Am. J. Hum. Genet. 68:1019–1029, 2001 1019 High-Resolution Analysis of Human Y-Chromosome Variation Shows a Sharp Discontinuity and Limited Gene Flow between Northwestern Africa and the Iberian Peninsula Elena Bosch, 1,* Francesc Calafell, 1 David Comas, 1 Peter J. Oefner, 2 Peter A. Underhill, 3 and Jaume Bertranpetit 1 1 Unitat de Biologia Evolutiva, Facultat de Cie `ncies de la Salut i de la Vida, Universitat Pompeu Fabra, Barcelona; 2 Stanford DNA Sequencing and Technology Center, Palo Alto, CA; and 3 Department of Genetics, Stanford University, Stanford, CA In the present study we have analyzed 44 Y-chromosome biallelic polymorphisms in population samples from northwestern (NW) Africa and the Iberian Peninsula, which allowed us to place each chromosome unequivocally in a phylogenetic tree based on 1150 polymorphisms. The most striking results are that contemporary NW African and Iberian populations were found to have originated from distinctly different patrilineages and that the Strait of Gibraltar seems to have acted as a strong (although not complete) barrier to gene flow. In NW African populations, an Upper Paleolithic colonization that probably had its origin in eastern Africa contributed 75% of the current gene pool. In comparison, ∼78% of contemporary Iberian Y chromosomes originated in an Upper Paleolithic expansion from western Asia, along the northern rim of the Mediterranean basin. Smaller contributions to these gene pools (constituting 13% of Y chromosomes in NW Africa and 10% of Y chromosomes in Iberia) came from the Middle East during the Neolithic and, during subsequent gene flow, from Sub-Saharan to NW Africa. Finally, bidirectional gene flow across the Strait of Gibraltar has been detected: the genetic contribution of European Y chromosomes to the NW African gene pool is estimated at 4%, and NW African populations may have contributed 7% of Iberian Y chromosomes. The Islamic rule of Spain, which began in A.D. 711 and lasted almost 8 centuries, left only a minor contribution to the current Iberian Y-chromosome pool. The high-resolution analysis of the Y chromosome allows us to separate successive migratory components and to precisely quantify each historical layer. Introduction The systematic search for polymorphisms in the hu- man Y chromosome, both by conventional techniques and by denaturing high-performance liquid chroma- tography (DHPLC), is producing a large number of new markers (Underhill et al. 1997, 2000; Shen et al. 2000), overcoming the initial dearth of available poly- morphisms on that chromosome (Dorit et al. 1995). Among all the different types of Y-chromosome poly- morphisms, base substitutions and insertion/deletion polymorphisms have proved to be especially useful in the reconstruction of the phylogeny of the 30-Mb Y- chromosome nonrecombining region. Given their na- ture, these mutations have probably arisen only once in evolutionary history and have created biallelic poly- Received December 27, 2000; accepted for publication February 14, 2001; electronically published March 14, 2001. Address for correspondence and reprints: Dr. Jaume Bertranpetit, Unitat de Biologia Evolutiva, Facultat de Cie `ncies de la Salut i de la Vida, Universitat Pompeu Fabra, Doctor Aiguader 80, 08003 Barce- lona, Spain. E-mail: [email protected] * Present affiliation: Department of Genetics, University of Leices- ter, Leicester, United Kingdom. q 2001 by The American Society of Human Genetics. All rights reserved. 0002-9297/2001/6804-0022$02.00 morphisms. In the absence of recurrence, the typing of such markers in nonhuman primates allows us to de- termine which is the ancestral allele. The knowledge of the ancestral and derived states of these markers, to- gether with the fact that most of the Y chromosome does not recombine, allows the direct application of par- simony criteria to obtain its phylogeny. Underhill et al. (2000) developed a new set of markers and typed a large set of samples from different worldwide population, pro- viding a well-established structure for Y-chromosome phylogeny and a wide context of very detailed infor- mation on Y-chromosome variation, against which any particular new population can be evaluated. A specific analysis of Europe (Semino et al. 2000) has shown the possibilities of the application of this marker set to a continental framework. Furthermore, because of this well-established phylogeny, we are able to characterize new populations by means of a fast hierarchical ap- proach, in which markers are successively typed from the top to the bottom (from the root toward the branch tips) of the phylogenetic tree, as needed. Given the fine degree of paternal-lineage dissection achieved, the proper knowledge of the worldwide distribution and of patterns of variation of the haplotypes that constitute this phylogeny will pave the way for the elucidation of

Welcome message from author
This document is posted to help you gain knowledge. Please leave a comment to let me know what you think about it! Share it to your friends and learn new things together.
Transcript
Am. J. Hum. Genet. 68:1019–1029, 2001
1019
High-Resolution Analysis of Human Y-Chromosome Variation Shows aSharp Discontinuity and Limited Gene Flow between Northwestern Africaand the Iberian PeninsulaElena Bosch,1,* Francesc Calafell,1 David Comas,1 Peter J. Oefner,2 Peter A. Underhill,3 andJaume Bertranpetit1
1Unitat de Biologia Evolutiva, Facultat de Ciencies de la Salut i de la Vida, Universitat Pompeu Fabra, Barcelona; 2Stanford DNA Sequencingand Technology Center, Palo Alto, CA; and 3Department of Genetics, Stanford University, Stanford, CA
In the present study we have analyzed 44 Y-chromosome biallelic polymorphisms in population samples fromnorthwestern (NW) Africa and the Iberian Peninsula, which allowed us to place each chromosome unequivocallyin a phylogenetic tree based on 1150 polymorphisms. The most striking results are that contemporary NW Africanand Iberian populations were found to have originated from distinctly different patrilineages and that the Strait ofGibraltar seems to have acted as a strong (although not complete) barrier to gene flow. In NW African populations,an Upper Paleolithic colonization that probably had its origin in eastern Africa contributed 75% of the currentgene pool. In comparison, ∼78% of contemporary Iberian Y chromosomes originated in an Upper Paleolithicexpansion from western Asia, along the northern rim of the Mediterranean basin. Smaller contributions to thesegene pools (constituting 13% of Y chromosomes in NW Africa and 10% of Y chromosomes in Iberia) came fromthe Middle East during the Neolithic and, during subsequent gene flow, from Sub-Saharan to NW Africa. Finally,bidirectional gene flow across the Strait of Gibraltar has been detected: the genetic contribution of European Ychromosomes to the NW African gene pool is estimated at 4%, and NW African populations may have contributed7% of Iberian Y chromosomes. The Islamic rule of Spain, which began in A.D. 711 and lasted almost 8 centuries,left only a minor contribution to the current Iberian Y-chromosome pool. The high-resolution analysis of the Ychromosome allows us to separate successive migratory components and to precisely quantify each historical layer.
Introduction
The systematic search for polymorphisms in the hu-man Y chromosome, both by conventional techniquesand by denaturing high-performance liquid chroma-tography (DHPLC), is producing a large number ofnew markers (Underhill et al. 1997, 2000; Shen et al.2000), overcoming the initial dearth of available poly-morphisms on that chromosome (Dorit et al. 1995).Among all the different types of Y-chromosome poly-morphisms, base substitutions and insertion/deletionpolymorphisms have proved to be especially useful inthe reconstruction of the phylogeny of the 30-Mb Y-chromosome nonrecombining region. Given their na-ture, these mutations have probably arisen only once inevolutionary history and have created biallelic poly-
Received December 27, 2000; accepted for publication February 14,2001; electronically published March 14, 2001.
Address for correspondence and reprints: Dr. Jaume Bertranpetit,Unitat de Biologia Evolutiva, Facultat de Ciencies de la Salut i de laVida, Universitat Pompeu Fabra, Doctor Aiguader 80, 08003 Barce-lona, Spain. E-mail: [email protected]
* Present affiliation: Department of Genetics, University of Leices-ter, Leicester, United Kingdom.
q 2001 by The American Society of Human Genetics. All rights reserved.0002-9297/2001/6804-0022$02.00
morphisms. In the absence of recurrence, the typing ofsuch markers in nonhuman primates allows us to de-termine which is the ancestral allele. The knowledge ofthe ancestral and derived states of these markers, to-gether with the fact that most of the Y chromosomedoes not recombine, allows the direct application of par-simony criteria to obtain its phylogeny. Underhill et al.(2000) developed a new set of markers and typed a largeset of samples from different worldwide population, pro-viding a well-established structure for Y-chromosomephylogeny and a wide context of very detailed infor-mation on Y-chromosome variation, against which anyparticular new population can be evaluated. A specificanalysis of Europe (Semino et al. 2000) has shown thepossibilities of the application of this marker set to acontinental framework. Furthermore, because of thiswell-established phylogeny, we are able to characterizenew populations by means of a fast hierarchical ap-proach, in which markers are successively typed fromthe top to the bottom (from the root toward the branchtips) of the phylogenetic tree, as needed. Given the finedegree of paternal-lineage dissection achieved, theproper knowledge of the worldwide distribution and ofpatterns of variation of the haplotypes that constitutethis phylogeny will pave the way for the elucidation of
1020 Am. J. Hum. Genet. 68:1019–1029, 2001
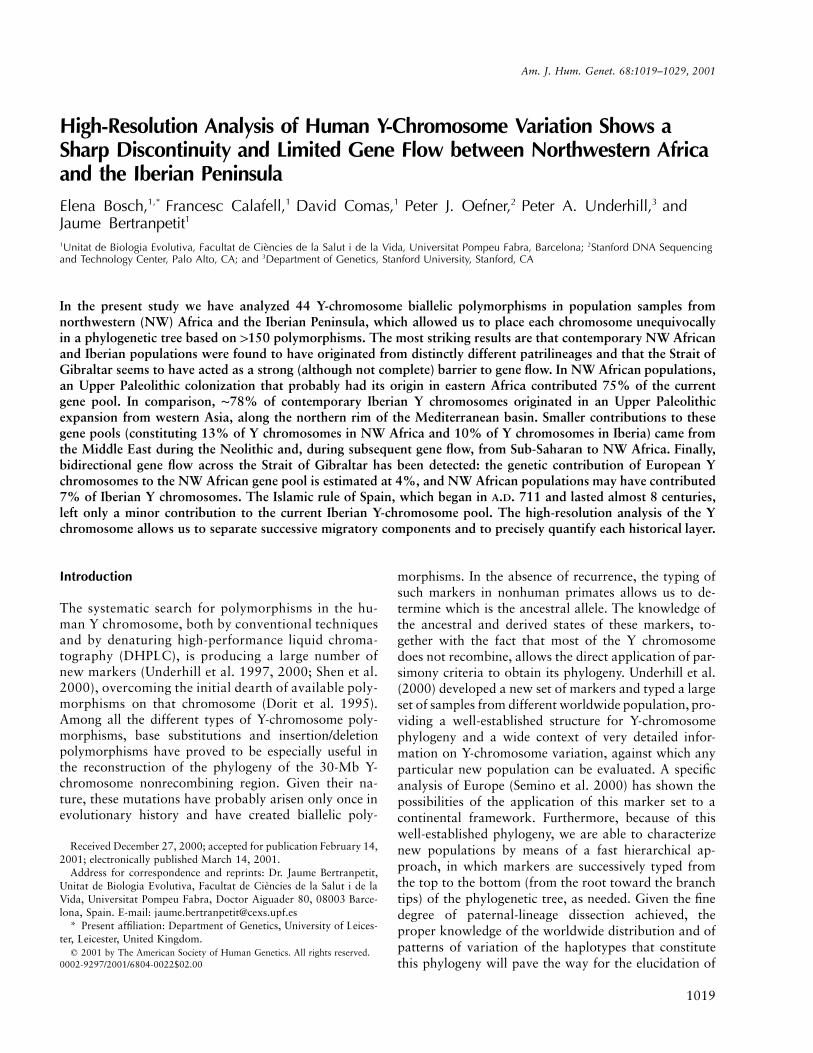
Figure 1 Phylogenetic tree of Y-chromosome haplotypes and their absolute frequencies in NW Africa and the Iberian Peninsula. Theidentifiers of the genotyped markers, as well as the haplogroup and haplotype designations, are according to Underhill et al. (2000). Italicizedmarkers were not typed, but their allelic states in the chromosomes analyzed can be deduced unequivocally from the phylogenetic tree.
the patterns of male migration and admixture, amongpresent and past human populations.
In addition to the geographical proximity of north-western (NW) Africa and the Iberian Peninsula, whichare separated only by the 15-km-wide Strait of Gibral-tar, both regions are linked by historical events involvingpopulation movement. During the Upper Paleolithic(known as the “Late Stone Age” in the study of Africanprehistory), the Ibero-Maurusian industry, spanning thetime period of 22,000–9,500 years ago (ya) (Newman1995), is found throughout northern Africa. The prefix“Ibero-” refers to the presumption that this culture ex-tended into Iberia, although an origin in the Nile Rivervalley is now widely accepted (Camps 1974). The Ibero-Maurusian culture was followed, in the NW AfricanMesolithic, by the Capsian industry (10,000–4,700 ya;Desanges 1990). The Capsian culture persists well intothe Neolithic (which began ∼5,500 ya), a fact that mayindicate a persistence of the Mesolithic population anda cultural adoption of agriculture and husbandry withsome Neolithic admixture, rather than a replacementby Neolithic populations originating in the Middle East.In general terms, prehistoric culture changes in NW Af-rica were quite independent of the change dynamics onthe European shores of the Mediterranean. In Iberia,the first Upper Paleolithic settlements appear as earlyas 40,000 ya. Later local developments, until the spreadof the Neolithic, followed traditions having Europeanor northern Mediterranean distributions.
NW Africa enters history with the Phoenicians, who,originating in the Middle East, founded Carthage in 814B.C. and established commercial relations with the localpopulations, who were the ancestors of the current Ber-bers. The Roman geographers documented the nativekingdoms of the Mauri, Numidae, Gaetali, and Libii,all of whom were subsequently conquered, in ∼150
B.C.–A.D. 50, by the Romans, who established them-selves, probably with a limited demographic impact,along a 100-km-wide strip along the Mediterraneancoast. This has a parallel in the history of Iberia, wherePhoenicians and Greeks established trading posts, andwhere the local populations (Iberians and Celts) werelater conquered (starting ∼200 B.C.) by the Romans.Iberia (“Hispania”) then became a province of the Ro-man Empire.
During the 7th century A.D., the Arabs conquerednorthern Africa from east to west and spread their lan-guage and religion throughout the native Berber pop-ulation. Although the cultural and political impact ofthis invasion changed the history of NW Africa pro-foundly, a precise estimation of the demographic con-tribution of the Arabs to NW Africa is not available.In A.D. 711, Berber troops under Arab leadership (Hitti1990) crossed to the Iberian Peninsula, which they sub-sequently conquered. That date marks the start of an8-century period during which the Iberian Peninsulawas divided into the Christian kingdoms to the northand the Islamic kingdoms in the south. The border be-tween the two moved southward until 1492, when thelast Islamic kingdom was conquered. The demographiccontribution of NW African populations to Iberia is notknown precisely; it may have been on the order of tensof thousands of individuals in a total Iberian populationof a few million (McEvedy and Jones 1978). After thefirst conquest of Iberia, two main Berber invasionsswept through the peninsula: the Almoravids (A.D.1056–1147) and the Almohades (A.D. 1121–1269). Theempire founded by the former group extended into Af-rica as far south as present-day Senegal and Mali (Ka-sule 1998).
After 1492, first Jews and then Moslems were forcedby the Spanish rulers to either convert to Catholicism
Bosch et al.: NW African and Iberian Y Discontinuity 1021
or leave the country. Most of those who were expelledtook refuge in NW Africa. However, the populationsubstrate of the Moslem group is not well known; theextent to which this group was composed of convertedIberians rather than of the descendants of the Islamicinvaders is difficult to ascertain.
In the present study, we have typed 44 biallelic poly-morphisms and 8 microsatellites (also known as “shorttandem repeats,” or “STRs”), to define the main Y-chromosome lineages in NW Africa and the Iberian Pen-insula, in a well-established phylogeographical frame(Underhill et al. 2000), as well as to attempt to estimatethe dates of both ancient and recent events in the historyof those populations. Several hypotheses regarding pop-ulation history are tested, such as those concerning theextent to which the Paleolithic genetic background maystill be present in both regions, as well as the impact ofthe Neolithic wave of advance; we also quantify anygene flow between these two regions and from externalpopulations into these regions. The present results arecontrasted with those of previous analyses of classicalpolymorphisms (i.e., blood groups and protein poly-morphisms), Alu-insertion polymorphisms, mtDNAcontrol-region sequences, and other Y-chromosomestudies. Previous analyses, of a smaller set of Y-chro-mosome polymorphisms in populations from NW Af-rica and the Iberian Peninsula, have been published byBosch et al. (1999), who emphasized gene genealogyrather than population history, and by Rosser et al.(2000), who typed 11 biallelic polymorphisms in abroad survey of western-Eurasian populations andfound that a principal-component analysis of haplotypefrequencies separated NW African populations fromEuropean and Middle Eastern populations.
Subjects and Methods
Subjects
Different autochthonous samples from NW Africaand the Iberian Peninsula were typed. The NW Africansample included blood from 29 Saharawis, 40 southernMoroccan Berbers, 44 Moroccan Arabs, and 63 north-central Moroccan Berbers. Samples from the IberianPeninsula included blood from 37 Andalusians, 16 Cat-alans, and 44 Basques; the Basque individuals were alsoincluded in the study by Underhill et al. (2000). Appro-priate informed consent was obtained from all partici-pants in this study, and information about the geograph-ical origin of their four grandparents and about theirfirst language was recorded. DNA was extracted fromfresh blood by standard phenol-chloroform protocols.
Polymorphism Typing
All samples in this study were characterized by meansof a top-down approach, in which the markers indicated
in figure 1 were successively typed, in hierarchical order,according to their position in the genealogy given byUnderhill et al. (2000). The typing methods in our anal-ysis would allow us to identify almost all haplotypesdescribed by Underhill et al. (2000). Thus, the originalhaplotype notation of Underhill et al. (2000) has beenkept.
DHPLC was used to type all biallelic markers, withthe exception of YAP (also known as “M1”). Markerinformation such as primer sequences and PCR condi-tions for their amplification, whether alleles are ancestralor derived, as well as additional details for their typingconditions by DHPLC, have been provided by Underhillet al. (1997, 2000). YAP was assayed as described byHammer and Horai (1995). It should be noted that asubset of the polymorphisms used in the present studyhas been typed in a number of European populations(Semino et al. 2000) and that a different notation hasbeen given to those haplotypes: H22 is termed “Eu2”;H35, H36, and H38 are subsumed under “Eu4”; H52,H50, H58, and H71 are termed “Eu7,” “Eu8,” “Eu9,”and “Eu10,” respectively; H88 is termed “Eu15;” H101,H102, H103, and H104 are subsumed under “Eu18”;and, finally, H108 is termed “Eu19.”
Data for eight STRs (DYS388, DYS19, DYS390,DYS391, DYS392, DYS393, DYS389I, and DYS389II)were available for almost all chromosomes in the sample(Bosch et al. 1999, and additional typings reported here).Complete haplotypes (biallelic markers and STRs) areavailable from the authors.
Data Analysis
Haplotype-frequency differences among populationsfrom NW Africa and the Iberian Peninsula were tested,by analysis of molecular variance (AMOVA), with theARLEQUIN software package (Schneider et al. 2000).AMOVA was performed both separately, for NW Af-rican and Iberian populations, and as a joint analysis inwhich genetic variance was partitioned hierarchically asinterregion (NW Africa vs. Iberia) variance, intraregionvariance, and intrapopulation variance.
Coalescence analysis (Griffiths and Tavare 1994) wasused to test whether NW Africa and Iberia could beregarded as a panmictic unit, to estimate the amount ofgene flow among the two regions, and to estimate theages of M35, M78, and M81, under assumptions of bothconstant and exponential growth, by means of the Gene-tree program (available from the Genetree Web site). Allbiallelic polymorphisms constituting the haplotypeswere given the same weight regardless of whether theywere nucleotide substitutions or indels, given that theywere all compatible with the infinite-sites model im-plemented in Genetree. First, the values of v p Nm
(where N is effective population size and m is mutationrate) that maximized the likelihood of the gene gene-
1022 Am. J. Hum. Genet. 68:1019–1029, 2001
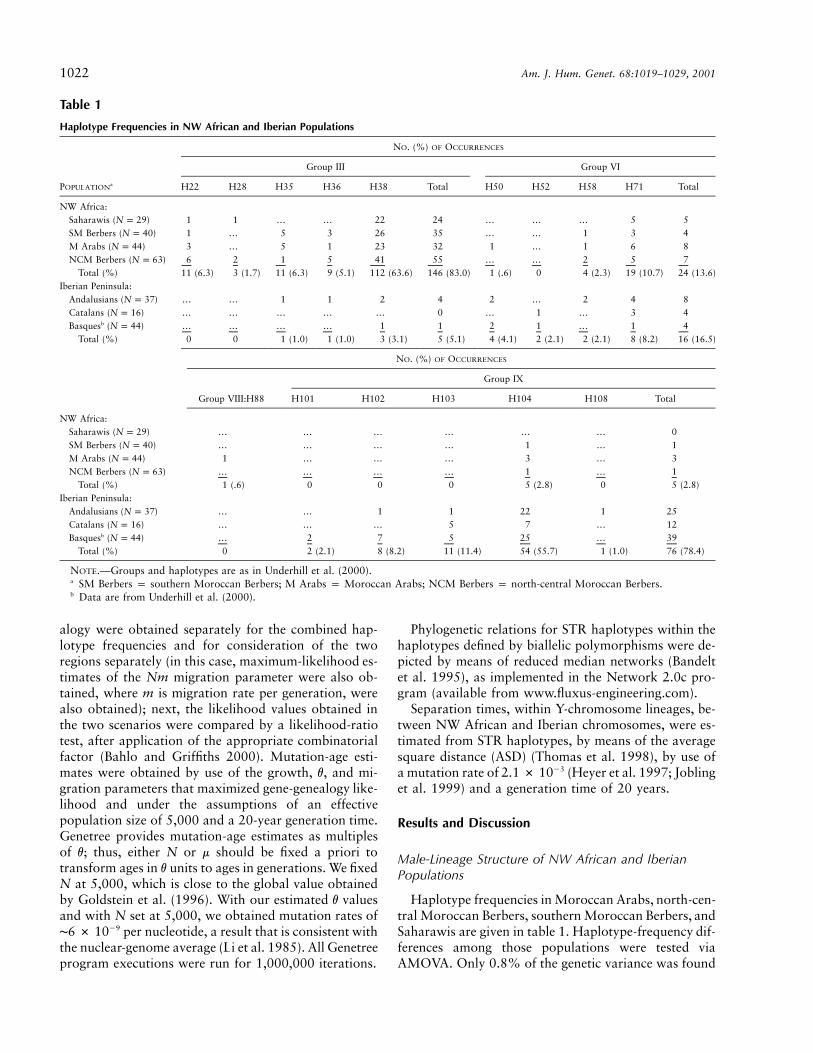
Table 1
Haplotype Frequencies in NW African and Iberian Populations
POPULATIONa
NO. (%) OF OCCURRENCES
Group III Group VI
H22 H28 H35 H36 H38 Total H50 H52 H58 H71 Total
NW Africa:Saharawis ( )N p 29 1 1 … … 22 24 … … … 5 5SM Berbers ( )N p 40 1 … 5 3 26 35 … … 1 3 4M Arabs ( )N p 44 3 … 5 1 23 32 1 … 1 6 8NCM Berbers ( )N p 63 6 2 1 5 41 55 … … 2 5 7
Total (%) 11 (6.3) 3 (1.7) 11 (6.3) 9 (5.1) 112 (63.6) 146 (83.0) 1 (.6) 0 4 (2.3) 19 (10.7) 24 (13.6)Iberian Peninsula:
Andalusians ( )N p 37 … … 1 1 2 4 2 … 2 4 8Catalans ( )N p 16 … … … … … 0 … 1 … 3 4Basquesb ( )N p 44 … … … … 1 1 2 1 … 1 4
Total (%) 0 0 1 (1.0) 1 (1.0) 3 (3.1) 5 (5.1) 4 (4.1) 2 (2.1) 2 (2.1) 8 (8.2) 16 (16.5)
NO. (%) OF OCCURRENCES
Group IX
Group VIII:H88 H101 H102 H103 H104 H108 Total
NW Africa:Saharawis ( )N p 29 … … … … … … 0SM Berbers ( )N p 40 … … … … 1 … 1M Arabs ( )N p 44 1 … … … 3 … 3NCM Berbers ( )N p 63 … … … … 1 … 1
Total (%) 1 (.6) 0 0 0 5 (2.8) 0 5 (2.8)Iberian Peninsula:
Andalusians ( )N p 37 … … 1 1 22 1 25Catalans ( )N p 16 … … … 5 7 … 12Basquesb ( )N p 44 … 2 7 5 25 … 39
Total (%) 0 2 (2.1) 8 (8.2) 11 (11.4) 54 (55.7) 1 (1.0) 76 (78.4)
NOTE.—Groups and haplotypes are as in Underhill et al. (2000).a SM Berbers p southern Moroccan Berbers; M Arabs p Moroccan Arabs; NCM Berbers p north-central Moroccan Berbers.b Data are from Underhill et al. (2000).
alogy were obtained separately for the combined hap-lotype frequencies and for consideration of the tworegions separately (in this case, maximum-likelihood es-timates of the Nm migration parameter were also ob-tained, where m is migration rate per generation, werealso obtained); next, the likelihood values obtained inthe two scenarios were compared by a likelihood-ratiotest, after application of the appropriate combinatorialfactor (Bahlo and Griffiths 2000). Mutation-age esti-mates were obtained by use of the growth, v, and mi-gration parameters that maximized gene-genealogy like-lihood and under the assumptions of an effectivepopulation size of 5,000 and a 20-year generation time.Genetree provides mutation-age estimates as multiplesof v; thus, either N or m should be fixed a priori totransform ages in v units to ages in generations. We fixedN at 5,000, which is close to the global value obtainedby Goldstein et al. (1996). With our estimated v valuesand with N set at 5,000, we obtained mutation rates of∼ per nucleotide, a result that is consistent with296 # 10the nuclear-genome average (Li et al. 1985). All Genetreeprogram executions were run for 1,000,000 iterations.
Phylogenetic relations for STR haplotypes within thehaplotypes defined by biallelic polymorphisms were de-picted by means of reduced median networks (Bandeltet al. 1995), as implemented in the Network 2.0c pro-gram (available from www.fluxus-engineering.com).
Separation times, within Y-chromosome lineages, be-tween NW African and Iberian chromosomes, were es-timated from STR haplotypes, by means of the averagesquare distance (ASD) (Thomas et al. 1998), by use ofa mutation rate of (Heyer et al. 1997; Jobling232.1 # 10et al. 1999) and a generation time of 20 years.
Results and Discussion
Male-Lineage Structure of NW African and IberianPopulations
Haplotype frequencies in Moroccan Arabs, north-cen-tral Moroccan Berbers, southern Moroccan Berbers, andSaharawis are given in table 1. Haplotype-frequency dif-ferences among those populations were tested viaAMOVA. Only 0.8% of the genetic variance was found
Bosch et al.: NW African and Iberian Y Discontinuity 1023
to be due to haplotype-frequency differences among thepopulations (statistically not significantly different from0; ). H38, which, according to Underhill et al.P p .169(2000), belongs to haplotype group III, is the most com-mon haplotype in NW Africa (64%), with its highestfrequencies found within the Saharawis (76%). H71,which belongs to group VI, is the second-most-frequenthaplotype (11%) in this area. Other haplotypes, foundat lower frequencies, are H22 and H35 (6% each) andH36 (5%), all belonging to group III. The remaininghaplotypes, which jointly represent 8% of the NW Af-rican Y chromosomes, are found at frequencies of !3%.The genetic homogeneity of NW African Y chromo-somes points to a common origin, for all populationsanalyzed, independent of ethnicity or language (Arab orBerber). These data support the interpretation of theArabization and Islamization of NW Africa, startingduring the 7th century A.D., as cultural phenomena with-out extensive genetic replacement.
Haplotype frequencies for Basques, Catalans, and An-dalusians are also given in table 1. AMOVA showed that2% of the genetic variance was attributable to haplo-type-frequency differences among them (statistically notsignificantly different from 0; ). Pairwise pop-P p .08ulation comparisons via AMOVA did not yield any val-ues significantly different from 0. The most frequent hap-lotype in these populations is H104 (56%), whichbelongs to group IX. Haplotypes H102 and H103,which also belong to group IX, are found at frequenciesof ∼10%. The frequency of H71 (8%) is similar to thathaplotype’s frequency in NW Africa. The proportion ofhaplotypes belonging to group VI (which includes H71)is slightly higher in Iberia (16%) than in NW Africa(14%). H35, H36, and H38, the only haplotypes foundto belong to group III, constitute 5% of the Iberian Ychromosomes.
These results clearly show that the contemporary pop-ulations from both regions originated from different pa-trilineages: group III haplotypes prevail in NW Africa,whereas Iberian haplotypes belong mostly to group IX.The proportion of genetic variance that can be attributedto the difference between the NW African and Iberianpopulations is 35.2% ( ), the minimum possibleP p .024value, given the number of populations and the per-mutation procedure employed to estimate statistical sig-nificance (Excoffier et al. 1992). Moreover, a coalescenceanalysis of the gene genealogy (Bahlo and Griffiths2000), including haplotype frequencies in both regions,allowed us to reject the hypothesis that they behavejointly as a panmictic unit ( , 1 df, and2x p 271.69
, for constant population sizes; and ,2P ≈ 0 x p 266.471 df, and , for expanding populations). The mi-P ≈ 0gration parameters that maximized gene-genealogy like-lihood were from Iberia to NW Africa andNm p 1.25
from NW Africa to Iberia, which indicates thatNm p 2
gene flow from NW Africa to Iberia may have beengreater than that in the opposite direction. Other studies,which analyzed either classical genetic markers (Boschet al. 1997; Kandil et al. 1999; Simoni et al. 1999), aset of up to 21 autosomal STRs (Bosch et al. 2000), or11 polymorphic Alu insertions (Comas et al. 2000),showed important genetic differences between NW Af-rican and Iberian populations. Moreover, Bosch et al.(1997) and Simoni et al. (1999), analyzing, respectively,13 and 20 populations from all around the Mediterra-nean basin, found that the sharpest genetic differenceswere between populations situated on either side of theStrait of Gibraltar. However, beyond the identificationof differences in allele frequencies, the use of a systemsuch as high-resolution biallelic-polymorphism Y-chro-mosome haplotypes, with a well-established gene ge-nealogy and clear geographical structure, allows us torecognize patterns of origin and diffusion of haplotypes,which can then be used to quantify gene flow, as dis-cussed below.
Neither the overall AMOVA nor any pairwise com-parison among populations within either NW Africa orIberia were significantly different from 0, implying thatY-chromosome biallelic haplotypes are highly homoge-neous within each geographical region. Classical geneticmarkers, together with linguistic, paleoanthropological,and archaeological data, point to a Mesolithic (or older)origin of the Basques (Calafell and Bertranpetit 1994).However, this degree of differentiation is not reached byY-chromosome polymorphisms (Hurles et al. 1999). Forfurther discussion on how different kinds of geneticmarkers reflect the Basque differentiation, see the reportby Comas et al. (2000).
Geographical and Historical Origins of Y-ChromosomeHaplotypes in NW Africa and the Iberian Peninsula
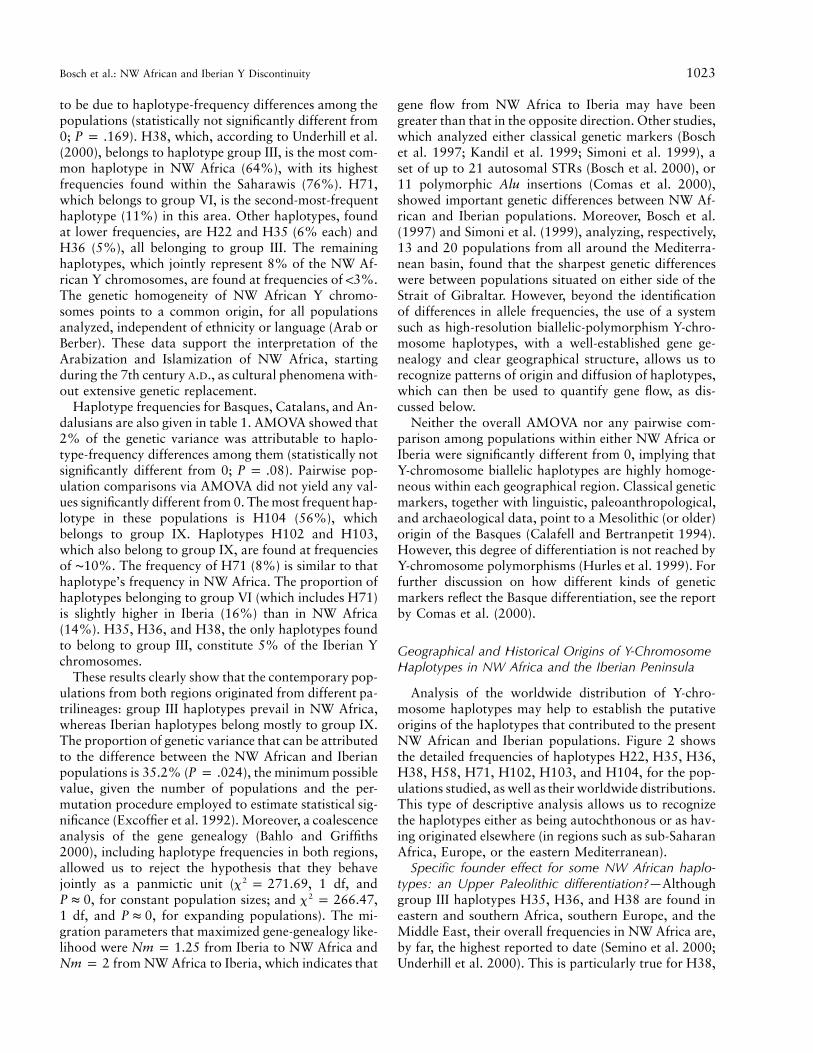
Analysis of the worldwide distribution of Y-chro-mosome haplotypes may help to establish the putativeorigins of the haplotypes that contributed to the presentNW African and Iberian populations. Figure 2 showsthe detailed frequencies of haplotypes H22, H35, H36,H38, H58, H71, H102, H103, and H104, for the pop-ulations studied, as well as their worldwide distributions.This type of descriptive analysis allows us to recognizethe haplotypes either as being autochthonous or as hav-ing originated elsewhere (in regions such as sub-SaharanAfrica, Europe, or the eastern Mediterranean).
Specific founder effect for some NW African haplo-types: an Upper Paleolithic differentiation?—Althoughgroup III haplotypes H35, H36, and H38 are found ineastern and southern Africa, southern Europe, and theMiddle East, their overall frequencies in NW Africa are,by far, the highest reported to date (Semino et al. 2000;Underhill et al. 2000). This is particularly true for H38,
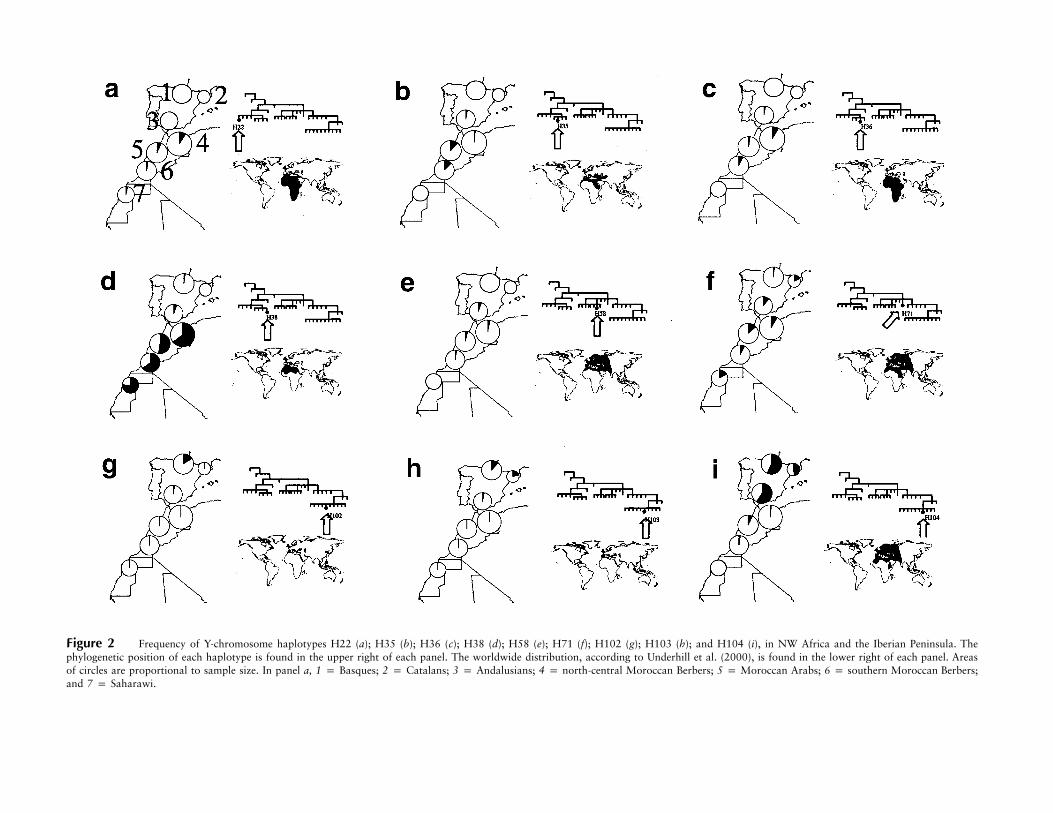
Figure 2 Frequency of Y-chromosome haplotypes H22 (a); H35 (b); H36 (c); H38 (d); H58 (e); H71 (f); H102 (g); H103 (h); and H104 (i), in NW Africa and the Iberian Peninsula. Thephylogenetic position of each haplotype is found in the upper right of each panel. The worldwide distribution, according to Underhill et al. (2000), is found in the lower right of each panel. Areasof circles are proportional to sample size. In panel a, 1 p Basques; 2 p Catalans; 3 p Andalusians; 4 p north-central Moroccan Berbers; 5 p Moroccan Arabs; 6 p southern Moroccan Berbers;and 7 p Saharawi.
Bosch et al.: NW African and Iberian Y Discontinuity 1025
Figure 3 Median-joining networks relating eight-locus STR hap-lotypes H35 (a); H38 (b); and H104 (c), within biallelic lineages. Areasof circles are proportional to absolute frequencies. White circles denoteNW African individuals, black circles denote Iberians. For the sake ofclarity, parallel lines do not always represent parallel mutations.
which clearly constitutes the male population core ofNW Africa. By contrast, haplotype H35 is found mainlyin Ethiopia (22.7%) and Sudan (17.5%), and H36 ismost frequent among Khoisans (10.3%) and Ethiopians(6.5%) (Underhill et al. 2000). Given that H36 is directlyancestral to H35 and H38 and is found at moderatefrequencies in Ethiopia and in southern Africa, thisbranch of the haplotype phylogeny may have been in-troduced into NW Africa from eastern Africa. On theother hand, the dramatic discontinuity in frequenciesof group III haplotypes (especially H38) that is seen innorthern Africa suggests that such differences originatedunder strong genetic drift in small, isolated populations.Such demographic conditions were probably found onlybefore the population surge brought by the Neolithic,which may have prevented further significant differen-tiation by drift (Cavalli-Sforza et al. 1994), as shown bycomputer simulations (Rendine et al. 1986; Calafell andBertranpetit 1993).
Use of classical genetic markers has suggested (Boschet al. 1997) that the NW African populations may havea sizeable Upper Paleolithic component. This hypothe-sized Upper Paleolithic expansion may be representedtoday by the descendants of the haplotypes that sharemutation M35 and that are further characterized byM78 (H35) and M81 (H38). It remains to be resolvedwhether the latter two haplotypes arose independentlyfrom H36 or share a common ancestor, yet to be dis-covered, that distinguishes them from the remaininghaplotypes derived from H36.
Assuming a constant population size, an infinite-sitesmodel, and population subdivision between NW Afri-ca and Iberia, we used Genetree (Griffiths and Tavare1994) to estimate the age of M35 (giving H36) to be
years ago (ya), that of M78 (giving53,000 5 21,000H35) to be ya, and that of M81 (giv-16,000 5 10,000ing H38) to be ya. Under the more32,000 5 11,000likely condition of population growth (Thomson et al.2000), the respective estimated ages were 30,000 5
ya, ya, and ya.6,000 7,600 5 6,000 19,000 5 4,000Hence, the expansion that brought the ancestors of H35and H38 (or even those haplotypes themselves) into NWAfrica could have happened at any time after 30,000 ya,and, more specifically, it could have happened duringthe Upper Paleolithic. However, confidence intervals forthose dates are large, even without the uncertainty inthe effective population size or in generation time. Thus,any interpretation derived from these dates should beregarded with caution. The lower limit for the differ-entiation event that brought H35 and H38 to such highfrequencies in NW Africa is set by the demographic con-ditions that are compatible with this magnitude, as dis-cussed above, as well as by the genetic evidence, fromclassical genetic markers (Bosch et al. 1997), that sug-gests a strong Paleolithic background in NW Africa.
Haplotypes H35, H36, and H38 were found at a lowoverall frequency (5%) in the Iberian populations. Eight-locus STR haplotypes for the five Iberian group III chro-mosomes showed that four of them were identical togroup III chromosomes in NW Africans and that thefifth was one STR mutation step away. This is clearlydepicted in the reduced median networks in figure 3aand b. Given the fast mutation rate of STRs, the extremesimilarity between the STR haplotypes in the two regionscan be explained only if Iberian and NW African groupIII chromosomes have a common origin. The time nec-
1026 Am. J. Hum. Genet. 68:1019–1029, 2001
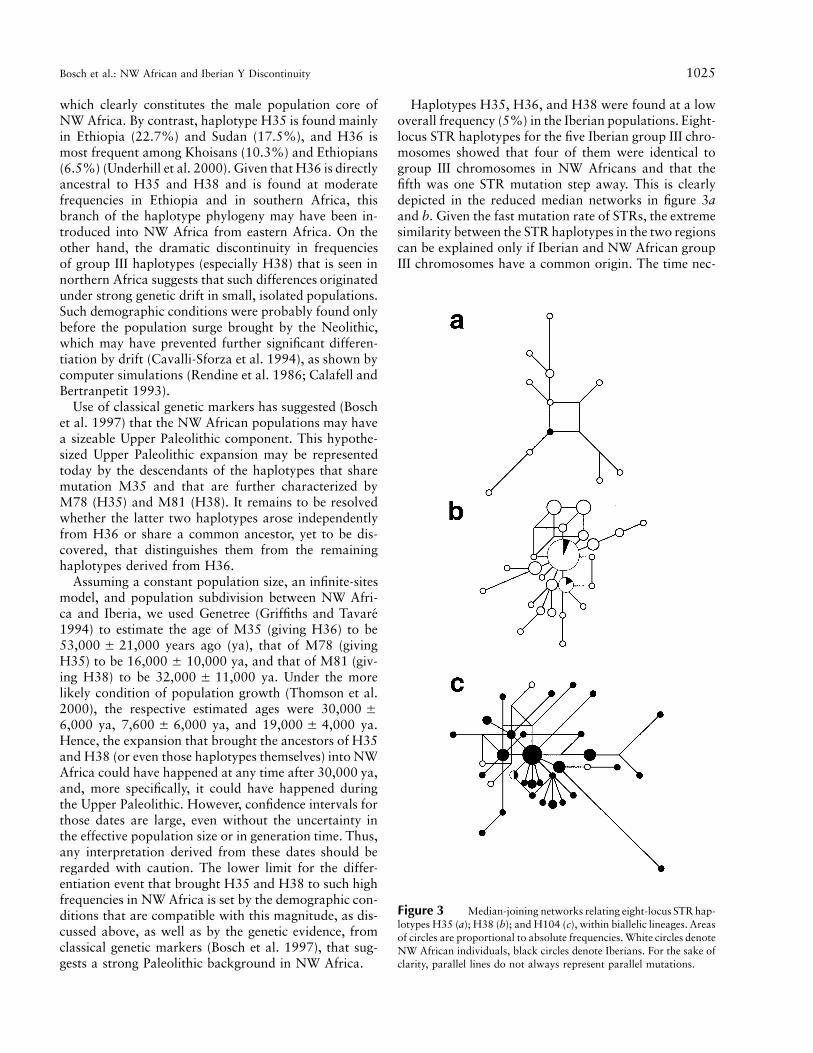
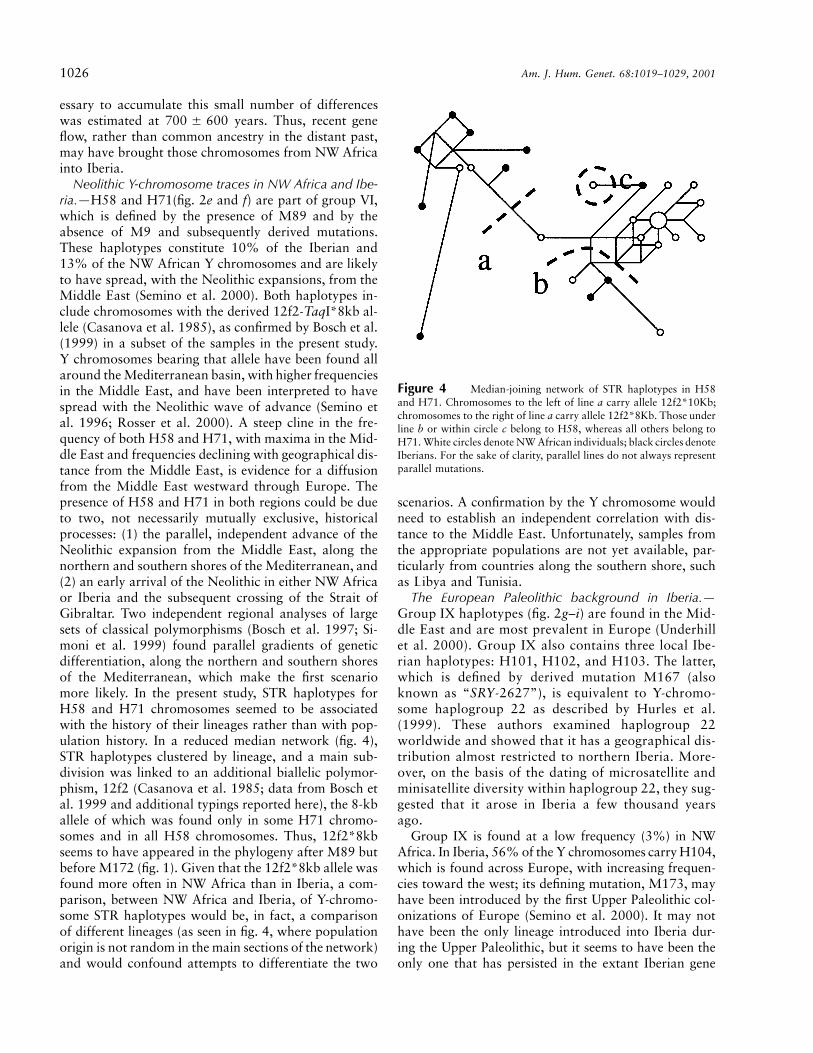
Figure 4 Median-joining network of STR haplotypes in H58and H71. Chromosomes to the left of line a carry allele 12f2*10Kb;chromosomes to the right of line a carry allele 12f2*8Kb. Those underline b or within circle c belong to H58, whereas all others belong toH71. White circles denote NW African individuals; black circles denoteIberians. For the sake of clarity, parallel lines do not always representparallel mutations.
essary to accumulate this small number of differenceswas estimated at years. Thus, recent gene700 5 600flow, rather than common ancestry in the distant past,may have brought those chromosomes from NW Africainto Iberia.
Neolithic Y-chromosome traces in NW Africa and Ibe-ria.—H58 and H71(fig. 2e and f) are part of group VI,which is defined by the presence of M89 and by theabsence of M9 and subsequently derived mutations.These haplotypes constitute 10% of the Iberian and13% of the NW African Y chromosomes and are likelyto have spread, with the Neolithic expansions, from theMiddle East (Semino et al. 2000). Both haplotypes in-clude chromosomes with the derived 12f2-TaqI*8kb al-lele (Casanova et al. 1985), as confirmed by Bosch et al.(1999) in a subset of the samples in the present study.Y chromosomes bearing that allele have been found allaround the Mediterranean basin, with higher frequenciesin the Middle East, and have been interpreted to havespread with the Neolithic wave of advance (Semino etal. 1996; Rosser et al. 2000). A steep cline in the fre-quency of both H58 and H71, with maxima in the Mid-dle East and frequencies declining with geographical dis-tance from the Middle East, is evidence for a diffusionfrom the Middle East westward through Europe. Thepresence of H58 and H71 in both regions could be dueto two, not necessarily mutually exclusive, historicalprocesses: (1) the parallel, independent advance of theNeolithic expansion from the Middle East, along thenorthern and southern shores of the Mediterranean, and(2) an early arrival of the Neolithic in either NW Africaor Iberia and the subsequent crossing of the Strait ofGibraltar. Two independent regional analyses of largesets of classical polymorphisms (Bosch et al. 1997; Si-moni et al. 1999) found parallel gradients of geneticdifferentiation, along the northern and southern shoresof the Mediterranean, which make the first scenariomore likely. In the present study, STR haplotypes forH58 and H71 chromosomes seemed to be associatedwith the history of their lineages rather than with pop-ulation history. In a reduced median network (fig. 4),STR haplotypes clustered by lineage, and a main sub-division was linked to an additional biallelic polymor-phism, 12f2 (Casanova et al. 1985; data from Bosch etal. 1999 and additional typings reported here), the 8-kballele of which was found only in some H71 chromo-somes and in all H58 chromosomes. Thus, 12f2*8kbseems to have appeared in the phylogeny after M89 butbefore M172 (fig. 1). Given that the 12f2*8kb allele wasfound more often in NW Africa than in Iberia, a com-parison, between NW Africa and Iberia, of Y-chromo-some STR haplotypes would be, in fact, a comparisonof different lineages (as seen in fig. 4, where populationorigin is not random in the main sections of the network)and would confound attempts to differentiate the two
scenarios. A confirmation by the Y chromosome wouldneed to establish an independent correlation with dis-tance to the Middle East. Unfortunately, samples fromthe appropriate populations are not yet available, par-ticularly from countries along the southern shore, suchas Libya and Tunisia.
The European Paleolithic background in Iberia.—Group IX haplotypes (fig. 2g–i) are found in the Mid-dle East and are most prevalent in Europe (Underhillet al. 2000). Group IX also contains three local Ibe-rian haplotypes: H101, H102, and H103. The latter,which is defined by derived mutation M167 (alsoknown as “SRY-2627”), is equivalent to Y-chromo-some haplogroup 22 as described by Hurles et al.(1999). These authors examined haplogroup 22worldwide and showed that it has a geographical dis-tribution almost restricted to northern Iberia. More-over, on the basis of the dating of microsatellite andminisatellite diversity within haplogroup 22, they sug-gested that it arose in Iberia a few thousand yearsago.
Group IX is found at a low frequency (3%) in NWAfrica. In Iberia, 56% of the Y chromosomes carry H104,which is found across Europe, with increasing frequen-cies toward the west; its defining mutation, M173, mayhave been introduced by the first Upper Paleolithic col-onizations of Europe (Semino et al. 2000). It may nothave been the only lineage introduced into Iberia dur-ing the Upper Paleolithic, but it seems to have been theonly one that has persisted in the extant Iberian gene
Bosch et al.: NW African and Iberian Y Discontinuity 1027
pool. Of five H104 NW African chromosomes, one hadan STR haplotype identical to that in an H104 Iberianchromosome, one was one mutation step away fromIberian H104 chromosomes, and the remaining threewere two mutation steps away. Moreover, the mean re-peat-size difference within 53 H104 Iberian STR haplo-types was 2.8 (range 0–11). The phylogenetic relationsamong H104 STR haplotypes is shown by a reducedmedian network (fig. 3c), in which the NW African chro-mosomes appear to be clearly embedded within the Ibe-rian diversity. The time necessary to accumulate the STR-allele differences between NW African and Iberian H104chromosomes was estimated at years. This2,100 5 450close STR-haplotype similarity seems to indicate thatH104 chromosomes found in NW Africa are a subsetof the European gene pool and that they may have beenintroduced during historic times.
Sub-Saharan gene flow into NW Africa.—H22 (definedby mutation M2, also referred to, by Seielstad et al.[1994], as “sY81”; see fig. 2a) and H28, which belongto group III, show a sub-Saharan distribution pattern(Seielstad et al. 1994; Hammer et al. 1997; Underhill etal. 2000). The highest frequency of H22 was found inMali (30%), and the highest frequencies of H28 werefound in southern (51%) and central Africa (57%). Bothhaplotypes together constitute 8% of the NW AfricanY chromosomes, and, given their geographical distri-bution, their presence in NW Africa can be interpretedas resulting from sub-Saharan gene flow. The NW Af-rican contact with the southern peoples was especiallyimportant during the Almoravid Berber expansion (A.D.1056–1147), which reached as far south as present-daySenegal and Mali (Kasule 1998), and it has been main-tained, until recently, by the trans-Saharan commercialroutes.
mtDNA control-region sequence analysis (Rando etal. 1998) detected female-mediated gene flow from sub-Saharan Africa to NW Africa. In particular, 21.5% ofthe mtDNA sequences in a set of different NW Africanpopulations were found to belong to haplogroups L1,L2, and L3a, which constitute most of the sub-SaharanmtDNA sequences.
So far, our analyses have allowed a clear dissectionof almost all NW African and Iberian paternal line-ages into several components with distinct historicalorigins. In this way, the historical origins of the NWAfrican Y-chromosome pool may be summarized asfollows: 75% NW African Upper Paleolithic (H35,H36, and H38), 13% Neolithic (H58 and H71), 4%historic European gene flow (group IX, H50, H52),and 8% recent sub-Saharan African (H22 and H28).In contrast, the origins of the Iberian Y-chromosomepool may be summarized as follows: 5% recent NWAfrican, 78% Upper Paleolithic and later local deriv-atives (group IX), and 10% Neolithic (H58, H71).
No haplotype assumed to have originated in sub-Saharan Africa was found in our Iberian sample. Itshould be noted that H58 and H71 are not the onlyhaplotypes present in the Middle East and that theNeolithic wave of advance could have brought otherlineages to Iberia and NW Africa. However, the homo-geneity of STR haplotypes within the most ancientbiallelic haplotypes in each region indicates a singleorigin during the past, with possible minor reintro-ductions, with the Neolithic expansion, from the Mid-dle East. Thus, Neolithic contributions may be slightlyunderestimated.
Detection of Gene Flow across the Gibraltar Strait
The detection of gene flow between both geographicalregions may provide a measure of the reciprocal con-tribution of Y chromosomes that has occurred duringthe past. In particular, we have shown that Iberian chro-mosomes carrying H35, H36, and H38 originated inNW Africa and were brought recently to the peninsula.Their frequency in Iberia will allow us to estimate themaximum NW African male contribution to the IberianY-chromosome pool. Since not all NW African Y chro-mosomes carry those haplotypes, gene flow from NWAfrica must have brought other chromosomes. Thus, toestimate the NW African contribution, the proportionof H35, H36, and H38 chromosomes in NW Africa mustbe taken into account. Therefore, we estimated the over-all NW African contribution to the Iberian Y-chromo-some pool as being 5% (the frequency of H35, H36,and H38 in Iberia) divided by 75% (the frequency ofthose haplotypes in NW Africa)—that is, 7%, with thehighest level of contribution (14%) being found in An-dalusians from southern Iberia. Conversely, since groupIX chromosomes in NW Africa may have an Iberianorigin, the Iberian (or European) contribution to NWAfrica can be estimated, as above, as being 4%.
A small NW African genetic contribution in Iberia isalso detected with mtDNA, the female counterpart ofthe Y chromosome. Rando et al. (1998) suggested a NWAfrican–specific origin for mtDNA haplogroup U6,which is found at frequencies of ∼10%–20% in NWAfricans and is absent or nearly absent in Europeansand other Africans. The presence of this NW AfricanmtDNA haplogroup in Iberia can be used as an indicatorof NW African–female contribution. Such a contribu-tion seems to be small, since haplogroup U6 is found atvery low frequencies: it has been found in 3 of 54 Por-tuguese and in 2 of 96 Galicians and is absent in An-dalusians and in 162 other Iberians (Bertranpetit et al.1995; Corte-Real et al. 1996; Pinto et al. 1996; Salas etal. 1998).
We have detected male-mediated gene flow fromNW Africa to the Iberian Peninsula; gene flow in the
1028 Am. J. Hum. Genet. 68:1019–1029, 2001
opposite direction, as shown by the Nm and admix-ture estimates and by ages obtained from STR hap-lotypes, occurred at lower levels and is more ancient.However, date estimates integrate all the gene flowbetween the two regions and should be regarded asgiving an average rather than as pinpointing a singleevent. In that respect, the more ancient age estimatefor the north-to-south gene flow could have beencaused by the fact that it occurred on a haplotypebackground, H104, that is slightly more diverse thanits south-to-north counterpart, H38 (compare figs. 3cand 3b, respectively), thus carrying a more diverse setof Y chromosomes from Iberia into NW Africa.
The Islamic (Arab and Berber) occupation of the Ibe-rian Peninsula, which began in A.D. 711 and, in thesouth, lasted until A.D. 1492, left a rich cultural heritage,from science and philosophy to agriculture and archi-tecture. Islamic rule lasted longest, until 1492, in south-ern Iberia. Our results suggest that the demographic con-tribution linked to that occupation (and to movementsin the opposite direction) must have been small but notat all negligible.
This study has demonstrated the unprecedented powerof the use of Y-chromosome biallelic polymorphisms forthe dissection of paternal lineages, which has allowedus to cut through the historic layers in the Iberian andNW African gene pools in much the same way as ar-chaeologists excavate prehistoric layers at a site.
Acknowledgments
We express our appreciation to the original blood donorswho made this study possible. We thank all persons involvedin reaching the Saharawi donors, as well as Elisabeth Pintado(Sevilla), Josep Lluıs Fernandez-Roure, and Alba Bosch (Ma-taro), for their help in the contacting of Moroccan donors. Weespecially thank A. A. Lin and P. Shen, for technical support.Mark A. Jobling and two anonymous reviewers made fruitfulcomments on the manuscript. This research was possiblethanks to E.B.’s stay at L. L. Cavalli-Sforza’s laboratory atStanford University. This work was supported by DireccionGeneral de Investigacion Cientıfica y Tecnica in Spain grantPB98-1064, by Direccio General de Recerca, Generalitat deCatalunya grants 1998SGR00009 and 2000SGR00093, andby NIHGMS grant 28428 to L. L. Cavalli-Sforza. E.B. wassupported by Comissionat per a Universitats i Recerca, Ge-neralitat de Catalunya grant FI/96-1153.
Electronic-Database Information
URLs for software in this article are as follows:
Genetree, http://www.maths.monash.edu.au/˜mbahlo/mpg/gtree.html (software for coalescence analysis of genegenealogies)
www.fluxus-engineering.com, http://www.fluxus-engineering
.com (for Network 2.0c software for median-joining net-work construction)
References
Bahlo M, Griffiths RC (2000) Inference from gene trees in asubdivided population. Theor Popul Biol 57:79–95
Bandelt H-J, Forster P, Sykes BC, Richards MB (1995) Mi-tochondrial portraits of human populations using mediannetworks. Genetics 141:743–753
Bertranpetit J, Sala J, Calafell F, Underhill P, Moral P, ComasD (1995) Human mitochondrial DNA variation and the or-igin of the Basques. Ann Hum Genet 59:63–81
Bosch E, Calafell F, Perez-Lezaun A, Clarimon J, Comas D,Mateu E, Martınez-Arias R, Morera B, Brakez Z, AkhayatO, Sefiani A, Harit G, Cambon-Thomsen A, Bertranpetit J(2000) Genetic structure of north-west Africa revealed bySTR analysis. Eur J Hum Genet 8:360–366
Bosch E, Calafell F, Perez-Lezaun A, Comas D, Mateu E, Ber-tranpetit J (1997) A population history of northern Afri-ca: evidence from classical genetic markers. Hum Biol 69:295–311
Bosch E, Calafell F, Santos FR, Perez-Lezaun A, Comas D,Benchemsi N, Tyler-Smith C, Bertranpetit J (1999) STR var-iation is deeply structured by genetic background on thehuman Y chromosome. Am J Hum Genet 65:1623–1638
Calafell F, Bertranpetit J (1993) A simulation of the genetichistory of the Iberian Peninsula. Curr Anthropol 34:735–745.
——— (1994) Principal component analysis of gene fre-quencies and the origin of Basques. Am J Phys Anthropol93:201–215
Camps G (1974) Les civilisations prehistoriques de l’Afriquedu Nord et du Sahara. Doin, Paris
Casanova M, Leroy P, Boucekkine C, Weissenbach J, BishopC, Fellous M, Purrello M, Fiori G, Siniscalco M (1985) Ahuman Y-linked DNA polymorphism and its potential forestimating genetic and evolutionary distance. Science 230:1403–1406
Cavalli-Sforza LL, Menozzi P, Piazza A (1994) History andgeography of human genes. Princeton University Press,Princeton, NJ
Comas D, Calafell F, Benchemsi N, Helal A, Lefranc G, Stone-king M, Batzer MA, Bertranpetit J, Sajantilla A (2000) Aluinsertion polymorphisms in northwestern Africa and the Ibe-rian Peninsula: evidence for a strong genetic boundarythrough the Gibraltar Straits. Hum Genet 107:312–319
Corte-Real HBSM, Macaulay V, Richards MB, Hariti G, IssadMS, Cambon-Thomsen A, Papiha S, Bertranpetit J, SykesBC (1996) Genetic diversity in the Iberian Peninsula deter-mined from mitochondrial sequence analysis. Ann Hum Ge-net 60:331–350
Desanges J (1990) The proto-Berbers. In: Mokhtar G (ed) Gen-eral history of Africa. Unesco, Paris, pp 236–245
Dorit R, Akashi H, Gilbert W (1995) Absence of polymor-phism at the ZFY locus on the human Y chromosome. Sci-ence 268:1183–1185
Excoffier L, Smouse PE, Quattro JM (1992) Analysis of mo-lecular variance inferred from metric distances among DNA
Bosch et al.: NW African and Iberian Y Discontinuity 1029
haplotypes: application to human mitochondrial DNA re-striction data. Genetics 131:479–491
Goldstein DB, Zhivotovsky LA, Nayar K, Ruiz-Linares A,Cavalli-Sforza LL, Feldman MW (1996) Statistical prop-erties of the variation at linked microsatellite loci: implica-tions for the history of human Y chromosomes. Mol BiolEvol 13:1213–1218
Griffiths RC, Tavare S (1994) Ancestral inference in populationgenetics. Stat Sci 9:307–319
Hammer MF, Horai S (1995) Y chromosomal DNA variationand the peopling of Japan. Am J Hum Genet 56:951–962
Hammer MF, Spurdle AB, Karafet T, Bonner MR, Wood ET,Novelletto A, Malaspina P, Mitchell RJ, Horai S, Jenkins T,Zegura SL (1997) The geographic distribution of human Ychromosome variation. Genetics 145:787–805
Heyer E, Puymirat J, Dieltjes P, Bakker E, de Knijff P (1997)Estimating Y chromosome specific microsatellite mutationfrequencies using deep rooting pedigrees. Hum Mol Genet6:799–803
Hitti PK (1990) The Arabs: a short history. Gateway Editions,Washington, DC
Hurles ME, Veitia R, Arroyo E, Armenteros M, BertranpetitJ, Perez-Lezaun A, Bosch E, Shlumukova M, Cambon-Thomsen A, McElreavey K, Lopez De Munain A, Rohl A,Wilson IJ, Singh L, Pandya A, Santos FR, Tyler-Smith C,Jobling MA (1999) Recent male-mediated gene flow overa linguistic barrier in Iberia, suggested by analysis of a Y-chromosomal DNA polymorphism. Am J Hum Genet 65:1437–1448
Jobling MA, Heyer E, Dieltjes P, de Knijff P (1999) Y-chro-mosome-specific microsatellite mutation rates re-examinedusing a minisatellite, MSY1. Hum Mol Genet 8:2117–2120
Kandil M, Moral P, Esteban E, Autori L, Mameli GE, ZaouiD, Calo C, Luna F, Vacca L Vona G (1999) Rell cell enzymepolymorphisms in Moroccans and southern Spaniards: newdata for the genetic history of the western Mediterranean.Hum Biol 71:791–802
Kasule S (1998) The history atlas of Africa. Macmillan, NewYork
Li WH, Wu CI, Luo CC (1985) A new method for estimatingsynonymous and nonsynonymous rates of nucleotide sub-stitution considering the relative likelihood of nucleotide andcodon changes. Mol Biol Evol 2:150–174
McEvedy C, Jones R (1978) Atlas of world population history.Penguin, Hardmonsworth, UK
Newman JL (1995) The peopling of Africa. Yale UniversityPress, New Haven
Pinto F, Gonzalez AM, Hernandez M, Larruga JM, CabreraVM (1996) Genetic relationship between the Canary Is-landers and their African and Spanish ancestors inferredfrom mitochondrial DNA sequences. Ann Hum Genet 60:321–330
Rando JC, Pinto F, Gonzalez AM, Hernandez M, Larruga JM,Cabrera VM, Bandelt HJ (1998) Mitochondrial DNA anal-ysis of northwest African populations reveals genetic ex-
changes with Europeans, Near-Eastern, and sub-Saharanpopulations. Ann Hum Genet 62:531–550
Rendine S, Piazza A, Cavalli-Sforza LL (1986) Simulation andseparation by principal components of multiple demic ex-pansions in Europe. Am Nat 128:681–706
Rosser ZH, Zerjal T, Hurles ME, Adojaan M, Alavantic D,Amorim A, Amos W, et al (2000) Y-chromosomal diversityin Europe is clinal and influenced primarily by geography,rather than by language. Am J Hum Genet 67:1526–1543
Salas A, Comas D, Lareu MV, Bertranpetit J, Carracedo A(1998) mtDNA analysis of the Galician population: a geneticedge of European variation. Eur J Hum Genet 6:365–375
Schneider S, Roessli D, Excoffier L (2000) ARLEQUIN v 2.0:a software for population genetics data analysis. Geneticsand Biometry Laboratory, University of Geneva, Geneva
Seielstad MT, Hebert JM, Lin AA, Underhill PA, Ibrahim M,Vollrath D, Cavalli-Sforza LL (1994) Construction of hu-man Y-chromosomal haplotypes using a new polymorphicA to G transition. Hum Mol Genet 3:2159–2161
Semino O, Passarino G, Brega A, Fellous M, Santachiara-Be-nerecetti S (1996) A view of the neolithic diffusion in Europethrough two Y chromosome–specific markers. Am J HumGenet 59:964–968
Semino O, Passarino G, Oefner PJ, Lin AA, Arbuzova S, Beck-man LE, De Benedictis G, Francalacci P, Kouvatsi A, Lim-borska S, Marcikiae M, Mika B, Primorac D, Santachiara-Benerecetti AS, Cavalli-Sforza LL, Underhill PA (2000) Thegenetic legacy of Paleolithic Homo sapiens in extant Eu-ropeans: a Y chromosome perspective. Science 290:1155–1159
Shen P, Wang F, Underhill PA, Franco C, Yang WH, Roxas A,Sung R, Lin AA, Hyman RW, Vollrath D, Davis RW, Cavalli-Sforza LL, Oefner PJ (2000) Population genetic implicationsfrom sequence variation in four Y chromosome genes. ProcNatl Acad Sci USA 97:7354–7359
Simoni L, Gueresi P, Pettener D, Barbujani G (1999) Patternsof gene flow inferred from genetic distances in the Medi-terranean region. Hum Biol 71:399–415
Thomas MG, Skorecki K, Ben-Ami H, Parfitt T, Bradman N,Goldstein DB (1998) Origin of Old Testament priests. Na-ture 394:138–140
Thomson R, Pritchard JK, Shen P, Oefner PJ, Feldman MW(2000) Recent common ancestry of human Y chromosomes:evidence from DNA sequence data. Proc Natl Acad Sci USA97:7360–7365
Underhill PA, Jin L, Lin AA, Mehdi SQ, Jenkins T, VollrathD, Davis RW, Cavalli-Sforza LL, Oefner PJ (1997) Detectionof numerous Y chromosome biallelic polymorphisms by de-naturing high-performance liquid chromatograpghy. Ge-nome Res 7:996–1005
Underhill PA, Shen P, Lin AA, Jin L, Passarino G, Yang WH,Kauffman E, Bonne-Tamir B, Bertranpetit J, Francalacci P,Ibrahim M, Jenkins T, Kidd JR, Mehdi SQ, Seielstad MT,Wells RS, Piazza A, Davis RW, Feldman MW, Cavalli-SforzaLL, Oefner PJ (2000) Y chromosome sequence variation andthe history of human populations. Nat Genet 26:358–361
Related Documents