Astronomy & Astrophysics manuscript no. 33953finalfinal c ESO 2018 October 30, 2018 High-resolution abundance analysis of four red giants in the globular cluster NGC 6558 * B. Barbuy 1 , L. Muniz 1 , S. Ortolani 2,3 , H. Ernandes 1 , B. Dias 4,5 , I. Saviane 4 , L. Kerber 6 , E. Bica 7 , A. P´ erez-Villegas 1 , L. Rossi 8 , and E.V. Held 9 1 Universidade de S˜ ao Paulo, IAG, Rua do Mat˜ ao 1226, Cidade Universit´ aria, S˜ ao Paulo 05508-900, Brazil; e-mail: [email protected] 2 Dipartimento di Fisica e Astronomia, Universit` a di Padova, I-35122 Padova, Italy 3 INAF-Osservatorio Astronomico di Padova, Vicolo dell’Osservatorio 5, I-35122 Padova, Italy 4 European Southern Observatory, Alonso de Cordova 3107, Santiago, Chile 5 Facultad de Ciencias Exactas, Universidad Andr´ es Bello, Av. Fernandez Concha 700, Las Condes, Santiago, Chile 6 Universidade Estadual de Santa Cruz, DCET, Rodovia Jorge Amado km 16, Ilh´ eus 45662-000, Bahia, Brazil 7 Universidade Federal do Rio Grande do Sul, Departamento de Astronomia, CP 15051, Porto Alegre 91501-970, Brazil 8 Centre for Astrophysics and Supercomputing, Swinburne University of Technology, Hawthorn, Victoria 3122, Australia 9 INAF - Osservatorio Astronomico di Padova, vicolo dell’Osservatorio 5, 35122 Padova, Italy Received; accepted ABSTRACT Context. NGC 6558 is a bulge globular cluster with a blue horizontal branch (BHB), combined with a metallicity of [Fe/H]≈-1.0. It is similar to HP 1 and NGC 6522, which could be among the oldest objects in the Galaxy. Element abundances in these clusters could reveal the nature of the first supernovae. Aims. We aim to carry out detailed spectroscopic analysis for four red giants of NGC 6558, in order to derive the abundances of the light elements C, N, O, Na, Al, the α-elements Mg, Si, Ca, Ti, and the heavy elements Y, Ba, and Eu. Methods. High-resolution spectra of four stars with FLAMES-UVES@VLT UT2-Kueyen were analysed. Spectroscopic parameter-derivation was based on excitation and ionization equilibrium of Fe I and Fe II. Results. This analysis results in a metallicity of [Fe/H] = -1.17 ± 0.10 for NGC 6558. We find the expected α-element enhancements in O and Mg with [O/Fe]=+0.40, [Mg/Fe]=+0.33, and low enhancements in Si and Ca. Ti has a moderate enhancement of [Ti/Fe]=+0.22. The r-element Eu appears very enhanced with a mean value of [Eu/Fe]=+0.63. Ba appears to have a solar abundance ratio relative to Fe. Conclusions. NGC 6558 shows an abundance pattern that could be typical of the oldest inner bulge globular clusters, together with the pattern in the similar clusters NGC 6522 and HP 1. They show low abundances of the odd-Z elements Na and Al, and of the explosive nucleosynthesis α-elements Si, Ca, and Ti. The hydrostatic burning α-elements O and Mg are normally enhanced as expected in old stars enriched with yields from core-collapse supernovae, and the iron-peak elements Mn, Cu, Zn show low abundances, which is expected for Mn and Cu, but not for Zn. Finally, the cluster trio NGC 6558, NGC 6522, and HP 1 show similar abundance patterns. Key words. Galaxy: Bulge - Globular Clusters: NGC 6558 - Stars: Abundances, Atmospheres 1. Introduction Globular clusters in the Galactic bulge are probes of the for- mation processes of the central parts of the Galaxy. The first dwarf-like galaxies were likely the formation-sites of the ear- liest globular clusters, and they were subsequently incorpo- rated in the halo and bulge of galaxies such as the Milky Way (Nakasato & Nomoto 2003; Boley et al. 2009; Bromm & Yoshida 2011; Tumlinson 2010). Therefore, metal-poor inner Send offprint requests to: B. Barbuy * Observations collected at the European Southern Observatory, Paranal, Chile (ESO), under programme 93.D-0123A. bulge globular clusters might be relics of an early generation of long-lived stars formed in the proto-Galaxy. Barbuy et al. (2018a) report a concentration and even dom- inance of clusters with [Fe/H]∼-1.00 within about 10 ◦ of the Galactic centre. A metallicity of -1.3 < ∼ [Fe/H] < ∼ -1.0 is compat- ible with the lowest metallicities of the bulk of stellar popula- tions in the Galactic bulge, as shown by the metallicity dis- tribution of bulge stars by Zoccali et al. (2008, 2017), Hill et al. (2011), Ness et al. (2013), and Rojas-Arriagada et al. (2014, 2017). This is due to a fast chemical enrichment in the Galactic bulge, as discussed in Chiappini et al. (2011), Wise et al. (2012) and Cescutti et al. (2018). Very low fractions of more metal-poor stars were found so far (e.g. Garc´ ıa-Perez et arXiv:1810.11703v1 [astro-ph.SR] 27 Oct 2018

Welcome message from author
This document is posted to help you gain knowledge. Please leave a comment to let me know what you think about it! Share it to your friends and learn new things together.
Transcript

Astronomy & Astrophysics manuscript no. 33953finalfinal c© ESO 2018October 30, 2018
High-resolution abundance analysis of four red giants in theglobular cluster NGC 6558 ∗
B. Barbuy1, L. Muniz1, S. Ortolani2,3, H. Ernandes1, B. Dias4,5, I. Saviane4, L. Kerber6, E. Bica7, A.Perez-Villegas1, L. Rossi8, and E.V. Held9
1 Universidade de Sao Paulo, IAG, Rua do Matao 1226, Cidade Universitaria, Sao Paulo 05508-900, Brazil; e-mail: [email protected] Dipartimento di Fisica e Astronomia, Universita di Padova, I-35122 Padova, Italy3 INAF-Osservatorio Astronomico di Padova, Vicolo dell’Osservatorio 5, I-35122 Padova, Italy4 European Southern Observatory, Alonso de Cordova 3107, Santiago, Chile5 Facultad de Ciencias Exactas, Universidad Andres Bello, Av. Fernandez Concha 700, Las Condes, Santiago, Chile6 Universidade Estadual de Santa Cruz, DCET, Rodovia Jorge Amado km 16, Ilheus 45662-000, Bahia, Brazil7 Universidade Federal do Rio Grande do Sul, Departamento de Astronomia, CP 15051, Porto Alegre 91501-970, Brazil8 Centre for Astrophysics and Supercomputing, Swinburne University of Technology, Hawthorn, Victoria 3122, Australia9 INAF - Osservatorio Astronomico di Padova, vicolo dell’Osservatorio 5, 35122 Padova, Italy
Received; accepted
ABSTRACT
Context. NGC 6558 is a bulge globular cluster with a blue horizontal branch (BHB), combined with a metallicity of [Fe/H]≈-1.0. It is similarto HP 1 and NGC 6522, which could be among the oldest objects in the Galaxy. Element abundances in these clusters could reveal the natureof the first supernovae.Aims. We aim to carry out detailed spectroscopic analysis for four red giants of NGC 6558, in order to derive the abundances of the lightelements C, N, O, Na, Al, the α-elements Mg, Si, Ca, Ti, and the heavy elements Y, Ba, and Eu.Methods. High-resolution spectra of four stars with FLAMES-UVES@VLT UT2-Kueyen were analysed. Spectroscopic parameter-derivationwas based on excitation and ionization equilibrium of Fe I and Fe II.Results. This analysis results in a metallicity of [Fe/H] = −1.17± 0.10 for NGC 6558. We find the expected α-element enhancements in O andMg with [O/Fe]=+0.40, [Mg/Fe]=+0.33, and low enhancements in Si and Ca. Ti has a moderate enhancement of [Ti/Fe]=+0.22. The r-elementEu appears very enhanced with a mean value of [Eu/Fe]=+0.63. Ba appears to have a solar abundance ratio relative to Fe.Conclusions. NGC 6558 shows an abundance pattern that could be typical of the oldest inner bulge globular clusters, together with the patternin the similar clusters NGC 6522 and HP 1. They show low abundances of the odd-Z elements Na and Al, and of the explosive nucleosynthesisα-elements Si, Ca, and Ti. The hydrostatic burning α-elements O and Mg are normally enhanced as expected in old stars enriched with yieldsfrom core-collapse supernovae, and the iron-peak elements Mn, Cu, Zn show low abundances, which is expected for Mn and Cu, but not forZn. Finally, the cluster trio NGC 6558, NGC 6522, and HP 1 show similar abundance patterns.
Key words. Galaxy: Bulge - Globular Clusters: NGC 6558 - Stars: Abundances, Atmospheres
1. Introduction
Globular clusters in the Galactic bulge are probes of the for-mation processes of the central parts of the Galaxy. The firstdwarf-like galaxies were likely the formation-sites of the ear-liest globular clusters, and they were subsequently incorpo-rated in the halo and bulge of galaxies such as the MilkyWay (Nakasato & Nomoto 2003; Boley et al. 2009; Bromm &Yoshida 2011; Tumlinson 2010). Therefore, metal-poor inner
Send offprint requests to: B. Barbuy∗Observations collected at the European Southern Observatory,
Paranal, Chile (ESO), under programme 93.D-0123A.
bulge globular clusters might be relics of an early generationof long-lived stars formed in the proto-Galaxy.
Barbuy et al. (2018a) report a concentration and even dom-inance of clusters with [Fe/H]∼-1.00 within about 10◦ of theGalactic centre. A metallicity of -1.3<∼ [Fe/H] <∼-1.0 is compat-ible with the lowest metallicities of the bulk of stellar popula-tions in the Galactic bulge, as shown by the metallicity dis-tribution of bulge stars by Zoccali et al. (2008, 2017), Hillet al. (2011), Ness et al. (2013), and Rojas-Arriagada et al.(2014, 2017). This is due to a fast chemical enrichment in theGalactic bulge, as discussed in Chiappini et al. (2011), Wiseet al. (2012) and Cescutti et al. (2018). Very low fractions ofmore metal-poor stars were found so far (e.g. Garcıa-Perez et
arX
iv:1
810.
1170
3v1
[as
tro-
ph.S
R]
27
Oct
201
8
2 B. Barbuy et al.: Abundance analysis of red giants in NGC 6558
al. 2013, Casey & Schlaufman 2015, Howes et al. 2016, Kochet al. 2016) – see also the discussion in Barbuy et al. (2018a).
Therefore it is crucial to study such moderately metal-poorclusters ([Fe/H]∼−1.0) located in the Galactic bulge, in orderto further identify their signatures, which correspond to theearliest stages of the Galactic bulge formation. Their chemi-cal abundances can reveal the nature of the first massive starsand supernovae.
One candidate Milky Way relic is NGC 6558, which hasa blue horizontal branch (BHB), together with a metallicity of[Fe/H]∼-1.0 (Rich et al. 1998; Barbuy et al. 2007), with char-acteristics very similar to NGC 6522 (Barbuy et al. 2009, 2014,Ness et al. 2014), and HP 1 (Barbuy et al. 2006, 2016). The trioNGC 6558, NGC 6522, and HP 1 are the main representativesof such clusters in the inner 6◦ of the Galactic bulge, as can beseen in the classification given in Barbuy et al. (2009) – see alsoBica et al. (2016). Their combined features indicate a very oldage. The ages of NGC 6522 and HP 1 were recently confirmedto be very old, calculated to be around 13 Gyr by Ortolani et al.(2011) and Kerber et al. (2018a,b).
The cluster NGC 6558 is projected on the Galactic bulge, ina field described as an extended clear region by Blanco (1988).The equatorial coordinates are (J2000) α = 18h 10m18.4s, δ= -31◦ 45’ 49”, and the Galactic coordinates are l = 0.201◦,b = -6.025◦. NGC 6558 is very concentrated, with post-corecollapse structure, a core radius of rc = 2” and a half light radiusrh = 129” according to Trager et al. (1995).
In Rossi et al. (2015), NGC 6558 was studied with aset of subarcsec (∼0.5”) seeing images obtained at the NewTechnology Telescope (NTT), with a time difference of 19years. This has allowed us to apply proper motion decontami-nation, with high accuracy, and a reliable selection of memberstars. Using the proper motion determinations by Rossi et al.(2015), combined with the radial velocity from high-resolutionspectroscopy by Barbuy et al. (2007) and heliocentric distancefrom literature (Bica et al. 2006), Perez-Villegas et al. (2018)carried out an orbital analysis of NGC 6558 in a bulge/barGalactic potential and with a Monte Carlo method, taking intoaccount the uncertainties in the observational parameters. Thecluster shows a pro-grade orbit, with peri-galactic and apo-galactic distances of ∼0.13 and ∼2.50 kpc, respectively, anda maximum height of < |z|max >∼1.4 kpc, pointing out that thecluster is confined in the innermost Galactic region with a bar-shape in the x-y projection, and boxy-shape in the x-z projec-tion (in a frame co-rotating with the bar), indicating that NGC6558 is trapped by the Galactic bar.
In Barbuy et al. (2007) we carried out a detailed abundanceanalysis of five stars with spectra obtained with the GIRAFFEspectrograph at the Very Large Telescope (VLT), from theESO projects 71.B-0617A, 73.B0074A (PI: A. Renzini) (seeZoccali et al. 2008). A mean metallicity of [Fe/H]=−0.97±0.15was obtained for NGC 6558. From CaT triplet lines based onFORS2@VLT spectra, for a sample of 28 globular clusters,Saviane et al. (2012) derived [Fe/H]=−1.03±0.14 for NGC6558. Based on FORS2@VLT spectra in the optical, Dias etal. (2015, 2016) derived metallicities for 51 globular clusters,including the same stars in the same clusters as in Saviane etal. (2012). A method of full spectrum fitting from observations
Table 1: Log of photometric observations, carried out on 20-21May 2012 at the NTT.
Filter Exp. (s) Seeing (“) Airmass
V 20 0.55 1.01I 10 0.50 1.01V 30 x 4 0.60 1.01V 300 0.60 1.01I 180 x 4 0.60 1.01I 20 x 4 0.60 1.01V 90 0.60 1.01I 60 0.60 1.01
in the 4600-5600 Å region was carried out. Recalling that theresults depend crucially on the library of spectra adopted, thefinal metallicity of [Fe/H]=−1.01±0.10 for NGC 6558 was ob-tained essentially with the use of a library of synthetic spectra(Coelho et al. 2005).
In this work we present results from spectra obtained forfour stars with the FLAMES-UVES spectrograph at the VLT,at a resolution R∼45,000. A detailed abundance analysis of thesample stars was carried out using MARCS model atmospheres(Gustafsson et al. 2008).
Photometric and spectroscopic data are described respec-tively in Sects. 2 and 3. Photometric stellar parameters effectivetemperature and gravity are derived in Sect. 4. Spectroscopicparameters are derived in Sect. 5 and abundance ratios are com-puted in Sect. 6. Results are discussed in Sect. 7 and conclu-sions are drawn in Sect. 8.
2. Photometric observations
Colour-magnitude diagrams (CMDs) for NGC 6558 were pre-sented by Rich et al. (1998) in V vs. V-I, and in the near-infrared (NIR) by Davidge et al. (2004) in K vs. J-K diagrams.Davidge et al. (2004) estimated a metallicity of [Fe/H]=-1.5±0.5, from Flamingos-I spectra of resolution of R=350, ob-tained with the Gemini-South telescope. We carried out a mem-bership check for their brightest stars, and found that their star#5 should be a member, located at the very tip of the red gi-ant branch at V-I = 2.55; star #11 is saturated in our images,and could not be verified for membership. More recently, NGC6558 has been further studied in the near-infrared by Chun etal. (2010), and in the optical by Alonso-Garcıa et al. (2012).
In Rossi et al. (2015) a proper-motion cleaned CMD ofNGC 6558 was produced, where the first epoch observations ofNGC 6558 were taken in June 15, 1993, and the second epochdata in May 20, 2012. Therefore a time baseline of 19 years isavailable for proper motion decontamination.
In the present work we give further detail on the NTT dataand reductions, beyond those given in Rossi et al. (2015), wheredata and reductions were only briefly described and reported intheir Table 1. For the first epoch, we used NTT at the EuropeanSouthern Observatory - ESO (La Silla) equipped with EMMI inthe focal reducer mode. The red arm and the 2024x2024 pixelsLoral UV-coated CCD ESO # 34 detector were employed. Thepixel size is 15 µm, corresponding to 0.35”, with a full field
B. Barbuy et al.: Abundance analysis of red giants in NGC 6558 3
of 11.8’x11.8’. The log of these observations can be found inRich et al. (1998).
For the second epoch, we used NTT equipped withEFOSC2, with CCD ESO # 40, UV-flooded, MPP, and2048x2048 pixels, with pixel size of 15 µm, corresponding to0.12”/pixel, binned in two by two. The full field is 4.1’x4.1’.The log of NTT 2012 observations is given in Table 1.
We have measured 20 Landolt stars (Landolt 1983, 1992)during the two photometric nights used to define the calibrationtransformations, and some of them have been observed repeat-edly. Daophot II was used to extract the instrumental magni-tudes. These magnitudes have been calibrated using Landoltstars, resulting in:
V = v + 0.04(V-I) + 28.51 ±0.015magI = i - 0.01(V-I) + 27.96 ±0.015mag
for exposure times of 15 sec and airmasses of 1.15. Due tocrowding effects the transfer of the aperture magnitudes fromstandards to the field stars gives an additional ±0.03 mag,and the final magnitude zero point uncertainty amounts to±0.04. The atmospheric extinction was corrected with the stan-dard La Silla coefficients for EFOSC2 (CV = 0.16, CI = 0.08mag/airmass).
The present proper motion measurements were based onthe two best seeing second epoch sets of images. We used theremaining images for a test on photometric error effects.
In Figure 1 we show an image of NGC 6558 combining J,Y, Z filters, from the Vista Variables in the Via Lactea (VVV1;Saito et al. 2012) survey; the four sample stars, and the morecentral RR Lyrae stars identified in the Optical GravitationalLensing Experiment (Udalski et al. 2002; Soszynski et al.2014) OGLE2 are overplotted.
In Figure 2 we give a V vs. V-I proper-motion-cleanedCMD (calibrated to the NTT 2012 data), together with theBaSTI α-enhanced 13 Gyr, [Fe/H]=-1.0, and primordial helium(Y=0.25) isochrone fit (Pietrinferni et al. 2004). The four sam-ple stars and the seven more central RR Lyrae from OGLE areidentified. As can be seen, the four sample stars are red giantbranch (RGB) stars, and the RR Lyrae populate the instabilitystrip of the horizontal branch (HB). The BaSTI isochrones em-ployed are suitable to the subgiant and red giant branch (SGB-RGB), and a separate isochrone suitable to the zero-age hori-zontal branch (ZAHB) is included.
2.1. Reddening and distance
In Table 2, we report values of V magnitude of the HorizontalBranch VHB, reddening, distance modulus and distancesadopted in the literature (Terndrup 1988, Hazen 1996, Richet al. 1998, Davidge et al. 2004, Barbuy et al. 2007, Rossi etal. 2015), together with the presently derived values. In a pio-neer work Terndrup (1988) derived reddening and proper mo-tion values for fields along the bulge minor axis, including theNGC 6558 location at -6◦. Distances of d� = 6.6 kpc and 6.3kpc were found respectively by Hazen (1996) and Rich et al.(1998). A revised distance taking into account an updated abso-
1horus.roe.ac.uk/vsa/2ogledb.astrouw.edu.pl/∼ogle/OCVS
lute magnitude of the HB versus metallicity relation by Harris(1996, updated in 2010)3 yields E(B-V)=0.44 and a distanceto the Sun of d�=7.4 kpc. Davidge et al. (2004) adopt E(B-V)=0.44. Barbuy et al. (2007) use photometric data from the2.2m MPI telescope at ESO, and obtain a magnitude of the HBlevel at VHB = 15.5.
Alonso-Garcıa et al. (2012) analyse the differential redden-ing in NGC 6558, relative to a ridge line (not the absolute val-ues). For a mean reddening value the authors adopt a valuefrom Schlegel et al. (1998), that is overestimated in particularin the central regions, because it measures the dust integratedin the line of sight all along the extent of the Galaxy. Thereforethese authors’ mean value of E(B-V)=0.51 appears to be toohigh - see literature values in Table 2. Alonso-Garcıa et al. findthat that NGC 6558 is a difficult case (their Sect. 4.18), andthey could not get a significant de-reddening improvement, dueto the cluster being very contaminated. Their method is also af-fected by stars with different reddening along the line of sight.
Rossi et al. (2015) use the 1993 NTT data combined withthe 2012 NTT data, and from these data a HB level at VHB =
16.0, a distance modulus of (m−M)0 = 14.43, AV = 1.178, anda distance of d� = 7.4 kpc was obtained. Conversion factorsfor E(V-I)/E(B-V) range from 1.31 (Dean et al. 1978), 1.38(Schlegel et al. 1998) to 1.40 (Schlafly & Finkbeiner 2011).Schlegel et al. (1998) gives E(V-I)=0.53 towards NGC 6558,this being an upper limit, since it is measured all along theline of sight. OGLE reddening maps give E(V-I)=0.54 (Natafet al. 2013), Rich et al. (1998) derived E(V-I)=0.60, and Harris(1996, updated in 2010) reports E(B-V)=0.44. In the presentwork we identified the HB at V(HB)=16.37, and find E(V-I)=0.50 (Table 2), which together with reddening law val-ues of E(V-I)/E(B-V)=1.33, and a total-to-selective absorptionRV=3.1, give a V-band extinction of AV=1.17, and a distanceof d� = 8.26 kpc (Table 2), farther than in previous measure-ments.
An additional constraint to the cluster distance can be ob-tained from the RR Lyrae. According to the MV-[Fe/H] rela-tion derived by the Gaia collaboration (2017), RR Lyrae starswith [Fe/H]=-1.17 (Sect. 5, Table 6), have MV∼0.65±0.10.Assuming the average V magnitude for the RR Lyrae stars of<V>∼16.40, and our reddening AV=1.165, we obtain exactlythe same intrinsic distance modulus values presented in Table2, of (m-M)0∼14.585. This shows that the distances from bothmethods, that is, isochrone fit and RR Lyrae stars, are converg-ing. The uncertainty in the MV of ±0.10 leads to an uncertaintyof ±0.10 in (m-M)0, and an uncertainty of +0.39
−0.37 kpc in the dis-tance.
3. Spectroscopic observations
The spectra of individual stars of NGC 6558 were obtained atthe VLT using the UVES spectrograph (Dekker et al. 2000),in FLAMES-UVES mode. The red chip (5800-6800 Å) usesESO CCD # 20, an MIT backside illuminated, of 4096x2048pixels, and pixel size 15x15µm. The blue chip (4800-5800 Å)uses ESO Marlene EEV CCD#44, backside illuminated, of
3 http://www.physics.mcmaster.ca/Globular.html
4 B. Barbuy et al.: Abundance analysis of red giants in NGC 6558
Table 2: Literature HB level, reddening, and distance forNGC 6558. References: 1 Terndrup (1988), 2 Hazen (1996),3 Rich et al. (1998), 4 Davidge et al. (2004), 5 Barbuy et al.(2007), 6 Rossi et al. (2015), 7 present work.
VHB E(B-V) E(V-I) AV (m-M) (m-M)o d�(kpc) reference
— 0.38 0.50 1.33 — — — 116.00 0.43 — 1.30 15.40 14.10 6.6 216.05 0.46 0.6 1.43 — — 6.4 316.30 0.44 — 1.36 — — — 415.50 0.38 — 1.18 — 14.43 7.4 516.00 — — 1.18 — 14.43 7.4 616.37 0.38 0.50 1.165 15.75 14.585 8.26 7
4102x2048 pixels, and pixel size 15x15µm. The UVES stan-dard setup 580 yields a resolution R ∼ 45,000 for a 1 arcsecslit width. The pixel scale is 0.0147 Å/pix, with ∼7.5 pixels perresolution element at 6000 Å.
The data were reduced using the UVES pipeline, withinESO/Reflex software (Ballester et al. 2000; Modigliani et al.2004). The log of the 2014 observations are given in Table3. The spectra were flatfielded, optimally extracted and wave-length calibrated with the FLAMES-UVES pipeline.
The present UVES observations centred at 5800 Å yield aspectral coverage of 4800 < λ < 6800 Å, with a gap at 5708-5825 Å. The final signal-to-noise ratio (S/N) resulted in valuesof S/N∼100 in the red portion, and S/N∼70 in the blue portion.The selected stars, their OGLE and 2MASS designations, coor-dinates, and V, I magnitudes from the NTT 2012 data presentedhere, together with the 2MASS JHKs (Skrutskie et al. 2006),and VVV JHKs magnitudes (Saito et al. 2012), are listed inTable 4.
We derived radial velocities using the IRAF/FXCOR taskfor all individual observations in each run, adopting as tem-plate the Arcturus spectrum (Hinkle et al. 2000). The presentmean heliocentric radial velocity vhel
r = −194.45±2.1 km s−1 isin very good agreement with the value of vhel
r = −197.3±4.0km s−1 derived from five giants stars observed with theGIRAFFE spectrograph (Barbuy et al. 2007), and −198.0±4.0km s−1 derived by Saviane et al. (2012) from four stars. Spectraextracted from different frames were then co-added, taking intoaccount the radial velocities reported in Table 5.
4. Photometric stellar parameters
4.1. Temperatures
VIJHKs magnitudes are given in Table 4. V and I magnitudesfrom the NTT 2012 observations, 2MASS J, H, and Ks fromSkrutskie et al. (2006)4 and VVV J, H, and Ks from the VVVsurvey (Saito et al. 2012), were adopted. Reddening laws fromDean et al. (1978) and Rieke & Lebofsky (1985), namely, RV= AV/E(B−V) = 3.1, E(V − I)/E(B−V)=1.33, E(V −K)/E(B−V)=2.744, E(J − K)/E(B − V)=0.527 were used.
Effective temperatures were derived from V − I using thecolour-temperature calibrations of Alonso et al. (1999). For the
4 http : //ipac.caltech.edu/2mass/releases/allsky/
transformation of V − I from Cousins to Johnson system weused V − IC=0.778(V − IJ) as given in Bessell (1979). TheVVV JHKs colours were transformed to the 2MASS JHKs
system, using relations by Soto et al. (2013). For the effectivetemperatures derived from the V − K, and J − K 2MASS andVVV colours we used the relations by Gonzalez Hernandez &Bonifacio (2009). It seems that some magnitudes are not ade-quate, in particular the 2MASS Ks for star 283. The photomet-ric effective temperatures derived are listed in Table 6.
4.2. Gravities
The following classical relation was used to derive gravities
log g∗ = 4.44 + 4 logT∗T�
+ 0.4(Mbol∗ − Mbol◦) + logM∗M�
(1)
For NGC 6558 the NTT 2012 photometry gives AV = 1.17,and (m-M)◦ = 14.58. We adopted T�=5770 K, Mbol�=4.75, andM∗=0.85 M�. The bolometric corrections computed with rela-tions from Alonso et al. (1999), and corresponding gravitiesare given in Table 6. The photometric parameters were adoptedas an initial guess in order to proceed with the analysis of thespectroscopic data for the derivation of the final stellar param-eters, as described in the next section.
5. Spectroscopic stellar parameters
The equivalent widths (EW) were initially measured using theautomatic code DAOSPEC, developed by Stetson & Pancino(2008). We also measured all lines manually using IRAF. TheFe II lines adopted were all measured by hand using IRAF,given that DAOSPEC is unable to take subtle blends into ac-count. To rely on the Fe II lines to derive the gravities, wecompared the observed and synthetic lines, and eliminated thenot clearly present lines in the observed spectra. For the Fe Iand Fe II lines, the oscillator strengths and EWs are reportedin Table to be published electronically only. The wavelengths,excitation potentials and oscillator strengths were gatheredfrom the line lists by Kurucz (1993) websites56, the NationalInstitute of Standards & Technology (NIST, Martin et al. 2002)7, and VALD (Piskunov et al. 1995). Oscillator strengths forthe Fe II lines are from Melendez & Barbuy (2009).
Atomic constants (log gf and van der Waals damping con-stants, and hyperfine structure) were adopted after checking thefits to lines in the solar spectrum with the same UVES@VLTinstrumentation as the present data 8, the Arcturus spectrum(Hinkle et al. 2000), and the metal-rich star µ Leo (Lecureur etal. 2007), as explained in previous papers (Barbuy et al. 2006;Barbuy et al. 2014; Trevisan & Barbuy 2014, among others).
Photospheric 1-D models for the sample giants were ex-tracted from the MARCS model atmospheres grid (Gustafsson
5http://www.cfa.harvard.edu/amp/ampdata/kurucz23/sekur.html6http://kurucz.harvard.edu/atoms.html7http://physics.nist.gov/PhysRefData/ASD/lines−form.html8www.eso.org/observing/dfo/quality/UVES/pipeline/solar−−spec-
trum.html

B. Barbuy et al.: Abundance analysis of red giants in NGC 6558 5
Table 3: Log of the spectroscopic observations: date, time, Julian date, exposure time, seeing, and air mass at the beginning andat the end of the observation.
Run Date Time HJD Exp. (s) Seeing (“) Airmass
1 16.04.14 07:33:30 2456763.81493 2700 1.09−1.03 0.71−0.662 16.04.14 08:21:18 2456763.84812 2700 1.03−1.01 0.66−1.073 16.04.14 09:10:32 2456763.88231 2700 1.01−1.02 1.02−1.074 29.04.14 05:30:49 2456776.72973 2700 1.00−1.13 1.28−1.145 07.06.14 05:59:48 2456815.74986 2700 0.91−0.91 1.01−1.036 04.07.14 02:50:40 2456842.61852 2700 1.46−1.00 1.05−1.01
Table 4: Identifications, positions, and magnitudes. JHKs from both 2MASS and VVV surveys are given. Superscript 1: uncertainvalues.
OGLE no. 2MASS ID α2000 δ2000 V I J H Ks JVVV HVVV KVVV
283 18102223-3145435 18 10 22.228 -31 45 43.340 15.883 14.378 13.248 12.564 10.5601 13.235 12.625 12.502364 18102150-3145268 18 10 21.496 -31 45 26.820 15.738 14.203 13.128 12.449 12.316 13.047 12.462 12.313
1072 18101520-3146014 18 10 15.208 -31 46 1.370 15.960 14.345 13.183 12.481 12.338 — 12.503 12.3771160 18101768-3145246 18 10 17.682 -31 45 24.570 15.586 14.063 12.892 12.000 11.863 12.902 12.320 12.196
Table 5: Radial velocities of the UVES sample stars, in each ofthe six exposure runs, corresponding heliocentric radial veloc-ities and mean heliocentric radial velocity.
Target vobsr vhel.
r Target vobsr vhel.
r
km s−1 km s−1 km s−1 km s−1
1160 1 -217.9820 -190.76 283 1 -221.4165 -194.201160 2 -217.8438 -190.72 283 2 -221.3267 -194.201160 3 -218.2692 -191.23 283 3 -221.0840 -194.051160 4 -214.5870 -190.52 283 4 -217.4875 -193.421160 5 -198.9683 -190.79 283 5 -202.3398 -194.161160 6 -185.4816 -190.23 283 6 -189.3486 -194.10Mean — -190.70 Mean — -194.02
364 1 -222.1566 -194.94 1072 1 -226.2227 -199.00364 2 -222.0449 -194.92 1072 2 -226.2266 -199.10364 3 -221.5339 -194.50 1072 3 -226.3010 -199.26364 4 -217.9897 -193.93 1072 4 -222.1284 -198.06364 5 -202.4231 -194.25 1072 5 -206.6227 -198.45364 6 -189.6272 -194.38 1072 6 -193.0282 -197.78Mean -194.48 Mean — -198.60
et al. 2008). The LTE abundance analysis and the spectrum syn-thesis calculations were performed using the code described inBarbuy et al. (2003), Coelho et al. (2005), and Barbuy et al.(2018b). A solar iron abundance of ε(Fe)=7.50 (Grevesse &Sauval 1998) was adopted. Molecular lines of CN (A2Π-X2Σ),C2 Swan (A3Π-X3Π), TiO (A3Φ-X3∆) γ and TiO (B3Π-X3∆)γ’ systems are taken into account in the studied wavelength re-gion.
Fig. 1: VVV image of NGC 6558 in combined JYZ colours,in size of 3.6’x2.4’. The four sample stars are identified as redfilled circles, and RR Lyrae from OGLE are identified by cyanfilled circles.
The stellar parameters were derived by initially adoptingthe photometric effective temperature and gravity, and then fur-ther constraining the temperature by imposing excitation equi-librium for Fe I lines. The selected Fe II lines measurable, al-lowed to derive gravities imposing ionization equilibrium, not-ing that their EWs are uncertain due to continuum placementinaccuracy. For this reason, we have over-plotted the computedand observed Fe II lines, and selected only those identified tobe not blended. Microturbulence velocities vt were determinedby canceling the trend of Fe I abundance vs. equivalent width.
The final spectroscopic parameters Teff , log g, [Fe I/H],[Fe II/H], [Fe/H] and vt values are reported in the last columnsof Table 6. We have adopted the spectroscopic parameters forthe derivation of elemental abundances.

6 B. Barbuy et al.: Abundance analysis of red giants in NGC 6558
Table 6: Photometric stellar parameters derived using the calibrations by Alonso et al. (1999) for V − I, V −K, J −K, bolometriccorrections, bolometric magnitudes and corresponding gravity log g, and final spectroscopic parameters.
Photometric parameters Spectroscopic parameters
star T(V − I) T(V − K) T(J − K) T(V − K) T(J − K) BCV log g Teff log g [FeI/H] [FeII/H] [Fe/H] vt
2MASS 2MASS VVV VVV(K) (K) (K) (K) (K) (K) (km s−1)
283 4730 3647 2103 4823 4895 −0.36 2.1 4800 2.10 −1.20 −1.20 −1.20 1.00364 4666 4792 4831 4784 4899 −0.39 2.0 4880 2.20 −1.18 −1.13 −1.15 1.901072 4509 4621 4728 4020 — −0.48 2.0 4850 2.60 −1.17 −1.17 −1.17 1.011160 4692 4541 4222 4815 4994 −0.38 2.0 4900 2.60 −1.11 −1.18 −1.15 1.30
Fig. 2: V vs. V − I Colour-magnitude diagram of NGC 6558from NTT 2012 data. The four sample stars are shown as redstars, and RR Lyrae are shown as green filled circles. A BaSTIisochrone for an age of 13 Gyr, [Fe/H]=-1.0 and primordialhelium abundance (Y=0.25) is overplotted.
6. Element abundances
Abundances were obtained by means of line-by-line spectrumsynthesis calculations compared with the observed spectra. Thehyperfine structure (HFS) for the studied lines of Ba II andEu II were taken into account.
We report the line-by-line abundances for the light elementsC, N, O, the odd-Z elements Na, Al, the α-elements Mg, Si, Ca,Ti, and the heavy elements Ba, Y, Sr, and Eu abundances, givenelectronically only. In Table 7 we give the final abundances foreach star, and the mean abundances for the cluster.
The carbon abundances were estimated from the C2(0,1)bandhead at 5635.3 Å of the Swan d3Πg-a3Πu system, using the
laboratory line list from Phillips & Davis (1968). The N abun-dances were derived from the CN (5,1) bandhead at 6332.2 Åof the CN A2Π-X2Σ red system, using laboratory line lists byDavis & Phillips (1963). Both these bandheads are weak andindicate only an upper limit for the S/N of these spectra. Theforbidden [OI] 6300.311 Å line was used to derive the oxygenabundances, taking into account the estimated C and N abun-dances iteratively. The abundance derivation of the elementsNa, Al, Mg, Si, Ca, and Ti followed the usual procedures andline lists (e.g. Barbuy et al. 2016). Examples of fits of syntheticspectra to observed lines are given in Figures 3 and 4.
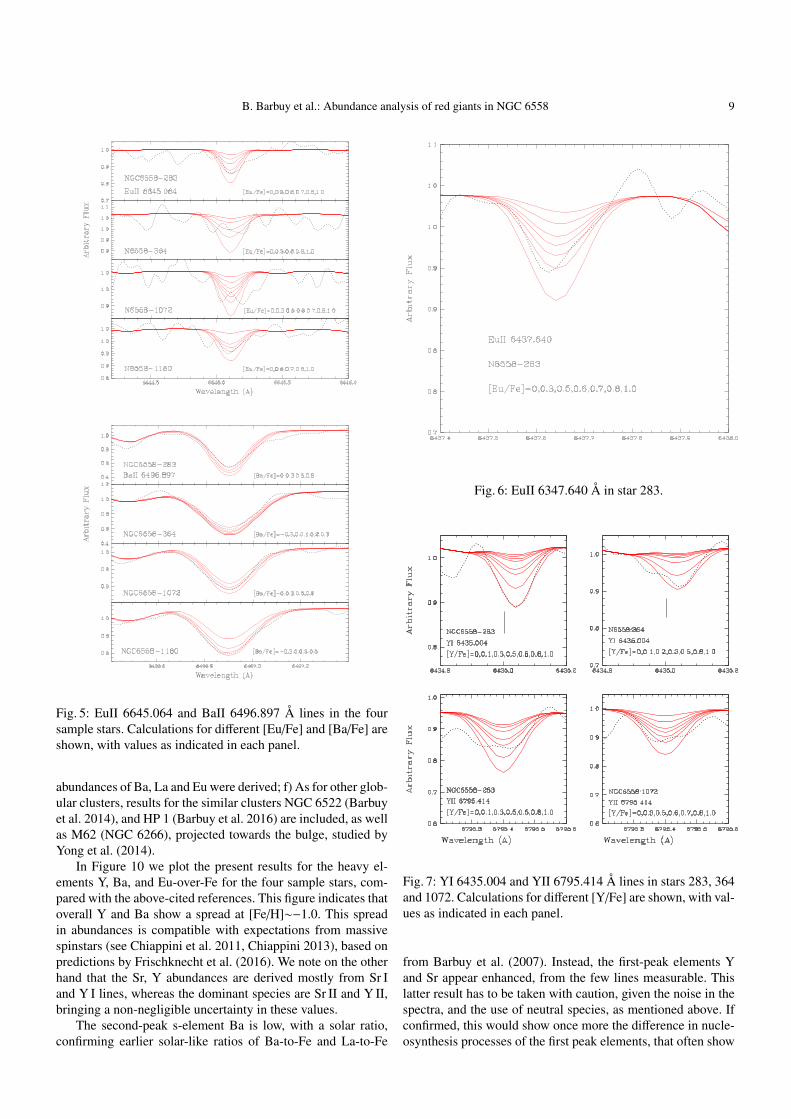
Fits to the Eu II 6645.064 and Ba II 6496.897 Å lines areshown in Fig. 5. Eu was derived from the Eu II 6645.064 Å,showing all high values. The lines Eu II 6173.029 Å, Eu II6437.640 Å were also inspected. The former is blended andwould in any case indicate an even higher Eu abundance. Thelatter is compatible with the abundances obtained from theEu II 6645.064 Å line, as can be seen in Fig. 6 in star 283 (forthe other three stars there are defects in the spectra).
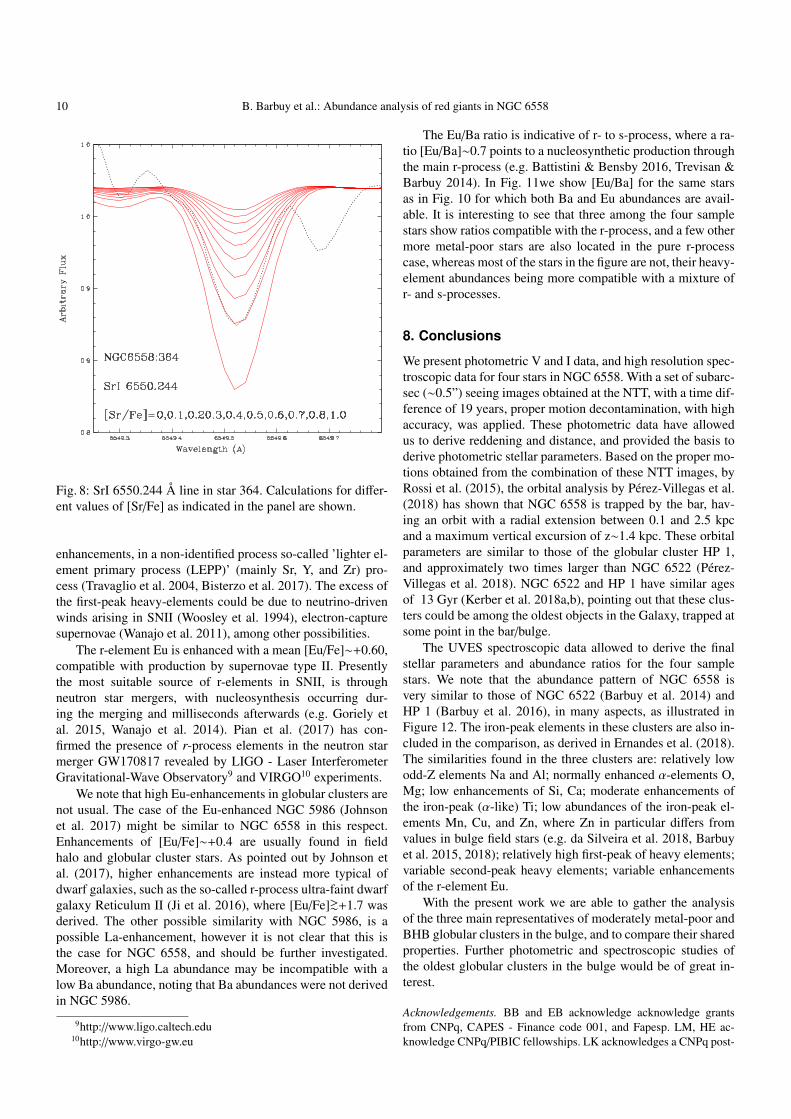
The heavy element Y was derived only for three stars fromthe Y II 6795.414 Å line, and also from Y II 6435.004 Å forone star; Sr was derived for one star from one line. As can beseen from Figs. 7 and 8 these results must be taken with cau-tion. Finally, La remains undefined given that although the La II6172.721 Å line indicates [La/Fe]∼+1.0 for two sample stars,the region shows unidentified blends, whereas La II 6320.276Å and La II 6390.477 Å give considerably lower values; La II6262.287 Å has defects in all four stars; besides, if La is highthis would be in contrast with a low Ba, and not compatiblewith the results from Barbuy et al. (2007), so that we prefer notto report final values for La.
Errors: The errors due to uncertainties in spectroscopic pa-rameters are given in Table 8, applied to the sample star NGC6558:283. We have adopted the usual errors as for similar sam-ples (Barbuy et al. 2014, 2016): ±100 K in effective tempera-ture, ±0.2 on gravity, and ±0.2 km s−1 on the microturbulencevelocity. Errors are computed by computing models with thesemodified parameters, with changes of ∆Teff=+100 K, ∆log g=+0.2, ∆vt = 0.2 km s−1, and recomputing lines of different el-ements. The error given is the abundance difference needed toreach the adopted abundances. A total error estimate is given inColumn (5) of Table 8. Additionally there is uncertainty in the
B. Barbuy et al.: Abundance analysis of red giants in NGC 6558 7
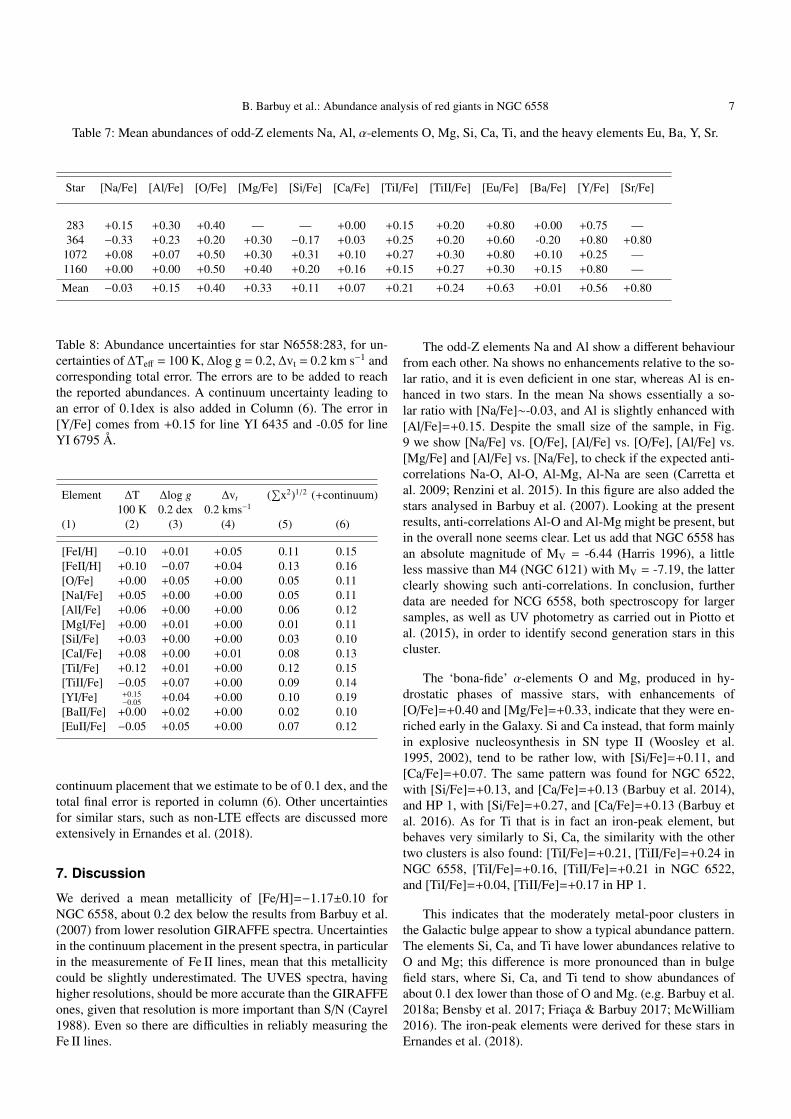
Table 7: Mean abundances of odd-Z elements Na, Al, α-elements O, Mg, Si, Ca, Ti, and the heavy elements Eu, Ba, Y, Sr.
Star [Na/Fe] [Al/Fe] [O/Fe] [Mg/Fe] [Si/Fe] [Ca/Fe] [TiI/Fe] [TiII/Fe] [Eu/Fe] [Ba/Fe] [Y/Fe] [Sr/Fe]
283 +0.15 +0.30 +0.40 — — +0.00 +0.15 +0.20 +0.80 +0.00 +0.75 —364 −0.33 +0.23 +0.20 +0.30 −0.17 +0.03 +0.25 +0.20 +0.60 -0.20 +0.80 +0.801072 +0.08 +0.07 +0.50 +0.30 +0.31 +0.10 +0.27 +0.30 +0.80 +0.10 +0.25 —1160 +0.00 +0.00 +0.50 +0.40 +0.20 +0.16 +0.15 +0.27 +0.30 +0.15 +0.80 —
Mean −0.03 +0.15 +0.40 +0.33 +0.11 +0.07 +0.21 +0.24 +0.63 +0.01 +0.56 +0.80
Table 8: Abundance uncertainties for star N6558:283, for un-certainties of ∆Teff = 100 K, ∆log g = 0.2, ∆vt = 0.2 km s−1 andcorresponding total error. The errors are to be added to reachthe reported abundances. A continuum uncertainty leading toan error of 0.1dex is also added in Column (6). The error in[Y/Fe] comes from +0.15 for line YI 6435 and -0.05 for lineYI 6795 Å.
Element ∆T ∆log g ∆vt (∑
x2)1/2 (+continuum)100 K 0.2 dex 0.2 kms−1
(1) (2) (3) (4) (5) (6)
[FeI/H] −0.10 +0.01 +0.05 0.11 0.15[FeII/H] +0.10 −0.07 +0.04 0.13 0.16[O/Fe] +0.00 +0.05 +0.00 0.05 0.11[NaI/Fe] +0.05 +0.00 +0.00 0.05 0.11[AlI/Fe] +0.06 +0.00 +0.00 0.06 0.12[MgI/Fe] +0.00 +0.01 +0.00 0.01 0.11[SiI/Fe] +0.03 +0.00 +0.00 0.03 0.10[CaI/Fe] +0.08 +0.00 +0.01 0.08 0.13[TiI/Fe] +0.12 +0.01 +0.00 0.12 0.15[TiII/Fe] −0.05 +0.07 +0.00 0.09 0.14[YI/Fe] +0.15
−0.05 +0.04 +0.00 0.10 0.19[BaII/Fe] +0.00 +0.02 +0.00 0.02 0.10[EuII/Fe] −0.05 +0.05 +0.00 0.07 0.12
continuum placement that we estimate to be of 0.1 dex, and thetotal final error is reported in column (6). Other uncertaintiesfor similar stars, such as non-LTE effects are discussed moreextensively in Ernandes et al. (2018).
7. Discussion
We derived a mean metallicity of [Fe/H]=−1.17±0.10 forNGC 6558, about 0.2 dex below the results from Barbuy et al.(2007) from lower resolution GIRAFFE spectra. Uncertaintiesin the continuum placement in the present spectra, in particularin the measuremente of Fe II lines, mean that this metallicitycould be slightly underestimated. The UVES spectra, havinghigher resolutions, should be more accurate than the GIRAFFEones, given that resolution is more important than S/N (Cayrel1988). Even so there are difficulties in reliably measuring theFe II lines.
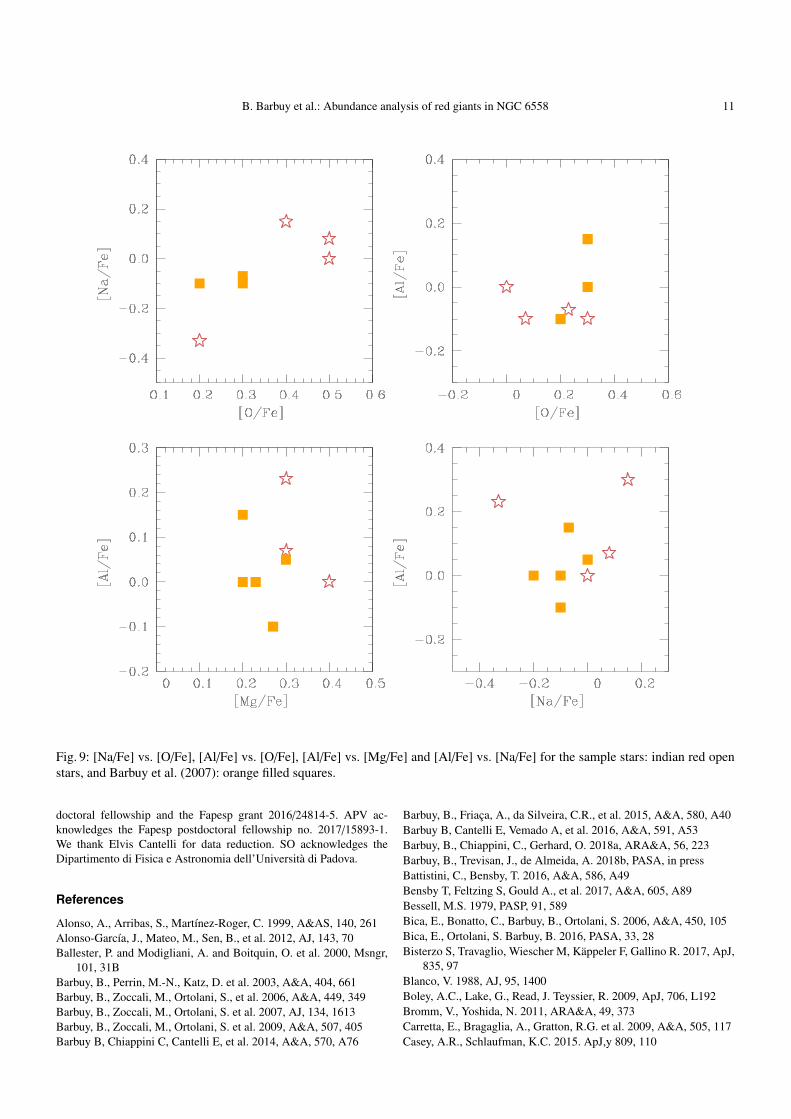
The odd-Z elements Na and Al show a different behaviourfrom each other. Na shows no enhancements relative to the so-lar ratio, and it is even deficient in one star, whereas Al is en-hanced in two stars. In the mean Na shows essentially a so-lar ratio with [Na/Fe]∼-0.03, and Al is slightly enhanced with[Al/Fe]=+0.15. Despite the small size of the sample, in Fig.9 we show [Na/Fe] vs. [O/Fe], [Al/Fe] vs. [O/Fe], [Al/Fe] vs.[Mg/Fe] and [Al/Fe] vs. [Na/Fe], to check if the expected anti-correlations Na-O, Al-O, Al-Mg, Al-Na are seen (Carretta etal. 2009; Renzini et al. 2015). In this figure are also added thestars analysed in Barbuy et al. (2007). Looking at the presentresults, anti-correlations Al-O and Al-Mg might be present, butin the overall none seems clear. Let us add that NGC 6558 hasan absolute magnitude of MV = -6.44 (Harris 1996), a littleless massive than M4 (NGC 6121) with MV = -7.19, the latterclearly showing such anti-correlations. In conclusion, furtherdata are needed for NCG 6558, both spectroscopy for largersamples, as well as UV photometry as carried out in Piotto etal. (2015), in order to identify second generation stars in thiscluster.
The ‘bona-fide’ α-elements O and Mg, produced in hy-drostatic phases of massive stars, with enhancements of[O/Fe]=+0.40 and [Mg/Fe]=+0.33, indicate that they were en-riched early in the Galaxy. Si and Ca instead, that form mainlyin explosive nucleosynthesis in SN type II (Woosley et al.1995, 2002), tend to be rather low, with [Si/Fe]=+0.11, and[Ca/Fe]=+0.07. The same pattern was found for NGC 6522,with [Si/Fe]=+0.13, and [Ca/Fe]=+0.13 (Barbuy et al. 2014),and HP 1, with [Si/Fe]=+0.27, and [Ca/Fe]=+0.13 (Barbuy etal. 2016). As for Ti that is in fact an iron-peak element, butbehaves very similarly to Si, Ca, the similarity with the othertwo clusters is also found: [TiI/Fe]=+0.21, [TiII/Fe]=+0.24 inNGC 6558, [TiI/Fe]=+0.16, [TiII/Fe]=+0.21 in NGC 6522,and [TiI/Fe]=+0.04, [TiII/Fe]=+0.17 in HP 1.
This indicates that the moderately metal-poor clusters inthe Galactic bulge appear to show a typical abundance pattern.The elements Si, Ca, and Ti have lower abundances relative toO and Mg; this difference is more pronounced than in bulgefield stars, where Si, Ca, and Ti tend to show abundances ofabout 0.1 dex lower than those of O and Mg. (e.g. Barbuy et al.2018a; Bensby et al. 2017; Friaca & Barbuy 2017; McWilliam2016). The iron-peak elements were derived for these stars inErnandes et al. (2018).

8 B. Barbuy et al.: Abundance analysis of red giants in NGC 6558
Fig. 3: SiI 5948.545, CaI 6493.788 and CaI 6572.779 Å linesin the four sample stars. Calculations for different [Si/Fe] and[Ca/Fe] are shown, with values as indicated in each panel.
Fig. 4: TiI 5866.449 and 6126.214 Å lines in the four samplestars. Calculations for different [Ti/Fe] are shown, with valuesas indicated in each panel.
As for the heavy elements, we compared the present re-sults with available literature abundances of heavy elements inbulge field stars, and results for NGC 6558 from Barbuy et al.(2007), and other globular clusters: a) Johnson et al. (2012) de-rived abundances of Eu in common with the present elementabundance derivation. Their observations concern red giants inPlaut’s field, located at l=-1◦, b=-8◦, and l=-1◦, b=-8.◦5, andtheir stars have metallicities in the range −1.6 ≤ [Fe/H] ≤ +0.5;b) Siqueira-Mello et al. (2016) analysed five stars indicated tohave metallicities around [Fe/H]∼-0.8 in the ARGOS survey(Ness et al. 2013). Abundances of the heavy elements Y, Zr,La, Ba, and Eu were derived; c) Bensby et al. (2017) presentelement abundances of 90 microlensed bulge dwarfs and sub-giants. Their study includes the abundances of the heavy ele-ments Y and Ba; d) van der Swaelmen et al. (2016) derivedabundances of Ba, La, Ce, Nd and Eu for 56 bulge field giants;e) five stars in NGC 6558 from Barbuy et al. (2007), where
B. Barbuy et al.: Abundance analysis of red giants in NGC 6558 9
Fig. 5: EuII 6645.064 and BaII 6496.897 Å lines in the foursample stars. Calculations for different [Eu/Fe] and [Ba/Fe] areshown, with values as indicated in each panel.
abundances of Ba, La and Eu were derived; f) As for other glob-ular clusters, results for the similar clusters NGC 6522 (Barbuyet al. 2014), and HP 1 (Barbuy et al. 2016) are included, as wellas M62 (NGC 6266), projected towards the bulge, studied byYong et al. (2014).
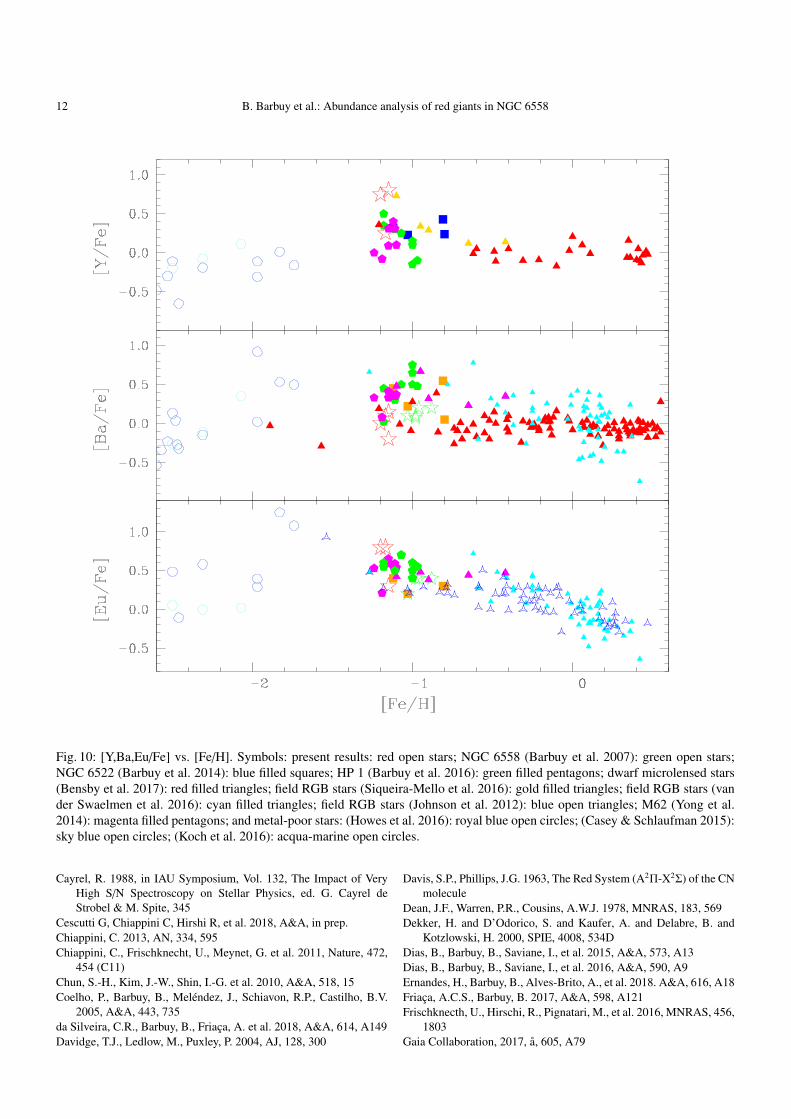
In Figure 10 we plot the present results for the heavy el-ements Y, Ba, and Eu-over-Fe for the four sample stars, com-pared with the above-cited references. This figure indicates thatoverall Y and Ba show a spread at [Fe/H]∼−1.0. This spreadin abundances is compatible with expectations from massivespinstars (see Chiappini et al. 2011, Chiappini 2013), based onpredictions by Frischknecht et al. (2016). We note on the otherhand that the Sr, Y abundances are derived mostly from Sr Iand Y I lines, whereas the dominant species are Sr II and Y II,bringing a non-negligible uncertainty in these values.
The second-peak s-element Ba is low, with a solar ratio,confirming earlier solar-like ratios of Ba-to-Fe and La-to-Fe
Fig. 6: EuII 6347.640 Å in star 283.
Fig. 7: YI 6435.004 and YII 6795.414 Å lines in stars 283, 364and 1072. Calculations for different [Y/Fe] are shown, with val-ues as indicated in each panel.
from Barbuy et al. (2007). Instead, the first-peak elements Yand Sr appear enhanced, from the few lines measurable. Thislatter result has to be taken with caution, given the noise in thespectra, and the use of neutral species, as mentioned above. Ifconfirmed, this would show once more the difference in nucle-osynthesis processes of the first peak elements, that often show
10 B. Barbuy et al.: Abundance analysis of red giants in NGC 6558
Fig. 8: SrI 6550.244 Å line in star 364. Calculations for differ-ent values of [Sr/Fe] as indicated in the panel are shown.
enhancements, in a non-identified process so-called ’lighter el-ement primary process (LEPP)’ (mainly Sr, Y, and Zr) pro-cess (Travaglio et al. 2004, Bisterzo et al. 2017). The excess ofthe first-peak heavy-elements could be due to neutrino-drivenwinds arising in SNII (Woosley et al. 1994), electron-capturesupernovae (Wanajo et al. 2011), among other possibilities.
The r-element Eu is enhanced with a mean [Eu/Fe]∼+0.60,compatible with production by supernovae type II. Presentlythe most suitable source of r-elements in SNII, is throughneutron star mergers, with nucleosynthesis occurring dur-ing the merging and milliseconds afterwards (e.g. Goriely etal. 2015, Wanajo et al. 2014). Pian et al. (2017) has con-firmed the presence of r-process elements in the neutron starmerger GW170817 revealed by LIGO - Laser InterferometerGravitational-Wave Observatory9 and VIRGO10 experiments.
We note that high Eu-enhancements in globular clusters arenot usual. The case of the Eu-enhanced NGC 5986 (Johnsonet al. 2017) might be similar to NGC 6558 in this respect.Enhancements of [Eu/Fe]∼+0.4 are usually found in fieldhalo and globular cluster stars. As pointed out by Johnson etal. (2017), higher enhancements are instead more typical ofdwarf galaxies, such as the so-called r-process ultra-faint dwarfgalaxy Reticulum II (Ji et al. 2016), where [Eu/Fe]>∼+1.7 wasderived. The other possible similarity with NGC 5986, is apossible La-enhancement, however it is not clear that this isthe case for NGC 6558, and should be further investigated.Moreover, a high La abundance may be incompatible with alow Ba abundance, noting that Ba abundances were not derivedin NGC 5986.
9http://www.ligo.caltech.edu10http://www.virgo-gw.eu
The Eu/Ba ratio is indicative of r- to s-process, where a ra-tio [Eu/Ba]∼0.7 points to a nucleosynthetic production throughthe main r-process (e.g. Battistini & Bensby 2016, Trevisan &Barbuy 2014). In Fig. 11we show [Eu/Ba] for the same starsas in Fig. 10 for which both Ba and Eu abundances are avail-able. It is interesting to see that three among the four samplestars show ratios compatible with the r-process, and a few othermore metal-poor stars are also located in the pure r-processcase, whereas most of the stars in the figure are not, their heavy-element abundances being more compatible with a mixture ofr- and s-processes.
8. Conclusions
We present photometric V and I data, and high resolution spec-troscopic data for four stars in NGC 6558. With a set of subarc-sec (∼0.5”) seeing images obtained at the NTT, with a time dif-ference of 19 years, proper motion decontamination, with highaccuracy, was applied. These photometric data have allowedus to derive reddening and distance, and provided the basis toderive photometric stellar parameters. Based on the proper mo-tions obtained from the combination of these NTT images, byRossi et al. (2015), the orbital analysis by Perez-Villegas et al.(2018) has shown that NGC 6558 is trapped by the bar, hav-ing an orbit with a radial extension between 0.1 and 2.5 kpcand a maximum vertical excursion of z∼1.4 kpc. These orbitalparameters are similar to those of the globular cluster HP 1,and approximately two times larger than NGC 6522 (Perez-Villegas et al. 2018). NGC 6522 and HP 1 have similar agesof 13 Gyr (Kerber et al. 2018a,b), pointing out that these clus-ters could be among the oldest objects in the Galaxy, trapped atsome point in the bar/bulge.
The UVES spectroscopic data allowed to derive the finalstellar parameters and abundance ratios for the four samplestars. We note that the abundance pattern of NGC 6558 isvery similar to those of NGC 6522 (Barbuy et al. 2014) andHP 1 (Barbuy et al. 2016), in many aspects, as illustrated inFigure 12. The iron-peak elements in these clusters are also in-cluded in the comparison, as derived in Ernandes et al. (2018).The similarities found in the three clusters are: relatively lowodd-Z elements Na and Al; normally enhanced α-elements O,Mg; low enhancements of Si, Ca; moderate enhancements ofthe iron-peak (α-like) Ti; low abundances of the iron-peak el-ements Mn, Cu, and Zn, where Zn in particular differs fromvalues in bulge field stars (e.g. da Silveira et al. 2018, Barbuyet al. 2015, 2018); relatively high first-peak of heavy elements;variable second-peak heavy elements; variable enhancementsof the r-element Eu.
With the present work we are able to gather the analysisof the three main representatives of moderately metal-poor andBHB globular clusters in the bulge, and to compare their sharedproperties. Further photometric and spectroscopic studies ofthe oldest globular clusters in the bulge would be of great in-terest.
Acknowledgements. BB and EB acknowledge acknowledge grantsfrom CNPq, CAPES - Finance code 001, and Fapesp. LM, HE ac-knowledge CNPq/PIBIC fellowships. LK acknowledges a CNPq post-
B. Barbuy et al.: Abundance analysis of red giants in NGC 6558 11
Fig. 9: [Na/Fe] vs. [O/Fe], [Al/Fe] vs. [O/Fe], [Al/Fe] vs. [Mg/Fe] and [Al/Fe] vs. [Na/Fe] for the sample stars: indian red openstars, and Barbuy et al. (2007): orange filled squares.
doctoral fellowship and the Fapesp grant 2016/24814-5. APV ac-knowledges the Fapesp postdoctoral fellowship no. 2017/15893-1.We thank Elvis Cantelli for data reduction. SO acknowledges theDipartimento di Fisica e Astronomia dell’Universita di Padova.
References
Alonso, A., Arribas, S., Martınez-Roger, C. 1999, A&AS, 140, 261Alonso-Garcıa, J., Mateo, M., Sen, B., et al. 2012, AJ, 143, 70Ballester, P. and Modigliani, A. and Boitquin, O. et al. 2000, Msngr,
101, 31BBarbuy, B., Perrin, M.-N., Katz, D. et al. 2003, A&A, 404, 661Barbuy, B., Zoccali, M., Ortolani, S., et al. 2006, A&A, 449, 349Barbuy, B., Zoccali, M., Ortolani, S. et al. 2007, AJ, 134, 1613Barbuy, B., Zoccali, M., Ortolani, S. et al. 2009, A&A, 507, 405Barbuy B, Chiappini C, Cantelli E, et al. 2014, A&A, 570, A76
Barbuy, B., Friaca, A., da Silveira, C.R., et al. 2015, A&A, 580, A40Barbuy B, Cantelli E, Vemado A, et al. 2016, A&A, 591, A53Barbuy, B., Chiappini, C., Gerhard, O. 2018a, ARA&A, 56, 223Barbuy, B., Trevisan, J., de Almeida, A. 2018b, PASA, in pressBattistini, C., Bensby, T. 2016, A&A, 586, A49Bensby T, Feltzing S, Gould A., et al. 2017, A&A, 605, A89Bessell, M.S. 1979, PASP, 91, 589Bica, E., Bonatto, C., Barbuy, B., Ortolani, S. 2006, A&A, 450, 105Bica, E., Ortolani, S. Barbuy, B. 2016, PASA, 33, 28Bisterzo S, Travaglio, Wiescher M, Kappeler F, Gallino R. 2017, ApJ,
835, 97Blanco, V. 1988, AJ, 95, 1400Boley, A.C., Lake, G., Read, J. Teyssier, R. 2009, ApJ, 706, L192Bromm, V., Yoshida, N. 2011, ARA&A, 49, 373Carretta, E., Bragaglia, A., Gratton, R.G. et al. 2009, A&A, 505, 117Casey, A.R., Schlaufman, K.C. 2015. ApJ,y 809, 110
12 B. Barbuy et al.: Abundance analysis of red giants in NGC 6558
Fig. 10: [Y,Ba,Eu/Fe] vs. [Fe/H]. Symbols: present results: red open stars; NGC 6558 (Barbuy et al. 2007): green open stars;NGC 6522 (Barbuy et al. 2014): blue filled squares; HP 1 (Barbuy et al. 2016): green filled pentagons; dwarf microlensed stars(Bensby et al. 2017): red filled triangles; field RGB stars (Siqueira-Mello et al. 2016): gold filled triangles; field RGB stars (vander Swaelmen et al. 2016): cyan filled triangles; field RGB stars (Johnson et al. 2012): blue open triangles; M62 (Yong et al.2014): magenta filled pentagons; and metal-poor stars: (Howes et al. 2016): royal blue open circles; (Casey & Schlaufman 2015):sky blue open circles; (Koch et al. 2016): acqua-marine open circles.
Cayrel, R. 1988, in IAU Symposium, Vol. 132, The Impact of VeryHigh S/N Spectroscopy on Stellar Physics, ed. G. Cayrel deStrobel & M. Spite, 345
Cescutti G, Chiappini C, Hirshi R, et al. 2018, A&A, in prep.Chiappini, C. 2013, AN, 334, 595Chiappini, C., Frischknecht, U., Meynet, G. et al. 2011, Nature, 472,
454 (C11)Chun, S.-H., Kim, J.-W., Shin, I.-G. et al. 2010, A&A, 518, 15Coelho, P., Barbuy, B., Melendez, J., Schiavon, R.P., Castilho, B.V.
2005, A&A, 443, 735da Silveira, C.R., Barbuy, B., Friaca, A. et al. 2018, A&A, 614, A149Davidge, T.J., Ledlow, M., Puxley, P. 2004, AJ, 128, 300
Davis, S.P., Phillips, J.G. 1963, The Red System (A2Π-X2Σ) of the CNmolecule
Dean, J.F., Warren, P.R., Cousins, A.W.J. 1978, MNRAS, 183, 569Dekker, H. and D’Odorico, S. and Kaufer, A. and Delabre, B. and
Kotzlowski, H. 2000, SPIE, 4008, 534DDias, B., Barbuy, B., Saviane, I., et al. 2015, A&A, 573, A13Dias, B., Barbuy, B., Saviane, I., et al. 2016, A&A, 590, A9Ernandes, H., Barbuy, B., Alves-Brito, A., et al. 2018. A&A, 616, A18Friaca, A.C.S., Barbuy, B. 2017, A&A, 598, A121Frischknecth, U., Hirschi, R., Pignatari, M., et al. 2016, MNRAS, 456,
1803Gaia Collaboration, 2017, å, 605, A79

B. Barbuy et al.: Abundance analysis of red giants in NGC 6558 13
Fig. 11: [Eu/Ba] vs. [Fe/H]. Same symbols as in Fig. 10.
Garcıa-Perez, A., Cunha, K., Shetrone, M., et al. 2013, ApJ, 767, L9Gonzalez Hernandez, J.I., Bonifacio, P. 2009, A&A, 497, 497Goriely, S., Bauswein, A., Janka, H.-T. 2015, ApJ, 738, L32Grevesse, N. & Sauval, J.N. 1998, SSRev, 35, 161Gustafsson, B., Edvardsson, B., Eriksson, K. et al. 2008, A&A, 486,
951Harris, W.E. 1996, AJ 112, 1487Hazen, M.L. 1996, AJ 111, 1184Hill, V., Lecureur, A., Gomez, A., et al. 2011, A&A, 534,A80Hinkle, K., Wallace, L., Valenti, J., Harmer, D. 2000, Visible and
Near Infrared Atlas of the Arcturus Spectrum 3727-9300 A, ed.K. Hinkle, L. Wallace, J. Valenti, and D. Harmer (San Francisco:ASP)
Howes, L.M., Asplund, M., Keller, S.C., et al. 2016. MNRAS, 460,884
Ji, A.P., Frebel, A., Simon, J.D., Chiti, A. 2016, ApJ, 830, 93Johnson, C.I., Rich, R.M., Kobayashi, C., Fulbright, J.P. 2012, ApJ,
749, 175Johnson, C.I., Caldwell, N., Rich, R.M., et al. 2017, ApJ, 842, 24Kerber, L.O., Nardiello, D., Ortolani, S., et al. 2018a, ApJ, 853, 15Kerber, L.O., Libralato, M., Ortolani, S. et al. 2018b, MNRAS, sub-
mittedKoch, A., McWilliam, A., Preston, G.W., Thompson, I.B. 2016, A&A,
587, 124Kurucz, R. 1993, CD-ROM 23Landolt, A.U.: 1983, AJ, 88, 439Landolt, A.U.: 1992, AJ, 104, 340Lecureur, A., Hill, V., Zoccali, M. et al. 2007, A&A, 465, 799Martin, W.C., Fuhr, J.R., Kelleher, D.E., et al. 2002, NIST Atomic
Database (version 2.0), http://physics.nist.gov/asd. NationalInstitute of Standards and Technology, Gaithersburg, MD.
McWilliam, A. 2016. PASA, 33, 40Melendez, J., Barbuy, B., 2009, A&A, 497, 611Modigliani, A., Mulas, G., Porceddu, I. et al. 2004, in The Messenger,
118, 8.Nakasato, N., Nomoto, K. 2003. ApJ, 588, 842Nataf, M.N., Gould, A., Fouque, P. et al. 2013, ApJ, 769, 88Ness M, Freeman K, Athanassoula E, et al. 2013, MNRAS, 430, 836
Ness, M., Asplund, M., Casey, A.R. 2014. MNRAS, 445, 2994Ortolani, S., Barbuy, B., Momany, Y. et al. 2011, ApJ, 737, 31Perez-Villegas, A., Rossi, L., Ortolani, S. et al. 2018, PASA, 35, 21Phillips, J.G., Davis, S.P. 1968, The Swan system of the C2 molecule
(U. of California Press)Pian, E., D’Avanzo, P., Benetti, S. et al. 2017, Nature, 551, 67Pietrinferni, A., Cassisi, S., Salaris, M., Castelli, F. 2004, ApJ, 612,
167Piotto, G., Milone, A.P., Bedin, L.R. et al. 2015, AJ, 149, 91Piskunov, N., Kupka, F., Ryabchikova, T. Weiss, W., Jeffery, C., 1995,
A&AS, 112, 525Renzini, A., D’Antona, F., Cassisi, S., et al. 2015, MNRAS, 454, 4197Rich, R.M., Ortolani, S., Bica, E., Barbuy, B. 1998, ApJ, 484, L25Rieke, G.H., Lebofsky, M.J., 1985, ApJ, 288, 618Rojas-Arriagada, A., Recio-Blanco, A., Hill, V., et al. 2014. A&A,
569, A103Rojas-Arriagada, A., Recio-Blanco, A., de Laverny, P., et al. 2017.
A&A, 601, A140Rossi, L., Ortolani, S., Bica, E., Barbuy, B., Bonfanti, A. 2015.
MNRAS, 450, 3270Saito, R. et al. (VVV collaboration) 2012, A&A, 537, 107Saviane, I., da Costa, G.S., Held, E.V. et al. 2012, A&A, 540, A27Schlafly, E.F., Finkbeiner, D.P. 2011, ApJ, 737, 103Schlegel, D.J., Finkbeiner, D.P., Davis, M. 1998, ApJ, 500, 525Siqueira-Mello, C., Chiappini, C., Barbuy, B., et al. 2016, A&A, 593,
A79Skrutskie, M., Cutri, R.M., Stiening, R., et al. 2006, AJ, 131, 1163Soto, M., Barba, R., Gunthardt, G., Minniti, D., Lucas, P. et al. 2013,
A&A, 552, A101Soszynski, I., Udalski, A., Szymannski, M.K. et al. 2014, AcA, 64,
177Stetson, P.B., Pancino, E. 2008, PASP, 120, 1332Terndrup, D.M. 1988, AJ, 96, 884Trager, S.C., King, I.R. & Djorgovski, S. 1995, AJ, 109, 218Travaglio, C., Gallino, R., Arnone, E., et al. 2004, ApJ, 601, 864Trevisan, M., Barbuy, B. 2014, A&A, 570, A22Tumlinson, J. 2010, ApJ, 708, 1398

14 B. Barbuy et al.: Abundance analysis of red giants in NGC 6558
Fig. 12: Abundance pattern [X/Fe] vs. atomic number Z of the moderately metal-poor bulge globular clusters NGC 6558,NGC 6522 and HP 1. Symbols: blue filled triangles: NGC 6558; green open triangles: NGC 6522; red open triangles: HP 1.
Udalski, A., Szymanski, M., Kubiak, M., Pietrzynski, G., Soszynski,I., et al. 2002, Acta Astron. 52, 217
van der Swaelmen, M., Barbuy, B., Hill, V., 2016. A&A, 586, A1Wanajo, S., Janka, H.-T., Muller, B., 2011. ApJ, 726, L15Wanajo, S., Sekiguchi, Y., Nishimura, N., et al. 2014. ApJ, 789, L39Wise, J.H., Turk, M.J., Norman, M.L., Abel, T. 2012. ApJ, 745, 50Woosley, S.E., Wilson, J.R., Mathews, G.J., Hoffman, R.D., Meyer,
B.S. 1994. ApJ, 433, 229Woosley, S.E., Weaver, T.A. 1995. ApJS, 101, 181Woosley, S., Heger, A., Weaver, T.A. 2002. RevModPhys, 74, 1015Yong, D., Alves-Brito, A., Da Costa, G. et al. 2014, MNRAS, 439,
2638Zoccali, M., Lecureur, A., Hill, V. et al. 2008, A&A, 486, 177Zoccali, M., Vasquez, S., Gonzalez,, O.A., et al. 2017. A&A, 599, A12
Related Documents