High-pressure X-ray photoelectron spectroscopy applied to vanadium phosphorus oxide catalysts under reaction conditions von Master of Science in Physics Evgueni Kleimenov aus St. Petersburg (Russland) Fakultät II - Mathematik und Naturwissenschaften der Technischen Universität Berlin zur Erlangung des akademischen Grades Doktor der Naturwissenschaften (Dr. rer. nat.) genehmigte Dissertation Promotionsausschuss: Vorsitzender: Prof. Dr. rer. nat. T. Möller Berichter: Prof. Dr. rer. nat. M. Dähne Prof. Dr. rer. nat. R. Schlögl Tag der wissenschaftlichen Aussprache: 13.05.2005 Berlin 2005 D 83

Welcome message from author
This document is posted to help you gain knowledge. Please leave a comment to let me know what you think about it! Share it to your friends and learn new things together.
Transcript
High-pressure X-ray photoelectron spectroscopy
applied to vanadium phosphorus oxide catalysts
under reaction conditions
von Master of Science in Physics
Evgueni Kleimenov
aus St. Petersburg (Russland)
Fakultät II - Mathematik und Naturwissenschaften
der Technischen Universität Berlin
zur Erlangung des akademischen Grades
Doktor der Naturwissenschaften
(Dr. rer. nat.)
genehmigte Dissertation
Promotionsausschuss:
Vorsitzender: Prof. Dr. rer. nat. T. Möller
Berichter: Prof. Dr. rer. nat. M. Dähne
Prof. Dr. rer. nat. R. Schlögl
Tag der wissenschaftlichen Aussprache: 13.05.2005
Berlin 2005
D 83


i
Evgueni Kleimenov
Fritz-Haber-Institut der Max-Planck-Gesellschaft
Department of Inorganic Chemistry
(Prof. Dr. R. Schlögl)
Faradayweg 4-6
D-14195 Berlin, Germany
ii
Evgueni Kleimenov, "High-pressure X-ray photoelectron spectroscopy applied to vanadium phosphorus oxide catalysts under reaction conditions", PhD thesis
Abstract
This thesis is devoted to improvement of the high-pressure X-ray photoelectron spectroscopy (XPS) technique and to investigation by means of this technique of the industrially important vanadium phosphorus oxide (VPO) catalyst for oxidation of n-butane to maleic anhydride (MA).
The design of a new instrument for high-pressure XPS is presented. Introduction into the design of a differential pumping system, combined with electrostatic lenses for collection of photoelectrons, makes possible the recording of XPS spectra of a gas or solid sample in a gas atmosphere at a pressure in the sample cell of up to 5 mbar. Calculation of the dimensions of the differential pumping system was performed using the molecular and viscous gas flow models. The electrostatic lenses were designed by numerical modeling. Details of the calculations are reported.
High-pressure XPS on VPO catalysts was performed under reaction conditions with simultaneous monitoring of the catalytic activity by mass-spectrometry (i.e. in situ). Two differently prepared VPO samples were investigated in the reaction gas mixture at a pressure of 2 mbar at various temperatures. Both samples produced MA at the reaction temperature (400°C) and had during the experiment a similar catalytic activity towards MA normalized to the surface area. XPS spectra with the photon energies corresponding to the information depths of 1.0 and 1.8 nm were recorded. One sample showed no changes in the vanadium oxidation state with conditions and had a homogeneous distribution of oxidation state with depth. Another sample showed dramatic changes in the oxidation state. This sample was inhomogeneous both at low temperature and at 400°C. The oxidation state of the surface was determined to be of the same value (4.0±0.1) for both samples at the reaction temperature (400°C). The thickness of the topmost layer, in which changes in the oxidation state for the inhomogeneous sample occurred, was determined to be (3.5 ± 2.0) nm. Similar catalytic properties of the samples together with the same oxidation state of the surface lead one to the conclusion that this value is the upper estimation of the thickness of the catalytically active layer and the structure of the catalytically active layer does not necessarily match the structure of the bulk.
Additionally, experiments in n-butane/He gas mixture at the pressure of 1.6 mbar and a temperature of 400°C were performed. The homogeneous sample showed slower changes in the vanadium oxidation state of the surface during stay in the gas mixture compared with the inhomogeneous sample. This correlates with a slower drop in MA yield for the homogeneous sample.
A P/V atomic ratio for the homogeneous sample was determined using some reference compounds. The ratio had not changed during the experiments greater than the experimental error.
The results prove in situ XPS to be a suitable and useful technique for investigation of a real catalyst.
iii
Evgueni Kleimenov, "Hochdruck-Röntgenphotoelektronenspektroskopie Untersuchungen an Vanadium Phosphoroxid Katalysatoren unter Reaktionsbedingungen", Dissertation
Kurzzusammenfassung
Diese Arbeit hat die Verbesserung der Hochdruck-Röntgen-Photoelektronen Spektroskopie (Hochdruck-XPS) und ihre Anwendung zur Untersuchung des industriell wichtigen Vanadium Phosphor Oxid (VPO) -Katalysators zur Oxidation von n-Butan zu Maleinsäureanhydrid (MA) zum Inhalt.
Die Konzeption eines neues Instruments für die Hochdruck-XPS wird vorgestellt. Der Einsatz eines differentiellen Pumpsystems kombiniert mit elektrostatischen Linsen zur Fokussierung von Photoelektronen ermöglichte die Aufnahme von XP-Spektren von gasförmigen oder festen Proben in einer Gasatmosphäre mit einem Druck von bis zu 5 mbar in der Probenzelle. Die Auslegung des differentiellen Pumpsystems basierte auf Berechnungen die für moleluare und für viskose Gasströmungen durchgeführt wurden. Die elektrostatischen Linsen wurden mit Hilfe von numerischen Modellen dimensioniert. Details der Berechnungen werden vorgestellt.
Hochdruck-XPS Messungen wurden an VPO-Katalysatoren unter Reaktionsbedingungen, bei gleichzeitiger Messung der katalytischen Aktivität mittels Massenspektrometrie (d.h. in situ) durchgeführt. Zwei unterschiedlich hergestellte VPO-Proben wurden in einer Reaktionsgasmischung bei einem Druck von 2 mbar und verschiedenen Temperaturen untersucht. Beide Proben produzierten MA bei einer Reaktionstemperatur von 400°C und hatten während des Experimentes eine vergleichbare katalytische Aktivität normalisiert auf die Oberfläche. XP-Spektren, mit den Photonen-Energien entsprechend einer Eindringtiefe von 1.0 und 1.8 nm, wurden gemessen. Eine Probe zeigte keine Veränderungen in der Oxidationsstufe des Vanadiums als Funktion der Reaktionbedingungen und die Oxidationsstufe war homogen mit Tiefe. Die andere Probe zeigte ausgeprägte Veränderungen der Oxidationsstufe. Diese Probe war inhomogen sowohl bei niedriger Temperatur als auch bei einer Temperatur von 400°C. Die Oxidationsstufe des Vanadiums auf der Oberfläche war bei der Reaktionstemperatur von 400°C für beide Proben die gleiche (4.0 ± 0.1). Die Dicke der obersten Schicht, in welcher Veränderungen der Oxidationsstufe bei der inhomogenen Probe auftraten wurde mit (3.5 ± 2.0) nm bestimmt. Ähnliche katalytische Eigenschaften der Proben zusammen mit der gleichen Oxidationsstufe der Oberfläche führten zu der Schlussfolgerung, dass dieser Wert die obere Grenze für eine Abschätzung der Dicke der katalytisch aktiven Schicht darstellt und dass die Struktur der katalytisch aktiven Schicht nicht notwendigerweise der Struktur der Bulk entspricht.
Zusätzlich wurden Experimente unter reduzierenden Bedingungen in einer n-Butan/He-Gasmischung bei einem Druck von 1.6 mbar und einer Temperatur von 400°C durchgeführt. In der Gasmischung zeigte die homogene Probe langsamere Veränderungen der Vanadiumoxidationsstufe in der Oberfläche, verglichen mit der inhomogenen Probe. Diese korreliert mit einem langsameren Verlust der Maleinsäureanhydrid-Ausbeute für die homogene Probe.
Das P/V-Atomverhältnis wurde für die homogene Probe mittels Referenzverbindungen bestimmt. Das Verhältnis veränderte sich während des Experimentes nur innerhalb des experimentellen Fehlers.
Die Ergebnisse zeigen, dass in situ XPS eine geeignete und nützliche Methode für die Untersuchung von realen Katalysatoren ist.

iv
Евгений Юрьевич Клейменов, "Рентгеновская фотоэлектронная спектроскопия высокого давления примененная к ванадиево фосфорно оксидным катализаторам в условиях реакции", диссертация на соискание степени кандидата физико-математических наук
Автореферат
Диссертация посвящена усовершенствованию метода рентгеновской фотоэлектронной спектроскопии (РЭС) и исследованию этим методом промышленно-важного ванадиево фосфорно оксидного (VPO) катализатора для окисления н-бутана до малеинового ангидрида (МА).
Описана конструкция нового спектрометра для РЭС высокого давления. Включение в конструкцию спектрометра системы дифференциальной откачки, объединенной с электростатическими линзами для сбора фотоэлектронов, позволило получать фотоэлектронные спектры газа либо твердого тела в газе при давлениях в камере образца до 5 мбар. Вычисления размеров системы дифференциальной откачки производились с использованием моделей молекулярного и вязкого газовых потоков. Электростатические линзы были рассчитаны численно. Приведены детали рассчетов.
Катализаторы VPO были исследованы методом РЭС высокого давления в условиях реакции с одновременной регистрацией каталитической активности посредством масс-спектрометрии (т.е. in situ). Два различно приготовленных образца катализатора VPO были исследованы в газовой смеси реагентов при давлении 2 мбар при различных температурах. Оба образца производили МА при температуре реакции (400°C) и в течении эксперимента имели близкие значения каталитической активности по отношению к МА на единицу площади поверхности. Спектры РЭС были зарегистрированы с энергиями возбуждения соответствующими глубинам информации 1.0 и 1.8 нм. Для одного образца окислительное состояние ванадия оставалось постоянным при изменении условий и было однородным по глубине. Окислительное состояние ванадия для другого образца изменялось значительно. Этот образец был неоднородным и при низких температурах и при 400°С. Окислительное состояние на поверхности обоих образцов при температуре реакции (400°С) было (4.0±0.1). Толщина верхнего слоя, где окислительное состояние в неоднородном образце изменялось с глубиной, была (3.5±2.0) нм. Близкие каталитические свойства и одинаковое окислительное состояние ванадия на поверхности обоих образцов позволяют заключить, что эта величина- оценка сверху для толщины каталитически активного поверхностного слоя, и что структура этого слоя не обязательно одинакова со структурой объема.
Кроме того, были проделаны эксперименты в газовой смеси н-бутана и гелия при давлении 1.6 мбар и температуре 400°С. Окислительное состояние для поверхности образца, который был однороден в условиях реакции, изменялось медленнее, чем для другого образца. Этот факт коррелирует с более медленным падением выхода МА для однородного образца.
Атомное отношение P/V для однородного образца было определено с использованием эталонных материалов. Изменения этого отношения в течении экспериментов было меньше, чем погрешность измерения.
Результаты исследования доказывают пригодность и полезность in situ РЭС для исследования реальных (не только модельных) катализаторов.
v
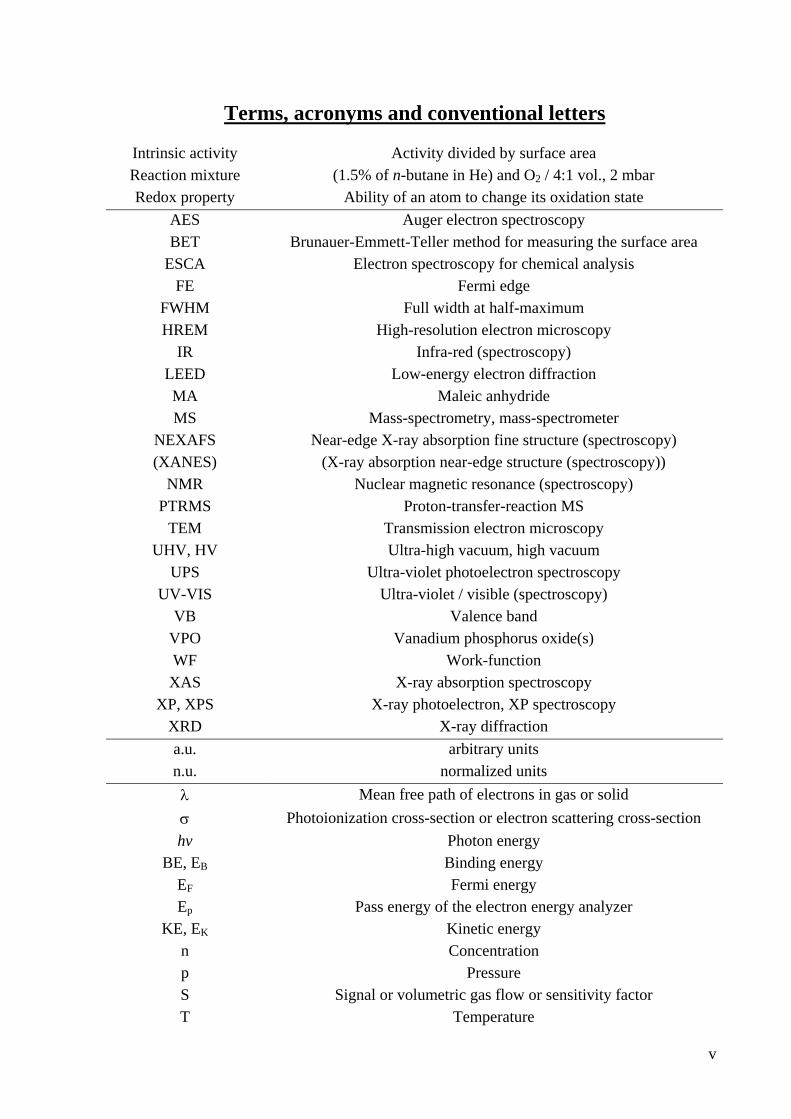
Terms, acronyms and conventional letters
Intrinsic activity Activity divided by surface area Reaction mixture (1.5% of n-butane in He) and O2 / 4:1 vol., 2 mbar Redox property Ability of an atom to change its oxidation state
AES Auger electron spectroscopy BET Brunauer-Emmett-Teller method for measuring the surface area
ESCA Electron spectroscopy for chemical analysis FE Fermi edge
FWHM Full width at half-maximum HREM High-resolution electron microscopy
IR Infra-red (spectroscopy) LEED Low-energy electron diffraction MA Maleic anhydride MS Mass-spectrometry, mass-spectrometer
NEXAFS (XANES)
Near-edge X-ray absorption fine structure (spectroscopy) (X-ray absorption near-edge structure (spectroscopy))
NMR Nuclear magnetic resonance (spectroscopy) PTRMS Proton-transfer-reaction MS
TEM Transmission electron microscopy UHV, HV Ultra-high vacuum, high vacuum
UPS Ultra-violet photoelectron spectroscopy UV-VIS Ultra-violet / visible (spectroscopy)
VB Valence band VPO Vanadium phosphorus oxide(s) WF Work-function XAS X-ray absorption spectroscopy
XP, XPS X-ray photoelectron, XP spectroscopy XRD X-ray diffraction a.u. arbitrary units n.u. normalized units λ Mean free path of electrons in gas or solid σ Photoionization cross-section or electron scattering cross-section hv Photon energy
BE, EB Binding energy EF Fermi energy Ep Pass energy of the electron energy analyzer
KE, EK Kinetic energy n Concentration p Pressure S Signal or volumetric gas flow or sensitivity factor T Temperature

vi
Contents
1 Introduction................................................................................. 1
2 In situ methods in heterogeneous catalysis ............................... 3
3 In situ XPS (high-pressure XPS for catalytic studies) ............. 6
3.1 X-ray photoelectron spectroscopy......................................................................7
3.2 Principles and history of high-pressure XPS ..................................................17
3.3 Construction of the high-pressure XPS system and characteristics of
the system ...........................................................................................................20
3.3.1 Factors influencing performance of the system. ..................................... 20
3.3.2 Calculation and design of the differential pumping system. ................... 27
3.3.3 Electrostatic lenses. ................................................................................. 33 3.3.3.1 Requirements for the electrostatic lens system. ............................................... 33 3.3.3.2 General information about electrostatic lenses. ............................................... 34 3.3.3.3 Calculation of the electrostatic lens system. .................................................... 38
3.4 Peculiarities of data analysis in high-pressure XPS .......................................47
3.5 Monitoring the catalytic performance: gas-phase XPS peaks, MS and
PTRMS. ..............................................................................................................50
4 Vanadium phosphorus oxide catalyst ..................................... 53
4.1 VPO catalyst for industrial production of maleic anhydride from n-
butane. ................................................................................................................54
4.2 Catalytically active species of a VPO catalyst. Literature review.................57
4.3 Sample preparation and characterization.......................................................64
4.4 Experimental conditions ...................................................................................65
4.5 Sample activity during in situ XPS measurements.........................................67
4.6 XPS data. ............................................................................................................71
4.7 Change of vanadium oxidation state................................................................84
4.8 Stoichiometric ratios. ........................................................................................93
4.9 Discussion of the experimental results...........................................................101
5 Conclusions and outlook......................................................... 104
References....................................................................................... 106

vii
List of figures
Figure 3-1 Basic elements of XPS experiment........................................................................... 7
Figure 3-2 Hemispherical electron energy analyzer................................................................... 8
Figure 3-3. Schematic diagram of a core-level-photoelectron emission process. .................... 10
Figure 3-4. Mean free path of photoelectrons in solid ............................................................. 11
Figure 3-5. Convolution of some concentration depth-distributions with the
probability function of photoelectron escape. ..................................................... 13
Figure 3-6. Photoelectron spectrum of V2O5. hv=730 eV. ....................................................... 14
Figure 3-7. Example of use different hv to achieve the same KE of different peaks. .............. 16
Figure 3-8 Principle scheme of a high-pressure XPS experiment............................................ 17
Figure 3-9 Collection of photoelectrons without (a) and with (b) electrostatic lenses............. 18
Figure 3-10. High-pressure XPS setup. .................................................................................... 20
Figure 3-11. Transmission of X-rays by Si3N4 window of different thickness........................ 21
Figure 3-12. X-ray transmission of O2 and butane................................................................... 22
Figure 3-13. Scheme for the equation (3-8) ............................................................................. 23
Figure 3-14. Characteristics of photoelectron scattering by molecular hydrogen.................... 23
Figure 3-15. Function sin2(a/2) and its approximation by a second-order polynomial............ 25
Figure 3-16. Scheme of the differential pumping system. ....................................................... 29
Figure 3-17. Scheme of gas flow through the reaction chamber.............................................. 31
Figure 3-18. Notation of thick electrostatic lens parameters.................................................... 35
Figure 3-19. Electron kinetic energy in the lens system. ......................................................... 38
Figure 3-20. Concept of the lens design by analogy with geometrical optics.......................... 39
Figure 3-21. Electron trajectories for the first two lens stages. (calculated in SIMION)......... 41
Figure 3-22. Electron trajectories for the third lens stage (calculated in SIMION). ................ 43
Figure 3-23. Spline function for the voltage in the third stage................................................. 44
Figure 3-24. Scheme of the differential pumping system and electrostatic lenses................... 45
Figure 3-25. Scheme of the in situ XPS instrument. ................................................................ 46
Figure 3-26. Apparent binding energy of the O1s peak of a VPO catalyst depending
on a temperature [81]. ......................................................................................... 47
Figure 3-27. Au4f XPS peak shape for different Ar pressures................................................. 48
Figure 3-28. Schematic diagram of the PTRMS system according [55].................................. 51
Figure 4-1. Consumption of MA in different fields of economics in the United States .......... 54
Figure 4-2. Reaction of n-butane oxidation to MA .................................................................. 55
Figure 4-3. HRTEM image of a VPO catalyst. ........................................................................ 60
viii
Figure 4-4. Maleic anhydride yield during in situ XPS experiments with the sample-1..........67
Figure 4-5. Maleic anhydride yield during in situ XPS experiments with the sample-2..........68
Figure 4-6. Time dependence of normalized MA yield in n-butane/He atmosphere at
400°C. ..................................................................................................................70
Figure 4-7. Typical survey photoelectron spectrum of VPO. ...................................................71
Figure 4-8. O1s and V2p3/2 XP spectra of V2O5 (001). ............................................................72
Figure 4-9. VB XP spectra of V2O5 (001). ...............................................................................73
Figure 4-10. Evolution of the O1s-V2p region of the sample-1. ..............................................74
Figure 4-11. Evolution of the O1s-V2p region of the sample-2. ..............................................74
Figure 4-12. Evolution of the O1s peak of the sample-1. .........................................................75
Figure 4-13. Evolution of the O1s peak of the sample-2. .........................................................75
Figure 4-14. Evolution of the V2p3/2 peak of the sample-1. .....................................................77
Figure 4-15. Evolution of the V2p3/2 peak of the sample-2. .....................................................77
Figure 4-16. Evolution of the P2p peak of the sample-1. .........................................................78
Figure 4-17. Evolution of the P2p peak of the sample-2. .........................................................78
Figure 4-18. Evolution of the C1s peak of the sample-1. .........................................................80
Figure 4-19. Evolution of the C1s peak of the sample-2. .........................................................80
Figure 4-20. Evolution of the VB region of the sample-1. .......................................................83
Figure 4-21. Evolution of the VB region of the sample-2. .......................................................83
Figure 4-22. V2p3/2 spectra of the sample-1 and sample-2 before and after heating in
the reaction mixture. ............................................................................................87
Figure 4-23. Comparison of the V2p3/2 peaks of the sample-1 and sample-2 in the
reaction gas mixture.............................................................................................88
Figure 4-24. Changes of the surface V2p3/2 spectra in n-butane at 400°C. ..............................92
Figure 4-25. Dependence of O1s/V2p3/2 peak area ratios of some reference
compounds on the nominal O/V atomic ratios and its comparison with a
calculation on base of [23]...................................................................................94
Figure 4-26. Estimated atomic ratios for a VPO compound with the nominal
stoichiometry P/V=1, O/V=4.5............................................................................95
Figure 4-27. Change of a phosphor-vanadium stoichiometric ratio of the sample-1. ..............99
Figure 4-28. Change of a phosphor-vanadium stoichiometric ratio of the sample-2. ............100

ix
List of tables
Table 3-1. Performance of the turbo-pumps............................................................................. 30
Table 3-2. Aperture diameters and distances between apertures.............................................. 30
Table 3-3. Results of a test of the differential pumping system with air.................................. 31
Table 3-4. Table of lens voltages for the first two stages. D=40 mm ...................................... 41
Table 3-5. Table of lens voltages for the third stage. D=60 mm.............................................. 43
Table 4-1. Sample preparation, catalytic selectivity and BET surface area. ............................ 64
Table 4-2. Experimental conditions: excitation energies and information depth for
O1s-V2p and P2p XPS regions. .......................................................................... 66
Table 4-3. Summary of data for determination of a vanadium oxidation state. ....................... 84
Table 4-4. Sensitivity factors estimated from peak area ratios of some reference
compounds and their comparison with calculations based on [23]..................... 94
Table 4-5. Data for calculation of a stoichiometry of the sample-2. ........................................ 96
Table 4-6. Change in a stoichiometry of the sample-1............................................................. 97
Table 4-7. Change in a stoichiometry of the sample-2............................................................. 98

Introduction
1
1 Introduction
Over the last hundred years catalysis took a firm stand in world economics. A major
part of the modern chemical industry employs to a greater or lesser extent various catalytic
processes, most of those are heterogeneous catalytic processes. Recently heterogeneous
catalysis became also an important phenomenon for environmental protection, i.e. for
catalytic neutralization of toxic emissions. It is not a secret that a major part of catalyst
development and improvement follows the trial-and-error approach rather than being really
knowledge-based. The striking example is the combinatorial chemistry. Numerous physical
methods were developed in order to obtain knowledge about the catalytically active species
and the detailed reaction mechanism of a catalytic process. Most of these methods have
nevertheless, one or both of two drawbacks, those make it difficult to correlate obtained
information with properties of the catalytically active material.
Firstly, many of these methods cannot be applied under reaction conditions (in situ).
According to the general conception of catalysis [1] the function of all catalysts arises from
their ability to change their geometric and electronic structures dynamically in the presence of
educt and product molecules. The attempts to correlate the structure that a catalyst possesses
at conditions that are not relevant to the catalytic conditions were visually compared by M.
Banares [2] with trying to make a puzzle with pieces from two different boxes. Even if one
will succeed to connect the pieces, the general picture will not make sense.
The second drawback is lack of surface sensitivity. Most of the methods are bulk
sensitive, while only several atomic layers are directly participating in the catalytic process
and deeper material acts as a substrate only. The structure of the topmost layers is not
necessarily the same as the structure of the bulk and correlation of obtained information with
properties of the active surface is problematic if possible at all.
In view of that mentioned above, development of surface sensitive in situ methods for
catalysis can be noted as extremely important. One of the most surface sensitive methods
which are widely used in catalyst investigations is X-ray photoelectron spectroscopy.
Conventionally this technique operates at ultra-high vacuum conditions, but introducing in the
instrument a differential pumping system can increase operation pressure of up to several
mbar. Although more than 35 years have passed since the first high-pressure XPS
experiments were performed, still only several papers were published about investigations by
this technique of catalysts under reaction conditions.
2
Present work is devoted to the design of an improved high-pressure XPS instrument
and application of the technique to investigation of the industrially important vanadium
phosphorus oxide catalyst for oxidation of n-butane to maleic anhydride. This catalyst has
been used in industry for more than 30 years and many publications are devoted to its
investigation in order to understand the catalytic mechanism, the nature of the active species
and to improve the performance of the catalyst. In spite of a great number of publications on
this subject still no agreement exists about the nature of the catalytically active species. Some
authors suggest crystalline (VO)2P2O7, where V atoms are in 4+ oxidation state, as the only
active phase. Others, to the contrary, state the importance of the presence of VOPO4, which is
V5+ phase or of V4+/V5+ couples dispersed on the surface. Such a disagreement is obviously
caused by lack of surface sensitivity of applied methods while many observations show that
no general correlation can be drawn between the structure of the catalyst bulk and the
structure of the catalytically active surface. Application under reaction conditions of XPS,
which is a surface sensitive technique, makes it possible to draw conclusions about the
oxidation state of vanadium atoms on the active surface.
The thesis consists of three main parts. In the first part in situ methods in catalysis are
discussed in sense of their surface sensitivity and pressure limit in order to find out the value
of in situ XPS among other existing methods. The second part is about in situ XPS. Principles
and history of the technique will be reviewed. Physical basics and details of the instrument
design are also presented in that part. The third part is devoted to the investigation of a VPO
catalyst. An introduction about the use of a VPO catalyst in industry and about ideas existing
in literature concerning the catalytically active sites will be given. XPS data will be presented
and discussed from the viewpoints of understanding the nature of the catalytically active
species and of the strategy for further improvement of the catalyst.

In situ methods in heterogeneous catalysis
3
2 In situ methods in heterogeneous catalysis
Many physical techniques [2] were applied to investigation of a heterogeneous catalyst
in situ (Lat. "on site"), i.e. under reaction conditions with possibility to register the reaction
products*. Below the type of information which can be achieved from the measurements and
limitations of the techniques, i.e. information depth and pressure will be reviewed briefly.
Infra-red spectroscopy is performed in the transmission, diffusion reflection or
attenuated total reflection modes. The spectra give information about molecular vibrations,
from which information about chemical bonding can be derived. The studies are possible at
atmospheric pressure or at even higher pressures. The method can be described as not surface
sensitive at all because the transition mode averages information over the whole volume and
in the reflection mode the signal is registered from the layer of a thickness of about
wavelength, which is several µm. The exception as for all other methods, is an investigation
of adsorbates or of a thin supported layer, for which the information depth is determined by
the layer thickness.
Raman spectroscopy also gives information about molecule vibrations but different
selection rules make this technique complementary to infra-red spectroscopy. Raman
spectroscopy can be applied under virtually any conditions. The technique is also bulk
sensitive except the cases when adsorbates or a supported layer are investigated.
Sum frequency generation is another kind of vibration spectroscopy which can be
operated at atmospheric pressure. This technique can be applied for investigation of only
high-ordered optically flat surfaces or interfaces such as a single crystal surface. Therefore, no
real catalyst can be investigated by this method. In catalysis this technique is usually applied
for investigation of adsorbates and in this sense it can be referred as a surface sensitive
technique.
Ultraviolet-visible spectroscopy of heterogeneous catalysts is usually performed in the
diffusive reflectance mode. The technique provides information about the electronic structure
of outer atomic and molecular shells, i.e. about the oxidation state and the coordination
environment of atoms. An information depth value is of about wave length, which is 200-
* Term "operando" had recently appeared in the literature for such kind of techniques in order to
distinguish them from the measurements in the same environment where the sample had been pretreated, but at
low temperature, which sometimes also called in situ.

4
1100 nm. Therefore, the technique should be considered as bulk sensitive. The experiments
are usually performed at atmospheric pressure.
Near edge X-ray absorption fine structure spectroscopy and extended X-ray
absorption fine structure spectroscopy are kinds of X-ray absorption spectroscopy. NEXAFS
gives information about empty electronic states of an atom and consequently, about the
electronic structure. EXAFS is able to provide a detailed picture of the local geometric
structure of an element studied. These techniques are suitable for investigation of amorphous
as well as crystalline material. They can be applied in the transmission, electron yield or
fluorescence modes. The information depth for the experiments in the transmission mode is
analogous to that in transmission IR spectroscopy, i.e. the techniques are bulk sensitive except
the cases of adsorbates and a supported layer. In the electron yield mode the information
depth depends on the kinetic energy of electrons. The dependence can be estimated from the
"universal curve" of electron inelastic mean free path in a solid [3]. For kinetic energies from
100 to 1000 eV the inelastic mean free path rises from 2 to 6 monolayers. At 3000 eV it starts
to increase almost linearly from 11 monolayers and reaches 17 monolayers at 7000 eV. Thus,
for the electron kinetic energies of up to 1000 eV XAS in the electron yield mode can be
considered as quite surface sensitive, and for the energies starting from 3000 eV as bulk
sensitive. The information depth in the fluorescent mode is equal to the X-ray attenuation
length, which is usually higher than 30 nm for the photon energies used in NEXAF and
EXAFS, i.e. XAS in this mode is bulk sensitive. Measurements in the transmission and
fluorescence modes can be easily done at atmospheric pressure with photon energy starting
from 3000 eV. In the excitation energy range of 1000-3500 eV the fluorescence and electron
yield modes are usually used. XAS experiments in this range can be performed at atmospheric
pressure. In the soft X-ray region (250-1000 eV) gas phase significantly absorbs photons.
NEXAFS in this excitation energy region is run in the electron yield mode at pressures of up
to 10 mbar.
Nuclear magnetic resonance and electron paramagnetic resonance are bulk
sensitive techniques, which give information about structural and electronic properties of
investigated atoms. The techniques can be applied at atmospheric pressure.
Mössbauer spectroscopy gives very precise information about the energy of a nucleus
and consequently, about chemical state of the atom. Nevertheless, this technique is applicable
only to a very limited number of elements which exhibit the Mössbauer effect. The technique
employs a photon energy of 10-100 KeV and therefore, can be easily applied at atmospheric
pressure and being a bulk sensitive technique.
In situ methods in heterogeneous catalysis
5
Positron emission tomography is a well-established diagnostic technique in medicine,
providing 3D images of a space distribution of radio isotopes such as 11C, 13N and 15O within
living human organs. In catalysis a positron emission process along with PET is also used for
1D profiling of an isotope distribution along the reactor tube (PEP) and for particles tracking
(PEPT). The spatial resolution of the methods is basically limited by the positron travel
distance before annihilation, which for solids is in mm range. Practically no gas pressure limit
exists for these techniques because penetration ability of γ-quanta is very high.
Transmission electron microscopy was performed at pressures of up to 50 mbar [4,
5]. Environmental scanning electron microscopy is another kind of microscopy which was
designed for measurements in gas atmosphere at pressure higher than 5 mbar [6]. These
techniques are bulk sensitive.
Scanning tunneling microscopy was performed in a wide range of pressures (from
UHV to 1 bar) and temperatures (300 to 675 K) [7]. This method gives an image of the
surface with atomic resolution.
X-ray diffraction and scattering give information about the long-range crystal
structure and crystallite size. The measurements can be performed at pressures of up to tenths
of atmospheres. Usually these techniques operate in the transmission mode and consequently,
are bulk sensitive. For optically flat surfaces a glancing incidence angle can be used, which
makes the XRD technique surface sensitive. This is nevertheless, not the case for a real
catalyst, which is usually powder or solid with rough surface.
From the above mentioned methods only NEXAFS in the soft X-ray energy region can
be referred to as a technique which is surface sensitive enough for investigation of the surface
layer of a real-catalyst material (not only a single crystal and a model supported catalyst) at
catalytically-relevant pressure and temperature. On this account, X-ray photoelectron
spectroscopy, which is known to have the information depth of several nm or even less than
one nm, should be named a very useful technique for obtaining information about the
catalytically active surface layer.

6
3 In situ XPS (high-pressure XPS for
catalytic studies)
In this chapter principles and brief history of XPS (part 3.1) and in particular of high-
pressure XPS (part 3.2) will be reviewed. Part 3.3 contains a discussion of the physical basics
of high-pressure XPS instrument designing including calculation of a differential pumping
system (part 3.3.2) and an electrostatic lens system (part 3.3.3). Peculiarities of experimental
data analysis in high-pressure XPS will be briefly reviewed in part 3.4. Part 3.5 is devoted to
the experimental methods which are suitable for registration of reaction products in in situ
XPS.

In situ XPS (high-pressure XPS for catalytic studies)
3.1 X-ray photoelectron spectroscopy
History of XPS [8] can be considered to begin in 1887 with discovery of the
photoelectric effect by H. Herz [9]. Already in 1907 P.D. Innes [10] described a kinetic-
energy spectrum of photoelectrons excited by radiation of an X-ray tube with platinum anode
and registered by a spectrometer consisting of a magnetic analyzer and photographic
detection. After development by Kai Siegbahn with colleagues of a high-resolution
spectrometer, which allowed to measure accurately binding energy of photoelectron peaks
[11], the goal of using XPS for electronic structure investigation had been realized.
Subsequently the same group observed the chemical shift effect for binding energy of core-
level electrons [12, 13], which led to development of the whole field of electron spectroscopy
named ESCA (electron spectroscopy for chemical analysis) [14, 15]. The work of K.
Siegbahn was awarded by Nobel prize in 1981 "for his contribution to the development of
high-resolution electron spectroscopy". In 1969-70 commercial XPS instruments began to
appear thanks to developing routine methods of obtaining UHV conditions. Starting from that
time XPS can be considered as a widely used method for investigation of the surface of a
solid sample. The possibility of estimation of chemical composition and of chemical state of
elements together with a small information depth makes XPS an important method for
microelectronics, metallurgy, heterogeneous catalysis, polymer technology and corrosion
science [16].
The basic elements of an XPS instrument are a light source, an electron energy
analyzer and an electron detector as it is drawn on Figure 3-1.
Figure 3-1 Basic elements of XPS experiment according [17].
hν
sample
photonsource
_
+
Detectore-
E k
Analyzer
7

In a laboratory XPS system an X-ray tube (usually with Al or Mg cathode) and a He
gas-discharge lamp are used. Spectroscopic measurements with a He lamp are usually called
Ultraviolet Photoelectron Spectroscopy (UPS). Development of synchrotrons made available
the whole range of excitation energies between X-ray tubes and He lamps and made a
difference between XPS and UPS somewhat arbitrary. Furthermore, use of synchrotron light
has several advantages comparing common laboratory X-ray sources. Besides higher photon
flux and the possibility of focusing of an X-ray beam into a small spot, synchrotron light has
the property of excitation energy tuneability, which allows changing the information depth
and the photoelectron cross section.
Magnetic electron energy analyzers were used on early stages of XPS development.
Later they were completely replaced by electrostatic analyzers because of easier construction
and handling. From different types of electrostatic analyzers including the retarding field
analyzer, the cylindrical mirror or deflection analyzers and the hemispherical analyzer only
the last one is widely used nowadays for XPS because of better resolution characteristics.
Retarding-field analyzers are employed in LEED and cylindrical-mirror analyzers are usually
the part of a laboratory AES system, where the signal-to-noise ratio is more important than
the resolution. A schematic diagram of a hemispherical electrostatic electron energies
analyzer is shown on Figure 3-2.
Figure 3-2 Hemispherical electron energy analyzer.
detector
Ek0 Ep
electrostatic lenses
electrons
8

In situ XPS (high-pressure XPS for catalytic studies)
9
Electrons of the initial kinetic energy Ek0, which are supposed to be registered, are
decelerating or accelerating by the electrostatic lenses to the analyzer pass energy Ep and
focusing on the inlet slit. The difference in voltages on the hemispherical electrodes
corresponds to a selection of electrons of the kinetic energy Ep. Thus, the photoelectrons are
registered in a small kinetic energy range, those width determines the analyzer resolution. A
spectrum is obtained by sweeping voltages of the electrostatic lenses and the hemispherical
electrodes. Electrons are usually detected by an electron multiplier of the channeltron type
and electronics in the pulse counting mode. Sometimes channeltrons are replaced by a
microchannel plate or a video camera of CCD type with a fluorescent screen or other
detectors for space-resolved spectroscopic measurements.
The volume of the analyzer should be kept at high vacuum conditions because the
photoelectron signal would be significantly decreased by scattering of photoelectrons in the
gas phase if the vacuum is not high enough. For example, the mean free path of
photoelectrons of kinetic energy 100 eV in gas phase at the pressure of 1 mbar is about 1 mm.
To have the mean free path bigger than the distance that electrons should travel in the
spectrometer, which is usually about 1 meter or more, a vacuum better than 10-3 mbar is
required. A sample in ordinary XPS should be also kept in high vacuum because the surface
should be kept clean. Gas molecules with a sticking coefficient of unity will form a
monolayer on the surface in about one second at the background pressure of 10-6 mbar.
Therefore, the pressure in the 10-10 mbar range is required to keep the surface clean for a
reasonable time.
Physical principles of photoemission process are demonstrated by Figure 3-3.

Figure 3-3. Schematic diagram of a core-level-photoelectron emission process.
E
Evac
EF
vacuum levelFermi level
core level
WF
EB
EK
hν
If no surface charging is present, the kinetic energy EK of a photoelectron can be
obtained from the Einstein equation:
EK=hv-EB-WF (3-1)
where hv is the energy of the X-ray quantum, EB is the binding energy of the core level
and WF is the work function of the sample. In the case of charging the potential energy of the
electron in electromagnetic field should be subtracted from the right side of the equation. One
should note that presented in the formula EB is a difference of the initial and final atomic
energies, which in general includes the relaxation component and which is always lower than
the energy of the orbital from which the photoelectron was emitted. Nevertheless, the value
EB is suitable for element analysis and chemical state identification.
As far as every chemical element has a characteristic XPS spectrum, the chemical
composition of a sample can be identified. A binding energy of a core-level electron depends
also on surroundings of atoms. Non-equivalence of binding energies for an element in
different chemical compounds can arise from various reasons: difference in a formal
oxidation state, different molecular environment, different lattice parameters and so on.
Binding energy shift due to environment effects, which is usually named chemical shift, can
be described by the simple equation [18]
10
In situ XPS (high-pressure XPS for catalytic studies)
EB-EB(0)=IA+EA (3-2)
where E (0)B is the binding energy of the core-level electron in the isolated atom. The
intraatomic part IA can be described in terms of the effective charge q of the atom in a
molecule or crystal as IA=kq, where k is a constant for the chemical element. The extraatomic
part EA is the potential energy produced by the surroundings. This part is often referred as
Madelung potential. The parts IA and EA acting opposite each other and dependence of EA
on type of solid sometimes makes problematic the identification of the chemical state of an
atom by its chemical shift.
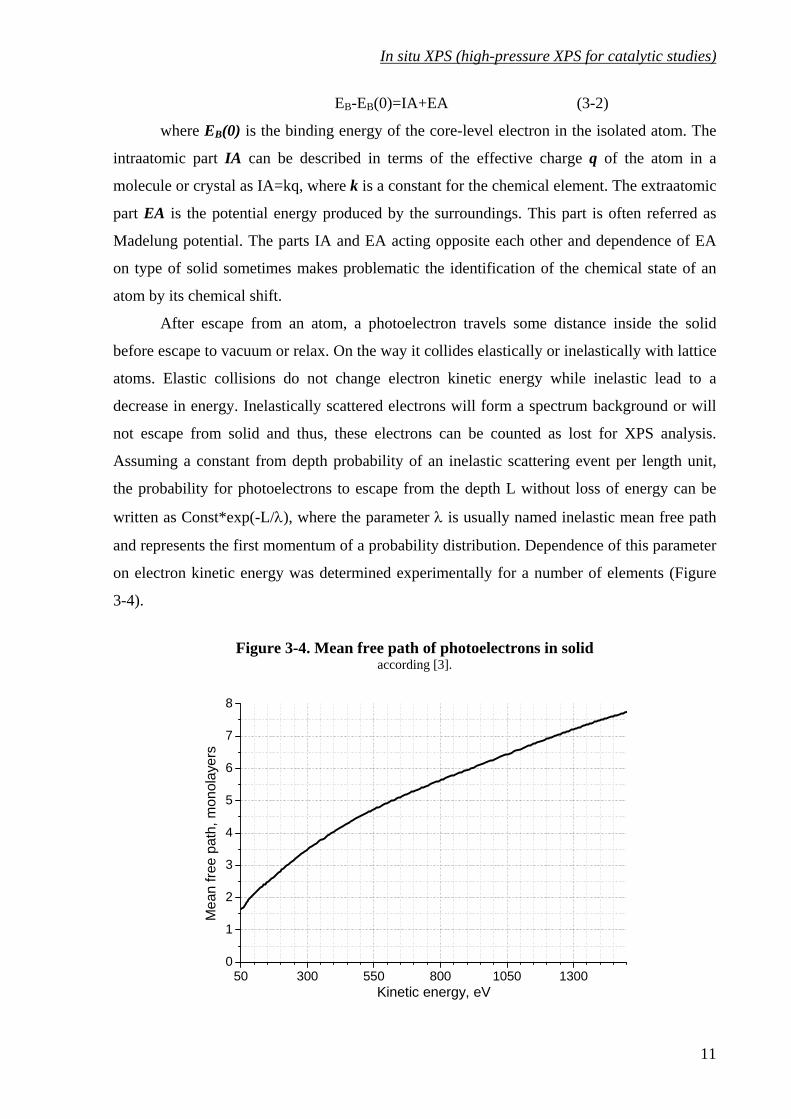
After escape from an atom, a photoelectron travels some distance inside the solid
before escape to vacuum or relax. On the way it collides elastically or inelastically with lattice
atoms. Elastic collisions do not change electron kinetic energy while inelastic lead to a
decrease in energy. Inelastically scattered electrons will form a spectrum background or will
not escape from solid and thus, these electrons can be counted as lost for XPS analysis.
Assuming a constant from depth probability of an inelastic scattering event per length unit,
the probability for photoelectrons to escape from the depth L without loss of energy can be
written as Const*exp(-L/λ), where the parameter λ is usually named inelastic mean free path
and represents the first momentum of a probability distribution. Dependence of this parameter
on electron kinetic energy was determined experimentally for a number of elements (Figure
3-4).
Figure 3-4. Mean free path of photoelectrons in solid according [3].
50 300 550 800 1050 13000
1
2
3
4
5
6
7
8
Mea
n fre
e pa
th, m
onol
ayer
s
Kinetic energy, eV
11

This dependence makes it possible to perform a non-destructive information depth
profiling by changing kinetic energy of photoelectrons by tuning excitation photon energy,
which is possible at the synchrotron. Another possibility to obtain dependence of information
on depth is the angular resolved photoelectron spectroscopy (ARPES). The basics of this
method are tuning of the angle ϕ between the perpendicular to the sample surface and the
direction of photoelectron detection. Information depth depends on the angle ϕ as cos(ϕ). No
excitation energy turning is necessary for this method and therefore, it can be performed with
ordinary X-ray tube. Disadvantages of the method are firstly, dependence of the data quality
on surface roughness, which makes it hardly applicable for powders and secondly, presence of
angular-dependent effects for valence band of ordered surfaces (mainly of single crystals),
which often makes impossible depth profiling on valence band by this method. Depth
profiling by ARPES is mainly applied for measurement of a thickness of deposed thin films.
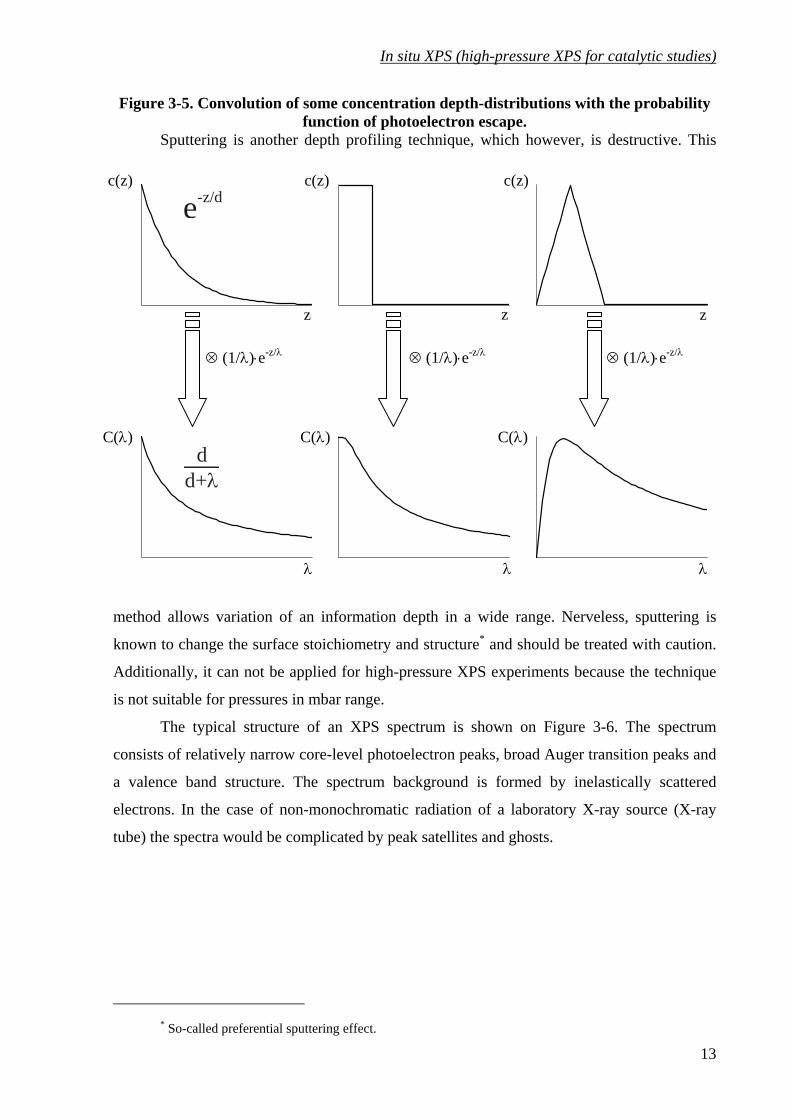
One should keep in mind that the information depth λ in these two depth-profiling
techniques represents the electron mean free path in solid, but not the sole depth from which
information is obtained. Photoelectrons are registered from the whole range of depth z∈(0,∞)
with the variable probability (1/λ)⋅e-z/λ. For example the registered depth profile of a relative
concentration C(λ) of some element referred to another element with a homogeneous
concentration distribution will be the convolution of the concentration function c(z) with the
probability (1/λ)⋅e-z/λ:
dzezcC z λ
λλ −
∞
∫ ⋅⋅=0
)(1)( (3-3)
Some examples of such a convolution are shown on Figure 3-5.
12
In situ XPS (high-pressure XPS for catalytic studies)
Figure 3-5. Convolution of some concentration depth-distributions with the probability function of photoelectron escape.
Sputtering is another depth profiling technique, which however, is destructive. This
method allows variation of an information depth in a wide range. Nerveless, sputtering is
known to change the surface stoichiometry and structure* and should be treated with caution.
Additionally, it can not be applied for high-pressure XPS experiments because the technique
is not suitable for pressures in mbar range.
λ λ
z
λ
C(λ)
⊗ (1/λ)⋅e-z/λ ⊗ (1/λ)⋅e-z/λ
c(z)
⊗ (1/λ)⋅e-z/λ
dd+λ
e-z/d
C(λ) C(λ)
zz
c(z) c(z)
The typical structure of an XPS spectrum is shown on Figure 3-6. The spectrum
consists of relatively narrow core-level photoelectron peaks, broad Auger transition peaks and
a valence band structure. The spectrum background is formed by inelastically scattered
electrons. In the case of non-monochromatic radiation of a laboratory X-ray source (X-ray
tube) the spectra would be complicated by peak satellites and ghosts.
13
* So-called preferential sputtering effect.
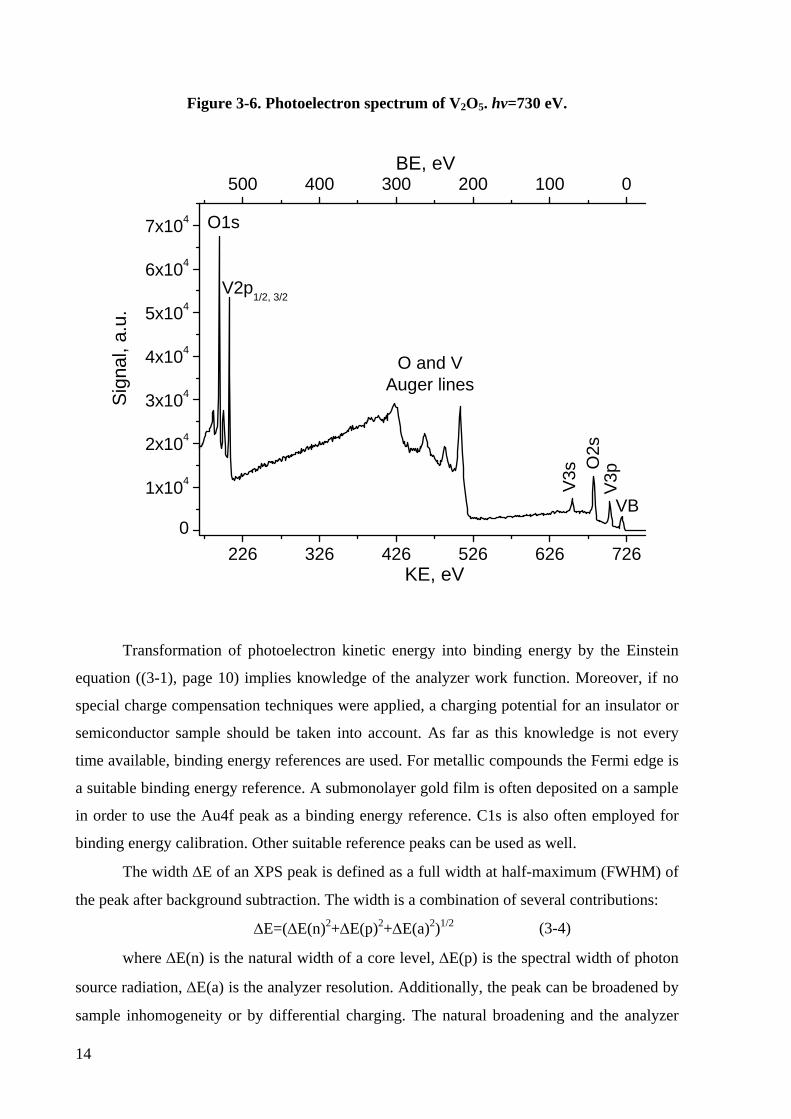
Figure 3-6. Photoelectron spectrum of V2O5. hv=730 eV.
226 326 426 526 626 7260
1x10⁴
2x10⁴
3x10⁴
4x10⁴
5x10⁴
6x10⁴
7x10⁴
500 400 300 200 100 0
VB
V3pO
2sV3
s
O and VAuger lines
V2p1/2, 3/2
O1s
BE, eV
Sign
al, a
.u.
KE, eV
Transformation of photoelectron kinetic energy into binding energy by the Einstein
equation ((3-1), page 10) implies knowledge of the analyzer work function. Moreover, if no
special charge compensation techniques were applied, a charging potential for an insulator or
semiconductor sample should be taken into account. As far as this knowledge is not every
time available, binding energy references are used. For metallic compounds the Fermi edge is
a suitable binding energy reference. A submonolayer gold film is often deposited on a sample
in order to use the Au4f peak as a binding energy reference. C1s is also often employed for
binding energy calibration. Other suitable reference peaks can be used as well.
The width ∆E of an XPS peak is defined as a full width at half-maximum (FWHM) of
the peak after background subtraction. The width is a combination of several contributions:
∆E=(∆E(n)2+∆E(p)2+∆E(a)2)1/2 (3-4)
where ∆E(n) is the natural width of a core level, ∆E(p) is the spectral width of photon
source radiation, ∆E(a) is the analyzer resolution. Additionally, the peak can be broadened by
sample inhomogeneity or by differential charging. The natural broadening and the analyzer
14
In situ XPS (high-pressure XPS for catalytic studies)
broadening are described by the Lorenz and Gauss profiles respectively. Synchrotron X-ray
radiation has the Gauss spectral shape because of the instrumental broadening introduced by a
monochromator.
The shape of a core-level photoelectron peak depends on a peak type as well as on the
insulator or metallic nature of the sample. In addition, several overlapping components can be
present in the peak due to the coexistence of different chemical states of the same element.
The shape of a peak corresponding to a single chemical component should be determined
separately for every chemical compound. Practically in most cases (except high-resolution
measurements) the peak shape can be well-described by the Gauss-Lorentz (Voight) profile
for semiconductors and insulators and by the Doniach-Sunjic profile for metals.
An X-ray photoelectron spectrum of a solid-state sample always contains a
background, which is formed by inelasticaly scattered photoelectrons. To estimate the peak
shape and the stoichiometry from an experimental spectrum first the background should be
subtracted. Different models of background shape are in use. A simple linear-type background
can be used for fast spectra analysis, while for more accurate line shape and stoichiometry
analysis more complicated background types should be used. D.A. Shirley suggested the
background shape on the assumptions of a constant energy spectrum of scattered
photoelectrons and a constant scattering probability in the peak region [19]. The shape has
been shown to have a significant error in the case of a metallic sample [20], but otherwise, it
gives realistic results. Relative ease in use makes this background type widely used. In the
case of metals, a Tougaard-type background [21] gives better results.
The stoichiometry of the sample surface can be estimated from the area ratio of XPS
peaks. The general formula for the XPS peak area [22] is
I=nfσθyλAT (3-5)
where n is the atomic concentration of the element, f is the X-ray flux, σ is the
photoelectronic cross-section for the atomic orbital of interest, θ is the angular efficiency
factor for the instrumental arrangement, y is the efficiency in the photoelectronic process for
formation of photoelectrons of the normal photoelectron energy, λ is the mean free path of the
photoelectrons in the sample, A is the area of the sample from which photoelectrons are
detected, T is the detection efficiency for electrons emitted from the sample.
In the case of a laboratory X-ray tube the stoichiometric ratio of two elements A and B
could be determined from the peak areas:
BB
AA
BBBBB
AAAAA
B
A
SISI
TyITyI
nn
==λσλσ
(3-6)
15

where SA and SB are the sensitivity factors for the elements, which are tabulated and
listed in literature (for example [22]).
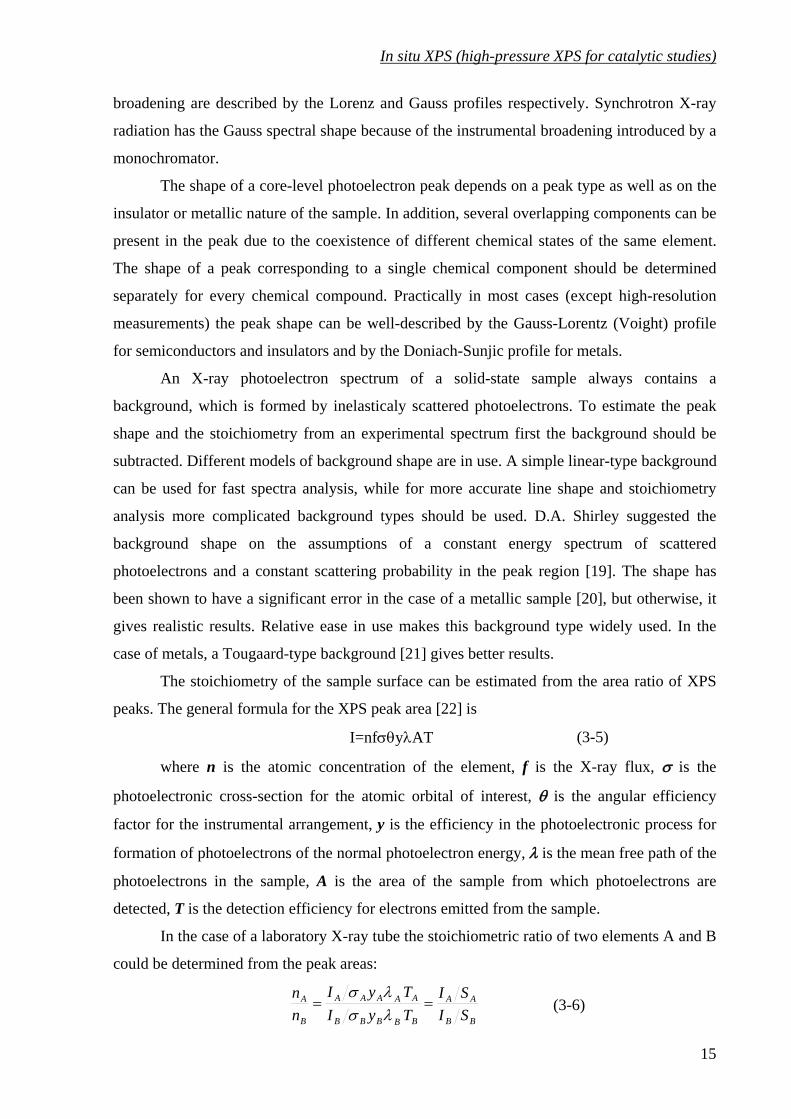
Figure 3-7. Example of use different hv to achieve the same KE of different peaks.
710 712 714 716 718
hv=1005 eV
hv=854 eVP2p
C1s
Sign
al, n
.u.
KE, eV291 288 285 138 136 134 132
P2pC1s
Sign
al, n
.u.
BE, eV
If the X-ray source is a synchrotron, it is possible to set kinetic energies of
photoelectrons from certain core levels of two different elements to the same value by use of
two different excitation energies (Figure 3-7). The same information depth and the same
analyzer transmission are achieved in this case and the formula for the stoichiometric ratio has
the form:
A
B
A
B
B
A
B
A
ff
II
nn
σσ
= (3-7)
The cross-sections were calculated theoretically in [23]. An analytical formula for the
photon-energy dependence was obtained on base of this data in [24]. It should be noted that
some disagreements were found for selected compounds between theoretical cross-section
values and experimental data [25]. As far as no other extended theoretical or experimental
cross-section database is available, stoichiometric ratio estimations are desired to be proven
by measurement of reference compounds.
16

In situ XPS (high-pressure XPS for catalytic studies)
3.2 Principles and history of high-pressure XPS
The base elements of a high-pressure XPS setup are shown on Figure 3-8.
Figure 3-8 Principle scheme of a high-pressure XPS experiment.
1. X-ray source 2. X-ray window
3. sample 4. experimental cell
5. differential pumping stage(s) 6. electron energy analyzer
The X-ray source (1) can be a conventional X-ray tube or a synchrotron. The thin X-
ray window (2) separates volume of the X-ray source from the experimental cell (4). X-rays
from the source pass the X-ray window, hit the sample (3) and extract photoelectrons. After
traveling in the sample cell a part of photoelectrons reaches the entrance aperture of the
differential pumping stage(s) (5) and passes through it to the electron energy analyzer (6).
Therefore, application of the differential pumping allows minimization of a travel path of
photoelectrons in gas phase. Gas atmosphere can be introduced into the sample cell instead of
UHV conditions, which are obligatory for conventional XPS. The pressure of gas in the
sample cell is limited by scattering of photoelectrons by gas-phase molecules, which leads to
a decrease of a photoelectron signal. A maximum pressure depends on several factors like the
distance between the sample and the first aperture, the intensity of the X-ray source,
photoelectron collection and detection efficiencies, the kinetic energy of photoelectrons and
the type of the gas. Electrostatic lenses introduced into the differential pumping stage (or
stages) could increase significantly collection of photoelectrons as demonstrated by Figure
3-9.
17

Figure 3-9 Collection of photoelectrons without (a) and with (b) electrostatic lenses. Electron trajectories are shown.
a.
b.
The concept of differential pumping for high-pressure XPS was first applied by K.
Siegbahn with colleagues [18] in 1969 for investigation of gases at pressures of up to a few
tenths of a Torr (1 Torr= 1.33 mbar= 133 Pa). The system was based on a magnetic-type
electron energy analyzer with one differential pumping stage. Four years later K. Siegbahn
and H. Sieghban reported the first XPS experiment on liquids [26]. The experimental system
allowed investigations of a liquid beam of liquids with a vapor pressure of less than 1 Torr
and was also based on a magnetic-type electron energy analyzer with one differential
pumping stage. Some other modifications of the spectrometer for liquid studies were reported
later by the same group [27, 28]. In 1979 the construction of the commercialized afterwards
XPS system for investigations of solids in gas at pressures of up to 1 Torr was reported by R.
Joyner and M. Roberts [29]. One differential pumping stage around the high-pressure sample
cell was used in combination with the commercial hemispherical electron energy analyzer
ESCALAB of V.G. Scientific Ltd. Next design of a high-pressure XPS system was reported
by H. Ruppender et al. in 1990 [30]. The system included three differential pumping stages
and allowed to perform experiments at gas pressures of up to 1 mbar. In 2000 the first results
obtained on the high-pressure XPS system designed by the group of M. Salmeron were
announced [31]. The spectrometer included a two-stage differential pumping combined with
the first introduced electrostatic lens system for collection of photoelectrons. The system was
used with a synchrotron X-ray source and allowed investigations at pressures of up to 7 mbar.
This setup was applied to investigate heterogeneous catalytic systems under reaction
conditions simultaneously with the monitoring of reaction products ([32], [33], [34]) and to
investigate of the process of ice premelting [32, 35]. This is why the setup got the special
name "in situ XPS". In 2001 M.A. Kelly et al. reported construction of a high-pressure X-ray
18

In situ XPS (high-pressure XPS for catalytic studies)
19
photoelectron spectrometer for monitoring of thin films synthesis [36]. A modified
SURFACE-SCIENCE-INSTRUMENTS hemispherical electron energy analyzer with the
specially constructed electrostatic lens system and a one-stage differential pumping made
possible measurements in gas atmosphere at pressures of up to 20 mTorr (0.03 mbar). The
electrostatic focusing elements introduced into the differential pumping stage of this setup
allowed collection of photoelectrons from the cone with the half angle of 15° and from the
surface area of about 1-2 mm2. Such a high collection was achieved because the electrostatic
lens elements were mounted very close to the sample. Nevertheless, the distance between the
sample and the inlet aperture of the differential pumping was about 40-50 mm (comparing 1-2
mm in all other designs), which limits the pressure in the sample cell to quite low values.
The system described here was constructed by our group (Fritz-Haber-Institut,
Department of Inorganic Chemistry, Group of Surface Analysis) in close collaboration with
the group of M. Salmeron and represents the next version of the setup described above ([32]).
The differential pumping and photoelectron collection systems were improved compared with
the previous design. Two almost identical exemplars of the new setup were produced. The
first one is for the group of M. Salmeron and another is for our group. Our high-pressure XPS
system has worked since September 2002 when it was successfully tested with a copper
catalyst [33] at the beamline U49/2-PGM1 of the synchrotron BESSY II (Berlin, Germany).
In March 2004 the company GAMMADATA SCIENTA announced a commercial
high-pressure XPS system based on a spectrometer SES-100. Pressure drop in the four-stage
differential pumping system was specified to be "better than 6 orders of magnitude", which
should correspond to the pressure limit in the sample cell of about 0.1 mbar assuming a
pressure in the analyser not higher than 10-7 mbar.

3.3 Construction of the high-pressure XPS system and
characteristics of the system
3.3.1 Factors influencing performance of the system.
As it was discussed in the previous chapter, the base feature of a high-pressure XPS
system (Figure 3-10) is the differential pumping between the sample cell and the electron
energy analyzer. The criterion for quality of a high-pressure XPS spectrometer is the
maximum pressure in the sample cell, which can be achieved without loss of spectrum
quality.
Figure 3-10. High-pressure XPS setup.
gas flow
p~mbar
X-raywindow photoelectrons
electrostatic lens system
X-ray
sample
p~10 mbar-8
differential pumping
hemisphericalelectron energy
analyzer
There are several parameters, which influence an XPS signal level:
1) X-ray intensity at the sample position, which depends on:
a) flux of the X-ray source
b) transmission of the X-ray window
c) adsorption of X-ray by gas phase in the sample cell
2) Efficiency of photoionisation and scattering of photoelectrons in solid
3) Scattering of photoelectrons by gas phase
4) Efficiency of photoelectron collection by the spectrometer.
20
In situ XPS (high-pressure XPS for catalytic studies)
It should be noted that the signal value as an indicator of the spectrometer quality
should be always referred to the same spectral resolution because a higher X-ray flux could
always be achieved by decreasing a monochromator resolution or by better photoelectron
collection caused by decrease of the electron energy analyzer resolution. Influence of these
factors on the total signal will be estimated below.
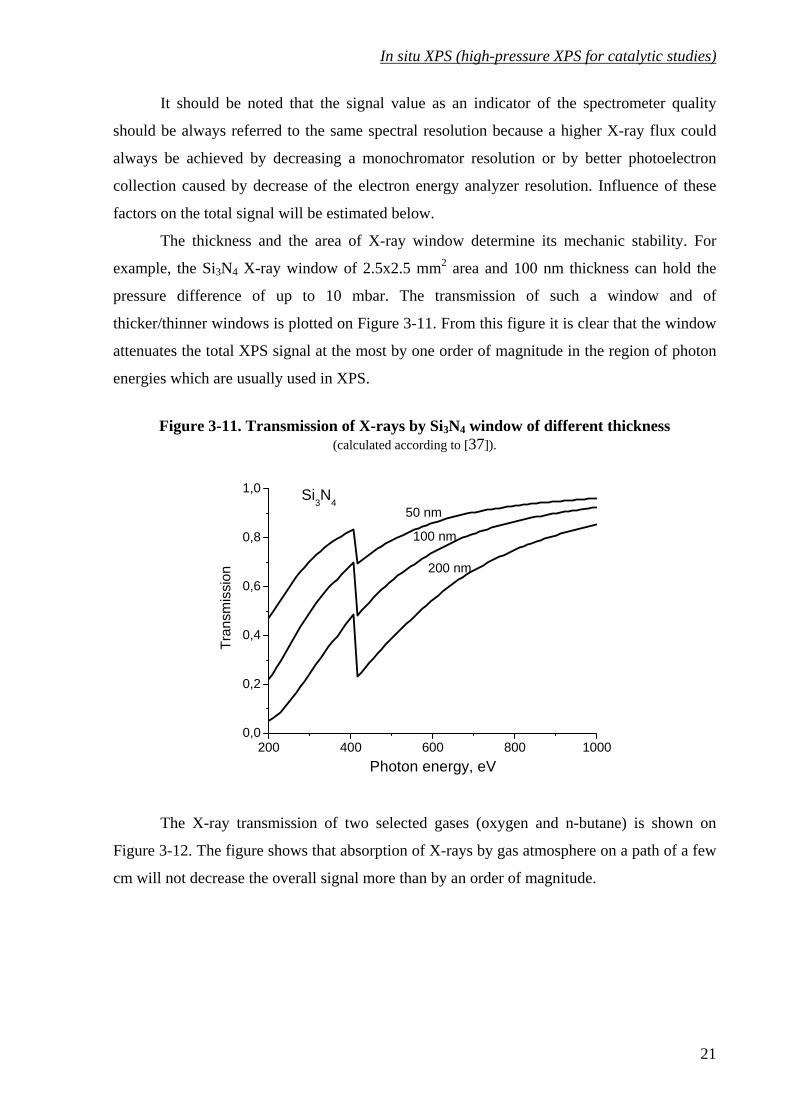
The thickness and the area of X-ray window determine its mechanic stability. For
example, the Si3N4 X-ray window of 2.5x2.5 mm2 area and 100 nm thickness can hold the
pressure difference of up to 10 mbar. The transmission of such a window and of
thicker/thinner windows is plotted on Figure 3-11. From this figure it is clear that the window
attenuates the total XPS signal at the most by one order of magnitude in the region of photon
energies which are usually used in XPS.
Figure 3-11. Transmission of X-rays by Si3N4 window of different thickness (calculated according to [37]).
200 400 600 800 10000,0
0,2
0,4
0,6
0,8
1,0
50 nm
200 nm
100 nm
Si3N4
Tran
smis
sion
Photon energy, eV
The X-ray transmission of two selected gases (oxygen and n-butane) is shown on
Figure 3-12. The figure shows that absorption of X-rays by gas atmosphere on a path of a few
cm will not decrease the overall signal more than by an order of magnitude.
21

Figure 3-12. X-ray transmission of O2 and butane. (calculated according [37])
200 400 600 800 10000,0
0,2
0,4
0,6
0,8
1,0
p= 5 mbarT= 295 K
2 cm
1 cm
butane
2 cm
1 cmO2
Tran
smis
sion
Photon energy, eV
An influence of photoelectron scattering by gas phase on the overall signal depends on
a pressure and on a path length of photoelectrons in gas phase. Actually, scattering of
photoelectrons is the main factor limiting a maximum pressure in the sample cell. As far as a
photoelectron signal decreases exponentially with the path length, a distance between the
sample surface and the first aperture of differential pumping should be kept as short as
possible. However, it is not possible to set the distance to be less than 1 mm for the aperture
radius of 0.5 mm because a gas pressure near the sample surface depends on a
distance/aperture-size ratio. The dependence was estimated in [31] using the molecular flow
approach:
( ) ⎟⎟⎠
⎞⎜⎜⎝
⎛
+−=
201
121
zzpzp (3-8)
22

In situ XPS (high-pressure XPS for catalytic studies)
Figure 3-13. Scheme for the equation (3-8)
-6 -4 -2 0 2 4 60,0
0,2
0,4
0,6
0,8
1,0
2R
First apertureSample
p, n
.u.
z, [R]
where p0 is a pressure in the sample cell and z is measured in R units. According to
this formula, the pressure near the sample surface would be 99% of p0 for z=-4 or 95% for z=-
2 or 85% for z=-1. Therefore, it is not recommended to go much closer than z=-2, which is 1
mm for the aperture diameter of 1 mm.
Cross-sections of photoelectron scattering by hydrogen molecules are shown on Figure
3-14a.
Figure 3-14. Characteristics of photoelectron scattering by molecular hydrogen a. Cross-sections for scattering of photoelectrons by a hydrogen molecule according to [38],
b. Mean free path of photoelectrons in hydrogen at T=300 K, p=1 mbar calculated using these cross-sections.
0 100 200 300 400 500
0
2
4
6
8
10
12
14
16
18
20
Mea
n fre
e pa
th, m
m
Electron energy, eV0 100 200 300 400 500
0
2
4
6
8
10
12
14
16
18
Tota
l sca
tterin
g cr
oss-
sect
ion,
10-1
6 cm2
Electron energy, eV
b.a.
It is easy to convert these values into a mean free path of photoelectrons using the
formula:
23
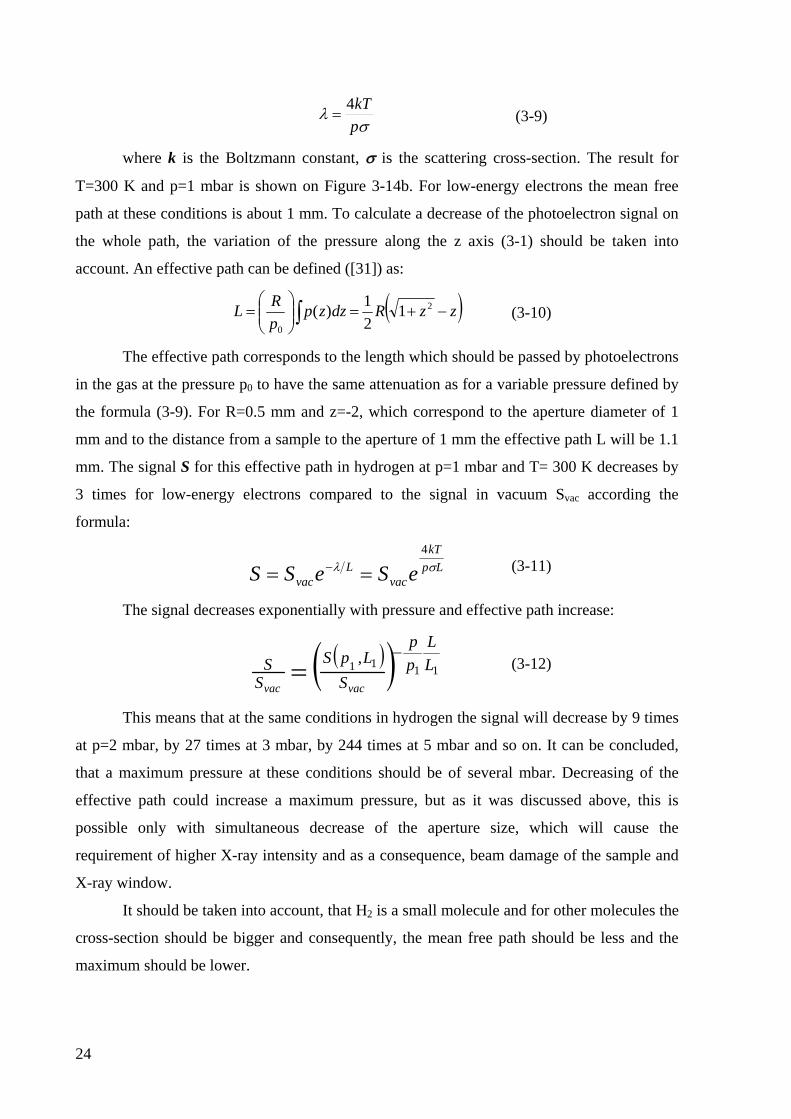
σλ
pkT4
= (3-9)
where k is the Boltzmann constant, σ is the scattering cross-section. The result for
T=300 K and p=1 mbar is shown on Figure 3-14b. For low-energy electrons the mean free
path at these conditions is about 1 mm. To calculate a decrease of the photoelectron signal on
the whole path, the variation of the pressure along the z axis (3-1) should be taken into
account. An effective path can be defined ([31]) as:
( )∫ −+=⎟⎟⎠
⎞⎜⎜⎝
⎛= zzRdzzp
pRL 2
0
121)( (3-10)
The effective path corresponds to the length which should be passed by photoelectrons
in the gas at the pressure p0 to have the same attenuation as for a variable pressure defined by
the formula (3-9). For R=0.5 mm and z=-2, which correspond to the aperture diameter of 1
mm and to the distance from a sample to the aperture of 1 mm the effective path L will be 1.1
mm. The signal S for this effective path in hydrogen at p=1 mbar and T= 300 K decreases by
3 times for low-energy electrons compared to the signal in vacuum Svac according the
formula:
LpkT
vacL
vac eSeSS σλ4
== −
(3-11)
The signal decreases exponentially with pressure and effective path increase:
( )( ) 1111 , LL
pp
SLpS
SS
vacvac
−=
(3-12)
This means that at the same conditions in hydrogen the signal will decrease by 9 times
at p=2 mbar, by 27 times at 3 mbar, by 244 times at 5 mbar and so on. It can be concluded,
that a maximum pressure at these conditions should be of several mbar. Decreasing of the
effective path could increase a maximum pressure, but as it was discussed above, this is
possible only with simultaneous decrease of the aperture size, which will cause the
requirement of higher X-ray intensity and as a consequence, beam damage of the sample and
X-ray window.
It should be taken into account, that H2 is a small molecule and for other molecules the
cross-section should be bigger and consequently, the mean free path should be less and the
maximum should be lower.
24
In situ XPS (high-pressure XPS for catalytic studies)
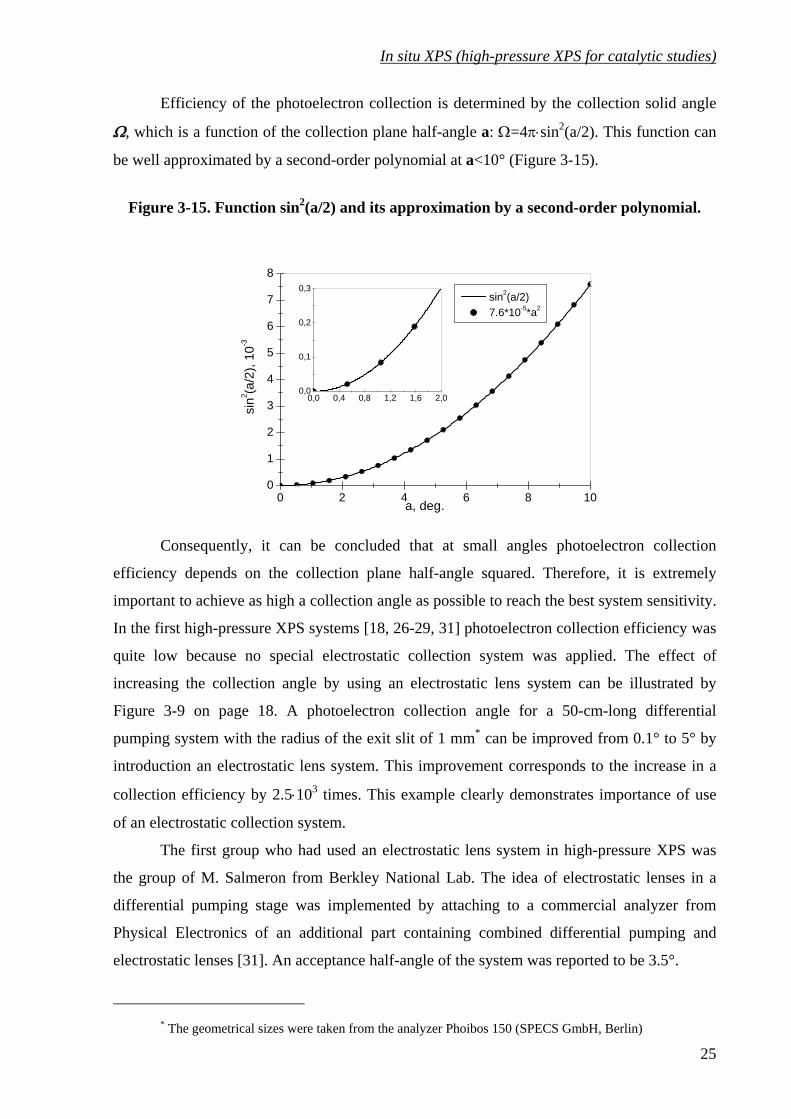
Efficiency of the photoelectron collection is determined by the collection solid angle
Ω, which is a function of the collection plane half-angle a: Ω=4π⋅sin2(a/2). This function can
be well approximated by a second-order polynomial at a<10° (Figure 3-15).
Figure 3-15. Function sin2(a/2) and its approximation by a second-order polynomial.
0,0 0,4 0,8 1,2 1,6 2,00,0
0,1
0,2
0,3
0 2 4 6 8 100
1
2
3
4
5
6
7
8
sin2(a/2) 7.6*10-5*a2
a, deg.
sin2 (a
/2),
10-3
Consequently, it can be concluded that at small angles photoelectron collection
efficiency depends on the collection plane half-angle squared. Therefore, it is extremely
important to achieve as high a collection angle as possible to reach the best system sensitivity.
In the first high-pressure XPS systems [18, 26-29, 31] photoelectron collection efficiency was
quite low because no special electrostatic collection system was applied. The effect of
increasing the collection angle by using an electrostatic lens system can be illustrated by
Figure 3-9 on page 18. A photoelectron collection angle for a 50-cm-long differential
pumping system with the radius of the exit slit of 1 mm* can be improved from 0.1° to 5° by
introduction an electrostatic lens system. This improvement corresponds to the increase in a
collection efficiency by 2.5⋅103 times. This example clearly demonstrates importance of use
of an electrostatic collection system.
The first group who had used an electrostatic lens system in high-pressure XPS was
the group of M. Salmeron from Berkley National Lab. The idea of electrostatic lenses in a
differential pumping stage was implemented by attaching to a commercial analyzer from
Physical Electronics of an additional part containing combined differential pumping and
electrostatic lenses [31]. An acceptance half-angle of the system was reported to be 3.5°.
25
* The geometrical sizes were taken from the analyzer Phoibos 150 (SPECS GmbH, Berlin)

26
Summarizing this part it is worth noting that the main factor limiting the maximum
working pressure in the sample cell is scattering of low-energy photoelectrons by gas phase
molecules. A path of photoelectrons in gas phase cannot be much shorter than the size of the
first aperture because it would lead to a decrease of gas pressure near to the investigated area
of the sample surface. Aperture size cannot be decreased significantly below 1 mm because it
influences the value of the investigated area and collection angle. The possibilities to increase
a maximum pressure are to use a photon source with higher flux and tighter focus, which
nevertheless, can be accompanied by beam damage of the sample, and/or to improve
collection of photoelectrons by using an electrostatic lens system in differential pumping
stages.

In situ XPS (high-pressure XPS for catalytic studies)
3.3.2 Calculation and design of the differential pumping system.
In this chapter details of calculations of the differential pumping system and
performance of the designed system are presented. The calculations are based on the approach
developed by the group of M. Salmeron for design of the prototype of the system [32].
The main parameters determining a differential pumping design are inlet gas flow and
desired pressure after the last pumping stage. The inlet flow, which is the flow through the
first aperture, will be estimated below. Denoting the volumetric flow rate through the first
aperture as Sa and the pumping speed of the pump in the first pumping stage as S1 we will get
the expression for a pressure in the first pumping stage:
10
1
SS
pp a= (3-13)
To calculate the flow S1 two approaches could be used.
The molecular flow approach is for the low-pressure region, where the mean free path
of gas molecules λgas is greater than the aperture diameter 2R. This approach implies the
absence of molecule-molecule collisions in a space region near the aperture. According to this
approach a volumetric flow rate can be determined from the formula:
MTkNRvRS A
a322 ππ >=<= (3-14)
where the <v> is a mean molecular velocity (which was assumed to be a mean-square
velocity of ideal gas molecules), T is a gas temperature, M is a molar mass, k and NA are the
Boltzmann and Avogadro constants. As an example, the volumetric flow will be calculated
for water molecules. For other gases except hydrogen and helium the volumetric flow should
be less or the same. A volumetric flow of water molecules through the aperture of 1 mm
diameter at room temperature is 0.5 l/s, which means a pressure drop of 0.7⋅103-1.4⋅103 times
in the first stage comparing the pressure in the sample cell if using in the first stage a high-
performance Leybold Turbovac TW 700 turbo-pump with 330-680 l/s pumping speed. This
means that three pumping stages are necessary to keep a pressure in analyzer in 10-8 mbar
range simultaneously with a pressure of several mbar in the sample cell.
Even with ideal pumping the fraction Ω/2π of the flux will pass through the
differential pumping system as a molecular beam (here Ω≈π⋅R32/L2 is a solid angle of the
differential pumping exit slit seen from the source aperture). This gives the expression for the
minimum length L of the differential pumping system:
27

332
2
0 2 pSLRpSa ≤⎟⎟
⎠
⎞⎜⎜⎝
⎛ππ (3-15)
or 3
0
3
3
2 pp
SSRL a≥ (3-16)
where R3, S3 and p3 are the radius of the exit aperture of the third pumping stage, the
volumetric flow through this aperture, and the pressure in the third stage respectively.
Supposing a diameter of the third aperture is 2 mm and a pumping speed is 105-180 l/s* the
minimum length will be estimated to be Lmin=350⋅R3=70 cm.
The second approach for the consideration of a gas flow is the viscous flow approach.
This approach is for high pressures for which λ≤0.01⋅2R. In this case a gas jet is described as
a supersonic molecular beam [39].
In the case if the ratio p1/p0<const (where const is some value, which depends on the
gas nature but is always greater than 0.528), which certainly takes place at p0=5 mbar, the
flow through the aperture becomes so-named "choked flow", which mean that a volumetric
flow does not change with a pressure and is determined by the formula *2aRSa π= (3-17)
where a* is a sound velocity in plane of the aperture. Applying thermodynamic
equations for the isentropic flow one will get:
MTkNRS A
a γγπ
+=
122 (3-18)
where γ≡cp/cv. For all ideal gases 1<γ≤1.67, which means 118.1121 ≤+
<γ
γ or
112
≈+ γγ for all gases and Sa≈0.3 l/s for water molecules at 300 K. This value is smaller than
the value obtained by the molecular flow approach. Nevertheless, the supersonic flow is more
directional than the molecular flow, at least before the Mach-disk-shock plane [40], which in
our case is on the distance xM=0.67⋅d⋅(p0/p1)1/2≈4.7 cm. After this plane the flow can be
already accounted as a molecular flow. This means that one can first consider the flow as a
non-directed molecular flow with Sa calculated using the formula (3-18) and afterwards add
xM to the obtained value. Therefore, by applying the formula (3-16) one will get the length of
55 cm and the total length L will be 60 cm, which is smaller than the value calculated by the
* Pfeiffer Vacuum TMU200MP pump
28
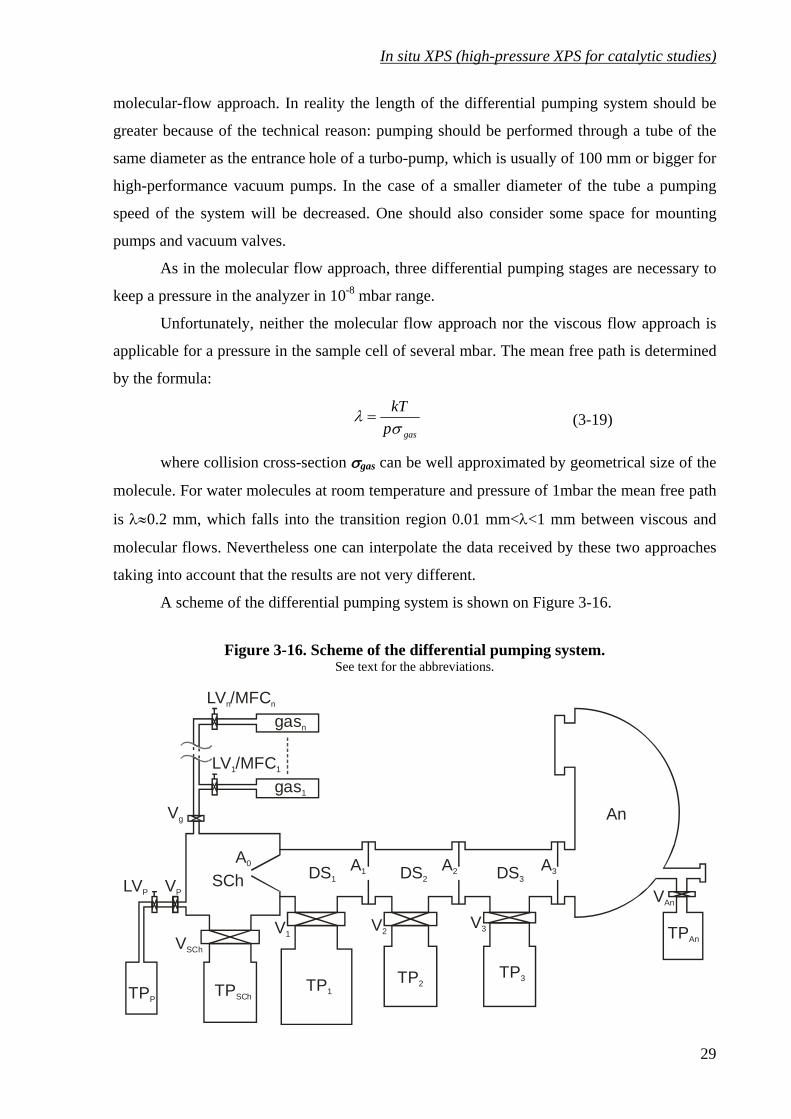
In situ XPS (high-pressure XPS for catalytic studies)
molecular-flow approach. In reality the length of the differential pumping system should be
greater because of the technical reason: pumping should be performed through a tube of the
same diameter as the entrance hole of a turbo-pump, which is usually of 100 mm or bigger for
high-performance vacuum pumps. In the case of a smaller diameter of the tube a pumping
speed of the system will be decreased. One should also consider some space for mounting
pumps and vacuum valves.
As in the molecular flow approach, three differential pumping stages are necessary to
keep a pressure in the analyzer in 10-8 mbar range.
Unfortunately, neither the molecular flow approach nor the viscous flow approach is
applicable for a pressure in the sample cell of several mbar. The mean free path is determined
by the formula:
gaspkTσ
λ = (3-19)
where collision cross-section σgas can be well approximated by geometrical size of the
molecule. For water molecules at room temperature and pressure of 1mbar the mean free path
is λ≈0.2 mm, which falls into the transition region 0.01 mm<λ<1 mm between viscous and
molecular flows. Nevertheless one can interpolate the data received by these two approaches
taking into account that the results are not very different.
A scheme of the differential pumping system is shown on Figure 3-16.
Figure 3-16. Scheme of the differential pumping system. See text for the abbreviations.
gas1
gasn
LV /MFCn n
Vg
VP
V1V2
V3
VAn
LVP
TPPTPSCh
TP1TP2
TP3
TPAn
An
A1A0 A2 A3DS1 DS2 DS3SCh
VSCh
LV /MFC1 1
29
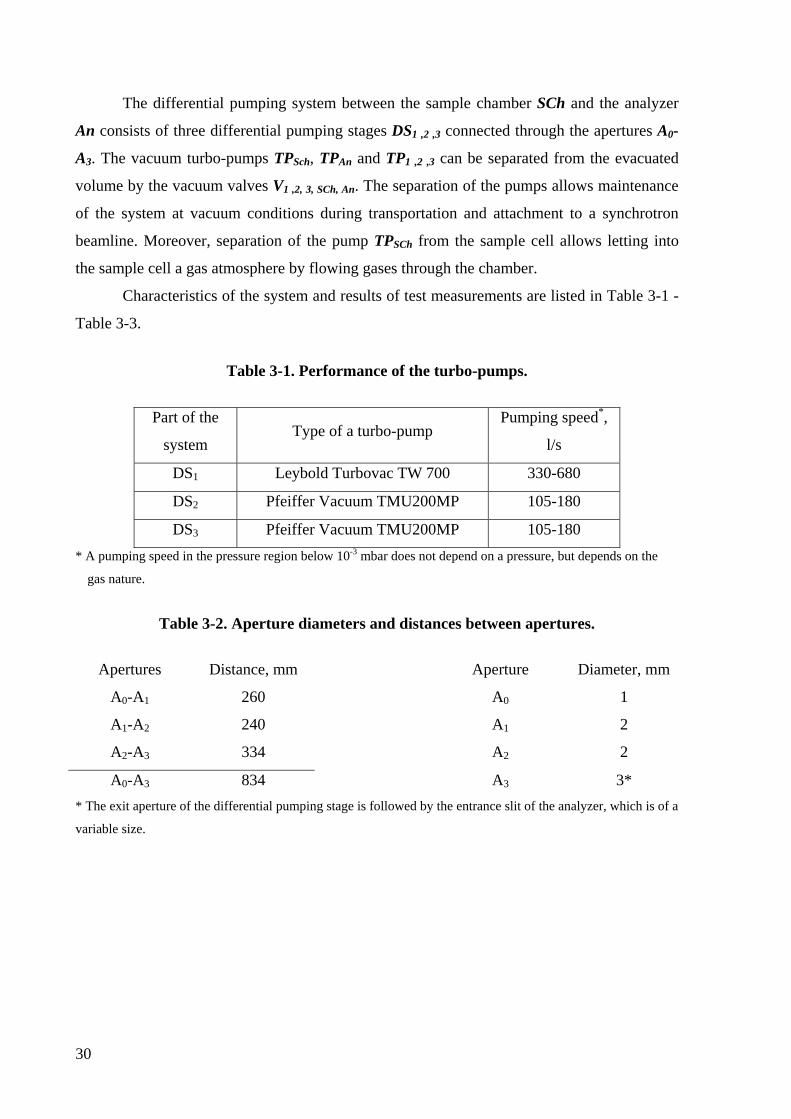
30
The differential pumping system between the sample chamber SCh and the analyzer
An consists of three differential pumping stages DS1 ,2 ,3 connected through the apertures A -
A0
3. The vacuum turbo-pumps TPSch, TPAn and TP1 ,2 ,3 can be separated from the evacuated
volume by the vacuum valves V1 ,2, 3, SCh, An. The separation of the pumps allows maintenance
of the system at vacuum conditions during transportation and attachment to a synchrotron
beamline. Moreover, separation of the pump TPSCh from the sample cell allows letting into
the sample cell a gas atmosphere by flowing gases through the chamber.
Characteristics of the system and results of test measurements are listed in Table 3-1 -
Table 3-3.
Table 3-1. Performance of the turbo-pumps.
Part of the
system Type of a turbo-pump
Pumping speed*,
l/s
DS1 Leybold Turbovac TW 700 330-680
DS2 Pfeiffer Vacuum TMU200MP 105-180
DS3 Pfeiffer Vacuum TMU200MP 105-180 * A pumping speed in the pressure region below 10-3 mbar does not depend on a pressure, but depends on the
gas nature.
Table 3-2. Aperture diameters and distances between apertures.
Apertures Distance, mm Aperture Diameter, mm
A0-A1 260 A0 1
A1-A2 240 A1 2
A2-A3 334 A2 2
A0-A3 834 A3 3* * The exit aperture of the differential pumping stage is followed by the entrance slit of the analyzer, which is of a
variable size.

In situ XPS (high-pressure XPS for catalytic studies)
Table 3-3. Results of a test of the differential pumping system with air.
p(SCh), mbar p(DS1), mbar p(DS2), mbar p(DS3), mbar p(An), mbar 1.28⋅10-7 4.06⋅10-9 2.60⋅10-8 1.29⋅10-8 3.38⋅10-8
1.02⋅10-6 4.33⋅10-9 2.64⋅10-8 1.29⋅10-8 3.38⋅10-8
1.07⋅10-5 7.72⋅10-9 2.63⋅10-8 1.29⋅10-8 3.38⋅10-8
1.08⋅10-4 4.08⋅10-8 2.65⋅10-8 1.29⋅10-8 3.38⋅10-8
1.15⋅10-3 3.75⋅10-7 2.85⋅10-8 1.30⋅10-8 3.38⋅10-8
1.50⋅10-2 4.06⋅10-6 4.62⋅10-8 1.30⋅10-8 3.41⋅10-8
0.11 3.65⋅10-5 2.15⋅10-7 1.40⋅10-8 3.58⋅10-8
0.22 7.88⋅10-5 4.18⋅10-7 1.51⋅10-8 3.67⋅10-8
0.50 2.24⋅10-4 1.10⋅10-6 1.86⋅10-8 4.10⋅10-8
1.04 5.77⋅10-4 2.63⋅10-6 2.62⋅10-8 5.07⋅10-8
2.01 1.32⋅10-3 5.89⋅10-6 4.33⋅10-8 7.28⋅10-8
5.03 3.44⋅10-3 1.60⋅10-5 9.74⋅10-8 1.43⋅10-7
10.2 6.67⋅10-3 3.34⋅10-5 1.96⋅10-7 2.62⋅10-7
Constant flow of the reaction gases is organized as it was briefly discussed above and
was shown on Figure 3-16. A more detailed scheme is shown on Figure 3-17.
Figure 3-17. Scheme of gas flow through the reaction chamber. See text for the abbreviations.
gas1
gasn
LV /MFCn n
Vg
QMS
TPMS
PTRMS
air
BP TPPTP1
DS1
A0 A1
SCh
LVQMS
LVP
LVm1
LVm2
VP
VSCh
LV /MFC1 1
31
32
Gases or liquid vapors are introduced into the sample chamber (sample cell) SCh
through the mass-flow controllers MFC1, .., n or through the leak valves LV1, .., n. The outlet of
the system is an aperture A0. Additional pumping can be provided through the process turbo-
molecular pump TPP. A gas composition in the reaction chamber is monitored by the
quadrupole mass-spectrometer QMS [41] and by the proton-transfer reaction mass-
spectrometer PTRMS [42]. The quadrupole mass-spectrometer is connected to the sample
chamber through the leak-valve LVQMS. The leak valve together with the turbo-pump TPMS
allows setting of a working pressure in QMS, which should be in the range 10-7-10-6 mbar.
PTRMS requires the inlet pressure of 1 bar. Therefore, it was connected to the outlet of the
backing pump BP. The outlet gas from the backing pump can be diluted with air if necessary.
PTRMS can be also connected to the backing pump of the TP1 if flow through the process
pump TPP is closed.

In situ XPS (high-pressure XPS for catalytic studies)
33
3.3.3 Electrostatic lenses.
3.3.3.1 Requirements for the electrostatic lens system.
As it was already discussed in previous chapters, the concept of the design of the
described (our) system is exchange of a most part of the electrostatic lens system of a standard
commercial analyzer by a home-made differential pumping system combined with a new
electrostatic lens system. It was desirable to fit several practical conditions for the new
electrostatic lens system:
1) Geometrical dimensions (diameter and total length) of the lens stages should fit the
dimensions of the differential pumping stages.
2) The number of independent lens elements should not exceed the number of high-
voltage power supplies in standard analyzer hardware. In this case lens voltages can be
driven by the standard hardware and software, just the voltage table should be changed.
3) Calculated voltages should not exceed a maximum voltage provided by standard power
supplies.
4) A best collection angle should be achieved.
5) A best focusing on the last aperture should be achieved, which means minimum
aberrations of the system.
6) A magnification coefficient (enlargement) should be fixed over the whole electron
kinetic energy range.
7) No significant deceleration should be applied to low energy electrons, otherwise
electron trajectories will be significantly affected by weak magnetic fields always
existing in an iron-containing system.
Additionally, several operation modes were planned for the electrostatic lenses:
1) The accelerating mode is a normal operation mode with acceleration of photoelectrons
in the first differential pumping stage.
2) The low-voltage mode is supposed to avoid gas discharge in the first stage at high
pressures by means of reducing voltage values.
3) The magnification mode should provide a high magnification to operate with a space-
resolution detector (such as for example, a CCD camera with a phosphor screen).
Unfortunately, in spite of a great number of publications existing on the topic of electrostatic
lens designing, no general theory for optimization of an electrostatic lens system exists.
General properties of an electrostatic lens, the approach chosen for the lens system
optimization and results of calculations will be presented bellow.

3.3.3.2 General information about electrostatic lenses.
Estimation of properties of an electrostatic lens usually includes two steps:
1) Estimation of a space distribution of electrostatic potential.
2) Estimation of trajectories of electrons or other charged particles in the
electrostatic field.
In the case of a high volume charge of the particle beam this approach will not work, which is
nevertheless not the case for a low-current electron flow in XPS (ca. 109 electrons/sec with 50
eV kinetic energy will induce on the aperture, where the influence is maximal, a voltage of
circa 0.07 V).
The electrostatic potential V in neglecting of an electron beam charge should satisfy
Laplace equation:
0=∆V (3-20)
where ∆ is the Laplace operator. Estimation of a potential distribution implies solution
of the Laplace equation with certain boundary conditions.
A trajectory of an electron can be calculated by solving the non-relativistic equation of
motion (which has a relativistic correction less than 1% for an electron kinetic energy of up to
10 KeV):
Vedtdvm ∇⋅= (3-21)
where v is an electron velocity vector, e and m are the charge and the mass of an
electron respectively and ∇ is the Hamilton operator.
In the case of the rotational symmetry the paraxial approximation (small r and r')
allows treating an electrostatic lens as a thick lens by analogy with geometrical optics (Figure
3-18).
34
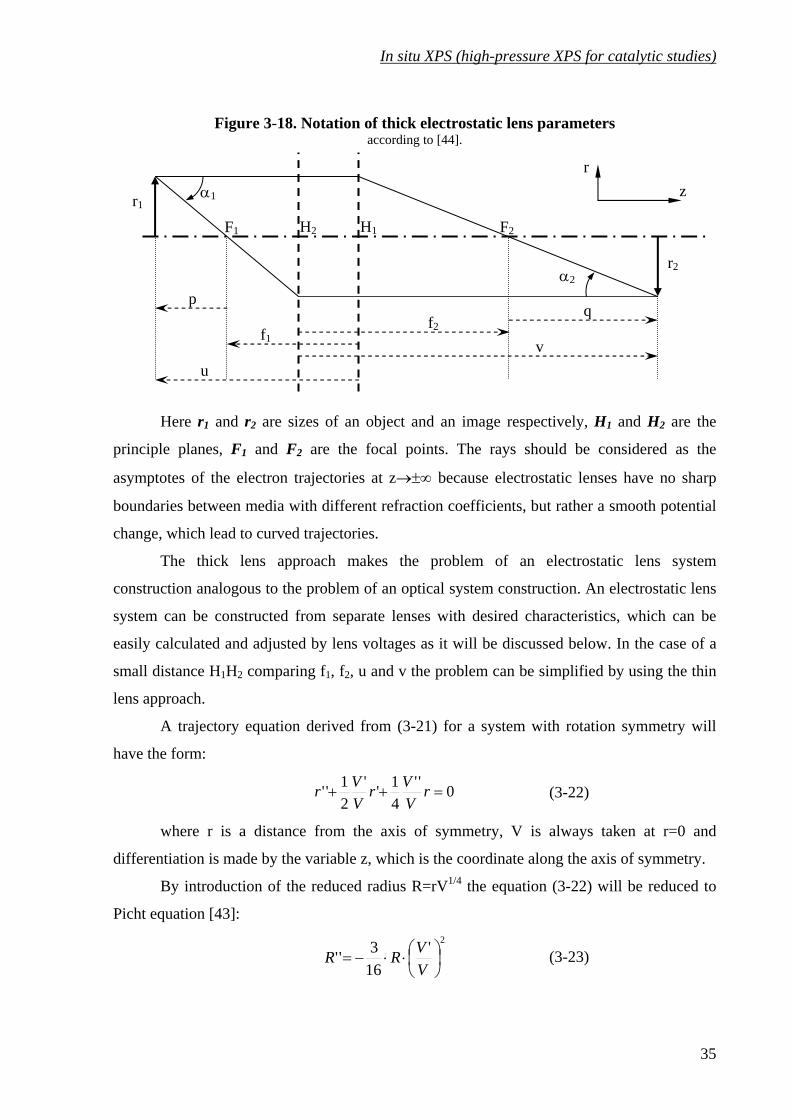
In situ XPS (high-pressure XPS for catalytic studies)
Figure 3-18. Notation of thick electrostatic lens parameters according to [44].
r1
rz
H1 H2 F2 F1
α2
α1
f1 f2
qp
vu
r2
Here r1 and r2 are sizes of an object and an image respectively, H1 and H2 are the
principle planes, F1 and F2 are the focal points. The rays should be considered as the
asymptotes of the electron trajectories at z→±∞ because electrostatic lenses have no sharp
boundaries between media with different refraction coefficients, but rather a smooth potential
change, which lead to curved trajectories.
The thick lens approach makes the problem of an electrostatic lens system
construction analogous to the problem of an optical system construction. An electrostatic lens
system can be constructed from separate lenses with desired characteristics, which can be
easily calculated and adjusted by lens voltages as it will be discussed below. In the case of a
small distance H1H2 comparing f1, f2, u and v the problem can be simplified by using the thin
lens approach.
A trajectory equation derived from (3-21) for a system with rotation symmetry will
have the form:
0''41''
21'' =++ r
VVr
VVr (3-22)
where r is a distance from the axis of symmetry, V is always taken at r=0 and
differentiation is made by the variable z, which is the coordinate along the axis of symmetry.
By introduction of the reduced radius R=rV1/4 the equation (3-22) will be reduced to
Picht equation [43]: 2'
163'' ⎟
⎠⎞
⎜⎝⎛⋅⋅−=
VVRR (3-23)
35

From this equation one can conclude that R'' always has a sign which is opposite to the
sign of R. This means that an electron trajectory is always curved towards the z axis and a
lens is always convergent.
A distribution of a potential can be calculated numerically using equation (3-20) and
boundary conditions. After this the lens cardinal points can be estimated by numerical
simulation of two principle rays (those are parallel to the optical axis z at z→+∞ and at z→-
∞) using the equation (3-23). Such an approach is realized in the program LENSYS [44].
Potential distributions for some lens geometries were calculated numerically and stored in a
data file. This approach allows fast adjustment of lens voltages without performing extensive
and time consuming calculations. Lens parameters received by this method can be further
adjusted by other software. The program SIMION [45] calculates a potential distribution with
a user-defined lens geometry, space step and lens voltages. Electron trajectories are calculated
by use of equation of motion (3-21) without the paraxial approximation. Such a method
allows achievement of more realistic results comparing the program LENSYS, while
consuming more time and computer resources.
The figure of merit of a system design besides the collection angle should be a
minimum size of the spot of an electron beam on the last aperture, which means minimum
spherical aberrations of the system. The spot size of a mono-energetic electron beam in the
image plane is given by the formula: 30αsMCr = (3-24)
where r is a spot radius, M is a magnification coefficient, α0 is a collection half-angle
and Cs is a coefficient of spherical aberrations. The problem of minimization of aberrations
thus, reduces to the problem of minimization of the product MCs or even of Cs if M is fixed.
The formula for an aberration coefficient is expressed [44] as:
dzRRTTTTTT
VR
VCs ⎥⎦
⎤⎢⎣⎡ +−+
⋅= ∫
∞
∞−
''4)'2
11'53(64
1 2242/1
4
2/10
(3-25)
where V is an axial potential, T(z)≡V'(z)/V(z), V0=V(-∞) and R(z) corresponds to the ray
which passes through the axial object point with the unit slope.
This equation is hard to apply directly to optimization of lens geometry and voltages,
but some practical conclusions can be derived for minimization of Cs:
1) R should be minimized, i.e. electron trajectories should be as close to the axis
as possible
2) R' should be minimized, i.e. electron trajectories should be as smooth as
possible. 36

In situ XPS (high-pressure XPS for catalytic studies)
37
Unfortunately, no practically useful relation can be drawn between an aberration
coefficient of the whole lens system and aberration coefficients of separate lenses as can be
done for example for focal properties. The only rule is an overall aberration coefficient will
decrease/increase with decreasing/increasing of any aberration coefficient. Nevertheless,
contributions of different parts of a lens system into an overall aberration coefficient do not
have to be equal or even of one order of magnitude.

3.3.3.3 Calculation of the electrostatic lens system.
The general idea of the electrostatic lens system design was developed by analogy
with geometrical optics, i.e. the system is constructed from a limited number of thin lenses.
The differential pumping system consists of three stages. This means that the
electrostatic lens system should also contain three independent parts (see Figure 3-19). The
first two stages require development of a lens system, while the third one was initially
designed as a differential pumping stage and should not be changed. The third part is intended
for work with photoelectrons of one tenth of initial photoelectron kinetic energy Ek0. This
means that the first lens element of the third lens stage and correspondingly, the last lens
element of the second lens stage should have the voltage of -0.9⋅Ek0, supposing Ek0 is
measured in eV. Photoelectrons are decelerated by the third stage to the kinetic energy equal
to the pass energy of the analyzer Ep.
Figure 3-19. Electron kinetic energy in the lens system.
Deceleration of photoelectrons from Ek0 to 0.1⋅Ek0 can be done even in the first stage
or in the second stage or in both step-by-step. It was performed in the second stage because it
is more preferable to keep a high electron energy in the first stage where a gas pressure can be
quite high and consequently, scattering of low-energy electrons can be significant.
The concept of the lens design is shown on Figure 3-20.
38

In situ XPS (high-pressure XPS for catalytic studies)
Figure 3-20. Concept of the lens design by analogy with geometrical optics.
a. Acceleration and low-voltage modes
b. Magnification mode
From this drawing it is obvious that the lens L1-1 as well as the lens L1-1' should be as
close to the aperture A0 as possible to provide a maximum collection angle. A focal length of
the lens L1-1 should be the same as the distance A L0 1-1, while a focal length of the lens L1-1'
should satisfy (in the approximation of a thin lens) the equation:
1'11'110
111ALLAf −−
+= (3-26)
The first part of the system in the acceleration mode should be symmetrical with
respect to the center.
Fast fitting of lens geometry and voltages was performed in the program LENSYS
[44]. This program is able to estimate the focal properties of a single lens or a small lens
system and to calculate the aberration coefficient Cs and magnification M. Fine adjustment of
the voltages was performed in the program SIMION ([45]).
The minimum length of the differential pumping system was estimated to be 70 cm
(see page 28). In reality the length should be increased to 83 cm to provide a space for
mounting turbo-pumps and for assembly work. Further increasing of the length would not
influence the photoelectron collection of our system in a positive way. The lengths of the
differential pumping stages are listed in Table 3-2 on page 30. Choice of the inner diameter of
lens elements determines the length of a lens stage in units of the diameter. Decrease of the
diameter allows decreasing of an aberration. Nevertheless, too small diameter will limit the
collection angle. The diameter of the lens elements in the first and second stages was chosen
to be 40 mm. It is less than of 60 mm, which is the inner diameter of the elements of the
39

40
standard analyzer [46]. The third differential pumping stage was not changed, which implies
the inner diameter of the lenses in this stage of 60 mm.
The first stage should keep an electron kinetic energy at exit aperture A1 to be the
same as after leaving the sample (KE=Ek0). The magnification in this stage should be about
unity for the acceleration and low-voltage modes and about 5 for the magnification mode.
The second stage should decelerate photoelectrons to 0.9 of initial kinetic energy Ek0
to provide the interfacing with third stage that was designed by the manufacturer of the
analyzer. The magnification of the third lens stage should be about unity for all the modes.
Lens voltages for the first two lens stages can be calculated for some electron kinetic energy
and afterwards scaled linearly for any other one.
Five independent power supplies from the standard analyzer hardware are available
for the first two stages: This is the limit for a number of lens elements.
As it was already discussed before, the first lens should be situated as close to the inlet
aperture as possible to provide a best possible photoelectron collection angle. For such a
condition it would be reasonable to choose for the first lens stage the symmetrical scheme
with two lenses L1-1 and L1-2 as it is drawn on Figure 3-20a. This scheme provides the unity
magnification with minimal aberrations because a photoelectron trajectory will be parallel to
the z-axis on a most part of the way, which is the smoothest and closest to the axis trajectory.
The lens elements of the lens L1-1 can be also used for the lens L1-1' in the magnification
mode. The scheme for the magnification mode (Figure 3-20b) will also provide a desired
magnification coefficient and aberrations will be minimized. The lens geometry for the
acceleration mode was calculated taking into account the maximum voltage of 3500 V
provided by the power supplies, which should correspond to the upper limit of electron KE
range of 1400 eV. Three-element lenses L1-1 and L1-2 were used because a two-element lens
cannot satisfy simultaneously the voltage and geometrical conditions. A four-element lens
would not bring significant improvement of aberration, but will need an additional power
supply. The lenses L1-1 and L1-2 are formed by the electrodes #1, #2, #3-#5 and #3-#5, #6, #7
respectively (see Figure 3-21 and Table 3-4).

In situ XPS (high-pressure XPS for catalytic studies)
Figure 3-21. Electron trajectories for the first two lens stages. (calculated in SIMION)
Acceleration mode
#10a #9 #8 #7 #6 #5 #2 #3 #4 #1
Magnification mode
Low-voltage mode
Table 3-4. Table of lens voltages for the first two stages. D=40 mm
Voltage/Ek0, V/eV
Electrode Length, mmAccelerationmode
Magnificationmode
Low-voltage mode
#1 40 0 0 #2 20 2,5
0
#3 20 -0,9
#4 20 -0,5 #5 100
-0,55
#6 20 2,5
-0,875
#7 40+48 0 0
0 #8 112 -0,9 -0,9 -0,9 #9 40 -0,4 -0,5 -0,45
#10a 40 -0,9 -0,9 -0,9 M 2 5 2
Cs/D, rad3 35 21 45 MCs/D, rad3 70 105 90
The length of electrode #1 is determined by geometrical reasons and the length of
electrode #2 was set to the minimum value of D/2 at which the electrical field still can be
found as a superposition of the electrical fields of contiguous electrode pairs. The voltage of
electrode #3-#5 may be experimentally adjusted, while voltages #2 and #6 are fixed to the
calculated value. In the magnification mode the four-element lens L1-1', consisting of
electrodes #1, #2-#3, #4, #5-#7, is employed. Electrode #4 here also plays an adjustable role.
41
42
For the low-voltage mode two two-electrode lenses are enough. The lenses are formed by
electrodes #1-#2, #3-#6 and #3-#6, #7 respectively. The lens geometry for this mode is
slightly asymmetrical, which nevertheless, does not worsen lens characteristics, but makes it
possible to adjust the focusing by one voltage only. The mode has the advantage of low
voltage values, which allow to avoid gas discharge at high pressures in the sample cell.
However, photoelectrons in this mode are decelerated to 0.125⋅Ek0 on a most path, which is 5
eV for Ek0=40 eV. Photoelectrons of such a low kinetic energy can be easily deflected by a
relatively weak electric or magnetic field. Therefore, the acceleration mode is more preferable
as compared to the low-voltage mode if no danger of gas discharge is present.
Estimation of the pressure at which gas discharge appears is not trivial in our case
because experimental data for a breakdown voltage are usually available for pressure⋅distance
values starting from ~1 Torr⋅mm (1 Torr= 1.32 mbar), which corresponds to the breakdown
voltages of several hundred volts. In our case the maximum voltage difference between
neighbor lens elements is 3500 V. The gap between lens elements is 2 mm and a maximum
pressure in the first differential pumping stage is in the 10-3 mbar range (see Table 3-3). This
corresponds to a maximum pressure⋅distance value in the 10-3 Torr⋅mm range. Experimental
curves for the breakdown voltage vs. pressure⋅distance (so-called Paschen curves) ([47], [48],
[49]) were extrapolated for low pressure⋅distance values to obtain the information for the
required region. A pressure at which breakdown should occur at 3500 V on the distance of 2
mm is 0.1-0.7 mbar for such gases as H2, NO, CO2, SO2, Air [47] and Ar [48]. Therefore, no
gas discharge is expected for diatomic and monoatomic gases. Nevertheless, for bigger
molecules such as for example, some saturated hydrocarbons (normal pentane, hexane,
heptane, octane and decane) gas discharge in the first differential pumping stage can occur
already at 0.4⋅10-5-2⋅10-4 mbar [49], which corresponds to a pressure in the sample cell of 0.1-
0.5 mbar.
The second lens stage is the same for all three modes. The electrons here should be
decelerated to 0.1⋅Ek0, which means that the voltage of the last electrode should be -0.9⋅Ek0 V,
where Ek0 is in eV units. This stage is formed by the two-element lens L2-1 (electrodes #7, #8)
and by the three-element lens L2-2 (electrodes #8, #9, #10a). A voltage of the electrode #8 is
fixed to the same value as a voltage of the electrode #10a and a voltage of electrode #9 can be
adjusted. The calculated voltages for the first two stages are listed in Table 3-4.
The third lens stage was designed by the manufacturer. Voltages cannot be scaled just
with photoelectron kinetic energies in this stage as it was done in the first and second stages.

In situ XPS (high-pressure XPS for catalytic studies)
The stage consists of three elements: #10b-#11, #12, #13-#14 (see Figure 3-22 and Table
3-5).
Figure 3-22. Electron trajectories for the third lens stage (calculated in SIMION).
Ek0/Ep=20
#14 #13 #12 #10b #11
Ek0/Ep=200
Ek0/Ep=100
Table 3-5. Table of lens voltages for the third stage. D=60 mm.
Electrode Length, mm Voltage/Ep, V/eV #10b 63 #11 29 -0.9Ek0/Ep
#12 62 -Ek0/Ep+spline(Ek0/Ep) #13 91 #14 89 -Ek0/Ep+1
The kinetic energy of photoelectrons at the entrance of the stage should be 0.1⋅Ek0 and
consequently, the voltage on the first lens electrode (#10b-#11) is -0.9Ek0 V (here Ek0 is in
eV). At the exit of the stage photoelectrons should have the kinetic energy equal the pass
energy of the analyzer Ep. Therefore, the voltage of the third lens element is -Ek0+Ep V (Ek0
and Ep are in eV). A voltage of the second element should be a function of the ratio Ek0/Ep.
The voltage was calculated for several electron kinetic energies and the spline function
43

(Figure 3-23) is used by the voltage-driving software. A collection angle and an aberration of
this stage is a function of the ratio Ek0/Ep (see Figure 3-22).
Figure 3-23. Spline function for the voltage in the third stage.
0 50 100 150 2004
5
6
7
8
9
splin
e
Ek0/Ep
A scheme of the calculated electrostatic lenses and of the differential pumping system
is presented on Figure 3-24 and a general view of the spectrometer is shown on Figure 3-25.
44

In situ XPS (high-pressure XPS for catalytic studies)
Figure 3-24. Scheme of the differential pumping system and electrostatic lenses.
45

Figure 3-25. Scheme of the in situ XPS instrument.
Turbopumps
Analyzer X-ray
46

In situ XPS (high-pressure XPS for catalytic studies)
3.4 Peculiarities of data analysis in high-pressure XPS
Data analysis in XPS usually includes element identification, estimation of
stoichiometric ratios and estimation of an oxidation state from a chemical shift or from fitting
the peak shape by sum of several components. Work with a laboratory X-ray source implies
also subtraction of satellites appearing because of non-monochromatic X-ray, which is
nevertheless, not the case for monochromitized synchrotron radiation.
Though the procedure for XPS spectra analysis is well described in many publications
(see for example [22]), analysis of high-pressure XPS data differ in some points from ordinary
XPS.
Firstly it is concerning a BE shift, which appears because of charging. Gas
composition, pressure and sample temperature influence the value of charging (see for
example Figure 3-26). In addition, our setup is constructed for work with synchrotron
radiation. This means the presence of variations in X-ray intensity and as a consequence, the
presence of variations in a sample surface charging. This fact makes charge correction much
more complicated comparing ordinary XPS in the case of an insulating or semiconducting
material. One should always have a reference in the spectrum for BE correction, such as for
example, the O1s peak for vanadium and titanium oxides or the Au4f peak from gold atoms
deposited on the surface especially for this reason*.
Figure 3-26. Apparent binding energy of the O1s peak of a VPO catalyst depending on a temperature [81].
The catalyst was heated up in a mixture of n-butane/helium and oxygen at the total pressure of 2 mbar.
50 100 150 200 250
Temperature / °C
530
535
540
545
O1s
App
aren
t Bin
ding
Ene
rgy
(eV
)
* Nevertheless, gold deposition is not recommended for catalysts because gold nanoparticles are known
to be catalytically active.
47
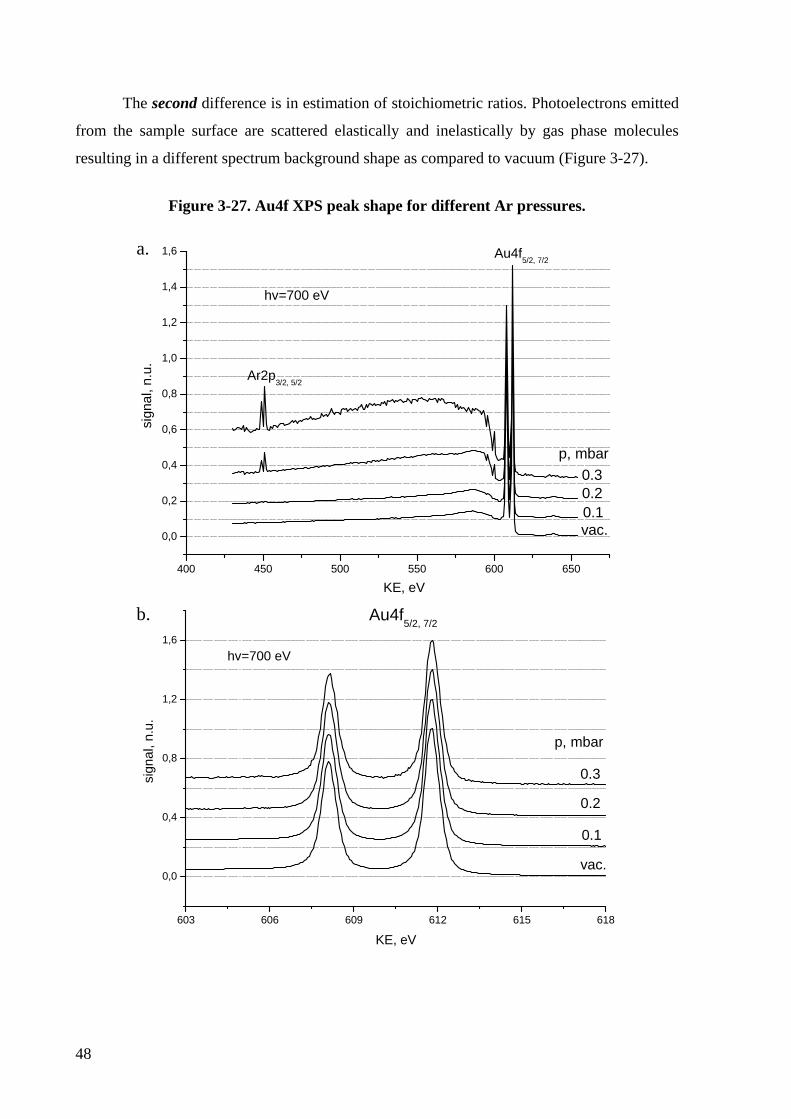
The second difference is in estimation of stoichiometric ratios. Photoelectrons emitted
from the sample surface are scattered elastically and inelastically by gas phase molecules
resulting in a different spectrum background shape as compared to vacuum (Figure 3-27).
Figure 3-27. Au4f XPS peak shape for different Ar pressures.
400 450 500 550 600 650
0,0
0,2
0,4
0,6
0,8
1,0
1,2
1,4
1,6
Ar2p3/2, 5/2
p, mbar0.30.20.1vac.
hv=700 eV
Au4f5/2, 7/2
sign
al, n
.u.
KE, eV
603 606 609 612 615 618
0,0
0,4
0,8
1,2
1,6
p, mbar
Au4f5/2, 7/2
hv=700 eV
0.3
0.2
0.1
vac.
sign
al, n
.u.
KE, eV
b.
a.
48
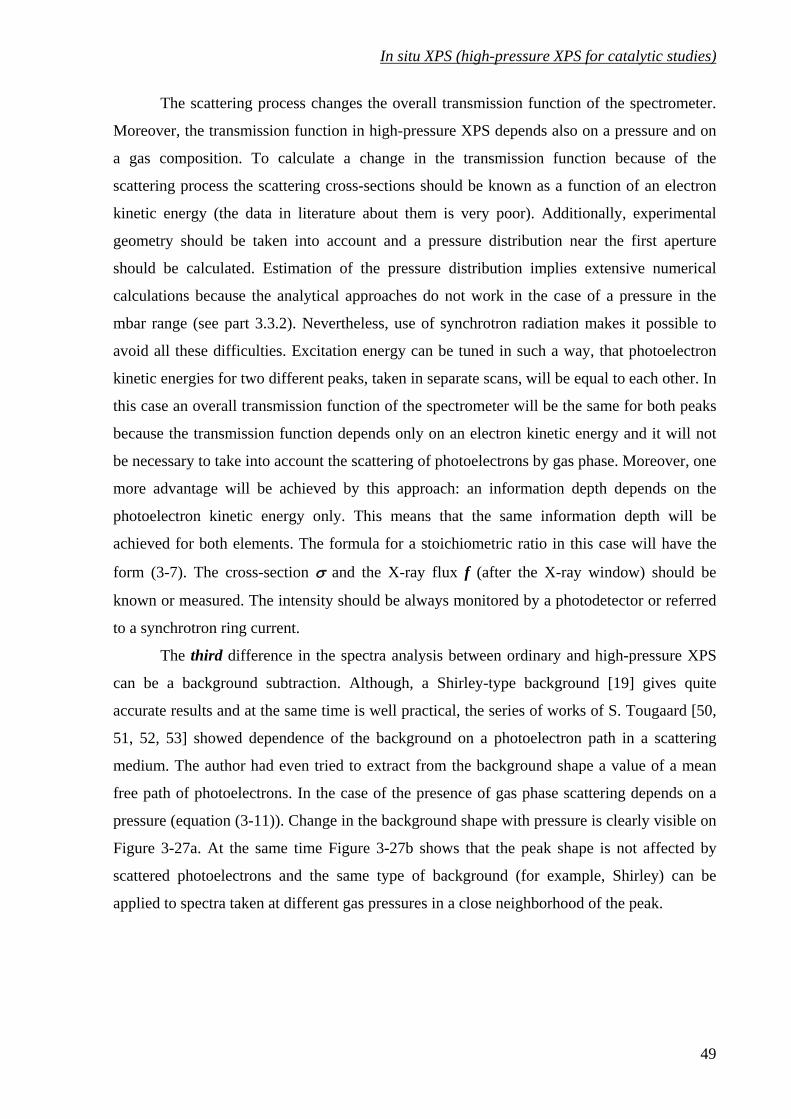
In situ XPS (high-pressure XPS for catalytic studies)
49
The scattering process changes the overall transmission function of the spectrometer.
Moreover, the transmission function in high-pressure XPS depends also on a pressure and on
a gas composition. To calculate a change in the transmission function because of the
scattering process the scattering cross-sections should be known as a function of an electron
kinetic energy (the data in literature about them is very poor). Additionally, experimental
geometry should be taken into account and a pressure distribution near the first aperture
should be calculated. Estimation of the pressure distribution implies extensive numerical
calculations because the analytical approaches do not work in the case of a pressure in the
mbar range (see part 3.3.2). Nevertheless, use of synchrotron radiation makes it possible to
avoid all these difficulties. Excitation energy can be tuned in such a way, that photoelectron
kinetic energies for two different peaks, taken in separate scans, will be equal to each other. In
this case an overall transmission function of the spectrometer will be the same for both peaks
because the transmission function depends only on an electron kinetic energy and it will not
be necessary to take into account the scattering of photoelectrons by gas phase. Moreover, one
more advantage will be achieved by this approach: an information depth depends on the
photoelectron kinetic energy only. This means that the same information depth will be
achieved for both elements. The formula for a stoichiometric ratio in this case will have the
form (3-7). The cross-section σ and the X-ray flux f (after the X-ray window) should be
known or measured. The intensity should be always monitored by a photodetector or referred
to a synchrotron ring current.
The third difference in the spectra analysis between ordinary and high-pressure XPS
can be a background subtraction. Although, a Shirley-type background [19] gives quite
accurate results and at the same time is well practical, the series of works of S. Tougaard [50,
51, 52, 53] showed dependence of the background on a photoelectron path in a scattering
medium. The author had even tried to extract from the background shape a value of a mean
free path of photoelectrons. In the case of the presence of gas phase scattering depends on a
pressure (equation (3-11)). Change in the background shape with pressure is clearly visible on
Figure 3-27a. At the same time Figure 3-27b shows that the peak shape is not affected by
scattered photoelectrons and the same type of background (for example, Shirley) can be
applied to spectra taken at different gas pressures in a close neighborhood of the peak.

50
3.5 Monitoring the catalytic performance:
gas-phase XPS peaks, MS and PTRMS.
The most common techniques for reaction products registration in catalytic
investigations are MS and gas chromatography. Our system provides the possibility to register
reaction products by PTRMS and conventional MS. A scheme of connection of the mass-
spectrometers is drawn on Figure 3-17 (page 31).
A description of the conventional quadrupole mass-spectroscopy technique with
ionization of gas molecules by the electron beam can be found in many literature sources (for
example in [54]). Our system employs the possibility to obtain mass-spectra of a gas inside
the sample cell with a BALZERS PRISMA™ quadrupole mass-spectrometer [41] connected
to the sample cell as it is shown on Figure 3-17. The operating pressure in this mass-
spectrometer should be in the 10-7-10-6 mbar range. To keep this pressure the mass-
spectrometer volume is pumped by the turbopump TPMS. A gas flow and consequently, a
pressure in the mass-spectrometer are regulated by the leak-valve LVQMS. A gas flow through
the leak valve is negligible comparing a gas flow through the aperture A0 and through the
process pump TPP, if the leak valve LVP and the valve VP are open. The conventional mass-
spectrometry technique has nevertheless, quite limited suitability for detection of big
molecules, such as for example, a molecule of maleic anhydride, because of a complicated
dissociation-fragment pattern. To register such kind of molecules the proton transfer reaction
mass-spectrometry (PTRMS) was applied. A description of this not widespread technique can
be found in [55]. A schematic diagram of the PTRMS instrument [42] is shown on Figure
3-28.

In situ XPS (high-pressure XPS for catalytic studies)
Figure 3-28. Schematic diagram of the PTRMS system according [55].
H Ovapor
2
pump pump
high vacuumpump
gas to beanalyzed
hollowcathode
ion detectiondrift tube
Diluted in a buffer gas (which is usually air) investigated gas is supplied to the drift
tube. H3O+ ions are produced in the hollow cathode by ionization of water molecules and
injected into the same drift tube. The ions collide with buffer gas molecules without reacting
with them and thus, being kinetically thermalizied. Once the ion meets an investigated gas
molecule R it may undergo the reaction
H3O+ + R → RH+ + H2O (3-27)
To make this reaction possible the molecule R should have a higher proton affinity as
compared with a water molecule. Therefore, not all chemical compounds can be investigated
by the PTRMS method. For example, butane and CO2 molecules have lower proton affinity
than water, but maleic anhydride can be readily protonized by H3O+. Produced RH+ ions will
be further moved in the drift tube by electrical field and registered by the ion detection
system, which is analogous to the detection system of a quadrupole mass-spectrometer. A
scheme of connection the PTRMS instrument to the sample cell is also drawn on Figure 3-17.
In the described experiment the investigated gas is compressed by the baking pump BP and
diluted with air or nitrogen afterwards. The PTRMS instrument allows measurement of an
absolute concentration of investigated gas molecules in the drift tube, which is proportional to
the concentration in the sample cell.
Another type of a technique for registration of gas-phase reaction products is analysis
of gas-phase XPS peaks. Such kind of analysis was performed in [33] to monitor O2, CO2,
H2O, CH2O and CH3OH presented in gas phase during the process of selective oxidation of
methanol to formaldehyde on a copper catalyst. This technique is very useful for in situ XPS
because it does not require any additional equipment such as a mass-spectrometer.
51

52
Unfortunately, gas peaks are very sensitive to the charging effect and the analysis is almost
impossible with insulating samples.

Vanadium phosphorus oxide catalyst
53
4 Vanadium phosphorus oxide catalyst
The object of this investigation is a vanadium phosphorus oxide catalyst, which is an
important industrial catalyst for oxidation of n-butane to maleic anhydride. In part 4.1 will be
given a short introduction about this catalyst including a state of the catalyst in modern
economics, conditions of operation and catalyst preparation procedures. A review of
published up to date experimental data and theoretical ideas concerning the active species on
the VPO surface is given in part 4.2. Parts 4.3-4.8 are devoted to the experimental procedure,
experimental data and its analysis. The experimental results will be discussed in part 4.9 from
the point of view of their meaning for understanding of the nature of catalytically active
species and the strategy of improvement of a VPO catalyst.
4.1 VPO catalyst for industrial production of maleic
anhydride from n-butane.
Maleic anhydride (MA) is an intermediate in industrial production of such chemicals
as unsaturated polyester resins, fumaric and maleic acids, lube oil additives, maleic
copolymers, agricultural and others (Figure 4-1).
Figure 4-1. Consumption of MA in different fields of economics in the United States according [60].
Maleic anhydride
Unsaturated polyestr resins
63 %
Fumaric andmalic acid
5 %
Maleic copolymers
8 % Agriculturalchemicals
2 %
Lube oiladditives
11 %
Others
11 %
Marine 16.2 %
Construction 34.2 %
Corrosion 10.4 % Transportation 15.0 %
Electrical 1.9 %
Other 22.3 %
The main consumption of MA is in production of polyester resins, which are widely
used in construction, boat-building, automotive and electrical industries in the form of so-
called glass reinforced plastics. MA was first prepared in 1830s [56, 57] and commercial
manufacture began a hundred years later in 1933 by National Aniline and Chemical Co., Inc.,
using a process based on benzene oxidation catalyzed by the vanadium oxide catalyst [58].
Benzene had been used as the only raw material for industrial production of MA till 1970s
then economical reasons and recognition of benzene as a hazardous chemical intensified
search for an alternative feedstock. Various C4 compounds were evaluated as possible
substitutes for benzene and finally, industry came to production of MA by oxidation of n-
butane catalyzed by vanadium phosphorus oxide (VPO), which was discovered as a catalyst
in 1966 [59]. Nowadays (in 2000) 100% of MA in the US and more than 65% of the world
54

Vanadium phosphorus oxide catalyst
amount (1359 kiloton/year) [60] are produced by the oxidation of n-butane (Figure 4-2) and
VPO is the only industrial catalyst for this reaction.
Figure 4-2. Reaction of n-butane oxidation to MA
C4H10 + 7/2 O2 → C4H2O3 + 4H2O ∆H=-1236 kJ/mol C4H10
n-butane maleic anhydride
Three different types of industrial process for obtaining MA from n-butane can be
distinguished, i.e. the fixed-bed process, the fluidised-bed process and the recirculating-solids
process.
A fixed-bed reactor consists of a number of tubes, which are packed with coarse
catalyst bodies. The reactants (n-butane and air) flow through these tubes. As far as a mixture
of n-butane in air has the concentration explosion limit of about 2 vol.% of n-butane, special
care should be taken in this process about mixing and pre-heating of the gases before the
reaction zone. High exothermicity of the reaction brings also the problem of hot spots in the
reactor, which should be solved by a complicated cooling design or by reducing a catalyst
activity.
Application of a fluidised-bed reactor reduces the problems of the gas explosivity and
hot spots, but puts strict limitations on a catalyst particle size (10-150 microns). In this
process reaction gases flow upward through the bed of the catalyst particles. A gas flow is
adjusted in such a way, that the force of the flow on a catalyst particle is equal to a weight of
the particle and the catalyst bed is brought in continuous motion.
DuPont company operates the process in the recirculating-solids reactor. In this kind
of process the oxidation of n-butane by lattice oxygen of the catalyst and regeneration of the
catalyst by gas-phase oxygen are carried out in two separate reaction zones. Such a process
allows increased selectivity towards MA and almost completely solves the problem of
explosivity, but because of difficulties to control the regeneration process on a large industrial
scale this process had not got wide spread up to now.
Technical peculiarities impose different requirements for properties of a catalyst
material in these processes, i.e. different requirements for heat conductance, particle size,
attrition resistance, activity, ability to regenerate and to supply bulk oxygen to the surface.
Consequently, the term "catalyst optimization", which often appears in scientific literature 55
56
concerning VPO has sense only in view of certain process. Usually people understand by this
term increasing of selectivity of a catalyst for the fixed-bed-process, as the mostly used in the
industry one (more than 50% of MA production [60]).
One should distinguish bulk and supported VPO catalysts. Although significant efforts
were performed to synthesize a supported VPO catalyst [61], [62], [63], the selectivity of the
synthesized samples is far from a bulk VPO catalyst and thus, supported VPO still cannot be
considered as a suitable candidate for industry. Nevertheless, studies on supported VPO will
be referred further in connection with searching of catalytically active species.
A bulk VPO catalyst is usually produced by activation of a catalyst precursor at
reaction conditions for several hundred hours. The indication for the catalyst formation which
is usually used in the preparation is formation of the dominant vanadyl pyrophosphate
(VO)2P2O7 phase monitored by XRD.
There are three well-established ways to prepare hemihydrate, which is the precursor
for a VPO catalyst. In literature (see for example [64, 76]) they are referred to as VPA
(aqueous route), VPO (alcoholic route) and VPD. The first route, VPA involves preparation of
the precursor by reduction of V2O5 in aqueous solution of HCl. In the second, VPO, route
alcohol is used as a solvent and reductant of V2O5. This method is currently used for
preparation of an industrial VPO catalyst. In the VPD method VOPO4⋅H2O is first prepared
from V2O5 and H3PO4 and then reduced using alcohol. These three preparation routes lead to
catalysts with different surface areas and intrinsic catalytic performances. Additionally, there
are two ways to improve catalytic performance and a surface area, i.e. doping of a catalyst by
metal atoms (so-called promotion) and mechanotreatment of the precursor. Although all of
these methods lead to different catalytic performances, it is believed that they influence the
number and distribution of the active species, but not the nature of them. In other words,
investigation of the nature of active species can be performed with a catalyst having a
composition most suitable for the experimental method. The presence of metal dopants and
alcohol molecules would complicate the in situ XPS investigation. This is why a catalyst
prepared by the VPA route without promoters was chosen for in situ XPS studies.

Vanadium phosphorus oxide catalyst
57
4.2 Catalytically active species of a VPO catalyst.
Literature review.
Vanadium oxides are widely used in catalysis thanks to the existence of a wide range
of vanadium oxidation states and the ability of vanadium atoms to easily convert between
them (so-called redox behavior). This makes a vanadium atom a good center for
accommodation and release of oxygen atoms during the catalytic cycle of oxidation, reduction
and oxidative dehydrogenation reactions. Performance of a catalyst depends on several factors
such as the structure and the morphology of the material, its redox properties and elemental
composition. The right oxidation state and geometrical arrangement of the active species and
whether they should be in the form of a certain crystalline phase or dispersed on the surface
are the questions which are always discussed in connection with a vanadium oxide catalyst.
Despite the long time of use of the VPO catalyst in industry and numerous investigations of
the catalyst, still there is no agreement about the nature of the catalytically active species of
the catalyst surface and about the reaction mechanism. Though a good literature review
concerning searching of the active species of the VPO catalyst can be found in some works
issued not a long time ago [65, 66, 67], some publishing activity in this field was observed
since that time. In this chapter key works in this field will be briefly reviewed.
Various VPO phases are discussed in literature concerning n-butane oxidation (see for
example [68], [69]). These are the phases with vanadium in 5+ oxidation state (for example,
α-, β-, γ-VOPO4), 4+ oxidation state (for example, (VO)2P2O7) and 3+ oxidation state (for
example, VPO4). It is generally accepted that well crystallized vanadyl pyrophosphate
(VO)2P2O7 (which is a V4+ phase) is the major phase which is presented in an industrial VPO
catalyst after a long operation time. Several groups suggested that the (100) crystalline plane
of vanadyl pyrophosphate (VO)2P2O7 is the most catalytically active VPO surface while other
VPO phases are thought to be much less active or even detrimental for the activity of a sample
[70, 71, 72]. T. Shimoda et al. [70] performed XRD, IR and XPS investigations of differently
prepared VPO catalysts in order to estimate a responsible for MA formation crystalline phase.
As a result the raw of catalyst selectivity was drawn: (VO)2P2O7 > X2, X1 > α-, β-VOPO4,
where X1 and X2 were some V5+ phases revealed by XRD. A selectivity of (VO)2P2O7 was at
least 50% higher than a selectivity of any other phase. V. Guliants et al. [71] have followed by 31P NMR, XRD and Raman spectroscopy evolution with activation time of catalyst precursors
prepared by different method. Correlation of a catalytic performance with a bulk composition
of the catalysts determined by XRD allowed authors to conclude that a best catalyst contains

58
only highly crystalline vanadyl pyrophosphate. However, it was also concluded that XRD
alone is not effective for identifying the presence of other minor phases. Coupling of XRD
with two other techniques helped to identify VOPO4 phases, which have V atoms in 5+
oxidation state, to be detrimental for a catalytic activity and vanadyl metaphosphate VO(PO3)2
to be inactive. Similar experiments enforced by electron microscopy were performed by the
same group several years later [72]. It was observed that a disordered surface layer of ca. 2
nm thickness covering the (100) planes of (VO)2P2O7 disappears with time on stream yielding
a solid with a high steady-state catalytic performance. This led authors to the conclusion about
responsibility of solely (100) planes of (VO)2P2O7 for an activity and a selectivity of VPO
catalyst. Nevertheless, in situ Raman spectroscopy in these experiments showed the
appearance of VOPO4 phases when the precursor was transformed to the active catalyst and
the catalyst obtained at this moment contained only poorly crystalline (VO)2P2O7 which was
fully crystallized only after hundreds of hours under reaction conditions. This discrepancy
was referred to the low activity and selectivity of the freshly prepared catalyst.
In situ electron microscopy and selected-area electron diffraction studies were
performed by P.L. Gai and K. Kourtakis on VPO samples in various gas atmospheres at
400°C [5]. On the basis of the experimental data authors built a model of the defect formation
mechanism during (VO)2P2O7 reduction. The presence of a certain type of oxygen vacancies
in (VO)2P2O7 structure was concluded to be necessary for n-butane activation (hydrogen
abstraction), i.e. vanadium atoms in an oxidation state lower than 4+ are necessary.
Other investigations indicate participation in the catalytic process of V5+ species in the
form of VOPO4 phases, surface insulated centers, surface and bulk crystalline defects [73, 74,
75, 76]. Importance of presence of both V4+ and V5+ in the active catalyst was stressed in
these works. J.-C. Volta with colleagues showed in [73, 74] importance for the catalytic
process of the presence of limited number of V5+ centers dispersed on the (100) (VO)2P2O7
crystalline plane. Evolution of the precursor during the activation under reaction conditions
was followed by in situ Raman and NMR spectroscopies supplemented by XRD and XPS.
Bands corresponding to VOPO4 and (VO)2P2O7 appeared in Raman spectra simultaneously
with beginning of MA production. Similar observation appeared in work [76] of G.J.
Hutchings with colleagues. They investigated precursors prepared by the VPA, VPO and
VPD methods by XRD and by in situ NMR and TEM. Nevertheless, authors recognize as the
active centers the V4+/V5+ couples dispersed on various VPO phases including (VO)2P2O7. K.
Aït-Lachgar et al. [75] oxidized pure and well-crystallized (VO)2P2O7 in oxygen flow at
500°C for different times up to 24 hours. The samples were characterized by UV-VIS, XRD

Vanadium phosphorus oxide catalyst
59
and NMR. While an oxidation state value increased continuously, selectivity had a maximum
value at an oxidation time of 1 hour. This led authors to the conclusion about existence of a
proper for MA production density of V5+ species on top of (VO)2P2O7.
Furthermore, Coulston et al. [77] correlated the time dependence of MA formation on
the αI-VOPO4/SiO2 and (VO)2P2O7/SiO2 samples with decay of V5+ species measured by
time-resolved VK-edge XAS. Authors argued the central role of V5+ in the catalytic process
and the responsibility of V4+ for by-product formation.
Such a wide range of opinions supported by experimental facts can be well explained
by location of an active material in a topmost (1-2 nm) surface layer. This layer can hardly be
investigated by the techniques used in the works mentioned above. Existence of such a layer
on top of amorphous material or various crystalline phases was suggested by several
experimental works. In [78] authors investigated exchange of gaseous and lattice oxygen
using gaseous 18O isotopes and a long-time operated (equilibrated) catalyst. Involvement of
lattice oxygen in formation of MA and participation of the four topmost layers in oxygen
exchange was concluded on the basis of the obtained time dependence of 18O-balance in gas
phase. Recent TEM investigations showed existence of a thin (about 1nm) amorphous layer
on top of (VO)2P2O7 for about 50 equilibrated VPO catalysts from different sources [79]. This
layer was marked as a suitable candidate for localization of the active species. The authors
nevertheless, failed to correlate the observations with a catalytic performance. This was
accounted for the existence of other factors influencing the performance, such as the
electronic structure. Figure 4-3 shows an example of a TEM image of such an amorphous
layer.

Figure 4-3. HRTEM image of a VPO catalyst. An amorphous layer of 2.5-4 nm thickness is clearly visible on top of a crystalline phase.
Details of the sample preparation and characterization are described in [64] (sample VPOP1).
Additionally, some other observations [61, 76, 80] can be viewed as indirect proof of
the presence of a thin active layer on top of a bulk phase. M. Ruitenbeek et al. [61]
investigated bulk and supported VPO. The sample with SiO2 support was found to have a
catalytic activity equal to the activity of the bulk VPO sample. An EXAFS spectrum,
however, showed the amorphous nature of SiO2-supported VPO, while bulk VPO had the
structure of well-crystalline (VO)2P2O7. This led the authors to conclusion that the oxidation
of n-butane takes place over an amorphous VPO surface. Furthermore, a completely
amorphous VPO catalyst was synthesized using supercritical CO2 [80]. The amorphous nature
of the catalyst was concluded from NMR, XRD, electron diffraction and HREM
measurements. For this catalyst no activation was necessary to reach full catalytic
performance. The catalyst showed a better intrinsic catalytic activity towards MA comparing
samples prepared by VPA, VPO and VPD route. In addition, no crystallization of the catalysts
material was observed during the reaction, which is in contradiction to the observations of
material crystallization with time on stream for catalysts prepared by the standard procedures
(VPA, VPO and VPD). In the same paper the authors argue about different structure of the
surface layer and of the bulk on base of some experimental observations. Among them are:
1) XPS consistently shows phosphorous enrichment on the surface.
2) Catalysts prepared by different methods gave very different relative amounts of
the (VO)2P2O7 and VOPO4 phases, but have very similar activities for MA
production. 60
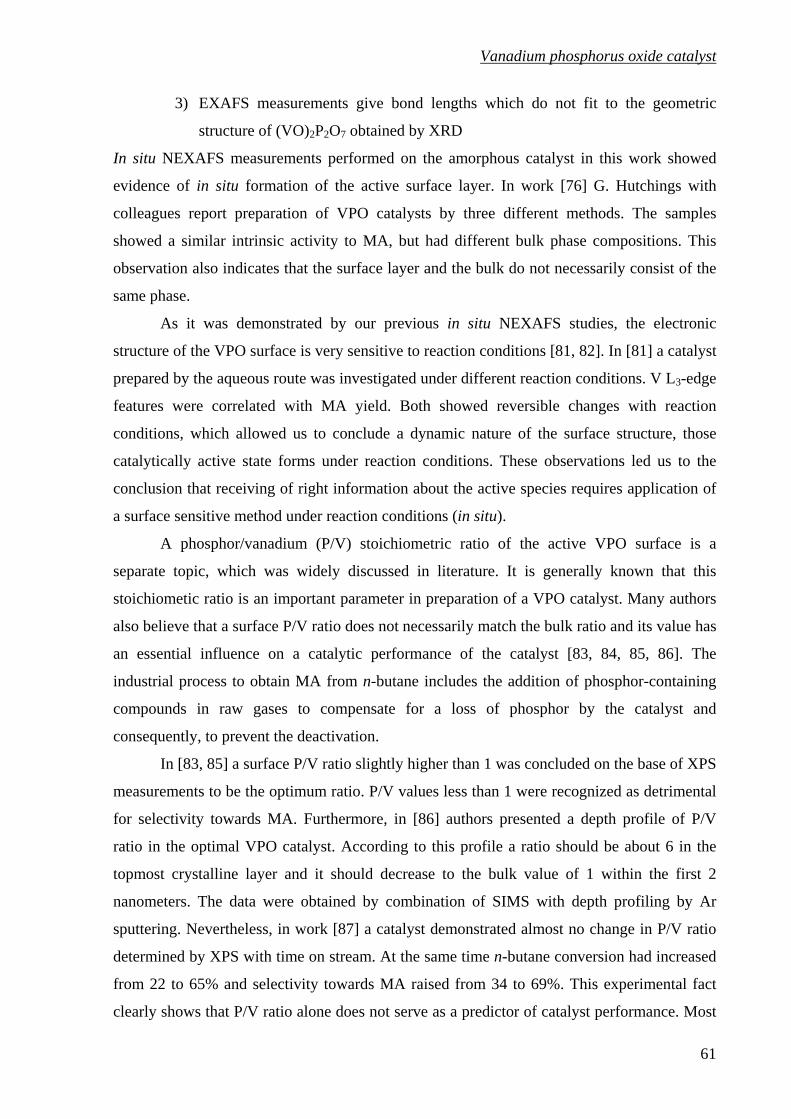
Vanadium phosphorus oxide catalyst
61
3) EXAFS measurements give bond lengths which do not fit to the geometric
structure of (VO)2P2O7 obtained by XRD
In situ NEXAFS measurements performed on the amorphous catalyst in this work showed
evidence of in situ formation of the active surface layer. In work [76] G. Hutchings with
colleagues report preparation of VPO catalysts by three different methods. The samples
showed a similar intrinsic activity to MA, but had different bulk phase compositions. This
observation also indicates that the surface layer and the bulk do not necessarily consist of the
same phase.
As it was demonstrated by our previous in situ NEXAFS studies, the electronic
structure of the VPO surface is very sensitive to reaction conditions [81, 82]. In [81] a catalyst
prepared by the aqueous route was investigated under different reaction conditions. V L3-edge
features were correlated with MA yield. Both showed reversible changes with reaction
conditions, which allowed us to conclude a dynamic nature of the surface structure, those
catalytically active state forms under reaction conditions. These observations led us to the
conclusion that receiving of right information about the active species requires application of
a surface sensitive method under reaction conditions (in situ).
A phosphor/vanadium (P/V) stoichiometric ratio of the active VPO surface is a
separate topic, which was widely discussed in literature. It is generally known that this
stoichiometic ratio is an important parameter in preparation of a VPO catalyst. Many authors
also believe that a surface P/V ratio does not necessarily match the bulk ratio and its value has
an essential influence on a catalytic performance of the catalyst [83, 84, 85, 86]. The
industrial process to obtain MA from n-butane includes the addition of phosphor-containing
compounds in raw gases to compensate for a loss of phosphor by the catalyst and
consequently, to prevent the deactivation.
In [83, 85] a surface P/V ratio slightly higher than 1 was concluded on the base of XPS
measurements to be the optimum ratio. P/V values less than 1 were recognized as detrimental
for selectivity towards MA. Furthermore, in [86] authors presented a depth profile of P/V
ratio in the optimal VPO catalyst. According to this profile a ratio should be about 6 in the
topmost crystalline layer and it should decrease to the bulk value of 1 within the first 2
nanometers. The data were obtained by combination of SIMS with depth profiling by Ar
sputtering. Nevertheless, in work [87] a catalyst demonstrated almost no change in P/V ratio
determined by XPS with time on stream. At the same time n-butane conversion had increased
from 22 to 65% and selectivity towards MA raised from 34 to 69%. This experimental fact
clearly shows that P/V ratio alone does not serve as a predictor of catalyst performance. Most

62
experimental works gave a P/V ratio higher than 1 for a well-active and selective VPO
catalyst. Estimated P/V values range from close to 1 [85] up to 3 [88] and sometimes even
higher, while a bulk P/V ratio is always close to 1. Various hypotheses exist in literature about
the role of phosphor enrichment on the surface. Some authors suggest the active site
insulation role of phosphor atoms [89], [90], [91]. According the hypothesis of site insulation
lattice oxygen atoms on the active surface of a VPO catalyst are arranged in domains, which
are fully insulated from each other by surface phosphor [89]. It is stated that only such a
distribution of oxygen atoms is inherent to a selective VPO catalyst and absence of the
insulation or insulation of single oxygen atoms would lead to loss of selectivity [90]. Other
authors assign to phosphor the property of prevention of overoxidation of vanadium atoms
[84], [92]. It can be also assumed that the presence of phosphor is necessary to set the right
distance between two vanadium atoms to accommodate n-butane molecules and reaction
intermediates [93]. Presence of V vacancies on the surface was also suggested [94], which can
explain the high P/V ratio values. Nevertheless, the speculations should be taken with caution
because they are mostly based on XPS and LEIS experimental data. These methods were
shown to give in some cases a wrong P/V ratio because of two possible reasons. The first
reason is deviation of XPS sensitivity factors from their true values. These sensitivity factors
are used to calculate stoichiometric ratios from XPS peak area ratios. Coulston et. al [25]
performed XPS measurements of organometallic reference compounds containing phosphor
and vanadium. The sensitivity factors based on theoretical calculations [95], which are
commonly used in XPS for P/V ratio estimation, were shown to be wrong by factor of two for
these measurements. T. Okuhara and M. Misono [83] have also used reference compounds
(phosphor-vanadium containing glasses) and obtained P/V values slightly above unity for
well-active and selective VPO catalysts. The second possible reason is the preferential
masking of surface vanadium atoms by carbon or hydrocarbons, which leads to a decrease of
the V signal in XPS and LEIS experiments. Existence of this effect was demonstrated by W.
Jansen with colleagues [96]. They measured by LEIS a P/V surface ratio of a VPO catalyst
with the bulk ratio of 1.1. The measurements were done before and after high-temperature
treatment in oxygen and hydrogen. The surface after the oxygen treatment was supposed to be
clean, while an oxidation state measured by XPS had not changed significantly. A P/V ratio
after the oxygen treatment was found to be 2.0 comparing 2.9 before the treatment. After
consequent hydrogen treatment a P/V value increased to 3.6. In view of all mentioned in this
paragraph it became clear that the value of a surface P/V ratio of an active VPO catalyst is
still a question under discussion.

Vanadium phosphorus oxide catalyst
63
Because of a wide range of opinions concerning the active species of a VPO catalyst,
an investigation of the nature of the catalytically active surface would have big practical
importance. Next chapters are devoted to experimental details and results of the investigation
of VPO catalysts by the XPS technique under reaction conditions.
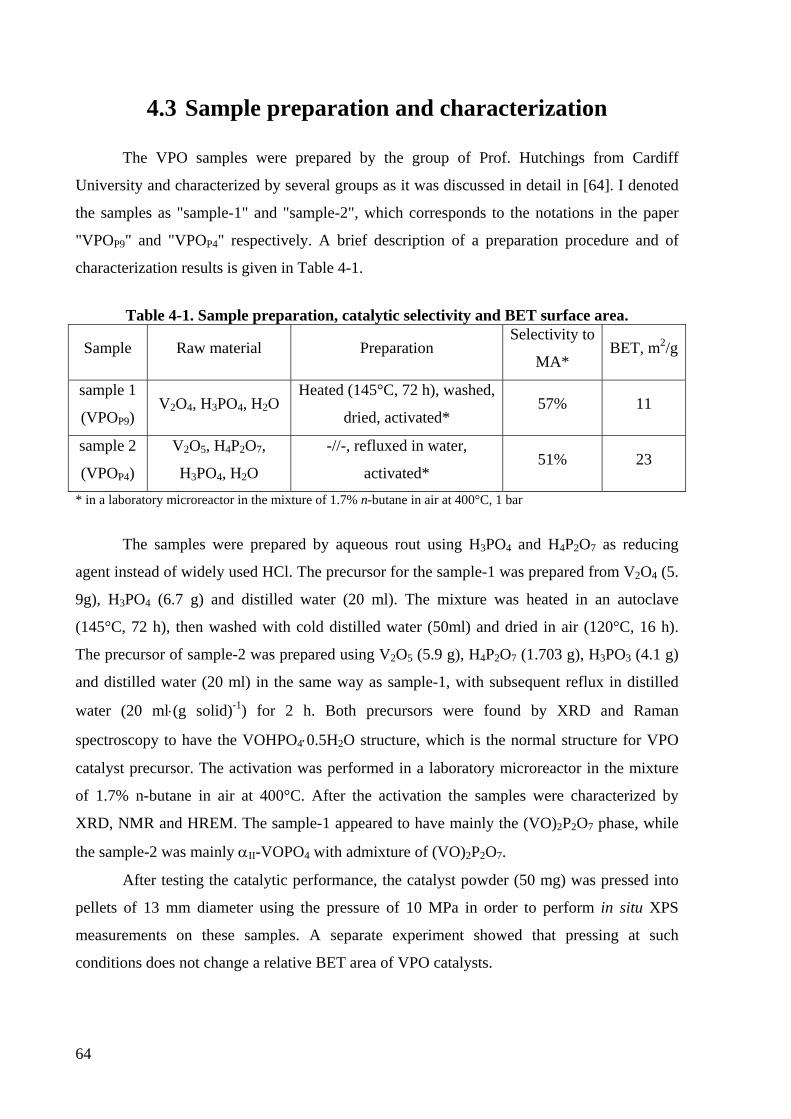
64
4.3 Sample preparation and characterization
The VPO samples were prepared by the group of Prof. Hutchings from Cardiff
University and characterized by several groups as it was discussed in detail in [64]. I denoted
the samples as "sample-1" and "sample-2", which corresponds to the notations in the paper
"VPOP9" and "VPOP4" respectively. A brief description of a preparation procedure and of
characterization results is given in Table 4-1.
Table 4-1. Sample preparation, catalytic selectivity and BET surface area.
Sample Raw material Preparation Selectivity to
MA* BET, m2/g
sample 1
(VPOP9) V2O4, H3PO4, H2O
Heated (145°C, 72 h), washed,
dried, activated* 57% 11
sample 2
(VPOP4)
V2O5, H4P2O7,
H3PO4, H2O
-//-, refluxed in water,
activated* 51% 23
* in a laboratory microreactor in the mixture of 1.7% n-butane in air at 400°C, 1 bar
The samples were prepared by aqueous rout using H3PO4 and H4P2O7 as reducing
agent instead of widely used HCl. The precursor for the sample-1 was prepared from V2O4 (5.
9g), H3PO4 (6.7 g) and distilled water (20 ml). The mixture was heated in an autoclave
(145°C, 72 h), then washed with cold distilled water (50ml) and dried in air (120°C, 16 h).
The precursor of sample-2 was prepared using V2O5 (5.9 g), H4P2O7 (1.703 g), H3PO3 (4.1 g)
and distilled water (20 ml) in the same way as sample-1, with subsequent reflux in distilled
water (20 ml⋅(g solid)-1) for 2 h. Both precursors were found by XRD and Raman
spectroscopy to have the VOHPO4⋅0.5H2O structure, which is the normal structure for VPO
catalyst precursor. The activation was performed in a laboratory microreactor in the mixture
of 1.7% n-butane in air at 400°C. After the activation the samples were characterized by
XRD, NMR and HREM. The sample-1 appeared to have mainly the (VO)2P2O7 phase, while
the sample-2 was mainly αII-VOPO4 with admixture of (VO)2P2O7.
After testing the catalytic performance, the catalyst powder (50 mg) was pressed into
pellets of 13 mm diameter using the pressure of 10 MPa in order to perform in situ XPS
measurements on these samples. A separate experiment showed that pressing at such
conditions does not change a relative BET area of VPO catalysts.

Vanadium phosphorus oxide catalyst
65
4.4 Experimental conditions
The experimental investigations were performed on the in situ XPS setup described in
detail in sections 3.3 and 3.5.
The experiments were performed at the beamline U49/2-PGM1 [97] at the synchrotron
BESSY-II [98] in Berlin. An overall spectral resolution of the system was evaluated from the
Ar 2p3/2 gas phase peak and was found to be better than 0.3 eV at the photon energy of 700
eV. The pressure for the reaction gas mixture in our experiments was set to 2 mbar. At this
pressure it was still possible to get spectra with good signal to noise ratio. The samples were
investigated in a constant gas flow of 1.5% n-butane in He (partial pressure 1.6 mbar) and
oxygen (partial pressure 0.4 mbar).
The aim of the investigation was to observe a difference in the electronic structure of
the catalysts in the catalytically active and inactive states. Change of the catalyst state was
performed by change of a temperature. The usual temperature of the catalyst to operate the
reaction of oxidation of n-butane to MA is 400°C. Consequently, this temperature was chosen
to investigate properties of the catalyst in the catalytically active state. At room temperature
the catalyst is known to be practically inactive. Unfortunately, VPO was highly charged at
room temperature during in situ XPS experiments in the reaction mixture. The charging
broadens XPS peaks and consequently, makes analysis of their shape difficult or not possible
at all. Usually charging in high-pressure XPS experiments is reduced relative to vacuum
conditions because of charge transfer by electrons extracted by the X-ray beam from gas
phase. Nevertheless, in the case of VPO samples the presence of the ions is obviously not
enough to compensate the charging effect and the use of standard methods of charge
compensation (such as an electron flood gun) is not possible in gas atmosphere. Fortunately,
as it was shown by our preliminary studies [81] a charging decreasing with temperature and
practically disappearing at some temperature not higher than 250°C. This fact can be
explained by an increase in electrical conductivity with temperature, which is inherent for
semiconductors and by changing the conductivity because of changes in the electronic
structure. The temperature offset of MA formation is well above 250°C and the catalyst state
can be considered as inactive at the temperature of charging disappearance. Therefore,
spectroscopic measurements were done at temperatures of 150-200°C, where a MA yield was
negligible, and at 400°C, which is the usual reaction temperature. Additionally, change with
time of the electronic structure of the samples was observed while they were kept in absence

66
of oxygen (in 1.6 mbar of 1.5% n-butane in He) at 400°C to investigate sample stability
towards reducing conditions.
In the described XPS experiments the O1s/V2p, C1s, P2p core-levels and the valence
band region were recorded. An incident photon energy was varied in such a way that a kinetic
energy of the photoelectrons was constant for all recorded XPS regions, thus, providing for a
uniform information depth, a constant contribution of the analyzer transmission function as
well as a constant contribution of gas phase scattering. Additionally, depth-profiling by
varying the excitation photon energy applied to the same core-level was performed, which
leads to a change of photoelectron kinetic energy and as a consequence, to a change in
information depth. The values of excitation energy and corresponding information depths,
estimated using the "universal curve" [3] (Figure 3-4), are presented in Table 4-2.
Table 4-2. Experimental conditions: excitation energies and information depth for O1s-V2p and P2p XPS regions.
Excitation energy, eV Photoelectron kinetic energy, eV O1s-V2p P2p C1s VB
Information depth [3]**, nm.
200 730 335 485 1.0 330 860 465 615 1.3 720 1254* 854 1005 730 1.8 1240 1254 2.3
* The photon energy of 1254 eV corresponds to MgKa line, which is in common use in laboratory XPS systems for chemical analysis (ESCA). ** An inelastic mean free path of electrons was calculated in [3] in terms of monolayers on base of experimental data for crystals with a thickness of monolayer of about a mean interatomic distance. To calculate an information depth for VPO, the monolayer thickness was chosen to be equal to the mean interatomic distance for oxygen atoms in (VO)2P2O7, which is about 0.3-0.4 nm [99].

Vanadium phosphorus oxide catalyst
4.5 Sample activity during in situ XPS measurements.
The catalytic reactivity of the samples was measured by proton-transfer-reaction-
mass-spectroscopy (PTRMS). A conventional quadrupole MS was found to be not sensitive
enough to detect a small amount of MA produced at our experimental conditions.
Protonated MA molecules produce signal at m/e=99 amu per electron charge. The
signal is measured in units of concentration of the selected mass inside the PTRMS. The
concentration is different from the concentration in the sample cell because investigated gas
was compressed and diluted with air. Nevertheless, relative concentrations are suitable for
comparison. Mass spectra were recorded simultaneously with XPS measurements, which
allow correlation of XPS results with catalytic activity of the material. MA signal in PTRMS,
showed the exponential time behavior with a time-constant of about 10 min, which results
from accumulation of products in the pumping system.
The mass-spectra are shown on Figure 4-4 and Figure 4-5.
Figure 4-4. Maleic anhydride yield during in situ XPS experiments with the sample-1 In the reaction mixture and in n-butane/He atmosphere. The points, where XPS spectra were recorded, are
marked by arrows and letters.
0 2 4 6 8 10 12 14 160,0
0,4
0,8
1,2
121620
0
200
400
2,0 2,5 3,0 3,5 4,00,0
0,5
1,0
1,5
2,0
150°C
400°C
150°C
20°C
O2 s
witc
h of
f
MA
sig
nal,
ppb
Time, hours
a.
b.
c.
d.e.
Tem
pera
ture
, °C
b.
MA
sign
al, p
pb
O2switch
off
Time, hours
a.
67

Figure 4-5. Maleic anhydride yield during in situ XPS experiments with the sample-2 a) in the reaction mixture, first heating, b) second heating, c) third heating and switching to n-butane/He
atmosphere. The points, where XPS spectra were recorded, are marked by arrows and letters.
0 1 2 3 4 5 6 70
2
4
6
8
0
100
200
300
400
c.
b.
20°C
200°C
400°C
200°C
20°CMA
sig
nal,
ppb
Time, hours
a.
Tem
pera
ture
, °C
a)
0 1 2 3 4 5 60
1
2
3
4
5
0
100
200
300
400
e''.e'.
d.
400°C
150°C
MA
sig
nal,
ppb
Time, hours
Tem
pera
ture
, °C
b)
0 1 2 3 4 5 60
1
2
3
4
0
100
200
300
400
i.
h.g.
f.
O2 flow switched off
MA
sig
nal,
ppb
Time, hours
400°C
150°C
Tem
pera
ture
, °C
c)
68

Vanadium phosphorus oxide catalyst
69
The signal-to-noise ratio in the spectrum on Figure 4-4 changed during the
measurements because a dwell time of the mass-spectrometer was increased in order to limit
the size of the data file in the region where no fast time response is necessary. No significant
increase in a MA signal was observed after heating the samples to 200°C. When the samples
were heated to 400°C with the heating ramp of 20°C/min (Figure 4-4, Figure 4-5 a), the peak
in the MA signal followed by decrease to a constant level after less than one hour was
observed. It can be clearly seen that MA could be detected for both catalysts at 400°C and
practically no MA was detectable after cooling down to temperatures lower than 200°C.
Heating tests with the same reaction mixture in absence of a sample in the chamber did not
show any production of MA, which allows to relate the catalytic activity to VPO material. For
sample-2 the temperature was cycled 3 times between 150 or 200°C and 400°C (see Figure
4-5). A steady-state level of the MA yield at 400°C was found to be the same in all three
cycles, which indicates that MA is a product of the catalytic reaction but not of an unsteady-
state process. An amplitude of the initial peak of MA signal in PTRMS was significantly
lower during the second heating cycle (see Figure 4-5 b), and no peak was visible during the
third cycle (Figure 4-5 c). The behavior of this peak clearly shows that the peak is caused by
desorption of MA, which was produced during activation of the catalyst in a microreactor in a
reaction mixture at 1 bar before the in situ XPS experiments. The same behavior was
observed for a VPO catalyst in our in situ XAS experiments [81]. The absence of a desorption
peak during the third heating cycle does not indicate the absence of adsorbed MA molecules
but rather, a lack of sensitivity of our system to register a desorption of a small amount of MA
attached to the surface at the low-pressure conditions. A steady-state MA yield in the reaction
gas mixture at 400°C was (2.6±0.7) times higher for the sample-2 as compared to the sample-
1. After normalization to the BET surface area (11 and 23 m2g-1 for the sample-1 and sample-
2, respectively. See Table 4-1) the ratio of normalized yields was obtained to be (1.2±0.3),
which indicates that both samples have nearly the same intrinsic activity to MA.
Reduction of the samples in n-butane/He atmosphere (see Figure 4-4 a, Figure 4-5 c
and Figure 4-6) led to significantly different deactivation time behavior. Fit of a MA yield
time behavior in n-butane/He with a first order exponential decay function gave the time
constants of 0.9 and 6.4h for the sample-1 and sample-2, respectively (Figure 4-6).

Figure 4-6. Time dependence of normalized MA yield in n-butane/He atmosphere at 400°C.
0 1 2 3 4 12 130,0
0,2
0,4
0,6
0,8
1,0
1,20 1 2 3 4 12 13
0,0
0,2
0,4
0,6
0,8
1,0
1,2
O2 off
cool down
MA
sig
nal,
n.u.
Time, hours
O2 off MA yield exponential fit
cool down
MA
sig
nal,
n.u.
Sample-1
Sample-2
70

Vanadium phosphorus oxide catalyst
4.6 XPS data.
A typical XPS spectrum of a VPO compound is shown on Figure 4-7.
71
Sample-2, 400°C, reaction mixture (p=2 mbar), hv=1254 eV.
The assignme Most intense peaks,
corresp
Figure 4-7. Typical survey photoelectron spectrum of VPO.
600 500 400 300 200 100 00,0
0,5
1,0
1,5
2,0
2,5
3,0
3,5
4,0
O1sgas
VBO2s
V3p
V3sP2p
P2sC1sV2p3/2
V2p1/2
O1s
sign
al, a
.u.
BE, eV
nt of XPS peaks was made according [22, 100].
onding to V, P, O and C elements, were recorded separately with small KE step in
order to extract information about a chemical state and stoichiometry. The peak at BE of 530
eV corresponds to photoelectrons emitted from the O1s core-level. The broadened doublet at
550-555 eV is the O1s photoelectron peak of gas phase oxygen molecules. Broadening of this
peak changes with sample charging and with sample position. In some spectra it became so
broad that it was not possible to recognize it anymore. The doublet with binding energies of
about 515 and 522 eV corresponds to electrons from the V2p level having the total angular
momenta j=3/2 and 1/2 respectively. The C1s and P2s peaks are around 285 and 190 eV
respectively. P2p have a form of one broad peak around 135 eV because the doublet
components (j=1/2 and 3/2) are not resolved in the spectrum because they have a BE
difference of about 1 eV. V3s is around 67 eV. The V3p doublet is also not resolved and has a
BE of about 40 eV. O2s peak is around 20 eV. The valence band is composed from oxygen,
vanadium, phosphor and carbon valence orbitals.

Evolution of the peaks during the experiment is presented on Figure 4-10 - Figure 4-19
and Figure 4-20 - Figure 4-21. Every region was recorded with two different excitation
energies, corresponding to the most surface and the most bulk sensitive modes (see Table 4-2
on page 30). The spectra in the bulk sensitive mode were taken with the excitation energy
corresponding to the photoelectron kinetic energy 720 eV (spectra B.). The kinetic energy of
200 eV was chosen for most of the spectra in the surface sensitive mode (spectra S.). Several
O1s and V2p spectra were recorded with the photoelectron kinetic energy of 330 eV (Figure
4-11-S, Figure 4-13-S, Figure 4-15-S) to obtain good-quality spectra at low temperature. An
information depth for these spectra is a little bit different as compared with the spectra taken
with KE~200 eV. Nevertheless, as it will be shown further, no remarkable gradient of
oxidation state was observed for the sample-2 and consequently, the spectra can be related to
the surface sensitive mode just as well as the spectra with KE~200 eV. The valence band
region was recorded in the bulk sensitive mode with KE~720 eV (Figure 4-20-B and Figure
4-21-B) because a spectral intensity of the excitation source around hv=200 eV does not allow
to record the region with a reasonable quality. Additionally, the VB region was recorded with
the photoelectron kinetic energy of 1250 eV (Figure 4-20-D and Figure 4-21-D) to observe
possible spectral changes with information depth.
The O1s, V2p (Figure 4-8) and VB (Figure 4-9) peaks of V2O5 and reduced V2O5 were
recorded as reference spectra for VPO.
Figure 4-8. O1s and V2p3/2 XP spectra of V2O5 (001). -3
72
The sample was reduced in 10 mbar of oxygen at 350°C.
533 532 531 530 529 528
0,0
0,2
0,4
0,6
0,8
1,0
1,2 hv=610 eV(KE~80 eV)
Sign
al, n
.u.
533 532 531 530 529 528
0,0
0,2
0,4
0,6
0,8
1,0
1,2
hv=1000 eV(KE~470 eV)
10-3 mbar0.6 mbar
10-3 mbar0.6 mbar
BE, eV
Sign
al, n
.u.
520 519 518 517 516 515 514 513
0,0
0,2
0,4
0,6
0,8
1,0
1,2V5+
V4+
hv=610 eV(KE~90 eV)
Sign
al, n
.u.
520 519 518 517 516 515 514 513
0,0
0,2
0,4
0,6
0,8
1,0
1,2
hv=1000 eV(KE~480 eV)
10-3 mbar0.6 mbar
10-3 mbar0.6 mbar
BE, eV
Sign
al, n
.u.
O1s V2p3/2

Vanadium phosphorus oxide catalyst
73
Figure 4-9. VB XP spectra of V2O5 (001). The sample was reduced in 10-3 mbar of oxygen at 350°C.
Spectra of the O1s-V2p regions on Figure 4-10 and Figure 4-11 and of valence band
on Figure 4-20 and Fi subtraction but after
normalization of the peak 4-12 - Figure 4-19 were
subjected to subtracti to unity. Calibration
of BE scale is a difficult task, which in our case should be performed separately for every
region. BE scale of an O1s-V2p region was calibrated to the position of the maximum of an
O1s peak at 530 eV. This value is inherent to binary vanadium oxides [22]. Nevertheless, the
choice of this binding energy for the O1s peak of VPO is somewhat arbitrary and was
performed solely because there is no agreement in literature about the right BE of this peak
(see for example Table 1 in Ref. [101]). The C1s and P2p peaks were calibrated to the
positions of their maxima, which are 285 and 135 eV respectively. BE scale of the VB region
was calibrated to the low-BE threshold of the small low-energy-side peak. This peak was
assigned to the V3d states and the threshold corresponds to FE.
The shape and a BE position of an XPS peak gives in principle information about the
chemical state of an element. Nevertheless, shifting and broadening of the peaks because of
charging and overlapping of spectral features sometimes make very complicated or not
possible at all extraction of firm data from a spectrum. Below the principle possibilities to
obtain information about chemical states of elements on the basis of XPS data received during
our experiment will be discussed.
10 8 6 4 2 0
0,0
0,2
0,4
0,6
0,8
1,0
1,2
0.6 mbar
10-3 mbar
10-3 mbar
0.6 mbar
hv=100 eV(KE )
V3dSig
nal,
n.u.
10 8 6 4 2 0
0,0
0,2
0,4
0,6
0,8
1,0
1,2
1,4
BE, eV
Sig
nal,
n.u.
hv=480 eV(KE~470 eV)
~90 eV
gure 4-21 are shown "as is" without background
amplitude to unity. Other spectra on Figure
on of a Shirley-type background and normalization
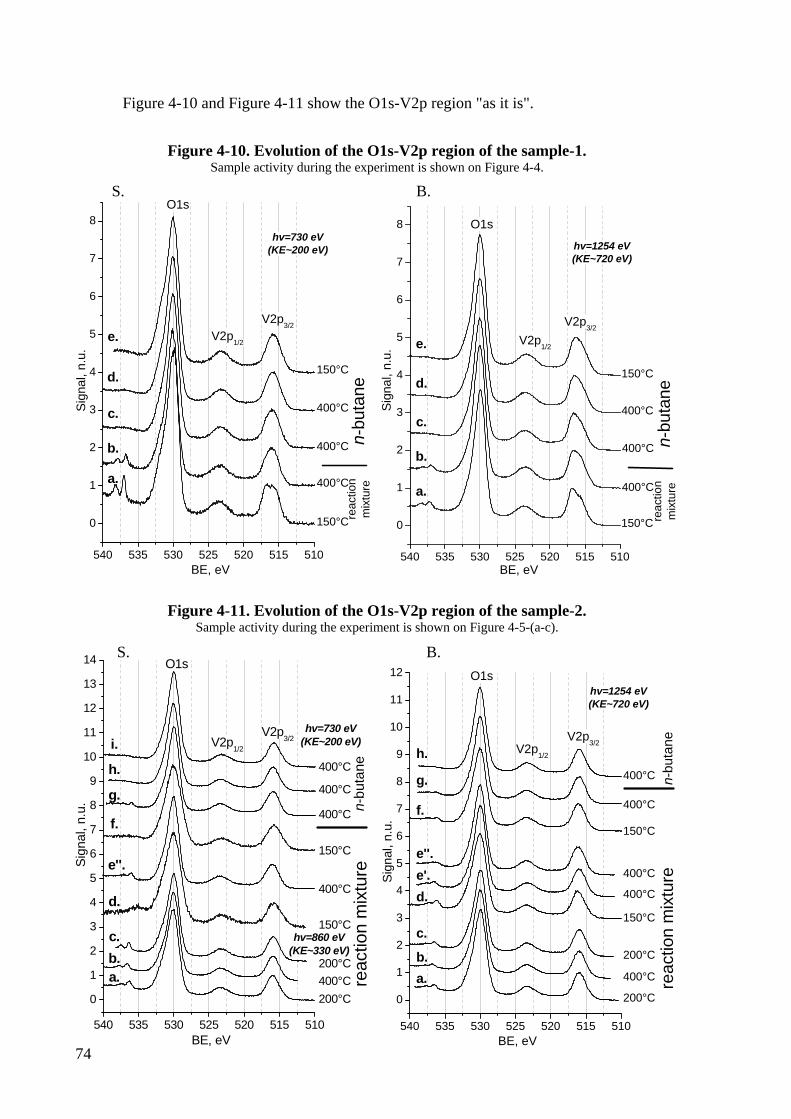
Figure 4-10 and Figure 4-11 show the O1s-V2p region "as it is".
Figure 4-10. Evolution of the O1s-V2p region of the sample-1. Sample activity during the experiment is shown on Figure 4-4.
74
le-2. -c).
Figure 4-11. Evolution of the O1s-V2p region of the sampSample activity during the experiment is shown on Figure 4-5-(a
540 535 530 525 520 515 510
0
1
2
3
4
5
6
7
8
a.
b.
c.
d.
e.
hv=730 eV(KE~200 eV)
n-bu
tane
150°C
400°CSi, n
u.
reac
tion
mix
ture
400°C
400°C
150°C
BE, eV
gnal
.
V2p3/2V2p1/2
O1s
540 535 530 525 520 515 510
0
1
2
3
4
5
6
7
8
hv=1254 eV(KE~720 eV)
c.
d.
e.
a.
b.
n-bu
tane
150°C
400°CSig
nal,
n.u.
V2p3/2
V2p1/2
O1s
S. B.
reac
tion
mix
ture
400°C
400°C
150°C
BE, eV
540 535 530 525 520 515 510
0
1
2
3
4
5
6
7
8
9
10
11
12
400°Ce'.
V2p3/2V2p1/2
O1shv=1254 eV(KE~720 eV)
n-bu
tane
150°C
400°C
400°C
400°C
150°C
reac
tion
mix
ture
200°C
400°C
200°C
Sign
al, n
.u.
BE, eV
a.b.
c.
d.
e''.
f.
g.
h.
540 535 530 525 520 515 510
0
1
2
3
4
5
6
7
8
9
10
11
12
13
14
V2p3/2V2p1/2
O1s
hv=860 eV(KE~330 eV)
hv=730 eV(KE~200 eV)
n-bu
tane
150°C
400°C
400°C
400°C
400°C
150°C
reac
tion
mix
ture
200°C400°C200°C
Sign
al, n
.u.
BE, eV
a.b.c.
d.
e''.
f.
g.
h.
i.
S. B.

Vanadium phosphorus oxide catalyst
75
BE sca the O1s peak
at 530.
Figure 4-12. Evolution of the O1s peak of the sample-1. Sample activity during the experiment is shown on Figure 4-4.
Figure 4-13. Evolution of the O1s peak of the sample-2. Sample activity during the experiment is shown on Figure 4-5-(a-c).
le of the region was calibrated to the position of the maximum of
0 eV. The O1s regions after Shirley background subtraction are shown on Figure 4-12
and Figure 4-13.
534 532 530 528 526
0,0
0,2
0,4
0,6
0,8
1,0
1,2
1,4 O1s
a.b.c.d.e.
hv=730 eV(KE~200 eV)
n-bu
tane
reac
tion
mix
ture
150°C400°C400°C400°C150°C
Sign
al, n
.u.
BE, eV534 532 530 528 526
0,0
0,2
0,4
0,6
0,8
1,0
1,2
1,4hv=1254 eV(KE~720 eV)
O1s
n-bu
tane
reac
tion
mix
ture
150°C400°C400°C400°C150°C
Sig
nal,
n.u.
BE, eV
a.b.c.d.e.
S. B.
534 532 530 528 526
0,0
0,2
0,4
0,6
0,8
1,0
1,2
1,4
1,6
1,8
2,0
2,2
2,4
2,6
2,8
3,0
3,2
400°Ce''.
hv=1254 eV(KE~720 eV)
Sign
al, n
.u.
BE, eV
O1s
n-bu
tane
150°C
400°C
400°C
400°C150°C
reac
tion
mix
ture
200°C
400°C
200°Ca.b.c.
d.e'.
f.
g.h.
534 532 530 528 526
0,00,20,40,60,81,01,21,41,61,82,02,22,42,62,83,03,23,4
Sig
nal,
n.u.
BE, eV
O1s
hv=860 eV(KE~330 eV)
hv=730 eV(KE~200 eV)
n-bu
tane
150°C
400°C400°C
400°C
400°C
150°C
reac
tion
mix
ture
200°C400°C200°Ca.
b.c.
d.
e''.
f.
g.h.i.
.BS.

76
As it was VPO catalyst is
(VO)2P
about 534 eV for P=O oxygen. A BE of V-O-P O1s component should than be between 530.0
and 532.5 eV, which are the values corresponding to V-O-V and P-O-P oxygen atoms. From
general considerations, the triply coordinated oxygen should contribute the O1s peak at lower
BE than that of V-O-V oxygen, and this contribution should be smaller than the contribution
of V-O-V oxygen. The O1s component of oxygen bonded to carbon should appear around
533-534 eV ([104], page 469). Therefore, from the possible kinds of oxygen atoms V-O-V
should have a lowest BE of O1s electrons and it is reasonable to assign the main peak of the
experimental O1s spectra (Figure 4-12 and Figure 4-13) to this kind of oxygen. The position
of this peak was artificially set to 530.0 eV to calibrate BE scale of O1s-V2p spectra. The
high-energy wing of the O1s peak should be than formed by other oxygen species. Although
the O1s peaks showed some changes around 531.5-532 eV, the effect was too small to relate
these changes to an alternation of a relative amount of certain oxygen species.
already discussed in part 4.2 the bulk phase of an industrial
2O7. The structure of this phase ([102] and references therein) is built by VO6
octahedra and PO4 tetrahedra. Therefore, there are three types of oxygen: singly coordinated
(V=O, P=O), doubly coordinated (V-O-P, V-O-V, P-O-P) and triply coordinated (to two V
and one P atom) [103]. Other VPO structures or amorphous phases should contain the same
types of oxygen atoms, perhaps with different bond lengths. One should also take into account
various types of carbon-oxygen-containing adsorbates which are present on the surface. A BE
of O1s electrons in V-O-V atoms can be estimated from data for binary vanadium oxides.
Various vanadium oxides have an O1s peak at almost the same BE of 530.0 eV (±0.5 eV)
[22]. A BE about 532.5 eV for the O1s level of P-O-P oxygen atoms can be obtained from
bridging oxygen atoms of P2O5 [22]. From the same compound one can estimate a BE of
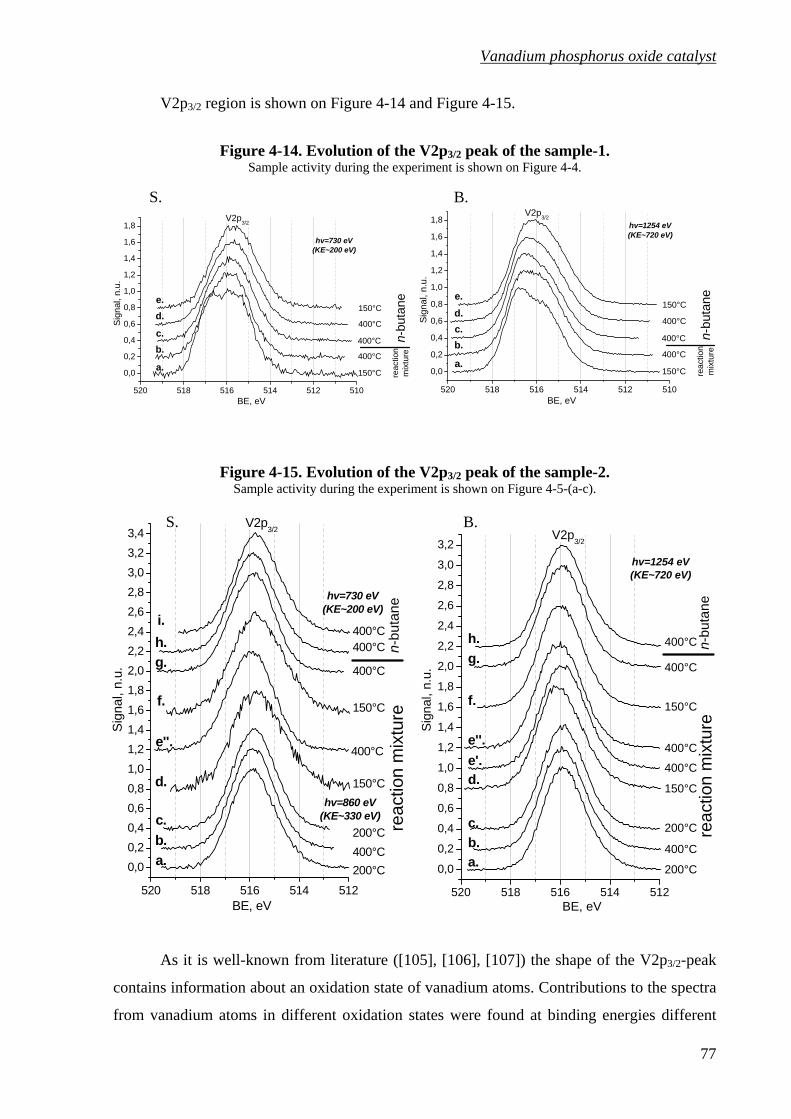
Vanadium phosphorus oxide catalyst
V2p3/2 region is shown on Figure 4-14 and Figure 4-15.
Figure 4-14. Evolution of the V2p3/2 peak of the sample-1. Sample activity during the experiment is shown on Figure 4-4.
77
Figure 4-15. Evolution of the V2p3/2 peak of the sample-2. Sample activity during the experiment is shown on Figure 4-5-(a-c).
As it is well-known from literature ([105], [106], [107]) the shape of the V2p3/2-peak
contains information about an oxidation state of vanadium atoms. Contributions to the spectra
from vanadium atoms in different oxidation states were found at binding energies different
520 518 516 514 512 510
0,0
0,2
0,4
0,6
0,8
1,0
1,2
1,4
1,6
1,8V2p3/2
a.
b.c.
d.e.
hv=730 eV(KE~200 eV)
n-bu
tane
reac
tion
mix
ture
150°C
400°C
400°C
400°C
150°C
Sign
al, n
.u.
BE, eV520 518 516 514 512 510
0,0
0,2
0,4
0,6
0,8
1,0
1,2
1,4
1,6
1,8hv=1254 eV(KE~720 eV)
V2p3/2
u.
S. B.
n-bu
tane
reac
tion
mix
ture
150°C
400°C
400°C
400°C
150°C
Sign
al, n
.
BE, eV
a.
b.c.d.e.
520 518 516 514 512
0,0
0,2
0,4
0,6
0,8
1,0
1,2
1,4
1,6
1,8
2,0
2,2
2,4
2,6
2,8
3,0
3,2
e'. 400°C
hv=1254 eV(KE~720 eV)
Sign
al, n
.u.
BE, eV
V2p3/2
n-bu
tane
150°C
400°C
400°C
400°C
150°C
reac
tion
mix
ture
200°C
400°C
200°Ca.b.c.
d.
e''.
f.
g.h.
S. B.
520 518 516 514 512
0,00,20,40,60,81,01,21,41,61,82,02,22,42,62,83,03,23,4
Sig
nal,
n.u.
BE, eV
V2p3/2
hv=860 eV(KE~330 eV)
hv=730 eV(KE~200 eV)
n-bu
tane
150°C
400°C400°C
400°C
400°C
150°C
reac
tion
mix
ture
200°C400°C200°C
a.b.c.
d.
e''.
f.
g.h.i.

78
enough ean oxidation
state. Different literature sources refer to different values of BE of single-oxidation-state
components (see e in the region
from 516.9 to 517.2 eV, the V4+ component is between 515.7 and 516.2 eV and the broad
V3+component with a width of ca. 4 eV has a maximum at about 515.5 eV. The procedure and
results of oxidation state determination will be discussed in chapter 4.7.
The P2p peak is shown on Figure 4-16 and Figure 4-17.
Figure 4-16. Evolution of the P2p peak of the sample-1. Sample activity during the experiment is shown on Figure 4-4.
Figure 4-17. Evolution of the P2p peak of the sample-2. Sample activity during the experiment is shown on Figure 4-5-(a-c).
to distinguish these contributions and extract information about a m
cha 5+ to bpter 4.7). The BE of V -component was determined
138 137 136 135 134 133 132
0,0
0,2
0,4
0,6
0,8
1,0
1,2
1,4
1,6
1,8P2p
hv=335 eV(KE~200 eV)
n-400°C
buta
ne150°C
400°C
reac
tion
mix
ture400°C
150°C
Sign
al, n
.u.
BE, eV
a.b.c.
d.e.
138 137 136 135 134 133 132
0,0
0,2
1,0
1,2
1,4
1,6
1,8P2p
a.b.
e.
0,6
0,8
0,4 c.
d.
hv=854 eV(KE~720 eV)
n-bu
tane
reac
tion
mix
ture
150°C
400°C
400°C
400°C
150°C
l, n.
u.
BE, eV
S. B.S
igna
138 137 136 135 134 133 132
0,0
0,2
0,4
0,6
0,8
1,0
1,2
1,4
1,6
1,8
2,0
2,2
2,4
2,6
2,8
3,0
Sig
nal,
n.u.
P2p
hv=465 eV(KE~330 eV)
hv=335 eV(KE~200 eV)
n-bu
tane
150°C
400°C
400°C
400°C
400°C
150°C
actio
n m
ixtu
re
200°Cc.
d.e''.
f.g.h.
i.
BE, eV
re
400°C200°Ca.
b.
138 137 136 135 134 133 132
0,0
0,2
0,4
0,6
0,8
1,0
1,2
1,4
1,6
1,8
2,0
2,2
2,4
2,6
2,8
3,0
3,2
400°Ce'.
hv=854 eV(KE~720 eV)
Sig
nal,
n.u.
BE, eV
P2pn-
buta
ne
150°C
400°C
400°C
400°C
150°C
reac
tion
mix
ture
c.
d.
e''.
f.
g.h.
S. B.
200°C
400°C
200°Ca.b.

Vanadium phosphorus oxide catalyst
79
arious natures. The most
interesting thing in respect of understanding of the reaction mechanism would be of course,
obtaining from
intermediates and products on the surface. Nevertheless, investigation of a real (not model)
catalyst under reaction conditions implies the presence on the surface of carbon oxides,
different kinds of hydrocarbons and a graphitic layer, which appears because of adsorption
and decomposition of reaction gas molecules as well as because of diffusion of carbon
incorporated in a catalyst material and because of gas-assisted transport of carbon containing
on the surface of the experimental chamber. Most of these carbon species are not related to
the catalytic reaction. In the experimental C1s spectra (Figure 4-18 and Figure 4-19) at least
three features changing their relative intensity are visible.
This peak could in principle, provide information about the chemical state of phosphor
atoms. Nevertheless, the changes in the peak shape are very small and a reliable BE reference
is necessary for extraction of the information. The O1s peak, which was used for BE
calibration of the V2p3/2 region is unfortunately, not suitable for BE calibration of the P2p
region in the surface sensitive mode, because it is not present in the spectra due to the low
excitation energy.
The C1s peak is formed by carbon-containing species of v
the amount of reaction C1s peak information about the nature and an

Figure 4-18. Evolution of the C1s peak of the sample-1. Sample activity during the experiment is shown on Figure 4-4.
80
The first feature is the highest peak in the C1s region. BE scale of this region was
calibrated to the position of the maximum of this peak at 285 eV. The gas-phase C1s peak
was found to have a similar BE position, but this feature cannot be related solely to the gas
phase because it was observed also in vacuum and in oxygen atmosphere. The second feature
is at 286.5 eV and the third one is at 288.5-289 eV. Although one can try to assign these
features to some carbon-containing compounds based on literature data, observation clearly
Figure 4-19. Evolution of the C1s peak of the sample-2. Sample activity during the experiment is shown on Figure 4-5-(a-c).
292 290 288 286 284 282
0,00,20,40,60,81,01,21,41,61,82,02,2
C1shv=485 eV
(KE~200 eV)
n-bu
tre
actio
nm
ixtu
re
400°C
400°C
400°C
150°C
BE, eV
a.
b.
ane150°C
Sig
n
c.
al, n
.u.
d.
e.
292 290 288 286 284 282
0,00,20,40,60,81,01,21,41,61,82,02,2
hv=1005 eV(KE~720 eV)
C1s
n-bu
tre
actio
nm
ixtu
re
400°C
400°C
400°C
150°C
Si
BE, eV
a.
b.
c.
ane150°C
gnal
, n.
d.
e.u.
S. B.
290 288 286 284 282
0,0
0,5
1,0
1,5
2,0
2,5
3,0
3,5
4,0
4,5
5,0
400°Ce''.
hv=1005 eV(KE~720 eV)
Sig
nal,
n.u.
BE, eV
C1s
-but
ane
n
150°C
400°C
400°C
400°C
150°C
reac
tion
mix
ture
200°C
400°C
200°Ca.
b.
c.
d.
e'.
f.
g.h.
S. B.
290 288 286 284 282
0,0
0,5
1,0
1,5
2,0
2,5
3,0
3,5
4,0
4,5
5,0
Sig
nal,
n.u.
BE, eV
C1s
hv=615 eV(KE~330 eV)
hv=485 eV(KE~200 eV)
n-bu
tane
150°C
400°C
400°C
150°C
reac
tion
mix
ture
200°C
400°C
200°Ca.
b.
c.
d.
e''.
f.
400°C400°Cg.
h.i.

Vanadium phosphorus oxide catalyst
81
shows that two o e spectra e'' on
Figure 4-19 have no peak at 286.5 and 288.5-289 eV,
including the spectra b, e' and g, which were recorded at the same conditions. Figure 4-5-b
shows the time dependence of temperature and MA yield during a part of experiment with the
sample-2.
Some time after 400°C was reached the temperature starts to fluctuate. These
fluctuations were caused by a defect of electric heater contacts, which was fixed afterwards.
The spectra e' and e'' (Figure 4-19-B) were recorded before and after these fluctuations. The
data for the stoichiometry which will be discussed in part 4.8 show a significant drop in C/V
ratio after heating to 400°C, but not between the spectra e' and e''. Obviously, fast thermal
fluctuations caused desorption of carbon species from the surface, which were replaced by
another carbon s on the catalytic
performa of the sample (Figure 4-5-b), which allows one to conclude that the desorbed
species were not the intermediates or products. After recording this series of spectra the
sample was cooled down and kept for 9 hours in air till the next experiment in which the C1s
spectra "f" and "g" had already the initial three-peak structure. The failure to detect the
intermediates in this experiment nevertheless, should not be viewed as a general inability of
the method to do that. The detection of the intermediates would be a separate extensive study
implying preparation of a carbon-free catalyst material, combined thermal-desorption and
high-pressure XPS studies and in situ XPS experiments with variation of reaction conditions
in order to change a catalytic activity.
The valence band region of VPO is formed by valence orbitals of phosphor, vanadium,
oxygen and carbon atoms. The (VO)2P2O7 structure of the bulk of an industrial VPO catalyst
consists of vanadium and phosphor atoms surrounded by oxygens. Other VPO phases, defects
and surface termination would add to this structural pattern P=O and V=O bonds. One can
expect formation of the valence band by the V3d, O2p and hybridized oxygen-vanadium and
oxygen-phosphor orbitals. Although in P2O5, which is a P5+ oxide, phosphor valence orbitals
are formally empty, one can nevertheless, expect appearance in the spectra of a P3s-
component because of defects and surface termination. The spectra are also complicated by
the pre
f these features do not relate to the catalytic reaction. Th
while all the other spectra do have it,
p ecies. This change in carbon content had no influence
nce
sence on the surface of carbon-containing compounds. They will introduce into the
spectra the C2s and C2p components as well as the components corresponding to carbon-
oxygen hybridized orbitals. In such a view the comparison of the VPO VB shown on Figure
4-20 and Figure 4-21 with the VB of binary vanadium oxides from Figure 4-9 and [105],
[106], [108] as well as with the VB of P2O5 [109] and carbon films [110] can help

82
ted to carbon valence orbitals [110] as well as the peak at 10 eV, which grows up
in the
understanding of peculiarities of VPO VB. The small peak at 1 eV can be assigned to V3d
states, which are inherent to vanadium oxides with oxidation sate of vanadium lower than 5.
The broad structure with three peaks between 3 and 13 eV is mostly formed by O2p states
hybridized with valence orbitals of vanadium, phosphor and carbon atoms. The peak at 15 eV
can be rela
n-butane/He atmosphere on Figure 4-21. Therefore, the valence band region of VPO
has quite a complicated structure with contribution of several elements and consequently, is
not suitable for extraction of reliable information about the electronic structure of elements
without additional extensive experimental and theoretical studies.

Vanadium phosphorus oxide catalyst
Figure 4-20. Evolution of the VB region of the sample-1. Sample activity during the experiment is shown on Figure 4-4.
16 14 12 10 8 6 4 2 0
0,0
0,4
0,8
1,2
1,6
2,0
2,4
2,8 Valence band
a.
b.
c.
d.
e.
hv=1254 eV(KE~1250 eV)
n-bu
tane
on e
150°C
400°C
400°C
400°C
Sign
al, a
.u.
reac
tim
ixtu
r
150°C
BE, eV16 14 12 10 8 6 4 2 0
0,0
0,2
0,4
0,6
0,8
1,0
1,2
1,4
1,6
1,8
2,0Valence band
hv=730 eV(KE~720 eV)
n-bu
tane
reac
tion
mix
ture
150°C
400°C
400°C
400°C
150°C
Sig
nal,
a.u.
a.b.c.d.
e.
B.
BE, eV
D.
83
Figure 4-21. Evolution of the VB region of the sample-2. Sample activity during the experiment is shown on Figure 4-5-(a-c).
15 12 9 6 3 0
0,0
0,4
0,8
1,2
1,6
2,0
2,4
2,8
3,2
3,6
4,0
4,4
4,8
5,2
5,6
400°C
e'.
Valence bandhv=1254 eV
(KE~1250 eV)
Sig
nal,
n.u.
BE, eV
n-bu
tane
150°C
400°C
400°C
400°C
150°Cre
actio
n m
ixtu
re200°C
400°C
200°C
a.
b.
c.
d.
e''.
f.g.
h.
15 12 9 6 3 0
0,0
0,4
0,8
1,2
1,6
2,0
2,4
2,8
3,2
3,6
4,0
4,4
4,8
Sign
al, n
.u.
BE, eV
Valence band
hv=860 eV(KE~850 eV)
hv=730 eV(KE~720 eV)
n-bu
tane
150°C
400°C400°C400°C
400°C
150°C
reac
tion
mix
ture
200°C
400°C
200°C
a.
b.
c.
d.
e''.
f.g.h.i.
B. D.

84
4.7 Change of vanadium oxidation state.
The XP spectra of various vanadium oxides, which are the reference compounds for
determination of vanadium oxidation state, were extensively discussed in literature ([105],
[106], [107], [111]). Data of a BE of V2p3/2 of these compounds are summarized in Table 4-3.
Table 4-3. Summary of data for determination of a vanadium oxidation state.
Source Oxide Ox.st. BE of
Ref. peak,eV
BE (O1s),
eV
BE (V2p3/2),
eV
FWHM(V2p3/2),
eV
∆BE (O1s-V2p3/2),
eV
5 517.1 0.8-1.4 12.9 Figure 4-8 V2O5,
reduced 4 O1s
530.0 530.0 515.6- 1.3-1.4 14.0-14.4 516.0 V2O5 5 529.8 516.9 1.6 12.9 VO2 4 529.9 516.2 3.2 13.7 VO2 4 529.7 515.9 4.1 13.7 V2O3 3 530.1 515.7 4.2 14.4
[10
V2O3 3 holder
530.3 515.9 3.8 14.4
5] FE of
sample
V2O5 5 517.2 1.2 (12.8) VO2 4 516 1.95 (14.0) [106] V2O3 3
Au4f/C1s84.0/285 (530)
515.85 4 (14.15) V2O5 5 529.8 517.0 1.3-1.4 12.8 V6O13 4.33 530.0 516.5 3.4 13.5 VO2 4 530.0 515.65 4.0 14.35 [107]
V2O3 3
O1s 329.8/ 530.0
530.0 515.15 4.8 14.84 V2O5 5 530.0 517.1 1.1 12.9 VO2 4 530.1 516.2 2.5 13.9 [111] V2O3 3
FE of Au 530.2 515.6 3.5 14.8
The fact, that the peaks corresponding to the 5+ and 4+ oxidation states are nicely
separated can be used for determination of a relative amount of atoms in a certain oxidation
state or for estimation of an average oxidation state. The data for the ∆BE for V5+ are very
well internally consistent, but the data for V4+ and V3+ have big scattering. Nevertheless, the
V3+ component in the V2p3/2 peak always has a lower BE and a greater width compared with
V4+. In the case of admixture of the V3+ component to a spectrum having the main V4+
component the resulting spectrum would be asymmetrically broadened towards the low-BE
side. As we will see further below, this is not the case for the recorded VPO spectra.
There are several procedures to estimate an oxidation state from an XPS spectrum.
Peak-profile fit is a mostly used procedure. Determination of the oxidation state x by
this method implies that the peak consists of several components of known profile. Each of
Vanadium phosphorus oxide catalyst
85
these compon ole oxidation
state n. Fit of the experimental spectrum points yi by sum of the components y(xi) is
usually
ents corresponds to the contribution of atoms with a certain wh
performed by minimization of the square deviation ( )( )∑ −i
ii xyy 2 by variation of
component areas and in some cases also by variation of widths, positions and line shapes (for
example Gauss-Lorentz ratio in the Voigt profile). Nevertheless, this method implies
know e use
some idealized profiles, such as the Voigt (or the simpler to handle Gauss-Lorentz product) or
Doniach-Sunjic profiles. This idealization is ba su b ys al
processes of X-ray emission, monochromatizat photo ssion, photoelectron scattering
and photoelectron kinetic energy monochromati ission
lines is usually a o b orent cause of the e b g, w ray
monochromator n e tron energy a i e th aussian ument
broadening. Differential charging is usually as to uce t aussian ening.
The result of convolution of these is oig le. In etallic
material the photoelectron line shape is non-symmetrical and Doniach-Sunjic profile should
be used. Although the fit approach works quite well for low-resolution measur it is
hardly applicable ctra igh resol cause a fine of a
core-level, which often makes the peak asymme An etrical peak is
V2p3/2 spond the stat gur pa Use e mentioned above
profiles for an asy rical peak would lead to em or in the calculat ation
state. Another problem, which is neverthele en oble r estim
oxidation state fr S da is limited adap of ncep proporti y of a
formal oxidation state to a BE position of the co
integer charge values only. Additionally, a BE position depends on the final-state effect,
the sam
main rule in
ledge of the shapes of these components, which is quite rarely available. Usually on
sed on sim
ion,
ple as mptions a out the ph ic
emi
zation. The intrinsic profile of photoem
ssumed t e l zian be life-tim roadenin hile an X-
and a lec nalyzer ntroduc e g instr
sumed introd he g broad
profiles the V t profi the case of a m
ements,
to spe measured with a h ution be of structure
trical. example of an asymm
corre ing to V5+ e on Fi e 4-8 ( ge 72). of th
m em t a syst atic err e dd oxi
ss, a g eral pr m fo ation of an
om XP ta tability the co t of onalit
mponent. The BE position is sensitive to the
effective charge of the atom or ion in the lattice, which in general, cannot be described by
which also depends on the atom surroundings. This can lead to different binding energies of
compounds with the same formal oxidation state and finally, to an error in the estimated
oxidation state. The last and probably, the most important problem of this method is
uncertainty in fit parameters. This usually appears in low-resolution spectra with strong-
overlapping components. Such a profile can be successfully fitted by various numbers of
components with various widths and relative binding energies. In such a case the analysis of
e experimental data by different persons can give completely different results. The
the analysis of such overlapping spectral structures is to fix or constrain from a
priori or a posteriori knowledge as many fit parameters as possible. Nevertheless, this meets

86
t, its relati
difference spectrum approach, which is based on subtraction from the data of a reference
with success not always and an absolute value of oxidation state received by this approach can
be easily criticized.
Another approach to estimate an oxidation state or at leas ve change is the
spectrum of a compound with known oxidation state. Although this approach is free from
most drawbacks of the peak-profile fit method, it nevertheless, implies very careful BE
calibration and peak amplitude normalization because even small shifts, which would not
affect the fit procedure results, will lead to appearance of additional structure in the difference
spectrum. The correct subtraction procedure is described in [112] and an example of its
application can be found in [113]. Charging or other effects causing broadening of a peak
would strongly affect in a negative way the shape of the difference spectrum. To compensate
the broadening one can convolute the subtracted spectrum with a gausssian of an appropriate
width. The method of a difference spectrum is especially valuable for analysis of small shape
changes while in the case of pronounced changes and symmetrical components it will give
practically the same result as the fit procedure, but will cost much more in data manipulation
efforts.
Some other methods can be applied to extract information about a mean oxidation
state. Coulston et al. [25] estimated the dependence of a vanadium oxidation state of VPO
on a difference of first momenta of the O1s and V2p peaks3/2 . The equation x=13.82-
0.68*[O(1s)-V(2p3/2)] was estimated for the oxidation state x by reference compound
measurements (here the first momenta O(1s) and V(2p3/2) should be measured in eV). The
result is independent on peak broadening because symmetric broadening will not change the
first momenta. The disadvantage of the method is dependence of a first momentum of the O1s
peak on the presence of adsorbates. This method is hardly applicable for our case because
adsorbates are obviously present on the surface.
The method of a difference spectrum was chosen as the most suitable method for
determination of a change in oxidation state on base of our experimental data. Application of
the fit method could lead to a bigger error in oxidation state because of uncertainty in
component widths and positions.
The V2p3/2 spectra of the sample-1 and sample-2 during the experiment of heating-
cooling in the reaction mixture are shown on Figure 4-22. The same spectra were already
presented as the spectra (a-b) on Figure 4-14 and (a-c) on Figure 4-15. The difference spectra
are also shown on this figure.

Vanadium phosphorus oxide catalyst
87
spectra of the sample-1 and sample-2 before and after heating in the reaction mixture.
e Table 4-3). The same feature was observed
in the d
served for the sample-2. The difference spectra on Figure
4-22-B
n and does not change with temperature.
Figure 4-22. V2p3/2
The spectra of the sample-1 are shown on Figure 4-22-A. The spectra reveal strong
changes of vanadium oxidation state with temperature. The peak at 517 eV is clearly visible
in the difference spectra for both bulk (spectrum c-d.) and surface (spectrum a-b.) sensitive
measurements. This peak has a BE-difference of about -13 eV relative to the maximum of
O1s, which is a typical value for V5+ species (se
ifference between bulk and surface spectra at 150°C (the spectrum c-a.) and at 400°C
(the spectrum d-b.). This means that a strong gradient in oxidation state is present in the near-
surface region of the sample-1 under the reaction and non-reaction conditions.
Different behavior was ob
show only small features with amplitudes of about the noise amplitude, which implies
that no changes are observed in the spectra within the uncertainty of our experiments. This
leads us to the conclusions that a vanadium oxidation state of the sample-2 is uniform with
depth in the near-surface regio
520 518 516 514 512 510
hv=730 eV
400°C150°C
a-b.b.a.S
igna
l, n.
u.
520 518 516 514 512 510
c-a.
hv=1254 eV
150°C400°C
d-b.
Sign
al, n
.u.
c-d.d.c.
A. B. sample-1 sample-2
BE, eV
520 518 516 514 512
hv=860 eV
400°C200°C
200°C
c-ba-bc.b.a.
Sign
al, n
.u.
520 518 516 514 512
hv=1254 eV
400°C200°C
e.d.
200°Cd-ef.
e-bf-e
Sign
al, n
.u.
BE, eV

88
On Figure 4-23-A the spectra under reaction conditions (the reaction mixture, 400°C)
the spectra it is obvious that values of oxidation state of the surface of the catalysts are closer
Figure 4-23. Comparison of the V2p3/2 peaks of the sample-1 and sample-2 in the reaction gas mixture.
ent should be
estimat
mple-1 relative to the
active surface of the sample-2 can be estimated from the difference spectra a-c. and b-d. on
are drawn. These spectra were already shown on Figure 4-22-A and -B. From comparison of
to each other than values of oxidation state of the bulk.
520 518 516 514 512
b-c.
150°C
400°C
differencehv=1254 eV
hv=730 eV
hv=1254 eV
hv=860 eV
hv=730 eV
sample-2
sample-1
a-c.
c.
b.
a.
Sign
al, n
.u.
BE, eV
A. B.
520 518 516 514 512
difference
400°C
hv=1254 eV
hv=730 eV
hv=1254 eV
hv=1254 eV
hv=860 eV
hv=730 eV
gaussian
sample-2
sample-1
d-e.
e.
b-d.
a-c.
d.
c.
b.
a.
Sign
al, n
.u.
BE, eV
The shape of the surface V2p3/2 peak of the sample-2 (spectrum d on Figure 4-23-A)
under reaction conditions can be fit with a single gaussian with the maximum at 515.85 eV.
This value falls into the BE region of the V4+ component (Table 4-3). To estimate a
confidence interval for the determined oxidation state one should take into account an
uncertainty in the calibration of BE scale in our experiment, which cannot be better than
±0.05, and scattering of the data in Table 4-3. The resulting uncertainty in position of the peak
maximum in the spectrum d. relative to the true position of the V4+-compon
ed to be ca. 0.1 eV. The variation of an oxidation state estimated by the fit of a VPO
spectrum by two gaussians with variation of a V4+-component position was found to be 0.1
per 0.1 eV. This means that the oxidation state of the sample-2 at the reaction conditions is
(4.0 ± 0.1) eV.
An excess of the V5+ in the bulk and on the surface of the sa

Vanadium phosphorus oxide catalyst
89
Figure
error values correspond to the noise
level in the difference spectra. From correlation of these data with information depth (Table
4-2) it is in ace
region with thickness of one or several nm. Extrapolation of a(λ) for λ→0 will give a(0)≈0,
which implies the identical oxidation state of the surface of the sample-1 and sample-2. Below
ribution.
the
ng the
4-23-A for 400°C and from the spectra a-c. and b-c. on Figure 4-23-B for 150°C. At
400°C the part of the V5+ component area ∆A in the whole peak area A is a=∆A/A=(0.12 ±
0.04) in the surface sensitive mode and (0.19 ± 0.01) in the bulk sensitive mode. At 150°C
this is (0.19 ± 0.01) and (0.32± 0.01) respectively. The
tuitively obvious that change of an oxidation state takes place in the near-surf
this statement will be proven by use of some simple models of an oxidation state dist
Firstly the simple linear distribution of an oxidation state with depth can be
suggested. If the oxidation state of the surface of the sample-2 is denoted by xS2, than
part of vanadium atoms in the 5+ oxidation state c=n5+/n in the sample-2 (assumi
presence of 5+ and 4+ only) will be:
( )1.00.04-xc S2S2 ±== (4-1)
The same quantity for the sample-1 will depend on the depth z:
zc ⋅+= α0c(z) (4-2)
where c0=c(0) and α is a constant gradient of c.
The relative contribution C(λ) of vanadium atoms in the 5+ oxidation state into the
V2p3/2 XPS peak can be found as:
dzezndzeznC zz λλλ −−+ ∫∫ ⋅⋅=
005 )()()( (4-3)
Here c(z) was convoluted with the probability of photoelectron escape 1/λ⋅e
∞∞
-z/λ, which
depends on the photoelectron inelastic mean free path λ and thus, on a photoelectron kinetic
energy. Assuming the concentration of vanadium atoms n(z) to be uniform with depth and
substituting n5+/n=c(z) from equation (4-2) we will get the equation for the difference ∆C(λ)
between the contribution C(λ) of V5+ to the spectrum of the sample-1 and the analogous
contribution CS2 to the spectrum of the sample-2:
λαλαλλ ⋅+∆=⋅+−=−=∆ 0202)()( cccCCC SS (4-4)
This quantity is also connected with a=∆A/A estimated from the difference spectrum:
( ) acC s ⋅+=∆ 21)(λ (4-5)
Substituting this equation into (4-4) we obtain:
( ) λα ⋅+∆=+⋅ 1 cca (4-6)
and consequently, ∆c
s 02
0 and α will be found as
( )( ) ( )
21
22
11
20 11
λλ
λλλλ
−
⋅−⋅+=∆
aacc S
(4-7)
( ) ( ) ( )12
1221
λλλλα
−−
⋅+=aacS (4-8)
The errors of these quantities can be estimated as:
( ) ( )( )( ) ( )( )
211 λ
22
11
20 1λ
λλλλ ⋅+
⋅+=∆aerroraerror
ccerror S(4-9)
−
( ) ( ) ( )( ) ( )( )12
1221
λλλλα
−+
⋅+=aerroraerrorcerror S (4-10)
4-10) the values of a
obtained from Figure 4-23-A and -B and corresponding λ from e 4-2 we will get
∆c0150°C ± α150°C ± -1 ∆c0
400°C= (0.03 ± 0.09), α400°C= (0.09
± 0.05) nm
) im ∈(0,∞), which makes no sense at high z,
where c(z) calculated using this formula will be grater than unity. Thanks to the presence in
the formulas (3-3)-(4-3) of e-z/λ, which is decreasing much faster at z→∞ than α⋅z is
increasing, the product can be well integrated on this semi-infinite interval. The deviation δ
from th p
The cS2 value is known from (4-1). Substituting into (4-7) - (
Tabl
= (0.06 0.01), = (0.14 0.01) nm , and -1. These values are nevertheless, overestimated because our model (Equation
(4-2) plies linearity of c(z) in the whole region z
e real values can be estimated assuming that the linear model (4-2) is held erfectly
true in the region z∈(0,λ2):
( )121
210 11
1 λλ
λλαδ −− −⋅
−+
⋅=∆ eecc (4-11) 2S
( )1221
21
2
11 λ
λλα1 λλλδα −− ⋅ e (4-12)
The deviations found by these formulas are: δ∆c0150°C= 0.06, δα1 .08 nm-1, and
δ∆c0400°
and therefore, the linear model can be referred to as having acceptable accuracy.
−⋅−+
= ecS
50°C= 0C= 0.04, δα400°C= 0.05 nm-1. These values are comparable with the experimental errors
90
Vanadium phosphorus oxide catalyst
91
ives a reliable value of the surface
oxidation state, it does not help to find the thickness of the surfac
take place. To estimate the value of this thickness one can use the step-like distribution
model:
Taking into account that one deals with the well-equilibrated catalysts which were
working for a long time, it is reasonable to assume that the catalyst bulk will not change its
oxidation state coming from a low temperature to the reaction conditions and all changes will
take place in a near-su ncentration c1 will be taken the
same for both the low-temperature and the reaction temperature. The thickness d is supposed
to change with temperature and will be respectively denoted d400°C an The surface
concentration c0 will be taken as the same for both temperatures to equalize a number of
parameters with the number of equations. Although this assumption is not ely correct,
from the linear model we know that a surface oxidation state should not be very different for
these t
Although the linear model discussed above g
e layer there the changes
⎭⎬⎫
⎩⎨⎧
>≤
=dzdz
cc
,,
c(z)1
0 (4-13)
rface region. Therefore, the bulk co
d d150°C.
absolut
wo temperatures and therefore, this simplification does not lead to a significant error.
The relation between the quantity a and other parameters will be found by analogy with the
linear model:
( ) λdbs eccca −⋅∆+∆=+⋅ 021 (4-14)
where ∆c =c -c0 0 S2 and ∆c =c -cb 1 0. Substituting into this equation a (λ )150°C1 , a (λ )150°C
2 ,
a (λ )400°C1 and a (λ )400°C
2 we will get a system of four equations with the set of variables ∆c0,
∆cb, d150°C, d400°C. This system should be solved numerically and the solution is: ∆c0= (0.08 ±
0.08), ∆cb= (0.5 + 0.3), d150°C= (2 ± 1) nm, d400°C= (3.5 ± 2.0) nm, where the errors were
obtained by variation of values of a within their errors. One should note that the obtained ∆c0
value is the same as for the linear model within the experimental error.
From the results of the calculations based on these two mo e should conclude
that both catalysts have the same oxidation state of the outmost surface molecular-layer at the
reaction conditions within the experimental error. The thickness of r in which changes
of oxidation state take place is several nanometers.
s
g conditions
comparing the sample-2. MA yield for the sample-1 also decreases much faster (see Figure
dels on
the laye
Stability of the active layer towards reducing conditions can be demonstrated by in
situ XPS data for the amples in n-butane/He atmosphere. It is clearly visible on Figure 4-24
that the surface of the sample-1 responds much more dynamically to the reducin

92
4-6 on
n state of the two surfaces was the same for both catalysts under reaction conditions,
which suggests the same nature of the surface layer for both catalysts. This implies that the
oxygen transport from the substrate to the surface is tter for the -2 as compared to
the sam
page 70). There could be two reasons for the different response of these two samples to
the change of conditions: either differences in properties of the active layer or different
interaction with deeper layers (substrate). The second hypothesis is more probable since the
oxidatio
be sample
ple-1. Obviously, this does not influence significantly the catalytic performance of the
active layer in the co-feed of oxygen and n-butane, but apparently makes sample-2 more
stable with respect to condition changes.
Figure 4-24. Changes of the surface V2p3/2 spectra in n-butane at 400°C.
520 518 516 514 512
sample-2120 min.20 min.
sample-130 min.
difference
c-a.d-a.
b.
sample-2
sample-1
in n-butane/Heatmosphere
30 min.
120 min.20 min.
c.
d.
e.
, n.u
.
samplesample-
in reaction mixture
e-
a.
b.Sign
al
-21
BE, eV
Vanadium phosphorus oxide catalyst
4.8 Stoichiometric ratios.
The possibility of estimation of a surface stoichiometry is one of the main strengths of
the XPS technique. Nevertheless, the problem of sensitivity factors usually comes up during
estimation of absolute values of stoichiometric ratios. Most estimations in literature are based
on the theoretical cross-sections [23] and [95], which were shown to give a wrong result for
some compounds [25]. G.W. Coulston with colleagues ([25]) have experimentally estimated a
sensitivity factor for the P/V stoichiometric ratio by measurement of some organometallic
compounds.
93
In the present work measurements of some reference compounds have been performed
in order or this
purpose XP spectra of V2O5 and αII- , β-, γ-VOPO4 (the structure of VOPO4 compounds was
checked by XRD) in O2 atmosphere at room temperature were recorded. No contribution of
oxygen gas phase is expected to an O/V stoichiometric ratio because the surface and the gas-
phase O1s XPS peaks are well resolved. Additionally, CO2 gas phase was used as a reference
for estimation of a C/O ratio. The experimental sensitivity factors (Table 4-4) were estimated
as a formal stoichiometry of a compound divided by the peak area ratio. Here and further
calculation of a peak area implies preliminary normalization of an XPS signal to an electron
current in the electron storage ring in order to take into account change of X-ray intensity with
time. The theoretical cross-sections presented in the same table were calculated according
equation (3-7) on page 16 as
to estimate experimental sensitivity factors for O/V, P/V and C/V ratios. F
( )B
A
BB
AA
kfkfBAS
σσ
⋅⋅⋅
= 0
0
(4-15)
where fA,B0, kA,B and σA,B are an X-ray flux before the X-ray window, a transmission
of the X-ray window and a photoionization cross-sections at respective hv. The stoichiometric
ratio thus, will be found as
( )BASII
nn
B
A
B
A = (4-16)
One should note the big scattering of the data for calculation of O/V and P/V
sensitivity factors in Table 4-4 and Figure 4-25.

94
Table 4-4. Sensitivity s of some reference compounds and their comparison with calculations based on [23].
factors estimated from peak area ratio
KE=290 eV KE=470 eV KE=290 eV KE=470 eV Average O/V O1s/V2p3/2 area ratio Sensitivity factor S(O/V)
V2O5 in O2 2.5 1.33 1.91 0.53 0.76 4 3.60 3.86 0.90 0.97 4 3.66 3.67 0.92 0.92 α-, β-, γ-
VOPO4 in O2 4 3.05 3.11 0.76 0.78 Average 0.78±0.18 0.86±0.10
Theoretically calculated 0.39 0.39
Correction coefficient 2.0±0.5 2.2±0.3 2.1±0.5 P/V P2p/V2p3/2 area ratio Sensitivity factor S(P/V)
1 4.37 8.77 4.37 8.77 1 3.29 6.45 3.29 6.45 α-, β-, γ-
VOPO4 in O2 1 3.62 7.30 3.62 7.30 Average 3.8±0.6 7.5±1.2
Theoretically calculated 1.9 3.4
Correction coefficient 2.0±0.3 2.2±0.5 2.1±0.5 C/O C1s/O1s area ratio Sensitivity factor S(C/O)
CO2 gas 0.5 0.71 1.45 1.43 2.90 Theoretically calculated 1.83 3.54 Correction coefficient 0.8 0.8
Figure 4-25. Dependence of O1s/V2p3/2 peak area ratios of some reference compounds on the nominal O/V atomic ratios and its comparison with a calculation on base of [23]
0,0 0,5 1,0 1,5 2,0 2,5 3,0 3,5 4,0 4,50,0
1,5
2,0
4,0
0,5
1,0
2,5
3,0
3,5
KE=290 eV KE=470 eV
Theoretical
α−, β−, γ−
are
a ra
tio
VOPO4
V2 5
s/V
2p3/
2
O/V stoichiometric
O
O1

Vanadium phosphorus oxide catalyst
95
The error in the average sensitivity factor was estimated as a standard deviation of the
data. y is
practic le, this scattering clearly indicates that a surface stoichiometry is
different from the forma r u a his
experimen al sens fa ed as a surface
stoichiom easurem f a stoic etry of a VPO compound with
the ios /V=4. P/V=1 re 4-26) shows that the estimation of a
stoichiometry on the base of the experime corre vit closer to the
real value than the theoretical ivity fac or example, the
theoretical valu :V=9:2:2:1 over the topmost wou ite
doubtful because of the presence of mount of oxygen.
6. timate mic rati a VPO ound w nominaichiometry P/V=1, O
The measureme on mixture. Atomic were calcul ng the data from y estimated sensiti l
Although reliable independent estimation of a real value of surface stoichiometr
ally not possib
l stoichiomet y of a compo nd and the c lculations on base of t
t itivity ctors should be view rough estimation of the
etry. Nevertheless, test m ents o hiom
nominal rat O 5 and (Figu
ntally cted sensiti y factors is
the estimation on base of sensit tors. F
e of stoichiometry O:P:C 1.5 nm ld be qu
an enor amous
Figure 4-2 Es d ato os for comp ith the l sto /V=4.5.
nts were performed in the reacti ratios ated usi[23] and the experimentall vity factors (Tab e 4-4).
200°C 400°C 200°C0
1
2
3
4
5
6
7
400°C
10
8
9
200°C 400°C 200°C 400°C0
1
2
3
4
5
6
7
01
8
9 KE 290 eV 470 eVO/V P/V C/V
Calculated usingexperim lnsitivity tors
Ato
mic
ratio
ent fac
ase
Calculated usingtheoretical
cross-sections

96
e literature (Figure 3 in
[25]), where it was found to be equal 2. The error of the correction coefficients determined for
the ki ients.
T
independently from KE to determine a stoichiometry of the VPO samples.
The estimation of a C/O sensitivity factor is very precise because the stoichiometry of
the CO2 gas molecules is well known and the error is dependent only on an uncertainty in the
peak area, which usually does not exceed 10%. Would one use some gas reference
compounds, which are not so stable as CO2, mass-spectrometry will offer a possibility to
estimate the average stoichiometry of the gas mixture. Therefore, high-pressure XPS on gas-
phase reference compounds offers a solution of the general problem of precise estimation of a
surface stoichiometry.
Correction coefficients were estimated as a ratio between the experimental and
theoretical sensitivity factors. A stoichiometry of the VPO samples estimated with help of the
theoretical cross-sections was corrected by division on these coefficients. The value of the
correction coefficient for S(P/V) matches the value estimated in th
netic energies is greater than the difference between the values of the coeffic
herefore, the average correction coefficient 2.1 was used for both S(O/V) and S(P/V)
An X-ray flux normalized to a storage ring electron current, the transmission of the
100-nm-thick X-ray window and the theoretical cross-sections calculated by the
approximation from [24] for the data [23] are presented in Table 4-5.
Table 4-5. Data for calculation of a stoichiometry of the sample-2.
hν, eV
Photon flux / synchrotron ring
current, a.u. / mA
X-ray window
transmission [37]
σ, Mb
O1s V2p3/2730 3.70 0.83 0.25 0.64 860 3.25 0.89 0.17 0.43 1254 1.29 0.96 0.064 0.16
P2p 335 1.44 0.57 1.16 465 2.80 0.57 0.50 854 3.23 0.89 0.089
C1s 485 2.93 0.60 0.29 615 3.52 0.75 0.16 1005 2.60 0.93 0.042

Vanadium phosphorus oxide catalyst
97
tainty in a peak area. The error in the average O/V and P/V
values
Sensitivity factors calculated using this data were corrected by division of the average
coefficients from Table 4-4. Relative changes in the stoichiometry of the sample-1 are
presented in Table 4-6. The absolute numbers were not estimated for this catalyst because of
technical problems, but the data for the sample-2 are enough to make a conclusion about
stoichiometry of the active surface. Absolute values of the stoichiometry of the sample-2 are
listed in Table 4-7. A random error of the stoichiometric data can be estimated to be 10%,
which is coming from the uncer
represents a standard deviation of the data from the mean value.
Table 4-6. Change in a stoichiometry of the sample-1
Peak area ratio T,°C gas O1s/V2p3/2 P2p/V2p3/2 C1s/V2p3/2KE=200 eV
150 r. mixture 4.05 0.50 1.16 400 r. mixture 3.74 0.55 0.71 400 n-butane/He 3.72 0.53 0.66 400 n-butane/He 3.75 0.57 0.74 150 n-butane/He 3.86 0.51 0.96
KE=720 eV 150 r. mixture 3.19 2.35 0.75 400 r. mixture 3.08 2.37 0.68 400 n-butane/He 3.12 2.38 0.51 400 n-butane/He 3.14 2.50 0.60 150 n-butane/He 3.19 2.42 0.72

98
Table 4-7. Change in a stoichiometry of the sample-2
Area ratio Corrected atomic ratio T,°C Gas O1s/V2p32 P2p/V2p32 C1s/V2p32 O/V P/V C/V KE=330 eV
200 r. mixture 4.00 1.56 1.71 4.86 1.17 3.05 400 r. mixture 3.78 1.70 1.07 4.60 1.28 1.92 200 r. mixture 3.79 1.53 1.02 4.60 1.15 1.81
KE=200 eV 150 r. mixture 4.22 1.28 2.45 5.10 1.27 5.67 400 r. mixture 3.53 1.17 0.12 4.27 1.16 0.27 150 r. mixtur 1.20 2.48 e 3.80 1.21 1.07 4.60 400 r. mixture 3.59 1.16 0.16 4.35 1.15 0.38 400 n-butane/He 3.69 1.07 4.46 1.05 0.53 0.23 400 n-butane/He 3.77 1.02 0.81 1.03 0.35 4.57 400 n-butane/He 3.89 1.20 1.04 0.52 4.71 1.03
Average 4.6 1.1±0.1 ±0.2KE=720 eV
200 r. mixture 2.94 1.69 4.13 1.09 1.98 3.48 400 r. mixture 2.85 1.34 4.00 1.05 1.56 3.37 200 r. mixture 2.70 1.07 3.92 1.00 1.25 3.30 150 r. mixture 3.38 2.28 4.02 1.31 2.67 3.53 400 r. mixture 3.63 0.11 3.90 1.34 0.13 3.28 400 r. mixture 3.23 0.14 3.68 1.20 0.16 3.10 150 r. mixture 3.36 1.16 3.89 1.24 1.36 3.28 400 r. mixture 8.12 1.18 3.81 (3.00) 1.39 3.21 400 n-butane/He 3.22 0.54 3.8 1.19 0.63 3.24 5
Average 3.9±0.1 1.2±0.1
The C/V ratio correlates well with conditions. The ratio is increasing with time in an
n-butane/He atmosphere, after cooling down and after staying in air between the experiments
and decreasing after the heating to 400°C. C/V values for the sample-2 in the points e'bulk and
e''bulk on Figure 4-19, which were discussed in the part 4.6, have the values of 0.13 and 0.16.
Therefore, no decreasing of the carbon content was observed for these two measurements.
The O/V ratio shows small variations with conditions, which correlate well with
variations in the C/V ratio. Therefore, these deviations can be related to a change of amount
of adsorbates. The mean value of 4.6 for a surface O/V ratio compared with O/V of 3.9 for the
greater information depth also indicates the presence of adsorbates. The last value is smaller
than the values of 4.5 for (VO)2P2O7 and 5.0 for VOPO4. These phases are expected for the
bulk according to the sample characterization (part 4.3). The disagreement in O/V ratios is
probably, because of the presence of adsorbates on the surface of reference samples, which
would cause an overestimation of sensitivity factors and as a consequence, an underestimation

Vanadium phosphorus oxide catalyst
99
of an O/V ratio for the sample-2. This fact nevertheless, should not have any influence on P/V
and C/V ratios.
Changes in P/V ratios of the nd sample-2 are shown on Figure 4-27 and
Figure 4-28.
ure nge o osphor dium stoichiometri o of mp
150°C 400°C 400°C 400°C 150°C
sample-1 a
Fig 4-27. Cha f a ph -vana c rati the sa le-1.
150°C 40 400°C 150°C0°C 400°C
KE=720 eV
0
P2p
/V2p
3/2 a
rea
ratio
, a.u
.
reaction mixture n-butane / He
KE=200 eV
0
P2p/
V2p 3/
2 are
a ra
tio, a
.u.

100
Change of a phosphor-vanadium stoichiometric ratio of the sample-2.
The points are random
Table 4-6 and Table 4-7. The m le-2 is 1.1 for the surface
perimental error. No
compared with the formal stoich g uncertainty of the
experime
gradient in the phosphor content w to literature ([86],
[88], [96] and others).
Figure 4-28.
200 00°C 400°C0,0
0,2
0,4
0,6
0,8
1,0
1,4
1,2
ly distributed within the error and do not show any correlation
with conditions. No correlation can be also drawn between the P/V and O/V or C/V ratios in
ean value of P/V ratio for the samp
and 1.2 for the bulk, which can be considered as the same within the ex
strong conclusions can be drawn about enrichment or lack of phosphor on the surface as
iometric value of 1.05 because of the bi
ntal sensitivity factors (Table 4-4). But it is obvious, that no great enrichment and
as found near the surface in contrast
°C 400°C 200°C 150°C 400°C 400°C 150°C 400°C 400°C 4
n-butane / Hereaction mixture
P/V
stoi
chio
met
ric ra
tio
KE=200 / 330 eV KE=730 eV

Vanadium phosphorus oxide catalyst
101
4.9 Discussion of the experimental results
ation of
towards M ic
activ
to be (1.2
ts
nstrated a
significan a
low tem
with dep s were
estimat
oscopic data are direct experimental proof of this fact. Therefore, one
can conclude that deeper layers are a substrate for the active layer and their structure does not
necessarily match the structure of the active layer. This easily explains the disagreements in
the theories based on the not surface sensitive techniques discussed in the literature review
part. The oxidation state of surface vanadium atoms found in this work is well consistent with
the 4+ vanadium oxidation state of vanadyl pyrophosphate, which is usually found in the
long-time operating catalyst. It is reasonable to assume that the diffusion process will equalize
oxygen concentration over depth and thus, will equalize vanadium oxidation state.
Nevertheless, the experimental error does not allow us to exclude the presence of some
amount of V5+ or V3+ on the surface. Moreover, it is reasonable to assume the presence of
such V atoms taking into account the polycrystalline nature of the catalyst, which should
Experimental data presented in this work are the result of the first XPS investig
VPO catalysts under reaction conditions. Two investigated catalysts were found to be active
A under the low-pressure (2 mbar) reaction conditions. The ratio of the intrins
ity of the sample-2 under the low-pressure conditions to that of the sample-1 was found
±0.3). Therefore, the catalysts have nearly the same intrinsic activity and
consequently, the same order of magnitude of a number of active species per surface area
unity. Tracing of similarities and differences in the experimental data for these two catalys
would allow to move closer to clearing up the mystery of the nature of the active species
responsible for the formation of MA on the VPO surface. The samples demo
tly different spectral behaviour during heating to the reaction temperature from
perature at which practically no MA was produced. The sample-2 showed no changes
in vanadium oxidation state, while for the sample-1 changes in distribution of oxidation state
th were observed. At the reaction conditions the surfaces of both catalyst
ed to have the same value of a vanadium oxidation state, but a different gradient of
oxidation state. A distribution of oxidation state with depth for the sample-2 was
homogeneous, while the sample-1 demonstrated an increase with depth of the V5+ component
in the V2p3/2 peak. The thickness of the layer where the changes of oxidation state take place
was estimated to be (3.5 ± 2.0) nm. One should note that the layer which directly participates
the catalytic cycle should obviously be thinner as it follows from general considerations and
from the literature data [78]. The existence of a surface layer of a composition which is
different from the bulk composition was already more than ones suggested in literature [61,
76, 79, 80]. Our spectr

102
contain variou e interpreted
as most V atoms on the catalytically active surface have the 4+ oxidation state, but one cannot
conclud
s kinds of surface and bulk defects. Therefore, the results should b
e from the data anything about a role in the catalytic process of a minor amount of V
atoms in other oxidation states. Although the estimated oxidation state of the active material
matches the oxidation state of vanadyl pyrophosphate crystalline phase, this data cannot be
viewed as a confirmation of the fact that the active phase is vanadyl pyrophosphate. On the
contrary, one can suggest that the vanadyl pyrophosphate structure is not the structure of the
active surface. Literature data for reduction of VPO in H2 and n-butane show formation of the
(VO)2P2O7 bulk phase and no V3+-phase formation was reported [114, 115]. This means that
the vanadium pyrophosphate phase has a high stability towards reducing conditions, while our
investigation shows fast reduction of the active layer in n-butane atmosphere for both
catalysts. Moreover, numerous in situ and ex situ studies revealed (VO)2P2O7 as the main bulk
phase of a well-equilibrated VPO catalyst, which means that the vanadium pyrophosphate
phase is stable towards changing from reaction conditions to room temperature. At the same
time, in situ XAS data [79, 81, 82] clearly show that the electronic structure of the VPO
surface varies dynamically with conditions. The same observations would suggest none of the
well-ordered crystalline structures as the active phase. Furthermore, several experimental
studies reveal amorphous nature of the active surface [79-80]. The permanence within the
experimental error of a P/V ratio during our experiments allow us to suggest rather the
phosphate nature of the VPO active layer, but not a two-dimensional vanadium oxide, which
was proposed recently [79]. The main role of phosphor in the operation of the catalyst is
believed to be the setting of the correct relative position of vanadium active centers because
the reaction of n-butane oxidation to MA was shown to take place also on supported
vanadium oxides without presence of phosphor [116]. One can assume two factors. Firstly, it
is insulation of oxygen domains, known as site insulation [89]. Secondly, phosphor could set
a distance between two neighbor vanadium atoms so, that it fits the size of the n-butane
molecule and consequently, the molecule can be easier accommodated [93].
As it was shown in this work, the composition of the surface layer can be different
from the bulk that without a significant difference in the catalytic performance compared to
the performance of a homogeneous VPO material. This fact clearly points to the development
of supported vanadium oxides as a way of further improvement of a catalyst for the steady-
state catalytic process. Several groups are involved in investigation of supported VPO [61, 62,
63]. Although a catalytic performance of produced samples is still far away from a bulk
commercial catalyst, this field of activity looks very promising first of all, because of the
Vanadium phosphorus oxide catalyst
103
principal possibility to employ a cheap support material instead of complicated prepared bulk
VPO and because of expected significant decrease of the catalyst activation period.
Additionally, study of alumina supported vanadium oxides [116] shows a principal possibility
to produce maleic anhydride from n-butane without use of phosphates, which would be
another option for developing an improved catalyst for this reaction.
Another type of VPO catalyst is the catalyst for the unsteady-state DuPont process, i.e.
the recirculating-solids process. A catalyst employed in this process should satisfy additional
requirements comparing a catalyst for the steady-state process [117]. The material should
readily supply bulk oxygen to the surface to make possible long-time catalyst operation under
reducing conditions. Moreover, the material should be easily reoxidizable in the regeneration
part of the operating cycle, which also implies good oxygen exchange between the gas phase,
the surface and the bulk. In situ XPS is the unique technique, which provides a possibility to
perform direct studies of lattice oxygen exchange in a near-surface region. Such studies were
performed on bulk vanadium oxides [118] and can be readily performed on supported
vanadium oxides [116]. The studies in the present work were performed in the reducing n-
butane/He atmosphere. Change with time of a vanadium oxidation state of the samples
correlates well with change of the MA yield. The sample having a better homogeneity with
depth showed slower changes in oxidation state and in MA yield compared with the other
sample. This implies better interaction of the active surface layer with the bulk in the sense of
oxygen exchange, which immediately leads us to the conclusion about better suitability of a
material of this catalyst towards condition changes in the unsteady-state process. These results
show the power of in situ XPS method for the investigation of interaction phenomena of the
active layer and a substrate, which would be extremely important for designing of supported
catalysts for unsteady-state catalytic processes.
104
maleic anhydride production from
e of the main factors influencing the catalytic
performance of the catalyst was not found to have any systematic changes during change of
conditions. Scattering of the data points was within the experimental error. An absolute value
of P/V ratio was calculated using experimental correction coefficients to theoretical sensitivity
factors. The coefficients were estimated using XPS data of some solid reference compounds.
An average P/V ratio of the VPO sample was found to be close to unity and did not change
with depth. The uncertainty in the sensitivity factors does not allow formation of strong
conclusions about the phosphor enrichment or depletion on the surface. More precise
measurements can be done using gas-phase reference compounds, as was discussed in part
4.8.
The process of supplying the active layer with oxygen from the bulk under reducing
conditions was investigated by leaving the sample in n-butane/He atmosphere in absence of
5 Conclusions and outlook
An experimental setup for in situ XPS investigations of the catalyst's surface was
constructed. Physical principles of the system design were described in detail in part 3. In situ
XPS technique was applied to a VPO catalyst, which is an important industrial catalyst for
n-butane. The results of the investigation were published in
[119].
Two VPO catalysts with similar intrinsic catalytic activities towards maleic anhydride
were investigated. In the reaction mixture one catalyst showed a high homogeneity of
vanadium oxidation state with depth and another catalyst had a significant gradient of
vanadium oxidation state. At the reaction conditions (2 mbar, reaction mixture, 400°C) both
catalysts had the same surface oxidation state of (4.0±0.1), while the bulk oxidation state
differed significantly. The experimental results suggest that the catalytically active species of
a VPO catalyst are located in the topmost layer of thickness less than (3.5 ± 2.0) nm. The
structure of this layer does not necessarily match the bulk structure and the bulk material is
acting as a substrate only. The finding indicates that a bulk vanadium oxidation state in
general, should not correlate with catalytic properties. The concept of an active layer with
structure different from that of the bulk can play the central role in the strategy of
improvement of a VPO catalyst. While the modern preparation methods are designed to get
the (VO)2P2O7 bulk phase, optimization of formation of the active surface layer could be more
important. In this respect, development of a supported vanadium oxide catalyst looks very
promising as a way to improve the catalyst and reduce its prices.
A P/V ratio, which is often referred as on
Conclusions and outlook
105
gas phase oxygen decreasing MA
yield. The sample state with depth
showed slo
of catalys
Nowadays one feels that there is a lack of such data in literature, but it is believed to be
. Changes in the V2p3/2 XPS peak correlate well with the
which had a better homogeneity of vanadium oxidation
wer changes in oxidation state and MA yield compared with the other sample. This
means better supply of the catalytically active layer with bulk oxygen for this sample. This
finding can be important for the catalyst design for the DuPont process, where a VPO catalyst
operates under reducing conditions. The results show also the power of in situ XPS method
for investigation of the phenomena of lattice oxygen exchange, which is important for design
ts for unsteady-state catalytic processes.
An accuracy of the XPS method could be significantly improved by obtaining
additional theoretical knowledge about the photoelectron spectral-line shapes for material
with various chemical composition and structure and about the photoionisation cross-sections.
possible to obtain it in the near future.
The results of this work together with other publications ([33], [34]) demonstrates
suitability and importance of the in situ XPS technique for characterization of the active
surface of a solid-state catalyst including a real industrial catalyst.

106
References
[1] "Catalysis from A to Z. A concise encyclopedia.", ed. B. Cornils, W.A. Herrmann, R.
Schlögl, C.-H. Wong, 1999, WILEY-VCH
[2] "In-situ spectroscopy of catalysts", ed. B.M. Weckhuysen, 2004, American Scientific
Publishers
[3] M.P. Seah, Surf. Interface Anal. 9 (1986) 85-98
[4] E.D. Boyes, P.L. Gai, Ultramicroscopy 67 (1997) 219-232
[5] P.L. Gai, K. Kourtakis, Science 267 (1995) 661-663
[6] G.D
[9] H. Hertz, "On an effect of ultraviolet light upon electric discharge", Sitzungsber. d. Berl.
Akad. d. Wiss. (1877)
[10] P.D. Innes, Proc. R. Soc. A 79 (1907) 442
[11] C. Nordling, E. Sokolowski, K. Siegbahn, Physical Review 105 (1957) 1676-1677
[12] E. Sokolowski, C. Nordling, K. Siegbahn, Physical Review, 110 (1958) 776-776
[13] A. Fahlman, K. Hamrin, J. Hedman, R. Nordberg, C. Nordling, K. Siegbahn, Nature 210
(1966) 4-8
[14] S. Hagstrom, C. Nordling, K. Siegbahn, Phys Lett 9 (1964) 235-236
[15] K. Siegbahn, Philosophical Transactions of the Royal Society of London Series A-
Mathematical and Physical Sciences 268 (1970) 33
[16] "Practical surface analysis", ed. D. Briggs, M.P. Seah, vol.1, 1990, John Wiley & Sons
Ltd.
. Danilatos, Advances in Electronics and Electron Physics 71 (1988) 109-250
[7] G.A. Somorjai, K.S. Hwang, J.S. Parker, Topics in Catalysis 26 (2003) 87-99
[8] J.R. Jenkin, R.C.G. Leckey, J. Liesegang, JESRP 12 (1977) 1-35

References
107
[17] S. Hüfner, "Photoelectron spe d applications", 2nd ed., 1996,
Springer-Verlag
Baer, "ESCA applied to free molecules",
[19] D.A. Shirley, Phys. Rev. B 5 (1972) 4709-4724
482-494
n spectroscopy", 1992, Perkin-Elmer
5) 125
[26] H n, JESRP 2 (1973), 319-325
[30] H.J Ruppender, M. Grunze, C.W. Kong, M. Wilmers, Surf. Interf. Anal. 15 (1990), 245-
niversity of California, Berkeley,
uhm, D.F. Ogletree, C.H.A. Huan, Ch. Fadley, Z. Hussain, M. Salmeron, posters
at the same conference
ctroscopy: principles an
[18] K. Siegbahn, C. Nordling, G. Johansson, J. Hedman, P.F. Heden, K. Hamrin, U. Gelius,
T. Bergmark, L.O. Werme, R. Manne, Y.
1969, North-Holland Publishing Company
[20] S. Tougard, B. Jørgensen, Surf.Sci. 143 (1984)
[21] S. Tougaard, J. Vac. Sci. Tech. A 8 (1990) 2197-2203
[22] Ed. J. Chastain, "Handbook of X-ray photoelectro
Corporation
[23] J. Yeh., I. Lindau, At. Dat. Nucl. Dat. Tabl. 32 (1985) 1-155
[24] D.A. Verner, D.G. Yakovlev, Astr. Astroph. Suppl. Ser. 109 (199
[25] G.W. Coulston, E.A. Thompson, N. Herron, Journal of Catalysis 163 (1996) 122-129
. Siegbahn, K. Siegbah
[27] H. Fellner-Feldegg, H. Siegbahn, L. Asplund, P. Kelfve, K. Siegbahn, JESRP 7 (1975)
421-428
[28] H. Siegbahn, S. Svensson, M. Lundholm, JESRP 24 (1981) 205-213
[29] R. Joyner, M. Roberts, Surf. Sci. 87 (1979), 501-509
253
[31] D.F. Ogletree, talk at 8th international conference on electronic spectroscopy and
structure, 08-12.08.2000, Clark Kerr Campus, U
California, USA
H. Bl

108
) 3872-3877
[34] D . Hävecker, H. Bluhm, H. Sauer, A. Knop-
86-194 and 195-203
almeron, J. Phys.-Cond. Matter.
2133
[32] D.F. Ogletree, H. Bluhm, G. Lebedev, C.S. Fadley, Z. Hussain, M. Salemon, Rev. Sci.
Instrum. 73 (2002
[33] H. Bluhm, M. Hävecker, A. Knop-Gericke, E. Kleimenov, R. Schlögl, D. Teschner, V.I.
Bukhtiyarov, D.F. Ogletree, M. Salmeron, J. Phys. Chem. B 108 (2004) 14340-14347
. Teschner, A. Pestryakov, E. Kleimenov, M
Gericke, R. Schlögl, J. of Catalysis 230 (2005) 1
[35] H. Bluhm, D.F. Ogletree, C.S. Fadley, Z. Hussain, N. S
14 (2002) L227-L233
[36] M.A. Kelly, M.L. Shek, P. Pianetta, T.M. Gür, M.R. Beasley, J. Vac. Sci. Technol. A 19
(2001) 2127-
[37] The online service http://www-cxro.lbl.gov/ for the data calculation is provided by
tory on base of:
54
s Rev. A 25 (1982) 1393-1403
ective", 3d edition,
ersity Press, New York
[42] P
[43] J. Picht, Ann. Phys, Lpz. 15 (1932) 926-964
[44] D
[45] SIMION version 7.0. Author D.A. Dahl, Lockheed Idaho Technologies Company
Center for X-Ray Optics (CXRO) of Lawrence Berkley National Labora
B.L. Henke, E.M. Gullikson, J.C. Davis, Atomic Data and Nuclear Data Tables
(1993) 181-342
[38] K.R. Hoffman, M.S. Dababneh, Y.-F. Hsieh, W.E. Kauppila, V. Pol, J.H. Smart, T.S.
Stein, Phy
[39] J.D. Anderson, "Modern compressible flow: with historical persp
2003, McGraw-Hill, New York
[40] D. Miller, in "Atomic and Molecular Beam Methods", ed. G. Scoles, 1988, Oxford
Univ
[41] Prisma QMS 200 M
TRMS instrument produced by IONICON Analytic GmbH, Innsbruck, Austria
.W.O. Heddle, "Electrostatic lens systems", 1991, IOP publishing Ltd.

References
109
[47] M. Knoll, F. Ollendorff, R. Rompe, "Gasentladungstabellen", Springer-Verlag, 1935,
[48] )
[49] J 71) 1126-1133
[51] S. Tougaard, Surface Science 162 (1985) 875-885
[53] S. Tougaard, J. Vac. Sci. Technol. A 5 (4) (1987) 1275-1278
[55] W
[56] R 4 (1832) 230
[58] J 84
[60] T.R. Felthouse, J.C. Burnett, B. Horrell, M.J. Mummey, Y.-J. Kuo, "Maleic anhydride,
online 18.10.2001
an Dillen, A. Barbon, E.E. van Faassen, D.C. Koningsberger, J.W.
aleic anhydride:
[46] Phoibos 150 hemispherical analyzer, manufactured by Specs GmbH, Berlin
Berlin, p. 84
V.A. Lisovskiy, S.D. Yakovin, V.D. Yegorenkov, J. Phys. D: Appl. Phys. 33 (2000
2722–2730, Figure 1
.S. Mirza, C.W. Smith, J.H. Calderwood, J. Phys. D: Appl. Phys. 4 (19
[50] S. Tougaard, A. Ignatiev, Surface Science 129 (1983) 355-365
[52] S. Tougaard, Surface Science 172 (1986) L503-L506
[54] A.O. Nier, "Mass Spectroscopy" in Encyclopedia of Physics, ed. R.G. Lerner, G.L.
Triggs, 2nd edition, 1991, VHC Publishers
. Lindinger, A. Hansel, A. Jordan, Chem. Soc. Rev. 27 (1998) 347-354
. Winckler, Ann.
[57] J. Pelouze, Ann. 11 (1834) 263
.R. Skeen, Chem. Eng. News 26 (1948) 36
[59] R.I. Bergman, N.W. Frisch, US Patent 3,293,268 (1966)
maleic acid, and fumaric acid.", Kirk-Othmer encyclopedia of chemical technology,
John Wiley and Sons, posted
[61] M. Ruitenbeek, A.J. v
Geus, Cat. Letters 55 (1998) 133-139
[62] R.A. Overbeek, "New aspects of the selective oxidation of n-butane to m
The development of a novel catalyst", Thesis, Utrecht University, 1994

110
s, J.J. Lerou,
[64] J chez, L. Griesel, J. Bartley, R. Wells, A. Liskowski, D. Su, R. Shlögl, J.-
[65] "Vanadyl pyrophosphate catalysts", ed. G. Centi, Catalysis Today 16, n.1 (1993)
dium phosphorus oxide
02
[71] n, I.E. Wachs, J.-M. Jehng, J.E. Roberts,
. Benziger, P. Heaney, D. Yates, I.E. Wachs, J.Mol.Cat.
Symposium Series 523 (1993) 217-230
[76] G
[79] H , R. Schlögl, D.
S. Su, Topics in Catalysis 23 (2003) 99-107
[63] M.J. Ledoux, C. Crouzet, C. Pham-Huu, V. Turines, K. Kourtakis, P.L. Mill
J. of Catalysis 203 (2001) 495-508
.A. Lopez-San
C. Volta, G. Hutchings, PCCP 5 (2003) 3525-3533
[66] J.-C. Volta, Chemistry 3 (2000) 717-723
[67] A. Delimitis, "Electron microscopy studies of doped vana
catalysts", PhD thesis, University of Liverpool, 20
[68] E. Borders, Catal. Today 1 (1987) 499-526
[69] E. Borders, Catal. Today 3 (1988) 163-174
[70] T. Shimoda, T. Okuhara, M. Misono, Bull. Chem. Soc. Jpn., 58 (1985) 2163-2171
V.V. Guliants, J.B. Benziger, S. Sundaresa
Catalysis Today 28 (1996) 275-295
[72] V.V. Guliants, S.A. Holmes, J.B
A 172 (2001) 265-276
[73] J.C. Volta, K. Bere, Y.J. Zhang, R. Oliver, ACS
[74] J.-C. Volta, Catalysis Today 32 (1996) 29-36
[75] K. Aït-Lachgar, M Abon, J.C. Volta, Journal of Catalysis 171 (1997) 383-390
.J. Hutchings, C.J. Kiely, M.T. Sananes-Schulz, A. Burrows, J.C. Volta, Cat. Today 40
(1998) 273-286
[77] G.W. Coulston, S.R. Bare, H. Kung, K. Birkeland, G.K. Bethke, R. Harlow, N. Herron,
P.L. Lee, Science 275 (1997) 191-193
[78] M. Abon, K.E. Bere, P. Delichere, Catalysis Today 33 (1997) 15-23
. Bluhm, M. Hävecker, E. Kleimenov, A. Knop-Gericke, A. Liskowski

References
111
er, A. Knop-Gericke, R.W. Mayer, R. Schlogl, J.C.
[81] M luhm, E. Kleimenov, A. Liskowski,
ez, J.K.
ys. Chem. B 107 (2003) 4587-4596
(1993) 61-67
agarde, Journal of Catalysis 98
[86] J Int. Congr. Cat. v.4 (1988) 1632-1639
[88] H. Batis, H. Batis, A. Ghorbel, J. Vedrine, J.C. Volta, Journal of Catalysis 128 (1991)
l. Letters 23 (1994) 339-351
[92] G. Centi, Catalysis Today 16 (1993) 5-26
[94] P ed Catalysis A: General (1998) 172, 295-309
[80] G.J. Hutchings, J.A. Lopez-Sanchez, J.K. Bartley, J.M. Webster, A. Burrows, C.J. Kiely,
A.F. Carley, C. Rhodes, M. Haveck
Volta, M. Poliakoff, J.Catal. 208 (2002) 197-210
. Hävecker, R.W. Mayer, A. Knop-Gericke, H. B
D. Su, R. Follath, F.G. Requejo, D.F. Ogletree, M. Salemon, J.A. Lopez-Sanch
Bartley, G.J. Hutchings, R. Schlögl, J. Ph
[82] M Hävecker, A. Knop-Gericke, H. Bluhm, E. Kleimenov, R.W. Mayer, M. Fait, R.
Schlögl, Appl. Surf. Sci. 230 (2004) 272-282
[83] T. Okuhara, M. Misono, Catalysis Today 16
[84] F. Garbassi, J.C.J. Bart, R. Tassinari, G. Vlaic, P. L
(1986) 317-325
[85] B.K. Hodnett, P. Permanne, B. Delmon, Applied Catalysis 6 (1983) 231-244
. Haas, C. Plog, W. Maunz, Proc. 9th
[87] M. Abon, K.E. Bere, A. Tuel, P. Delichere, Journal of Catalysis 156 (1995) 28-36
248-263
[89] P.A. Agaskar, L. De Caul, R.K. Grasselli, Cata
[90] R.K. Grasselli, Topics in Catalysis 15 (2001) 93-101
[91] J.R. Ebner, M.R. Thompson, Catalysis Today 16 (1993) 51-60
[93] V. Zazhigalov, private communications
. Delichere, K.E. Bere, M. Abon, Appli
[95] J. Scofield, JESRP 8 (1976) 129-137
[96] W.P.A. Jansen, M. Ruitenbeek, A.W.D. v.d. Gon, J.W. Geus, H.H. Brongersma, J. Catal.
196 (2000) 379-387
112
[97] F. Senf, F. Eggenstein, U. Flechsig, R. Follath, S. Hartlaub, H. Lammert, T. Noll, J.S.
Schmidt, G. Reichardt, O. Schwarzkopf, M. Weiss, T. Zeschke and W. Gudat, Nucl.
Instr. Meth. A 467-468 (2001) 474-478
[98] http://www.bessy.de/
[99] S
[100] ptics and
[101] lysis A 127 (1995) 125-138
. Bluhm, R. Schlogl, J. Electr.
[103] karz, J. Haber, K. Hermann, J. Mol. Catal. A 166 (2001) 59-72
cal surface
[107] J. Mendialdua, R. Casanova, Y. Barbaux, J. Electr. Sp. Rel. Ph. 71 (1995) 249-261
2002) 159-165
998) 565-568
, P. Steiner, S. Huefner, J. Phys.: Cond. Matter
in X-ray Photoelectron Spectroscopy" in "Practical
. Geupel, K. Pilz, S. van Smaalen, Acta Crystallographica C 58 (2002) I9
A. Thompson, D. Vaughan et al., "X-ray data booklet", Center for X-ray O
Advanced Light Source, Lawrence Berkeley National Laboratory, second edition, 2001
L.M. Cornaglia, E.A. Lombardo, Applied Cata
[102] M. Havecker, A. Knop-Gericke, R.W. Mayer, M. Fait, H
Sp. Rel. Ph. 125 (2002) 79–87
M. Witko, R. To
[104] D. Briggs, "Application of XPS in Polymer Technology", in "Practi
analysis", ed. D. Briggs, M.P. Seah, vol.1, 1990, John Wiley & Sons Ltd
[105] G.A. Sawatzky, D. Post, Phys. Rev. B 20 (1979) 1546-1555
[106] M. Demeter, M. Neumann, W. Reichelt, Surf. Sci. 454-456 (2000) 41-44
[108] M. Heber, W. Grünert, J. Phys. Chem. B. 104 (2000) 5288-5297
[109] W. Yuqing, P.M.A. Sherwood, Surf. Sci. Spectra 9 (
[110] L. Calliari, N. Laidani, G. Speranza, Surf. Interface Anal. 26 (1
[111] R. Zimmermann, R. Claessen, F. Reinert
10 (1998) 5697-5716
[112] a) A. Proctor, P.M.A. Sherwood, Anal. Chem.54 (1982) 13-19
b) P.M.A. Sherwood, "Data analysis
surface analysis", ed. D. Briggs, M.P. Seah, 1983, p. 445-475
References
113
[114] T.P. Moser, G.L. Schrader, Journal of Catalysis 104 (1987) 99-108
ara, M. Misono, J. Am. Chem. Soc. 120 (1998) 767-774
nop-Gericke,
2) 846-855
EXAFS Investigations of Lattice Oxygen Exchange in
ational
. Pestryakov, D. Teschner,
Science 575
[113] A. Carley, P. Chalker, J. Riviere, M. Roberts, J. Chem. SOC, Farad. Trans I 83 (1987)
351-370
[115] G. Koyano, T. Okuh
[116] D. Teschner, A. Pestryakov, E. Kleimenov, M. Hävecker, H. Bluhm, A. K
R. Schlögl, "In-situ XPS and XAS investigation on the redox and catalytic properties of
VOx/Al2O3", preparing for publication
[117] X.-F. Huang, C.-Y. Li, B.-H. Chen, P. L. Silveston, AIChE Journal 48 (200
[118] E. Kleimenov, H. Bluhm, M. Hävecker, A. Knop-Gericke, A. Pestryakov, D. Teschner,
R. Schlögl, "In Situ XPS and N
V2O5 by Reduction in Low-Pressure Oxygen Atmosphere", 4th Intern
Symposium on Chemistry and Biological Chemistry of Vanadium, 03-05.09.2004,
Szeged, Hungary
[119] E. Kleimenov, H. Bluhm, M. Hävecker, A. Knop-Gericke, A
J. A. Lopez-Sanchez, J. K. Bartley, G.J. Hutchings, R. Schlögl, Surface
(2005) 181-188
Acknowledgement
I would like to thank all people who contributed this work. I am saying "thank you" to:
ssions • my second scientific adviser Prof. Dr. Mario Dähne for interest to my work and its
• my family and girlfriend Anja for care and patience • aboratory Dr. D. Frank Ogletree, Dr. Eleonore
f
•
•
• Bartley and Prof. Dr. Graham J. Hutchings for the VPO samples
• for the language correction
•
• my colleagues from FHI for interest to my work and fruitful discu
reviewing • BESSY staff for the full and continuous technical support of the experiments • my former teachers and colleagues. Especially to my advisers M.Sc. Alexander B.
Fedotov, Dr. Nikolaj A. Krjukov, Prof. Dr. Valerij S. Ivanov, Dr. Sergej V. Potapov
the members of Lawrence Berkeley LL. Hebenstreit and Dr. Miquel Salmerond for collaboration in the theoretical design othe XPS system
• SPECS company (Berlin, Germany) and personally Dr. Sven Mächl for collaboration in modifying the spectrometer M.Sc. Andrzej Liskowski for production the VOPO4 reference compounds Dipl. Ing. Ute Wild for XPS data of some vanadium compounds measured at ESCA spectrometer the members of Cardiff University Dr. Jose A. Lopez-Sanchez, Dr. Jonathan K.
Dr. Elaine Vass • Dr. Detre Teschner and Prof. Dr. Alexej Pestryakov for participation the experimental
work and discussions of the experimental results Dipl. Ing. Klaus Ihmann for the engineering design of our XPS system and for care about a part production process
• agues Dr. Axel Knop-Gericke, Dr. Michael Hävecker and Dr. Hendrik Bluhm, from every of those I have got the overall support at all stages of my PhD work including work with literature, gaining skills of working with the equipment, planning the experiments, experimental work, data analysis, publishing the results, presenting them at conferences and writing the PhD thesis
• my scientific adviser Prof. Dr. Robert Schlögl for statement of the scientific problem, for providing the financial support of the PhD work and for scientific ideas thanks to those this work was fulfilled
my senior colle
Related Documents