High pressure crystal phases of benzene probed by infrared spectroscopy Lucia Ciabini Dipartimento di Chimica dell’Universita ` di Firenze, Via G. Capponi 9, I-50121 Firenze, Italy Mario Santoro LENS, European Laboratory for Non-linear Spectroscopy and INFM, Largo E. Fermi 2, I-50125 Firenze, Italy Roberto Bini a) and Vincenzo Schettino Dipartimento di Chimica dell’Universita ` di Firenze, Via G. Capponi 9, I-50121 Firenze, Italy and LENS, European Laboratory for Non-linear Spectroscopy and INFM, Largo E. Fermi 2, I-50125 Firenze, Italy ~Received 12 April 2001; accepted 6 June 2001! In this work we present an infrared study of the high pressure phases of benzene crystal up to 25 GPa. The far infrared portion of the spectrum has been studied for the first time above 4 GPa. From the pressure behavior of the frequencies and the integrated peak absorptions we are able to confirm, beside the transition between phases II–III at 4.8 GPa, the transition between phases III–III8 at 11.2 GPa. The spectral pattern changes very smoothly among the different phases and the number of bands is always consistent with a crystal structure having two molecules per cell and the inversion center as a symmetry element. At 17.4 GPa a structural change is suggested from the slope decrease of the frequency evolution with pressure of almost all the crystal modes. Particularly important are the changes of the doubly degenerate n 18 bending mode, which could be strongly involved in the irreversible transformation occurring at higher pressure. © 2001 American Institute of Physics. @DOI: 10.1063/1.1388543# I. INTRODUCTION Solid benzene is one of the most thoroughly investigated molecular crystals, since it represents the model system in the study of aromatic compounds. The first analysis of the phase diagram of benzene crystal at high pressure was per- formed by Bridgman. 1 A good agreement exists, according to the results of different experimental techniques, on the pres- sure values of the different phase transitions observed below 10 GPa, while there are surprisingly few data obtained at higher pressures. Liquid benzene crystallizes, at room tem- perature and about 700 bar, into the orthorhombic Pbca ( D 2 h 15 ) phase I. 2 Two other crystal phases have been detected below 10 GPa: phase II existing between 1.4 and 4 GPa, and phase III which is stable between 4 and 11 GPa. 3–5 The structure of phase III is monoclinic P 2 1/c ( C 2 h 5 ) with two molecules per unit cell. 2,3 Also phase II is confidently con- sidered monoclinic, but a precise assignment of the unit cell structure is missing. 3 Both I–II and II–III phase transitions are extremely sluggish, and were clearly observed only when the transitions were thermally activated by heating the sample. 3 More recently greater attention was given to the behavior of benzene when pressure exceeds 10 GPa to test the stability of the aromatic ring. 3,6–10 Around 11 GPa Thiery et al. 3 detected a second-order transition to a new phase probably having the same monoclinic structure of phase III. The same x-ray experiment also provided evidence of changes in the lattice parameters between 19 and 24 GPa, which were interpreted as due to a further phase transition. 3 A more recent study indicates this change as the first step of an irreversible transformation to a cross-linked polymer which forms, at room temperature, after the sample is pres- surized up to 30 GPa. 6 In addition to the mentioned x-ray analysis, 2,3 there is a relative abundance of spectroscopic studies on the high pres- sure phases of benzene. The room temperature Raman spec- trum is well characterized, both in the lattice and in the in- ternal modes region only up to 20 GPa. 3,11,12 Quite recently this technique was employed to study the transformation of benzene with pressure and temperature up to 800 K. 10 The infrared spectrum, including the lattice phonon region, was first investigated by Adams et al. up to 4 GPa. 11 Recently, the I–II and II–III phase transitions were confirmed by a study of the midinfrared spectrum ~400–4000 cm 21 ! below 10 GPa. 13 Another infrared investigation was performed up to 30 GPa to characterize the chemical transformation of ben- zene above 25 GPa, 6 but the accessible frequency range was limited by the use of diamonds Ia and only the spectra rela- tive to the C–H stretching region were reported. Neverthe- less, this work revealed the fundamental importance of the infrared data to understand this transformation and especially the reaction path, since it is controversial if the transforma- tion takes place through the condensation or the opening of the benzene rings. From the available literature it appears that infrared analyses are always limited in frequency and/or pressure range, making a comparative study with the corre- sponding Raman data difficult. This is an obvious limitation since complete vibrational information is important to model the intermolecular interactions under pressure and predict the thermodynamic properties. 14 Furthermore, these data can a! Electronic mail: [email protected] JOURNAL OF CHEMICAL PHYSICS VOLUME 115, NUMBER 8 22 AUGUST 2001 3742 0021-9606/2001/115(8)/3742/8/$18.00 © 2001 American Institute of Physics Downloaded 29 Aug 2001 to 150.217.28.107. Redistribution subject to AIP license or copyright, see http://ojps.aip.org/jcpo/jcpcr.jsp

Welcome message from author
This document is posted to help you gain knowledge. Please leave a comment to let me know what you think about it! Share it to your friends and learn new things together.
Transcript
JOURNAL OF CHEMICAL PHYSICS VOLUME 115, NUMBER 8 22 AUGUST 2001
High pressure crystal phases of benzene probed by infrared spectroscopyLucia CiabiniDipartimento di Chimica dell’Universita` di Firenze, Via G. Capponi 9, I-50121 Firenze, Italy
Mario SantoroLENS, European Laboratory for Non-linear Spectroscopy and INFM, Largo E. Fermi 2, I-50125 Firenze,Italy
Roberto Binia) and Vincenzo SchettinoDipartimento di Chimica dell’Universita` di Firenze, Via G. Capponi 9, I-50121 Firenze, Italy and LENS,European Laboratory for Non-linear Spectroscopy and INFM, Largo E. Fermi 2, I-50125 Firenze,Italy
~Received 12 April 2001; accepted 6 June 2001!
In this work we present an infrared study of the high pressure phases of benzene crystal up to 25GPa. The far infrared portion of the spectrum has been studied for the first time above 4 GPa. Fromthe pressure behavior of the frequencies and the integrated peak absorptions we are able to confirm,beside the transition between phases II–III at 4.8 GPa, the transition between phases III–III8 at 11.2GPa. The spectral pattern changes very smoothly among the different phases and the number ofbands is always consistent with a crystal structure having two molecules per cell and the inversioncenter as a symmetry element. At 17.4 GPa a structural change is suggested from the slope decreaseof the frequency evolution with pressure of almost all the crystal modes. Particularly important arethe changes of the doubly degeneraten18 bending mode, which could be strongly involved in theirreversible transformation occurring at higher pressure. ©2001 American Institute of Physics.@DOI: 10.1063/1.1388543#
te
thp
toreloa
embctea
-ce
hethhe
asIIoP
on
p ofer
res-
res-spec-in-
of
as
dy
toen-asla-
he-theiallya-
g ofars/orrre-onel
t then
I. INTRODUCTION
Solid benzene is one of the most thoroughly investigamolecular crystals, since it represents the model systemthe study of aromatic compounds. The first analysis ofphase diagram of benzene crystal at high pressure wasformed by Bridgman.1 A good agreement exists, accordingthe results of different experimental techniques, on the psure values of the different phase transitions observed be10 GPa, while there are surprisingly few data obtainedhigher pressures. Liquid benzene crystallizes, at room tperature and about 700 bar, into the orthorhombic P(D2h
15) phase I.2 Two other crystal phases have been detecbelow 10 GPa: phase II existing between 1.4 and 4 GPa,phase III which is stable between 4 and 11 GPa.3–5 Thestructure of phase III is monoclinicP21/c (C2h
5 ) with twomolecules per unit cell.2,3 Also phase II is confidently considered monoclinic, but a precise assignment of the unitstructure is missing.3 Both I–II and II–III phase transitionsare extremely sluggish, and were clearly observed only wthe transitions were thermally activated by heatingsample.3 More recently greater attention was given to tbehavior of benzene when pressure exceeds 10 GPa tothe stability of the aromatic ring.3,6–10Around 11 GPa Thieryet al.3 detected a second-order transition to a new phprobably having the same monoclinic structure of phaseThe same x-ray experiment also provided evidencechanges in the lattice parameters between 19 and 24 Gwhich were interpreted as due to a further phase transiti3
a!Electronic mail: [email protected]
3740021-9606/2001/115(8)/3742/8/$18.00
Downloaded 29 Aug 2001 to 150.217.28.107. Redistribution subject to A
dineer-
s-wt-
adnd
ll
ne
test
eI.fa,.
A more recent study indicates this change as the first stean irreversible transformation to a cross-linked polymwhich forms, at room temperature, after the sample is psurized up to 30 GPa.6
In addition to the mentioned x-ray analysis,2,3 there is arelative abundance of spectroscopic studies on the high psure phases of benzene. The room temperature Ramantrum is well characterized, both in the lattice and in theternal modes region only up to 20 GPa.3,11,12Quite recentlythis technique was employed to study the transformationbenzene with pressure and temperature up to 800 K.10 Theinfrared spectrum, including the lattice phonon region, wfirst investigated by Adamset al.up to 4 GPa.11 Recently, theI–II and II–III phase transitions were confirmed by a stuof the midinfrared spectrum~400–4000 cm21! below 10GPa.13 Another infrared investigation was performed up30 GPa to characterize the chemical transformation of bzene above 25 GPa,6 but the accessible frequency range wlimited by the use of diamonds Ia and only the spectra retive to the C–H stretching region were reported. Nevertless, this work revealed the fundamental importance ofinfrared data to understand this transformation and especthe reaction path, since it is controversial if the transformtion takes place through the condensation or the openinthe benzene rings. From the available literature it appethat infrared analyses are always limited in frequency andpressure range, making a comparative study with the cosponding Raman data difficult. This is an obvious limitatisince complete vibrational information is important to modthe intermolecular interactions under pressure and predicthermodynamic properties.14 Furthermore, these data ca
2 © 2001 American Institute of Physics
IP license or copyright, see http://ojps.aip.org/jcpo/jcpcr.jsp
s
ranasthstor
er
ngcktir
alp
thf
mubsuhe
nh
e
sondi
tio
tioi-iotth
ee
ctedarereee, at
therPa,stillow
rentd with
le isandI.
. Inquen-ta.
3743J. Chem. Phys., Vol. 115, No. 8, 22 August 2001 High pressure crystal phases of benzene
provide an indirect structural characterization once discusaccording to group theory arguments.
The aim of the present work is to give a complete infred analysis of benzene, including external and intermodes, up to 25 GPa in order to cover all the known phtransitions at ambient temperature. We will show thatgrowth of good quality samples greatly reduces the metability problems found in the previous works, especially fthe low pressure phase transitions.
II. EXPERIMENT
High pressure infrared spectra of solid benzene wmeasured using a membrane diamond anvil cell~MDAC!equipped with IIa diamonds. The cell was loaded by fillithe gasket hole with a drop of liquid benzene from Mer~purity >99.9). In most of the experiments care was takenclose the cell maintaining the sample in the liquid phaseorder to cross the melting point very slowly. This proceduensured the production of high quality samples, genercomposed by 2–3 single crystals, in phase I. The samdimensions were typically 40–50mm thick and 150mm indiameter for the experiments in the midinfrared. Due toweakness of the lattice modes in one experiment in theinfrared region, we prepared a sample 90–95mm thick and200 mm in diameter. In this case a rhenium gasket was eployed to retain the sample also at high pressures. A rchip was inserted in the sample to measure the local presby the R1 ruby fluorescence band shift, according to tequationP(GPa)5248.4@(l/l0)7.66521#.15
The complete apparatus to perform infrared experimeunder pressure, including the optical beam condenser,been extensively described in previous reports.16,17A Fouriertransform infrared~FTIR! spectrometer~Bruker IFS-120HR! was used to measure the infrared spectra. For theperiments in the far-infrared region~100–450 cm21! the in-strument was equipped with a 6mm thick mylar beam split-ter and a bolometer as a detector~cooled to 4.2 K!. A KBrbeam splitter and a semiconductive detector~MCT! wereemployed in the 450- and 4000 cm21 frequency range. Theinstrumental resolution was better than 1 cm21.
III. FAR-INFRARED SPECTRA
In Fig. 1 some spectra showing the evolution with presure of the far-infrared region are reported. The absorptidue to the translational lattice modes, measured in twoferent experiments, and to then16 C–C–C out-of-planebending mode are included. The spectra in the lower secwere obtained with the thick sample~90–95mm!. This ex-periment allowed measurement of the very weak absorpof the n16 crystal components but it was limited to a maxmum pressure of about 17 GPa. The same spectral regrecorded on a thinner sample which allowed measuremento 25 GPa of the phonon region alone, is reported inupper section. The worst quality of this sample made then16
components hardly detectable even at the lower pressurthe experiment. For the sake of clarity the spectra relativthe lattice phonons and to then16 internal mode will be dis-cussed separately.
Downloaded 29 Aug 2001 to 150.217.28.107. Redistribution subject to A
ed
-ale
ea-
e
onelyle
ear
-yre
tsas
x-
-s
f-
n
n
n,upe
ofto
A. Lattice modes
The first spectrum of the lower section of Fig. 1~1 GPa!was recorded in phase I. Six translational modes are expein the infrared spectra of this phase, but only three bandsdetected in our spectra. The relative intensities of the thbands closely recall those observed in the same phasambient pressure and 80 K, by Haradaet al.18 In Table I thefrequency values of the three peaks are reported, togewith other literature data. The next spectrum, at 3.2 Gshould be characteristic of phase II. Three peaks areobserved as in phase I, but their relative intensity is nrather different. The low pressure spectra (P<3 GPa! com-
FIG. 1. Room temperature far-infrared spectra of solid benzene at diffepressures. The spectra reported in the two sections have been recordesamples having different thickness:>45 and>90 mm ~room pressure val-ues! for the upper and lower spectra, respectively. The absorbance scadifferent in the two sections to display clearly the different spectra. The bmarked with an asterisk in the lower section spectra belongs to phase
TABLE I. Frequency values of the translational lattice modes in phase Ithe third column the values in parentheses are the ambient pressure frecies obtained extrapolating, according to a quadratic fit, our phase I da
Symmetry n ~cm21!a n ~cm21!b n ~cm21!c
b1u 9865.5
b2u 100 127.5 129.8~107!56
b3u 88.5 112.5 113.5~92!73 93 96.5~77!
aFrom Ref. 19 at 138 K and ambient pressure.bFrom Ref. 11 at 295 K and 0.4 GPa.cThis work at 298 K and 1 GPa.
IP license or copyright, see http://ojps.aip.org/jcpo/jcpcr.jsp

ntctcaeioison
oob
edna-l
rysetha
ryta, bify
ou
,thhaothse
-w
b
it
se
i--aaahisnaea
la
here-
theyorp-inu-dthsPa,
idly
tthis
kerrtedtherd inndhly,
c-
llr-d inn of
3744 J. Chem. Phys., Vol. 115, No. 8, 22 August 2001 Ciabini et al.
pare quite well with the only available experiment (P,4GPa! where the three bands were resolved only belowGPa.11 The two experiments performed with differesamples overlap between 5 and 17 GPa. In the upper seof Fig. 1, showing the spectra of the thinner sample, weobserve only two bands, with the central peak completmissing. This difference could arise from sample orientator from sample quality. The first possibility, however,ruled out, by symmetry arguments. From x-ray diffractiexperiments it results that phase II is monoclinic with twmolecules per unit cell but, due to the limited numberdiffraction lines observed, the exact structure could notestablished.3 Phase III, on the contrary, is well characterizand belongs to theC2h
5 group with two molecules per cell oinversion centers.2,3 For this structure three infrared transltional modes are expected (2au1bu). Using these structuradata the lattice frequencies have been calculated at 1.9~Ref.12! and 2.5~Ref. 7! GPa and they were found to be veclose to those observed at similar pressures in the prework. Since the number and the relative intensities ofobserved lattice bands in the infrared and Raman spectrphases II and III do not change significantly,3,20,21 it is rea-sonable to assume that the two phases have the same cstructure with minor differences in the molecular orientions. Using the calculated frequencies it is then possibleanalogy, to assign the infrared translational modes identing the lowest frequency mode asbu ~polarized in theaccrystal plane! and the other two asau ~polarized along thebaxis!. In this situation the only possibility to observe twpeaks in an experiment with nonpolarized light would occfor a crystal slab containing theb axis and perpendicular tothe transition dipole moment of thebu mode. In such a casehowever, one should observe in the infrared spectrumtwo higher frequency peaks. It can be noted from Fig. 1 tin the spectrum of the thinner sample the bands appear tbroader. This is evidence of a poorer crystal quality ofthinner sample and we favor this explanation for the misobservation of the central peak.
In Fig. 2 ~lower panel! the peak frequencies of the infrared translational modes as a function of pressure are shoDefinite changes in slope are observed at 4.860.5, 11.260.7, and 17.461 GPa. These changes in slope shouldassociated with the II–III, III–III8, and III8–V phase transi-tions, respectively. The first two are in good agreement wfindings from Raman and x-ray experiments.3 On the con-trary, the III8–V transition should be correlated to the phachange~III 8–IV according to their notation! reported at.22GPa by Thieryet al.3 The present experiment clearly indcates that the transformation of phase III8 occurs at a pressure well below 22 GPa. We labeled the intermediate phbetween III8 and the higher pressure chemical transformtion, whose study will be reported in a forthcoming paper,V, because in the phase diagram presented in Ref. 10 atemperature, low pressure phase was already indicated aThe pressure shift coefficients of the three translatiomodes in the different phases are reported in Table II. Thvalues compare very well with those relative to the Ramlattice modes.3
To locate the different phase transitions, and in particu
Downloaded 29 Aug 2001 to 150.217.28.107. Redistribution subject to A
2
ionn
lyn
fe
nteof
stal-y-
r
etbeed
n.
e
h
se-sghIV.lirn
r
the III8–V, a better indication comes from the analysis of tintegrated area of the different bands whose values areported as a function of pressure in Fig. 2~b!. The intensitiesare weakly pressure dependent up to 10–11 GPa, whilegrow between 10 and 17.4 GPa where the maximum abstion is reached. Above this pressure the intensities contously decrease on further compression. Also, the bandwishow an anomalous narrowing between 17.5 and 21 Gwhile pressurizing above 21 GPa they increase very rapin contrast to the integrated area behavior.
B. n16
The doubly degeneraten16 (e2u) bending mode has noyet been studied at high pressure. The absorption due tomode was observed in the present work only with the thicsample~see Fig. 1! by virtue of its better quality and largedimensions. At 1 GPa only three out of the six expeccomponents are resolved. Their frequency values, togewith those relative to the other crystal modes, are reporteTable III. Upon the I–II phase transition the highest alowest components change in frequency very smootwhile two new components appear at 420 and 433 cm21 ~3.2GPa!. The two peaks, which are easily visible in the spe
FIG. 2. Pressure evolution of the frequency~lower section! and the inte-grated absorption~upper section! of the translational modes.~a! Full andempty dots are relative to the>45 and>90 thick samples, respectively. Fulines indicate the best linear fit.~b! Full and empty dots refer to the absobance data of the low and high frequency modes, respectively, collectethe experiment on the thinner sample. See the text for the determinatiothe transition pressures~dotted lines!.
IP license or copyright, see http://ojps.aip.org/jcpo/jcpcr.jsp

ithditis
Ionncit.e
pe
e
aintafoenna
nales II,esesin
,telyameints-andtedere
lynd
g
ts
u
in
3745J. Chem. Phys., Vol. 115, No. 8, 22 August 2001 High pressure crystal phases of benzene
trum at 4.3 GPa of Fig. 1, rise continuously in intensity wpressure and become dominant at 10 GPa. The intermepeak of phase I, marked with an asterisk in Fig. 1, is sobservable in phase II. Its intensity continuously decreawith increasing pressure and disappears only at.7 GPa, i.e.,in phase III, testifying to the sluggishness of both the I–and II–III phase transitions. In Fig. 3 the frequency evolutiof the different Davydov components is reported as a fution of pressure. The changes in slope at the phase transare less pronounced than for the translational modesphase III8 the intensity of all the four components decreasrapidly with increasing pressure and the four peaks disapbetween 15 and 17 GPa.
IV. MID-INFRARED SPECTRA
The high pressure infrared spectrum of benzene has bstudied in detail between 500 and 4000 cm21 only below 10GPa.13 We extended, in the present work, the complete chacterization of this spectral region up to 25 GPa, succeedin obtaining a better resolution of most of the fundamenmodes. The discussion will be limited only to the modeswhich an increased information is provided by the presexperiment. The Wilson indexing of the benzene inter
TABLE II. Pressure shift coefficients~cm21/GPa! of the infrared modes inthe II, III, III 8, and V crystal phases. The mode frequencies refer to thephase, with the exception of the translational modes~T!, whose frequenciesare those measured in phase I at 1.0 GPa. The pressure shift coefficienlisted in order of increasing frequency of the crystal components. For then15
and n17 modes in phase II, the pressure shift coefficients for the residpeaks of phase I are also reported.
Mode II III III 8 V
T (bu ; 96.5 cm21! 12.9 5.4 3.2 2.3T (au ; 113.4 cm21! 14.5 7.2 ¯ ¯
T (au ; 129.8 cm21! 15.4 8.1 5.8 1.9
n16 (e2u ; 404 cm21! 1.9 2.4 1.4 ¯
4.3 3.2 3.6 ¯
7.1 4.6 4.7 ¯
7.7 5.5 4.5 ¯
n17 (e2u ; 967 cm21! 0.6 0.5 0.6 0.21.5 0.5 0.6 0.31.4 ¯ ¯ ¯
3.1 2.1 1.4 ¯
3.0 ¯ ¯ ¯
3.6 0.8 0.6 0.5n12 (b1u ; 1010 cm21! 1.4 0.5 1.9 0.6
1.2 0.9 2.5 0.9n18 (e1u ; 1037 cm21! ¯ 0.8 1.3 0.9
¯ 1.5 3.4 1.7¯ 2.1 4.2 1.1¯ 3.1 4.6 1.3
n15 (b2u ; 1146 cm21! 1.8 1.9 2.2 ¯
3.5 2.8 ¯ ¯
5.2 3.8 4.5 2.1n14 (b2u ; 1309 cm21! 3.4 3.3 3.0 2.3
7.1 4.1 5.6 3.19.0 4.5 6.0 3.5
n13 (b1u ; 3057 cm21! 6.4 ¯ ¯ ¯
n20 (e1u ; 3064 cm21! 6.2 3.9 5.1 2.8(n81n19) 6.2 ¯ ¯ ¯
7.5 5.2 7.9 4.1
Downloaded 29 Aug 2001 to 150.217.28.107. Redistribution subject to A
atelles
I
-ionInsar
en
r-glrtl
modes,23 employed in most of the literature24 but differentfrom that used by Andersonet al.,13 will be adopted.
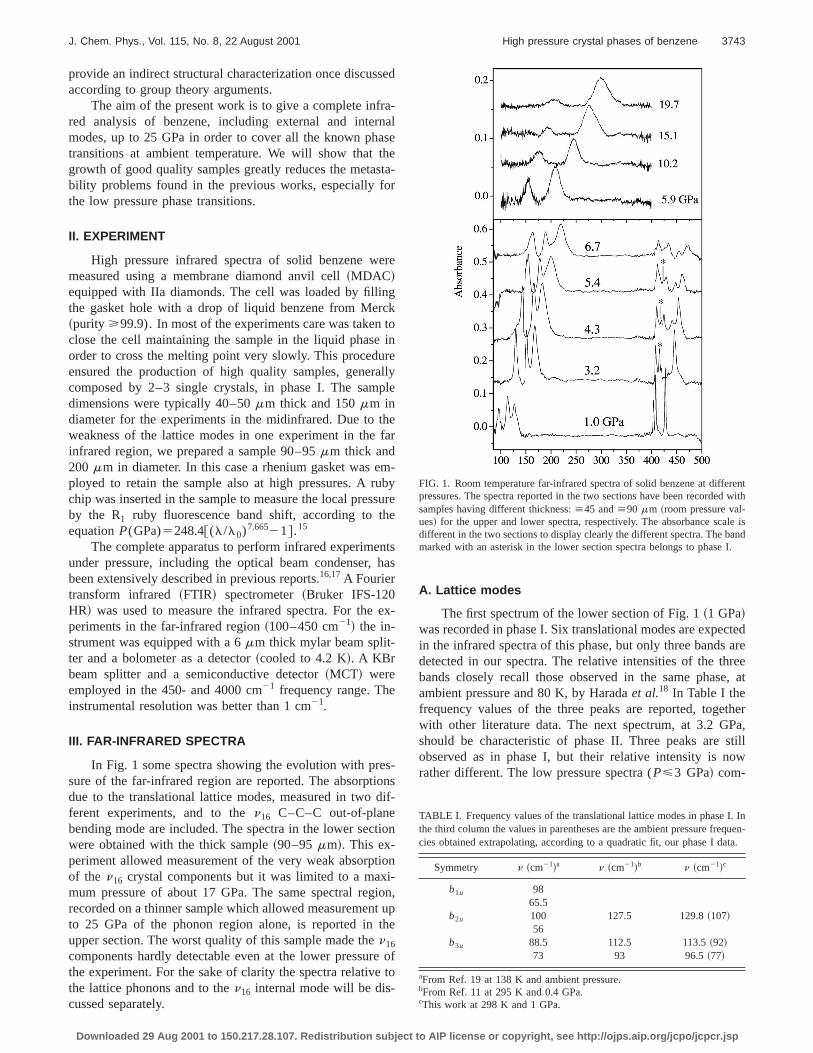
Figures 4–6 show the infrared spectra of the intermodes at three selected pressures, corresponding to phasIII, and III8. The first remarkable result of our study is thlarger number of components resolved in the different phafor almost all the modes with respect to those reportedRef. 13. Only two modes,n11 (a2u ; .611 cm21! and n19
(e1u ; .1480 cm21!, infrared active in the isolated moleculewere not characterized, their absorption being complesaturated in all the pressure ranges investigated. For the sreason then18 mode was studied only above 5 GPa, i.e.,phases III, III8, and V. In phase I not all the componenpredicted according to theD2h factor group have been resolved in the spectra, as already observed for the latticethen16 modes. On the contrary, all the theoretically expeccomponents for the high pressure monoclinic phases wobserved with the exception of then14 mode, which showsonly one component. This argument is strictly correct onfor phase III, whose crystal structure is exactly known a
as
are
al
TABLE III. Frequency values of the internal and combination modesphase I.
Mode (D6h) n ~cm21!a n ~cm21!b n ~cm21!c
n16 (e2u) 401 404.0d
404.3 404 408.3d
418.0 415 427.6d
n11 (a2u) 674681.0 685 682e
688.5 690701
n17 (e2u) 974.0 974 974.7978.0 977 977.4986.8 983 986.3
n12 (b1u) 1006.5 1006 1006.71008.8
1009.5 1010 1010n18 (e1u) 1033.6 1035 1037e
1038.5 1038n14 (b2u) 1308.3
1312.5 1312 1314.2n15 (b2u) 1142 1143.7
1148.0 1148 1149.8n19 (e1u) 1469.7 1470
1474.1 1475 1477e
1477.7 1478n13 (b1u), n20 (e1u) 3010.3
3023.5 3027.43030.03031.0 3033 3036.03037.5 3038 3042.03053.0 3057 3057.33068.5 3069 3072.93085.5 3083.23088.0 3088 3090.3
3091.83091.7 3092 3095.9
aFrom Ref. 22 at 85 K and ambient pressure.bFrom Ref. 7 at 230–240 K and ambient pressure.cThis work at 298 K and 0.3 GPa.dData collected at 1 GPa.eCentral values of saturated peaks.
IP license or copyright, see http://ojps.aip.org/jcpo/jcpcr.jsp
d
inth
n
udys
lett
eHncytion
no-
de-ady,
vedr, in
ca
lat
-
and
3746 J. Chem. Phys., Vol. 115, No. 8, 22 August 2001 Ciabini et al.
where four components for degenerate and two for nongenerate modes should be observed.
A separate discussion is required by the C–H stretchregion where a precise assignment is difficult due toFermi resonance betweenn20 (e1u) ~and n13; b1u! and then81n19 combination mode. At low pressure (P<0.3 GPa!,and therefore in phase I, we observe ten peaks, while onine and six components are reported in Refs. 22 andrespectively. Their frequencies are reported in Table III. Ospectra in phase I are practically identical to those reporteRef. 22 and measured with polarized light on oriented crtals having thickness larger than 15mm. An assignment ofthe combination bands falling in this region is not possibeven considering the pressure shift coefficients. As a maof fact, the frequency shifts of the C–C stretching peaksn8
FIG. 3. Pressure evolution of the frequencies of then16 components. Emptysymbols are relative to a component belonging to phase I. Full lines indithe best linear fit. Dotted lines are drawn as in Fig. 2.
FIG. 4. Infrared spectra of the bending region at selected pressures reto phases II, III, and III8. Due to the increasing overlap with then17 moderising pressure, the components of then12 vibration are indicated by asterisks.
Downloaded 29 Aug 2001 to 150.217.28.107. Redistribution subject to A
e-
ge
ly7,rin-
,er
~from Ref. 3! and n19 ~peak frequency estimated from thsaturated peak!, are approximately half those of the C–stretching modes. Therefore, no differences of the frequeshifts are expected among fundamentals and combinabands in this spectral region.
In phase II more components than expected for a moclinic cell with Z52 are observed forn15 andn17. The ad-ditional components are bands of phase I that slowlycrease in intensity with increasing pressure, as was alrediscussed forn16. This can be clearly seen from Fig. 7where the integrated intensities of some of the obserbands as a function of pressure are reported. In particula
te
ive
FIG. 5. Infrared spectra of then15 ~in-plane C–H bending! and n14 ~C–Cstretching! modes region at selected pressures relative to phases II, III,III 8. The asterisks indicate a combination band (n101n16 ;n61n11 .!
FIG. 6. Infrared spectra of the C–H stretching region (n13 and n20) atselected pressures relative to phases II, III, and III8.
IP license or copyright, see http://ojps.aip.org/jcpo/jcpcr.jsp
oath
thI
ge
a
ordu
mTl t
Ay–pe7eu
ond
antd atthiseisfre-pu-a-Paandorre-at
itiesern-s. Inther the
nthich
nslso
re-avepro-se
ct
ha
rent
3747J. Chem. Phys., Vol. 115, No. 8, 22 August 2001 High pressure crystal phases of benzene
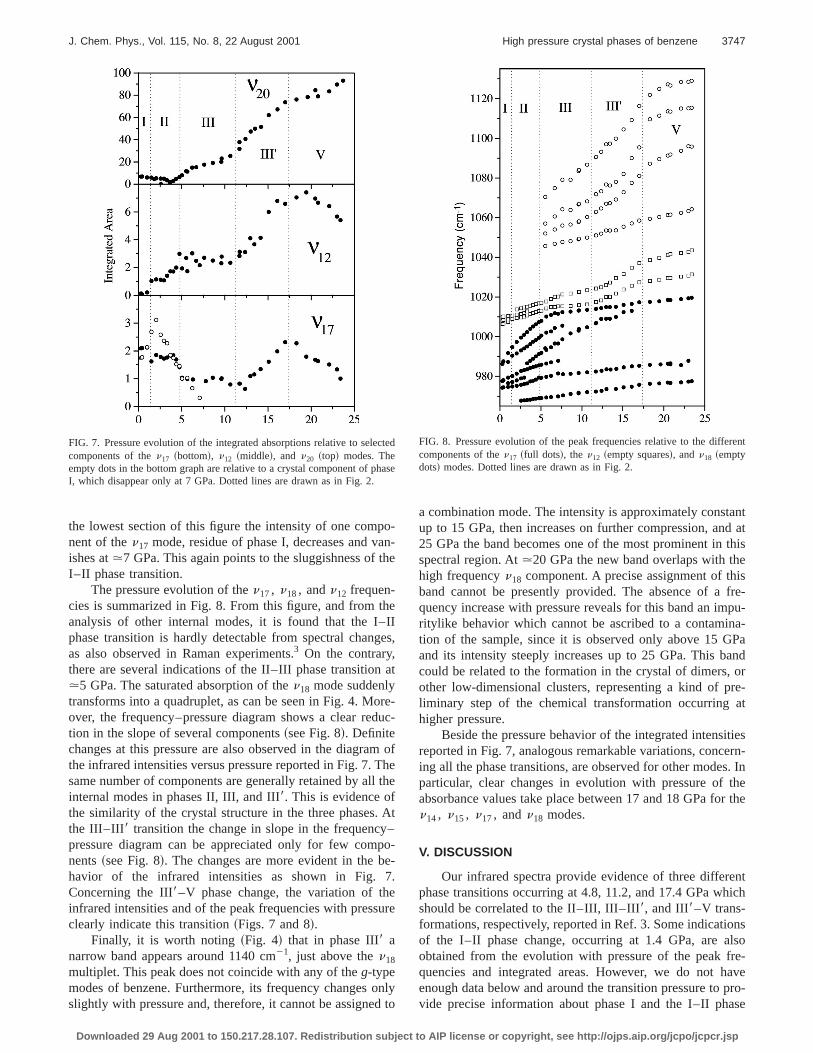
the lowest section of this figure the intensity of one compnent of then17 mode, residue of phase I, decreases and vishes at.7 GPa. This again points to the sluggishness ofI–II phase transition.
The pressure evolution of then17, n18, andn12 frequen-cies is summarized in Fig. 8. From this figure, and fromanalysis of other internal modes, it is found that the I–phase transition is hardly detectable from spectral chanas also observed in Raman experiments.3 On the contrary,there are several indications of the II–III phase transition.5 GPa. The saturated absorption of then18 mode suddenlytransforms into a quadruplet, as can be seen in Fig. 4. Mover, the frequency–pressure diagram shows a clear retion in the slope of several components~see Fig. 8!. Definitechanges at this pressure are also observed in the diagrathe infrared intensities versus pressure reported in Fig. 7.same number of components are generally retained by alinternal modes in phases II, III, and III8. This is evidence ofthe similarity of the crystal structure in the three phases.the III–III8 transition the change in slope in the frequencpressure diagram can be appreciated only for few comnents~see Fig. 8!. The changes are more evident in the bhavior of the infrared intensities as shown in Fig.Concerning the III8–V phase change, the variation of thinfrared intensities and of the peak frequencies with pressclearly indicate this transition~Figs. 7 and 8!.
Finally, it is worth noting~Fig. 4! that in phase III8 anarrow band appears around 1140 cm21, just above then18
multiplet. This peak does not coincide with any of theg-typemodes of benzene. Furthermore, its frequency changesslightly with pressure and, therefore, it cannot be assigne
FIG. 7. Pressure evolution of the integrated absorptions relative to selecomponents of then17 ~bottom!, n12 ~middle!, and n20 ~top! modes. Theempty dots in the bottom graph are relative to a crystal component of pI, which disappear only at 7 GPa. Dotted lines are drawn as in Fig. 2.
Downloaded 29 Aug 2001 to 150.217.28.107. Redistribution subject to A
-n-e
eIs,
t
e-c-
ofhehe
t
o--.
re
lyto
a combination mode. The intensity is approximately constup to 15 GPa, then increases on further compression, an25 GPa the band becomes one of the most prominent inspectral region. At.20 GPa the new band overlaps with thhigh frequencyn18 component. A precise assignment of thband cannot be presently provided. The absence of aquency increase with pressure reveals for this band an imritylike behavior which cannot be ascribed to a contamintion of the sample, since it is observed only above 15 Gand its intensity steeply increases up to 25 GPa. This bcould be related to the formation in the crystal of dimers,other low-dimensional clusters, representing a kind of pliminary step of the chemical transformation occurringhigher pressure.
Beside the pressure behavior of the integrated intensreported in Fig. 7, analogous remarkable variations, concing all the phase transitions, are observed for other modeparticular, clear changes in evolution with pressure ofabsorbance values take place between 17 and 18 GPa fon14, n15, n17, andn18 modes.
V. DISCUSSION
Our infrared spectra provide evidence of three differephase transitions occurring at 4.8, 11.2, and 17.4 GPa wshould be correlated to the II–III, III–III8, and III8–V trans-formations, respectively, reported in Ref. 3. Some indicatioof the I–II phase change, occurring at 1.4 GPa, are aobtained from the evolution with pressure of the peak fquencies and integrated areas. However, we do not henough data below and around the transition pressure tovide precise information about phase I and the I–II pha
ed
se
FIG. 8. Pressure evolution of the peak frequencies relative to the diffecomponents of then17 ~full dots!, the n12 ~empty squares!, andn18 ~emptydots! modes. Dotted lines are drawn as in Fig. 2.
IP license or copyright, see http://ojps.aip.org/jcpo/jcpcr.jsp

an
rvu
mure,at
thucs,obK
sicuou,ic
aliastt
dtohafo
venethheoa
or
ehi
asiso
stsulaetign
asthe
res-acehver,blelope
re-
the
avetheredand-e ofrnalt is
11
d toandesthepo-
ioncar-effi-theed.140r-
ightsionera-
ionian-
. P.
3748 J. Chem. Phys., Vol. 115, No. 8, 22 August 2001 Ciabini et al.
transformation. A very good agreement with the Ramanx-ray data3 is found for the pressure of the II–III and III–III8transitions. On the contrary, the last phase change, obsebetween 17 and 18 GPa, occurs well below the pressvalue reported by Thieryet al. ~22–24 GPa!.3 The explana-tion of this non-negligible pressure difference for the III8–Vtransition is not trivial, but in the x-ray experiment the sapling above 12 GPa was quite poor since only three measments were performed at.14, 19, and 24 GPa. Furthermorsome problems concerning the exact pressure determinin the experiment were reported by the authors.3 Pruzanet al. suggested that this last phase transition could befirst step of the chemical transformation to a polymeric strture involving the possible opening of the aromatic ring6
and it was correlated to the irreversible transformationserved when benzene is pressurized at 4 GPa above 85025
However, we must remark that all the characteristic bandcrystalline benzene, including those relative to the lattmodes, are observed up to 25 GPa. This, and the continhardening of the peak frequencies with increasing pressbetter agree with a transformation, occurring at 17.4 GPaa new crystal phase rather than with the onset of a chemreaction.
A second important result of this work is that the overinfrared absorption pattern does not change substantalong the different phase transitions. The number of crycomponents remains identical, as already observed forRaman spectrum, both in the lattice and in the internal moregions. The complete vibrational information allows usconclude that all the phases observed above 1.4 GPastructures with two molecules per unit cell, as foundphase III.2,3 New absorptions due tog modes of the isolatedmolecule are never observed in all the pressure ranges intigated in the present work, indicating that the inversion cter is preserved in all the different phases. These experimtal evidences emphasize the striking similarities amongII, III, III 8, and V crystal phases, which probably have all tsame structure with only small deformations of the monclinic unit cell, as also suggested by x-ray and Ramresults.3
Finally, the present infrared results contain some infmation on the high pressure reaction.3,6,7The main indicationof the occurrence of a chemical reaction has been the appance, above 21 GPa, of a broad band due to C–H stretcmodes relative to carbon atoms havingsp3 hybridization andwhose intensity grows, releasing pressure.6,8,9 This phenom-enon is also observed in our spectra where a very weak bappears, at.22–23 GPa, in the C–H stretching region jubelow the characteristic benzene absorption. The analysthe Raman internal modes showed that the frequency evtion with pressure ofn6 , a C–C–Cin-plane e2g bendingmode, and ofn10 ~in C6D6), an out-of-planee1g C–H bend-ing mode, is softer than the calculated one.7 This behavior,not observed for the symmetric vibrational modes, suggea nonsymmetric opening of the benzene ring at high presand a reactivity possibly driven by asymmetric molecuvibrations. To better understand to what extent the symmand the nature of the internal motions can trigger the hpressure reaction, the extension of the study of the freque
Downloaded 29 Aug 2001 to 150.217.28.107. Redistribution subject to A
d
edre
-e-
ion
e-
-.
ofeus
re,toal
lllyalhees
ver
es--n-e
-n
-
ar-ng
ndtof
lu-
edrerryhcy
evolution with pressure to all the infrared active modes wconsidered a crucial test. Our results show that none ofinternal modes actually shows a softening, even in the psure range where the transformation should take pl(P>20 GPa!. The slopes of the frequency evolution witpressure are indeed always positive up to 25 GPa. Howeconsidering the crystal modes which are still detectaabove 20 GPa, we observe a strong reduction of the svalues of all the components of the doubly degeneraten17
and n18 modes, an out- and an in- plane C–H bending,spectively, and of then12 C–C–Cbending mode~see TableII !. The decrease is particularly large at the III8–V transition(;75%! for the two high frequency components of then18
mode, suggesting this vibration as a preferential probe instudy of the reaction.
VI. CONCLUSIONS
Room temperature infrared absorption experiments hbeen carried out on benzene crystal up to 25 GPa. Forfirst time this analysis has been extended to the far-infraregion, where the bands due to the translational phononsto then16 internal vibration fall. Three different phase transitions have been identified from the pressure dependencthe integrated area and the peak frequencies of both inteand external modes. Among these, particularly importanthe confirmation of the phase change observed aroundGPa between phases III and III8, and the observation of aphase transition at 17.4 GPa which should be correlatethe III8–V phase change previously reported between 2224 GPa. The lack of discontinuities of the frequency valuat the different phase transitions and the constancy innumber of lattice phonon bands and internal mode comnents indicate that also phases II, III8, and V are monoclinic,factor groupC2h , with two molecules per unit cell. Also inthe present study we find indications of a chemical reactabove 22–23 GPa leading to the formation of saturatedbon atoms. Even though some of the pressure shift cocients are really small in phase V, a real softening offrequency of the different infrared modes is never observWe have also reported the growth of a new band at 1cm21 which could be correlated to the formation of precusory species of the high pressure reaction. To give insinto the pressure-induced reaction of benzene, the extenof the present analysis at higher pressure and lower tempture is mandatory.
ACKNOWLEDGMENTS
This work has been supported by the European Ununder Contract No. HPRI-CT1999-00111 and by the ItalMinistero dell’Universitae della Ricerca Scientifica e Tecnologica ~MURST!.
1P. W. Bridgman, Phys. Rev.3, 153 ~1914!.2G. J. Piermarini, A. D. Mighell, C. E. Weir, and S. Block, Science165,1250 ~1969!.
3M. M. Thiery and J. M. Leger, J. Chem. Phys.89, 4255~1988!.4P. W. Bridgman, Phys. Rev.3, 153 ~1914!.5J. Akella and G. C. Kennedy, J. Chem. Phys.55, 793 ~1971!.6P. Pruzan, J. C. Chervin, M. M. Thiery, J. P. Itie, J. M. Besson, JForgerit, and M. Revault, J. Chem. Phys.92, 6910~1990!.
IP license or copyright, see http://ojps.aip.org/jcpo/jcpcr.jsp

r
3749J. Chem. Phys., Vol. 115, No. 8, 22 August 2001 High pressure crystal phases of benzene
7M. M. Thiery, J. M. Besson, and J. L. Bribes, J. Chem. Phys.96, 2633~1992!.
8J. M. Besson, M. M. Thiery, and P. Pruzan, inMolecular Systems UndeHigh Pressure, edited by R. Pucci and G. Piccitto~Elsevier, New York,1991!, p. 341.
9M. Gauthier, J. C. Chervin, and P. Pruzan, inFrontiers of High PressureResearch, edited by H. D. Hochheimer and R. D. Etters~Plenum, NewYork, 1991!, p. 87.
10F. Cansell, D. Fabre, and J. P. Petitet, J. Chem. Phys.99, 7300~1993!.11D. M. Adams and R. Appleby, R. Trans. Faraday Soc.73, 1896~1977!.12W. D. Ellenson and N. Nicol, J. Chem. Phys.61, 1380~1974!.13A. Anderson, B. Piwowar, and W. Smith, Spectrosc. Lett.31, 1811~1999!.14R. G. Della Valle, E. Venuti, and A. Brillante, Chem. Phys.202, 231
~1996!.15H. K. Mao, P. M. Bell, J. V. Shaner, and D. J. Steinberg, J. Appl. Phys.49,
3276 ~1978!.
Downloaded 29 Aug 2001 to 150.217.28.107. Redistribution subject to A
16R. Bini, R. Ballerini, G. Pratesi, and H. J. Jodl, Rev. Sci. Instrum.68, 3154~1997!.
17F. Gorelli, M. Santoro, L. Ulivi, and R. Bini, Phys. Rev. Lett.83, 4093~1999!.
18I. Harada and T. Shimanouchi, J. Chem. Phys.46, 2708~1967!.19Y. A. Sataty, A. Ron, and M. Brith, Chem. Phys. Lett.23, 500 ~1973!.20M. M. Thiery, K. Kobashi, and I. L. Spain, Solid State Commun.54, 95
~1985!.21M. M. Thiery, D. Fabre, I. L. Spain, and K. Kobashi, Physica B139–140,
520 ~1986!.22M. P. Marzocchi, H. Bonadeo, and G. Taddei, J. Chem. Phys.53, 867
~1970!.23E. B. Wilson, Phys. Rev.45, 706 ~1934!.24G. Varsanyi, Vibrational Spectra of Benzene Derivatives~Academic, New
York, 1969!.25S. Block, C. E. Weir, and G. J. Piermarini, Science169, 586 ~1970!.
IP license or copyright, see http://ojps.aip.org/jcpo/jcpcr.jsp
Related Documents