1 High Performance Software in Multidimensional Reduction Methods for Image Processing with Application to Ancient Manuscripts Corneliu T.C. Arsene* 1 , Peter E. Pormann 1 , Naima Afif 1 , Stephen Church 2 , Mark Dickinson 2 1 School of Arts, Languages and Cultures, University of Manchester, United Kingdom 2 Photon Science Institute, University of Manchester, United Kingdom email: [email protected], [email protected], [email protected], [email protected], [email protected], [email protected] Abstract Multispectral imaging is an important technique for improving the readability of written or printed text where the letters have faded, either due to deliberate erasing or simply due to the ravages of time. Often the text can be read simply by looking at individual wavelengths, but in some cases the images need further enhancement to maximise the chances of reading the text. There are many possible enhancement techniques and this paper assesses and compares an extended set of dimensionality reduction methods for image processing. We assess 15 dimensionality reduction methods in two different manuscripts. This assessment was performed both subjectively by asking the opinions of scholars who were experts in the languages used in the manuscripts which of the techniques they preferred and also by using the Davies-Bouldin and Dunn indexes for assessing the quality of the resulted image clusters. We found that the Canonical Variates Analysis (CVA) method which was using a Matlab implementation and we have used previously to enhance multispectral images, it was indeed superior to all the other tested methods. However it is very likely that other approaches will be more suitable in specific circumstance so we would still recommend that a range of these techniques are tried. In particular, CVA is a supervised clustering technique so it requires considerably more user time and effort than a non-supervised technique such as the much more commonly used Principle Component Analysis Approach (PCA). If the results from PCA are adequate to allow a text to be read then the added effort required for CVA may not be justified. For the purposes of comparing the computational times and the image results, a CVA method is also implemented in C programming language and using the GNU (GNU’s Not Unix) Scientific Library (GSL) and the OpenCV (OPEN source Computer Vision) computer vision programming library. Therefore high performance software was developed by using the GNU GSL library, which provided a number of functions, which drastically reduced the computational complexity and time for the CVA- GNU GSL method while for the CVA-Matlab, the vectorization was used in order to reduce the respective computational times (i.e. matrix and vector operations instead of loop-based). 1. Introduction Multispectral/hyperspectral image analysis has undergone much development in the last decade 1 and it has become a popular technique for imaging hard-to-read documents 2 as it is a non-invasive and non-destructive way of analysis such documents by using a larger light spectrum. Multispectral images are obtained by the old document or manuscript being illuminated by narrow band light sources at a set of different wavelengths ranging from ultraviolet (300 nm) to infrared (1000 nm). For example, the Archimedes Palimpsest 2 was imaged over several years and in several stages with different imaging systems as technology improved. In the final stage 16 spectral images were 1 Kwon et al. 2013; Wang and Chunhui 2015; Shanmugam and SrinivasaPerumal 2014; Chang 2013; Zhang and Du 2012. 2 Easton, Christens-Barry and Knox 2011; Easton and Noel 2010; Netz et al. 2010; Easton et al. 2010; Bermann and Knox 2009, URL: http://www.archimedespalimpsest.net. arXiv: 1612.06457v2 [cs.CV] 25 Dec 2016

Welcome message from author
This document is posted to help you gain knowledge. Please leave a comment to let me know what you think about it! Share it to your friends and learn new things together.
Transcript

1
High Performance Software in Multidimensional Reduction Methods for
Image Processing with Application to Ancient Manuscripts
Corneliu T.C. Arsene*1, Peter E. Pormann
1, Naima Afif
1, Stephen Church
2, Mark Dickinson
2
1School of Arts, Languages and Cultures, University of Manchester, United Kingdom
2Photon Science Institute, University of Manchester, United Kingdom
email: [email protected], [email protected],
[email protected], [email protected],
[email protected], [email protected]
Abstract
Multispectral imaging is an important technique for improving the readability of written or printed text where the
letters have faded, either due to deliberate erasing or simply due to the ravages of time. Often the text can be read
simply by looking at individual wavelengths, but in some cases the images need further enhancement to maximise
the chances of reading the text. There are many possible enhancement techniques and this paper assesses and
compares an extended set of dimensionality reduction methods for image processing. We assess 15 dimensionality
reduction methods in two different manuscripts. This assessment was performed both subjectively by asking the
opinions of scholars who were experts in the languages used in the manuscripts which of the techniques they
preferred and also by using the Davies-Bouldin and Dunn indexes for assessing the quality of the resulted image
clusters. We found that the Canonical Variates Analysis (CVA) method which was using a Matlab implementation
and we have used previously to enhance multispectral images, it was indeed superior to all the other tested methods.
However it is very likely that other approaches will be more suitable in specific circumstance so we would still
recommend that a range of these techniques are tried. In particular, CVA is a supervised clustering technique so it
requires considerably more user time and effort than a non-supervised technique such as the much more commonly
used Principle Component Analysis Approach (PCA). If the results from PCA are adequate to allow a text to be read
then the added effort required for CVA may not be justified. For the purposes of comparing the computational times
and the image results, a CVA method is also implemented in C programming language and using the GNU (GNU’s
Not Unix) Scientific Library (GSL) and the OpenCV (OPEN source Computer Vision) computer vision
programming library. Therefore high performance software was developed by using the GNU GSL library, which
provided a number of functions, which drastically reduced the computational complexity and time for the CVA-
GNU GSL method while for the CVA-Matlab, the vectorization was used in order to reduce the respective
computational times (i.e. matrix and vector operations instead of loop-based).
1. Introduction
Multispectral/hyperspectral image analysis has undergone much development in the last decade
1 and it has
become a popular technique for imaging hard-to-read documents2 as it is a non-invasive and non-destructive way of
analysis such documents by using a larger light spectrum. Multispectral images are obtained by the old document or
manuscript being illuminated by narrow band light sources at a set of different wavelengths ranging from ultraviolet
(300 nm) to infrared (1000 nm). For example, the Archimedes Palimpsest2 was imaged over several years and in
several stages with different imaging systems as technology improved. In the final stage 16 spectral images were
1 Kwon et al. 2013; Wang and Chunhui 2015; Shanmugam and SrinivasaPerumal 2014; Chang 2013; Zhang and Du 2012.
2 Easton, Christens-Barry and Knox 2011; Easton and Noel 2010; Netz et al. 2010; Easton et al. 2010; Bermann and Knox 2009,
URL: http://www.archimedespalimpsest.net.
arX
iv: 1
61
2.0
64
57
v2 [
cs.C
V]
2
5 D
ec 2
01
6

2
selected which included one waveband centered in the near ultraviolet region of the spectrum (365 nm), seven
visible bands (445 nm, 470 nm, 505 nm, 530 nm, 570 nm, 617 nm and 625 nm), three infrared bands (700 nm, 735
nm, 870 nm). In addition images were obtained under tungsten illumination and under raking illumination using
separate lighting units from two sides and at two wavelengths (470 nm and 870 nm). The ink used in the writing of
the respective manuscript such as the iron-gall inks have a lot of low reflectance at Ultra-Violet (UV) wavelengths2,
meaning the ink can appear dark against parchment, which has a high reflectance at UV wavelengths. This kind of
distinction would be lost in conventional images, which are formed by integrating over larger wavelength ranges,
and any small variations in wavelength dependent reflectance or absorption tend to average out.
The application of these multispectral/hyperspectral image analysis methods to old manuscripts and palimpsests3
has produced significant results, enabling researchers to recover texts that would be otherwise lost, by improving the
contrast between the lost text and the manuscript. In particular a palimpsest is an old manuscript for which the
initial writing (i.e. the underwriting) was deleted by various mechanical or chemical ways and a new writing (i.e. the
overwriting) was written on the same parchment.
A number of important old manuscripts and ancient palimpsests have been processed in the last decade with
significant results and by using not only multispectral imaging systems and enhanced image processing techniques
but also synchrotron facilities4. The Archimedes Palimpsest
5 was processed between 2000 and 2011 with great
success. The Archimedes Palimpsest is a circa 10th century parchment manuscript that was deleted in the early of the
13th
century and overwritten with a Christian prayer book called the Euchologion. The name of the palimpsest is
because in the early of the 20th
century there were identified partial copies of seven scientific documents by
Archimedes, the oldest surviving reproductions of his writings. During the respective project an extended number of
multispectral imaging techniques and processing methods were developed and successfully applied on the respective
palimpsest. Multispectral imaging techniques6 and image processing were carried out for manuscripts originating
from Mount Sinai in Egypt, which were written between the 10th and 12
th centuries in Glagolitic, which is the oldest
Slavonic script. A number of palimpsests7
were multispectral image acquired and processed, which were
originating from the New Finds at Saint Catherine’s Monastery in Sinai in today’s Egypt. A number of old
manuscripts or documents8 (e.g. paintings) were multispectral imaged and processed namely the documentation of
Heinrich Schliemann’s (1822-1890) copybooks, the Nikolas Gyzis’s oil sketches on paper who was an important
Greek painter of the 19th century and an old papyrus dated 420/430 BC which was found in Daphne which is in
Athens in Greece (i.e. the oldest Greek text found in Greece). In the San Lorenzo palimpsest9 the underwriting was
containing over 200 secular musical compositions dated from the 14th
and the beginning of the 15th
century and it
was also multispectral imaged and processed. The overwriting contained the church properties until the 17th
century
in Florence in Italy (i.e. document named Campione dei Beni). It is worth mentioning also that other methods have
been used to study old manuscripts such as X-ray fluorescence analysis10
was done to discover the history of making
of the Codex Germanicus 6 which is a combination of twelve different texts forming a 614-page manuscript created
around 1450 in Germany. X-ray Phase-Contrast Tomography (XPCT) technique11
was used to uncover letters and
words in two papyrus rolls which are part of hundreds of similar rolls which were buried by the eruption of Mount
Vesuvius in 79 AD and belonging at that time to a library in Herculaneum in Italy. A combination of X-ray
fluorescence technique and multispectral imaging12
was done for the study of the Leonardo da Vinci’s The
3 Bhayro, Pormann and Sellers 2013; Pormann 2015; Hollaus, Gau and Sablatnig 2012.
4 Rabin, Hahn and Geissbuhler 2014; Mocella et al. 2015.
5 Walvoord and Easton 2008; Easton, Christens-Barry and Knox 2011; Easton and Noel 2010; Netz et al. 2011; Easton et al.
2010; Bergmann and Knox 2009.
6 Camba et al. 2014.
7 Easton and Kelbe 2014.
8 Alexopoulou and Kaminari 2014.
9 Janke and MacDonald 2014.
10 Rabin, Hahn and Geissbuhler 2014.
11 Mocella et al. 2015.
12 Stout, Kuester and Seracini 2012.

3
Adoration of the Magi drawing. Synchrotron radiation X-Ray Fluorescence (srXRF)13
has been used also in the
study of other old manuscripts.
The image processing techniques discussed in this paper have been applied for the purposes of image
enhancement to two old manuscripts. The first manuscript is with regard to Aelius Galenus (ca. 129-216) who was
an important Greek physician and philosopher in the Roman empire who influenced the development of various
scientific disciplines such as anatomy, physiology, pathology or pharmacology. For many centuries, the book of
Galen On Simple Drugs was required to be known while seeking to become physician as the book contained the
ancient knowledge about pharmaceutical plants and medicine. The Syriac Galen palimpsest14
is an important ancient
manuscript, which put many challenges to researchers as the undertext contains the Syriac translation by Sergius of
Reshaina of Galen’s On Simple Drugs. Sergius of Reshaina was a Christian physician and priest (d.536) and this
palimpsest is especially important because contains more text than in the other historical copy of the Syriac
translation made by Sergiu of Reshaina of Galen’s On Simple Drugs which exists in London, British Library (BL),
MS Add. 14661. There are better readings than in the other historical copy existent in BL. It has relevance to both
the Greek source text, the Arabic target texts and the development of Greco-Arabic translation technique. Finally is
able to address the role of Sergius’ Syriac versions of Hunayn ibn Ishaq’s school15
.
The second manuscript on which image processing techniques will be applied is an old Latin Roll titled John
Rylands Library, University of Manchester, United Kingdom, Latin MS 18 with its catalogue entry dating from
192116
and entitled Arbor Caritas at Misericordiae which although does not have any underwriting (i.e not a
palimpsest), some of the text has been almost deleted on account of water damage and the effects of age. This old
Latin Roll has also the particularity of having many illuminations/drawings on it such as Church Fathers and saints,
and biblical images from the Old and New Testaments.
2. Dimensionality Reduction Methods
There are various ways to improve the quality of an image of a page of a manuscript such as deblurring,
enhancement or dimensional reduction methods.
Deblurring17
of images consists of taking out blurring items from images caused, for example, by the fact that the
image is out of focus. Deblurring can be done in various ways such as by using a Wiener filter, by using a
regularized filter, by using blind deconvolution algorithm or the Lucy-Richardson algorithm18
. Image enhancement
can be achieved by modifying the histogram of pixel values in the image to adjust the contrast, thereby improving
the clarity of details within the picture. This is typically achieved by linearly scaling the pixel values between two
reference points, however, in some cases significant improvements can be made by using polynomial scaling to
higher orders, ie. L2, L
3 or L
4, which can place more emphasis on the variation within features of interest. Color
images can be also enhanced by transforming the RGB images to L*a*b* color space and by altering then the
luminosity L* of the image. Techniques to improve the image contrast between the manuscript and the written text
were developed elsewhere19
and included for example the implementation of a custom image look-up table to
display the text in false-color, the automatic contrast adjustment of the image based upon the quartic scaling of pixel
values and the removal of variation in the manuscript pixels by blurring out the image details and subtracting the
13 Glaser and Deckers 2014; Manning et al. 2013.
14 Bhayro et al. 2013, URL: http://www.digitalgalen.net.
15 Khurshid 1996.
16 James 1921.
17 Shao and Elad, 2015.
18 Fish et al. 1995.
19 Church 2015.

4
original image. These methods allowed an inexperienced user to maximize the clarity of text, but were heavily
dependent upon required sampling and could produce artifacts and incoherent results due to large scale image
variation and sampling mistakes. Therefore additional methods were developed to carry out the study with no user
input. This included the calculation of localized variances, which provide a distinct outline for any text based upon
the large change in pixel value between the text and other image components, and 2 dimensional spatial
autocorrelation indexes which distinguished between text and the manuscript based on the degree of variation in
each region which increased the visibility of the text from the manuscript.
There are also techniques to do color image enhancement in multispectral images by using the Karhunen-Loeve
transform20
, a linear contrast stretch or a decorrelation stretch. Moreover, contrast enhancement techniques based on
histogram and for multispectral images have been also developed in the past21
. A further development of this
method and applied to multispectral images for color enhancement was done22
to enhance the spectrum which is not
in the visible range. Multispectral image enhancement technique based on PCA and Intensity-Hue-Saturation (IHS)
transformation have been developed and applied23
.
For palimpsests such as the Archimedes Palimpsest, image enhancing techniques have been applied to the
acquired multispectral images24
. Initially, spectral segmentation techniques were developed20
based on a least-
squares supervised classification, but the scholars assessed that the results were not clear enough. Following this, the
contrast of each image band was enhanced using the neighborhood information of a pixel and then subtracting two
resulted channels (i.e. called sharpies method). However the subtraction increased the noise, so a new method called
“pseudocolor” was developed in which the red channel under tungsten illumination was placed in the red channel of
the new image, while the ultraviolet-blue image was placed in the blue and green channel. This way the overwriting
showed with a gray color while the underwriting showed with rather a red color. Finally PCA method was employed
which provided further enhancement to the multispectral images and which was followed by a combination of the
PCA method with the pseudocolor method which provided the best quality in the respective investigations.
An example of a regular and simple image enhancement technique for image processing briefly used herein is a
Double Thresholding (DT) technique which consists of the following: the darker overtext is carefully identified by
the human operator and colored in white (threshold 1) and then the remaining undertext, which is black but not as
black as the initial overtext is made even darker (threshold 2). This technique apparently showed some initial
interesting results but its success depends on both the human operator who has to select suitable cutting values and
on the characteristics of the respective image so clearly this simpler method would not work for any page of an
ancient manuscript. However, these various image processing methods, although capable to provide workable
images of undertext for example in the gutter region of a folio, are unable to show when there is undertext beneath
the overtext. However, more complex methods25
have been developed and are available for image processing (i.e.
image reconstruction, image restoration, image segmentation) based for example on Artificial Neural Networks26
(ANNs) which are processing information models which are trying to mimic the way the brain works.
One solution is to use the dimensionality reduction methods which reduce the number of features or random
variables under consideration by transforming the data from a high-dimensional space to a space of a fewer
dimensions27
. There are mainly two types of dimensionality reduction methods: unsupervised methods, which are
using a number of points to determine the model without knowing the classes (e.g. parchment, overwriting,
underwriting) to which the input data points belong to, and supervised methods, which are methods that are using a
number of input points to determine the model while knowing the classes (e.g. parchment, overwriting,
20 Mitsui et al. 2005.
21 Mlsna and Rodriguez 1995; McCollum and Clocksin 2007.
22 Hashimoto et al. 2011.
23 Lu et al. 2011.
24 Easton and Noel 2010.
25 Zhenghao et al. 2009; Doi 2007; Egmont-Petersen, de Ridder and Handels 2002.
26 Graves et al. 2009; Lisboa et al. 2009; Arsene, Lisboa and Biganzoli 2011; Arsene and Lisboa 2011; Arsene and Lisboa 2007;
Arsene et al. 2006.
27 Freeden and Nashed 2010.

5
underwriting) to which the input points belong to. The supervised methods in general produce better results than the
unsupervised methods as they use also the information about the classes to which the inputs points belong and so the
mathematical model obtained is able to reflect better the task of reduction the number of input dimensions. However
selecting a number of input points is time consuming28
so there is an interest in studying also the unsupervised
methods especially whether an automatic method of choosing the input points could be provided for the
unsupervised methods.
There are a larger number of dimensionality reduction methods being developed in the last decade implemented in
various computer programming languages. An extended number of dimensionality reduction methods have been
tested in this paper by using a Matlab toolkit29
and the ones presented below are the ones which provided
meaningful image results.
The Canonical Variates Analysis (CVA) supervised method, with an independent implementation in Matlab30
,
tries to maximize the distance between the different classes while minimizing the size of each of the classes and is
doing this for multiple classes. The covariance matrixes within each class and between the classes are calculated
and then the eigenanalysis is performed based on these two matrixes. The eigenvectors calculated by this
eigenanalysis are the canonical vectors used to produce the new grayscale images. The Linear Discriminant
Analysis (LDA) is similar to CVA but it is applied to 2 classes only. These types of methods are typically very
robust producing very good results, as they are both supervised methods: also the problem that they are solving,
maximizing the distance between the different classes while minimizing the size of each of the classes, is of key
importance in the present analysis. As they are supervised methods both the human operator selects a number of
points to be used by the respective methods and also the classifications of the respective points (i.e. class
manuscript, class underwriting, etc) are given to the respective methods.
From the extended number of dimensionality reduction methods being tested in this paper by using the Matlab
toolkit23
, the Neighborhood Component Analysis (NCA) supervised method, is a supervised learning algorithm for
classifying multivariate data into distinct classes by using a distance metric over the data. Usually the distance is the
Mahalanobis distance measure. The method consists of learning a linear transformation of the input space, which in
this case are the multispectral images, such that in the transformed space the k-Nearest Neighbors (kNN) algorithm
performs well.
From the same toolkit, in the General Discriminate Analysis (GDA) supervised method the methods of the
general linear model are applied to the discriminant function analysis problem. The advantage of doing this is that it
is possible to specify complex models for the set of predictor variables continuous or categorical (e.g. polynomial
regression model, response surface model, factorial regression, mixture surface regression).
Both NCA and GDA are expected to deliver some good image results as they are supervised methods and were
reported as performant methods in the context of multispectral/hyperspectral image analysis31
. However, the NCA
method is based on optimization algorithms (i.e. line search optimization method) for calculating the models
parameters and sometimes, depending on the optimization algorithms being used, a local minimum point can be
reached for the function being optimized which means that the image results might not be optimal. In such
situations re-running the respective dimensionality reduction method (e.g. NCA, GDA) might solve the problem by
avoiding reaching a point of local minimum.
Other dimensionality reduction methods will be used from the Matlab toolkit23
in a supervised way, that is the
user will select the input points as it would happen normally with the supervised methods but without providing the
class information.
Isomap is a nonlinear dimensionality reduction technique and, in this work, the a priori chosen points are used as
input information making it a supervised method. In the Isomap method a matrix of shortest distances between all of
the input points is constructed and multidimensional scaling is then used to calculate a reduced-dimension space.
The multidimensional scaling consists of collections of nonlinear methods that map the high dimensional data to a
low dimensional space by trying to keep the original distances between points as much as possible. The quality of
mapping is given by a stress function, which is a measure of error between the distances between the points in the
28 Hollaus, Gau and Sablatnig 2013.
29 van der Maaten and Hinton 2008.
30 Bohling 2010.
31 Goldberger et al. 2005; Imani and Ghassemian 2014.

6
initial high dimensional representation of data and the distances between the points in the new lower dimensional
representation of data.
The Landmark Isomap algorithm is a variant of the Isomap algorithm, which uses landmarks to increase the speed
of the algorithm. It addresses the computational load with regard to the calculations of the shortest path distances
between points when mapping the data from the high dimensional to the lower dimensional space and the
calculation of the eigenvalues. A smaller number of points are chosen to be the landmark points for which the
shortest distances between the respective points and each of the other data points are calculated. This results in a
reduction of the computational time. In the literature, Isomap type of methods being nonlinear, local and geodesic
methods were reported as having good performance when tested on multispectral images32
.
The Principal Component Analysis (PCA) method is a statistical method, which performs an orthogonal
transformation of the input data in order to change a number of observations of possibly correlated variables into a
number of linear uncorrelated variables named Principal Components (orthogonal). The first principal component is
the one with the biggest variance and therefore which justifies for the most of the variation in the data. There are
several stages in this well established method: subtract the mean of each variable from the dataset, calculate the
covariance matrix, calculate the eigenvectors and eigenvalues of this matrix, orthogonalize the set of eigenvectors
and normalize them. In the Probabilistic Principal Component Analysis (PPCA) method the principal components
are calculated through maximum-likelihood estimation of parameters in a latent variable model, which offers a
lower dimensional representation of the data and their correlations. The Gaussian Process Latent Variable (GPLV)
model is a probabilistic dimensionality reduction method that uses Gaussian Process Latent Variable model to find a
lower dimensional space for the high dimensional data. It is an extension of the PCA. The latent variable models are
models which use for example one latent variable to aggregate several observable variables and which are dependent
somehow (e.g. “sharing” variance). The PCA types of dimensionality reduction methods have been applied with
success to more general multispectral/hyperspectral images33
but also to old manuscripts34
.
In this work, three variants of the PCA method will be used. The PCA method used in a supervised way by
providing a set of input points especially chosen to represent the classes of interest (i.e. underwriting, overwriting,
manuscript) and two unsupervised PCA methods implemented in ImageJ software14
and Matlab which will use as
input an entire manuscript page/folio without any supervised information.
The Diffusion Maps (DM) model is a nonlinear dimensionality reduction method, which uses a diffusion distance
as a measure between the different input points, and so builds a map, which gives a global description of the dataset.
An analogy can be seen between a diffusion operator on a geometrical space and a Markov transition matrix
operating on a graph whose nodes are sampled from the respective geometrical space (i.e. dataset). The algorithm is
robust to errors and it is computationally less expensive. The DM has been applied to image processing with some
success35
and here will be used as a supervised method.
The t-Distributed Stochastic Neighbor Embedding (t-SNE) method is another dimensionality reduction method in
which the Kullback-Leibler divergence distance between two probability distributions is minimized. The two
probability distributions include one distribution in which the nearby points have higher probability than the other
points in the higher initial dimensional space while the second distribution is the lower desired dimensional space of
data. The model is of more recent date and it is still being heavily investigated36
in order to improve its
performances and it will be used here also in a supervised way the same as all the remaining methods described
below.
The Neighborhood Preserving Embedding (NPE) method tries to maintain the local neighborhood structure in the
data in order to be less influenced by errors in comparison, for example, to PCA (i.e. PCA tries to maintain the
overall Euclidian distances in the data). It is similar to the Locality Linear Embedding (LLE) method which is also
trying to find first a linear combination of neighbors for each input point. Second, the LLE method implements an
eigenvector-based optimization method, which optimization method is different from the one used by NPE, in order
to find a low-dimensional embedding of the points in such a way that each input point is still represented by the
32 Journaux et al. 2006; Journaux, Foucherot and Gouton 2008.
33 Journaux, Foucherot and Gouton 2008; Baronti et al. 1997; Ricotta and Avena 1997.
34 Eastonm, Christens-Barry and Knox 2011; Easton and Noel 2010.
35 Gepshtein and Keller 2013; Xu et al. 2009; Freeden and Nashed 2010.
36 Bunte et al. 2012.

7
same mixture of its neighbors. In effect a neighborhood map is realized in the two methods (NPE, LLE), in which
for each point in the higher initial dimensional space is corresponding a new point in the new lower dimensional
space. The Hessian Locally-Linear Embedding (HLLE) method is based on the LLE method in the way that it
achieves a linear embedding by minimizing the Hessian functional on the data space. The HLLE algorithm involves
the second derivative and therefore the algorithm is sensitive to noise.
Other methods from the same Matlab toolbox, but which methods resulted in poor image results in this work,
were the Factor Analysis (FA) method the Laplacian Eigenmaps (LE) method. The FA method depicts the diversity
of input data function of some unseen variables called factors. The observed variables are depicted as linear
mixtures of the unseen factors and to these factors are added some error variables. The information extracted with
regard to the relationships between the observed variables (i.e. the correlation matrix), is used to calculate both the
factors and the new reduced dimensional space by minimizing the difference between the correlation matrix of the
initial input data (i.e. the observed variables) and the correlation matrix of the new reduced space. The LE method
employs the spectral techniques to implement the dimensionality reduction problem. A graph is built in which each
node represents a data point and the connections with the other graph nodes are given by the adjacency of the data
points from the vicinity of initial data point from the initial higher dimensional data space. The lower dimensional
space is represented by the eigenfunctions of the Laplace-Beltrami operator, while the minimization of an error
function based on the graph ensures that the new points in the lower dimensional space are maintaining the
proximity characteristic of the initial data points from the higher dimensional data space. The calculation of the
connections in the graph is not easy to be done and again when data is complex the method is not so robust. The FA
and LE results are not shown herein as the image results were not good.
The above extended set of dimensionality reduction methods implemented by the above Matlab toolbox23
together with the previous result37
obtained with the Canonical Variates Analysis (CVA) method and the
unsupervised PCA method implemented in ImageJ14
and again Matlab were applied to the page 102v-107r_B page
of the Galen palimpsest.
Image data consisted of large 8-bit TIFF image files. There were in total 23 multispectral images consisting of
images obtained through Light-Emitting Diode (LED) illumination at the spectra of 365 nm, 450 nm, 470 nm, 505
nm, 535 nm, 570 nm, 615 nm, 630 nm, 700 nm, 735 nm, 780 nm, 870 nm, 940 nm, images obtained at raking light
under illumination at 940 nm (raking infrared with illumination from the right and then from the left), 470 nm
(raking blue with illumination from the right and then from the left) and ultraviolet images (365 nm) with red, green
and blue color filters and blue illumination (450 nm) with red, green and blue color filters. The multispectral images
were already normalized with values between 0 and 255 and there were used as an input to the all the image
processing methods used in this work and without making any further pre-processing of the data.
In this experimental setup, for all the methods except the unsupervised PCA methods, there were selected from
each of the 23 multispectral image, 50 points representing the overwriting (class Overwriting), 50 points
representing the underwriting (class Underwriting), 50 points representing the parchment (class Parchment) and 50
points representing both overwriting and underwriting (class Both). In this last case (Class Both) the scholar could
read only the overwriting but from the structure of the underwriting it was inferred that underwriting existed under
the overwriting. There were in total 200-classification input points used by each supervised dimensionality reduction
methods. The input data matrix consisted of 23 rows by 200 columns and for the CVA, LDA, GDA and NCA
methods it was provided to the Matlab software functions also the information about the classes (e.g. parchment,
overwriting, underwriting) to which the input points belonged. Moreover the number of points (i.e. 50) for each
class could be varied so that to put more emphasis on a class or another class and the number of classes could be
varied as well, such as to exclude class Both (Overwriting and Underwriting) or to include another class
representing for example the region outside the manuscript in case it existed (class Outside).
For the unsupervised PCA methods implemented in ImageJ and Matlab, it was used no a priori known
information but the entire manuscript page/folio. In ImageJ the Multivariate Statistical Analysis (MSA) 514 plugin
was used which implements the PCA method. The 23 multispectral images are loaded as a stack in ImageJ, then the
Crop function from ImageJ is used to exclude everything outside the folio of the manuscript and then the MSA514
plugin was run while it was told how many images to produce (i.e. 5 in this case). An image stack is produced by the
MSA514 plugin and by scrolling through the produced grayscale images, the undertext was mostly visible in
channels 1, 4 and 5 and then the stack to RGB command was used to produce a color image.
Each dimensionality reduction method (supervised or unsupervised) produces a number of regression coefficients
that are multiplied with the entire set of 23 multispectral images. It results in a new set of 23 arrays of floating point
37 Pormann 2015.

8
numbers which are further processed by making a correspondence between the maximum and the minimum values
of the arrays to the values of 0 and 255 (i.e. 8 bit image files) and rescaling all the floating point numbers by taking
into account the new range (0-255) and the new correspondence (0 for the minimum value array and 255 for the
maximum value array). An array will become a new grayscale image.
A second set of 23 arrays of floating point numbers is produced based on the same multiplication between the
regression coefficients and the entire set of multispectral images. The newly calculated minimum and the maximum
values of the input points initially used by the respective supervised or unsupervised dimensionality reduction
methods are scaled between 0 and 255 and the arrays of floating point numbers are rescaled based on this new
range. The scope of these two different processes is to map the new numbers to the range 0 and 255 by taking into
account either the new scores of the input points or the new floating point numbers obtained from the above
multiplication.
Finally a third set of grayscale images can be obtained also for exploratory purposes by taking out the 0.01, 0.1, 1
or 5 percentiles of the data obtained from the multiplication of the regression coefficients with the entire set of
multispectral images and following the same rescaling explained above. It is possible this way to see how important
the segment of the data is which is taken out by the respective percentiles.
The post-processing steps described above were applied identically to all the results obtained with the various
dimensionality reduction methods.
All the grayscale images produced by the dimensionality reduction methods were looked at and investigated.
There were no pre-processing steps applied on the input data matrix consisting of the 23 rows by the 200
columns. However some of the dimensionality reduction methods apply some pre-processing steps on the input data
but inside the respective functions consisting of recentering the data on the mean and with variance 1, such as: NCA,
GPLVM, LDA, t-SNE, PCA and DM. All the dimensionality reduction methods were used with the default input
parameters. Most of these dimensionality reduction methods are generally using also the calculation of the
eigenvectors along their inner computational steps: CVA, PCA, DM, HLLE, t-SNE, GDA, GPLVM, LDA, NPE,
Isomap, Landmark Isomap, LLE and Laplacian Eigenmaps.
Furthermore a color image can be produced by combining three grayscale images. Normally the best grayscale
image in terms of underwriting was placed in the Green channel before producing the color image (combined Red,
Green and Blue grayscale images) for each of the dimensionality reduction method. Further image enhancement can
be achieved, for example, by adjusting the contrast on the grayscale images.
For the purposes of comparing the computational times with the CVA method implemented in Matlab, a CVA
function was implemented in the C programming language and by using also a software library for numerical
computations called GNU (GNU’s Not Unix) Scientific Library (GSL). For easiness in use, an image processing
software was employed, ImageJ software38
, which is an open architecture image processing software which gives
the possibility to add new functions/procedure/macros by writing Java plugins. By using a JNILIB library file,
which is Java framework that allows Java to integrate with other programming languages, the CVA function
implemented in C programming language as a JNILIB library file is called. The CVA-GNU GSL method is able to
process and to produce both 8-bit and 16-bit images and the OpenCV39
(OPEN source Computer Vision) computing
programming library was used with this scope.
3. Evaluation of dimensionality reduction methods for ancient manuscripts
We used two approaches to evaluate the success of the image processing techniques. Firstly, the relative success of
these methods was determined visually by seven experts in the Syriac language (i.e. for the Syriac Galen
manuscript) based on how well the scholars could read the undertext by distinguish it from the parchment and the
overtext. No further changes were made to the resulted images to assess directly the quality of the results of the
dimensionality reduction methods. The scholars/experts were able also to identify the improvements achieved in the
38 Schneider, Rasband and Eliceiri 2012.
39 http://opencv.org

9
new produced images with the different dimensionality reduction methods as compared to the original multispectral
images.
Secondly we calculated two different indices that are commonly used for evaluating the success of
multidimensional clustering techniques to see whether either of these numerical approaches agreed with the
qualitative evaluations. However, the assessment made by normal people and by the scholars is the standard way of
evaluating these images but for exploratory purposes there is also this numerical way of comparing the images (i.e.
interferometric visibility another numerical method for quantitative assessment of manuscripts18
). The first index is
the Davies-Bouldin Index (DBI) 40
, which is one of the standard measures for evaluating clustering algorithms41
. It
is calculated using the following equations.
(1)
where is a measure of scatter within the cluster i (i.e. the average distance between each point in the i cluster and
the centroid of the i cluster), is the size of cluster, is the centroid of cluster i, are values forming a cluster
and p is usually 2.
Equation (2) describes , the Euclidian distance between the centroids of the two clusters i and j.
(2)
where is as explained above the Euclidian distance between the clusters i and j where in this case the two
clusters are the underwriting cluster and the parchment cluster, n is the size of the centroids Ai and Aj, ak,i and ak,j are
the kth element of clusters Ai or Aj.
The measure of how good the clustering technique is (i.e dimensionality reduction method) is whereas lower
the value is, the better the separation of clusters between the parchment cluster and the underwriting cluster.
(3)
where is a measure of scatter within the cluster j (i.e. the average distance between each point in the j cluster and
the centroid of the j cluster).
For exploratory purposes a second well-known measure is used the Dunn Index (DI)42
. This index is suggested for
clusters, which are dense with small variance between the different items of the clusters and with the means of
different clusters being sufficiently at a sufficiently large distance which might be expected if our multispectral
enhancement methods have performed well. Therefore DI is expected to identify well the CVA or LDA methods
which are very likely to produce sets of clusters of the above type but it might be not so suitable for all the
dimensionality reduction methods hence the interest in exploring this index as well.
(4)
The minimum distance between cluster i and j is taken as the difference between and the scatters of the two
clusters and . Furthermore the maximum distance within a cluster and over all the clusters is taken as the
maximum over the scatters of the two clusters and .
(5)
40 Bouldin and Donald 1979.
41 Franti, Rezaei and Zhao 2014.
42 Dunn 1973.
10
In Figure 1 it can be seen a geometrical interpretation of the minimum distance between cluster i and j which was
taken as described above as the difference between (i.e. the Euclidian difference between the means/centroids
of the two clusters) and the scatters of the two clusters and .
Scatter of cluster
Figure 1. Geometrical interpretation of the minimum distance between cluster i and j taken as the difference
(i.e. the Euclidian difference between the centroids of the two clusters) and the scatters (i.e. the average distance
between each point in the cluster and the centroid of the respective cluster) of the two clusters and .
4. Results
We chose 12 methods from the Matlab toolbox
23 and applied them to the 102v-107r_B page of the Galen
palimpsest and also the CVA method24
used previously. In total there were applied 13 supervised methods from
which 4 methods, used both a number of user selected input points and also the class information about the
respective input points: Canonical Variates Analysis (CVA) method, Generalized Discriminant Analysis (GDA),
Linear Discriminant Analysis (LDA) and Neighborhood Component Analysis (NCA). Six supervised methods
were also applied which used only the user selected input points: Gaussian Process Latent Variable Model
(GPLVM), Isomap, Landmark Isomap, Principal Component Analysis (PCA), Probabilistic Principal Component
Analysis (PPCA) and Diffusion Maps (DM). Other three supervised methods (i.e. making a total of 13 supervised
methods) which used also only the user selected input points but did not give good results in this work were
Neighborhood Preserving Embedding (NPE) method, the t-Distributed Stochastic Neighbor Embedding (t-SNE) and
the Hessian Locally-Linear Embedding (HLLE).
Finally, a regular image enhancement method that is the Double Thresholding (DT) method was applied and two
independent implementations of the unsupervised PCA method in ImageJ and Matlab (i.e. making a total of 15
dimensionality reduction methods being used).
In Figure 2 is shown an area of the color or grayscale images of the 13 supervised methods, the two unsupervised
PCA methods (ImageJ, Matlab), the double thresholding technique, the ultraviolet illumination with green color
filter and the original page seen by the human eye for the 102v-107r_B page of the Galen palimpsest.

11
a) Canonical Variates Analysis method b) Linear Discriminant Analysis method
c) Neighborhood Component Analysis d) Generalized Discriminant Analysis
e) Diffusion Map f) Isomap
g) Landmark Isomap h) Principal Component Analysis-Unsupervised
(ImageJ implementation)

12
i) Principal Component Analysis j) Gaussian Process Latent Variable Model
k) Probabilistic Principal Component Analysis l) Double thresholding
m) ultraviolet illumination with n) original page seen by the human eye
green color filter (i.e. CFUG)
o) PCA - Unsupervised (Matlab implementation) p) TSNE2

13
r) HLLE s) NPE
Figure 2. Color image results obtained with 13 supervised dimensionality reduction methods, a simple double
thresholding technique, two unsupervised PCA dimensionality reduction methods and in comparison with the
original page seen by the human eye and the image obtained with the ultraviolet illumination with green color filter
for a section of 102v-107r_B page.
As previously described, for the 13 supervised methods 50 points (i.e. 50 different x and y image pixel
coordinates) were selected from each of the multispectral images for class Overwriting, 50 points for class
Underwriting, 50 points for class Parchment and 50 points representing both overwriting and underwriting. 200
input points (i.e. 200 different pixel coordinates) were used from each multispectral image which resulted in an
input matrix of 23 rows by 200 columns, the input data for each supervised dimensionality reduction method. It can
be noticed that in this case, the PCA, PPCA and GPLVM methods (Figure 2) gave similar visual and numerical
results as can be seen above.
The visual assessment made by the 7 scholars experts in the Syriac language was done in two ways with regard to
the images shown in Figure 2. First by giving a score for each photo function of how well the underwriting was
readable by the scholars. The scores used were 5 – excellent, 4 – good, 3 – moderate, 2 – fair, 1 – poor, 0 – no
readability and the images with the highest scores were deemed the best by the scholars in terms of underwriting.
The total score was summed through the 7 lists produced by the 7 scholars. The first four images which best scored
were in order CVA, PCA Matlab (unsupervised), GDA and Isomap (Table 1).
Table 1. Scores between 5 and 0 given by the 7 scholars (P1-P7) experts in Syriac language
(5 – excellent, 4 – good, 3 – moderate, 2 – fair, 1 – poor, 0 – no readability).
P1 P2 P3 P4 P5 P6
P7
Total
CVA 4 5 5 5 5 5 5 34
PCA unsupervised
(Matlab) 4 4 5 2 5 4 4 28
GDA 4 4 3 3 5 3 4 26
Isomap 4 3 4 3 5 3 4 26
LDA 4 4 3 2 5 4 2 24
PCA unsupervised
(ImageJ) 3 3 4 3 4 2 4 23
NCA 2 4 3 2 4 4 3 22
DM 2 3 3 2 5 2 4 21
PCA 1 3 4 2 4 2 3 19
GPLVM 1 3 4 2 4 2 3 19
PPCA 1 3 4 2 4 2 3 19
Landmark Isomap 3 3 3 2 3 1 4 19
CFUG (ultraviolet) 3 1 3 2 3 3 3 18
Original page 0 0 2 0 2 2 1 7
DT 0 1 1 1 0 1 2 6
NPE 0 0 1 1 1 2 1 6
TSNE2 0 0 1 0 1 1 0 3
HLLE 0 0 0 0 0 0 0 0

14
Running an ANalysis Of VAriance (ANOVA) test for each column, where each column represents a person,
resulted in a p value of 0.0591, which means that there are overall no significant differences between the different
persons who scored the images. Calculating the standard deviation of the Total column gives a value of 9.4903. We
can define the most effective methods as lying within one standard deviation of the top value, which is CVA (34),
giving the four methods from above in the order CVA, PCA Matlab (unsupervised), GDA, Isomap.
Table 2. Ranking positions (1 to 18) given by the 7 scholars (P1-P7) experts in Syriac language.
Finally, a second ANOVA test was carried out by taking each row as a group in order to check whether there are
any statistically significant differences between the scores given to each image. The calculated p-value of 5.1596e-
23 means that there are statistically significant differences between the scores given to the different images, which is
obviously what was expected as some methods produced much better images than the others.
Second way in which the scholars assessed the images was to rank the images from 1 to 18 function again of how
well the underwriting was readable and then to sum up the ranks for each image. The first six images which best
scored (Table 2) corresponded to the methods in the order CVA, PCA Matlab (unsupervised), NCA, Isomap, LDA,
GDA. The standard deviation is 34.39 for the last column from Table 2 (Total) plus the value of the best scoring
method which is 7 (CVA) it gives 41.39. The methods up to the value of 41.39 are in order CVA, PCA Matlab
(unsupervised), NCA, Isomap, LDA, GDA exactly the same as the first six methods from above. It can be observed
also some strong similarities with the first four methods from Table 1 that is list formed of CVA, PCA Matlab
(unsupervised), GDA, Isomap.
For exploratory purposes, a numerical assessment of the color images from Figure 2 was done based on the
grayscale images which had the best visually looking underwriting from the three grayscale images used to produce
a color image in Figure 2. A color RGB image is usually obtained by combining these three grayscale images.
The grayscale image for which the underwriting is most visible in comparison to the other two grayscale images
produced by a dimensionality reduction method, is as already described, usually located in the green channel of the
resulted color RGB image. With the DB index, it was compared the underwriting cluster versus the parchment
cluster for the best good looking grayscale image showing the best underwriting and using 200 points for each
cluster. In Figure 3 is shown the ranking of the grayscale images made numerically with the best looking grayscale
image having to have the smallest value for the DB index.
P1 P2 P3 P4 P5 P6
P7
Total
CVA 1 1 1 1 1 1 1 7
PCA unsupervised
(Matlab) 5 9 2 3 3 2 4 28
NCA 9 3 8 2 7 3 2 34
Isomap 4 6 3 4 4 5 8 34
LDA 2 2 10 9 2 4 6 35
GDA 3 4 9 5 6 7 3 37
DM 10 5 11 7 5 9 5 52
PCA unsupervised
(ImageJ) 7 8 4 8 8 11 7 53
Landmark Isomap 6 7 12 6 12 8 9 60
PCA 11 10 5 10 9 12 10 67
GPLVM 12 11 6 11 10 13 11 74
CFUG (ultraviolet) 8 14 13 13 13 6 13 80
PPCA 13 12 7 12 11 14 12 81
Original page 16 15 14 14 15 10 14 98
DT 18 13 17 15 14 15 16 108
TSNE2 14 16 15 16 17 17 17 112
NPE 15 18 16 18 16 16 15 114
HLLE 17 17 18 17 18 18 18 123

15
Table 3. DB index.
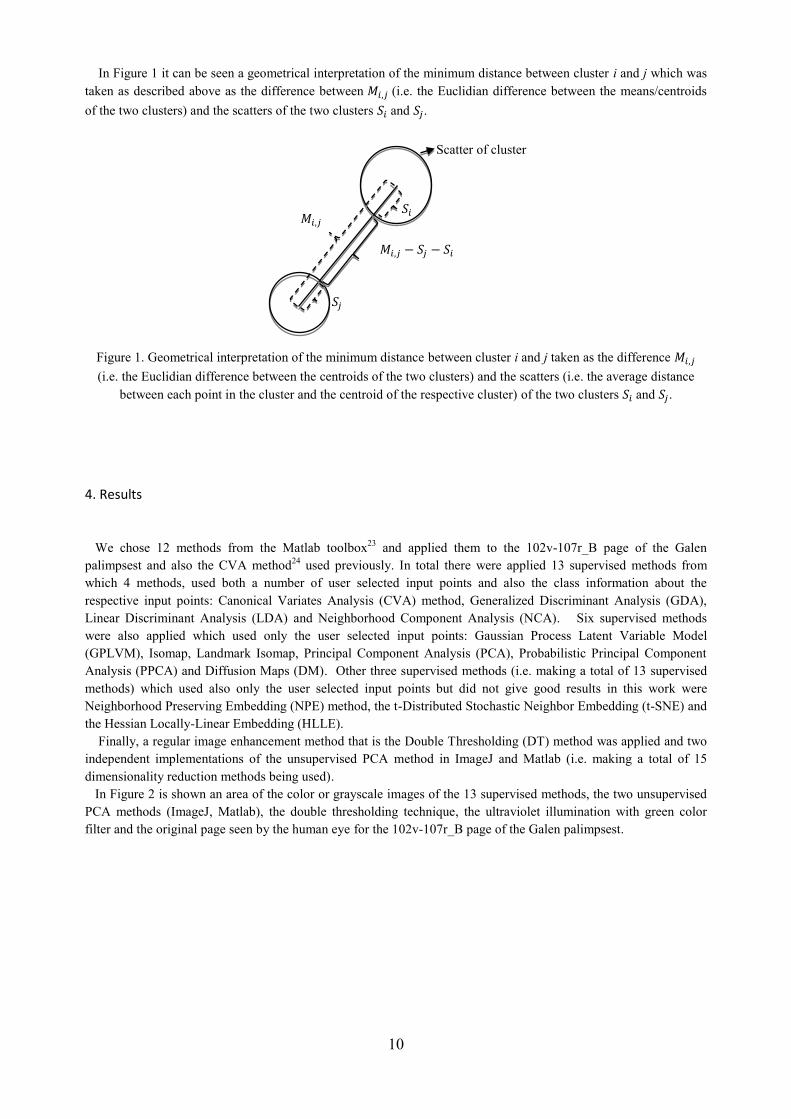
The DB index (Table 3) confirmed partly the visual assessment with the CVA method being the best (0.0522)
followed in order by the Double Thresholding technique (0.13), LDA (0.2), the original 102v-107r_B page with
ultraviolet illumination with green color filter (0.21), DM (0.22), GDA (0.235), Isomap (0.25), Landmark Isomap
(0.283), NCA (0.29), PCA (0.3), PPCA (0.3), GPLVM (0.3), PCA unsupervised-ImageJ implementation (0.33),
PCA unsupervised-Matlab implementation (0.38), Original page (0.4194), TSNE2 (0.6614), HLLE (1.61) and NPE
(3.85). The CVA method gave a much better result (0.0522) than the 102v-107r_B folio with ultraviolet illumination
with green color filter (0.21).
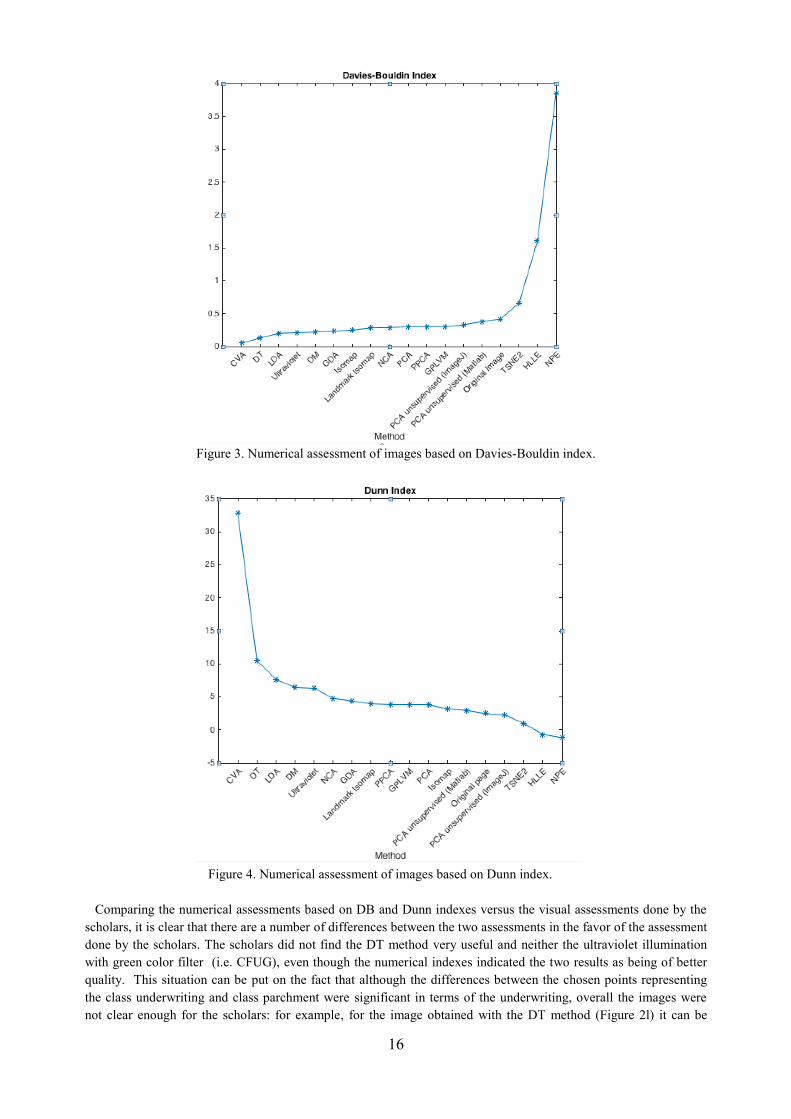
For exploratory purposes, the second index DI (Table 4), was also used to assess the respective grayscale images,
which resulted in the ranking shown in Figure 4. The DI is suitable especially for CVA or LDA type of methods.
Although the Dunn index confirmed also the superiority of CVA method, overall the DB index was more
conservative while the Dunn index ranking of the methods was CVA (32.90), Double Thresholding (10.52), LDA
(7.65), DM (6.45), NCA (4.78), GDA (4.39), Landmark Isomap (3.93), PCA (3.83), PPCA (3.83), GPLVM (3.83),
Isomap (3.18), PCA unsupervised-Matlab implementation (3), PCA unsupervised-ImageJ implementation (2.94),
Original image (2.46), TSNE2 (0.9963), HLLE (-0.69), NPE (-1.191).
It has to be stressed again that although the DB index or other indexes are useful to be implemented for
exploratory purposes, the standard way of assessing the resulted images is visually by scholars/experts in the
respective language(s).
Table 4. Dunn index.
Method Score Method Score
CVA 0.0522 PCA 0.3
Double Thresholding 0.13 PPCA 0.3
LDA 0.2 GPLVM 0.3
Ultraviolet illumination
with green color filter 0.21
PCA
unsupervised
(ImageJ)
0.331
DM 0.22
PCA
unsupervised
(Matlab)
0.38
GDA 0.235 Original Image 0.4194
Isomap 0.25 TSNE2 0.6614
Landmark Isomap 0.283 HLLE 1.61
NCA 0.29 NPE 3.85
Method Score Method Score
CVA 32.90 GPLVM 3.83
Double Thresholding 10.52 PCA 3.82
LDA 7.65 Isomap 3.18
DM 6.45 PCA unsupervised
(Matlab) 2.94
Ultraviolet illumination
with green color filter 6.30 Original page 2.46
NCA 4.78 PCA unsupervised
(ImageJ) 2.26
GDA 4.39 TSNE2 0.9963
Landmark Isomap 3.93 HLLE -0.69
PPCA 3.83 NPE -1.191
16
Figure 3. Numerical assessment of images based on Davies-Bouldin index.
Figure 4. Numerical assessment of images based on Dunn index.
Comparing the numerical assessments based on DB and Dunn indexes versus the visual assessments done by the
scholars, it is clear that there are a number of differences between the two assessments in the favor of the assessment
done by the scholars. The scholars did not find the DT method very useful and neither the ultraviolet illumination
with green color filter (i.e. CFUG), even though the numerical indexes indicated the two results as being of better
quality. This situation can be put on the fact that although the differences between the chosen points representing
the class underwriting and class parchment were significant in terms of the underwriting, overall the images were
not clear enough for the scholars: for example, for the image obtained with the DT method (Figure 2l) it can be

17
observed that the black pixels for the underwriting are not shaped into easy to read letters but are forming rather
some diffused letters. On another hand, the PCA unsupervised method with the two different implementations in
Matlab and ImageJ produced good images in terms of underwriting and which were assessed positively by the
scholars in the Table 1 and Table 2, even though the numerical indexes did not provide the same good results,
suggesting that while the differences between the chosen points representing the class underwriting and the class
parchment were not significant in terms of the underwriting, then there were not enough classification points being
used (i.e. 200) in order to obtain important numerical results with the respective indexes.
Confidence intervals could be added to the results shown in Figure 3 and Figure 4 by applying the dimensionality
reduction methods to a number of other palimpsest pages. However the visual assessment done by the scholars was
more than enough as the results were much superior in terms of quality of the assessment than the numerical
assessments with or without confidence intervals.
For the purposes of comparing the computational times and the image results, a CVA method is also implemented
in C programming language and using the GNU (GNU’s Not Unix) Scientific Library (GSL) and OpenCV computer
vision library. Therefore high performance software was developed by using the GNU GSL library, which provided
a number of functions, which drastically reduced the computational complexity and time for the CVA-GNU GSL
method. From the point of view of the computational time on a 3.5 GHz Intel Core i5 with 16 GB RAM memory,
running the CVA-Matlab function together with the producing (i.e. writing on the SSD hard drive) of the new color
images took 111 seconds. On the same computer the computational time for the CVA-GNU GSL took 80 seconds
which is 31 seconds shorter than the CVA-Maltab version but this does not represent a critical time difference.
However this reduction of the computational time with CVA-GNU GSL can be extended by using a computing
programming library such as OpenMP43
(OPEN MultiProcessing) which may speedup further the CVA-GNU GSL
software by parallelizing the software code.
In Figure 5, it can be noted that because of the different eigenvectors calculated by Matlab with the eig function
and the GNU GSL with the gsl_eigen_gensymmv function, which differences consisted for example of different
signs for the significant eigenvectors (i.e. corresponding eigenvalues higher than zero), then the images produced by
the two pieces of software were different but of comparable quality: Figure 5a produced by the CVA-Matlab versus
Figure 5b and Figure 5c produced by CVA-GNU GSL. Moreover, by inverting the first two channels of the color
image obtained by the CVA-GNU GSL method (Figure 5b) then almost a similar result was obtained in Figure 5c as
the one shown in Figure 5a with CVA-Matlab. The majority of scholars (i.e. three out of five) considered the CVA-
GNU GSL result (Figure 5b) being better in terms of underwriting than the CVA-Matlab (Figure 5a) but however
one scholar considered all the three results being of similar high quality.
a) CVA-Matlab b) CVA-GNU GSL
43 http://www.openmp.org
18
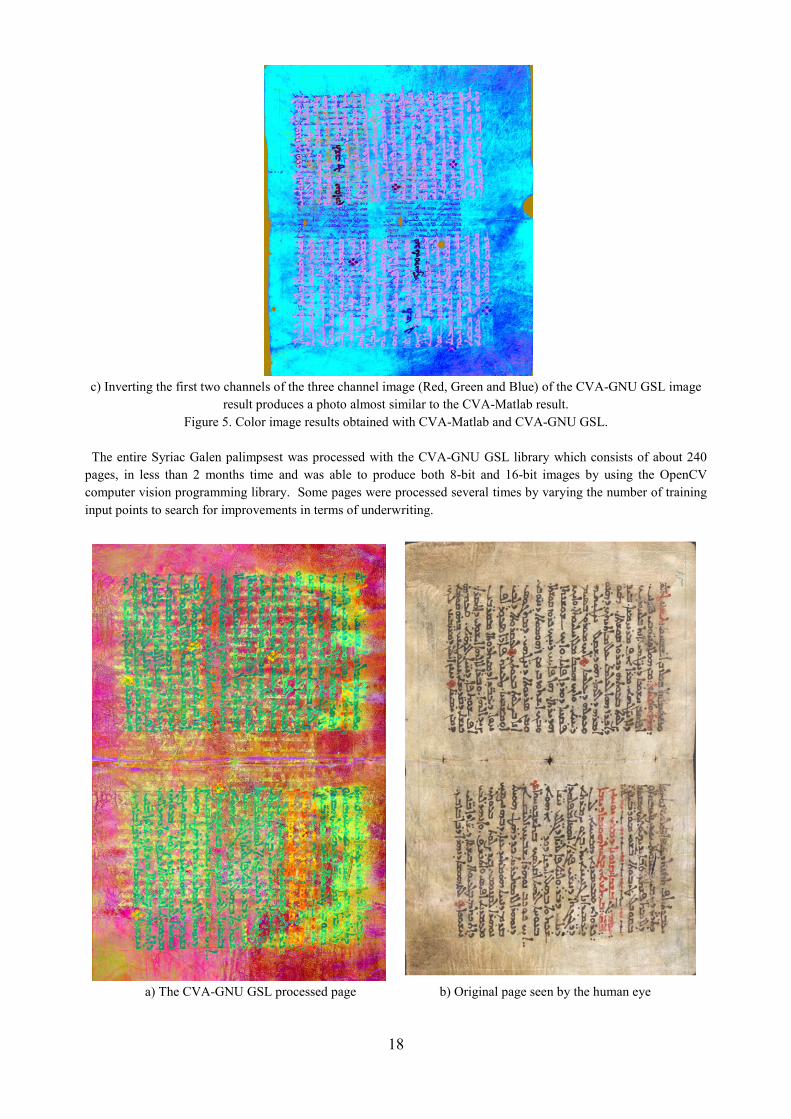
c) Inverting the first two channels of the three channel image (Red, Green and Blue) of the CVA-GNU GSL image
result produces a photo almost similar to the CVA-Matlab result.
Figure 5. Color image results obtained with CVA-Matlab and CVA-GNU GSL.
The entire Syriac Galen palimpsest was processed with the CVA-GNU GSL library which consists of about 240
pages, in less than 2 months time and was able to produce both 8-bit and 16-bit images by using the OpenCV
computer vision programming library. Some pages were processed several times by varying the number of training
input points to search for improvements in terms of underwriting.
a) The CVA-GNU GSL processed page b) Original page seen by the human eye

19
c) Ultraviolet illumination with green color filter
Figure 6. Comparison for folio 040v-045r between the CVA-GNU GSL processed page and the multispectral and
the original page seen by the human eye.
Figure 6 shows another folio of the palimpsest processed with the CVA-GNU GSL software library and in
comparison with the original page seen by the human eye (i.e. folio 040v-045r), result which shows how the
underwriting is revealed to the scholars after the folio was multispectral acquired and then the CVA-GNU GSL
method was applied. It can be seen clearly in Figure 6 that there is no underwriting in the original page seen by the
human eye, while in the multispectral image acquired with ultraviolet illumination with the green color filter the
underwriting starts to be revealed, and finally, in the image result obtained with the CVA-GNU GSL the
underwriting becomes quite clear all over the respective page.
The study carried out on the Galen palimpsest identified a smaller set of dimensionality reduction methods which
provided better image results than the rest of the other methods. From this smaller set of methods, based on the
visual and the numerical evaluation of the produced images, the CVA method produced the best result. Therefore
we wanted to test the CVA on a second manuscript written in Latin language and entitled John Rylands Library,
University of Manchester, Latin MS 18. The authorship and provenance are currently unknown so hence the high
interest in identifying the respective manuscript. The manuscript does not have any underwriting therefore it is not a
palimpsest but however some of the text has been almost deleted because of passing of time and water.
a) Section obtained with CVA-Matlab for a grayscale image.
20
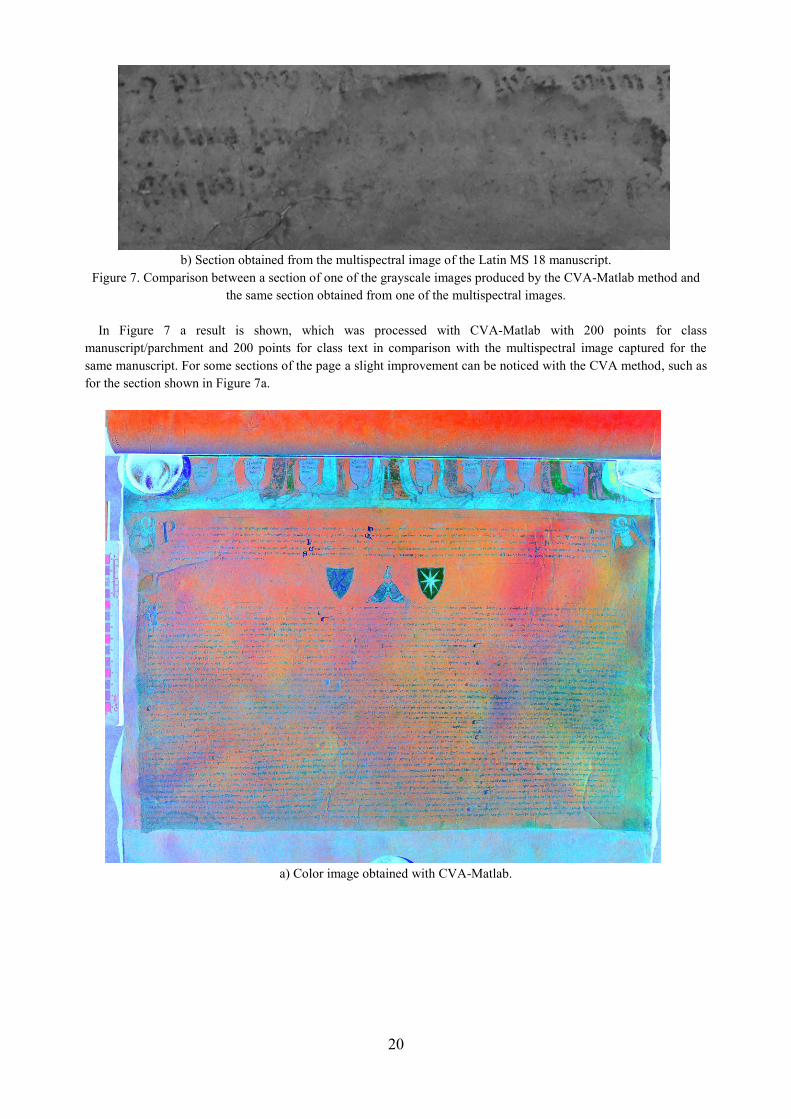
b) Section obtained from the multispectral image of the Latin MS 18 manuscript.
Figure 7. Comparison between a section of one of the grayscale images produced by the CVA-Matlab method and
the same section obtained from one of the multispectral images.
In Figure 7 a result is shown, which was processed with CVA-Matlab with 200 points for class
manuscript/parchment and 200 points for class text in comparison with the multispectral image captured for the
same manuscript. For some sections of the page a slight improvement can be noticed with the CVA method, such as
for the section shown in Figure 7a.
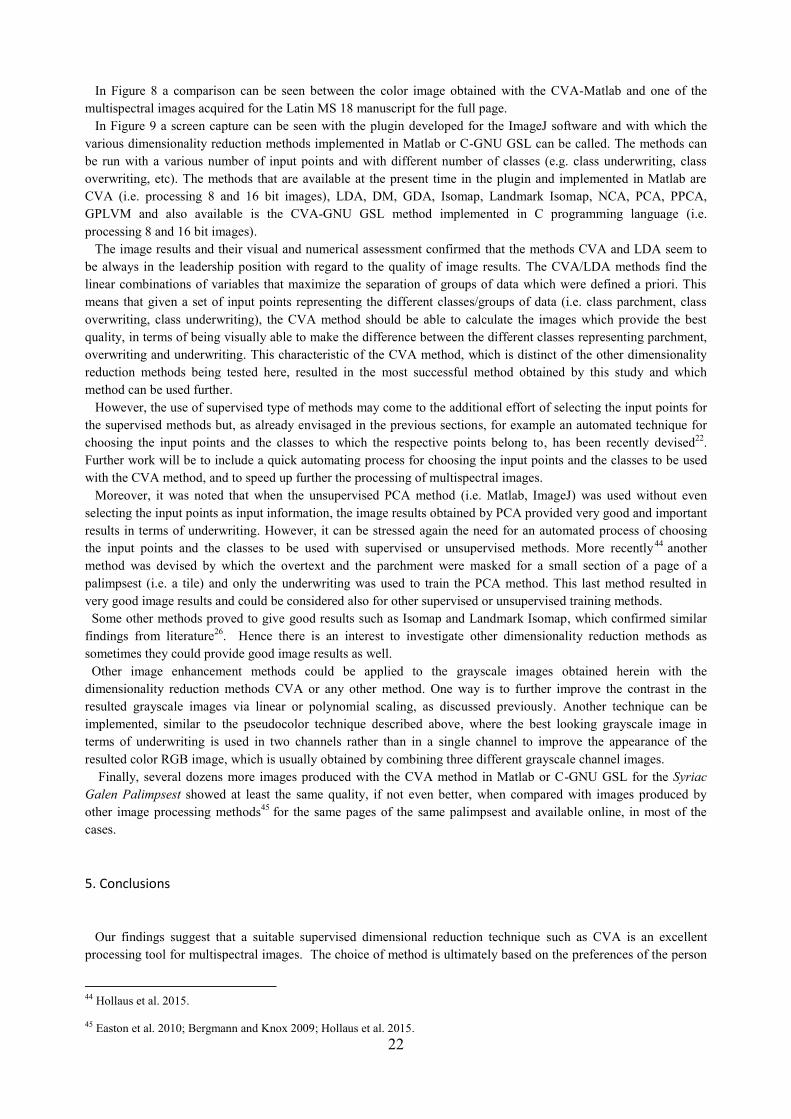
a) Color image obtained with CVA-Matlab.

21
b) Multispectral image acquired for the Latin MS 18 manuscript.
Figure 8. Comparison between color image obtained with the CVA-Matlab and one of the multispectral images
acquired for the Latin MS 18 manuscript.
Figure 9. Screen capture with the plugin developed for the ImageJ software with which the various dimensionality
reduction methods implemented in Matlab or C-GNU GSL can be called for the purposes of image processing.
22
In Figure 8 a comparison can be seen between the color image obtained with the CVA-Matlab and one of the
multispectral images acquired for the Latin MS 18 manuscript for the full page.
In Figure 9 a screen capture can be seen with the plugin developed for the ImageJ software and with which the
various dimensionality reduction methods implemented in Matlab or C-GNU GSL can be called. The methods can
be run with a various number of input points and with different number of classes (e.g. class underwriting, class
overwriting, etc). The methods that are available at the present time in the plugin and implemented in Matlab are
CVA (i.e. processing 8 and 16 bit images), LDA, DM, GDA, Isomap, Landmark Isomap, NCA, PCA, PPCA,
GPLVM and also available is the CVA-GNU GSL method implemented in C programming language (i.e.
processing 8 and 16 bit images).
The image results and their visual and numerical assessment confirmed that the methods CVA and LDA seem to
be always in the leadership position with regard to the quality of image results. The CVA/LDA methods find the
linear combinations of variables that maximize the separation of groups of data which were defined a priori. This
means that given a set of input points representing the different classes/groups of data (i.e. class parchment, class
overwriting, class underwriting), the CVA method should be able to calculate the images which provide the best
quality, in terms of being visually able to make the difference between the different classes representing parchment,
overwriting and underwriting. This characteristic of the CVA method, which is distinct of the other dimensionality
reduction methods being tested here, resulted in the most successful method obtained by this study and which
method can be used further.
However, the use of supervised type of methods may come to the additional effort of selecting the input points for
the supervised methods but, as already envisaged in the previous sections, for example an automated technique for
choosing the input points and the classes to which the respective points belong to, has been recently devised22
.
Further work will be to include a quick automating process for choosing the input points and the classes to be used
with the CVA method, and to speed up further the processing of multispectral images.
Moreover, it was noted that when the unsupervised PCA method (i.e. Matlab, ImageJ) was used without even
selecting the input points as input information, the image results obtained by PCA provided very good and important
results in terms of underwriting. However, it can be stressed again the need for an automated process of choosing
the input points and the classes to be used with supervised or unsupervised methods. More recently44
another
method was devised by which the overtext and the parchment were masked for a small section of a page of a
palimpsest (i.e. a tile) and only the underwriting was used to train the PCA method. This last method resulted in
very good image results and could be considered also for other supervised or unsupervised training methods.
Some other methods proved to give good results such as Isomap and Landmark Isomap, which confirmed similar
findings from literature26
. Hence there is an interest to investigate other dimensionality reduction methods as
sometimes they could provide good image results as well.
Other image enhancement methods could be applied to the grayscale images obtained herein with the
dimensionality reduction methods CVA or any other method. One way is to further improve the contrast in the
resulted grayscale images via linear or polynomial scaling, as discussed previously. Another technique can be
implemented, similar to the pseudocolor technique described above, where the best looking grayscale image in
terms of underwriting is used in two channels rather than in a single channel to improve the appearance of the
resulted color RGB image, which is usually obtained by combining three different grayscale channel images.
Finally, several dozens more images produced with the CVA method in Matlab or C-GNU GSL for the Syriac
Galen Palimpsest showed at least the same quality, if not even better, when compared with images produced by
other image processing methods45
for the same pages of the same palimpsest and available online, in most of the
cases.
5. Conclusions
Our findings suggest that a suitable supervised dimensional reduction technique such as CVA is an excellent
processing tool for multispectral images. The choice of method is ultimately based on the preferences of the person
44 Hollaus et al. 2015.
45 Easton et al. 2010; Bergmann and Knox 2009; Hollaus et al. 2015.

23
trying to read the manuscript, the precise makeup of the original document and obviously the quality of the images
produced by the respective dimensionality reduction method. In addition to these, easy access to an appropriate
toolset software was clearly highly desirable so that to provide the support for quick processing of the multispectral
images. The use of an existent software for image processing, ImageJ software, and the addition of the extra
functionalities in course of this work to the respective software provided the support for fast and remarkably good
processing of the multispectral images of the Galen palimpsest, of the second unidentified Latin manuscript and a
number of other manuscripts.
Further work will consist of applying these dimensionality techniques and the software developed to enable the
recovery of the undertext or hard-to-read texts in various other palimpsests and ancient manuscripts.
Acknowledgment The authors would like to thank the Arts and Humanities Research Council, United Kingdom, for supporting this
work (Research Grant AH/M005704/1 - The Syriac Galen Palimpsest: Galen’s On Simple Drugs and the Recovery
of Lost Texts through Sophisticated Imaging Techniques). The authors would like to thank to Dr William Sellers,
Dr. Natalia Smelova, Dr Siam Bhayro, Dr Kamran Karimullah, Dr Grigory Kessel, Miss Elaine Van Dalen and Dr
Irene O’Daly in supporting this paper.
References
Alexopoulou, A., Kaminari, A. (2014), ‘The Evolution of Imaging Techniques in the Study of Manuscripts’,
Manuscript Cultures, 7.
Arsene, C.T.C., Lisboa, P.J.G., Borrachi, P., Biganzoli, E. and Aung, M.S.H., (2006), ‘Bayesian Neural Networks
for Competing Risks with Covariates’, The Third International Conference in Advances in Medical, Signal and
Information Processing, MEDSIP 2006, IET.
Arsene, C.T.C., Lisboa, P.J.C., (2007), ‘Artificial neural networks used in the survival analysis of breast cancer
patients: a node negative study’, In Perspectives in Outcome Prediction in Cancer, Amsterdam: Elsevier
Science Publ, Editors: A.F.G. Taktak and A.C. Fisher.
Arsene, C.T.C., P.J. Lisboa, (2011), ‘PLANN-CR-ARD model predictions and Non-parametric estimates with
Confidence Intervals’, Proceedings of the International Joint Conference on Neural Networks (IJCNN), San
Jose, California.
Arsene,C.T.C., P.Lisboa, E. Biganzoli, (2011), ‘Model Selection with PLANN-CR-ARD’, J. Cabestany, I. Rojas,
and G. Joya (Eds.): IWANN 2011, Part II, Lecture Notes in Computer Science (LNCS), 6692:210–219,
Springer-Verlag Berlin Heidelberg.
Baronti, S., Casini, A., Lotti, F., Porcinai, S. (1997), ‘Principal component analysis of visible and near-infrared
multispectral images of works of art’, Chemometrics and Intelligent Laboratory Systems, vol. 39(1), 103-114.
Bergmann, U., Knox, K.T. (2009), ‘Pseudocolor enhanced x-ray fluorescence of the Archimedes Palimpsest’, Proc.
SPIE, v.7247-02.
Bhayro, S., Hawley, R., Kessel, G., Pormann, P. (2013), ‘The Syriac Galen palimpsest: progress, prospects and
problems’, J Semitic Studies, 58(1), 131-148.
Bhayro, S., Pormann, P.E., Sellers, W.J. (2013), ‘Imaging the Syriac Galen Palimpsest: preliminary analysis and
future prospects’, Semitica et Classica, vol. 6, 297-300.
Bohling, G. (2010), ‘Dimension reduction and cluster analysis’, Report, EECS 833, The University of Kansas, 6
March.
Bouldin, D.L., Donald W. (1979), ‘A Cluster Separation Measure’, IEEE Transactions on Pattern Analysis and
Machine Intelligence, PAMI-1 (2): 224–227.

24
Bunte, K, Haase, S., Biehl, M., Villmann, T. (2012), ‘Stochastic neighbour embedding (SNE) for dimension
reduction and visualization using arbitrary divergences’, Neurocomputing, 90(1), 23-45.
Camba, A., Gau M., Hollaus, F., Fiel, S., Sablatnig, R. (2014), ‘Multispectral Imaging, Image Enhancment, and
Automated Writer Identification in Historical Manuscripts’, Manuscript Cultures, 7.
Chang, C. (2013), Hyperspectral data processing: algorithm design and analysis, Wiley.
Church, S. (2015), Image processing and reflectance recovery of carbonised papyri from multispectral images,
MPhys report, School of Physic and Astronomy, University of Manchester.
Doi, K. (2007), ‘Computer-aided diagnosis in medical imaging: Historical review, current status and future
potential’, Computerized Medical Imaging and Graphics, 25(4-5), 198-211.
Dunn, J. C. (1973), ‘A Fuzzy Relative of the ISODATA Process and Its Use in Detecting Compact Well-Separated
Clusters’, Journal of Cybernetics 3 (3): 32– 57.
Easton, R.L., Christens-Barry, W.A., Knox, K.T. (2011), ‘Spectral Image Processing and Analysis of the
Archimedes Palimpsest’, 19th
European Signal Processing Conference (EUSIPCO 2011).
Easton, R.L., Jr., Noel, W.G. (2010), ‘Infinite Possibilities: Ten years of study of the Archimedes Palimpsest’, Proc.
Am. Philosophical Soc., v.154, 50-76.
Easton, R., Kelbe, D. (2014), ‘Statistical Processing of Spectral Imagery to Recover Writings from Erased or
Damaged Manuscripts’, Manuscript Cultures, 7.
Easton, R.L. Jr., Knox, K.T., Christens-Barry, W.A., Boydston, K., Toth, M.B., Emery., D., Noel, W.G. (2010),
‘Standardized system for multispectral imaging of palimpsests’, Proc. SPIE, 7531-12.
Egmont-Petersen, M., de Ridder, D., Handels, H., (2002), ‘Image processing with neural networks-a review’,
Pattern Recognition, 35(10), 2279-2301.
Fish D. A., Brinicombe A. M., Pike E. R., and Walker J. G., (1995), ‘Blind deconvolution by means of the
Richardson-Lucy algorithm’, Journal of the Optical Society of America A, 12 (1): 58–65.
Freeden, W., Nashed, M.Z. (2010), Handbook of Geomathematics, Springer.
Franti, P., Rezaei, M., Zhao, Q. (2014), ‘Centroid index: cluster level similarity measure’, Pattern Recognition, 47,
3034-3045.
Gepshtein, S., Keller, Y. (2013), ‘Image completion by diffusion maps and spectral relaxation’, IEEE Transactions
on Image Processing, 2983-2994.
Glaser, L, Deckers, D., (2014), ‘The basics of fast-scanning XRF element mapping for iron-gall ink palimpsests’,
Manuscript Cultures, 7, 104-112.
Goldberger, J., Roweis, S., Hinton, G., Salakhutdinov, R. (2005), ‘Neighbourhood Component Analysis’, 19TH
Annual Conference on Neural Information Processing Systems, NIPS.
Graves, A., Liwicki, M., Fernandez, S., Bertolami, R., Bunke, H., Schmidhuber, J. (2009), ‘A novel connectionist
system for improved unconstrained handwriting’, IEEE Transactions on Pattern Analysis and Machine
Intelligence, 31 (5).
Hashimoto, N., Murakami, Y., Bautista, P.A., Yamaguchi, M., Obi, T., Ohyama, N., Uto, K., Kosugi, Y. (2011),
‘Multispectral image enhancement for effective visualization’, Optics Express, vol. 19(10), 9315-9329.
Hollaus, F., Gau, M., Sablatnig, R. (2012), ‘Multispectral Image Acquisition of Ancient Manuscripts’, Progress in
Cultural Heritage Preservation, Lecture Notes in Computer Science, EuroMed, 30-39.
Hollaus, F., Gau, M., Sablatnig, R. (2013), ‘Enhancement of multispectral images of degraded documents by
employing spatial information’, 12th
International Conference on Document Analysis and Recognition.
25
Hollaus, F., Gau, M., Sablatnig, R., Christens-Barry, W.A., Miklas, H. (2015), ‘Readability enhancement and
palimpsest decipherment of historical manuscripts’, In “Codicology and Palaeography in the Digital Age 3”,
Editors: Duntze, O., Schaban, T., Vogeler, G..
Imani, M., Ghassemian, H. (2014), ‘Band clustering-based feature extraction for classification of hyperspectral
images using limited training samples’, IEEE Geoscience and remote sensing letters, vol. 11, no. 8.
James, M.R. (1921), A Descriptive Catalogue of the Latin Manuscripts in the John Rylands Library at Manchester
(Manchester, 1921), reprinted with an introduction and additional notes and corrections by F. Taylor
(München, 1980).
Janke, A, MacDonald, C. (2014), ‘Multispectral Imaging of the San Lorenzo Palimpsest (Florence Archivio del
Capitolo di San Lorenzo, Ms. 2211)’, Manuscript Cultures, 7.
Journaux, L., Tizon, X., Foucherot, I., Gouton, P (2006), ‘Dimensionality reduction techniques: An operational
comparison on multispectral satellite images using unsupervised clustering’, IEEE 7th
Nordic Signal
Processing Symposium (NORSIG), Reykjavik, Iceland, June 7-9, 242-245.
Journaux, L., Foucherot, I., Gouton, P. (2008), ‘Multispectral satellite images processing through dimensionality
reduction’, Signal Processing for Image Enhancement and Multimedia Processing, Multimedia Systems and
Applications Series, vol. 31, 59-66.
Khurshid. A. (1996), ‘Hunain bin Ishaq on Ophthalmic Surgery’, Bulletin of the Indian Institute of History of
Medicine, 26, 69–74.
Kwon, H., Hu, X., Theiler, J., Zare, A., Gurram, P. (2013), ‘Algorithms for Multispectral and Hyperspectral Image
Analysis’, Journal of Electrical and Computer Engineering, vol. 2013 (908906).
Lisboa, PJL, Etchells, T., Jarman, I, Arsene, CTC, Aung, M.S.H. Eleuteri, A. Taktak, A.F.G. Ambrogi, F. Boracchi,
P. Biganzoli, E. (2009), ‘Partial Logistic Artificial Neural Network for Competing Risks Regularized With
Automatic Relevance Determination’, IEEE Transactions on Neural Networks, vol 20(9), 1403-1416.
Lu, S, Zou, L., Shen, X., Wu, W., Zhang, W. (2011), ‘Multi-spectral remote sensing image enhancement method
based on PCA and IHS transformations’, Journal of Zhejiang University-SCIENCE A (Applied Physics &
Engineering), 12(6), 453-460.
Manning, P.L., Edwards, N.P., Wogelius, R.A, Bergmann, U., Barden, H.E., Larson, P.L., Schwarz-Wings, D.,
Egerton, V.M., Sokaras, D., Mori, R.A., Sellers, W.I., (2013), ‘Synchrotron-based chemical imaging reveals
plumage patterns in a 150 million year old early bird’, Journal of Analytical Atomic Spectrometry, 28, 1024-
1030.:
McCollum, A.J., Clocksin, W.F. (2007), ‘Multidimensional histogram equalization and modification’, 14th
International Conference on Image Analysis and Processing – ICIAP 2007, 659-664.
Mitsui, M., Murakami, Y., Obi, T., Yamaguchi, M., Ohyama, N. (2005), ‘Color enhancement in multispectral image
using the Karhunen-Loeve transform’, Optical review, vol. 12(2), 69-75.
Mlsna, P.A., Rodriguez, J.J. (1995), ‘A multivariate contrast enhancement technique for multispectral images’,
IEEE Transactions on Geoscience and Remote Sensing, vol. 33(1), 212-216.
Mocella, V., Brun, E., Ferrero, C., Delattre, D. (2015), ‘Revealing Letters in Rolled Herculaneum Papyri by X-Ray
Phase-Contrast Imaging’, Nature Communications, 6.
Netz, R., Noel, W., Wilson, N., Tchernetska, N. (2011), The Archimedes Palimpsest, Cambridge University Press.
Pormann, P.E. (2015), ‘Interdisciplinary: Inside Manchester’s ‘arts lab’’, Nature, 525 (7569), 318-319.
Rabin, I., Hahn, O., Geissbuhler, M. (2014), ‘Combining Codicology and X-Ray Spectrometry to Unveil the History
of Production of Codex Germanicus 6’, SUB Hamburg, Manuscript Cultures, 7.
Ricotta, C., Avena, G.C. (1999), ‘The influence of principal component analysis on the spatial structure of a
multispectral dataset’, Int. J. Remote Sensing, 20(17), 3367-3376.

26
Schneider C.A,. Rasband W.S., Eliceiri K.W. (2012), ‘NIH Image to ImageJ: 25 years of image analysis’, Nat
Methods, 9 (7), 671–675.
Shao, W., Elad, M., (2015), ‘Bi-l0-l2-Norm Regularization for Blind Motion Deblurring’, Journal of Visual
Communication and Image Representation, 33, 42-59.
Shanmugam, S., SrinivasaPerumal, P. (2014), ‘Spectral matching approaches in hyperspectral image processing’,
International Journal of Remote Sensing, vol.35, 24.
Stout, S., Kuester, F., Seracini, M. (2012), ‘XRAY fluorescence assisted, multispectral imaging of historic
drawings’, Denver X-ray Conference (DXC) on Applications of X-ray Analysis, vol.56.
Zhang, L., Du, B. (2012), ‘Recent advances in hyperspectral image processing’, Geo-spatial Information Science,
vol. 15-3, 143-156.
Zhenghao, S., He L., Suzuki, K., Nahamura, T., Itoh, H., (2009), ‘Survey on Neural Networks used for Medical
Image Processing’, Int J Comput Sci, 3(1):86-100.
van der Maaten, L.J.P., Hinton, G.E.. (2008), ‘Visualizing High-Dimensional Data Using t-SNE’, Journal of
Machine Learning Research, 9, 2579-2605.
Xu, R., du Plessis, L., Damelin, S., Sears, M., Wunsch, D. (2009), ‘Analysis of hyperspectral data with diffusion
maps and fuzzy ART’, International Joint Conference in Neural Networks (IJCNN).
Wang, L., Chunhui, Z. (2015), Hyperspectral Image Processing, Springer.
Walvoord, D.J., Easton, R.L.Jr. (2008), ‘Digital Transcription of Archimedes Palimpsest’, IEEE Signal Processing,
25, 100-104.
Related Documents