Journal of Chromatography B, 751 (2001) 247–256 www.elsevier.com / locate / chromb High-performance liquid chromatographic determination of oxolinic acid and flumequine in the live fish feed Artemia * Maria Touraki , Manolis Ladoukakis, Costas Prokopiou Laboratory of General Biology, Department of Genetics, Development and Molecular Biology, School of Biology, Faculty of Sciences, Aristotle University of Thessaloniki, 54006 Thessaloniki, Greece Received 27 April 2000; received in revised form 7 August 2000; accepted 16 August 2000 Abstract A high-performance liquid chromatography (HPLC) analytical method for the determination of oxolinic acid and flumequine in Artemia nauplii is described. The samples were extracted and cleaned up by a solid-phase extraction (SPE) procedure using SPE C cartridges. Oxolinic acid and flumequine were determined by reversed-phase HPLC using a mobile 18 phase of methanol–0.1 M phosphate buffer, pH 3 (45:55, v / v) and a UV detection wavelength of 254 nm. Calibration curves 2 were linear for oxolinic acid in the range of 0.2–50 mg/g (r 50.9998) and for flumequine in the range of 0.3–50 mg/g 2 ( r 50.9994). Mean recoveries amounted to 100.8% and 98.4% for oxolinic acid and flumequine, respectively. The quantification limit was 0.2 mg/g for oxolinic acid and 0.3 mg / g for flumequine. Quantitative data from an in vivo feeding study indicated excellent uptake of both drugs by Artemia nauplii. 2001 Elsevier Science B.V. All rights reserved. Keywords: Artemia; Oxolinic acid; Flumequine 1. Introduction using Artemia nauplii, which are their live feed, supplemented with the therapeutic agents. This meth- Quinolones are synthetic antibacterial agents, od proved quite effective in administering poten- which are especially active against Gram-negative tiated sulfonamides or tetracyclines to fish larvae bacteria and they are used both in human [1] and in with minimal leakage of the administered drugs to veterinary medicine [2–4]. Bacterial diseases of fish the environment [7–9]. pose a major problem in intensive culture systems Several methods have been reported for the de- and they have been treated with various chemo- termination of quinolones in samples of fish or fish therapeutics, such as potentiated sulfonamides and, feed, using either bioassays [10,11], high-perform- more recently, with the quinolones oxolinic acid and ance liquid chromatography (HPLC) [12–18], or gas flumequine [5,6]. An efficient method for the ad- chromatography [19]. These methods have been used ministration of therapeutics to fish larvae consists of for the determination of either oxolinic acid [12,14,17,18] or flumequine [1,3,4] or both [6,13,15,16] and they apply tissue specific liquid– *Corresponding author. Tel.: 130-31-998-292; fax: 130-31- liquid extraction [13,16] or solid-phase extraction 998-299. E-mail address: [email protected] (M. Touraki). (SPE) procedures [12,14,18]. Moreover, the methods 0378-4347 / 01 / $ – see front matter 2001 Elsevier Science B.V. All rights reserved. PII: S0378-4347(00)00474-6

Welcome message from author
This document is posted to help you gain knowledge. Please leave a comment to let me know what you think about it! Share it to your friends and learn new things together.
Transcript
Journal of Chromatography B, 751 (2001) 247–256www.elsevier.com/ locate /chromb
High-performance liquid chromatographic determination of oxolinicacid and flumequine in the live fish feed Artemia
*Maria Touraki , Manolis Ladoukakis, Costas ProkopiouLaboratory of General Biology, Department of Genetics, Development and Molecular Biology, School of Biology, Faculty of Sciences,
Aristotle University of Thessaloniki, 54006 Thessaloniki, Greece
Received 27 April 2000; received in revised form 7 August 2000; accepted 16 August 2000
Abstract
A high-performance liquid chromatography (HPLC) analytical method for the determination of oxolinic acid andflumequine in Artemia nauplii is described. The samples were extracted and cleaned up by a solid-phase extraction (SPE)procedure using SPE C cartridges. Oxolinic acid and flumequine were determined by reversed-phase HPLC using a mobile18
phase of methanol–0.1 M phosphate buffer, pH 3 (45:55, v /v) and a UV detection wavelength of 254 nm. Calibration curves2were linear for oxolinic acid in the range of 0.2–50 mg/g (r 50.9998) and for flumequine in the range of 0.3–50 mg/g
2(r 50.9994). Mean recoveries amounted to 100.8% and 98.4% for oxolinic acid and flumequine, respectively. Thequantification limit was 0.2 mg/g for oxolinic acid and 0.3 mg/g for flumequine. Quantitative data from an in vivo feedingstudy indicated excellent uptake of both drugs by Artemia nauplii. 2001 Elsevier Science B.V. All rights reserved.
Keywords: Artemia; Oxolinic acid; Flumequine
1. Introduction using Artemia nauplii, which are their live feed,supplemented with the therapeutic agents. This meth-
Quinolones are synthetic antibacterial agents, od proved quite effective in administering poten-which are especially active against Gram-negative tiated sulfonamides or tetracyclines to fish larvaebacteria and they are used both in human [1] and in with minimal leakage of the administered drugs toveterinary medicine [2–4]. Bacterial diseases of fish the environment [7–9].pose a major problem in intensive culture systems Several methods have been reported for the de-and they have been treated with various chemo- termination of quinolones in samples of fish or fishtherapeutics, such as potentiated sulfonamides and, feed, using either bioassays [10,11], high-perform-more recently, with the quinolones oxolinic acid and ance liquid chromatography (HPLC) [12–18], or gasflumequine [5,6]. An efficient method for the ad- chromatography [19]. These methods have been usedministration of therapeutics to fish larvae consists of for the determination of either oxolinic acid
[12,14,17,18] or flumequine [1,3,4] or both[6,13,15,16] and they apply tissue specific liquid–*Corresponding author. Tel.: 130-31-998-292; fax: 130-31-liquid extraction [13,16] or solid-phase extraction998-299.
E-mail address: [email protected] (M. Touraki). (SPE) procedures [12,14,18]. Moreover, the methods
0378-4347/01/$ – see front matter 2001 Elsevier Science B.V. All rights reserved.PI I : S0378-4347( 00 )00474-6
248 M. Touraki et al. / J. Chromatogr. B 751 (2001) 247 –256
previously described for the simultaneous determi- mm and a pore size of 0.45 mm). The SPE cartridgesnation of flumequine and oxolinic acid in fish tissues were C Extract-Clean from Alltech.18
[5,16], plasma [13] or silage [6] employed the use offluorescence detection [6,13,15,16], gradient elution 2.3. Standard solutions[13] or even column-switching [15]. In addition, theliquid–liquid extraction protocols that were used Stock solutions of oxolinic acid and of flumequine[6,13,15,16], produced poor results in the case of were prepared at a concentration of 1 mg/ml in 0.1Artemia samples. There is no analytical method M sodium hydroxide and they were stored at 48C inavailable for the determination of quinolones in the dark flasks. Under these storage conditions they werelive fish feed Artemia nauplii. In fact, the only stable for 1 month. Oxolinic acid was used as themethod that was previously used [11], was a non- internal standard for the determination of flumequinespecific radial-diffusion bioassay that employed no and vice versa. A range of working standard solu-extraction procedure and was of moderate sensitivity. tions was prepared daily by diluting stock solutions
In this paper, a simple, rapid and sensitive ana- with double distilled water.lytical method is described for the simultaneousdetermination of flumequine and oxolinic acid in 2.4. Analytical procedureArtemia nauplii, using SPE with reversed-phasechromatography and UV detection at 254 nm. Frozen samples of Artemia nauplii (0.5 g) were
homogenized in 3 ml 0.1 M sodium dihydrogenphos-phate buffer. The pH values of the homogenizationbuffer ranged from 2 to 9 and the recoveries of both
2. Experimentaloxolinic acid and flumequine were determined in allcases. The homogenate was centrifuged, the sedi-
2.1. Chemicals and reagentsments were reconstituted in another 3 ml of thehomogenization buffer and recentrifuged. The aque-
Methanol (Malinckrodt Baker, Deventer, Theous supernates were combined and used for liquid–
Netherlands) and n-hexane (Lab Scan, Dublin, Ire-liquid extraction or for SPE. Liquid–liquid extraction
land) were of HPLC grade. Sodium dihydrogenphos-was performed using 235 ml n-hexane and the
phate, sodium hydrogenphosphate and sodium hy-organic phase was discarded. For SPE, the SPE
droxide (E. Merck, Darmstadt, Germany) were ana-cartridges were preconditioned with 5 ml methanol,
lytical-grade reagents. Oxolinic acid and flumequine5 ml water and 5 ml 0.1 M phosphate buffer of the
were purchased from Sigma (St. Louis, MO, USA).same pH value as the homogenization buffer, eachtime. After application of the samples the cartridges
2.2. Apparatus were flushed with 235 ml n-hexane and they weredried out. Oxolinic acid and flumequine were eluted
The HPLC system consisted of a Marathon iso- with 5 or 10 ml of 0.1 M phosphate buffer, pHcratic pump (Rigas Labs., Thessaloniki, Greece), a 3–methanol (1:9, v /v). The methanolic phase wasRheodyne 7125 valve injector with a 100-ml loop, an evaporated under vacuum, the aquatic phase (1 ml)SSI Model 500 UV–Vis variable-wavelength detec- was collected and 100 ml were injected onto thetor and a Hewlett-Packard HP 3396 Series II inte- chromatographic column.grator. The analytical column was Hypersil octa-decylsilane ODS 15034.6 mm I.D., 5 mm particle 2.5. Operating conditionssize, protected with a guard column 1034.6 mmI.D., packed with the same material (Alltech, Deer- In a first set of experiments the mobile phasefield, IL, USA). Centrifugation was performed with consisted of 0.1 M phosphate buffer, pH 3–methanolan Eppendorff bench centrifuge. Solvents were fil- at 65:35, 60:40, 55:45, 50:50, 45:55 (v /v). Thetered with an Alltech HPLC solvent filtration system values of the capacity factor (k) were determined andusing Alltech membrane filters (of a diameter of 47 the presence of interferences was recorded in each
M. Touraki et al. / J. Chromatogr. B 751 (2001) 247 –256 249
case. The hold-up time (t ) was determined by quantitation (LOQ) was defined as the lowest con-0
injecting 50 ml of a NaNO solution (1 mg/ml) centration of a processed standard that presented a2
which is not retained on the column and is eluted in precision of 10–20% RSD [18].the void volume of mobile phase.
In the second set of experiments the mobile phase 2.7. Feeding experimentwas 0.1 M phosphate buffer–methanol (55:45, v /v),while pH values ranging from 2 to 6 were tested and Artemia cysts (GSL, EG grade) were incubated inthe capacity factors were determined for each pH artificial seawater (salinity 35 g/ l, pH 8.75), undervalue of the mobile phase. continuous aeration and illumination (2000 lux) as
The analytical cartridge was conditioned by flush- previously described [7–9]. After 24 h instar Iing with methanol–water (20:80, v /v) at 1 ml /min Artemia nauplii were collected and transferred infor 30 min and then the mobile phase was intro- clean artificial seawater at a density of 100 in-duced. The cartridge was at ambient temperature, the dividuals /ml. Then, two rations of an emulsionflow-rate of the mobile phase was 1 ml /min, the UV (Selco, INVE Aquaculture Artemia Systems, Bel-detector operated at a wavelength of 254 nm, peak gium) in which either oxolinic acid (5, 10 or 20%,areas were integrated and 50-ml samples were in- w/w) or flumequine (20, 30, or 40%, w/w) werejected onto the cartridge at intervals of 30 min. The administered to the nauplii. The first ration wasguard cartridge was changed after about 200 sample administered 2 h after the onset of incubation, theinjections. second ration 8 h after the onset of incubation and
the duration of the enrichment period was 24 h.2.6. Calculations and validation of the analytical Blank Artemia samples were fed with the emulsionmethod in which no drugs were added. The nauplii were
collected after 24 h of enrichment, they were thor-Calibration curves were prepared from Artemia oughly washed, and stored at 2408C until used for
nauplii samples (0.5 g) to which 100 ml of the further analysis.internal standard solution (100 mg/ml) and 50 ml ofthe appropriate drug standard solutions were addedto give a final concentration of 1.0, 5.0, 10.0, 20.0 3. Results and discussionand 50.0 mg/g of tissue. As mentioned earlier,oxolinic acid was used as the internal standard for 3.1. Liquid chromatography conditionsflumequine determination and vice versa.
The calibration curves were constructed and linear The effects of the percentage of methanol and ofregression equations were obtained by plotting the the pH of the buffer in the mobile phase on theratios of oxolinic acid or flumequine peak areas to capacity factor of oxolinic acid and flumequine arethe peak areas of the internal standard, against the shown in Table 1. Methanol levels in mobile phase,known concentrations of oxolinic acid or flumequine. that were higher than 50%, caused the drug peaks toThe extraction recovery was calculated as the per- coelute with endogenous compounds in Artemiacentage of the ratio of the peak area of the drugs in a nauplii tissues, while a methanol content lower thanprocessed spiked sample standard to the peak area of 45% resulted in long retention times that exceededthe same drug in a pure standards solution [18]. 20 min. As for the effect of the pH of the mobilePrecision was estimated by the relative standard phase, at pH 2 the baseline was receding even after 2deviation (RSD) of the measured concentrations of h of equilibration while the pH values of 4, 5 and 6replicate samples and accuracy was estimated as the gave rise to severe peak tailing.bias (found concentration2theoretical concentra- Previous investigators employed acidic mobiletion) / theoretical concentration3100 [20]. The limit phases, of a pH value 2 to 3, and a content of organicof detection (LOD) was determined as the lowest modifiers ranging from 10 to 30% for the simulta-analyte concentration detectable above the noise neous determination of oxolinic acid and flumequinelevel of the system, with S /N53. The limit of in fish tissues [5,15,16], fish silage [6] and in
250 M. Touraki et al. / J. Chromatogr. B 751 (2001) 247 –256
Table 1 3.2. Extraction conditions and recoveryEffect of (A) the percentage of methanol and (B) the pH of themobile phase on the capacity factor of oxolinic acid and
The recoveries of oxolinic acid and flumequineflumequinefrom spiked Artemia samples using different pH
Capacity factor (k) values of the phosphate buffer used for the extractionOxolinic acid Flumequine are shown in Table 2. Best recoveries were obtained
for both drugs at pH 3. Two extraction cycles each(A) Methanol (%)35 5.6560.1 15.7760.7 with 3 ml of phosphate buffer were required, as the40 4.6260.8 10.3660.3 second extraction step was found to improve re-45 2.6660.1 6.5760.1 covery by 8% for oxolinic acid and by 10% for50 1.6360.1 3.8760.1
flumequine. Multiple extraction cycles have also55 0.9460.3 3.0560.3been reported to improve recovery of oxolinic acid
(B) pH of mobile phase from fish tissue [14]. The extraction of the sample2 2.8460.2 6.6960.3 lipids with hexane appeared to be a crucial and pH3 2.6660.1 6.5760.1 related step in the extraction protocol. At high pH4 2.6460.2 6.5060.1
values, Artemia lipids, which are mainly carotenoids5 2.6060.2 6.4860.2and pigments, were not dissolved in hexane but6 1.9260.1 5.5760.1remained in the aquatic phase and coeluted with thedrugs from the SPE cartridge, resulting in adverseinterferences in the final chromatograms. An attempt
mussels [21]. However, the use of a higher content to remove these matrix constituents by filtrationof organic modifier in our studies is in accordance through a 0.2-mm syringe filter resulted in lowwith that reported recently either for the determi- extraction recoveries, suggesting possible interac-nation of flumequine [4] or of oxolinic acid [18]. tions between the matrix lipids and the drugs. At low
It appears that the problem of tailing peaks at pH pH values (pH,3) clogging of the SPE cartridgesvalues higher than 3 was also encountered in the was observed.analysis of oxolinic acid in fish tissues [14]. Peak In addition to SPE, liquid–liquid extraction wastailing and the presence of a shoulder is also evident also tested for its efficacy. Hexane was first addedin our chromatograms possibly due to column over- during the centrifuging of the homogenized tissueload. A change of the column resulted in the samples. To this end two extractions were performedimprovement of the peak shape of flumequine and during the two sequential centrifuging steps, eachonly a peak tailing remained. The use of tetrahydro- employing 3 ml of hexane, the aqueous phase wasfuran in the mobile phase also greatly improves the collected and the recovery was found to bepeak shape (data not shown) but it also results in the 32.168.1% (n54) for oxolinic acid and 56.163.4%coelution of oxolinic acid with matrix components. (n54) for flumequine. Then hexane was added in theIn our studies the best separation and peak shape in aqueous supernate that resulted from the centrifugingthe determination of oxolinic acid and flumequine in step, two extractions employing 5 ml hexane eachArtemia nauplii samples were obtained with the use were performed, and the recovery was 53.864.6%of the mobile phase methanol–0.1 M phosphate for oxolinic acid and 54.564.5% for flumequine.buffer (45:55, v /v) at pH 3 (Figs. 1 and 2, respec- Finally the extraction of lipids with hexane on thetively). Under these conditions the capacity factor for SPE cartridge was tested. The cartridge was equili-oxolinic acid was 2.6660.12, for flumequine brated, the sample was applied, then 235 ml hexane6.5760.07, while the asymmetry factors were 0.90 was added on the SPE cartridge and the drugs wereand 0.86 for oxolinic acid and flumequine, respec- eluted. This approach resulted in the highest re-tively. The retention times were 5.94 min for ox- coveries that amounted to 100.866.3% for oxolinicolinic acid and 12.4 min for flumequine, with a acid and to 98.965.3% for flumequine. It should alsohold-up time (t ) of 1.58 min, while no interferences be noted that the elution of the drugs from the SPE0
from the sample matrix were observed. cartridge with 10 ml of phosphate buffer, pH 3–
M. Touraki et al. / J. Chromatogr. B 751 (2001) 247 –256 251
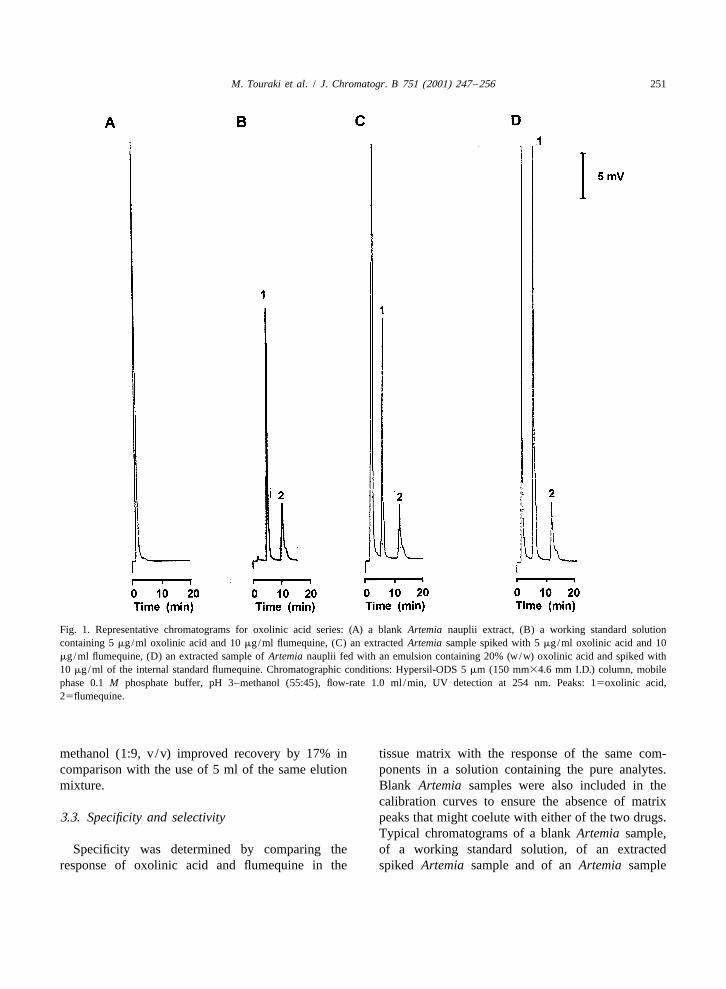
Fig. 1. Representative chromatograms for oxolinic acid series: (A) a blank Artemia nauplii extract, (B) a working standard solutioncontaining 5 mg/ml oxolinic acid and 10 mg/ml flumequine, (C) an extracted Artemia sample spiked with 5 mg/ml oxolinic acid and 10mg/ml flumequine, (D) an extracted sample of Artemia nauplii fed with an emulsion containing 20% (w/w) oxolinic acid and spiked with10 mg/ml of the internal standard flumequine. Chromatographic conditions: Hypersil-ODS 5 mm (150 mm34.6 mm I.D.) column, mobilephase 0.1 M phosphate buffer, pH 3–methanol (55:45), flow-rate 1.0 ml /min, UV detection at 254 nm. Peaks: 15oxolinic acid,25flumequine.
methanol (1:9, v /v) improved recovery by 17% in tissue matrix with the response of the same com-comparison with the use of 5 ml of the same elution ponents in a solution containing the pure analytes.mixture. Blank Artemia samples were also included in the
calibration curves to ensure the absence of matrix3.3. Specificity and selectivity peaks that might coelute with either of the two drugs.
Typical chromatograms of a blank Artemia sample,Specificity was determined by comparing the of a working standard solution, of an extracted
response of oxolinic acid and flumequine in the spiked Artemia sample and of an Artemia sample
252 M. Touraki et al. / J. Chromatogr. B 751 (2001) 247 –256
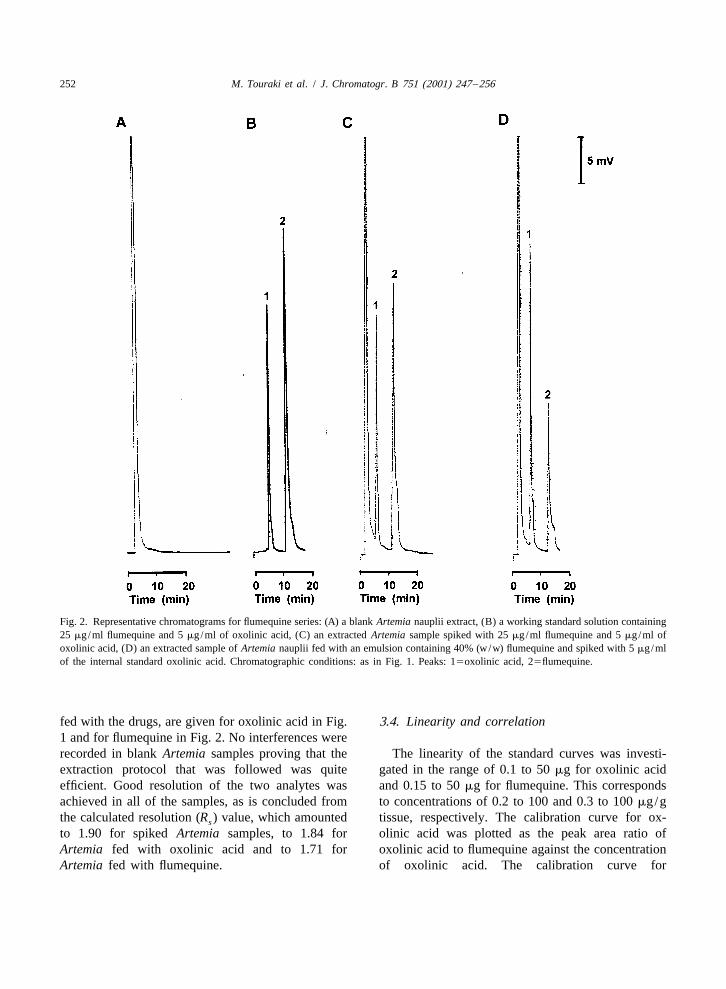
Fig. 2. Representative chromatograms for flumequine series: (A) a blank Artemia nauplii extract, (B) a working standard solution containing25 mg/ml flumequine and 5 mg/ml of oxolinic acid, (C) an extracted Artemia sample spiked with 25 mg/ml flumequine and 5 mg/ml ofoxolinic acid, (D) an extracted sample of Artemia nauplii fed with an emulsion containing 40% (w/w) flumequine and spiked with 5 mg/mlof the internal standard oxolinic acid. Chromatographic conditions: as in Fig. 1. Peaks: 15oxolinic acid, 25flumequine.
fed with the drugs, are given for oxolinic acid in Fig. 3.4. Linearity and correlation1 and for flumequine in Fig. 2. No interferences wererecorded in blank Artemia samples proving that the The linearity of the standard curves was investi-extraction protocol that was followed was quite gated in the range of 0.1 to 50 mg for oxolinic acidefficient. Good resolution of the two analytes was and 0.15 to 50 mg for flumequine. This correspondsachieved in all of the samples, as is concluded from to concentrations of 0.2 to 100 and 0.3 to 100 mg/gthe calculated resolution (R ) value, which amounted tissue, respectively. The calibration curve for ox-s
to 1.90 for spiked Artemia samples, to 1.84 for olinic acid was plotted as the peak area ratio ofArtemia fed with oxolinic acid and to 1.71 for oxolinic acid to flumequine against the concentrationArtemia fed with flumequine. of oxolinic acid. The calibration curve for

M. Touraki et al. / J. Chromatogr. B 751 (2001) 247 –256 253
Table 2aEffect of extraction buffer pH on the recovery of oxolinic acid and flumequine from spiked Artemia samples
pH of extraction buffer Recovery (%) (mean6SD)(0.1 M sodium dihydrogenphosphate)
Oxolinic acid Flumequine(n54) (n54)
2 29.960.2 58.960.23 100.866.3 98.965.34 83.260.6 64.560.15 77.060.1 66.164.66 71.660.1 70.369.87 47.962.6 57.761.98 44.962.2 70.861.39 29.560.4 65.760.1
a Artemia samples (0.5 g) were spiked with oxolinic acid and flumequine (each at a concentration of 10 mg/ml which corresponds to 20mg/g).
flumequine was plotted as the ratio of the peak area similar behavior of the two analytes in the course ofof flumequine to oxolinic acid against the concen- sample pretreatment.tration of flumequine. Equations of the standardcurves obtained by analyzing spiked samples were 3.5. Accuracy, precision and recoveryy50.00510.200x (r50.9999) for oxolinic acid andy520.00610.100x (r50.9997) for flumequine. The The determination of accuracy was based on thecorresponding equations for the standard curves recovery of known amounts of analyte spiked intoobtained by direct injection of the pure analytes were the sample matrix [20]. The acceptance criterion fory50.00410.196x (r50.9998) for oxolinic acid and this parameter is set at a value lower than 10% [18].y520.00410.104x (r50.9991) for flumequine. The From the accuracy data shown in Table 3, it isfact that there is good agreement in the slopes of the concluded that accuracy was good at all concen-two sets of standard curves for each drug suggests a trations tested, for both analytes.
Table 3Accuracy data obtained from Artemia samples spiked with oxolinic acid or flumequine from 0.2 to 50 mg/g
Nominal concentration Mean calculated concentration Accuracy(mg/g) (mg/g) (mean6SD) (%)
Oxolinic acid0.2 0.260.03 6.01.0 1.160.1 8.05.0 4.760.2 25.6
10.0 9.760.3 23.120.0 18.660.4 27.050.0 50.862.8 1.6
Flumequine0.3 0.360.04 3.31.0 1.060.04 0.85.0 4.860.1 3.6
10.0 9.960.4 0.620.0 19.060.5 5.050.0 46.360.9 7.4
254 M. Touraki et al. / J. Chromatogr. B 751 (2001) 247 –256
Table 4aPrecision data obtained from spiked Artemia samples
Oxolinic acid concentration (mg/g)
50 20 10 5 1.0 0.2
N 8 8 8 12 9 10Mean6SD (mg/g) 50.862.8 18.660.4 9.760.3 4.760.2 1.160.1 0.260.02Repeatability RSD (%) 3.7 2.0 2.9 4.0 4.6 4.8Reproducibility RSD (%) 5.6 1.9 3.4 4.3 10.4 13.4
Flumequine concentration (mg/g)
50 20 10 5 1.0 0.3
N 8 8 12 8 8 10Mean6SD (mg/g) 46.360.9 19.060.5 9.960.4 4.860.1 1.060.04 0.360.04Repeatability RSD (%) 1.7 3.2 1.7 3.1 3.9 4.7Reproducibility RSD (%) 1.9 2.9 3.9 2.7 3.9 13.6
a Repeatability RSD (%) corresponds to intra-day precision and reproducibility RSD (%) to inter-day precision of HPLC analysis. Nrepresents the number of analyses during the study of precision.
Within- and between-day precision data are given Mean recovery amounted to 100.866.3% (RSD5
in Table 4. Acceptable RSD values (lower than 10%) 4.9%) for oxolinic acid and to 98.965.4% (RSD5
were obtained for all concentrations and for both 3.9%) for flumequine.analytes, with the exception of the lowest concen-tration tested, where reproducibility appeared slightlyelevated amounting to 13.4% for oxolinic acid and to 3.6. Limits of detection and quantification13.6% for flumequine.
The analytical recovery data are shown in Table 5. The detection limit is defined as the lowestconcentration of the analyte, that produces a re-sponse detectable above the noise level of the
Table 5system, which typically is three times the noise levelRecovery rates of oxolinic acid and flumequine in spiked Artemia[20]. The LOD was calculated to be 0.012 mg/g forsamples (n56)oxolinic acid and 0.037 mg/g for flumequine. TheseOxolinic acid Recovery RSDvalues are in accordance with those reported whenconcentration (mean6SD) (%)
(mg/g) UV detection is employed [18], but higher than thevalues obtained using fluorescence detection [13].0.2 105.5613.6 12.9
The LOQ in Artemia samples was taken as the1.0 110.6611.6 10.45.0 93.164.1 4.3 lowest concentration of the analyte, which is mea-
10.0 96.863.8 3.9 sured with a defined precision and accuracy under20.0 99.861.5 1.5 the experimental conditions used. Precision was50.0 98.962.1 2.2
considered acceptable when its RSD value rangedfrom 10 to 20% [18]. The LOQ was determined toFlumequine
concentration be 0.2 mg/g for oxolinic acid and 0.3 mg/g for(mg/g) flumequine. The intra-assay (n510) and inter-assay
(n58) RSDs were 4.8 and 13.4% for oxolinic acid0.3 101.6610.9 10.7
and 4.7 and 13.6% for flumequine, respectively1.0 100.765.1 5.0(Table 4). As the inter-assay RSD was lower than5.0 96.861.7 1.8
10.0 102.062.4 2.3 15% for both analytes, the mean values of the20.0 94.662.6 2.8 analyte peak heights were significantly different (P,50.0 92.461.9 1.1 0.05) from the intercepts and they were greater than
M. Touraki et al. / J. Chromatogr. B 751 (2001) 247 –256 255
three standard deviations [21], these LOQs were of determination of the drugs in Artemia, that isaccepted. presented in this study. The flumequine levels in the
enriched Artemia nauplii were quite lower than those3.7. Animal study of oxolinic acid, although higher concentrations of
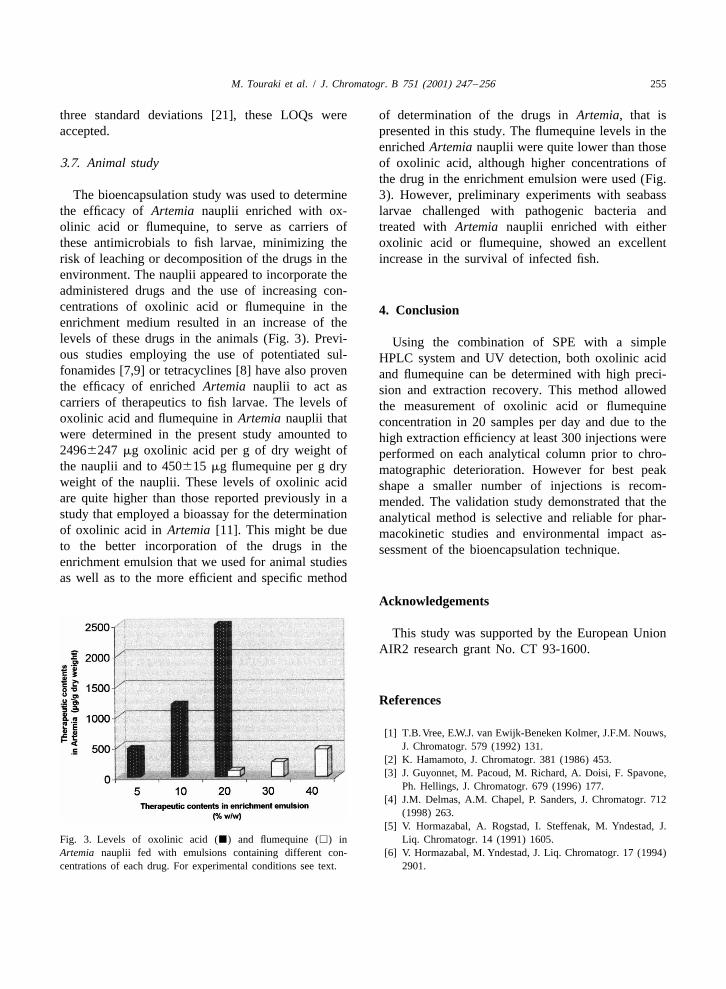
the drug in the enrichment emulsion were used (Fig.The bioencapsulation study was used to determine 3). However, preliminary experiments with seabass
the efficacy of Artemia nauplii enriched with ox- larvae challenged with pathogenic bacteria andolinic acid or flumequine, to serve as carriers of treated with Artemia nauplii enriched with eitherthese antimicrobials to fish larvae, minimizing the oxolinic acid or flumequine, showed an excellentrisk of leaching or decomposition of the drugs in the increase in the survival of infected fish.environment. The nauplii appeared to incorporate theadministered drugs and the use of increasing con-centrations of oxolinic acid or flumequine in the 4. Conclusionenrichment medium resulted in an increase of thelevels of these drugs in the animals (Fig. 3). Previ- Using the combination of SPE with a simpleous studies employing the use of potentiated sul- HPLC system and UV detection, both oxolinic acidfonamides [7,9] or tetracyclines [8] have also proven and flumequine can be determined with high preci-the efficacy of enriched Artemia nauplii to act as sion and extraction recovery. This method allowedcarriers of therapeutics to fish larvae. The levels of the measurement of oxolinic acid or flumequineoxolinic acid and flumequine in Artemia nauplii that concentration in 20 samples per day and due to thewere determined in the present study amounted to high extraction efficiency at least 300 injections were24966247 mg oxolinic acid per g of dry weight of performed on each analytical column prior to chro-the nauplii and to 450615 mg flumequine per g dry matographic deterioration. However for best peakweight of the nauplii. These levels of oxolinic acid shape a smaller number of injections is recom-are quite higher than those reported previously in a mended. The validation study demonstrated that thestudy that employed a bioassay for the determination analytical method is selective and reliable for phar-of oxolinic acid in Artemia [11]. This might be due macokinetic studies and environmental impact as-to the better incorporation of the drugs in the sessment of the bioencapsulation technique.enrichment emulsion that we used for animal studiesas well as to the more efficient and specific method
Acknowledgements
This study was supported by the European UnionAIR2 research grant No. CT 93-1600.
References
[1] T.B.Vree, E.W.J. van Ewijk-Beneken Kolmer, J.F.M. Nouws,J. Chromatogr. 579 (1992) 131.
[2] K. Hamamoto, J. Chromatogr. 381 (1986) 453.[3] J. Guyonnet, M. Pacoud, M. Richard, A. Doisi, F. Spavone,
Ph. Hellings, J. Chromatogr. 679 (1996) 177.[4] J.M. Delmas, A.M. Chapel, P. Sanders, J. Chromatogr. 712
(1998) 263.[5] V. Hormazabal, A. Rogstad, I. Steffenak, M. Yndestad, J.
Fig. 3. Levels of oxolinic acid (j) and flumequine (h) in Liq. Chromatogr. 14 (1991) 1605.Artemia nauplii fed with emulsions containing different con- [6] V. Hormazabal, M. Yndestad, J. Liq. Chromatogr. 17 (1994)centrations of each drug. For experimental conditions see text. 2901.
256 M. Touraki et al. / J. Chromatogr. B 751 (2001) 247 –256
[7] M. Touraki, S. Mourelatos, Gh. Karamanlidou, S. Kalait- [15] H.H. Thanh, A.T. Andresen, T. Agasøster, K.E. Rasmussen,zopoulou, C. Kastritsis, Aquacultural Eng. 15 (1996) 133. J. Chromatogr. 532 (1990) 363.
[8] M. Touraki, P. Rigas, P. Pergandas, C. Kastritsis, J. Chroma- [16] I. Steffenak, V. Hormazabal, M. Yndestad, J. Liq. Chroma-togr. 663 (1995) 167. togr. 14 (1991) 61.
[9] M. Touraki, I. Niopas, C. Kastritsis, Aquaculture 175 (1999) [17] R. Ueno, T. Aoki, J. Chromatogr. 682 (1996) 179.15. [18] S. Loussouarn, H. Pouliquen, F. Armand, J. Chromatogr. 698
[10] G.A. Baker, Aquaculture 127 (1994) 83. (1997) 251.[11] K. Duis, C. Hammer, M.C.M. Beveridge,V. Inglis, E. Braum, [19] A.P. Pfenning, R.K. Munns, S.B. Turnipseed, J.E. Roybal,
J. Fish Dis. 18 (1995) 229. D.G. Holland, A.R. Long, J. AOAC Int. 79 (1996) 1227.[12] S.O. Hustvedt, R. Salte, J. Chromatogr. 494 (1989) 335. [20] J.M. Green, Anal. Chem. 68 (1996) 305A.[13] O.B. Samuelsen, J. Chromatogr. 530 (1990) 452. [21] H. Pouliquen, D. Gouelo, M. Larhantec, N. Pilet, L. Pilault,
¨[14] H.V. Bjorklund, J. Chromatogr. 530 (1990) 75. J. Chromatogr. 702 (1997) 157.
Related Documents