Analytical Methods High performance liquid chromatographic determination of aflatoxins in chilli, peanut and rice using silica based monolithic column Wejdan Shakir Khayoon a , Bahruddin Saad a,⇑ , Tien Ping Lee a , Baharuddin Salleh b a School of Chemical Sciences, Universiti Sains Malaysia, 11800 Penang, Malaysia b School of Biological Sciences, Universiti Sains Malaysia, 11800 Penang, Malaysia article info Article history: Received 29 March 2011 Received in revised form 5 November 2011 Accepted 10 January 2012 Available online 28 January 2012 Keywords: Aflatoxins High performance liquid chromatography Monolithic column Foodstuffs Liquid chromatography–tandem mass spectrometry abstract A simple and rapid high performance liquid chromatographic with fluorescence detection method for the determination of the aflatoxin B 1 ,B 2 ,G 1 and G 2 in peanuts, rice and chilli was developed. The sample was extracted using acetonitrile:water (90:10, v/v%) and then purified by using ISOLUTE Ò multimode solid phase extraction. After the pre-column derivatisation, the analytes were separated within 3.7 min using Chromolith Ò performance RP-18e (100–4.6 mm) monolithic column. To assess the possible effects of endogenous components in the food items, matrix-matched calibration was used for the quantification and validation. The recoveries of aflatoxins that were spiked into food samples were 86.38–104.5% and RSDs were <4.4%. The method was applied to the determination of aflatoxins in peanut (9), rice (5) and chilli (10) samples. Liquid chromatography–tandem mass spectrometry analysis using triple quadru- ple analyser and operated in the multiple reaction monitoring modes on the contaminated samples was performed for confirmation. Ó 2012 Elsevier Ltd. All rights reserved. 1. Introduction Species of fungi such as Aspergillus (A) particularly A. flavus and A. parasiticus can grow on agricultural commodities especially in hot and humid regions and become potential target for the pro- duction of aflatoxins. Among the approximately 20 different types of aflatoxins, only the aflatoxins B 1 (AFB 1 ), B 2 (AFB 2 ), G 1 (AFG 1 ) and G 2 (AFG 2 ) are associated with acute liver damage and cirrho- sis (Fig 1). Aflatoxin M 1 (AFM 1 ) is a hydroxylated metabolite of AFB 1 which can be found in milk. However, the toxicity of AFM 1 is lower than AFB 1 and it was classified as hepatotoxic and carcin- ogenic (Han et al., 2010). Due to the teratogenic and mutagenic, carcinogenic, hepatotoxic effects of aflatoxins, the International Agency for Research on Cancer (IARC) have classified them under Group 1 as human carcinogen (IARC, 2002). Contamination of food such as rice, peanut and spices especially chilli by aflatoxins is widespread. Rice is one of the most widely con- sumed foods in the world. It is one of the least susceptible crops to mycotoxins contamination while chilli and peanut can be affected by aflatoxins during the pre- or post-harvest stage (Cho et al., 2008; O’Riordan & Wilkinson, 2008, 2009; Reiter, Vouk, Bhm, & Razzazi-Fazeli, 2010). The Commission Regulations (EU) has set 5.0 ng g 1 for AFB 1 and 10.0 ng g 1 for total aflatoxins in spices; 2.0 ng g 1 for AFB 1 and 4.0 ng g 1 for total aflatoxins for ground- nuts (peanut) and other oil seeds and processed products intended for direct human consumption. The limit was 5.0 ng g 1 and 10.0 ng g 1 for AFB 1 and total aflatoxins, respectively for nut and dried fruits to be subjected to sorting, or other physical treatment, before human consumption or use as an ingredient in foodstuffs (Commision Regulation, 2010). Several analytical methods have been described for the determination of aflatoxins in food; the main ones are enzyme linked immunosorbent assay (O’Riordan & Wilkinson, 2009), thin layer chromatography (Stroka, Otterdijk, & Anklam, 2000) high performance liquid chromatography (HPLC) (Herzallah, 2009; Khayoon, Saad, Salleh, et al., 2010; Khayoon, Saad, Yan, et al., 2010; Quinto, Spadaccino, Palermo, & Centonze, 2009), ultra-high performance liquid chromatography (UPLC) (Fu, Huang, & Min, 2008) and capillary electrophoresis (Peña, Alcaraz, Arce, Ríos, & Valcárcel, 2002). For the HPLC technique, fluorescence detection is useful due to its good sensitivity, while mass spec- trometry (MS) is excellent for confirmation (Frenich, Vidal, Romer- o-Gonzalez, & Aguilera-Luiz, 2009). To date, reversed-phase HPLC using C18 particle column is the most commonly used method (Herzallah, 2009; Khayoon et al., 2010; Khayoon, Saad, Yan, et al., 2010; Quinto et al., 2009). However, the use of monolithic columns is steadily increasing. Monolithic columns, first described by Tanaka and co-workers (Minakuchi, Soga, Ishizuka, & Tanaka, 1996), are prepared as a single piece made of porous cross-linked polymer or porous silica in different formats (e.g., porous rods, thin membranes or disks). The columns are composed of a continuous porous rod that provide 0308-8146/$ - see front matter Ó 2012 Elsevier Ltd. All rights reserved. doi:10.1016/j.foodchem.2012.01.010 ⇑ Corresponding author. Tel.: +60 4 6534047; fax: +60 4 6574857. E-mail address: [email protected] (B. Saad). Food Chemistry 133 (2012) 489–496 Contents lists available at SciVerse ScienceDirect Food Chemistry journal homepage: www.elsevier.com/locate/foodchem

Welcome message from author
This document is posted to help you gain knowledge. Please leave a comment to let me know what you think about it! Share it to your friends and learn new things together.
Transcript
Food Chemistry 133 (2012) 489–496
Contents lists available at SciVerse ScienceDirect
Food Chemistry
journal homepage: www.elsevier .com/locate / foodchem
Analytical Methods
High performance liquid chromatographic determination of aflatoxins in chilli,peanut and rice using silica based monolithic column
Wejdan Shakir Khayoon a, Bahruddin Saad a,⇑, Tien Ping Lee a, Baharuddin Salleh b
a School of Chemical Sciences, Universiti Sains Malaysia, 11800 Penang, Malaysiab School of Biological Sciences, Universiti Sains Malaysia, 11800 Penang, Malaysia
a r t i c l e i n f o a b s t r a c t
Article history:Received 29 March 2011Received in revised form 5 November 2011Accepted 10 January 2012Available online 28 January 2012
Keywords:AflatoxinsHigh performance liquid chromatographyMonolithic columnFoodstuffsLiquid chromatography–tandem massspectrometry
0308-8146/$ - see front matter � 2012 Elsevier Ltd. Adoi:10.1016/j.foodchem.2012.01.010
⇑ Corresponding author. Tel.: +60 4 6534047; fax: +E-mail address: [email protected] (B. Saad).
A simple and rapid high performance liquid chromatographic with fluorescence detection method for thedetermination of the aflatoxin B1, B2, G1 and G2 in peanuts, rice and chilli was developed. The sample wasextracted using acetonitrile:water (90:10, v/v%) and then purified by using ISOLUTE� multimode solidphase extraction. After the pre-column derivatisation, the analytes were separated within 3.7 min usingChromolith� performance RP-18e (100–4.6 mm) monolithic column. To assess the possible effects ofendogenous components in the food items, matrix-matched calibration was used for the quantificationand validation. The recoveries of aflatoxins that were spiked into food samples were 86.38–104.5% andRSDs were <4.4%. The method was applied to the determination of aflatoxins in peanut (9), rice (5)and chilli (10) samples. Liquid chromatography–tandem mass spectrometry analysis using triple quadru-ple analyser and operated in the multiple reaction monitoring modes on the contaminated samples wasperformed for confirmation.
� 2012 Elsevier Ltd. All rights reserved.
1. Introduction
Species of fungi such as Aspergillus (A) particularly A. flavus andA. parasiticus can grow on agricultural commodities especially inhot and humid regions and become potential target for the pro-duction of aflatoxins. Among the approximately 20 different typesof aflatoxins, only the aflatoxins B1 (AFB1), B2 (AFB2), G1 (AFG1)and G2 (AFG2) are associated with acute liver damage and cirrho-sis (Fig 1). Aflatoxin M1 (AFM1) is a hydroxylated metabolite ofAFB1which can be found in milk. However, the toxicity of AFM1
is lower than AFB1 and it was classified as hepatotoxic and carcin-ogenic (Han et al., 2010). Due to the teratogenic and mutagenic,carcinogenic, hepatotoxic effects of aflatoxins, the InternationalAgency for Research on Cancer (IARC) have classified them underGroup 1 as human carcinogen (IARC, 2002).
Contamination of food such as rice, peanut and spices especiallychilli by aflatoxins is widespread. Rice is one of the most widely con-sumed foods in the world. It is one of the least susceptible crops tomycotoxins contamination while chilli and peanut can be affectedby aflatoxins during the pre- or post-harvest stage (Cho et al.,2008; O’Riordan & Wilkinson, 2008, 2009; Reiter, Vouk, Bhm, &Razzazi-Fazeli, 2010). The Commission Regulations (EU) has set5.0 ng g�1 for AFB1 and 10.0 ng g�1 for total aflatoxins in spices;2.0 ng g�1 for AFB1 and 4.0 ng g�1 for total aflatoxins for ground-
ll rights reserved.
60 4 6574857.
nuts (peanut) and other oil seeds and processed products intendedfor direct human consumption. The limit was 5.0 ng g�1 and10.0 ng g�1 for AFB1 and total aflatoxins, respectively for nut anddried fruits to be subjected to sorting, or other physical treatment,before human consumption or use as an ingredient in foodstuffs(Commision Regulation, 2010). Several analytical methods havebeen described for the determination of aflatoxins in food; themain ones are enzyme linked immunosorbent assay (O’Riordan &Wilkinson, 2009), thin layer chromatography (Stroka, Otterdijk, &Anklam, 2000) high performance liquid chromatography (HPLC)(Herzallah, 2009; Khayoon, Saad, Salleh, et al., 2010; Khayoon,Saad, Yan, et al., 2010; Quinto, Spadaccino, Palermo, & Centonze,2009), ultra-high performance liquid chromatography (UPLC) (Fu,Huang, & Min, 2008) and capillary electrophoresis (Peña, Alcaraz,Arce, Ríos, & Valcárcel, 2002). For the HPLC technique, fluorescencedetection is useful due to its good sensitivity, while mass spec-trometry (MS) is excellent for confirmation (Frenich, Vidal, Romer-o-Gonzalez, & Aguilera-Luiz, 2009).
To date, reversed-phase HPLC using C18 particle column is themost commonly used method (Herzallah, 2009; Khayoon et al.,2010; Khayoon, Saad, Yan, et al., 2010; Quinto et al., 2009).However, the use of monolithic columns is steadily increasing.Monolithic columns, first described by Tanaka and co-workers(Minakuchi, Soga, Ishizuka, & Tanaka, 1996), are prepared as asingle piece made of porous cross-linked polymer or porous silicain different formats (e.g., porous rods, thin membranes or disks).The columns are composed of a continuous porous rod that provide
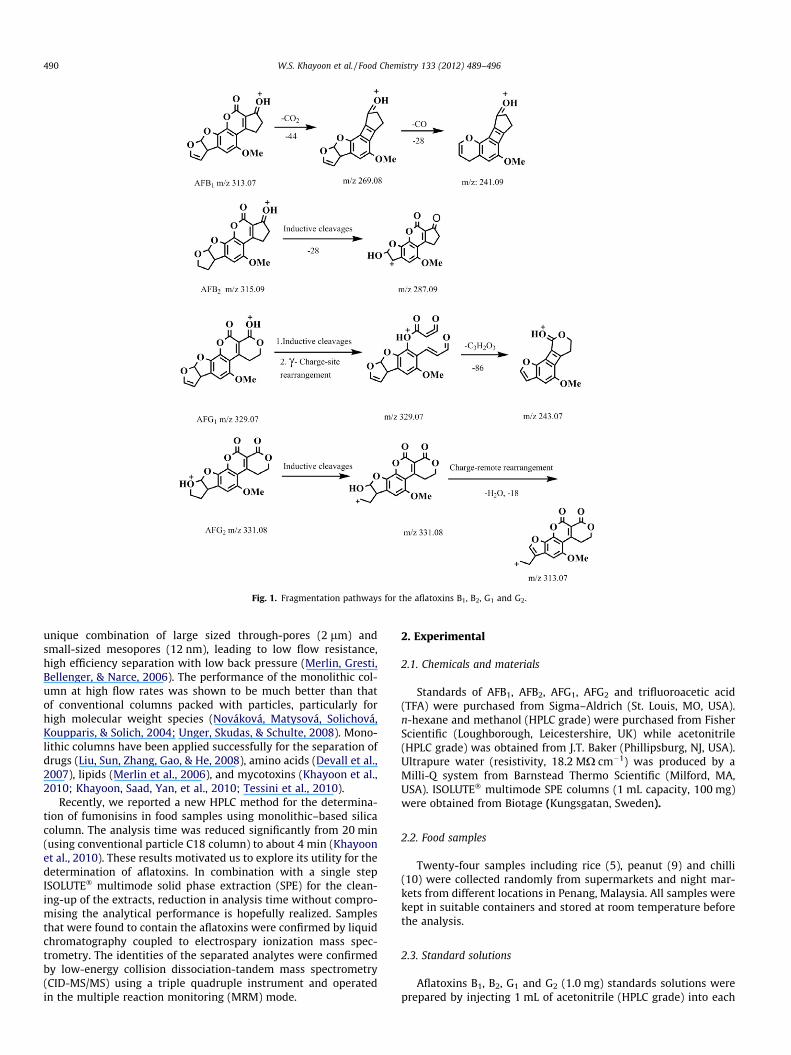
Fig. 1. Fragmentation pathways for the aflatoxins B1, B2, G1 and G2.
490 W.S. Khayoon et al. / Food Chemistry 133 (2012) 489–496
unique combination of large sized through-pores (2 lm) andsmall-sized mesopores (12 nm), leading to low flow resistance,high efficiency separation with low back pressure (Merlin, Gresti,Bellenger, & Narce, 2006). The performance of the monolithic col-umn at high flow rates was shown to be much better than thatof conventional columns packed with particles, particularly forhigh molecular weight species (Nováková, Matysová, Solichová,Koupparis, & Solich, 2004; Unger, Skudas, & Schulte, 2008). Mono-lithic columns have been applied successfully for the separation ofdrugs (Liu, Sun, Zhang, Gao, & He, 2008), amino acids (Devall et al.,2007), lipids (Merlin et al., 2006), and mycotoxins (Khayoon et al.,2010; Khayoon, Saad, Yan, et al., 2010; Tessini et al., 2010).
Recently, we reported a new HPLC method for the determina-tion of fumonisins in food samples using monolithic–based silicacolumn. The analysis time was reduced significantly from 20 min(using conventional particle C18 column) to about 4 min (Khayoonet al., 2010). These results motivated us to explore its utility for thedetermination of aflatoxins. In combination with a single stepISOLUTE� multimode solid phase extraction (SPE) for the clean-ing-up of the extracts, reduction in analysis time without compro-mising the analytical performance is hopefully realized. Samplesthat were found to contain the aflatoxins were confirmed by liquidchromatography coupled to electrospary ionization mass spec-trometry. The identities of the separated analytes were confirmedby low-energy collision dissociation-tandem mass spectrometry(CID-MS/MS) using a triple quadruple instrument and operatedin the multiple reaction monitoring (MRM) mode.
2. Experimental
2.1. Chemicals and materials
Standards of AFB1, AFB2, AFG1, AFG2 and trifluoroacetic acid(TFA) were purchased from Sigma–Aldrich (St. Louis, MO, USA).n-hexane and methanol (HPLC grade) were purchased from FisherScientific (Loughborough, Leicestershire, UK) while acetonitrile(HPLC grade) was obtained from J.T. Baker (Phillipsburg, NJ, USA).Ultrapure water (resistivity, 18.2 MX cm�1) was produced by aMilli-Q system from Barnstead Thermo Scientific (Milford, MA,USA). ISOLUTE� multimode SPE columns (1 mL capacity, 100 mg)were obtained from Biotage (Kungsgatan, Sweden).
2.2. Food samples
Twenty-four samples including rice (5), peanut (9) and chilli(10) were collected randomly from supermarkets and night mar-kets from different locations in Penang, Malaysia. All samples werekept in suitable containers and stored at room temperature beforethe analysis.
2.3. Standard solutions
Aflatoxins B1, B2, G1 and G2 (1.0 mg) standards solutions wereprepared by injecting 1 mL of acetonitrile (HPLC grade) into each
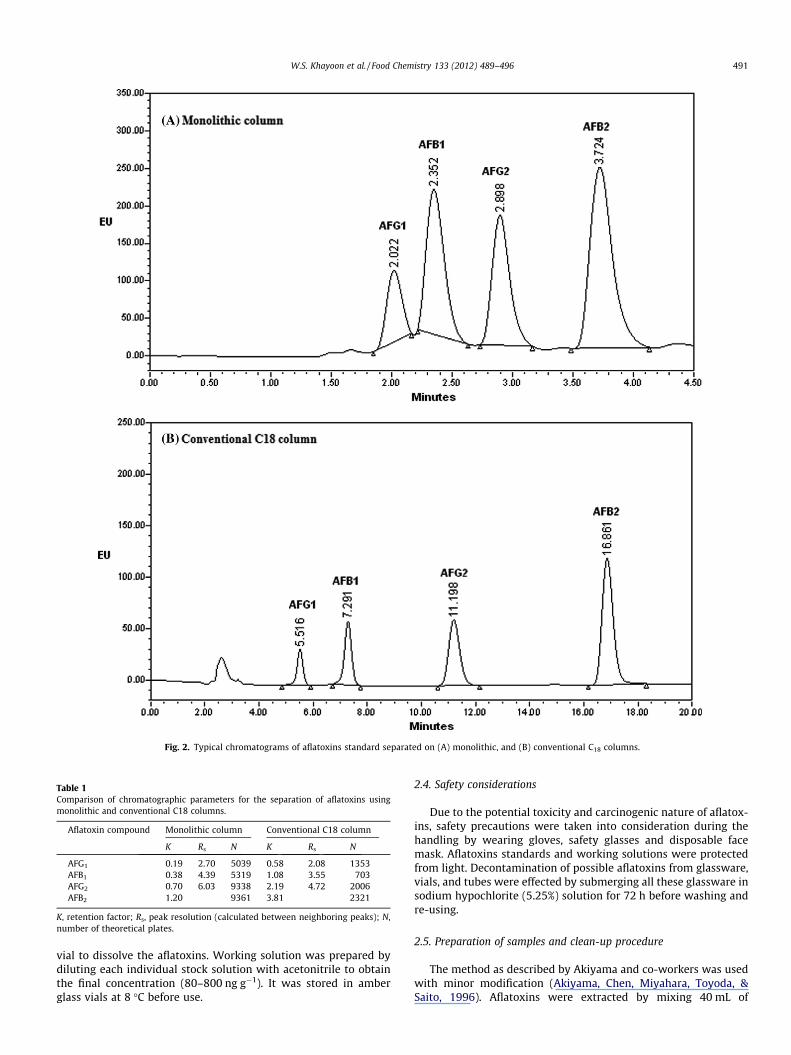
Fig. 2. Typical chromatograms of aflatoxins standard separated on (A) monolithic, and (B) conventional C18 columns.
Table 1Comparison of chromatographic parameters for the separation of aflatoxins usingmonolithic and conventional C18 columns.
Aflatoxin compound Monolithic column Conventional C18 column
K Rs N K Rs N
AFG1 0.19 2.70 5039 0.58 2.08 1353AFB1 0.38 4.39 5319 1.08 3.55 703AFG2 0.70 6.03 9338 2.19 4.72 2006AFB2 1.20 9361 3.81 2321
K, retention factor; Rs, peak resolution (calculated between neighboring peaks); N,number of theoretical plates.
W.S. Khayoon et al. / Food Chemistry 133 (2012) 489–496 491
vial to dissolve the aflatoxins. Working solution was prepared bydiluting each individual stock solution with acetonitrile to obtainthe final concentration (80–800 ng g�1). It was stored in amberglass vials at 8 �C before use.
2.4. Safety considerations
Due to the potential toxicity and carcinogenic nature of aflatox-ins, safety precautions were taken into consideration during thehandling by wearing gloves, safety glasses and disposable facemask. Aflatoxins standards and working solutions were protectedfrom light. Decontamination of possible aflatoxins from glassware,vials, and tubes were effected by submerging all these glassware insodium hypochlorite (5.25%) solution for 72 h before washing andre-using.
2.5. Preparation of samples and clean-up procedure
The method as described by Akiyama and co-workers was usedwith minor modification (Akiyama, Chen, Miyahara, Toyoda, &Saito, 1996). Aflatoxins were extracted by mixing 40 mL of
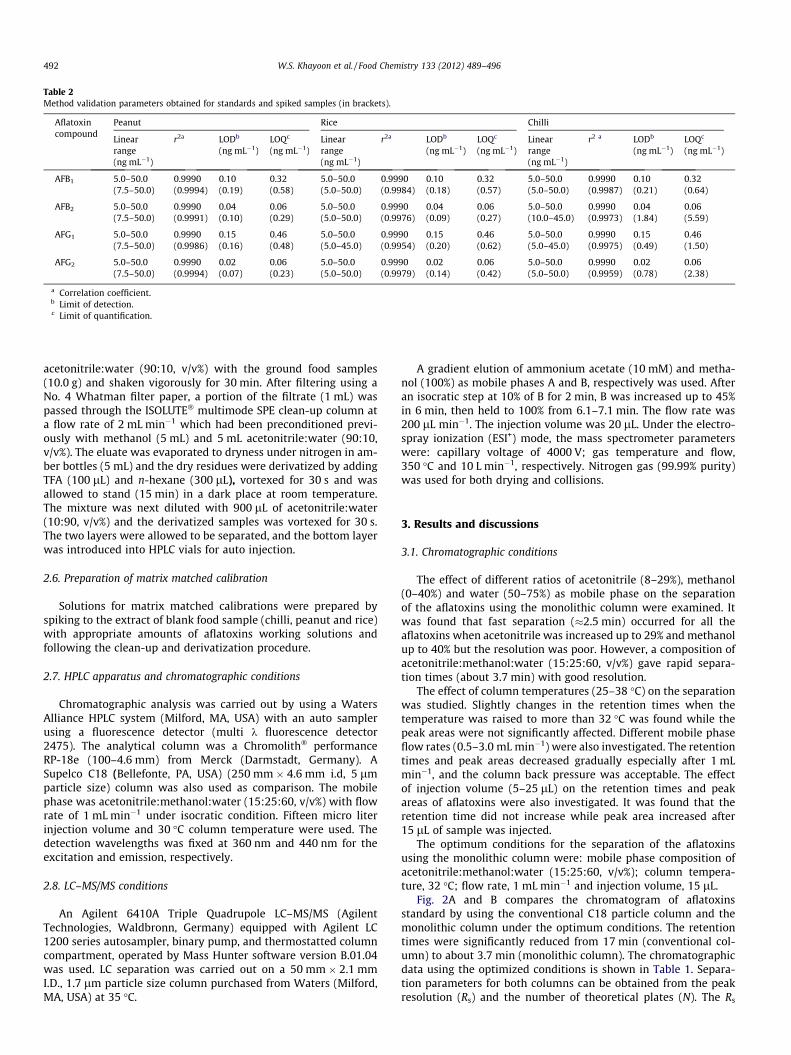
Table 2Method validation parameters obtained for standards and spiked samples (in brackets).
Aflatoxincompound
Peanut Rice Chilli
Linearrange(ng mL�1)
r2a LODb
(ng mL�1)LOQc
(ng mL�1)Linearrange(ng mL�1)
r2a LODb
(ng mL�1)LOQc
(ng mL�1)Linearrange(ng mL�1)
r2 a LODb
(ng mL�1)LOQc
(ng mL�1)
AFB1 5.0–50.0 0.9990 0.10 0.32 5.0–50.0 0.9990 0.10 0.32 5.0–50.0 0.9990 0.10 0.32(7.5–50.0) (0.9994) (0.19) (0.58) (5.0–50.0) (0.9984) (0.18) (0.57) (5.0–50.0) (0.9987) (0.21) (0.64)
AFB2 5.0–50.0 0.9990 0.04 0.06 5.0–50.0 0.9990 0.04 0.06 5.0–50.0 0.9990 0.04 0.06(7.5–50.0) (0.9991) (0.10) (0.29) (5.0–50.0) (0.9976) (0.09) (0.27) (10.0–45.0) (0.9973) (1.84) (5.59)
AFG1 5.0–50.0 0.9990 0.15 0.46 5.0–50.0 0.9990 0.15 0.46 5.0–50.0 0.9990 0.15 0.46(7.5–50.0) (0.9986) (0.16) (0.48) (5.0–45.0) (0.9954) (0.20) (0.62) (5.0–45.0) (0.9975) (0.49) (1.50)
AFG2 5.0–50.0 0.9990 0.02 0.06 5.0–50.0 0.9990 0.02 0.06 5.0–50.0 0.9990 0.02 0.06(7.5–50.0) (0.9994) (0.07) (0.23) (5.0–50.0) (0.9979) (0.14) (0.42) (5.0–50.0) (0.9959) (0.78) (2.38)
a Correlation coefficient.b Limit of detection.c Limit of quantification.
492 W.S. Khayoon et al. / Food Chemistry 133 (2012) 489–496
acetonitrile:water (90:10, v/v%) with the ground food samples(10.0 g) and shaken vigorously for 30 min. After filtering using aNo. 4 Whatman filter paper, a portion of the filtrate (1 mL) waspassed through the ISOLUTE� multimode SPE clean-up column ata flow rate of 2 mL min�1 which had been preconditioned previ-ously with methanol (5 mL) and 5 mL acetonitrile:water (90:10,v/v%). The eluate was evaporated to dryness under nitrogen in am-ber bottles (5 mL) and the dry residues were derivatized by addingTFA (100 lL) and n-hexane (300 lL), vortexed for 30 s and wasallowed to stand (15 min) in a dark place at room temperature.The mixture was next diluted with 900 lL of acetonitrile:water(10:90, v/v%) and the derivatized samples was vortexed for 30 s.The two layers were allowed to be separated, and the bottom layerwas introduced into HPLC vials for auto injection.
2.6. Preparation of matrix matched calibration
Solutions for matrix matched calibrations were prepared byspiking to the extract of blank food sample (chilli, peanut and rice)with appropriate amounts of aflatoxins working solutions andfollowing the clean-up and derivatization procedure.
2.7. HPLC apparatus and chromatographic conditions
Chromatographic analysis was carried out by using a WatersAlliance HPLC system (Milford, MA, USA) with an auto samplerusing a fluorescence detector (multi k fluorescence detector2475). The analytical column was a Chromolith� performanceRP-18e (100–4.6 mm) from Merck (Darmstadt, Germany). ASupelco C18 (Bellefonte, PA, USA) (250 mm � 4.6 mm i.d, 5 lmparticle size) column was also used as comparison. The mobilephase was acetonitrile:methanol:water (15:25:60, v/v%) with flowrate of 1 mL min�1 under isocratic condition. Fifteen micro literinjection volume and 30 �C column temperature were used. Thedetection wavelengths was fixed at 360 nm and 440 nm for theexcitation and emission, respectively.
2.8. LC–MS/MS conditions
An Agilent 6410A Triple Quadrupole LC–MS/MS (AgilentTechnologies, Waldbronn, Germany) equipped with Agilent LC1200 series autosampler, binary pump, and thermostatted columncompartment, operated by Mass Hunter software version B.01.04was used. LC separation was carried out on a 50 mm � 2.1 mmI.D., 1.7 lm particle size column purchased from Waters (Milford,MA, USA) at 35 �C.
A gradient elution of ammonium acetate (10 mM) and metha-nol (100%) as mobile phases A and B, respectively was used. Afteran isocratic step at 10% of B for 2 min, B was increased up to 45%in 6 min, then held to 100% from 6.1–7.1 min. The flow rate was200 lL min�1. The injection volume was 20 lL. Under the electro-spray ionization (ESI+) mode, the mass spectrometer parameterswere: capillary voltage of 4000 V; gas temperature and flow,350 �C and 10 L min�1, respectively. Nitrogen gas (99.99% purity)was used for both drying and collisions.
3. Results and discussions
3.1. Chromatographic conditions
The effect of different ratios of acetonitrile (8–29%), methanol(0–40%) and water (50–75%) as mobile phase on the separationof the aflatoxins using the monolithic column were examined. Itwas found that fast separation (�2.5 min) occurred for all theaflatoxins when acetonitrile was increased up to 29% and methanolup to 40% but the resolution was poor. However, a composition ofacetonitrile:methanol:water (15:25:60, v/v%) gave rapid separa-tion times (about 3.7 min) with good resolution.
The effect of column temperatures (25–38 �C) on the separationwas studied. Slightly changes in the retention times when thetemperature was raised to more than 32 �C was found while thepeak areas were not significantly affected. Different mobile phaseflow rates (0.5–3.0 mL min�1) were also investigated. The retentiontimes and peak areas decreased gradually especially after 1 mLmin�1, and the column back pressure was acceptable. The effectof injection volume (5–25 lL) on the retention times and peakareas of aflatoxins were also investigated. It was found that theretention time did not increase while peak area increased after15 lL of sample was injected.
The optimum conditions for the separation of the aflatoxinsusing the monolithic column were: mobile phase composition ofacetonitrile:methanol:water (15:25:60, v/v%); column tempera-ture, 32 �C; flow rate, 1 mL min�1 and injection volume, 15 lL.
Fig. 2A and B compares the chromatogram of aflatoxinsstandard by using the conventional C18 particle column and themonolithic column under the optimum conditions. The retentiontimes were significantly reduced from 17 min (conventional col-umn) to about 3.7 min (monolithic column). The chromatographicdata using the optimized conditions is shown in Table 1. Separa-tion parameters for both columns can be obtained from the peakresolution (Rs) and the number of theoretical plates (N). The Rs
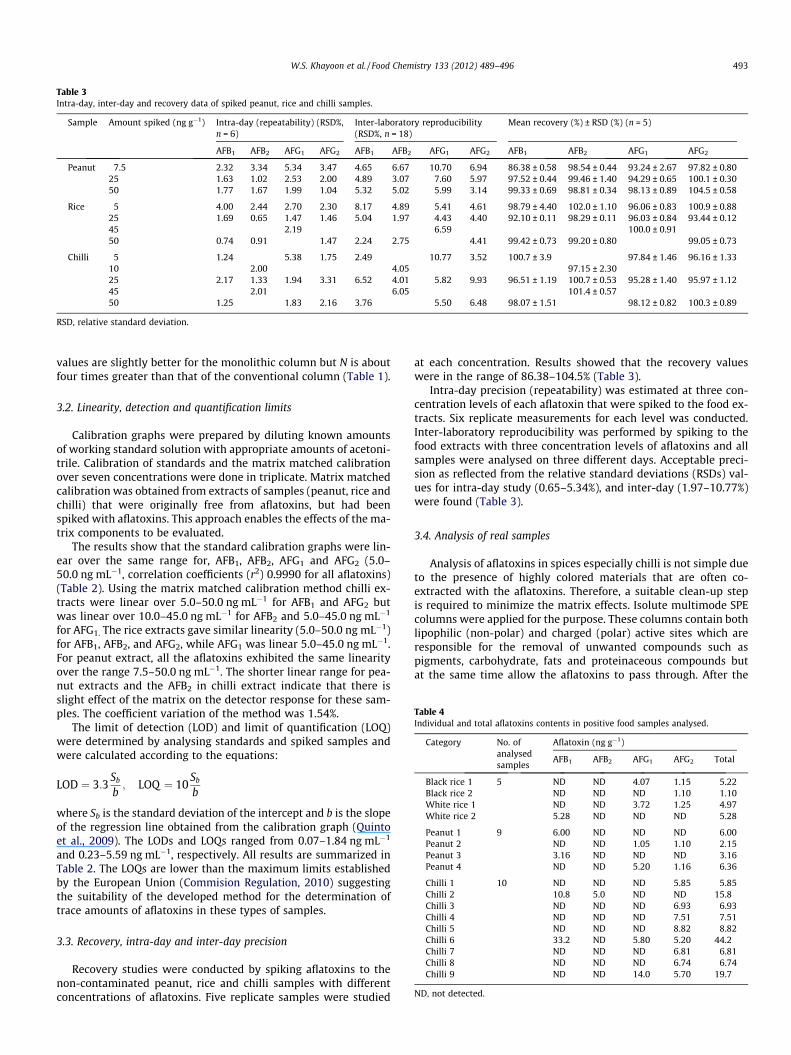
Table 4Individual and total aflatoxins contents in positive food samples analysed.
Category No. ofanalysedsamples
Aflatoxin (ng g�1)
AFB1 AFB2 AFG1 AFG2 Total
Black rice 1 5 ND ND 4.07 1.15 5.22Black rice 2 ND ND ND 1.10 1.10White rice 1 ND ND 3.72 1.25 4.97White rice 2 5.28 ND ND ND 5.28
Peanut 1 9 6.00 ND ND ND 6.00Peanut 2 ND ND 1.05 1.10 2.15Peanut 3 3.16 ND ND ND 3.16Peanut 4 ND ND 5.20 1.16 6.36
Chilli 1 10 ND ND ND 5.85 5.85Chilli 2 10.8 5.0 ND ND 15.8Chilli 3 ND ND ND 6.93 6.93Chilli 4 ND ND ND 7.51 7.51Chilli 5 ND ND ND 8.82 8.82Chilli 6 33.2 ND 5.80 5.20 44.2Chilli 7 ND ND ND 6.81 6.81Chilli 8 ND ND ND 6.74 6.74Chilli 9 ND ND 14.0 5.70 19.7
ND, not detected.
Table 3Intra-day, inter-day and recovery data of spiked peanut, rice and chilli samples.
Sample Amount spiked (ng g�1) Intra-day (repeatability) (RSD%,n = 6)
Inter-laboratory reproducibility(RSD%, n = 18)
Mean recovery (%) ± RSD (%) (n = 5)
AFB1 AFB2 AFG1 AFG2 AFB1 AFB2 AFG1 AFG2 AFB1 AFB2 AFG1 AFG2
Peanut 7.5 2.32 3.34 5.34 3.47 4.65 6.67 10.70 6.94 86.38 ± 0.58 98.54 ± 0.44 93.24 ± 2.67 97.82 ± 0.8025 1.63 1.02 2.53 2.00 4.89 3.07 7.60 5.97 97.52 ± 0.44 99.46 ± 1.40 94.29 ± 0.65 100.1 ± 0.3050 1.77 1.67 1.99 1.04 5.32 5.02 5.99 3.14 99.33 ± 0.69 98.81 ± 0.34 98.13 ± 0.89 104.5 ± 0.58
Rice 5 4.00 2.44 2.70 2.30 8.17 4.89 5.41 4.61 98.79 ± 4.40 102.0 ± 1.10 96.06 ± 0.83 100.9 ± 0.8825 1.69 0.65 1.47 1.46 5.04 1.97 4.43 4.40 92.10 ± 0.11 98.29 ± 0.11 96.03 ± 0.84 93.44 ± 0.1245 2.19 6.59 100.0 ± 0.9150 0.74 0.91 1.47 2.24 2.75 4.41 99.42 ± 0.73 99.20 ± 0.80 99.05 ± 0.73
Chilli 5 1.24 5.38 1.75 2.49 10.77 3.52 100.7 ± 3.9 97.84 ± 1.46 96.16 ± 1.3310 2.00 4.05 97.15 ± 2.3025 2.17 1.33 1.94 3.31 6.52 4.01 5.82 9.93 96.51 ± 1.19 100.7 ± 0.53 95.28 ± 1.40 95.97 ± 1.1245 2.01 6.05 101.4 ± 0.5750 1.25 1.83 2.16 3.76 5.50 6.48 98.07 ± 1.51 98.12 ± 0.82 100.3 ± 0.89
RSD, relative standard deviation.
W.S. Khayoon et al. / Food Chemistry 133 (2012) 489–496 493
values are slightly better for the monolithic column but N is aboutfour times greater than that of the conventional column (Table 1).
3.2. Linearity, detection and quantification limits
Calibration graphs were prepared by diluting known amountsof working standard solution with appropriate amounts of acetoni-trile. Calibration of standards and the matrix matched calibrationover seven concentrations were done in triplicate. Matrix matchedcalibration was obtained from extracts of samples (peanut, rice andchilli) that were originally free from aflatoxins, but had beenspiked with aflatoxins. This approach enables the effects of the ma-trix components to be evaluated.
The results show that the standard calibration graphs were lin-ear over the same range for, AFB1, AFB2, AFG1 and AFG2 (5.0–50.0 ng mL�1, correlation coefficients (r2) 0.9990 for all aflatoxins)(Table 2). Using the matrix matched calibration method chilli ex-tracts were linear over 5.0–50.0 ng mL�1 for AFB1 and AFG2 butwas linear over 10.0–45.0 ng mL�1 for AFB2 and 5.0–45.0 ng mL�1
for AFG1. The rice extracts gave similar linearity (5.0–50.0 ng mL�1)for AFB1, AFB2, and AFG2, while AFG1 was linear 5.0–45.0 ng mL�1.For peanut extract, all the aflatoxins exhibited the same linearityover the range 7.5–50.0 ng mL�1. The shorter linear range for pea-nut extracts and the AFB2 in chilli extract indicate that there isslight effect of the matrix on the detector response for these sam-ples. The coefficient variation of the method was 1.54%.
The limit of detection (LOD) and limit of quantification (LOQ)were determined by analysing standards and spiked samples andwere calculated according to the equations:
LOD ¼ 3:3Sb
b; LOQ ¼ 10
Sb
b
where Sb is the standard deviation of the intercept and b is the slopeof the regression line obtained from the calibration graph (Quintoet al., 2009). The LODs and LOQs ranged from 0.07–1.84 ng mL�1
and 0.23–5.59 ng mL�1, respectively. All results are summarized inTable 2. The LOQs are lower than the maximum limits establishedby the European Union (Commision Regulation, 2010) suggestingthe suitability of the developed method for the determination oftrace amounts of aflatoxins in these types of samples.
3.3. Recovery, intra-day and inter-day precision
Recovery studies were conducted by spiking aflatoxins to thenon-contaminated peanut, rice and chilli samples with differentconcentrations of aflatoxins. Five replicate samples were studied
at each concentration. Results showed that the recovery valueswere in the range of 86.38–104.5% (Table 3).
Intra-day precision (repeatability) was estimated at three con-centration levels of each aflatoxin that were spiked to the food ex-tracts. Six replicate measurements for each level was conducted.Inter-laboratory reproducibility was performed by spiking to thefood extracts with three concentration levels of aflatoxins and allsamples were analysed on three different days. Acceptable preci-sion as reflected from the relative standard deviations (RSDs) val-ues for intra-day study (0.65–5.34%), and inter-day (1.97–10.77%)were found (Table 3).
3.4. Analysis of real samples
Analysis of aflatoxins in spices especially chilli is not simple dueto the presence of highly colored materials that are often co-extracted with the aflatoxins. Therefore, a suitable clean-up stepis required to minimize the matrix effects. Isolute multimode SPEcolumns were applied for the purpose. These columns contain bothlipophilic (non-polar) and charged (polar) active sites which areresponsible for the removal of unwanted compounds such aspigments, carbohydrate, fats and proteinaceous compounds butat the same time allow the aflatoxins to pass through. After the
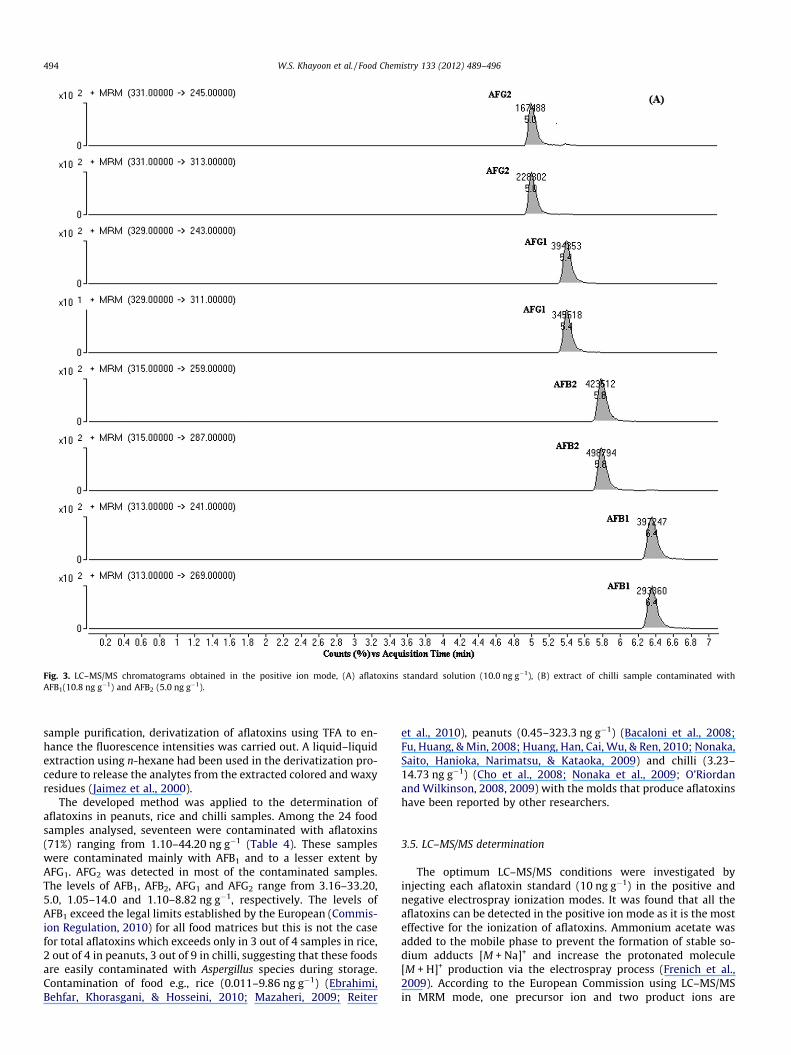
Fig. 3. LC–MS/MS chromatograms obtained in the positive ion mode, (A) aflatoxins standard solution (10.0 ng g�1), (B) extract of chilli sample contaminated withAFB1(10.8 ng g�1) and AFB2 (5.0 ng g�1).
494 W.S. Khayoon et al. / Food Chemistry 133 (2012) 489–496
sample purification, derivatization of aflatoxins using TFA to en-hance the fluorescence intensities was carried out. A liquid–liquidextraction using n-hexane had been used in the derivatization pro-cedure to release the analytes from the extracted colored and waxyresidues (Jaimez et al., 2000).
The developed method was applied to the determination ofaflatoxins in peanuts, rice and chilli samples. Among the 24 foodsamples analysed, seventeen were contaminated with aflatoxins(71%) ranging from 1.10–44.20 ng g�1 (Table 4). These sampleswere contaminated mainly with AFB1 and to a lesser extent byAFG1. AFG2 was detected in most of the contaminated samples.The levels of AFB1, AFB2, AFG1 and AFG2 range from 3.16–33.20,5.0, 1.05–14.0 and 1.10–8.82 ng g�1, respectively. The levels ofAFB1 exceed the legal limits established by the European (Commis-ion Regulation, 2010) for all food matrices but this is not the casefor total aflatoxins which exceeds only in 3 out of 4 samples in rice,2 out of 4 in peanuts, 3 out of 9 in chilli, suggesting that these foodsare easily contaminated with Aspergillus species during storage.Contamination of food e.g., rice (0.011–9.86 ng g�1) (Ebrahimi,Behfar, Khorasgani, & Hosseini, 2010; Mazaheri, 2009; Reiter
et al., 2010), peanuts (0.45–323.3 ng g�1) (Bacaloni et al., 2008;Fu, Huang, & Min, 2008; Huang, Han, Cai, Wu, & Ren, 2010; Nonaka,Saito, Hanioka, Narimatsu, & Kataoka, 2009) and chilli (3.23–14.73 ng g�1) (Cho et al., 2008; Nonaka et al., 2009; O’Riordanand Wilkinson, 2008, 2009) with the molds that produce aflatoxinshave been reported by other researchers.
3.5. LC–MS/MS determination
The optimum LC–MS/MS conditions were investigated byinjecting each aflatoxin standard (10 ng g�1) in the positive andnegative electrospray ionization modes. It was found that all theaflatoxins can be detected in the positive ion mode as it is the mosteffective for the ionization of aflatoxins. Ammonium acetate wasadded to the mobile phase to prevent the formation of stable so-dium adducts [M + Na]+ and increase the protonated molecule[M + H]+ production via the electrospray process (Frenich et al.,2009). According to the European Commission using LC–MS/MSin MRM mode, one precursor ion and two product ions are
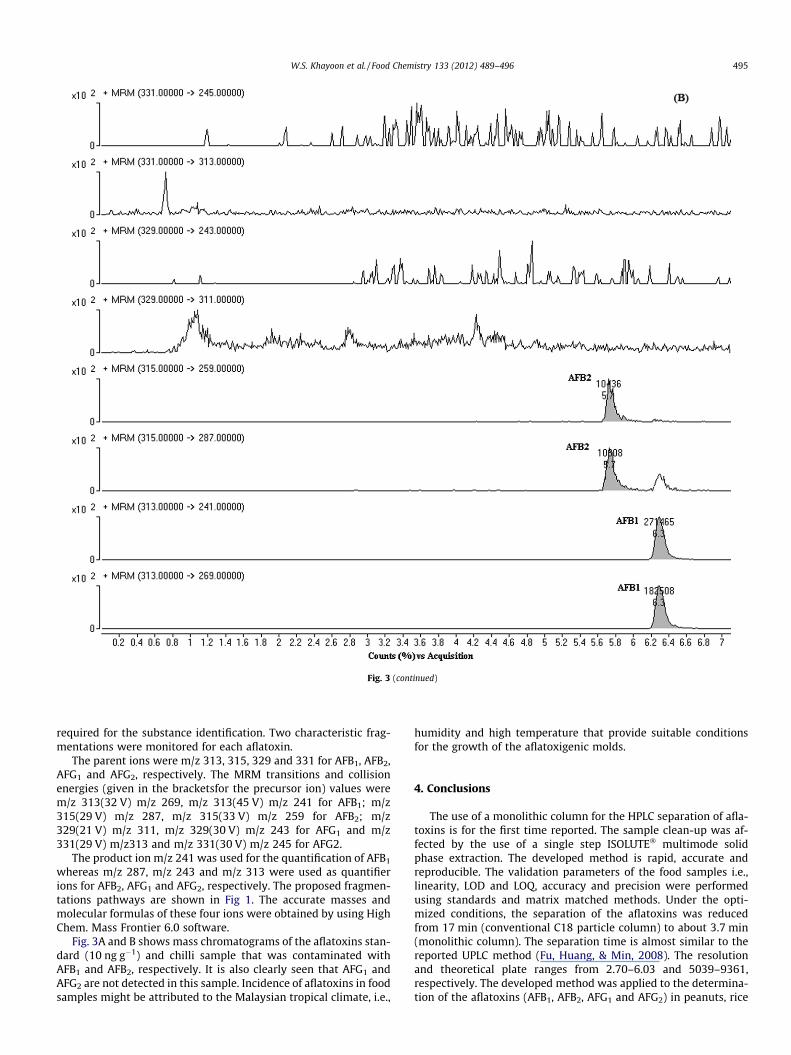
Fig. 3 (continued)
W.S. Khayoon et al. / Food Chemistry 133 (2012) 489–496 495
required for the substance identification. Two characteristic frag-mentations were monitored for each aflatoxin.
The parent ions were m/z 313, 315, 329 and 331 for AFB1, AFB2,AFG1 and AFG2, respectively. The MRM transitions and collisionenergies (given in the bracketsfor the precursor ion) values werem/z 313(32 V) m/z 269, m/z 313(45 V) m/z 241 for AFB1; m/z315(29 V) m/z 287, m/z 315(33 V) m/z 259 for AFB2; m/z329(21 V) m/z 311, m/z 329(30 V) m/z 243 for AFG1 and m/z331(29 V) m/z313 and m/z 331(30 V) m/z 245 for AFG2.
The product ion m/z 241 was used for the quantification of AFB1
whereas m/z 287, m/z 243 and m/z 313 were used as quantifierions for AFB2, AFG1 and AFG2, respectively. The proposed fragmen-tations pathways are shown in Fig 1. The accurate masses andmolecular formulas of these four ions were obtained by using HighChem. Mass Frontier 6.0 software.
Fig. 3A and B shows mass chromatograms of the aflatoxins stan-dard (10 ng g�1) and chilli sample that was contaminated withAFB1 and AFB2, respectively. It is also clearly seen that AFG1 andAFG2 are not detected in this sample. Incidence of aflatoxins in foodsamples might be attributed to the Malaysian tropical climate, i.e.,
humidity and high temperature that provide suitable conditionsfor the growth of the aflatoxigenic molds.
4. Conclusions
The use of a monolithic column for the HPLC separation of afla-toxins is for the first time reported. The sample clean-up was af-fected by the use of a single step ISOLUTE� multimode solidphase extraction. The developed method is rapid, accurate andreproducible. The validation parameters of the food samples i.e.,linearity, LOD and LOQ, accuracy and precision were performedusing standards and matrix matched methods. Under the opti-mized conditions, the separation of the aflatoxins was reducedfrom 17 min (conventional C18 particle column) to about 3.7 min(monolithic column). The separation time is almost similar to thereported UPLC method (Fu, Huang, & Min, 2008). The resolutionand theoretical plate ranges from 2.70–6.03 and 5039–9361,respectively. The developed method was applied to the determina-tion of the aflatoxins (AFB1, AFB2, AFG1 and AFG2) in peanuts, rice
496 W.S. Khayoon et al. / Food Chemistry 133 (2012) 489–496
and chilli. The use of LC–MS/MS using the QqQ analyser and oper-ated in the MRM mode allows the monitoring of a number of se-lected transitions, providing positive identification of theaflatoxins in the contaminated samples.
Acknowledgements
This work was financially supported by Universiti Sains Malay-sia (USM) Postgraduate Research Grant Scheme (USM-RU-PRGS),1001/PKIMIA/842071 and Research Fellowship program. Theauthors also wish to thank the Doping Control Center at USM forthe technical assistance and the use of LC–MS/MS.
References
Akiyama, H., Chen, D., Miyahara, M., Toyoda, M., & Saito, Y. (1996). Simple HPLCdetermination of aflatoxins B1, B2, G1 and G2 in nuts and corn. Journal of theFood Hygienic Society of Japan, 37, 195–201.
Bacaloni, A., Cavaliere, C., Cucci, F., Foglia, P., Samperi, R., & Laganà, A. (2008).Determination of aflatoxins in hazelnuts by various sample preparationmethods and liquid chromatography–tandem mass spectrometry. Journal ofChromatography A, 1179(2), 182–189.
Cho, S. H., Lee, C. H., Jang, M.-R., Son, Y.-W., Lee, S.-M., Choi, I.-S., et al. (2008).Aflatoxins contamination in spices and processed spice productscommercialized in Korea. Food Chemistry, 107(3), 1283–1288.
Commision Regulation (EU) No. 165/2010 of 26 February 2010 amendingRegulation (EC) No. 1881/2006 setting maximum levels for certaincontaminants in foodstuffs as regards aflatoxins. Official Journal of theEuropean Union, L50, 8–12.
Devall, A. J., Blake, R., Langman, N., Smith, C. G. S., Richards, D. A., & Whitehead, K. J.(2007). Monolithic column-based reversed-phase liquid chromatographyseparation for amino acid assay in microdialysates and cerebral spinal fluid.Journal of Chromatography B: Analytical Technologies in the Biomedical and LifeSciences, 848(2), 323–328.
Ebrahimi, R., Behfar, A., Khorasgani, Z. N., & Hosseini, A. (2010). Determination ofaflatoxins levels in imported rice at markets of Ahvaz city. Toxicology Letters,196(Suppl. 1), S329.
Frenich, A. G., Vidal, J. L. M., Romero-Gonzalez, R., & Aguilera-Luiz, M. M. (2009).Simple and high-throughput method for the multimycotoxin analysis in cerealsand related foods by ultra-high performance liquid chromatography/tandemmass spectrometry. Food Chemistry, 117(4), 705–712.
Fu, Z., Huang, X., & Min, S. (2008). Rapid determination of aflatoxins in corn andpeanuts. Journal of Chromatography A, 1209(1–2), 271–274.
Han, Z., Zheng, Y., Luan, L., Cai, Z., Ren, Y., & Wu, Y. (2010). An ultra-high-performance liquid chromatography–tandem mass spectrometry method forsimultaneous determination of aflatoxins B1, B2, G1, G2, M1 and M2 intraditional Chinese medicines. Analytica Chimica Acta, 664(2), 165–171.
Herzallah, S. M. (2009). Determination of aflatoxins in eggs, milk, meat and meatproducts using HPLC fluorescent and UV detectors. Food Chemistry, 114(3),1141–1146.
Huang, B., Han, Z., Cai, Z., Wu, Y., & Ren, Y. (2010). Simultaneous determination ofaflatoxins B1, B2, G1, G2, M1 and M2 in peanuts and their derivative productsby ultra-high-performance liquid chromatography–tandem mass spectrometry.Analytica Chimica Acta, 662(1), 62–68.
IARC (2002). IARC Monographs on the evaluation of carcinogenic risks to humans(Suppl. 7, Vol. 83). Lyon France: International Agency for Research on Cancer.
Jaimez, J., Fente, C. A., Vazquez, B. I., Franco, C. M., Cepeda, A., Mahuzier, G., et al.(2000). Application of the assay of aflatoxins by liquid chromatography withfluorescence detection in food analysis. Journal of Chromatography A, 882(1–2),1–10.
Khayoon, W. S., Saad, B., Salleh, B., Ismail, N. A., Manaf, N. H. A., & Latiff, A. A.(2010a). A reversed phase high performance liquid chromatography method forthe determination of fumonisins B1 and B2 in food and feed using monolithiccolumn and positive confirmation by liquid chromatography/tandem massspectrometry. Analytica Chimica Acta, 679(1–2), 91–97.
Khayoon, W. S., Saad, B., Yan, C. B., Hashim, N. H., Ali, A. S. M., Salleh, M. I., et al.(2010b). Determination of aflatoxins in animal feeds by HPLC withmultifunctional column clean-up. Food Chemistry, 118(3), 882–886.
Liu, J., Sun, J., Zhang, W., Gao, K., & He, Z. (2008). HPLC determination of rifampicinand related compounds in pharmaceuticals using monolithic column. Journal ofPharmaceutical and Biomedical Analysis, 46(2), 405–409.
Mazaheri, M. (2009). Determination of aflatoxins in imported rice to Iran. Food andChemical Toxicology, 47(8), 2064–2066.
Merlin, J. F., Gresti, J., Bellenger, S., & Narce, M. (2006). Fast high performance liquidchromatography analysis in lipidomics: Separation of radiolabelled fatty acidsand phosphatidylcholine molecular species using a monolithic C18 silicacolumn. Analytica Chimica Acta, 565(2), 163–167.
Minakuchi, H. N. K., Soga, N., Ishizuka, N., & Tanaka, N. (1996). Octadecylsilylatedporous silica rods as separation media for reversed-phase liquidchromatography. Analytical Chemistry, 68, 3498–3501.
Nonaka, Y., Saito, K., Hanioka, N., Narimatsu, S., & Kataoka, H. (2009). Determinationof aflatoxins in food samples by automated on-line in-tube solid-phasemicroextraction coupled with liquid chromatography–mass spectrometry.Journal of Chromatography A, 1216(20), 4416–4422.
Nováková, L., Matysová, L., Solichová, D., Koupparis, M. A., & Solich, P. (2004).Comparison of performance of C18 monolithic rod columns and conventionalC18 particle-packed columns in liquid chromatographic determination ofEstrogel and Ketoprofen gel. Journal of Chromatography B, 813(1–2), 191–197.
O’Riordan, M. J., & Wilkinson, M. G. (2008). A survey of the incidence and level ofaflatoxin contamination in a range of imported spice preparations on the Irishretail market. Food Chemistry, 107(4), 1429–1435.
O’Riordan, M. J., & Wilkinson, M. G. (2009). Comparison of analytical methods foraflatoxin determination in commercial chilli spice preparations and subsequentdevelopment of an improved method. Food Control, 20(8), 700–705.
Peña, R., Alcaraz, M. C., Arce, L., Ríos, A., & Valcárcel, M. (2002). Screening ofaflatoxins in feed samples using a flow system coupled to capillaryelectrophoresis. Journal of Chromatography A, 967(2), 303–314.
Quinto, M., Spadaccino, G., Palermo, C., & Centonze, D. (2009). Determination ofaflatoxins in cereal flours by solid-phase microextraction coupled with liquidchromatography and post-column photochemical derivatization-fluorescencedetection. Journal of Chromatography A, 1216(49), 8636–8641.
Reiter, E. V., Vouk, F., Bhm, J., & Razzazi-Fazeli, E. (2010). Aflatoxins in rice – Alimited survey of products marketed in Austria. Food Control, 21(7), 988–991.
Stroka, J., Otterdijk, R. V., & Anklam, E. (2000). Immunoaffinity column clean-upprior to thin-layer chromatography for the determination of aflatoxins invarious food matrices. Journal of Chromatography A, 904(2), 251–256.
Tessini, C., Mardones, C., von Baer, D., Vega, M., Herlitz, E., Saelzer, R., et al. (2010).Alternatives for sample pre-treatment and HPLC determination of Ochratoxin Ain red wine using fluorescence detection. Analytica Chimica Acta, 660(1–2),119–126.
Unger, K. K., Skudas, R., & Schulte, M. M. (2008). Particle packed columns andmonolithic columns in high-performance liquid chromatography-comparisonand critical appraisal. Journal of Chromatography A, 1184(1–2), 393–415.
Related Documents