A high-performance liquid chromatographic (HPLC) analysis of triterpenoids from Ganoderma is developed and validated in an attempt to explore a way to differentiate a number of species of the genus Ganoderma. Results show that 64 samples examined in this study could be divided into 18 groups based on characteristics of the HPLC pattern of triterpenoids. This result also conforms with those of the morphological examination and the interfertility test by di-monokaryotic mating. The HPLC analysis of triterpenoids further reveals that differentiation among samples from three different regions each of the two species G. lucidum and G. tsugae is workable. Even then, an incorrect designation is found for two of the groups of samples that were originally classified as G. resinaceum but showed different morphological characteristics and mating incompatibility. In conclusion, an HPLC analysis of triterpenoids is a simple and easy way to differentiate among different species of the genus Ganoderma. Introduction Members of the Ganoderma fungus genus have attracted considerable attention because they produce many biologi- cally active triterpenoids (1–3). Among them, G. lucidum and G. tsugae have most frequently been used as folk medicine in China and Japan. More than 100 new triterpenoids (including ganoderic acid derivatives) have been isolated from the fruiting bodies and the cultured mycelia of these Ganoderma species. Some of these compounds have activities inhibiting both his- tamine release in rat mast cells (2) and the angiotensin-con- verting enzyme (3), cytotoxicity activity against hepatoma cells in vitro (1), anti-HIV-1 and anti-HIV-1-protease activities (4), and hepatoprotective effects as a β-glucuronidase inhibitor (5). The therapeutic effects of substances occurring in other basidiomycetous mushrooms (including G. lucidum) have been reviewed (6). There are numerous species of Ganoderma, and the infor- mation gathered has usually been inadequate for identifi- cation and classification. Traditionally, classification was based on the morphological characteristics of the fruiting body. However, variations in the morphological character- istics of the fruiting body caused by differences in the growing origin and position, geological distribution, cli- mate, and development of individual species make identifi- cation and confirmation difficult. Furthermore, different amounts of emphasis on the importance of the morpholog- ical characteristics of the fruiting body can result in the same species being given different names. Uncertainty in the defining of the Ganoderma species has possibly caused the misinterpretation or differences in explanation of the exper- imental results of in vivo studies. Therefore, several methods have been proposed to identify or confirm the genus and species of Ganoderma, especially for species with close relations. These methods include the scanning elec- tron microscopy of the outline of basidiospores (7), an inter- fertility test (8), DNA restriction enzyme fragment length polymorphism (9), DNA sequence (10), isozyme patterns (11), secondary metabolites, API-ZYM analysis (Analytab Products Inc., Plainview, NY) (11), and growing conditions (7). However, most of these methods are time-consuming and not very cost effective. Previously, it has been found that different species of Gano- derma have shown quite varied patterns in the thin-layer chro- matography (TLC) chromatograms of triterpenoids. In the literature, a pattern was disclosed that was peculiar to the strain for several terpenoids isolated from the fruiting bodies of G. lucidum and G. tsugae (12). A chromatographic method has been developed to not only resolve each pair of stereoiso- mers but also identify certain triterpenoids present in the crude extract of G. lucidum (13). Changes in the triterpenoid patterns during formation of the fruiting body in G. lucidum have been reported as well (14). It was thought that those sec- ondary metabolites of triterpenoids from Ganoderma could Abstract High-Performance Liquid Chromatographic Analysis for the Characterization of Triterpenoids from Ganoderma Ching-Hua Su 1 , Yi-Zhen Yang 1 , Hsiu-O Ho 2 , Chung-Hong Hu 1 , and Ming-Thau Sheu 2, * 1 Center for Biotechnical Development and Research and 2 Graduate Institute of Pharmaceutical Sciences, Taipei Medical University, 250 Wu-Hsing Street, Taipei, Taiwan, R.O.C. Reproduction (photocopying) of editorial content of this journal is prohibited without publisher’s permission. 93 Journal of Chromatographic Science, Vol. 39, March 2001 * Author to whom correspondence should be addressed: e-mail [email protected]. Downloaded from https://academic.oup.com/chromsci/article-abstract/39/3/93/284488 by guest on 22 November 2018

Welcome message from author
This document is posted to help you gain knowledge. Please leave a comment to let me know what you think about it! Share it to your friends and learn new things together.
Transcript

A high-performance liquid chromatographic (HPLC) analysis oftriterpenoids from Ganoderma is developed and validated in anattempt to explore a way to differentiate a number of species ofthe genus Ganoderma. Results show that 64 samples examined inthis study could be divided into 18 groups based on characteristicsof the HPLC pattern of triterpenoids. This result also conformswith those of the morphological examination and the interfertilitytest by di-monokaryotic mating. The HPLC analysis of triterpenoidsfurther reveals that differentiation among samples from threedifferent regions each of the two species G. lucidum and G. tsugaeis workable. Even then, an incorrect designation is found for twoof the groups of samples that were originally classified as G.resinaceum but showed different morphological characteristicsand mating incompatibility. In conclusion, an HPLC analysis oftriterpenoids is a simple and easy way to differentiate amongdifferent species of the genus Ganoderma.
Introduction
Members of the Ganoderma fungus genus have attractedconsiderable attention because they produce many biologi-cally active triterpenoids (1–3). Among them, G. lucidum andG. tsugae have most frequently been used as folk medicine inChina and Japan. More than 100 new triterpenoids (includingganoderic acid derivatives) have been isolated from the fruitingbodies and the cultured mycelia of these Ganoderma species.Some of these compounds have activities inhibiting both his-tamine release in rat mast cells (2) and the angiotensin-con-verting enzyme (3), cytotoxicity activity against hepatoma cellsin vitro (1), anti-HIV-1 and anti-HIV-1-protease activities (4),and hepatoprotective effects as a β-glucuronidase inhibitor(5). The therapeutic effects of substances occurring in other
basidiomycetous mushrooms (including G. lucidum) havebeen reviewed (6).There are numerous species of Ganoderma, and the infor-
mation gathered has usually been inadequate for identifi-cation and classification. Traditionally, classification wasbased on the morphological characteristics of the fruitingbody. However, variations in the morphological character-istics of the fruiting body caused by differences in thegrowing origin and position, geological distribution, cli-mate, and development of individual species make identifi-cation and confirmation difficult. Furthermore, differentamounts of emphasis on the importance of the morpholog-ical characteristics of the fruiting body can result in thesame species being given different names. Uncertainty in thedefining of the Ganoderma species has possibly caused themisinterpretation or differences in explanation of the exper-imental results of in vivo studies. Therefore, severalmethods have been proposed to identify or confirm thegenus and species of Ganoderma, especially for species withclose relations. These methods include the scanning elec-tron microscopy of the outline of basidiospores (7), an inter-fertility test (8), DNA restriction enzyme fragment lengthpolymorphism (9), DNA sequence (10), isozyme patterns(11), secondary metabolites, API-ZYM analysis (AnalytabProducts Inc., Plainview, NY) (11), and growing conditions(7). However, most of these methods are time-consumingand not very cost effective.Previously, it has been found that different species of Gano-
derma have shown quite varied patterns in the thin-layer chro-matography (TLC) chromatograms of triterpenoids. In theliterature, a pattern was disclosed that was peculiar to thestrain for several terpenoids isolated from the fruiting bodiesof G. lucidum and G. tsugae (12). A chromatographic methodhas been developed to not only resolve each pair of stereoiso-mers but also identify certain triterpenoids present in thecrude extract of G. lucidum (13). Changes in the triterpenoidpatterns during formation of the fruiting body in G. lucidumhave been reported as well (14). It was thought that those sec-ondary metabolites of triterpenoids from Ganoderma could
Abstract
High-Performance Liquid Chromatographic Analysis forthe Characterization of Triterpenoids from Ganoderma
Ching-Hua Su11, Yi-Zhen Yang11, Hsiu-O Ho22, Chung-Hong Hu11, and Ming-Thau Sheu22,,*1Center for Biotechnical Development and Research and 2Graduate Institute of Pharmaceutical Sciences, Taipei Medical University,250 Wu-Hsing Street, Taipei, Taiwan, R.O.C.
Reproduction (photocopying) of editorial content of this journal is prohibited without publisher’s permission. 93
Journal of Chromatographic Science, Vol. 39, March 2001
* Author to whom correspondence should be addressed: e-mail [email protected].
Dow
nloaded from https://academ
ic.oup.com/chrom
sci/article-abstract/39/3/93/284488 by guest on 22 Novem
ber 2018

Journal of Chromatographic Science, Vol. 39, March 2001
94
possibly be used as a way of identification. In this report, ahigh-performance liquid chromatographic (HPLC) separationof triterpenoids was developed and validated, and the possibilityof using this to identify species of the Ganoderma genus wasexplored.
Experimental
Sample extraction and preparationTwo external standards of the ganoderic acids B and C2
were purified from G. tsugae following a procedure previ-ously developed in our laboratory (15). Sixty-four fruitingbodies either collected by our laboratory, supplied byTaiwan Agriculture Research Institute (TARI) of R.O.C.(Taipei, Taiwan), or purchased from the deposit of the Cul-
ture Collection and Research Center, (CCRC, Hsinchu,Taiwan, R.O.C.), were included in this study. Detailedinformation of these samples is included in Table I. Allsamples were dried and ground into fine powder. Twograms of powdered samples were mixed with 100 mLalcohol and then placed on a rotating shaker for 24 h. Fil-trate was collected, and alcohol was evaporated to drynessunder reduced pressure. A final volume of 1.5 mL for eachsample was prepared as a stock solution with the additionof methanol. For quantitation, a sample solution for eachsample was prepared by mixing two external standards ata respective concentration of 6.8 µg/mL (ganoderic acid B)and 0.27 µg/mL (ganoderic acid C2) with an equal volumeof the respective stock solution.
Chromatographic conditionsThe HPLC equipment consisted of a Shimadzu (Kyoto,
Species CCRC* TARI* Collection area Grouping
G. australe 36128† India C‡
G. formosanum 37048 88-1-49† Eastern Taiwan B‡
G. lobatum 36245† Canada Q‡
G. lucidum 36021 87-1-1† Central Taiwan K36041 87-1-2† Southern Taiwan K37026 87-1-6† Northern Taiwan K‡
37029 87-1-9† Northern Taiwan K37033 88-1-30† Central Taiwan K37043 88-1-44† Eastern Taiwan I37053 88-1-54† Eastern Taiwan I‡
36124† India H‡
36125† Argentina I36144† North America I
G. mirabile 36152† R
G. neo-japonicum 36049 87-1-4† Northern Taiwan A37042 88-1-43† Eastern Taiwan A37051 88-1-52† Northern Taiwan A‡
G. oerstedii 36291† R
G. pfeifferi 36159† G‡
G. resinaceum 36146† G36147† R36149† R
G. subamboinense 36087† Argentina Hvar. laevisporum
Species CCRC* TARI* Collection area Grouping
G. tsugae 36042† 87-1-3† Central Taiwan O36065† 87-1-14† Central Taiwan P36090† 87-1-19 Central Taiwan O‡
88-1-56† Northern Taiwan O36203 88-1-59† Central Taiwan O36204 88-1-60† Northern Taiwan P
–§ 37063† P‡
G. weberianum 36145† F
– 37049† 88-1-50† Eastern Taiwan F37081 88-1-58† Central Taiwan F‡
– 88-1-77† F
G. boniense 37040 88-1-39† Central Taiwan L‡
37068 88-1-73† L
G. calidophilum 36205 88-1-61† Central Taiwan D‡
G. curtisii 87-1-13† Central Taiwan P88-1-34† Central Taiwan P88-1-37† Central Taiwan P88-1-64† Central Taiwan P88-1-67† Central Taiwan P
37064 88-1-68† Central Taiwan P
G. fornicatum 37067 88-1-71† Northern Taiwan N‡
G. mastoporum 37044 88-1-45† Eastern Taiwan E88-1-62† E‡
G. tropicum 87-1-8† M87-1-28† Northern Taiwan M88-1-40† Northern Taiwan M‡
88-1-57† Central Taiwan M88-1-65† Northern Taiwan M88-1-69† Northern Taiwan M
Table I. Status Information for the Analyzed Samples and Grouping
* Company that assigned accession number.† Analyzed samples.‡ Representative of each group.§ –, Undetermined species.
Dow
nloaded from https://academ
ic.oup.com/chrom
sci/article-abstract/39/3/93/284488 by guest on 22 Novem
ber 2018

Journal of Chromatographic Science, Vol. 39, March 2001
95
Japan) LC-4A pump, an SPD-6AV UV detector (Shimadzu)with the wavelength set at 254 nm, and an SP4270 recorder(Integrator, Spectra-Physics, Mountain View, CA). A modelCTO-2AS heater module (Shimadzu) was used to keep thecolumn temperature constant at 42°C ± 0.5°C. Separationwas carried out on a C-18 column (Lichrosphere 100, 300 ×4.6 mm, 5 µm) (Merck, Darmstadt, Germany). Five microlitersof the stock or sample solution was introduced with a Rheo-dyne valve equipped with a 50-µL external loop. The mobile-phase flow rate was 1 mL/min and consisted of acetonitrile,glacial acetic acid, and distilled water (69.3:0.01:30.69). Fornormal-phase TLC examination, precoated silica-gel TLCplates (Kieselgel 60 F254, DC-Alufolien, Merck) were used. Thedeveloping reagent was composed of chloroform, methanol,and water in a volumetric ratio of 30:4:1. Visualization pro-ceeded by spraying 10% sulfuric acid in alcohol and thenheating the sample to 100°C in order to evaporate the sol-vents. The sample was initially examined under a UV lampwith a wavelength of 254 nm, and plates were further heatedto 105°C for visualization.
Figure 1. HPLC chromatograms for the ganoderic acids C2 (A) and B (B).
Figure 2. HPLC chromatograms of the triterpenoids of G. tsugae from six different regions.
Dow
nloaded from https://academ
ic.oup.com/chrom
sci/article-abstract/39/3/93/284488 by guest on 22 Novem
ber 2018

Journal of Chromatographic Science, Vol. 39, March 2001
96
Results and Discussion
Typical HPLC chromatograms for the ganoderic acids B andC2 are shown in Figure 1. This figure demonstrates the applic-ability of these chromatographic conditions to the separationof triterpenoids in the crude extract of these Ganodermaspecies. The suitability was further confirmed in an analysis of
G. tsugae from six different origins, and their HPLC chro-matograms are illustrated in Figure 2.After careful examination, these 64 samples were divided
into 18 patterns (A–R) based on the following criteria: (a) theexistence of chromatographic peaks for ganoderic acids Band C2; (b) the peak number before ganoderic acid B andafter ganoderic acid C2; (c) the peak number between gan-
Figure 3. HPLC chromatograms of the triterpenoids for groups A through J.
Time (min) Time (min)
Dow
nloaded from https://academ
ic.oup.com/chrom
sci/article-abstract/39/3/93/284488 by guest on 22 Novem
ber 2018

Journal of Chromatographic Science, Vol. 39, March 2001
97
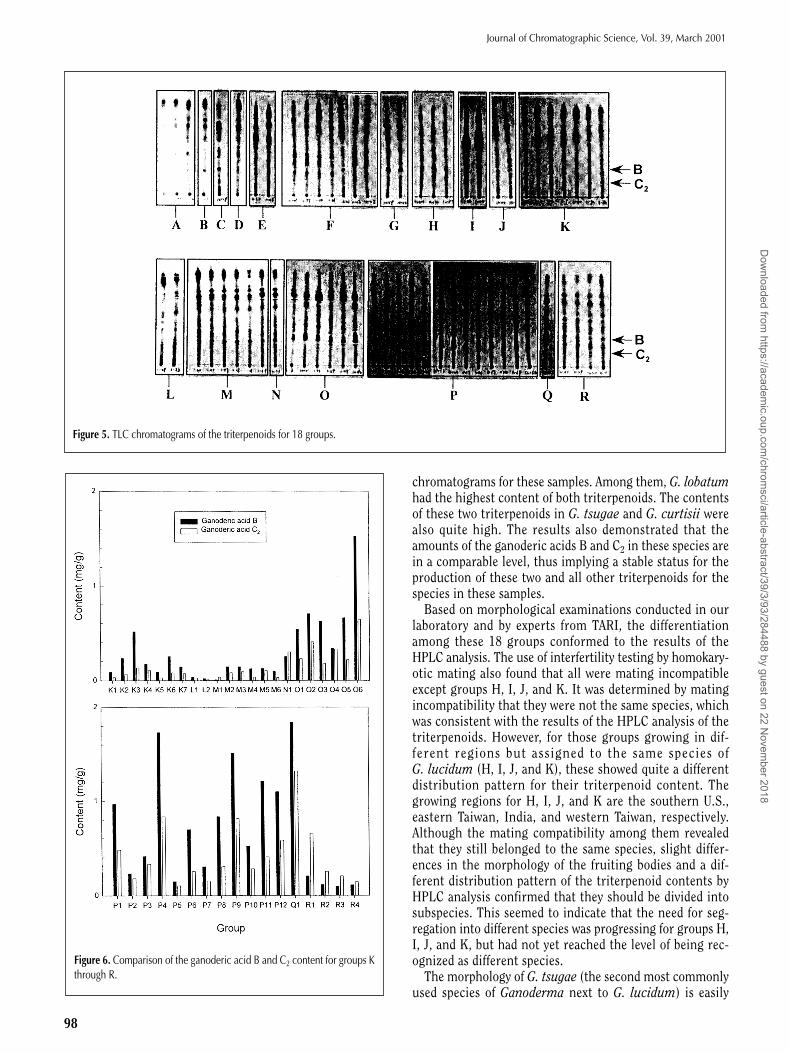
oderic acid B and C2; and (d) the total peak number in achromatographic time period of 55 min when there wereno peaks for ganoderic acids B or C2. A representative samplefor each pattern is marked in Table I, and typical HPLC chro-matograms are displayed in Figures 3 and 4. Furthermore, itwas found that the TLC chromatograms for these 64 samplescould be grouped into 18 groups as well, as shown in Figure5. Obviously, the TLC results showed a similar grouping pat-tern as that for HPLC, as listed in Table I. The comparison ofthe TLC chromatograms for the representative sample ofeach pattern is demonstrated in Figure 5.The calibration curves that were applied for quantitation
based on the HPLC method were constructed respectively forganoderic acid B and C2. The linear range for both com-pounds was found to be between 0.5 and 20 µg/mL. The
accuracy and precision for interday runs were 0.53 to 6.54%and –3.11 to 4.86%, respectively, and for intraday runs were1.25 to 8.94% and 2.55 to 8.65%. The contents of the gan-oderic acids B and C2 in each sample were calculated byinterpolation from the corresponding calibration curvesbased on the peak area (the results are summarized in TableII and Figure 6). These results showed that G. lucidum,G. boniense, G. tropicum, G. fornicatum, G. curtisii,G. lobatum, G. resinaceum (36146), G. mirabile, and G. oer-stedii contain both ganoderic acid B and C2 in variousamounts, but they were not found in G. neo-japonicum,G. formasanum, G. australe, G. calidophilum, G. masto-porum, G. weberianum, G. pfeifferi, G. resinaceum (36147and 36149), G. subamboninese var. laevisporum, or part ofG. lucidum. The same results were observed in the TLC
Figure 4. HPLC chromatograms of the triterpenoids for groups K through R.
Time (min) Time (min)
Dow
nloaded from https://academ
ic.oup.com/chrom
sci/article-abstract/39/3/93/284488 by guest on 22 Novem
ber 2018
Journal of Chromatographic Science, Vol. 39, March 2001
98
chromatograms for these samples. Among them, G. lobatumhad the highest content of both triterpenoids. The contentsof these two triterpenoids in G. tsugae and G. curtisii werealso quite high. The results also demonstrated that theamounts of the ganoderic acids B and C2 in these species arein a comparable level, thus implying a stable status for theproduction of these two and all other triterpenoids for thespecies in these samples.Based on morphological examinations conducted in our
laboratory and by experts from TARI, the differentiationamong these 18 groups conformed to the results of theHPLC analysis. The use of interfertility testing by homokary-otic mating also found that all were mating incompatibleexcept groups H, I, J, and K. It was determined by matingincompatibility that they were not the same species, whichwas consistent with the results of the HPLC analysis of thetriterpenoids. However, for those groups growing in dif-ferent regions but assigned to the same species ofG. lucidum (H, I, J, and K), these showed quite a differentdistribution pattern for their triterpenoid content. Thegrowing regions for H, I, J, and K are the southern U.S.,eastern Taiwan, India, and western Taiwan, respectively.Although the mating compatibility among them revealedthat they still belonged to the same species, slight differ-ences in the morphology of the fruiting bodies and a dif-ferent distribution pattern of the triterpenoid contents byHPLC analysis confirmed that they should be divided intosubspecies. This seemed to indicate that the need for seg-regation into different species was progressing for groups H,I, J, and K, but had not yet reached the level of being rec-ognized as different species.The morphology of G. tsugae (the second most commonly
used species of Ganoderma next to G. lucidum) is easily
Figure 5. TLC chromatograms of the triterpenoids for 18 groups.
Figure 6. Comparison of the ganoderic acid B and C2 content for groups Kthrough R.
Dow
nloaded from https://academ
ic.oup.com/chrom
sci/article-abstract/39/3/93/284488 by guest on 22 Novem
ber 2018

Journal of Chromatographic Science, Vol. 39, March 2001
99
confused with that of G. lucidum. Based on the results of theHPLC analysis of triterpenoids (Figures 3 and 4), samples ofthese two species from three different regions displayed quitevaried patterns for their distribution of triterpenoid con-tents. This made it easy to distinguish between these twospecies based on this HPLC analysis of triterpenoids. Simi-larly, G. tropicum demonstrated its characteristic patterns inthe HPLC analysis of triterpenoids as well as its differentia-tion from other species.
We also found that two samples with the accession num-bers CCRC-36147 (CBS 194.76) and CCRC-36149(CBS352.74) were labeled as G. resinaceum and showed asimilar HPLC pattern of triterpenoids. However, it was quitedifferent from patterns displayed by the other sample (acces-sion number CCRC-36146, CBS 152.27), which was desig-nated as the same species. This could be the result ofincorrect designation based merely on traditional methodsand further confirms that an HPLC analysis of the triter-
penoid contents of Ganoderma is a supe-rior way to differentiate species—evensubspecies growing in different regions.
Conclusion
In conclusion, an HPLC analysis of thetriterpenoid contents of Ganoderma is asimple and easy method to differentiate thespecies of Ganoderma. This should provebeneficial to the research fields of classifi-cation, biological activity, and structuraldetermination.
Acknowledgments
The financial support from the NationalScience Council of R.O.C. (NSC-88-2143-B038-001, Taipei, Taiwan) is highly appre-ciated.
References
1. J.O. Toth, B. Luu, and G. Ourisson. Lesacides Ganoderiques T à Z: Triterpenescytotoxiques de Ganoderma Lucidum(Polyporacée), Tetrahedron Lett. 24:1081–1084 (1983).
2. H. Kohda, W. Tokumoto, K. Sakamoto,M. Fujii, Y. Hirai, K. Yamasaki, Y. Komoda,H. Nakamura, S. Ishihara, and M. Uchida.The biologically active constitutents of Gan-oderma-lucidum histamine release-inhibitory triterpenes. Chem. Pharm. Bull.33: 1367–74 (1985).
3. A. Morigiwa, K. Kitabatake, Y. Fujimoto,and N. Ikekawa. Angiotensin convertingenzyme-inhibitory triterpenes from Gano-derma-Lucidum. Chem. Pharm. Bull. 34:3025–28 (1986).
4. S. El-Mekkawy, M.R. Meselhy, N. Naka-mura, Y. Tezuka, M. Hattori, N. Kakiuchi,K. Shimotohno, T. Kawahata, and T. Otake.Anti-HIV-1 and anti-HIV-1-protease sub-stances from Ganoderma licidum. Phyto-chemistry 49: 1651–57 (1998).
5. D.H. Kim, S.B. Shim, N.J. Kim, and I.S. Jang.
Table II. HPLC Analysis of the Ganoderic Acids B and C22
Accession B C22Group number Species (mg/g) (mg/g)
K 87-1-1 (K1) G. lucidum 0.0883 0.033487-1-2 (K2) G. lucidum 0.2322 0.067787-1-6 (K3) G. lucidum 0.5104 0.131787-1-9 (K5) G. lucidum 0.1706 0.102788-1-30 (K6) G. lucidum 0.0878 0.028988-1-70 (K7) G. lucidum 0.2516 0.079188-1-76 (K8) G. lucidum 0.1427 0.0722
L 88-1-39 (L1) G. boniense 0.0353 0.026988-1-73 (L2) G. boniense 0.0207 0.0096
M 87-1-8 (M1) G. tropicum 0.0940 0.034387-1-28 (M2) G. tropicum 0.1433 0.082088-1-40 (M3) G. tropicum 0.1416 0.091588-1-57 (M4) G. tropicum 0.1236 0.035688-1-65 (M5) G. tropicum 0.1251 0.105288-1-69 (M6) G. tropicum 0.0974 0.0312
N 88-1-71 (N1) G. farnicatum 0.2504 0.2974
O 87-1-3 (O1) G. tsugae 0.5338 0.229036042 (O2) G. tsugae 0.7030 0.402488-1-56 (O3) G. tsugae 0.6230 0.176488-1-59 (O4) G. tsugae 0.3357 0.327687-1-19 (O5) G. tsugae 0.6585 0.213936090 (O6) G. tsugae 1.5218 0.6401
P 87-1-14 (P1) G. tsugae 0.9697 0.480036065 (P2) G. tsugae 0.2330 0.179788-1-60 (P3) G. tsugae 0.4140 0.332237063 (P4) G. tsugae 1.7319 0.832587-1-13 (P5) G. tsugae 0.1476 0.105136064 (P6) G. tsugae 0.6956 0.253788-1-34 (P7) G. curtisii 0.3039 0.153388-1-37 (P8) G. curtisii 0.8339 0.305888-1-64 (P9) G. curtisii 1.5071 0.812088-1-67 (P10) G. curtisii 0.5221 0.280888-1-68 (P11) G. curtisii 1.2139 0.4062Lai-41 (P12) G. curtisii 1.0997 0.5793
Q 36245 (Q1) G. lobatum 1.8409 1.3198
R 36147 (R1) G. resinaceum 0.2050 0.652536149 (R2) G. resinaceum 0.1141 0.252736152 (R3) G. mirabile 0.0944 0.203336291 (R4) G. oerstedii 0.1108 0.1417
Dow
nloaded from https://academ
ic.oup.com/chrom
sci/article-abstract/39/3/93/284488 by guest on 22 Novem
ber 2018

Journal of Chromatographic Science, Vol. 39, March 2001
100
Beta-glucuronidase-inhibitory activity and hepatoprotective effectof Ganoderma licidum. Biol. Pharma. Bull. 22: 162–64 (1999).
6. S.P. Wasser and A.L. Weis. Therapeutic effects of substancesoccuring in higher basidomycetes mushrooms: a modern per-spective. Critical Rev. Immunol. 19: 65–96 (1999).
7. J.E. Adaskaveg and R.L. Gilbertson. Cultural studies and geneticsof sexuality of Ganoderma-lucidum and Ganoderma-tsuage inrelation to the taxonomy of the Ganoderma-Lucidum complex.Mycologia 78: 694–705 (1986).
8. Z.Y. Yeh. “Taxonomic study of Ganoderma australe complex inTaiwan”. Ph.D. Thesis, Institute of Botany National Taiwan Uni-versity, 1990, p 109.
9. J.E. Adaskaveg and R.L. Gilbertson. Basidiospores, pilocystidia,and other basidiocarp characters in several species of the Gano-derma lucidum complex. Mycologia 80: 493–507 (1988).
10. R.S. Hseu, H.H. Wang, H.F. Wang, and J.M. Moncalvo. Differ-entiation and grouping of isolates of the Ganoderma lucidumcomplex by random amplified polymorphic DNA-PCR comparedwith grouping on the basis of internal transcribed spacersequences. Applied Environ. Microbiol. 62:1354–63 (1996).
11. R.S. Hseu. “An identification system for Ganoderma isolated inTaiwan”. Ph.D. Thesis, Institute of Botany, National Taiwan Uni-versity, Taipein, Taiwan, 1990, p 105.
12. T. Nishitoba, H. Sato, S. Shirasu, and S. Sakamura. Evidence onthe strain-specific terpenoid pattern of Ganoderma-Lucidum.Agric. Biol. Chem. 50: 2151–54 (1986).
13. L.J. Lin and M.S. Shiao. Separation of oxygenated triterpenoidsfrom Ganoderma lucidum by high-performance liquid chro-matography. J. Chromatogr. 410: 195–200 (1987).
14. M. Hirotani and T. Furuya. Changes of the triterpenoid patternsduring formation of the fruit body in Ganoderma lucidum. Phy-tochemistry 29: 3767–71 (1990).
15. C.H. Su, C.S. Sun, S.W. Juan, H.O. Ho, C.H. Hu, and M.T.Sheu. Development of fungal mycelia as skin substitutes: effectson wound healing and fibroblast. Biomaterials 20: 61–68(1999).
Manuscript accepted December 12, 2000.
Dow
nloaded from https://academ
ic.oup.com/chrom
sci/article-abstract/39/3/93/284488 by guest on 22 Novem
ber 2018
Related Documents