High performance hot rolling process through steel grade-dependent influencing of the scale formation and flexible descaling control (Hiperscale) FINAL REPORT Research and Innovation EUR 29535 EN

Welcome message from author
This document is posted to help you gain knowledge. Please leave a comment to let me know what you think about it! Share it to your friends and learn new things together.
Transcript
High performance hot rolling process through steel grade-dependent
influencing of the scale formation and flexible descaling control
(Hiperscale)
FINAL REPORT
Research and Innovation
EUR 29535 EN

High performance hot rolling process through steel grade-dependent influencing
of the scale formation and flexible descaling control
(Hiperscale) European Commission
Directorate-General for Research and Innovation
Directorate D - Industrial Technologies
Unit D.4 — Coal and Steel
Contact Hervé Martin
E-mail [email protected]
European Commission
B-1049 Brussels
Manuscript completed in 2018.
This document has been prepared for the European Commission however it reflects the views only of the authors, and the
Commission cannot be held responsible for any use which may be made of the information contained therein.
More information on the European Union is available on the internet (http://europa.eu).
Luxembourg: Publications Office of the European Union, 2018
PDF ISBN 978-92-79-98327-6 ISSN 1831-9424 doi:10.2777/624530 KI-NA-29-535-EN-N
© European Union, 2018.
Reuse is authorised provided the source is acknowledged. The reuse policy of European Commission documents is regulated by
Decision 2011/833/EU (OJ L 330, 14.12.2011, p. 39).
For any use or reproduction of photos or other material that is not under the EU copyright, permission must be sought directly
from the copyright holders.
All pictures, figures and graphs © VDEh-Betriebsforschungsinstitut GmbH (BFI), RFSR-CT-2014-00010 Hiperscale
European Commission
Research Fund for Coal and Steel High performance hot rolling process
throughsteel grade-dependent influencing of the scale formation and flexible descaling control
(Hiperscale)
Miriam Sartor, Martin Wunde, Andrea Lemke, Delphine Rèche VDEh-Betriebsforschungsinstitut GmbH (BFI) Sohnstr. 65, 40237 Düsseldorf, Germany
Ingo Fricke, Jörg Schilling ArcelorMittal Ruhrort GmbH (AmRu) Vohwinkelstr. 107, 47137 Duisburg, Germany
Michal Pohanka, Miroslav Raudensky Vysokeuceni technicke v Brne (BUT) Antoninska 548/1, 60190 Brno, Czech Republic
Diana Espinosa Centre de Recherches Metallurgiques C.R.M. ASBL (CRM) Bouldevard de la Plaine 5, 1200 Bruxelles, Belgium
Irene Luzzo, Luigi Langelotto, Luigi Zampetti, Guido Jöchler Centro Sviluppo Materiali SPA (CSM) Via die Castel Romano 100, 00128 Roma, Italy
Stéphane Deleuze, Yves Goldblatt, Martin Beck Emuref S.A (Emuref) Rue de Tilleur 23, 4101 Jemeppe, Belgium
Victor Santisteban Sidenor Investigacion y Desarrollo Europa SA (Sidenor) Barrio Ugarte, 48970 Basauri, Spain
John Niska, Annika Nilsson, Jan Niemi Swerea MEFOS AB (Mefos) Arontorpsvagen, 97125 Lulea, Sweden
Didier Farrugia Tata Steel UK Limited, Swinden Technology Centre (Tata) Moorgate Road, S60 3AR Rotherham, UK
Christian Müller ThyssenKrupp Steel Europe (TKSE) Kaiser-Wilhelm-Straße 100, 47166 Duisburg, Germany
Grant Agreement RFSR-CT-2014-00010 01.07.2014 – 31.12.2017
Final report
Directorate-General for Research and Innovation
2018 EUR 29535 EN
3
Table of contents
Page
1. Final Summary 7
1.1 WP 1: Envelope of processing conditions and definition of reference oxide
state (Process_AS_IS) 7
1.1.1 Task 1.1: Acquiring/ Collection of surface impairments and scale-related defects of representative steel grades for scale-relevant investigations 8
1.1.2 Task 1.2: Process envelope and reheating/ descaling scenarios 8
1.1.3 Task 1.3: Methodology and guideline for scale characterisation and through process test matrix 9
1.1.4 Task 1.4: Enhancement of residual scale detection and quantification systems 9
1.1.5 Task 1.5: Development of regime maps for Process AS_IS 9
1.2 WP2: Conditioning of primary oxide scale and scale-metal interface during reheating 10
1.2.1 Task 2.1: Laboratory investigations on primary scale formation and interfacial effects (without coatings) 10
1.2.2 Task 2.2: Development of scale conditioning coatings, properties and application methods 11
1.2.3 Task 2.3: Laboratory investigations on primary scale conditioning (with coatings) 11
1.2.4 Task 2.4: Modelling of the primary scale oxidation processes for selected steel grades with/ without coating 12
1.2.5 Task 2.5: Pilot plant and industrial investigations on primary scale formation by the presence of scale conditioning coatings 13
1.2.6 Task 2.6: Selection of best coating for primary scale conditioning regarding oxidation, decarburisation and oxide-scale interface control 13
1.3 WP 3: Determination of descalability and post-descaling effects on scale re-growth using standard descaling conditions and rolling practices 14
1.3.1 Task 3.1: Laboratory investigation of effect of coating on descalability 14
1.3.2 Task 3.2: Quantification of effect of scale conditioning coating on descalability for all selected steel grades in pilot plants 14
1.3.3 Task 3.3: Laboratory and pilot investigations on scale re-growth and interfacial effects 15
1.4 WP 4: Optimisation of descaling strategies and development of new descaling technologies 15
1.4.1 Task 4.1: Investigations of new, promising descaling technologies and
development of methods for evaluation of the descaling efficiency 16
1.4.2 Task 4.2: Investigations on improved flexible and steel-grade dependent
primary descaling strategies 16
1.4.3 Task 4.3: Pilot plant and industrial descaling trials for validation of innovative descaling strategies and evaluation of impact on resource efficiency 17
1.5 WP 5: Synergistic and economical approach for controlled scale formation and flexible descaling strategies (Process_HI_PER) 17
1.5.1 Task 5.1: Determination of individual and combined effects (synergy) on
scale formation and descalability 17
1.5.2 Task 5.2: Verification of approaches for improved hot rolling and cleaner surfaces including validation of the material models 18
1.5.3 Task 5.3: Compilation of regime maps (Process_HI_PER) and guidelines for technological and economic feasible transfer to industry 18
4
1.6 WP 6: Management and reporting 18
2. Scientific and technical description of results 19
2.1 Objectives of the project 19
2.2 State-of-the-Art 21
2.3 Description of activities and discussion 23
2.3.1 Collection of information on Process_AS_IS at the steel companies (WP 1) 23
2.3.1.1 Definition of key production indicators for the rolling process regarding the surface quality (KPI) (Task 1.1, Task 1.2, Task 1.5) 23
2.3.1.2 Compilation of regime maps for the descalability Process_AS_IS (Task 1.5) 24
2.3.2 Procedure for scale characterisation (Task 1.3) 29
2.3.2.1 Characterisation of primary scale formation and decarburisation in TGA (to Task 2.1, Task 2.2 and Task 2.4) (preparation of testing procedure by Tata
and BFI) 29
2.3.2.2 Heating microscopy (to Task 2.1 and Task 2.3) (preparation of testing procedure by Tata) 31
2.3.2.3 Hot screening tests for determination of scale conditioning coating efficiency (coating pre-screening) (to Task 2.1 and Task 2.3) (preparation of testing
procedure by BFI) 32
2.3.2.4 Characterisation of scale re-growth and blister formation (to Task 3.1, Task 3.2) (preparation of testing procedure by Mefos) 33
2.3.2.5 Characterisation of the scale-metal interface (to Task 2.1, Task 2.3, Task 3.1, Task 3.3.) (preparation of testing procedure by CRM) 34
2.3.2.6 Scale detection systems (Task 1.4, Task 5.1, Task 5.2) 37
2.3.3 Procedure for investigations on descalability (WP 3, Task 3.1, Task 3.2) 38
2.3.3.1 Descalability after hot deposition of the coatings (CRM) 38
2.3.3.2 Descalability after cold deposition of the coatings (BFI) 39
2.3.3.3 Characterisation of descalability (Hot bending tests) (Mefos) 40
2.3.4 Procedure for investigations on descaling efficiency (WP 4, Task 4.1, Task 4.2) 41
2.3.4.1 Impact pressure distribution measurements (BUT) 42
2.3.4.2 Erosion measurements (BUT, BFI) 43
2.3.4.2.1 Conventional erosion measurement with aluminium plate (BUT) 43
2.3.4.2.2 Development of an alternative erosion test - procedure (BFI) 44
2.3.4.2.3 Descaling of hot oxidised surface (BUT) 46
2.3.4.2.4 Measurement of impact force in overlap for cold samples (BUT) 47
2.3.4.3 Heat transfer coefficient measurements (BUT) 48
2.3.4.4 Cooling homogeneity measurements (BUT) 49
2.3.4.5 Hot quality measurements (BUT) 50
2.3.5 Modelling of scale formation and descalability (to WP 2, Task 2.4, WP 3, Task 3.3, WP 4, Task 4.2) 51
2.4 Conclusions 53
2.4.1 Primary oxide scale formation without coatings (WP 2, Task 2.1) 53
2.4.1.1 Primary oxide scale formation (Tata) 53
2.4.1.2 Influence of process conditions during reheating and the amount of scale – Thermo-gravimetric analyses and industrial test (pilot conditions) (Tata, Sidenor, BFI) 54
5
2.4.1.3 Influence of initial surface on scale formation on NGO B24 (Tata 1), AmRu 2, TKSE 1, (BFI, CRM) 58
2.4.1.4 Detection and classification of scale residues in industrial (TKSE) and pilot
(Tata) mill (BFI) 59
2.4.1.5 Influence of alloying elements on scale formation (CRM) 62
2.4.1.6 Simulation of scale spallation for uncoated material – modelling (BFI) 63
2.4.1.7 Summary of results in investigations on oxidation processes without scale conditioning coatings 64
2.4.2 Development of oxide scale conditioning coatings and application technology (WP2, Task 2.2) 65
2.4.2.1 Coating development 65
2.4.2.2 Application of coatings (WP 2, Task 2.2, Task 2.5, WP 5 Task 5.1, Task 5.2) 67
2.4.2.2.1 Application technology (CRM, Emuref) 67
2.4.2.2.2 Safety and health during spraying 69
2.4.3 Influence of oxide scale conditioning coatings on oxidation processes
(WP 2, Task 2.3 to Task 2.6) 73
2.4.3.1 Testing conditions 73
2.4.3.2 Efficiency of coatings regarding decarburisation – long products (BFI, Sidenor, CSM) 74
2.4.3.3 Efficiency of coatings regarding scale formation – flat products (CRM, BFI, CSM, Tata, Mefos) 75
2.4.3.4 Incremental castings (CRM) 80
2.4.3.5 Influence of coating on emissivity (Tata) 81
2.4.3.6 Influence of coatings on heat transfer / thermodynamic (CSM) 83
2.4.3.7 Influence of coatings on refractory material (Tata) 87
2.4.3.8 Overall conclusions on coating efficiency 89
2.4.4 Descalability and scale re-growth (WP 3) 90
3.5.4.1 Descalability with / without coatings for flat products (Task 3.1 to 3.3) 90
2.4.4.1.1 Descalability and scale re-growth trials with steel grade Tata 1 (CRM, Tata) 90
2.4.4.1.2 Descalability trials with steel grade AmRu 2 and TKSE 1 (BFI) 93
2.4.4.1.3 Descalability trials with SSAB 1 steel grade (Mefos) 97
2.4.4.1.4 Secondary scale growth and hot rolling trials on blister formation during subsequent descaling/ rolling passes (Task 3.3), (Mefos) 98
2.4.4.2 Overall conclusions on descalability when applying coatings 101
2.4.5 New descaling technologies and strategies (WP 4, Task 4.1 to 4.3) 102
2.4.5.1 Innovative testing method for reproducible erosion of a plate by water pressure (WP 4, Task 4.1), (BFI) 102
2.4.5.2 Investigations on improved flexible and steel-grade dependent primary scale
descaling strategies (WP 4, Task 4.2, Task 4.3), (BUT, Lechler) 104
2.4.5.2.1 Innovative nozzle development (BUT, Lechler) 104
2.4.5.2.2 Influence of descaling process conditions on descaling efficiency (BUT, Lechler) 107
2.4.5.2.3 Steel grade dependent descaling (BUT) 111
2.4.5.2.4 Pre-cooling strategy to increase descalability (CSM) 112
2.4.5.3 Validation of innovative descaling strategies (WP 4, Task 4.3), (BUT, CSM) 114
2.4.5.3.1 Pulsating water jets in pilot trials (BUT) 114
2.4.5.3.2 Validation of the pre-cooling system and compilation of descaling regime maps (CSM) 115
2.4.5.4 Overall conclusion on innovative descaling strategies 117
2.5 Exploitation and impact of the research results 119
6
2.5.1 Effects on oxidation behaviour and descalability in industrial verification (WP5, Task 5.1, Task 5.2) 119
2.5.1.1 Industrial trials on scale monitoring at SSAB roughing mill in Raahe (Mefos) 119
2.5.1.2 Verification trials for approaches for improved hot rolling and cleaner surfaces by application of coatings 123
2.5.1.2.1 General coating application and utilisation (CRM, Emuref) 123
2.5.1.2.2 Industrial trials on coating application with a test plant of Emuref (Sidenor) 125
2.5.1.2.3 Installation of a spraying plant and industrial trials on coating application (AmRu, BFI) 129
2.5.1.3 Industrial trials with optimised descaling nozzles (TKSE, BFI, Lechler) 130
2.5.1.4 Industrial trials with optimised descaling strategy (CSM) 131
2.5.1.5 Summary on strategies to improve the oxidation behaviour (compiled by BFI) 133
2.5.2 Combined effects on improved hot rolling and cleaner surfaces (Task 5.1) 133
2.5.2.1 Modelling results and their validation (compiled by BFI) 134
2.5.2.2 Key production indicators (compiled by BFI) 135
2.5.2.3 Descaling regime maps (compiled by BFI) 136
2.5.3 Guidelines for technological and economic feasible transfer to industry (WP 5, Task 5.3) 137
2.5.3.1 Application of coatings (Emuref) 137
2.5.3.2 Guidelines for handling scale conditioning coatings and utilisation of improved descaling equipment (Task 5.3), (all partners, compiled by BFI) 139
2.5.3.3 Do’s and Don’ts (WP 5, Task 5.3), (all partners, compiled by BFI) 143
2.5.3.4 Economic evaluation (WP 5, Task 5.3) 146
2.5.3.5 Rough cost estimation for the application of coatings (Emuref) 146
2.5.3.6 Rough cost estimation for new descaling nozzles (Lechler) 148
2.5.4 Publications 148
2.5.5 Seminar 148
List of Figures 151
List of Tables 157
List of Acronyms and Abbreviations 159
List of References 161
7
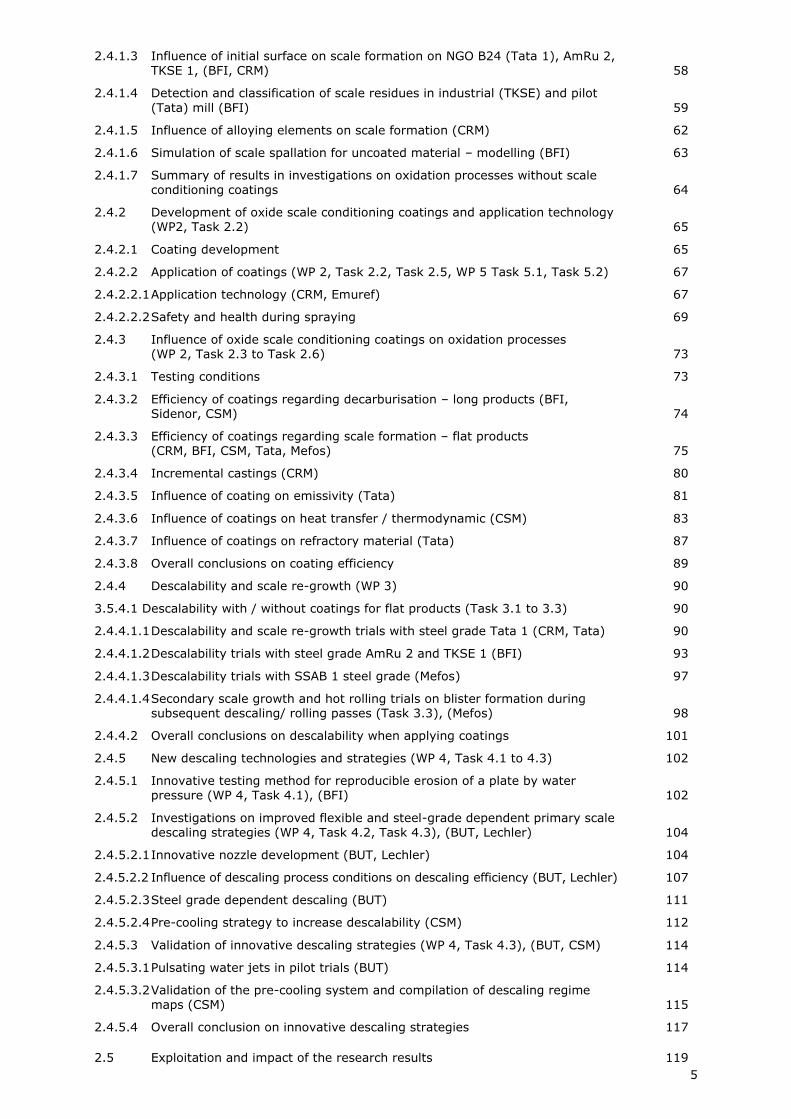
1. Final Summary
The project HiPerScale dealt with the developing of an integrated, energy efficient and flexible
approach to influence oxidation, decarburisation, overall descalability and surface quality for
difficult to descale steel grades (e.g. alloyed with Si, Cr, Mn). This was done by studying the
reheating processes in order to better understand the interdependencies, the scale formation
conditions, application of scale conditioning coatings and improvements on descaling technologies.
Figure 1 shows the structure of the project.
Figure 1: Structure of the project HiPerScale, (compiled by BFI)
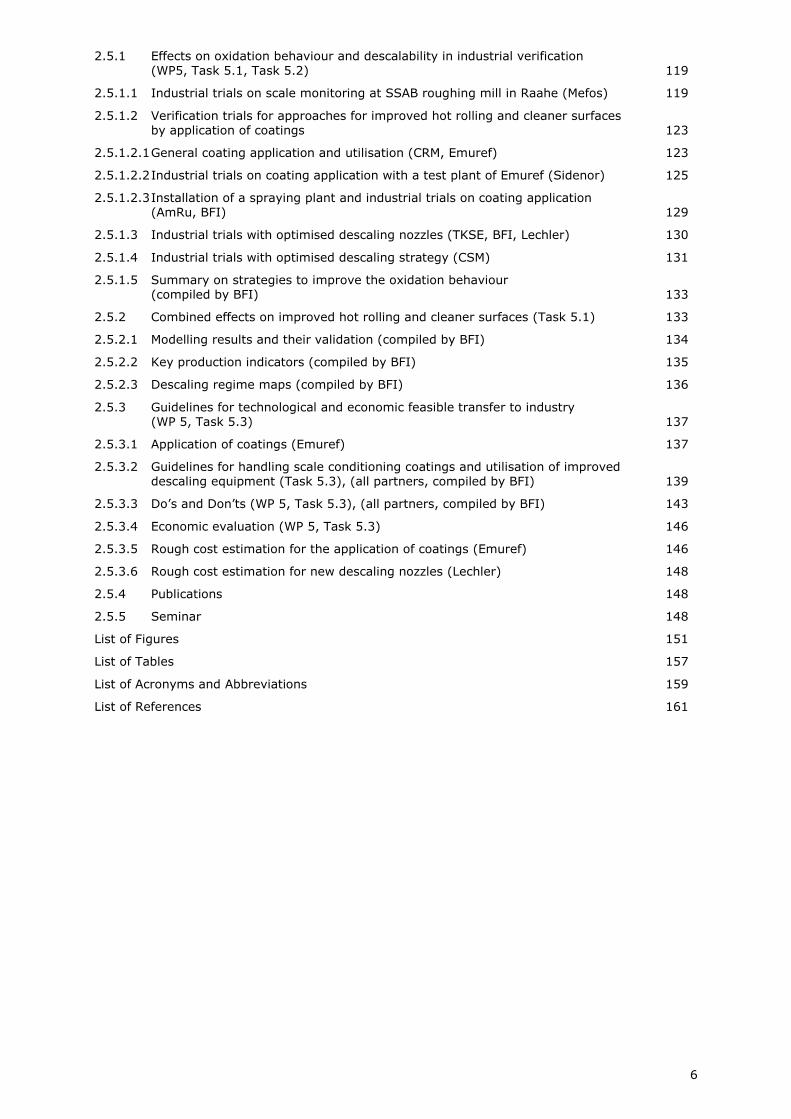
1.1 WP 1: Envelope of processing conditions and definition of reference
oxide state (Process_AS_IS)
WP 1 enveloped the processing conditions from reheating to finished products for a range of
difficult to descale steel grades from each of the participating steel producer (ArcelorMittal - AmRu,
Sidenor, Tata, TKSE, SSAB). This work package was important to evaluate the achieved process
efficiency at the end of the project. The structure of WP 1 is shown in Figure 2.
Figure 2: Structure of Work package 1
(SP = steel producer, RI = research institute), (compiled by BFI)
8
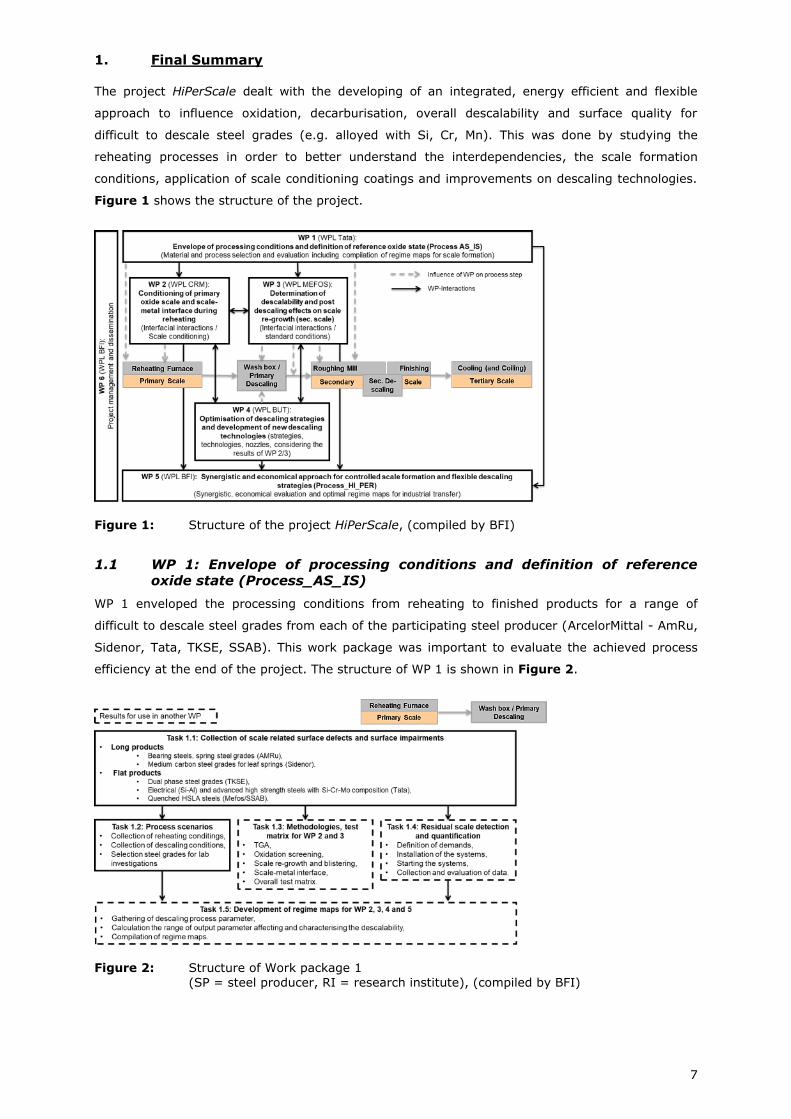
1.1.1 Task 1.1: Acquiring/ Collection of surface impairments and scale-related
defects of representative steel grades for scale-relevant investigations
This task aimed on a selection and characterisation of representative steel grades which cause
difficulties during descaling / rolling in terms of their descalability and tendency for oxidation
related defects. A summary of the collected information is given in Table 1.
Table 1: Overview on selected steel grades and oxidation related problems, (compiled by BFI)
Industrial partner Selected Steel Grade Main oxidation related problem
Type C-content [%]
Main alloying elements
Abbre- viation
Lo
ng
pro
d. AmRu Spring Steel 0.51 - 0.59 Si, Cr AmRu 2 decarburisation
Sidenor Leaf Spring Steel Cr, V Sidenor 1 decarburisation
Fla
t p
ro
du
cts
Tata Electrical Steel 0.0022 Si, Mn, Al Tata 1 NGO B24
Scale related defects; descalability
TKSE Dual Phase Steel 0.17 Si, Mn TKSE 1 Scale related defects; descalability
SSAB HSLA Nb, V, Ti SSAB 1 Scale related defects; descalability
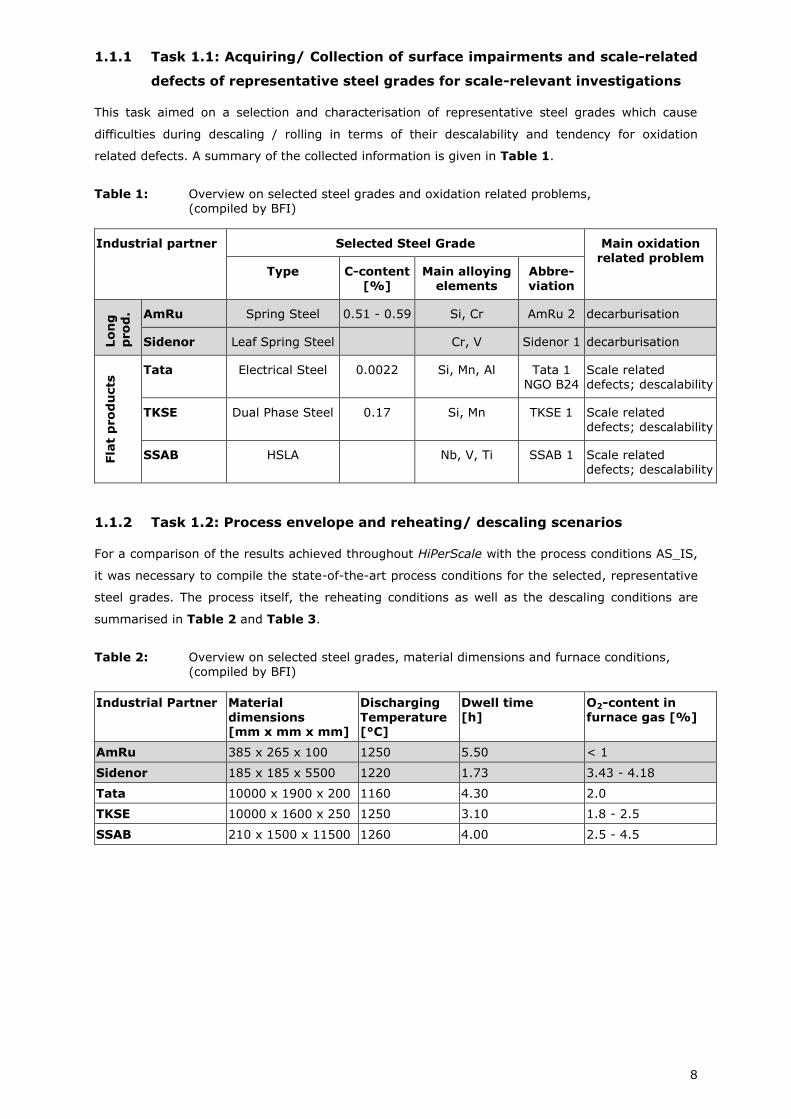
1.1.2 Task 1.2: Process envelope and reheating/ descaling scenarios
For a comparison of the results achieved throughout HiPerScale with the process conditions AS_IS,
it was necessary to compile the state-of-the-art process conditions for the selected, representative
steel grades. The process itself, the reheating conditions as well as the descaling conditions are
summarised in Table 2 and Table 3.
Table 2: Overview on selected steel grades, material dimensions and furnace conditions, (compiled by BFI)
Industrial Partner Material
dimensions [mm x mm x mm]
Discharging
Temperature [°C]
Dwell time [h]
O2-content in furnace gas [%]
AmRu 385 x 265 x 100 1250 5.50 < 1
Sidenor 185 x 185 x 5500 1220 1.73 3.43 - 4.18
Tata 10000 x 1900 x 200 1160 4.30 2.0
TKSE 10000 x 1600 x 250 1250 3.10 1.8 - 2.5
SSAB 210 x 1500 x 11500 1260 4.00 2.5 - 4.5
9
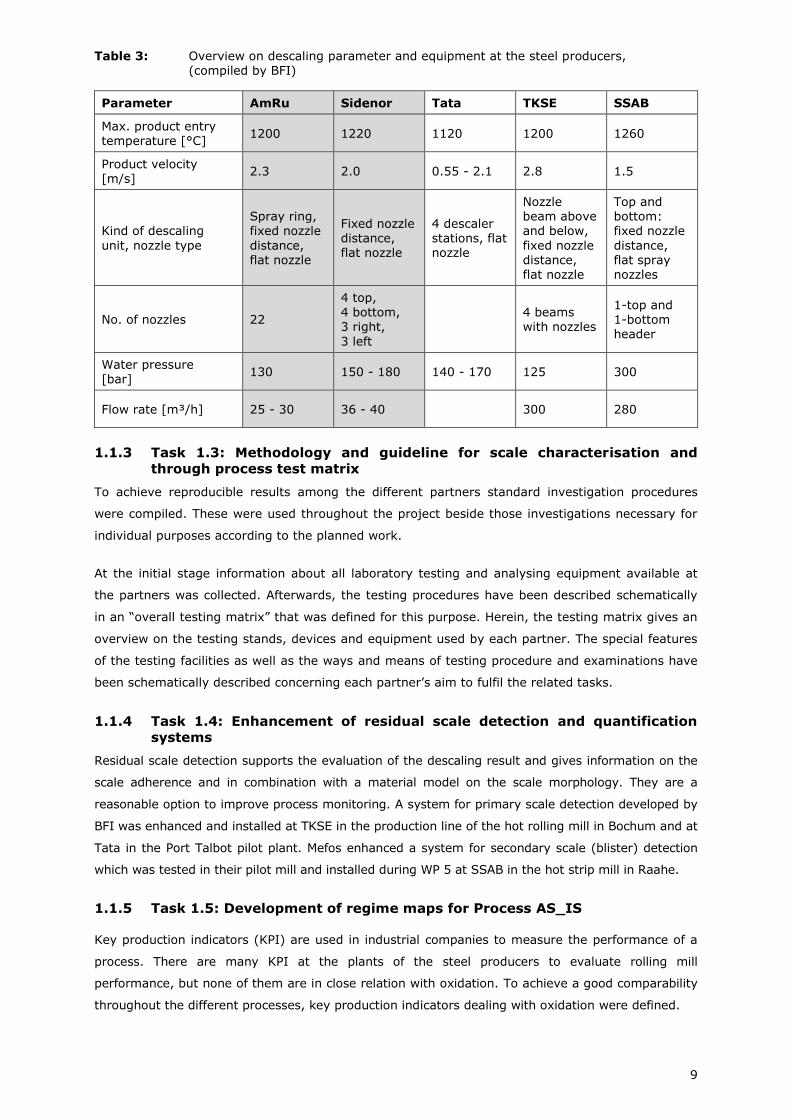
Table 3: Overview on descaling parameter and equipment at the steel producers, (compiled by BFI)
Parameter AmRu Sidenor Tata TKSE SSAB
Max. product entry temperature [°C]
1200 1220 1120 1200 1260
Product velocity [m/s]
2.3 2.0 0.55 - 2.1 2.8 1.5
Kind of descaling
unit, nozzle type
Spray ring, fixed nozzle
distance, flat nozzle
Fixed nozzle distance, flat nozzle
4 descaler stations, flat nozzle
Nozzle beam above and below,
fixed nozzle distance, flat nozzle
Top and bottom: fixed nozzle
distance, flat spray nozzles
No. of nozzles 22
4 top, 4 bottom, 3 right,
3 left
4 beams with nozzles
1-top and 1-bottom header
Water pressure [bar]
130 150 - 180 140 - 170 125 300
Flow rate [m³/h] 25 - 30 36 - 40 300 280
1.1.3 Task 1.3: Methodology and guideline for scale characterisation and
through process test matrix
To achieve reproducible results among the different partners standard investigation procedures
were compiled. These were used throughout the project beside those investigations necessary for
individual purposes according to the planned work.
At the initial stage information about all laboratory testing and analysing equipment available at
the partners was collected. Afterwards, the testing procedures have been described schematically
in an “overall testing matrix” that was defined for this purpose. Herein, the testing matrix gives an
overview on the testing stands, devices and equipment used by each partner. The special features
of the testing facilities as well as the ways and means of testing procedure and examinations have
been schematically described concerning each partner’s aim to fulfil the related tasks.
1.1.4 Task 1.4: Enhancement of residual scale detection and quantification
systems
Residual scale detection supports the evaluation of the descaling result and gives information on the
scale adherence and in combination with a material model on the scale morphology. They are a
reasonable option to improve process monitoring. A system for primary scale detection developed by
BFI was enhanced and installed at TKSE in the production line of the hot rolling mill in Bochum and at
Tata in the Port Talbot pilot plant. Mefos enhanced a system for secondary scale (blister) detection
which was tested in their pilot mill and installed during WP 5 at SSAB in the hot strip mill in Raahe.
1.1.5 Task 1.5: Development of regime maps for Process AS_IS
Key production indicators (KPI) are used in industrial companies to measure the performance of a
process. There are many KPI at the plants of the steel producers to evaluate rolling mill
performance, but none of them are in close relation with oxidation. To achieve a good comparability
throughout the different processes, key production indicators dealing with oxidation were defined.
10
Regime maps of descalability for Process_AS_IS as a function of scale morphology and adhesion as
well as the processing conditions for all selected steel grades were developed and issued. These
descaling regime maps (DRM) cover all data related to the descaling process.
1.2 WP2: Conditioning of primary oxide scale and scale-metal interface
during reheating
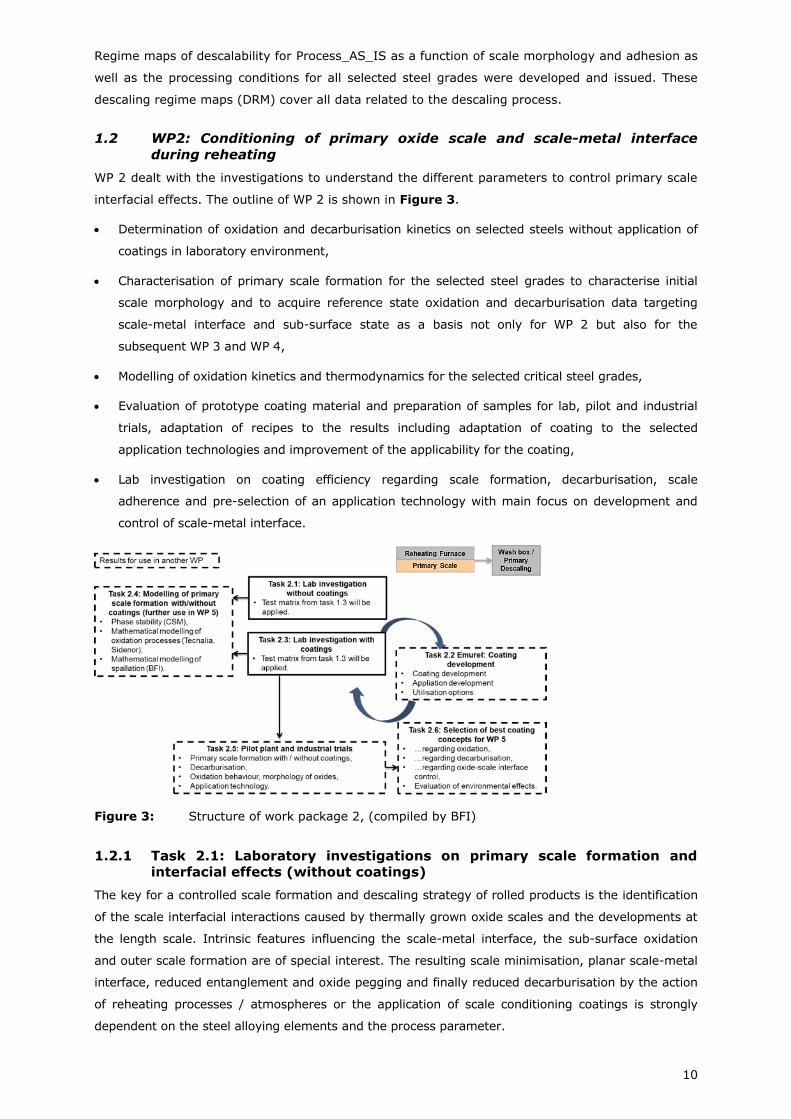
WP 2 dealt with the investigations to understand the different parameters to control primary scale
interfacial effects. The outline of WP 2 is shown in Figure 3.
Determination of oxidation and decarburisation kinetics on selected steels without application of
coatings in laboratory environment,
Characterisation of primary scale formation for the selected steel grades to characterise initial
scale morphology and to acquire reference state oxidation and decarburisation data targeting
scale-metal interface and sub-surface state as a basis not only for WP 2 but also for the
subsequent WP 3 and WP 4,
Modelling of oxidation kinetics and thermodynamics for the selected critical steel grades,
Evaluation of prototype coating material and preparation of samples for lab, pilot and industrial
trials, adaptation of recipes to the results including adaptation of coating to the selected
application technologies and improvement of the applicability for the coating,
Lab investigation on coating efficiency regarding scale formation, decarburisation, scale
adherence and pre-selection of an application technology with main focus on development and
control of scale-metal interface.
Figure 3: Structure of work package 2, (compiled by BFI)
1.2.1 Task 2.1: Laboratory investigations on primary scale formation and
interfacial effects (without coatings)
The key for a controlled scale formation and descaling strategy of rolled products is the identification
of the scale interfacial interactions caused by thermally grown oxide scales and the developments at
the length scale. Intrinsic features influencing the scale-metal interface, the sub-surface oxidation
and outer scale formation are of special interest. The resulting scale minimisation, planar scale-metal
interface, reduced entanglement and oxide pegging and finally reduced decarburisation by the action
of reheating processes / atmospheres or the application of scale conditioning coatings is strongly
dependent on the steel alloying elements and the process parameter.
11
The following aspects were investigated:
Influence of (reheating) process conditions and prediction of scale formation,
Amount of scale formed and characterisation of interfacial interactions,
Microstructural evolution, namely the morphology of the external scale and the internal
precipitates as well as the chemical composition.
The results showed that scale conditioning can be achieved by changing process parameter or even
the steel composition in narrow ranges: The investigations on incremental castings showed that
addition of 0.6 % of Cr to the steel composition to the materials with Si from round about 0.5 to
1.5 % decreases the risk of rough interface steel/scale. The entanglement is reduced remarkable
and the internal oxidation into the substrate is less deep. The oxide thickness is slightly lower when
Cr is added. The initial surface state of the material did not show any difference on scale formation
during reheating at 1180 °C; initial surface did not affect the fayalite formation and the primary
oxide thickness for electrical steels.
1.2.2 Task 2.2: Development of scale conditioning coatings, properties and
application methods
Different steel grades and the different demands of the companies regarding scale conditioning
lead to the demand for the coating supplier to develop different coatings. The results of lab and
pilot trials showed concerning coating application and general utilisation of the coatings:
The coating production was improved and more constant results were achieved. The coatings
show in general good results on minimisation of oxidation and decarburisation. As during the
investigations of the coatings it was found, that a reproducible application was not possible
especially in lab / pilot investigations this was focussed in WP 5.
For industrial application spraying is the best option. It is better to control the pressure of the
application spray than the number of passes. A small change in the speed of the application
has a big effect on the coating thickness and homogeneity.
1.2.3 Task 2.3: Laboratory investigations on primary scale conditioning
(with coatings)
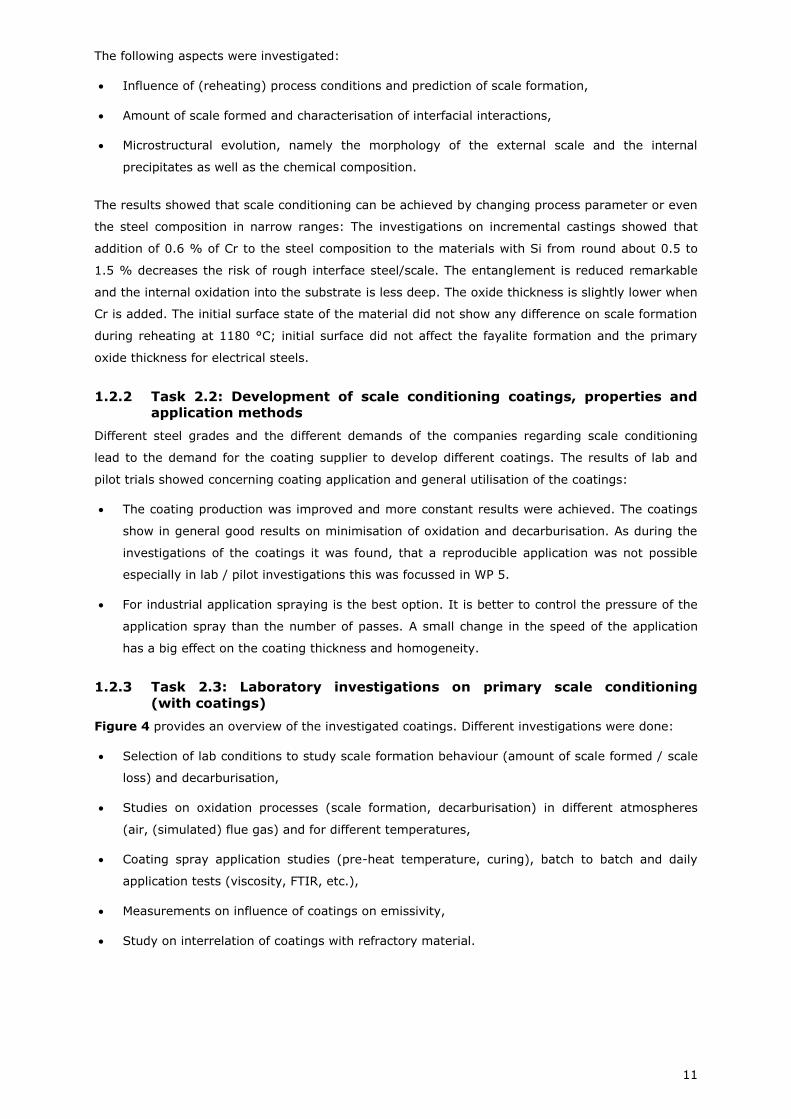
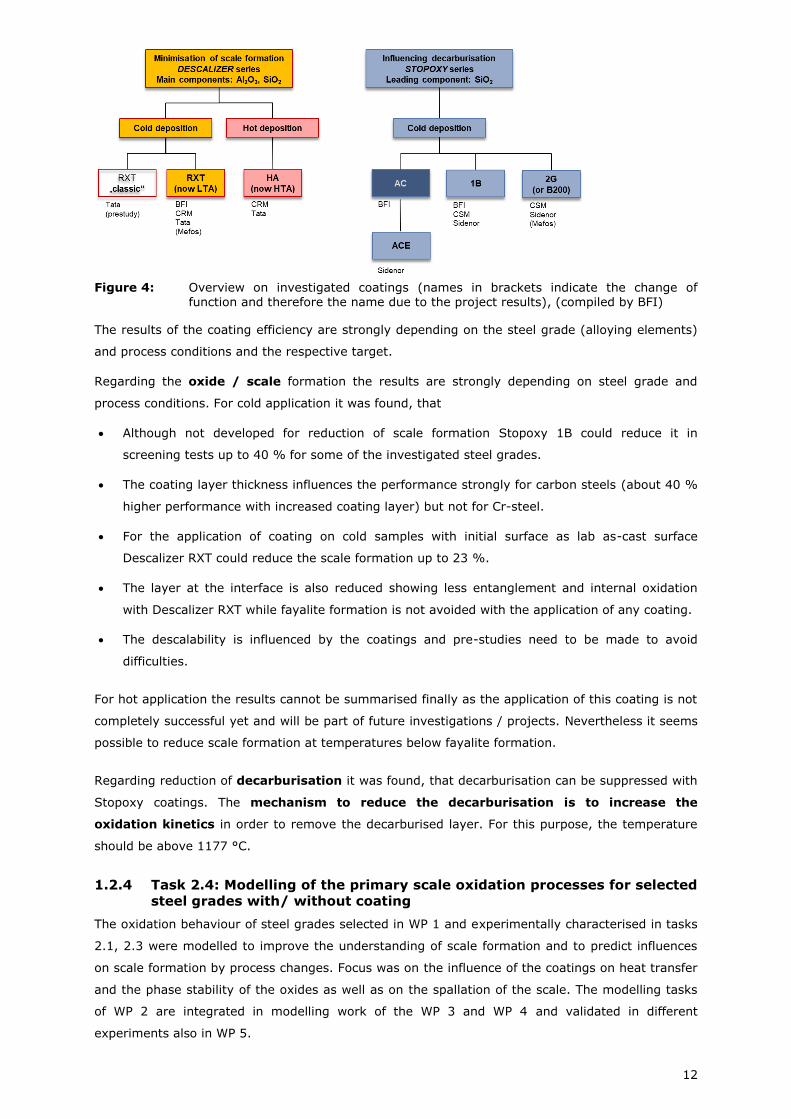
Figure 4 provides an overview of the investigated coatings. Different investigations were done:
Selection of lab conditions to study scale formation behaviour (amount of scale formed / scale
loss) and decarburisation,
Studies on oxidation processes (scale formation, decarburisation) in different atmospheres
(air, (simulated) flue gas) and for different temperatures,
Coating spray application studies (pre-heat temperature, curing), batch to batch and daily
application tests (viscosity, FTIR, etc.),
Measurements on influence of coatings on emissivity,
Study on interrelation of coatings with refractory material.
12
Figure 4: Overview on investigated coatings (names in brackets indicate the change of
function and therefore the name due to the project results), (compiled by BFI)
The results of the coating efficiency are strongly depending on the steel grade (alloying elements)
and process conditions and the respective target.
Regarding the oxide / scale formation the results are strongly depending on steel grade and
process conditions. For cold application it was found, that
Although not developed for reduction of scale formation Stopoxy 1B could reduce it in
screening tests up to 40 % for some of the investigated steel grades.
The coating layer thickness influences the performance strongly for carbon steels (about 40 %
higher performance with increased coating layer) but not for Cr-steel.
For the application of coating on cold samples with initial surface as lab as-cast surface
Descalizer RXT could reduce the scale formation up to 23 %.
The layer at the interface is also reduced showing less entanglement and internal oxidation
with Descalizer RXT while fayalite formation is not avoided with the application of any coating.
The descalability is influenced by the coatings and pre-studies need to be made to avoid
difficulties.
For hot application the results cannot be summarised finally as the application of this coating is not
completely successful yet and will be part of future investigations / projects. Nevertheless it seems
possible to reduce scale formation at temperatures below fayalite formation.
Regarding reduction of decarburisation it was found, that decarburisation can be suppressed with
Stopoxy coatings. The mechanism to reduce the decarburisation is to increase the
oxidation kinetics in order to remove the decarburised layer. For this purpose, the temperature
should be above 1177 °C.
1.2.4 Task 2.4: Modelling of the primary scale oxidation processes for selected
steel grades with/ without coating
The oxidation behaviour of steel grades selected in WP 1 and experimentally characterised in tasks
2.1, 2.3 were modelled to improve the understanding of scale formation and to predict influences
on scale formation by process changes. Focus was on the influence of the coatings on heat transfer
and the phase stability of the oxides as well as on the spallation of the scale. The modelling tasks
of WP 2 are integrated in modelling work of the WP 3 and WP 4 and validated in different
experiments also in WP 5.
13
1.2.5 Task 2.5: Pilot plant and industrial investigations on primary scale
formation by the presence of scale conditioning coatings
The pilot plant (CRM, Tata, TKSE) and industrial investigations (AmRu, Sidenor) were carried out to
study the behaviour of pre-selected coatings at larger scale with the view to propose reheating
strategies to influence scale formation/ behaviour. To avoid any unforeseen difficulties in the
industrial production, for the flat products pilot trials at different pilot plants were performed. For
the long products investigations were directly conducted in the industrial plants.
Pilot investigations on scale morphology confirmed the knowledge gained from the lab
investigations in Task 2.3 that the effect of the coatings is strongly depending on the process and
the investigated steel grade. As an example the different behaviour of TKSE 1 and AmRu 2 can be
given: In case of TKSE 1 samples of Stopoxy AC and 1B the scale detaches near the transition and
form a lower porous layer and an upper dense layer. As a result the silicon rich fayalite phase
remains at the surface and causes the formation of red scale after rolling. In case of AmRu 2
samples of uncoated reference, Stopoxy AC and 1B the scale detaches directly at / near the metal-
scale interface.
Concerning the results on decarburisation the results were very evident and comparable to those
obtained in the lab investigations. Nevertheless also differences between the different steel grades
were observed. For Sidenor 1 only Stopoxy 1B prevents decarburisation, reducing the decarburised
layer to 0 µm on the flat bar surface. For AmRu 2 this was reached with Stopoxy 1B as well as with
Descalizer RXT in the pilot trials.
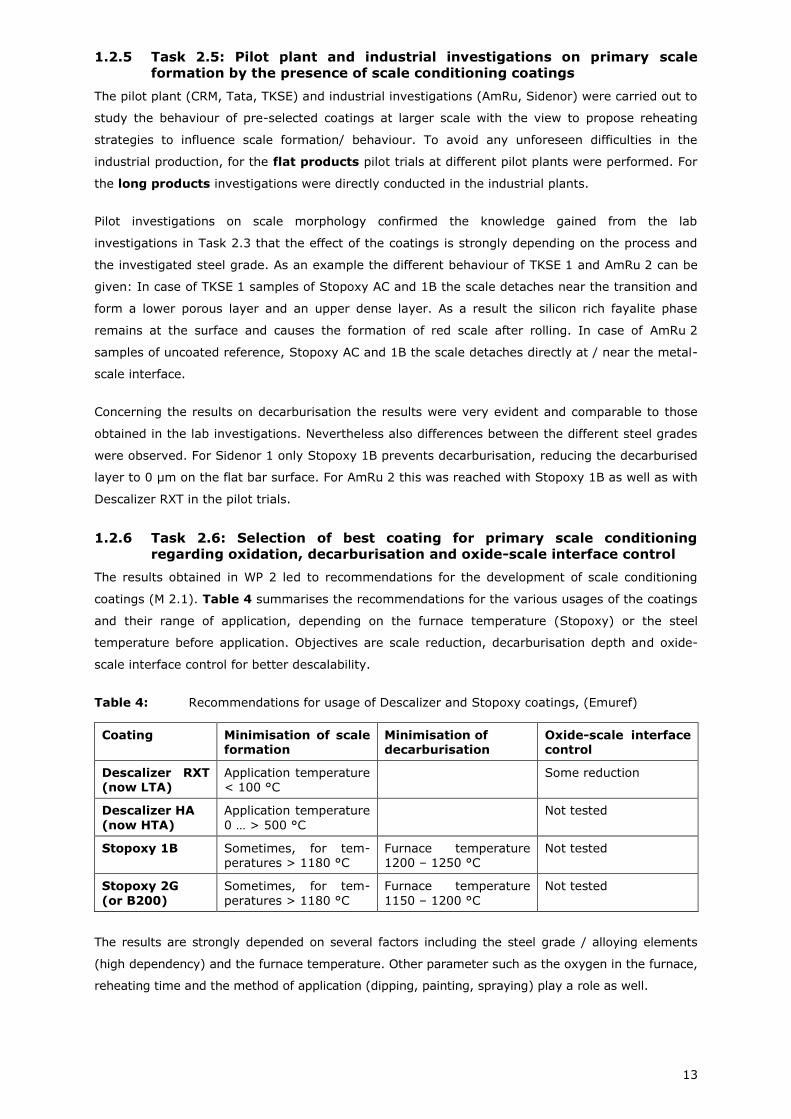
1.2.6 Task 2.6: Selection of best coating for primary scale conditioning
regarding oxidation, decarburisation and oxide-scale interface control
The results obtained in WP 2 led to recommendations for the development of scale conditioning
coatings (M 2.1). Table 4 summarises the recommendations for the various usages of the coatings
and their range of application, depending on the furnace temperature (Stopoxy) or the steel
temperature before application. Objectives are scale reduction, decarburisation depth and oxide-
scale interface control for better descalability.
Table 4: Recommendations for usage of Descalizer and Stopoxy coatings, (Emuref)
Coating Minimisation of scale formation
Minimisation of decarburisation
Oxide-scale interface control
Descalizer RXT (now LTA)
Application temperature < 100 °C
Some reduction
Descalizer HA
(now HTA)
Application temperature
0 … > 500 °C
Not tested
Stopoxy 1B Sometimes, for tem-peratures > 1180 °C
Furnace temperature 1200 – 1250 °C
Not tested
Stopoxy 2G
(or B200)
Sometimes, for tem-
peratures > 1180 °C
Furnace temperature
1150 – 1200 °C
Not tested
The results are strongly depended on several factors including the steel grade / alloying elements
(high dependency) and the furnace temperature. Other parameter such as the oxygen in the furnace,
reheating time and the method of application (dipping, painting, spraying) play a role as well.
14
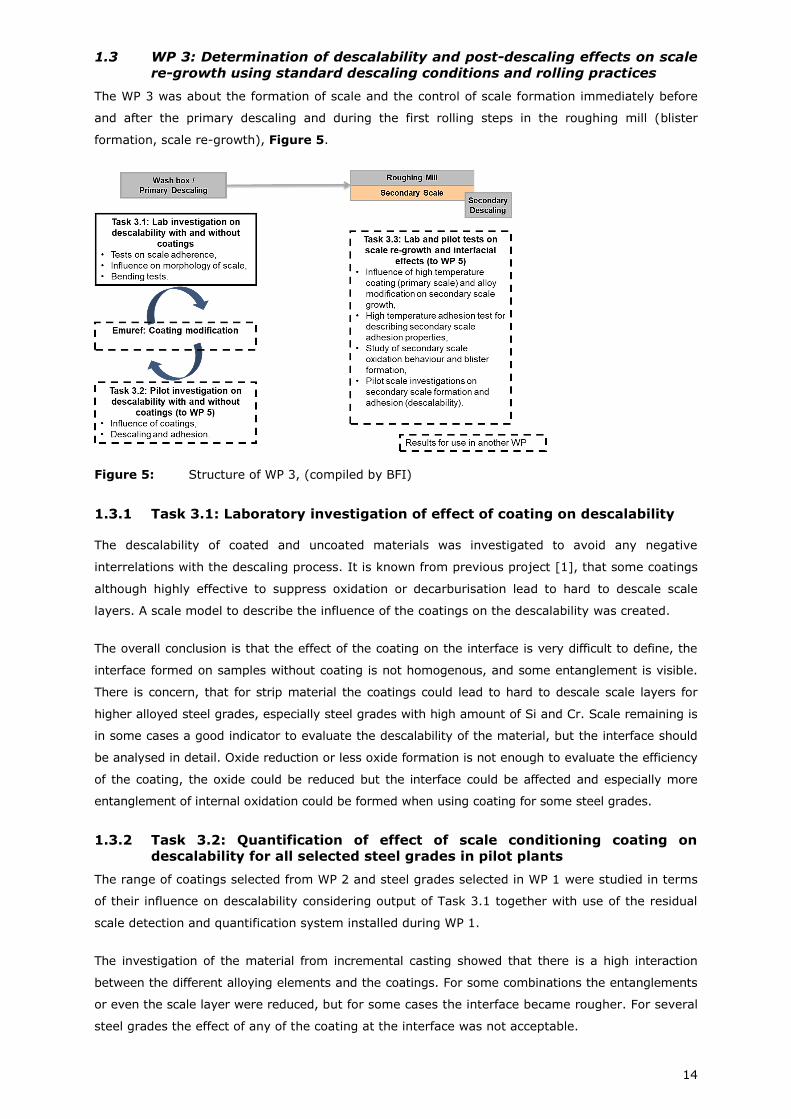
1.3 WP 3: Determination of descalability and post-descaling effects on scale
re-growth using standard descaling conditions and rolling practices
The WP 3 was about the formation of scale and the control of scale formation immediately before
and after the primary descaling and during the first rolling steps in the roughing mill (blister
formation, scale re-growth), Figure 5.
Figure 5: Structure of WP 3, (compiled by BFI)
1.3.1 Task 3.1: Laboratory investigation of effect of coating on descalability
The descalability of coated and uncoated materials was investigated to avoid any negative
interrelations with the descaling process. It is known from previous project [1], that some coatings
although highly effective to suppress oxidation or decarburisation lead to hard to descale scale
layers. A scale model to describe the influence of the coatings on the descalability was created.
The overall conclusion is that the effect of the coating on the interface is very difficult to define, the
interface formed on samples without coating is not homogenous, and some entanglement is visible.
There is concern, that for strip material the coatings could lead to hard to descale scale layers for
higher alloyed steel grades, especially steel grades with high amount of Si and Cr. Scale remaining is
in some cases a good indicator to evaluate the descalability of the material, but the interface should
be analysed in detail. Oxide reduction or less oxide formation is not enough to evaluate the efficiency
of the coating, the oxide could be reduced but the interface could be affected and especially more
entanglement of internal oxidation could be formed when using coating for some steel grades.
1.3.2 Task 3.2: Quantification of effect of scale conditioning coating on
descalability for all selected steel grades in pilot plants
The range of coatings selected from WP 2 and steel grades selected in WP 1 were studied in terms
of their influence on descalability considering output of Task 3.1 together with use of the residual
scale detection and quantification system installed during WP 1.
The investigation of the material from incremental casting showed that there is a high interaction
between the different alloying elements and the coatings. For some combinations the entanglements
or even the scale layer were reduced, but for some cases the interface became rougher. For several
steel grades the effect of any of the coating at the interface was not acceptable.
15
1.3.3 Task 3.3: Laboratory and pilot investigations on scale re-growth and
interfacial effects
The primary descaling with and without application of coating was studied in order to determine the
scale re-growth after descaling, blister formation and the secondary scale formation within the first
1-2 rolling passes. The work proved also that no components of the coating migrate into the sub-
surface and have an effect on secondary scale formation.
There were no significant differences to observe for the oxide behaviour between the different
coatings applied and the different materials treated. The surface after descaling and rolling is
homogenous; the primary oxide is mainly removed homogenously in the descaling step. During the
rolling trials no batches or blisters were visible after rolling. The adherence of the oxide when using
coating seems to be affected and higher entanglement creates oxide difficult to remove which is in
line with the results obtained in Task 3.1 and 3.2. Nevertheless coating residues are not visible on
any of the cross-sections.
When going deeper into the secondary scale formation it was found, that the growths mechanisms
for the powdery red scale do not require deformation or a crushing of the surface oxides during
rolling as it was formed also in the resistive heating trials. The results on blistering showed that a
temperature below 900 °C did not create any blisters. The first blisters appeared at a temperature
of about 920 °C and higher. At the higher temperatures of 980 and 1020 °C, the blister formation
was rapid and the small blisters grew together after a while. The model for the blister formation
gave realistic indications for the amount of surface covered and the number of blisters.
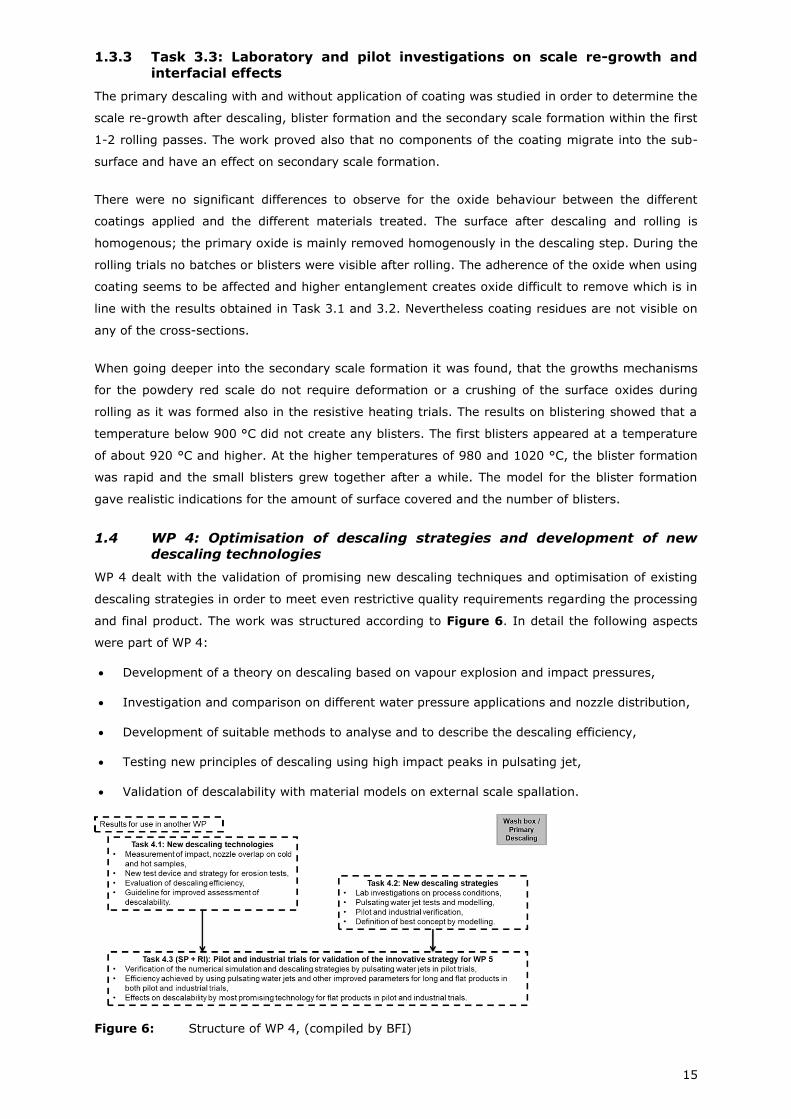
1.4 WP 4: Optimisation of descaling strategies and development of new
descaling technologies
WP 4 dealt with the validation of promising new descaling techniques and optimisation of existing
descaling strategies in order to meet even restrictive quality requirements regarding the processing
and final product. The work was structured according to Figure 6. In detail the following aspects
were part of WP 4:
Development of a theory on descaling based on vapour explosion and impact pressures,
Investigation and comparison on different water pressure applications and nozzle distribution,
Development of suitable methods to analyse and to describe the descaling efficiency,
Testing new principles of descaling using high impact peaks in pulsating jet,
Validation of descalability with material models on external scale spallation.
Figure 6: Structure of WP 4, (compiled by BFI)
16
1.4.1 Task 4.1: Investigations of new, promising descaling technologies and
development of methods for evaluation of the descaling efficiency
In general it was found, that the investigations on descaling efficiency are difficult due to the low
comparability of the testing conditions, e.g. it is difficult to investigate new nozzles as the spray
produced is varying when the spray direction is not perfectly aligned with the axis of the nozzle and
the spray may not hit the point on the surface where the nozzles is aiming. The twist angle also
varies when various nozzles are placed into the same holder.
Evaluation of efficiency of a descaling technology is mainly carried out by impact force
measurements on aluminium or steel substrates with different microstructural state, e.g. different
levels of decarburisation. It was supposed, that the decarburisation of the subsurface also
influences scale adherence and descalability, respectively. Results showed that adjusted (in water
droplet size and velocity) water jet impact lead to higher forces on the surface and can highly
improve the descaling efficiency.
Erosion on aluminium plate caused by high velocity spray from descaling nozzle may not always
correspond to impact pressure distribution. In case of collision of two water streams from
neighbouring nozzles the impact pressure is increased but erosion is decreased. This confirms the
theory that the impact pressure is not the only one important parameter but the structure of the
jet is also important. The above observations confirm the need of the development of a composite
which represents the scale better than the aluminium material.
Further aspects on descaling quality were found:
Overcooling in overlap can be significantly reduced when twist angle is set to zero.
Descaling quality in overlap and washout areas was studied during hot descaling test. It was
found that the homogeneity is strongly dependent on oxidation temperature and steel grade.
Hot descaling tests confirmed that impact pressure is important parameter for quality of
descaling. Higher impact pressure results in better descaling quality.
Worn nozzles have increased spray angle and reduced impact pressure. The spray width was
increased by 25 % and impact pressure was reduced by 16 %.
Latest generation of hydrodynamic nozzles showed better performance than standard descaling
nozzles for certain conditions but these conditions are not typical for plant conditions. The
performance still needs extensive development work.
1.4.2 Task 4.2: Investigations on improved flexible and steel-grade dependent
primary descaling strategies
Modelling of descaling requires knowledge of mechanical and thermo-physical properties of scales.
Because these material properties can hardly be found in literature two types of experiments were
designed to measure some of these mechanical and thermo-physical material properties.
A new method for measuring thermo-physical properties of scale layer on steel substrate was
developed. The obtained thermal conductivity is smaller than values found in literature because
published values are mainly for sintered scales but the scales measured were porous. The pores
represent 37 % of total volume which significantly reduces the thermal conductivity.
Further a FE model of thermo-mechanical evolution of the scale during descaling has been
developed. The model has been applied to support the design of an innovative descaling system
17
based on a pre-cooling step. The model indicates that the pre-cooling technique is efficient and
advantageous to apply. This is especially true if damage penetration in scale thickness obtained by
pre-cooling is greater than that obtained without it.
1.4.3 Task 4.3: Pilot plant and industrial descaling trials for validation of
innovative descaling strategies and evaluation of impact on resource
efficiency
Pilot plant investigations were performed in order to validate the selected techniques and
parameter in terms of their specific (steel-grade dependent) descaling strategies. In some plants
(e.g. TKSE) the descaling equipment in the pilot plants were altered according to the results of the
previous tasks. The pilot and industrial trials (WP 5) will improve the technology and verification of
the obtained results regarding different aspects from validation of the simulation to the efficiency
of pulsating water jets and pre-cooling system and the implementation of new nozzles.
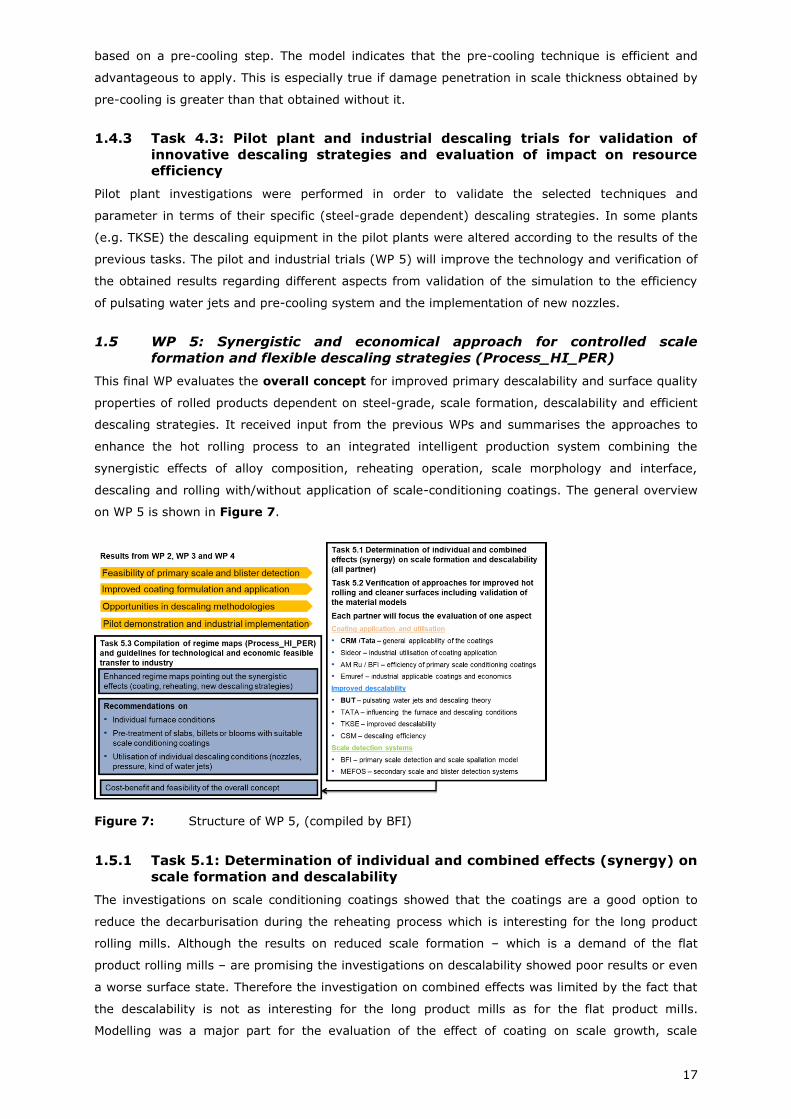
1.5 WP 5: Synergistic and economical approach for controlled scale
formation and flexible descaling strategies (Process_HI_PER)
This final WP evaluates the overall concept for improved primary descalability and surface quality
properties of rolled products dependent on steel-grade, scale formation, descalability and efficient
descaling strategies. It received input from the previous WPs and summarises the approaches to
enhance the hot rolling process to an integrated intelligent production system combining the
synergistic effects of alloy composition, reheating operation, scale morphology and interface,
descaling and rolling with/without application of scale-conditioning coatings. The general overview
on WP 5 is shown in Figure 7.
Figure 7: Structure of WP 5, (compiled by BFI)
1.5.1 Task 5.1: Determination of individual and combined effects (synergy) on
scale formation and descalability
The investigations on scale conditioning coatings showed that the coatings are a good option to
reduce the decarburisation during the reheating process which is interesting for the long product
rolling mills. Although the results on reduced scale formation – which is a demand of the flat
product rolling mills – are promising the investigations on descalability showed poor results or even
a worse surface state. Therefore the investigation on combined effects was limited by the fact that
the descalability is not as interesting for the long product mills as for the flat product mills.
Modelling was a major part for the evaluation of the effect of coating on scale growth, scale
18
characteristics and sub surface degradation. It demonstrated that the presence of silicon oxide in
the coating increases the amount of fayalite as observed during the trials.
1.5.2 Task 5.2: Verification of approaches for improved hot rolling and cleaner
surfaces including validation of the material models
The three different aspects
Secondary scale detection systems,
Coating application and utilisation,
Improved descalability
were focused during the verification trials. The trials led to the compilation of key production
indicators (KPI) and descaling regime maps (DRM) for the Process_HI_PER evaluating also the
combined effects on hot rolling and cleaner surfaces. The work was done by an installation of a
pilot secondary scale detection system at SSAB roughing mill in Raahe, industrial trials for coating
application at the site of Sidenor, the installation of a spraying plant and regular utilisation of
coatings at AmRu as well as the installation of new nozzles in the descaling plant of TKSE as well as
the compilation of descaling regime maps and isoenergy maps in pilot trials at CSM.
1.5.3 Task 5.3: Compilation of regime maps (Process_HI_PER) and guidelines
for technological and economic feasible transfer to industry
All outputs from previous tasks were used to issue KPIs, DRMs cost/ performance, feasibility and
transfer technology for definition of new production guidelines (Process_HI_PER) giving steel
companies hints to improve their existing guidelines for descaling critical (difficult to descale) steel
grades and to improve steel-grade- and process-dependent handling of the production process.
Beside the technical results also an economical benchmark of the new, intelligent through process
strategy was conducted. A SWOT technique summarising technical and economic Strength,
Weakness, Opportunities and Threats (SWOT) of output of project was issued. For the coating
supplier Emuref the outcome of the HiPerScale is the knowledge about the operation conditions for
the products depending on the industrial conditions.
All results were presented in a seminar on “Oxide formation and flexible descaling during steel
processing" with more than 60 participants.
1.6 WP 6: Management and reporting
The work package included coordination of work, organisation of meetings and reporting.
Additionally to the half-year meetings, several telephone and web conferences were held. For
project management, an internet-based platform was arranged and used. This internet-based
system allowed all partners to follow the progress of work and to store, organise, access and share
all necessary information. To improve the cooperation between the research institutes, the rolling
mills and the coating supplier a “memorandum of understanding” was compiled. Project results
were presented on conferences and a workshop / seminar was held at the end of the project.
19
2. Scientific and technical description of results
2.1 Objectives of the project
Cleaner surfaces and improved surface properties of rolled products achieved through an enhanced
hot rolling process regarding oxidation were target of HiPerScale. Controlled scale formation and
descalability targeting scale-metal interface using a combination of innovative through process
approaches, improved descaling processes and scale detection systems were investigated and applied
to the hot rolling process in terms of primary scale formation, decarburisation and scale re-growth.
To reach the targets of HiPerScale the work was completed by several synergistic and overall tasks
on material modelling, coating composition, scale re-growth (blister and secondary scale
formation), innovative descaling strategies as well as the adaptation and implementation of scale
detection and quantification systems.
In terms of the productivity, product quality and resource efficiency related benefits the main
objectives and innovative aspects were:
To enhance the descaling efficiency by scale modification through adapted process strategies,
application of scale conditioning coatings combined with new flexible descaling technologies
targeting mechanisms at scale-metal interface,
To develop a detailed understanding along primary scale formation steps and post-descaling
scale re-growth effected by scale conditioning coating or process factors on the mechanisms of
oxidation and decarburisation as well as descalability targeting the scale-metal-interface and
sub-surface,
To quantify residual scale re-growth effects like secondary scale formation during first 1-2 rolling
passes and blister formation,
To fully assess effect of scale conditioning coating on reheating conditions and heating rate
targeting influence of emissivity of coating and scale-metal interface/ morphology,
To provide a methodology for optimising descaling energy and resource consumption as function
of steel-grade-dependent oxidation/ decarburisation conditions linking surface descalability
quantification with processing conditions,
To reduce oxide scale related defects for critical (difficult to descale) grades (Ni-, electrical-,
spring-steels, etc.) by linking quantification of descalability of primary scale with existing surface
inspection systems on finished products,
To quantify and cost the synergistic effect of reheating, surface conditioning (coating), descaling/
rolling on descalability for effective transfer to steel industry,
To develop and transfer methodologies for scale detection, coating pre-screening, scale-metal
interface description and trial matrix for through process characterisation of primary scale.

20
21
2.2 State-of-the-Art
Oxidation processes (scale formation, decarburisation) are a topic of continuous improvement for
hot rolling mills. Although various research was done the interactions between process conditions
and alloying elements are not fully understood. Further latest research results are promising to
enhance the hot rolling process and the surface quality of the hot rolled material by scale
conditioning coatings and improved descaling technologies. The aspect of reheating process
conditions, scale conditioning coatings and innovative descaling technologies are focussed. Further
scale detection systems will allow a better observation of the descaling results.
State-of-the-Art in scale formation and surface defects
A defect and impairment free surface is one of the most important quality factors of rolled
products. Since a broad range of defects is caused by scale residues, various research projects and
other research work dealt with the topic of scale formation and the resulting surface defects, e.g.
[1]-[26], [27]-[31]. Nevertheless the interdependencies of the interface reaction during reheating,
descaling and rolling are not explained satisfactorily up to now. To achieve a controlled influence of
the scale formation these parameters have to be investigated. E.g. the water vapour during
descaling has a strong influence on the subsequent formation of secondary scale, its adhesion and
finally the surface quality [32], [33].
State-of-the-Art in scale conditioning coatings
The application of scale conditioning coatings to minimise scale formation and scale adhesion at the
different steps of steel production has been studied over the last decades, e.g.[1], [9], [15], [19],
[20], [34]-[44].Various coating concepts of different reactivity (passive to active) have been
developed based on glass powders, metal oxide, phosphates or lubricants, silicon-silica or sol-gel
systems. Some of those were patented and some products are on the market, e.g. [42]-[51]. All
are targeting different
production processes (like press-hardening, pipe production) or
aspects like reduced scale formation or decarburisation like e.g. the Stopoxy coating product
from Emuref [52] or
drawing temperatures, reheating times or application technologies.
Regarding high-temperature corrosion and to find solutions like coatings to avoid this a lot of work
was done in literature on permanent high-temperature corrosion protection e.g. for power plants
(e.g. [53], [54]). Only little work was done on scale conditioning coating for temporary protection
of steel surface, e.g. [1]. Although the above mentioned coating concepts for a temporary
corrosion protection in reheating have been formulated, little consideration of effect of through
process on coating formulation, behaviour and performance has been quantified using a dedicated
procedure involving surface state (residual scale) quantification. To date, the development and
application of economical concepts that reduce scale formation and scale adhesion on typical steel
grades is still a challenging target. Other research works discuss the decrease of the roll force and
internal shear formation [55] or wear by applying coatings [56].
State-of-the-Art in descaling and control of descaling
A high percentage of surface defects and impairments on surface quality are caused by the
presence of residual scales during rolling. To minimise surface quality impairments the efficiency of
22
the hydraulic descaling is a determining factor and depends on different parameters [57]-[61],
[76]. The removal of the scale layer is intrinsically dependent on interface morphology (roughness,
pegging, etc.), level of entanglement (in Ni grades) and thermal and mechanical effects.
Additionally, growth stresses and residual stresses within the scale layer as well as the elastic
modulus of the layer compound (i.e. metallic matrix and external oxide scale) are directly
interlinked to the temperature state. The different stresses and regimes of descaling (direct impact,
thermal, shear, boiling / evaporation effect) are applied in different descaling strategies. Latest
work in Hides [4] has been done on the effects of the water supply and impact pressure was
regarded in HiJetRod [62], [63] and other investigations [64]-[66]. However, there is still a lack of
a comprehensive knowledge between the interchanging factors of (re-) heating furnace operation,
oxide scaling and the resulting descaling efficiency of reheated and rolled steel products, strategies
to reduce energy consumption as well as flexible steel-grade-dependent descaling strategies. [1],
[4], [57]-[61]
State-of-the-Art in scale detection and controlling
Extensive work had been done to train defect-classifier in scale detection or surface state detection
systems [67]-[75]. On-line systems have been developed mostly for strip such as those provided by
Parsytec [67] and Cognex [68]. On this basis and in addition to this, BFI has compiled the resulting
information in the so-called "residual scale defect grades" [1] with the aid of a self-developed surface
inspection and defect quantification system. These combined systems cover a wide range of defects
related to the strip length for each coil like defects caused by rolled-in scale, by the roughness of rolls
and periodical effects of rotating plant components (especially rolls), in the transfer bar and defects
caused by vibration e.g. chatter marks. A successful integration of scale related material models e.g.
like a spallation-descaling-probability-calculation in system infrastructures for the prediction of scale
adherence / descalability of rolled products was still challenging at the beginning of the project.
Further Mefos has developed a real-time inspection system for primary scale tested at SSAB and also
at SSAB [1] which needed extension to secondary scale detection and evaluation, since the detection
of special effects like blisters had to be assured.
23
2.3 Description of activities and discussion
The project HiPerScale improved the oxidation behaviour during rolling in terms of primary scale
related defects, amount of scale formed and decarburisation by process enhancement, application
of scale conditioning coatings and innovative descaling strategies.
2.3.1 Collection of information on Process_AS_IS at the steel companies
(WP 1)
The comparison of results on improvement of the oxidation behaviour in the hot rolling process is
challenging as different processes and steel grades were relevant for the individual rolling mills.
Therefore approaches for evaluation of the results of the project were defined. These are different
scale related key production indicators and descaling regime maps. The situation of the
Process_AS_IS was determined at the beginning of the project and the Process_HI_PER at its end.
The results were the basis for the definition of general guidelines (Hints and Do’s and Don’ts) for
the implementation of the achieved results into the steel industry.
2.3.1.1 Definition of key production indicators for the rolling process regarding the surface quality (KPI) (Task 1.1, Task 1.2, Task 1.5)
Key production indicators (KPI) are used in industrial companies to measure the performance of a
process. Although there are many KPI at the plants of the industrial partners to evaluate rolling mill
performance none of them is in close relation with oxidation. It is obvious, that scale formation and
decarburisation have a high impact on the material losses and the quality of the product.
Therefore, in addition to the overall / quality indicators scale related and decarburisation related
indicators were defined (Table 5).
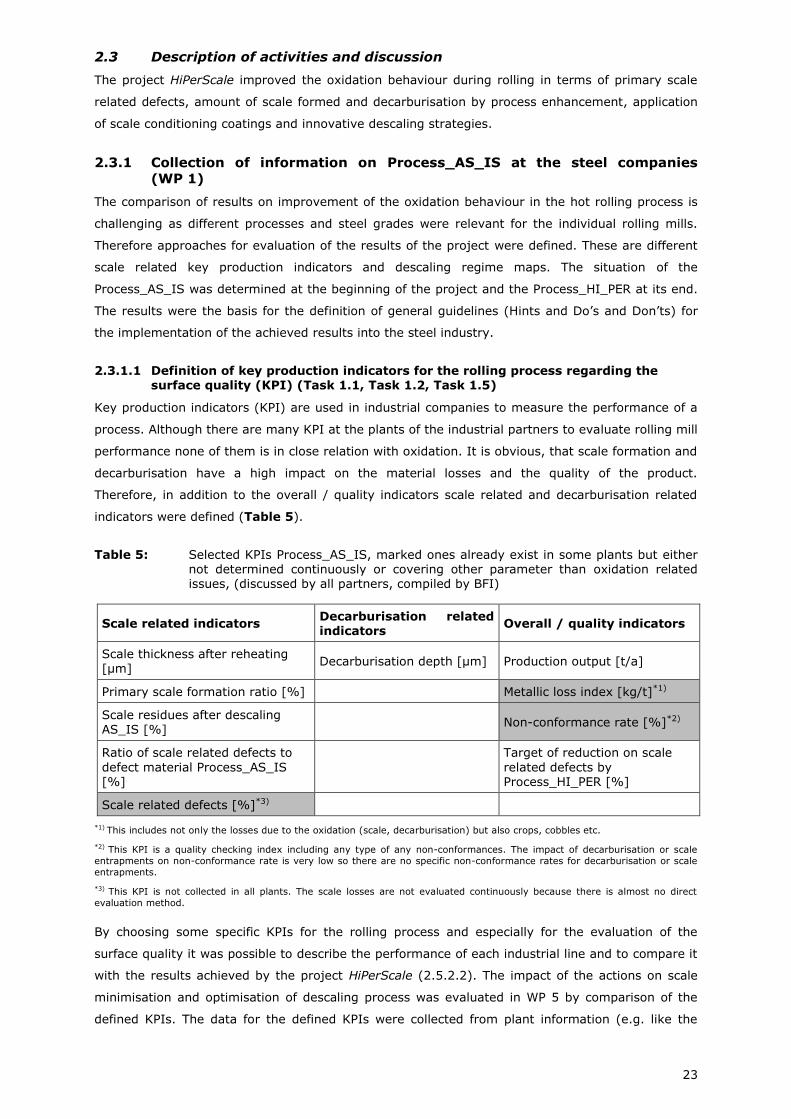
Table 5: Selected KPIs Process_AS_IS, marked ones already exist in some plants but either not determined continuously or covering other parameter than oxidation related issues, (discussed by all partners, compiled by BFI)
Scale related indicators Decarburisation related indicators
Overall / quality indicators
Scale thickness after reheating [µm]
Decarburisation depth [µm] Production output [t/a]
Primary scale formation ratio [%] Metallic loss index [kg/t]*1)
Scale residues after descaling AS_IS [%]
Non-conformance rate [%]*2)
Ratio of scale related defects to
defect material Process_AS_IS [%]
Target of reduction on scale
related defects by Process_HI_PER [%]
Scale related defects [%]*3)
*1) This includes not only the losses due to the oxidation (scale, decarburisation) but also crops, cobbles etc.
*2) This KPI is a quality checking index including any type of any non-conformances. The impact of decarburisation or scale
entrapments on non-conformance rate is very low so there are no specific non-conformance rates for decarburisation or scale
entrapments.
*3) This KPI is not collected in all plants. The scale losses are not evaluated continuously because there is almost no direct
evaluation method.
By choosing some specific KPIs for the rolling process and especially for the evaluation of the
surface quality it was possible to describe the performance of each industrial line and to compare it
with the results achieved by the project HiPerScale (2.5.2.2). The impact of the actions on scale
minimisation and optimisation of descaling process was evaluated in WP 5 by comparison of the
defined KPIs. The data for the defined KPIs were collected from plant information (e.g. like the
24
overall / quality indicators) or had to be measured in HiPerScale. E.g. the scale residues in the
plants were measured with the scale detection systems and are summarised in Table 6.
Due to compliance with the cartel law the collection of KPIs was not possible in the
originally planned way. The data for public (overall indicators) KPIs were collected from the
industrial (*1) or pilot plants (*2). Other data regarding the scale formation and decarburisation of
the specific materials was generated in lab tests (*3, *4). Other data, which can only be collected in
the plants were displayed as index AS_IS (100 %) and the measured data are not provided. The
applicability of the KPIs for evaluation of achievements made by different measures regarding
oxidation related issues were evaluated in WP 5.
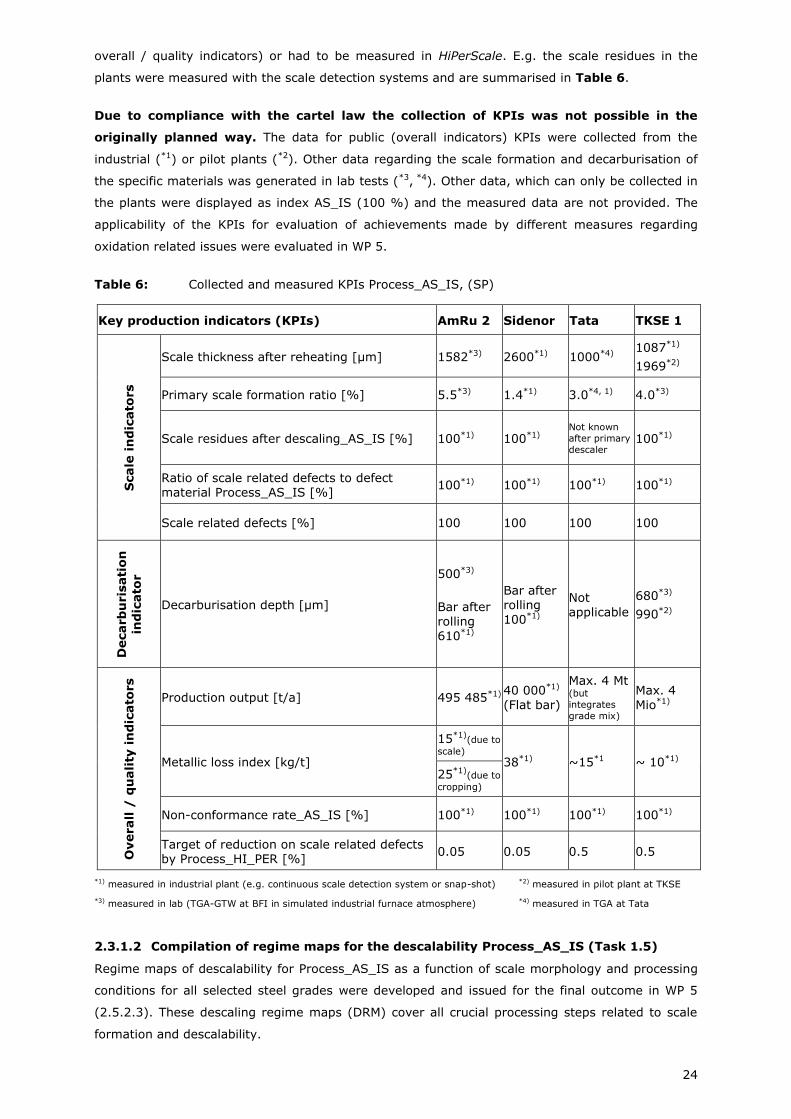
Table 6: Collected and measured KPIs Process_AS_IS, (SP)
Key production indicators (KPIs) AmRu 2 Sidenor Tata TKSE 1
Scale
in
dic
ato
rs
Scale thickness after reheating [µm] 1582*3) 2600*1) 1000*4) 1087*1)
1969*2)
Primary scale formation ratio [%] 5.5*3) 1.4*1) 3.0*4, 1) 4.0*3)
Scale residues after descaling_AS_IS [%] 100*1) 100*1) Not known
after primary
descaler 100*1)
Ratio of scale related defects to defect material Process_AS_IS [%]
100*1) 100*1) 100*1) 100*1)
Scale related defects [%] 100 100 100 100
Decarb
uris
ati
on
ind
icato
r
Decarburisation depth [µm]
500*3)
Bar after rolling 610*1)
Bar after rolling 100*1)
Not applicable
680*3)
990*2)
Overall
/ q
uali
ty i
nd
icato
rs
Production output [t/a] 495 485*1) 40 000*1)
(Flat bar)
Max. 4 Mt (but
integrates
grade mix)
Max. 4 Mio*1)
Metallic loss index [kg/t]
15*1)(due to
scale) 38*1) ~15*1 ~ 10*1)
25*1)(due to
cropping)
Non-conformance rate_AS_IS [%] 100*1) 100*1) 100*1) 100*1)
Target of reduction on scale related defects by Process_HI_PER [%]
0.05 0.05 0.5 0.5
*1) measured in industrial plant (e.g. continuous scale detection system or snap-shot) *2) measured in pilot plant at TKSE
*3) measured in lab (TGA-GTW at BFI in simulated industrial furnace atmosphere) *4) measured in TGA at Tata
2.3.1.2 Compilation of regime maps for the descalability Process_AS_IS (Task 1.5)
Regime maps of descalability for Process_AS_IS as a function of scale morphology and processing
conditions for all selected steel grades were developed and issued for the final outcome in WP 5
(2.5.2.3). These descaling regime maps (DRM) cover all crucial processing steps related to scale
formation and descalability.
25
Descaling regime maps involve assessing the most significant parameters affecting descalability
and descaling set-up for a given static descaler installation. For rotary or other means of descaling
such as hot shot blasting, other methodology needs to be adopted as additional mechanisms such
as multiple shear or plasticity exist. These DRM were obtained through combined audit
measurements, reference to engineering drawings for descaler setups, laboratory measurements of
effect of nozzle geometry on spray impact (state-of-the-art are primarily through aluminum erosion
tests, impact force measurements) as well as theoretical calculations. The DRM will then need to be
populated with hot descalability tests to associate the magnitude of the parameters defined below
with the effective descalability of the steel of interest as to output robust and safe descaling
regimes.
Descalability of steel surface is intrinsically linked to:
1. Mechanical impact (normal/shear),
2. Speed through descaler (i.e. time under spray but also before/after),
3. Thermal effect prior/during and after descaler,
4. Scale morphology, type and steel/metal interface and steel sub-surface (profile, local
composition (oxide, fayalite), entanglement, oxidation, flaws, decarburisation, etc.).
No. 1, 2 and 3 are intrinsically linked to pump-flow characteristics and constraint (flow, pressure,
coverage, etc.), nozzle/filter type and throughput/pacing and other constraints through the mill
depending on mill configuration, etc. These parameters were collected in WP 1 and will be
investigated in WP 3 and 4. No. 4 is linked to the scale properties and will be focussed in WP 2.
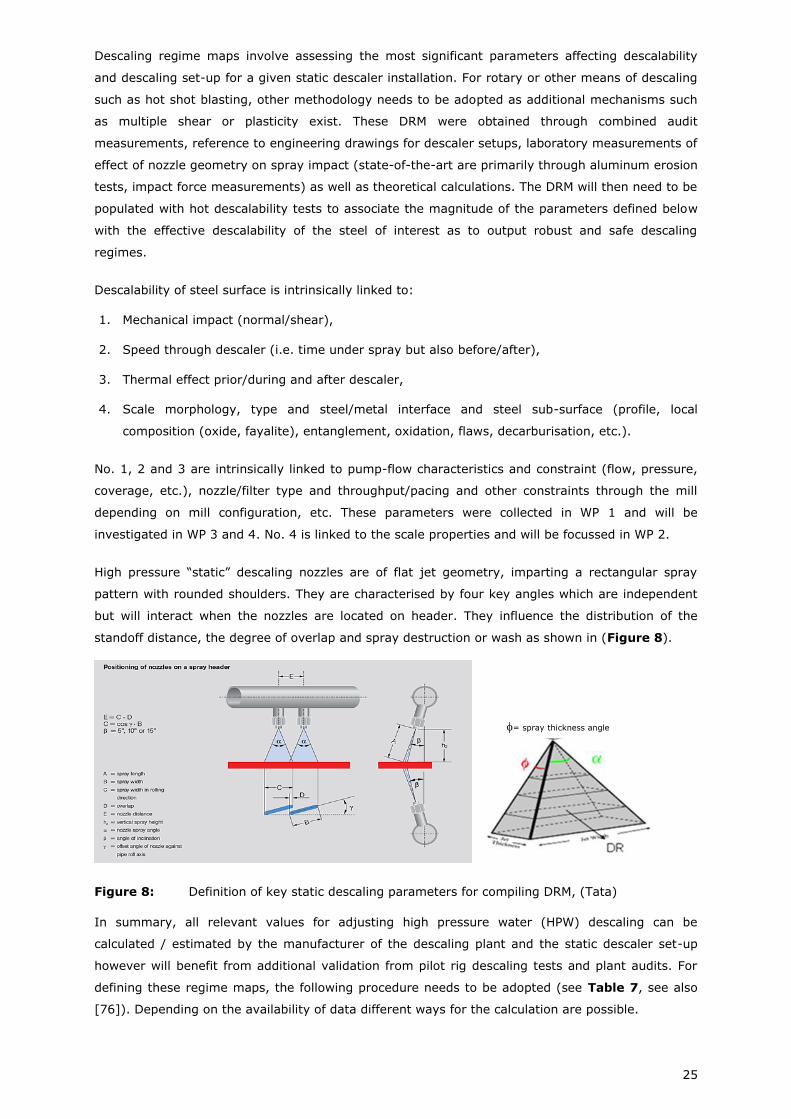
High pressure “static” descaling nozzles are of flat jet geometry, imparting a rectangular spray
pattern with rounded shoulders. They are characterised by four key angles which are independent
but will interact when the nozzles are located on header. They influence the distribution of the
standoff distance, the degree of overlap and spray destruction or wash as shown in (Figure 8).
Figure 8: Definition of key static descaling parameters for compiling DRM, (Tata)
In summary, all relevant values for adjusting high pressure water (HPW) descaling can be
calculated / estimated by the manufacturer of the descaling plant and the static descaler set-up
however will benefit from additional validation from pilot rig descaling tests and plant audits. For
defining these regime maps, the following procedure needs to be adopted (see Table 7, see also
[76]). Depending on the availability of data different ways for the calculation are possible.
= spray thickness angle
26
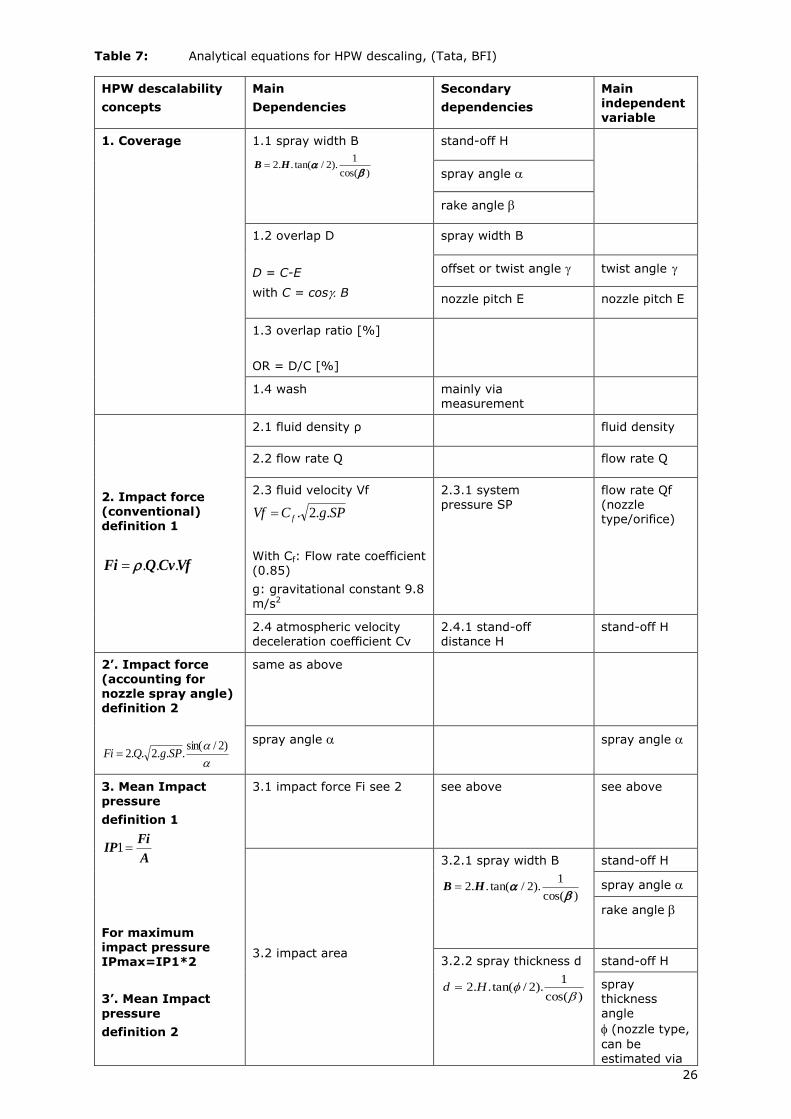
Table 7: Analytical equations for HPW descaling, (Tata, BFI)
HPW descalability
concepts
Main
Dependencies
Secondary
dependencies
Main independent
variable
1. Coverage 1.1 spray width B
stand-off H
spray angle
rake angle
1.2 overlap D
D = C-E
with C = cosB
spray width B
offset or twist angle twist angle
nozzle pitch E nozzle pitch E
1.3 overlap ratio [%]
OR = D/C [%]
1.4 wash mainly via measurement
2. Impact force (conventional) definition 1
2.1 fluid density ρ fluid density
2.2 flow rate Q flow rate Q
2.3 fluid velocity Vf
With Cf: Flow rate coefficient (0.85)
g: gravitational constant 9.8 m/s2
2.3.1 system pressure SP
flow rate Qf (nozzle type/orifice)
2.4 atmospheric velocity deceleration coefficient Cv
2.4.1 stand-off distance H
stand-off H
2’. Impact force (accounting for nozzle spray angle) definition 2
same as above
spray angle spray angle
3. Mean Impact pressure
definition 1
For maximum impact pressure IPmax=IP1*2
3’. Mean Impact
pressure
definition 2
3.1 impact force Fi see 2 see above see above
3.2 impact area
3.2.1 spray width B
stand-off H
spray angle
rake angle
3.2.2 spray thickness d
stand-off H
spray thickness angle
(nozzle type,
can be estimated via
)cos(
1).2/tan(..2
HB
VfCvQFi ...
SPgCVf f ..2.
)2/sin(...2..2 SPgQFi
A
FiIP 1
)cos(
1).2/tan(..2
HB
)cos(
1).2/tan(..2
Hd
27
HPW descalability
concepts
Main
Dependencies
Secondary
dependencies
Main independent
variable
nozzle orifice
diameter)
rake angle
3”. Impact pressure
definition 3
Leading to (main equation)
3.3 coefficient of discharge
nozzle CD
flow rate-system
pressure
flow rate Q
3.4 flow rate Q flow rate Q
3.5 rake angle rake angle
3.6 stand-off H stand-off H
3.7 nozzle spray angle spray angle
(nozzle type)
4. Specific Water
Impingement
4.1 flow rate Q Flow rate Q
4.2 feedstock velocity through jet
velocity V
4.3 spray width
stand-off H stand-off H
spray angle spray angle
rake angle rake angle
5. Descaling Energy DE
DE=IP(1 or 2)* SWI
see above
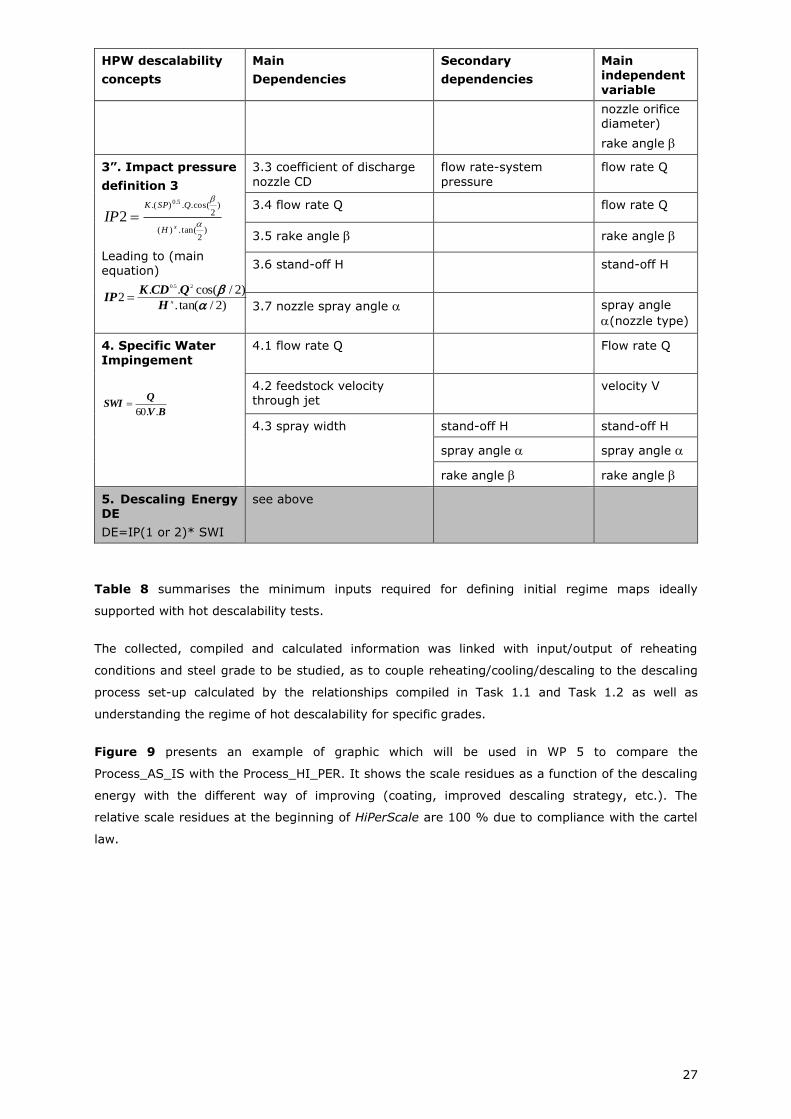
Table 8 summarises the minimum inputs required for defining initial regime maps ideally
supported with hot descalability tests.
The collected, compiled and calculated information was linked with input/output of reheating
conditions and steel grade to be studied, as to couple reheating/cooling/descaling to the descaling
process set-up calculated by the relationships compiled in Task 1.1 and Task 1.2 as well as
understanding the regime of hot descalability for specific grades.
Figure 9 presents an example of graphic which will be used in WP 5 to compare the
Process_AS_IS with the Process_HI_PER. It shows the scale residues as a function of the descaling
energy with the different way of improving (coating, improved descaling strategy, etc.). The
relative scale residues at the beginning of HiPerScale are 100 % due to compliance with the cartel
law.
)2
tan(.)(
)2
cos(..).( 5.0
2
xH
QSPK
IP
)2/tan(.
)2/cos(..2
25.0
xH
QCDKIP
BV
QSWI
..60
28
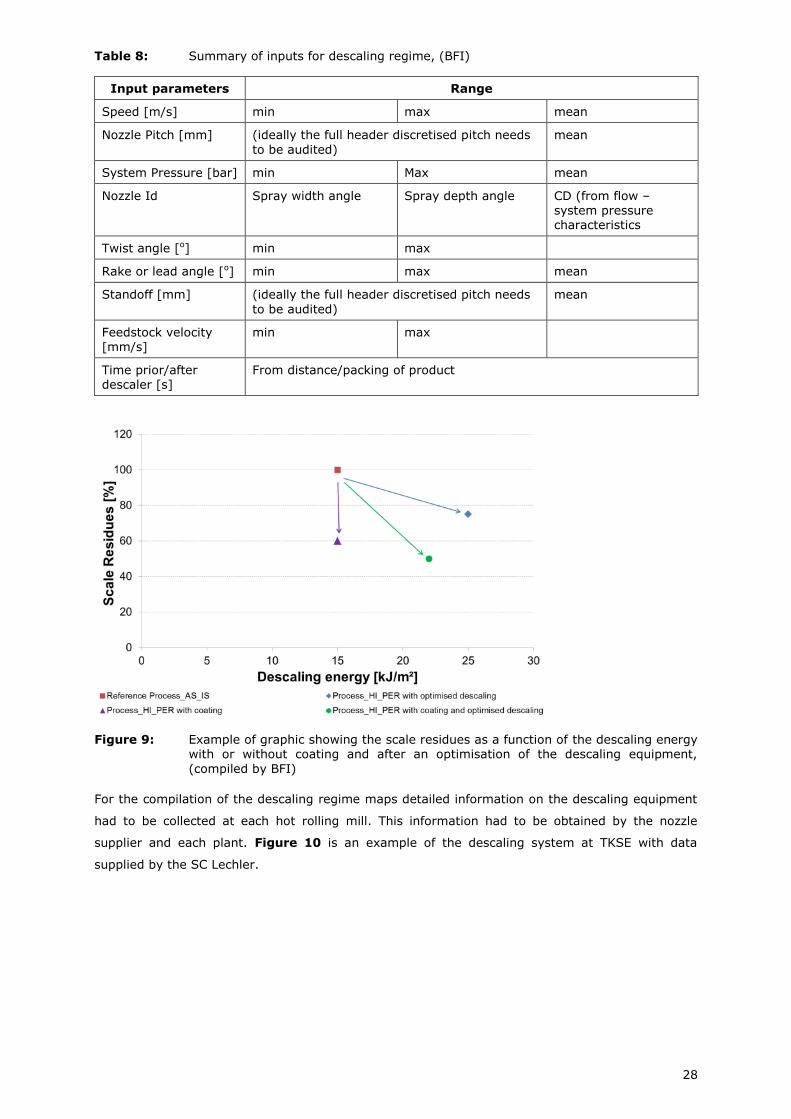
Table 8: Summary of inputs for descaling regime, (BFI)
Input parameters Range
Speed [m/s] min max mean
Nozzle Pitch [mm] (ideally the full header discretised pitch needs
to be audited)
mean
System Pressure [bar] min Max mean
Nozzle Id Spray width angle Spray depth angle CD (from flow – system pressure characteristics
Twist angle [o] min max
Rake or lead angle [o] min max mean
Standoff [mm] (ideally the full header discretised pitch needs
to be audited)
mean
Feedstock velocity [mm/s]
min max
Time prior/after descaler [s]
From distance/packing of product
Figure 9: Example of graphic showing the scale residues as a function of the descaling energy with or without coating and after an optimisation of the descaling equipment,
(compiled by BFI)
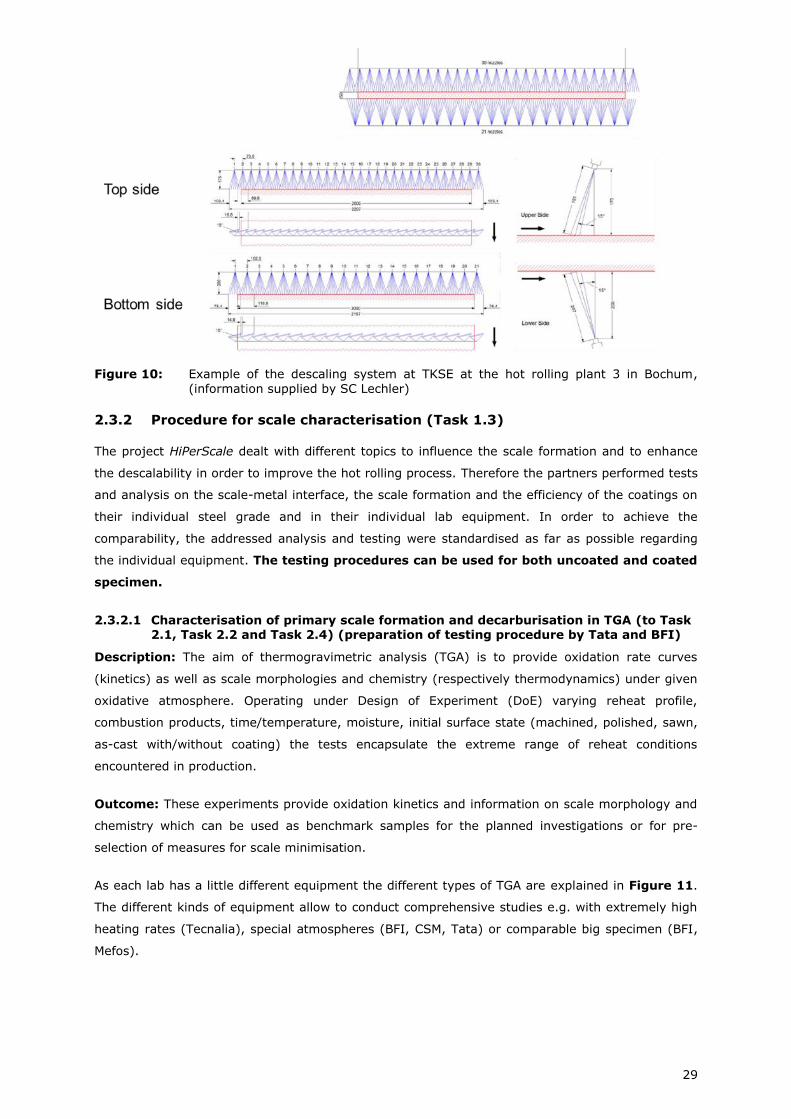
For the compilation of the descaling regime maps detailed information on the descaling equipment
had to be collected at each hot rolling mill. This information had to be obtained by the nozzle
supplier and each plant. Figure 10 is an example of the descaling system at TKSE with data
supplied by the SC Lechler.
29
Figure 10: Example of the descaling system at TKSE at the hot rolling plant 3 in Bochum,
(information supplied by SC Lechler)
2.3.2 Procedure for scale characterisation (Task 1.3)
The project HiPerScale dealt with different topics to influence the scale formation and to enhance
the descalability in order to improve the hot rolling process. Therefore the partners performed tests
and analysis on the scale-metal interface, the scale formation and the efficiency of the coatings on
their individual steel grade and in their individual lab equipment. In order to achieve the
comparability, the addressed analysis and testing were standardised as far as possible regarding
the individual equipment. The testing procedures can be used for both uncoated and coated
specimen.
2.3.2.1 Characterisation of primary scale formation and decarburisation in TGA (to Task 2.1, Task 2.2 and Task 2.4) (preparation of testing procedure by Tata and BFI)
Description: The aim of thermogravimetric analysis (TGA) is to provide oxidation rate curves
(kinetics) as well as scale morphologies and chemistry (respectively thermodynamics) under given
oxidative atmosphere. Operating under Design of Experiment (DoE) varying reheat profile,
combustion products, time/temperature, moisture, initial surface state (machined, polished, sawn,
as-cast with/without coating) the tests encapsulate the extreme range of reheat conditions
encountered in production.
Outcome: These experiments provide oxidation kinetics and information on scale morphology and
chemistry which can be used as benchmark samples for the planned investigations or for pre-
selection of measures for scale minimisation.
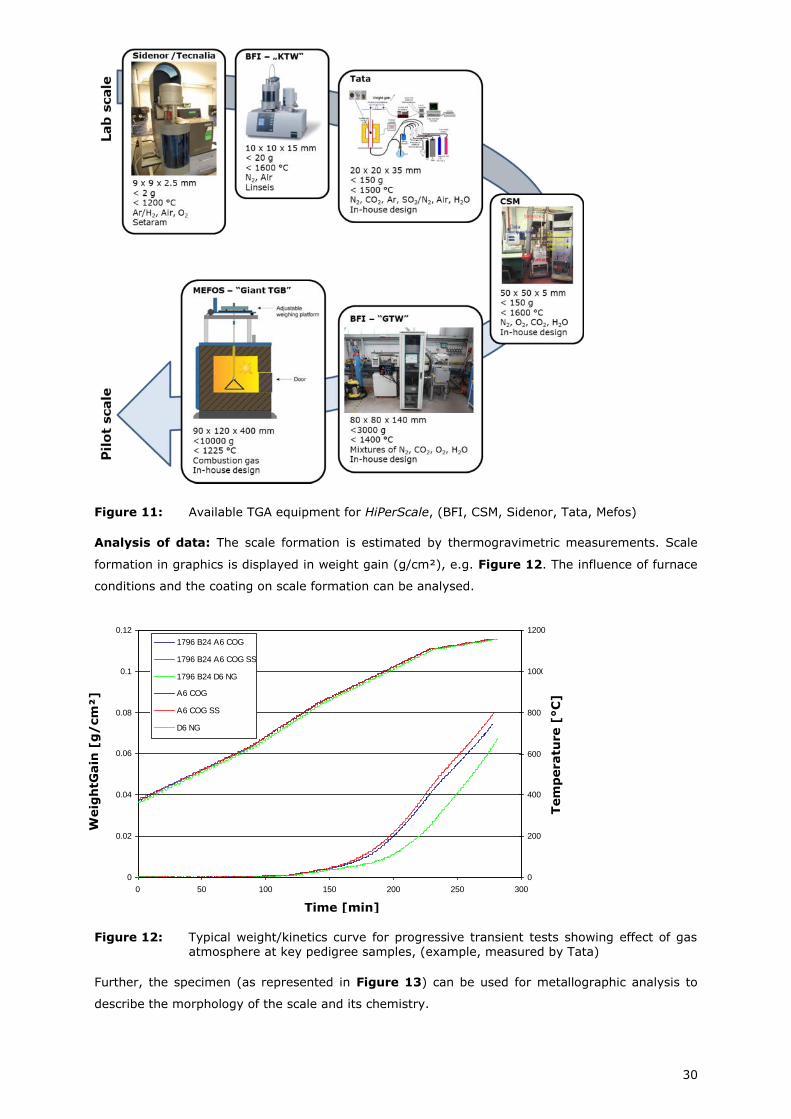
As each lab has a little different equipment the different types of TGA are explained in Figure 11.
The different kinds of equipment allow to conduct comprehensive studies e.g. with extremely high
heating rates (Tecnalia), special atmospheres (BFI, CSM, Tata) or comparable big specimen (BFI,
Mefos).
30
Figure 11: Available TGA equipment for HiPerScale, (BFI, CSM, Sidenor, Tata, Mefos)
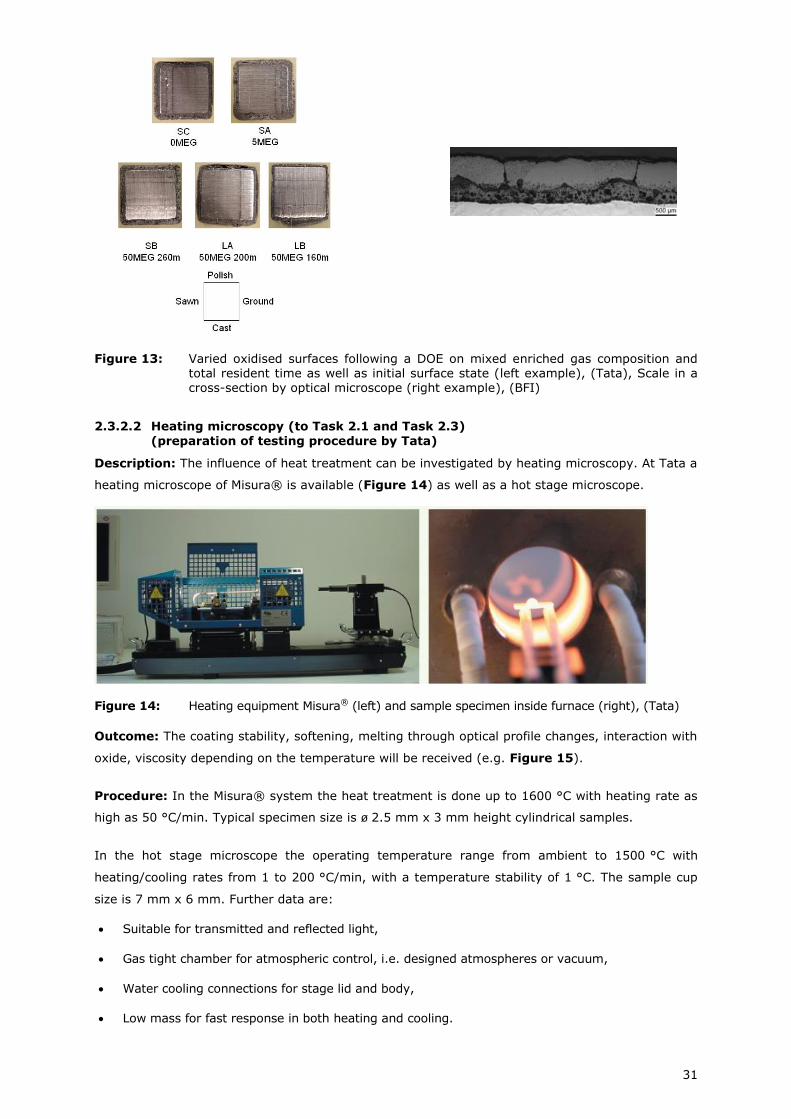
Analysis of data: The scale formation is estimated by thermogravimetric measurements. Scale
formation in graphics is displayed in weight gain (g/cm²), e.g. Figure 12. The influence of furnace
conditions and the coating on scale formation can be analysed.
Figure 12: Typical weight/kinetics curve for progressive transient tests showing effect of gas atmosphere at key pedigree samples, (example, measured by Tata)
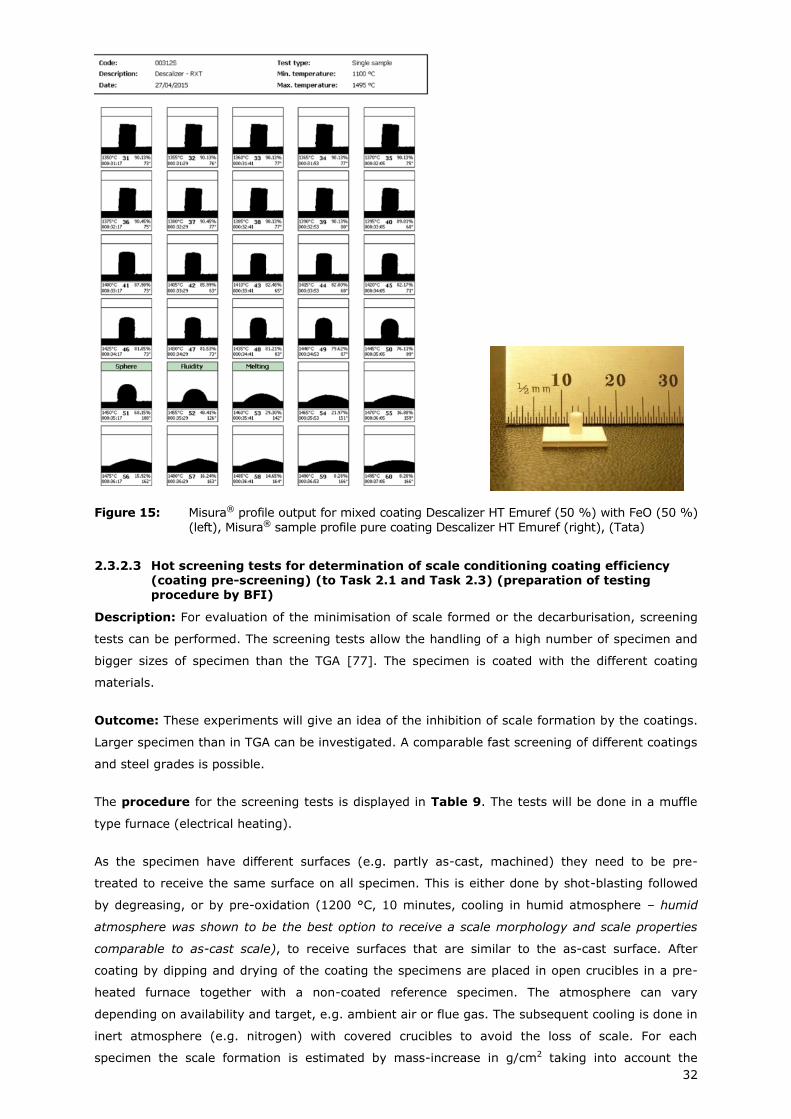
Further, the specimen (as represented in Figure 13) can be used for metallographic analysis to
describe the morphology of the scale and its chemistry.
B24 TGA - Effect of Gas Atmosphere
0
0.02
0.04
0.06
0.08
0.1
0.12
0 50 100 150 200 250 300
Time, minutes
Weig
ht
Gain
, g
cm
-2
0
200
400
600
800
1000
1200
Tem
pera
ture
, oC
1796 B24 A6 COG
1796 B24 A6 COG SS
1796 B24 D6 NG
A6 COG
A6 COG SS
D6 NG
Weig
htG
ain
[g
/cm
²]
Tem
peratu
re [
°C
]
Time [min]
31
Figure 13: Varied oxidised surfaces following a DOE on mixed enriched gas composition and total resident time as well as initial surface state (left example), (Tata), Scale in a cross-section by optical microscope (right example), (BFI)
2.3.2.2 Heating microscopy (to Task 2.1 and Task 2.3)
(preparation of testing procedure by Tata)
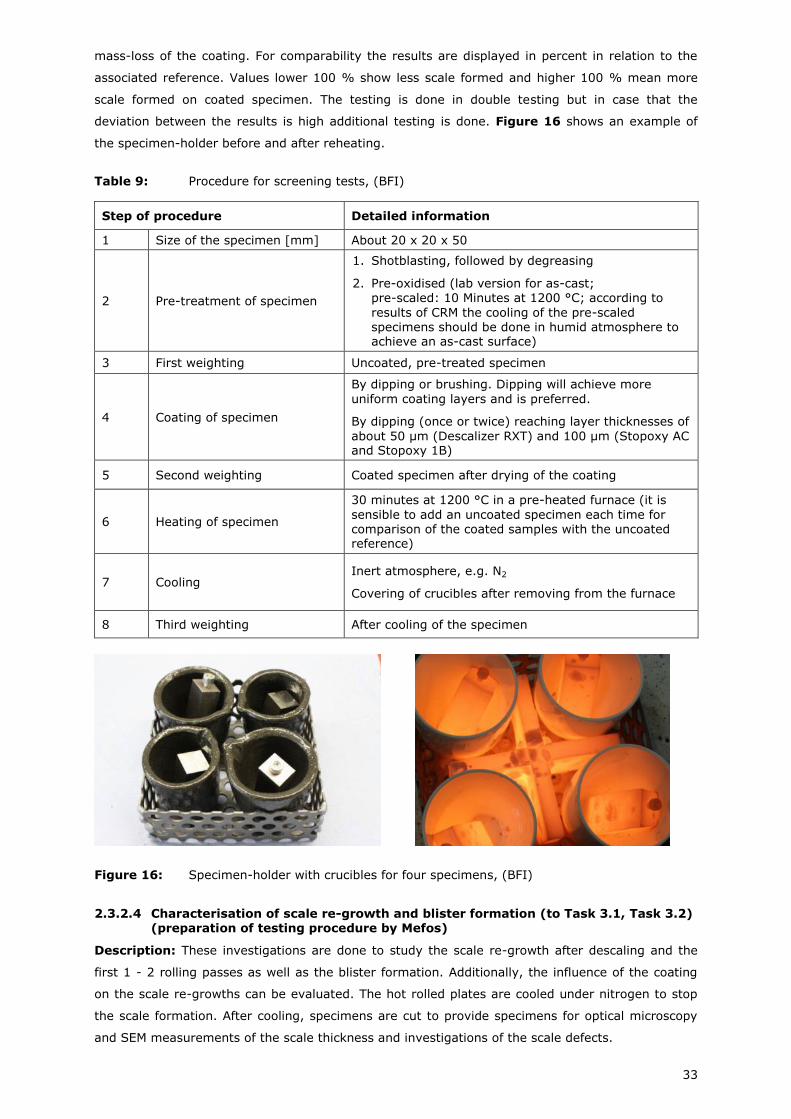
Description: The influence of heat treatment can be investigated by heating microscopy. At Tata a
heating microscope of Misura® is available (Figure 14) as well as a hot stage microscope.
Figure 14: Heating equipment Misura® (left) and sample specimen inside furnace (right), (Tata)
Outcome: The coating stability, softening, melting through optical profile changes, interaction with
oxide, viscosity depending on the temperature will be received (e.g. Figure 15).
Procedure: In the Misura® system the heat treatment is done up to 1600 °C with heating rate as
high as 50 °C/min. Typical specimen size is ø 2.5 mm x 3 mm height cylindrical samples.
In the hot stage microscope the operating temperature range from ambient to 1500 °C with
heating/cooling rates from 1 to 200 °C/min, with a temperature stability of 1 °C. The sample cup
size is 7 mm x 6 mm. Further data are:
Suitable for transmitted and reflected light,
Gas tight chamber for atmospheric control, i.e. designed atmospheres or vacuum,
Water cooling connections for stage lid and body,
Low mass for fast response in both heating and cooling.
32
Figure 15: Misura® profile output for mixed coating Descalizer HT Emuref (50 %) with FeO (50 %)
(left), Misura® sample profile pure coating Descalizer HT Emuref (right), (Tata)
2.3.2.3 Hot screening tests for determination of scale conditioning coating efficiency (coating pre-screening) (to Task 2.1 and Task 2.3) (preparation of testing
procedure by BFI)
Description: For evaluation of the minimisation of scale formed or the decarburisation, screening
tests can be performed. The screening tests allow the handling of a high number of specimen and
bigger sizes of specimen than the TGA [77]. The specimen is coated with the different coating
materials.
Outcome: These experiments will give an idea of the inhibition of scale formation by the coatings.
Larger specimen than in TGA can be investigated. A comparable fast screening of different coatings
and steel grades is possible.
The procedure for the screening tests is displayed in Table 9. The tests will be done in a muffle
type furnace (electrical heating).
As the specimen have different surfaces (e.g. partly as-cast, machined) they need to be pre-
treated to receive the same surface on all specimen. This is either done by shot-blasting followed
by degreasing, or by pre-oxidation (1200 °C, 10 minutes, cooling in humid atmosphere – humid
atmosphere was shown to be the best option to receive a scale morphology and scale properties
comparable to as-cast scale), to receive surfaces that are similar to the as-cast surface. After
coating by dipping and drying of the coating the specimens are placed in open crucibles in a pre-
heated furnace together with a non-coated reference specimen. The atmosphere can vary
depending on availability and target, e.g. ambient air or flue gas. The subsequent cooling is done in
inert atmosphere (e.g. nitrogen) with covered crucibles to avoid the loss of scale. For each
specimen the scale formation is estimated by mass-increase in g/cm2 taking into account the
33
mass-loss of the coating. For comparability the results are displayed in percent in relation to the
associated reference. Values lower 100 % show less scale formed and higher 100 % mean more
scale formed on coated specimen. The testing is done in double testing but in case that the
deviation between the results is high additional testing is done. Figure 16 shows an example of
the specimen-holder before and after reheating.
Table 9: Procedure for screening tests, (BFI)
Step of procedure Detailed information
1 Size of the specimen [mm] About 20 x 20 x 50
2 Pre-treatment of specimen
1. Shotblasting, followed by degreasing
2. Pre-oxidised (lab version for as-cast; pre-scaled: 10 Minutes at 1200 °C; according to
results of CRM the cooling of the pre-scaled specimens should be done in humid atmosphere to achieve an as-cast surface)
3 First weighting Uncoated, pre-treated specimen
4 Coating of specimen
By dipping or brushing. Dipping will achieve more
uniform coating layers and is preferred.
By dipping (once or twice) reaching layer thicknesses of
about 50 µm (Descalizer RXT) and 100 µm (Stopoxy AC and Stopoxy 1B)
5 Second weighting Coated specimen after drying of the coating
6 Heating of specimen
30 minutes at 1200 °C in a pre-heated furnace (it is
sensible to add an uncoated specimen each time for comparison of the coated samples with the uncoated reference)
7 Cooling Inert atmosphere, e.g. N2
Covering of crucibles after removing from the furnace
8 Third weighting After cooling of the specimen
Figure 16: Specimen-holder with crucibles for four specimens, (BFI)
2.3.2.4 Characterisation of scale re-growth and blister formation (to Task 3.1, Task 3.2) (preparation of testing procedure by Mefos)
Description: These investigations are done to study the scale re-growth after descaling and the
first 1 - 2 rolling passes as well as the blister formation. Additionally, the influence of the coating
on the scale re-growths can be evaluated. The hot rolled plates are cooled under nitrogen to stop
the scale formation. After cooling, specimens are cut to provide specimens for optical microscopy
and SEM measurements of the scale thickness and investigations of the scale defects.
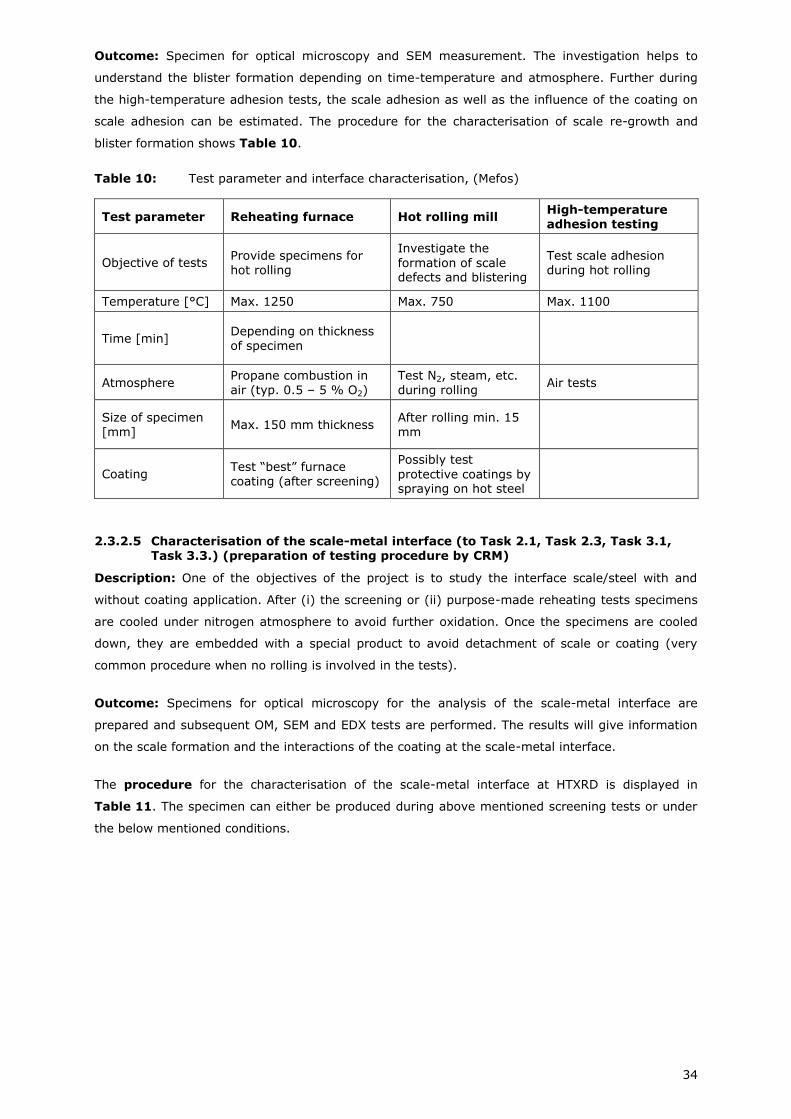
34
Outcome: Specimen for optical microscopy and SEM measurement. The investigation helps to
understand the blister formation depending on time-temperature and atmosphere. Further during
the high-temperature adhesion tests, the scale adhesion as well as the influence of the coating on
scale adhesion can be estimated. The procedure for the characterisation of scale re-growth and
blister formation shows Table 10.
Table 10: Test parameter and interface characterisation, (Mefos)
Test parameter Reheating furnace Hot rolling mill High-temperature adhesion testing
Objective of tests Provide specimens for hot rolling
Investigate the
formation of scale defects and blistering
Test scale adhesion during hot rolling
Temperature [°C] Max. 1250 Max. 750 Max. 1100
Time [min] Depending on thickness of specimen
Atmosphere Propane combustion in air (typ. 0.5 – 5 % O2)
Test N2, steam, etc. during rolling
Air tests
Size of specimen [mm]
Max. 150 mm thickness After rolling min. 15 mm
Coating Test “best” furnace coating (after screening)
Possibly test
protective coatings by spraying on hot steel
2.3.2.5 Characterisation of the scale-metal interface (to Task 2.1, Task 2.3, Task 3.1, Task 3.3.) (preparation of testing procedure by CRM)
Description: One of the objectives of the project is to study the interface scale/steel with and
without coating application. After (i) the screening or (ii) purpose-made reheating tests specimens
are cooled under nitrogen atmosphere to avoid further oxidation. Once the specimens are cooled
down, they are embedded with a special product to avoid detachment of scale or coating (very
common procedure when no rolling is involved in the tests).
Outcome: Specimens for optical microscopy for the analysis of the scale-metal interface are
prepared and subsequent OM, SEM and EDX tests are performed. The results will give information
on the scale formation and the interactions of the coating at the scale-metal interface.
The procedure for the characterisation of the scale-metal interface at HTXRD is displayed in
Table 11. The specimen can either be produced during above mentioned screening tests or under
the below mentioned conditions.
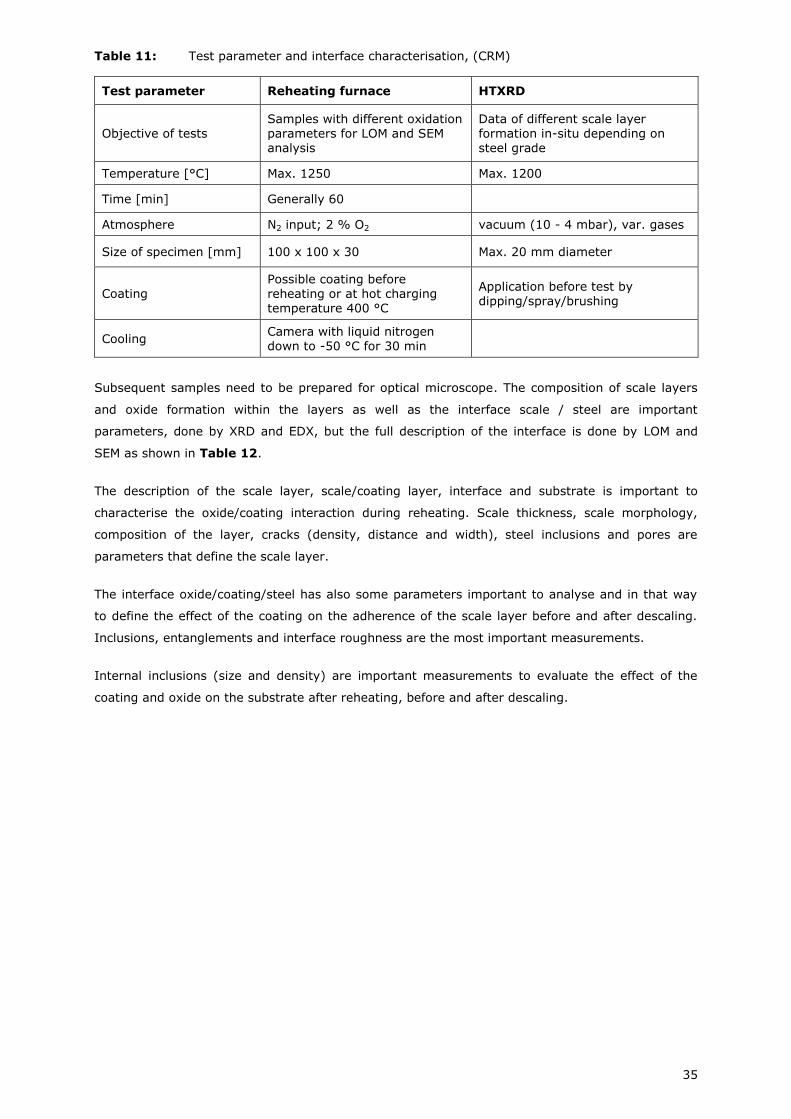
35
Table 11: Test parameter and interface characterisation, (CRM)
Test parameter Reheating furnace HTXRD
Objective of tests Samples with different oxidation parameters for LOM and SEM analysis
Data of different scale layer formation in-situ depending on steel grade
Temperature [°C] Max. 1250 Max. 1200
Time [min] Generally 60
Atmosphere N2 input; 2 % O2 vacuum (10 - 4 mbar), var. gases
Size of specimen [mm] 100 x 100 x 30 Max. 20 mm diameter
Coating Possible coating before reheating or at hot charging temperature 400 °C
Application before test by dipping/spray/brushing
Cooling Camera with liquid nitrogen down to -50 °C for 30 min
Subsequent samples need to be prepared for optical microscope. The composition of scale layers
and oxide formation within the layers as well as the interface scale / steel are important
parameters, done by XRD and EDX, but the full description of the interface is done by LOM and
SEM as shown in Table 12.
The description of the scale layer, scale/coating layer, interface and substrate is important to
characterise the oxide/coating interaction during reheating. Scale thickness, scale morphology,
composition of the layer, cracks (density, distance and width), steel inclusions and pores are
parameters that define the scale layer.
The interface oxide/coating/steel has also some parameters important to analyse and in that way
to define the effect of the coating on the adherence of the scale layer before and after descaling.
Inclusions, entanglements and interface roughness are the most important measurements.
Internal inclusions (size and density) are important measurements to evaluate the effect of the
coating and oxide on the substrate after reheating, before and after descaling.
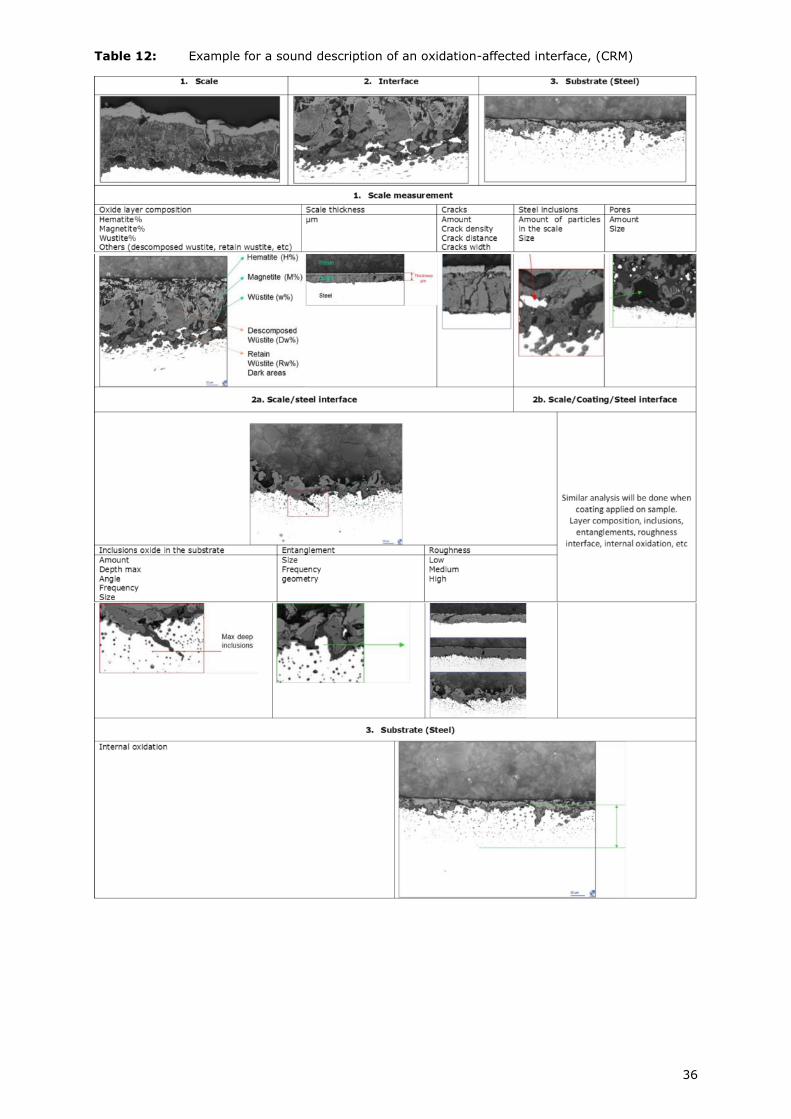
36
Table 12: Example for a sound description of an oxidation-affected interface, (CRM)
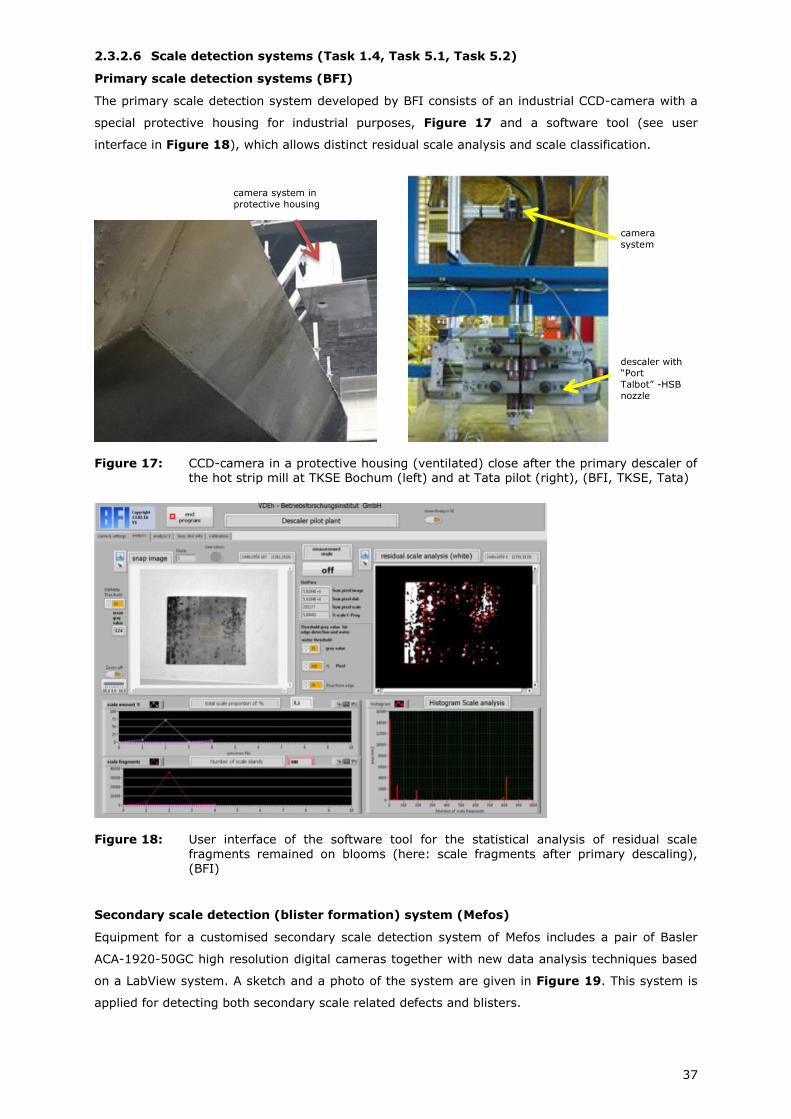
37
2.3.2.6 Scale detection systems (Task 1.4, Task 5.1, Task 5.2)
Primary scale detection systems (BFI)
The primary scale detection system developed by BFI consists of an industrial CCD-camera with a
special protective housing for industrial purposes, Figure 17 and a software tool (see user
interface in Figure 18), which allows distinct residual scale analysis and scale classification.
Figure 17: CCD-camera in a protective housing (ventilated) close after the primary descaler of the hot strip mill at TKSE Bochum (left) and at Tata pilot (right), (BFI, TKSE, Tata)
Figure 18: User interface of the software tool for the statistical analysis of residual scale
fragments remained on blooms (here: scale fragments after primary descaling), (BFI)
Secondary scale detection (blister formation) system (Mefos)
Equipment for a customised secondary scale detection system of Mefos includes a pair of Basler
ACA-1920-50GC high resolution digital cameras together with new data analysis techniques based
on a LabView system. A sketch and a photo of the system are given in Figure 19. This system is
applied for detecting both secondary scale related defects and blisters.
camera
system
descaler with
“Port
Talbot” -HSB
nozzle
camera system in
protective housing
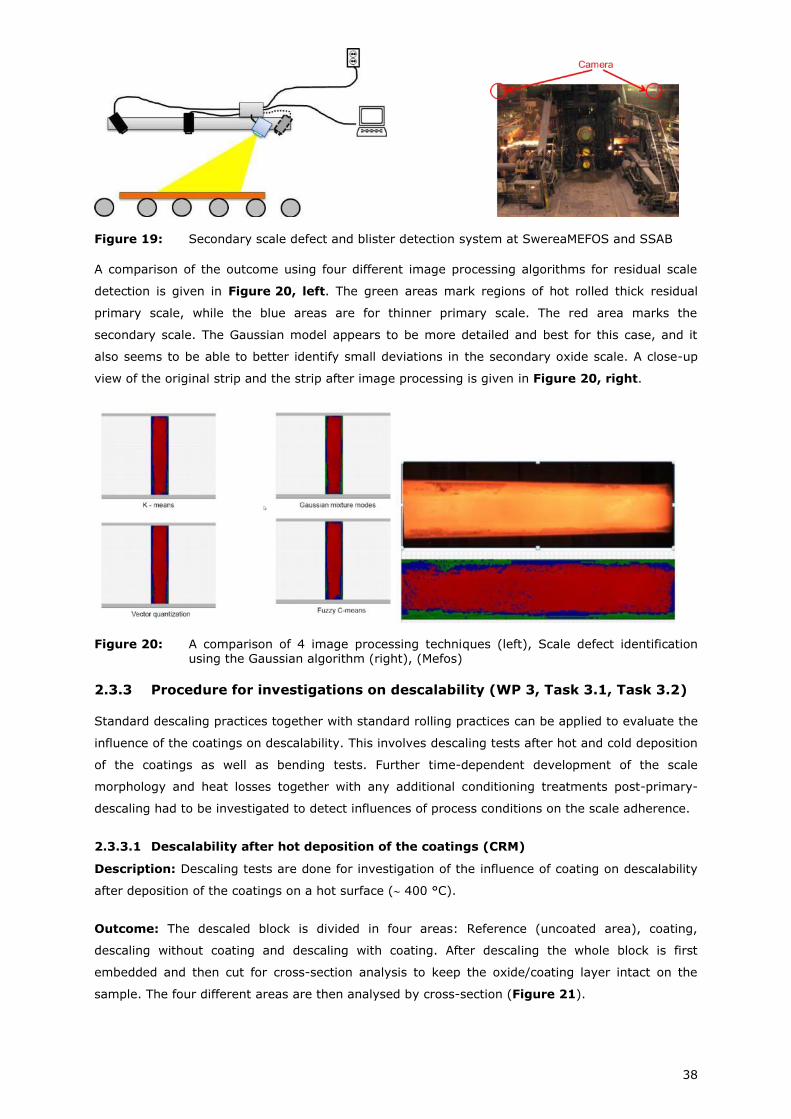
38
Figure 19: Secondary scale defect and blister detection system at SwereaMEFOS and SSAB
A comparison of the outcome using four different image processing algorithms for residual scale
detection is given in Figure 20, left. The green areas mark regions of hot rolled thick residual
primary scale, while the blue areas are for thinner primary scale. The red area marks the
secondary scale. The Gaussian model appears to be more detailed and best for this case, and it
also seems to be able to better identify small deviations in the secondary oxide scale. A close-up
view of the original strip and the strip after image processing is given in Figure 20, right.
Figure 20: A comparison of 4 image processing techniques (left), Scale defect identification using the Gaussian algorithm (right), (Mefos)
2.3.3 Procedure for investigations on descalability (WP 3, Task 3.1, Task 3.2)
Standard descaling practices together with standard rolling practices can be applied to evaluate the
influence of the coatings on descalability. This involves descaling tests after hot and cold deposition
of the coatings as well as bending tests. Further time-dependent development of the scale
morphology and heat losses together with any additional conditioning treatments post-primary-
descaling had to be investigated to detect influences of process conditions on the scale adherence.
2.3.3.1 Descalability after hot deposition of the coatings (CRM)
Description: Descaling tests are done for investigation of the influence of coating on descalability
after deposition of the coatings on a hot surface ( 400 °C).
Outcome: The descaled block is divided in four areas: Reference (uncoated area), coating,
descaling without coating and descaling with coating. After descaling the whole block is first
embedded and then cut for cross-section analysis to keep the oxide/coating layer intact on the
sample. The four different areas are then analysed by cross-section (Figure 21).
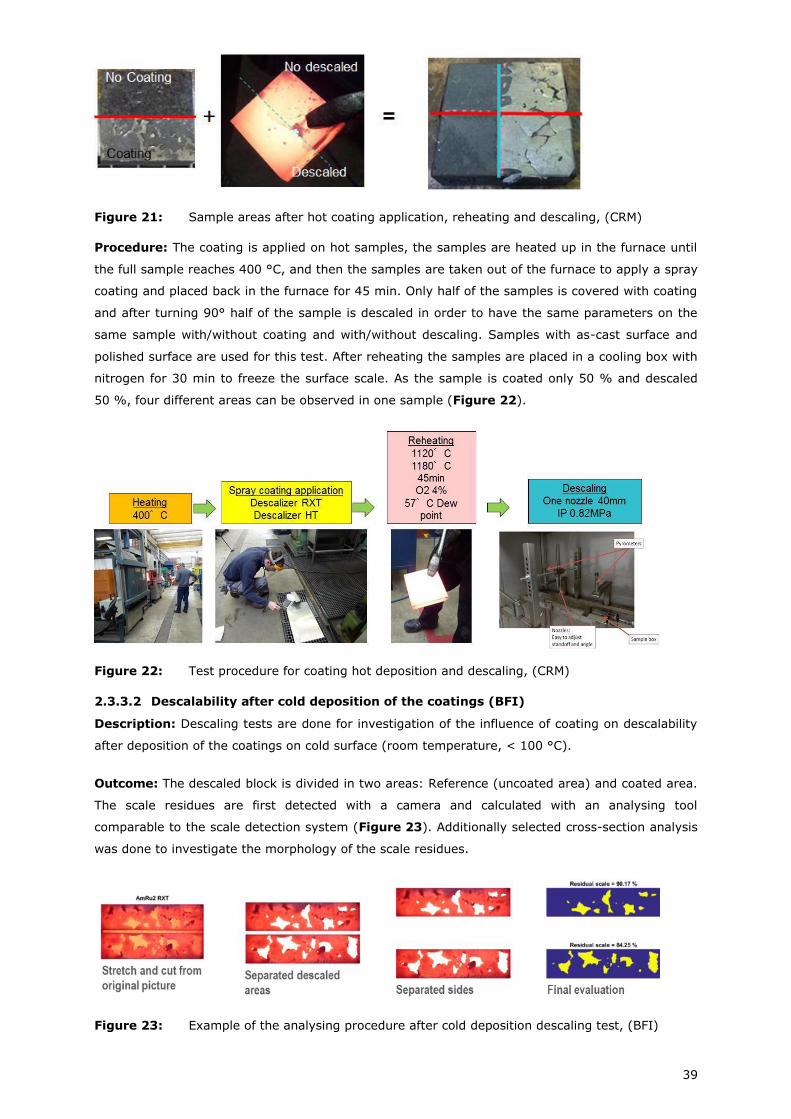
39
Figure 21: Sample areas after hot coating application, reheating and descaling, (CRM)
Procedure: The coating is applied on hot samples, the samples are heated up in the furnace until
the full sample reaches 400 °C, and then the samples are taken out of the furnace to apply a spray
coating and placed back in the furnace for 45 min. Only half of the samples is covered with coating
and after turning 90° half of the sample is descaled in order to have the same parameters on the
same sample with/without coating and with/without descaling. Samples with as-cast surface and
polished surface are used for this test. After reheating the samples are placed in a cooling box with
nitrogen for 30 min to freeze the surface scale. As the sample is coated only 50 % and descaled
50 %, four different areas can be observed in one sample (Figure 22).
Figure 22: Test procedure for coating hot deposition and descaling, (CRM)
2.3.3.2 Descalability after cold deposition of the coatings (BFI)
Description: Descaling tests are done for investigation of the influence of coating on descalability
after deposition of the coatings on cold surface (room temperature, < 100 °C).
Outcome: The descaled block is divided in two areas: Reference (uncoated area) and coated area.
The scale residues are first detected with a camera and calculated with an analysing tool
comparable to the scale detection system (Figure 23). Additionally selected cross-section analysis
was done to investigate the morphology of the scale residues.
Figure 23: Example of the analysing procedure after cold deposition descaling test, (BFI)
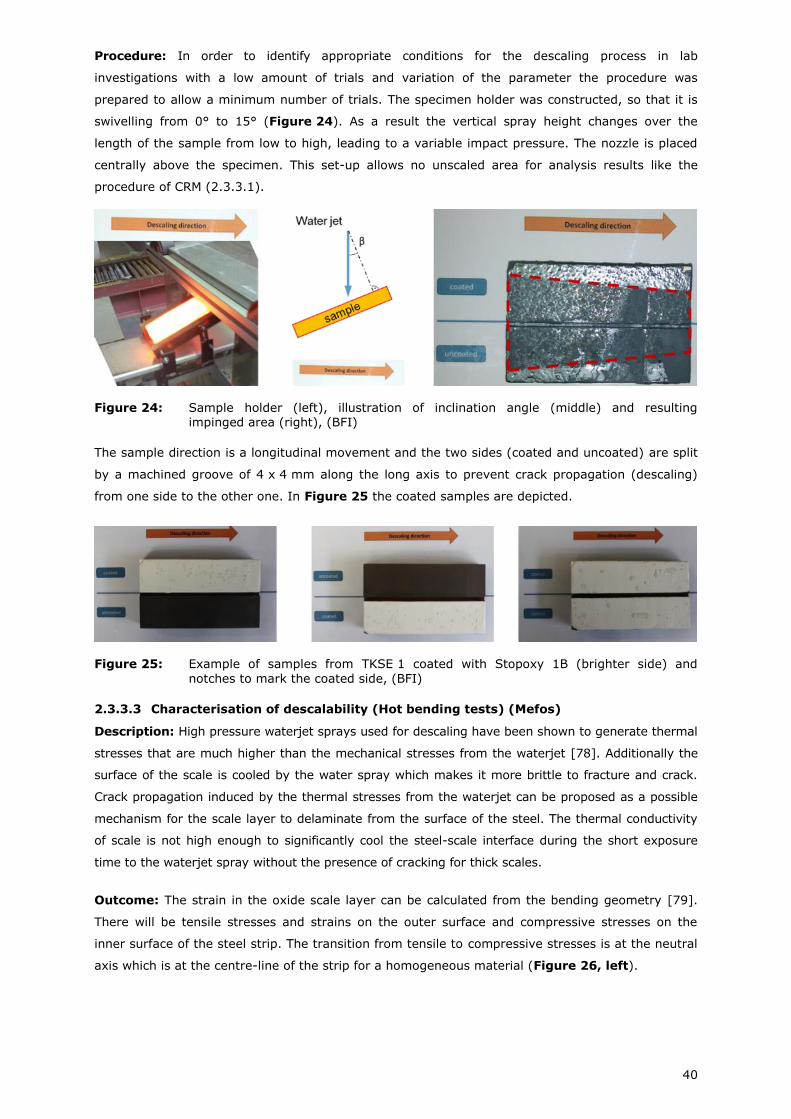
40
Procedure: In order to identify appropriate conditions for the descaling process in lab
investigations with a low amount of trials and variation of the parameter the procedure was
prepared to allow a minimum number of trials. The specimen holder was constructed, so that it is
swivelling from 0° to 15° (Figure 24). As a result the vertical spray height changes over the
length of the sample from low to high, leading to a variable impact pressure. The nozzle is placed
centrally above the specimen. This set-up allows no unscaled area for analysis results like the
procedure of CRM (2.3.3.1).
Figure 24: Sample holder (left), illustration of inclination angle (middle) and resulting impinged area (right), (BFI)
The sample direction is a longitudinal movement and the two sides (coated and uncoated) are split
by a machined groove of 4 x 4 mm along the long axis to prevent crack propagation (descaling)
from one side to the other one. In Figure 25 the coated samples are depicted.
Figure 25: Example of samples from TKSE 1 coated with Stopoxy 1B (brighter side) and
notches to mark the coated side, (BFI)
2.3.3.3 Characterisation of descalability (Hot bending tests) (Mefos)
Description: High pressure waterjet sprays used for descaling have been shown to generate thermal
stresses that are much higher than the mechanical stresses from the waterjet [78]. Additionally the
surface of the scale is cooled by the water spray which makes it more brittle to fracture and crack.
Crack propagation induced by the thermal stresses from the waterjet can be proposed as a possible
mechanism for the scale layer to delaminate from the surface of the steel. The thermal conductivity
of scale is not high enough to significantly cool the steel-scale interface during the short exposure
time to the waterjet spray without the presence of cracking for thick scales.
Outcome: The strain in the oxide scale layer can be calculated from the bending geometry [79].
There will be tensile stresses and strains on the outer surface and compressive stresses on the
inner surface of the steel strip. The transition from tensile to compressive stresses is at the neutral
axis which is at the centre-line of the strip for a homogeneous material (Figure 26, left).
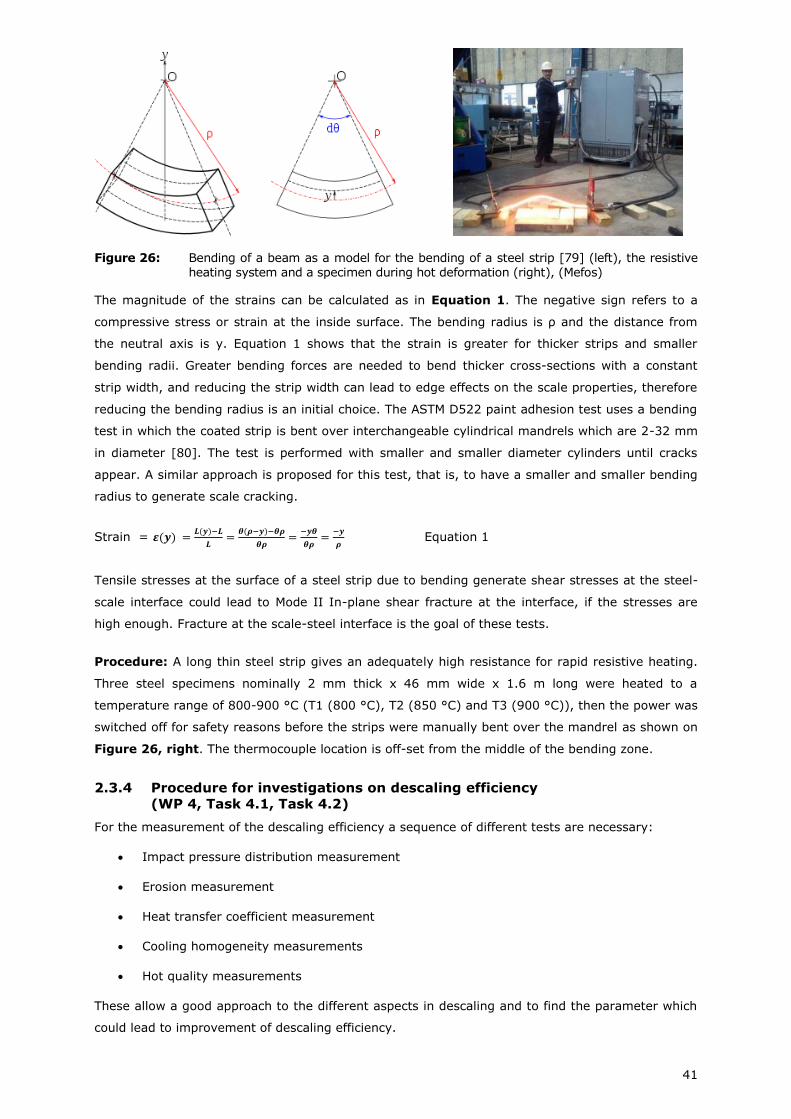
41
Figure 26: Bending of a beam as a model for the bending of a steel strip [79] (left), the resistive heating system and a specimen during hot deformation (right), (Mefos)
The magnitude of the strains can be calculated as in Equation 1. The negative sign refers to a
compressive stress or strain at the inside surface. The bending radius is ρ and the distance from
the neutral axis is y. Equation 1 shows that the strain is greater for thicker strips and smaller
bending radii. Greater bending forces are needed to bend thicker cross-sections with a constant
strip width, and reducing the strip width can lead to edge effects on the scale properties, therefore
reducing the bending radius is an initial choice. The ASTM D522 paint adhesion test uses a bending
test in which the coated strip is bent over interchangeable cylindrical mandrels which are 2-32 mm
in diameter [80]. The test is performed with smaller and smaller diameter cylinders until cracks
appear. A similar approach is proposed for this test, that is, to have a smaller and smaller bending
radius to generate scale cracking.
Strain = 𝜺(𝒚) =𝑳(𝒚)−𝑳
𝑳=
𝜽(𝝆−𝒚)−𝜽𝝆
𝜽𝝆=
−𝒚𝜽
𝜽𝝆=
−𝒚
𝝆 Equation 1
Tensile stresses at the surface of a steel strip due to bending generate shear stresses at the steel-
scale interface could lead to Mode II In-plane shear fracture at the interface, if the stresses are
high enough. Fracture at the scale-steel interface is the goal of these tests.
Procedure: A long thin steel strip gives an adequately high resistance for rapid resistive heating.
Three steel specimens nominally 2 mm thick x 46 mm wide x 1.6 m long were heated to a
temperature range of 800-900 °C (T1 (800 °C), T2 (850 °C) and T3 (900 °C)), then the power was
switched off for safety reasons before the strips were manually bent over the mandrel as shown on
Figure 26, right. The thermocouple location is off-set from the middle of the bending zone.
2.3.4 Procedure for investigations on descaling efficiency
(WP 4, Task 4.1, Task 4.2)
For the measurement of the descaling efficiency a sequence of different tests are necessary:
Impact pressure distribution measurement
Erosion measurement
Heat transfer coefficient measurement
Cooling homogeneity measurements
Hot quality measurements
These allow a good approach to the different aspects in descaling and to find the parameter which
could lead to improvement of descaling efficiency.
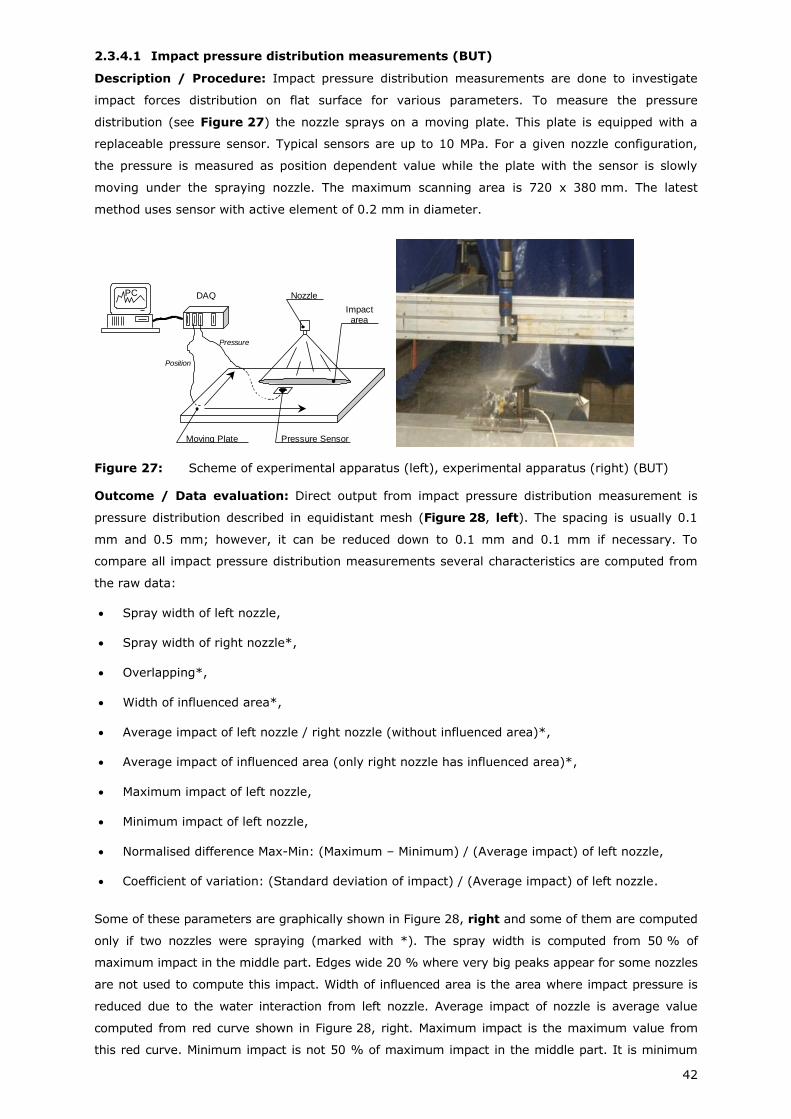
42
2.3.4.1 Impact pressure distribution measurements (BUT)
Description / Procedure: Impact pressure distribution measurements are done to investigate
impact forces distribution on flat surface for various parameters. To measure the pressure
distribution (see Figure 27) the nozzle sprays on a moving plate. This plate is equipped with a
replaceable pressure sensor. Typical sensors are up to 10 MPa. For a given nozzle configuration,
the pressure is measured as position dependent value while the plate with the sensor is slowly
moving under the spraying nozzle. The maximum scanning area is 720 x 380 mm. The latest
method uses sensor with active element of 0.2 mm in diameter.
Figure 27: Scheme of experimental apparatus (left), experimental apparatus (right) (BUT)
Outcome / Data evaluation: Direct output from impact pressure distribution measurement is
pressure distribution described in equidistant mesh (Figure 28, left). The spacing is usually 0.1
mm and 0.5 mm; however, it can be reduced down to 0.1 mm and 0.1 mm if necessary. To
compare all impact pressure distribution measurements several characteristics are computed from
the raw data:
Spray width of left nozzle,
Spray width of right nozzle*,
Overlapping*,
Width of influenced area*,
Average impact of left nozzle / right nozzle (without influenced area)*,
Average impact of influenced area (only right nozzle has influenced area)*,
Maximum impact of left nozzle,
Minimum impact of left nozzle,
Normalised difference Max-Min: (Maximum – Minimum) / (Average impact) of left nozzle,
Coefficient of variation: (Standard deviation of impact) / (Average impact) of left nozzle.
Some of these parameters are graphically shown in Figure 28, right and some of them are computed
only if two nozzles were spraying (marked with *). The spray width is computed from 50 % of
maximum impact in the middle part. Edges wide 20 % where very big peaks appear for some nozzles
are not used to compute this impact. Width of influenced area is the area where impact pressure is
reduced due to the water interaction from left nozzle. Average impact of nozzle is average value
computed from red curve shown in Figure 28, right. Maximum impact is the maximum value from
this red curve. Minimum impact is not 50 % of maximum impact in the middle part. It is minimum
DAQ PC Nozzle
Impact area
Pressure Sensor Moving Plate
Pressure
Position
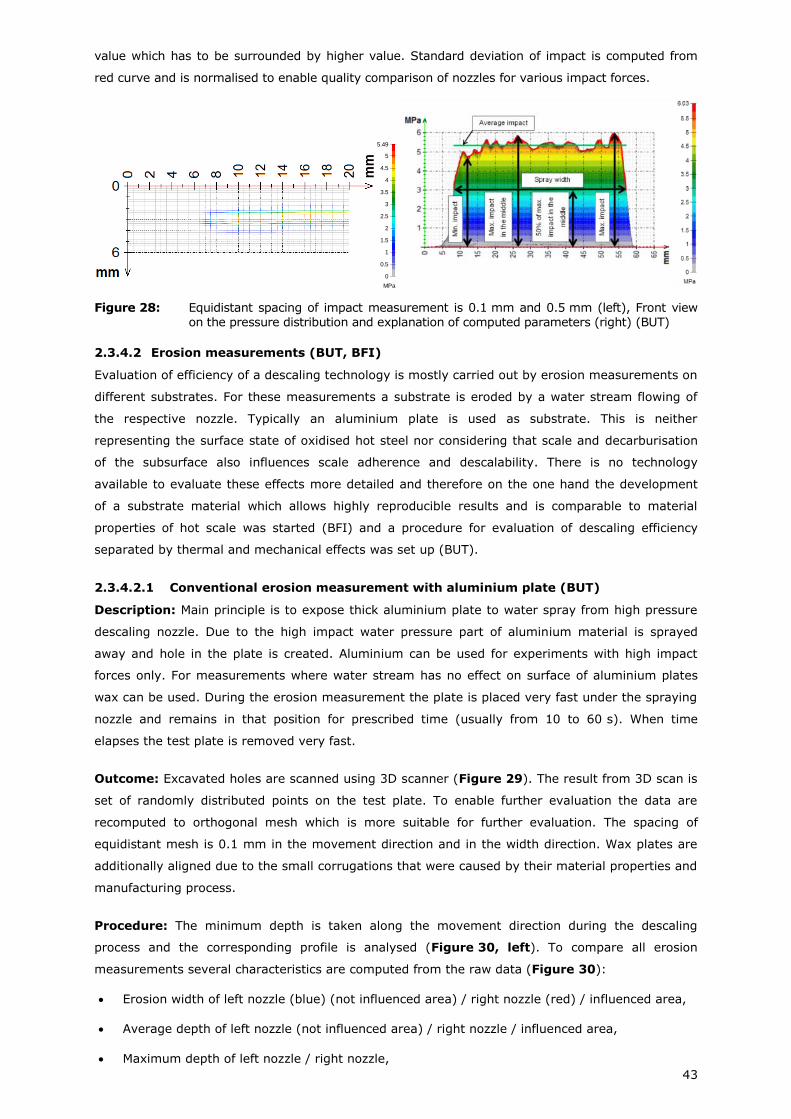
43
value which has to be surrounded by higher value. Standard deviation of impact is computed from
red curve and is normalised to enable quality comparison of nozzles for various impact forces.
Figure 28: Equidistant spacing of impact measurement is 0.1 mm and 0.5 mm (left), Front view on the pressure distribution and explanation of computed parameters (right) (BUT)
2.3.4.2 Erosion measurements (BUT, BFI)
Evaluation of efficiency of a descaling technology is mostly carried out by erosion measurements on
different substrates. For these measurements a substrate is eroded by a water stream flowing of
the respective nozzle. Typically an aluminium plate is used as substrate. This is neither
representing the surface state of oxidised hot steel nor considering that scale and decarburisation
of the subsurface also influences scale adherence and descalability. There is no technology
available to evaluate these effects more detailed and therefore on the one hand the development
of a substrate material which allows highly reproducible results and is comparable to material
properties of hot scale was started (BFI) and a procedure for evaluation of descaling efficiency
separated by thermal and mechanical effects was set up (BUT).
2.3.4.2.1 Conventional erosion measurement with aluminium plate (BUT)
Description: Main principle is to expose thick aluminium plate to water spray from high pressure
descaling nozzle. Due to the high impact water pressure part of aluminium material is sprayed
away and hole in the plate is created. Aluminium can be used for experiments with high impact
forces only. For measurements where water stream has no effect on surface of aluminium plates
wax can be used. During the erosion measurement the plate is placed very fast under the spraying
nozzle and remains in that position for prescribed time (usually from 10 to 60 s). When time
elapses the test plate is removed very fast.
Outcome: Excavated holes are scanned using 3D scanner (Figure 29). The result from 3D scan is
set of randomly distributed points on the test plate. To enable further evaluation the data are
recomputed to orthogonal mesh which is more suitable for further evaluation. The spacing of
equidistant mesh is 0.1 mm in the movement direction and in the width direction. Wax plates are
additionally aligned due to the small corrugations that were caused by their material properties and
manufacturing process.
Procedure: The minimum depth is taken along the movement direction during the descaling
process and the corresponding profile is analysed (Figure 30, left). To compare all erosion
measurements several characteristics are computed from the raw data (Figure 30):
Erosion width of left nozzle (blue) (not influenced area) / right nozzle (red) / influenced area,
Average depth of left nozzle (not influenced area) / right nozzle / influenced area,
Maximum depth of left nozzle / right nozzle,
MPa
0
0.5
1
1.5
2
2.5
3
3.5
4
4.5
5
5.49
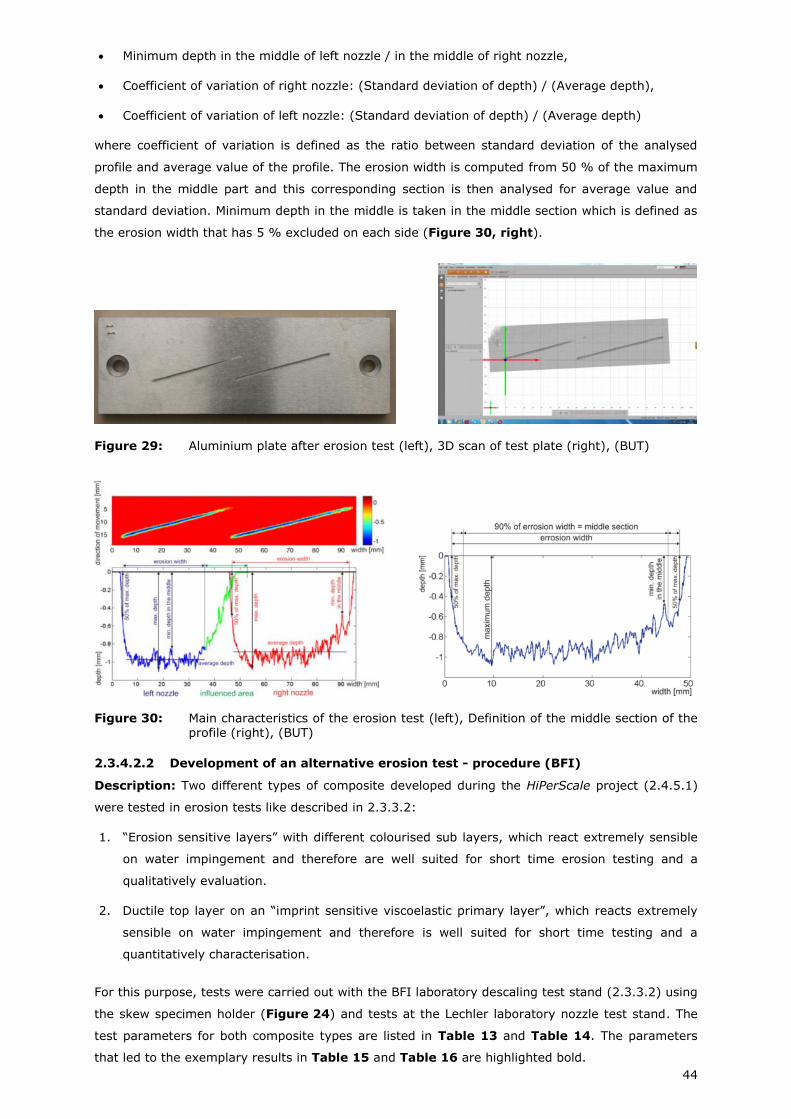
44
Minimum depth in the middle of left nozzle / in the middle of right nozzle,
Coefficient of variation of right nozzle: (Standard deviation of depth) / (Average depth),
Coefficient of variation of left nozzle: (Standard deviation of depth) / (Average depth)
where coefficient of variation is defined as the ratio between standard deviation of the analysed
profile and average value of the profile. The erosion width is computed from 50 % of the maximum
depth in the middle part and this corresponding section is then analysed for average value and
standard deviation. Minimum depth in the middle is taken in the middle section which is defined as
the erosion width that has 5 % excluded on each side (Figure 30, right).
Figure 29: Aluminium plate after erosion test (left), 3D scan of test plate (right), (BUT)
Figure 30: Main characteristics of the erosion test (left), Definition of the middle section of the profile (right), (BUT)
2.3.4.2.2 Development of an alternative erosion test - procedure (BFI)
Description: Two different types of composite developed during the HiPerScale project (2.4.5.1)
were tested in erosion tests like described in 2.3.3.2:
1. “Erosion sensitive layers” with different colourised sub layers, which react extremely sensible
on water impingement and therefore are well suited for short time erosion testing and a
qualitatively evaluation.
2. Ductile top layer on an “imprint sensitive viscoelastic primary layer”, which reacts extremely
sensible on water impingement and therefore is well suited for short time testing and a
quantitatively characterisation.
For this purpose, tests were carried out with the BFI laboratory descaling test stand (2.3.3.2) using
the skew specimen holder (Figure 24) and tests at the Lechler laboratory nozzle test stand. The
test parameters for both composite types are listed in Table 13 and Table 14. The parameters
that led to the exemplary results in Table 15 and Table 16 are highlighted bold.
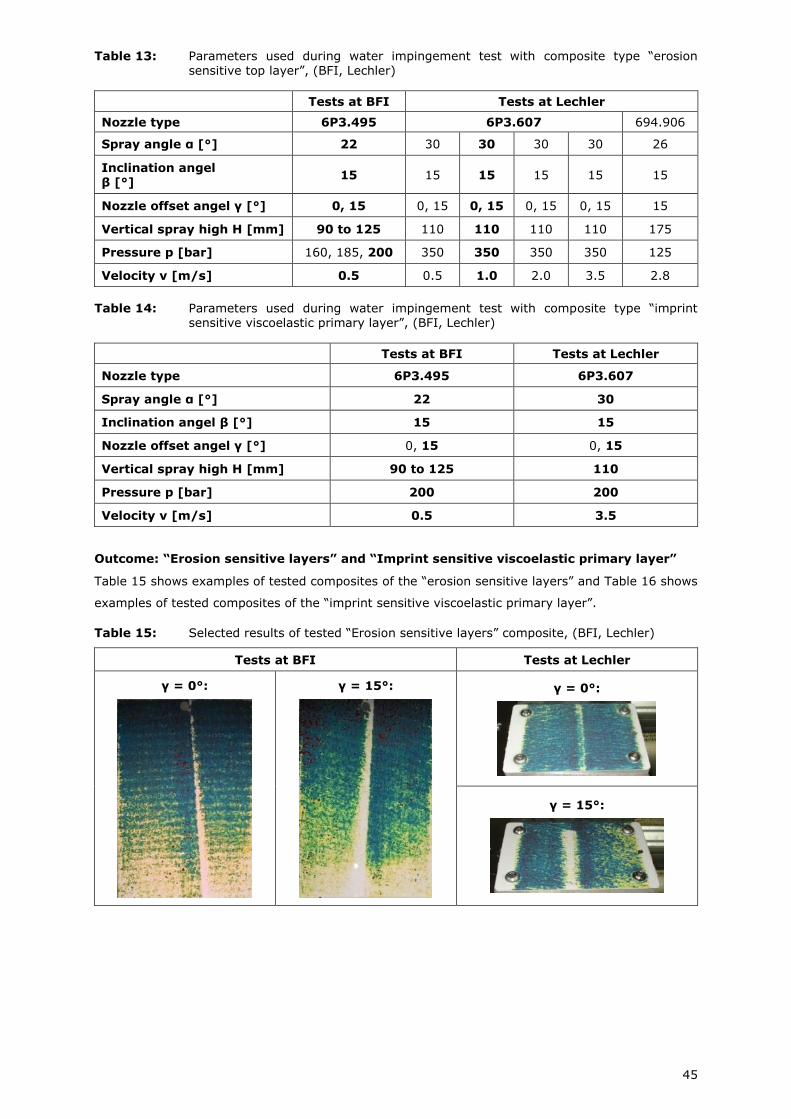
45
Table 13: Parameters used during water impingement test with composite type “erosion sensitive top layer”, (BFI, Lechler)
Tests at BFI Tests at Lechler
Nozzle type 6P3.495 6P3.607 694.906
Spray angle α [°] 22 30 30 30 30 26
Inclination angel β [°]
15 15 15 15 15 15
Nozzle offset angel γ [°] 0, 15 0, 15 0, 15 0, 15 0, 15 15
Vertical spray high H [mm] 90 to 125 110 110 110 110 175
Pressure p [bar] 160, 185, 200 350 350 350 350 125
Velocity v [m/s] 0.5 0.5 1.0 2.0 3.5 2.8
Table 14: Parameters used during water impingement test with composite type “imprint sensitive viscoelastic primary layer”, (BFI, Lechler)
Tests at BFI Tests at Lechler
Nozzle type 6P3.495 6P3.607
Spray angle α [°] 22 30
Inclination angel β [°] 15 15
Nozzle offset angel γ [°] 0, 15 0, 15
Vertical spray high H [mm] 90 to 125 110
Pressure p [bar] 200 200
Velocity v [m/s] 0.5 3.5
Outcome: “Erosion sensitive layers” and “Imprint sensitive viscoelastic primary layer”
Table 15 shows examples of tested composites of the “erosion sensitive layers” and Table 16 shows
examples of tested composites of the “imprint sensitive viscoelastic primary layer”.
Table 15: Selected results of tested “Erosion sensitive layers” composite, (BFI, Lechler)
Tests at BFI Tests at Lechler
γ = 0°:
γ = 15°:
γ = 0°:
γ = 15°:
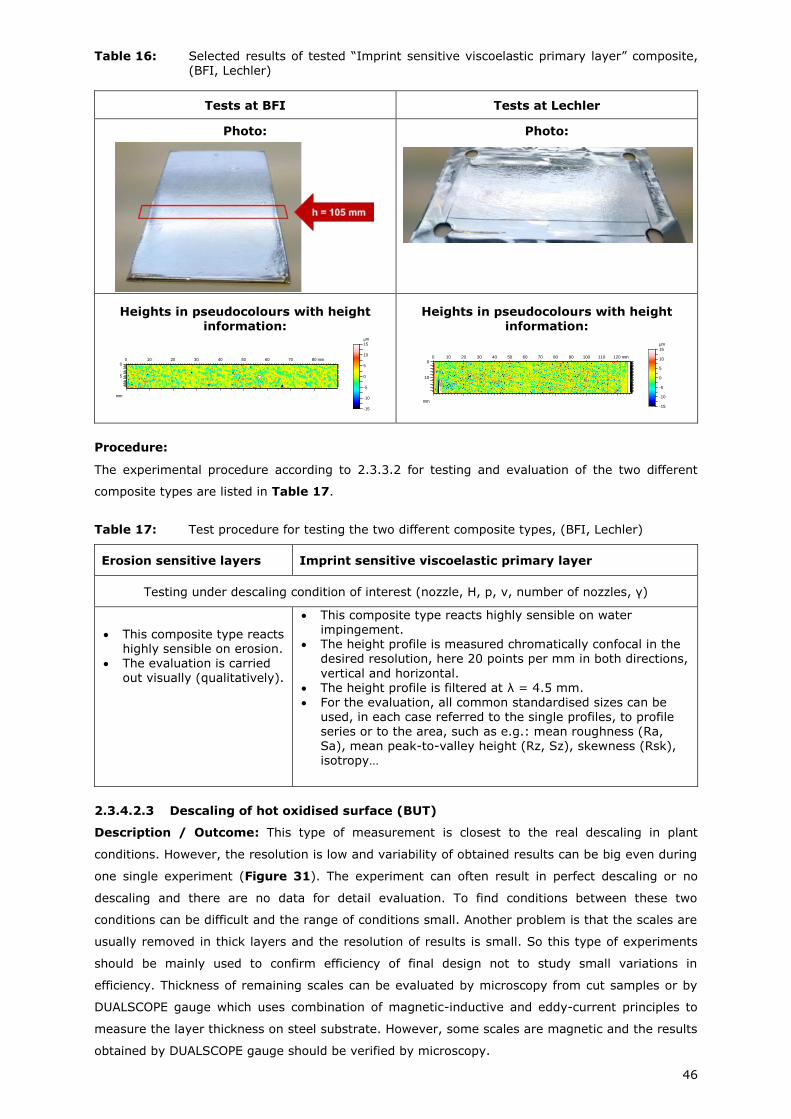
46
Table 16: Selected results of tested “Imprint sensitive viscoelastic primary layer” composite, (BFI, Lechler)
Tests at BFI Tests at Lechler
Photo:
Photo:
Heights in pseudocolours with height information:
Heights in pseudocolours with height information:
Procedure:
The experimental procedure according to 2.3.3.2 for testing and evaluation of the two different
composite types are listed in Table 17.
Table 17: Test procedure for testing the two different composite types, (BFI, Lechler)
Erosion sensitive layers Imprint sensitive viscoelastic primary layer
Testing under descaling condition of interest (nozzle, H, p, v, number of nozzles, γ)
This composite type reacts highly sensible on erosion.
The evaluation is carried out visually (qualitatively).
This composite type reacts highly sensible on water impingement.
The height profile is measured chromatically confocal in the desired resolution, here 20 points per mm in both directions,
vertical and horizontal. The height profile is filtered at λ = 4.5 mm. For the evaluation, all common standardised sizes can be
used, in each case referred to the single profiles, to profile series or to the area, such as e.g.: mean roughness (Ra, Sa), mean peak-to-valley height (Rz, Sz), skewness (Rsk), isotropy…
2.3.4.2.3 Descaling of hot oxidised surface (BUT)
Description / Outcome: This type of measurement is closest to the real descaling in plant
conditions. However, the resolution is low and variability of obtained results can be big even during
one single experiment (Figure 31). The experiment can often result in perfect descaling or no
descaling and there are no data for detail evaluation. To find conditions between these two
conditions can be difficult and the range of conditions small. Another problem is that the scales are
usually removed in thick layers and the resolution of results is small. So this type of experiments
should be mainly used to confirm efficiency of final design not to study small variations in
efficiency. Thickness of remaining scales can be evaluated by microscopy from cut samples or by
DUALSCOPE gauge which uses combination of magnetic-inductive and eddy-current principles to
measure the layer thickness on steel substrate. However, some scales are magnetic and the results
obtained by DUALSCOPE gauge should be verified by microscopy.
0 10 20 30 40 50 60 70 80 mm
mm
0
5
µm
-15
-10
-5
0
5
10
15
0 10 20 30 40 50 60 70 80 90 100 110 120 mm
mm
0
10
µm
-15
-10
-5
0
5
10
15
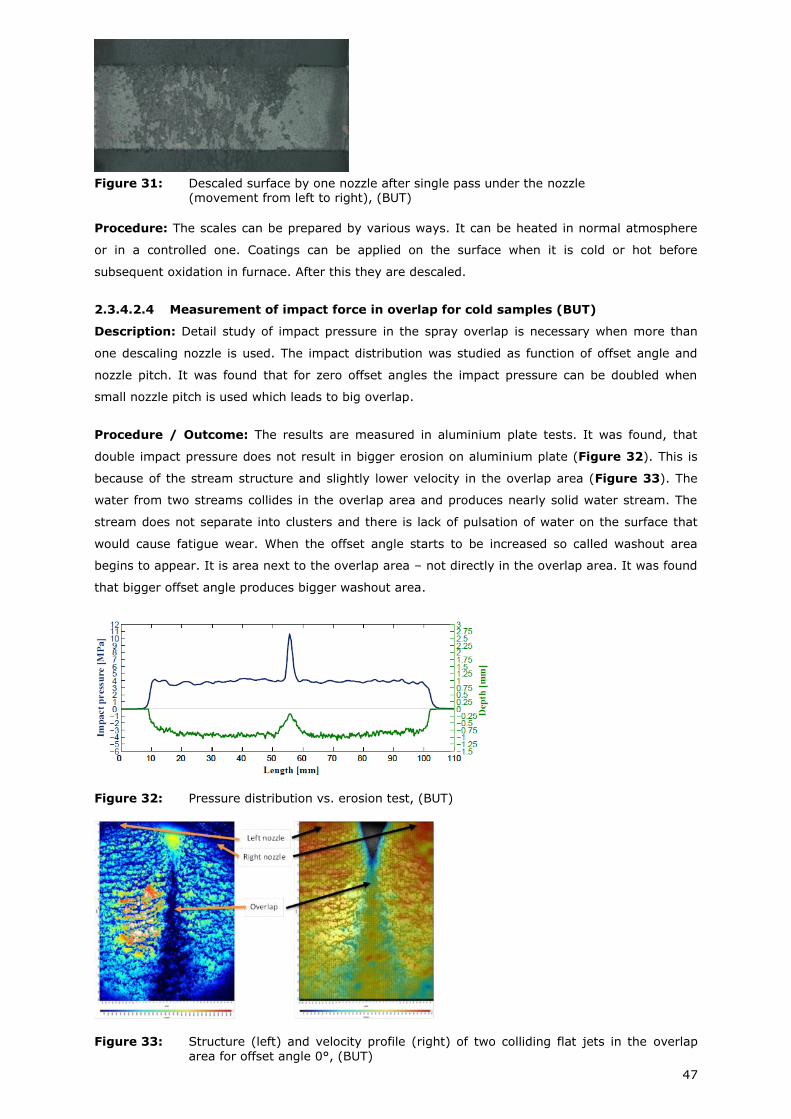
47
Figure 31: Descaled surface by one nozzle after single pass under the nozzle (movement from left to right), (BUT)
Procedure: The scales can be prepared by various ways. It can be heated in normal atmosphere
or in a controlled one. Coatings can be applied on the surface when it is cold or hot before
subsequent oxidation in furnace. After this they are descaled.
2.3.4.2.4 Measurement of impact force in overlap for cold samples (BUT)
Description: Detail study of impact pressure in the spray overlap is necessary when more than
one descaling nozzle is used. The impact distribution was studied as function of offset angle and
nozzle pitch. It was found that for zero offset angles the impact pressure can be doubled when
small nozzle pitch is used which leads to big overlap.
Procedure / Outcome: The results are measured in aluminium plate tests. It was found, that
double impact pressure does not result in bigger erosion on aluminium plate (Figure 32). This is
because of the stream structure and slightly lower velocity in the overlap area (Figure 33). The
water from two streams collides in the overlap area and produces nearly solid water stream. The
stream does not separate into clusters and there is lack of pulsation of water on the surface that
would cause fatigue wear. When the offset angle starts to be increased so called washout area
begins to appear. It is area next to the overlap area – not directly in the overlap area. It was found
that bigger offset angle produces bigger washout area.
Figure 32: Pressure distribution vs. erosion test, (BUT)
Figure 33: Structure (left) and velocity profile (right) of two colliding flat jets in the overlap
area for offset angle 0°, (BUT)
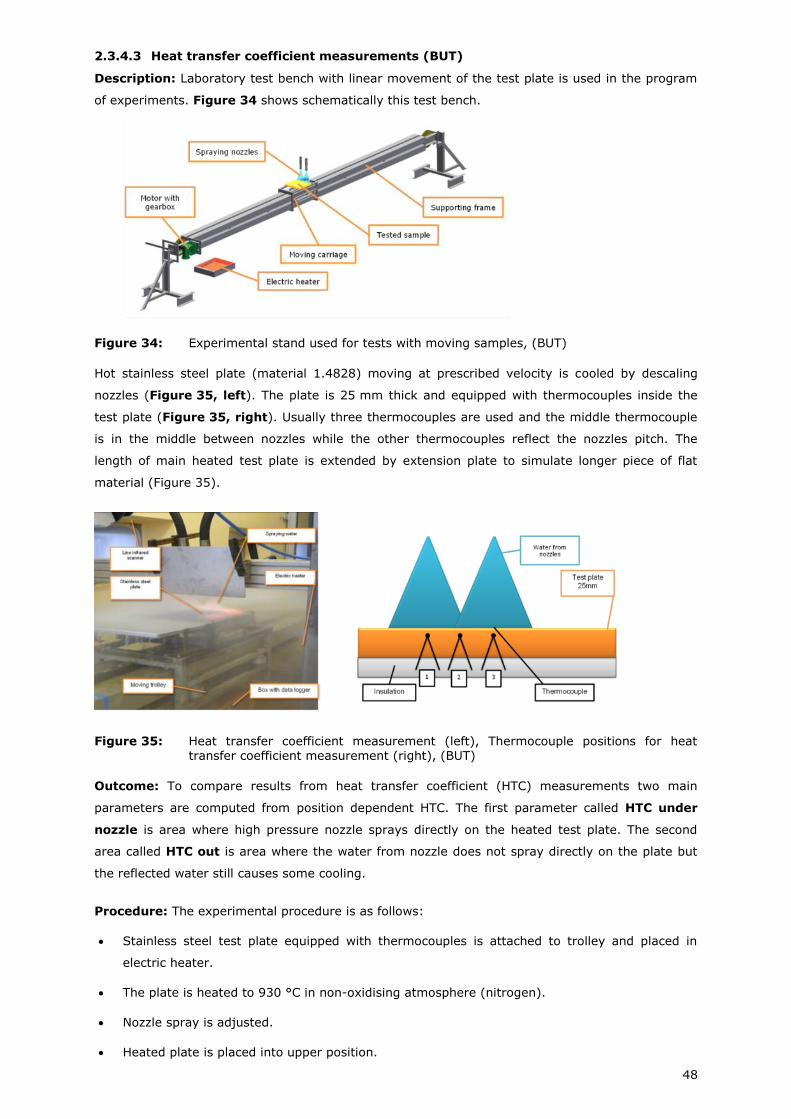
48
2.3.4.3 Heat transfer coefficient measurements (BUT)
Description: Laboratory test bench with linear movement of the test plate is used in the program
of experiments. Figure 34 shows schematically this test bench.
Figure 34: Experimental stand used for tests with moving samples, (BUT)
Hot stainless steel plate (material 1.4828) moving at prescribed velocity is cooled by descaling
nozzles (Figure 35, left). The plate is 25 mm thick and equipped with thermocouples inside the
test plate (Figure 35, right). Usually three thermocouples are used and the middle thermocouple
is in the middle between nozzles while the other thermocouples reflect the nozzles pitch. The
length of main heated test plate is extended by extension plate to simulate longer piece of flat
material (Figure 35).
Figure 35: Heat transfer coefficient measurement (left), Thermocouple positions for heat transfer coefficient measurement (right), (BUT)
Outcome: To compare results from heat transfer coefficient (HTC) measurements two main
parameters are computed from position dependent HTC. The first parameter called HTC under
nozzle is area where high pressure nozzle sprays directly on the heated test plate. The second
area called HTC out is area where the water from nozzle does not spray directly on the plate but
the reflected water still causes some cooling.
Procedure: The experimental procedure is as follows:
Stainless steel test plate equipped with thermocouples is attached to trolley and placed in
electric heater.
The plate is heated to 930 °C in non-oxidising atmosphere (nitrogen).
Nozzle spray is adjusted.
Heated plate is placed into upper position.
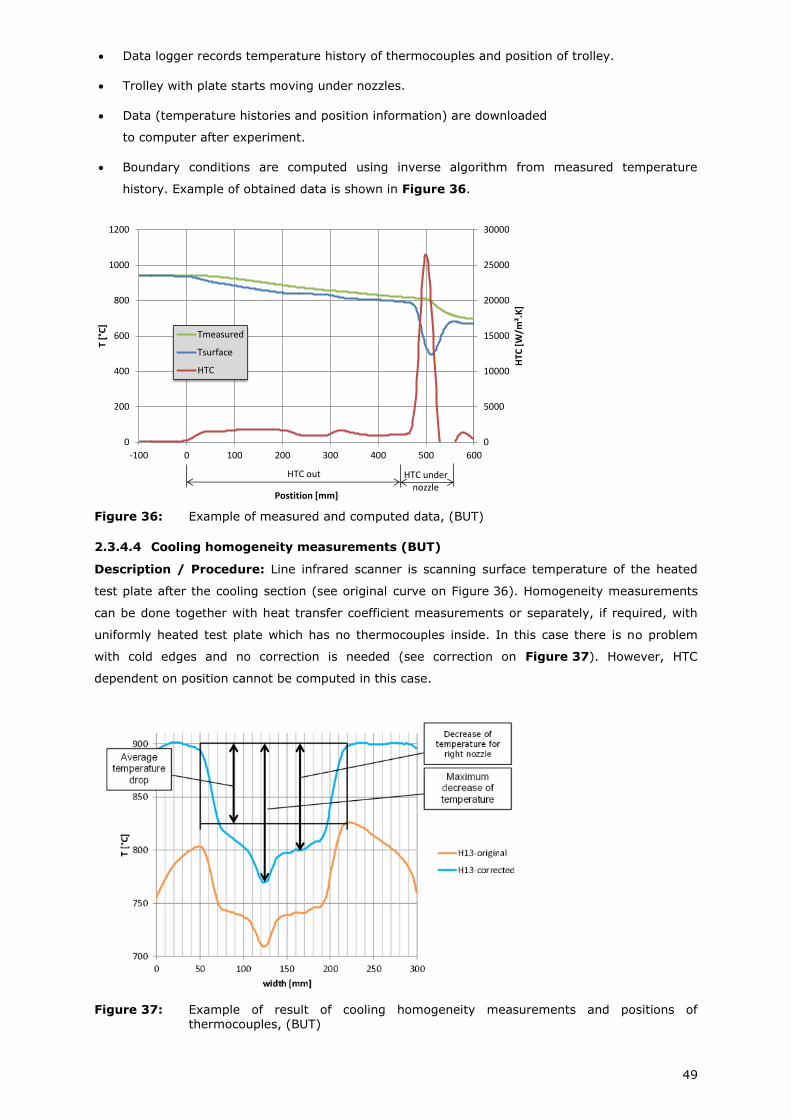
49
Data logger records temperature history of thermocouples and position of trolley.
Trolley with plate starts moving under nozzles.
Data (temperature histories and position information) are downloaded
to computer after experiment.
Boundary conditions are computed using inverse algorithm from measured temperature
history. Example of obtained data is shown in Figure 36.
Figure 36: Example of measured and computed data, (BUT)
2.3.4.4 Cooling homogeneity measurements (BUT)
Description / Procedure: Line infrared scanner is scanning surface temperature of the heated
test plate after the cooling section (see original curve on Figure 36). Homogeneity measurements
can be done together with heat transfer coefficient measurements or separately, if required, with
uniformly heated test plate which has no thermocouples inside. In this case there is no problem
with cold edges and no correction is needed (see correction on Figure 37). However, HTC
dependent on position cannot be computed in this case.
Figure 37: Example of result of cooling homogeneity measurements and positions of
thermocouples, (BUT)
0
5000
10000
15000
20000
25000
30000
0
200
400
600
800
1000
1200
-100 0 100 200 300 400 500 600
HTC
[W
/m².
K]
T [°
C]
Postition [mm]
Tmeasured
Tsurface
HTC
HTC out HTC undernozzle
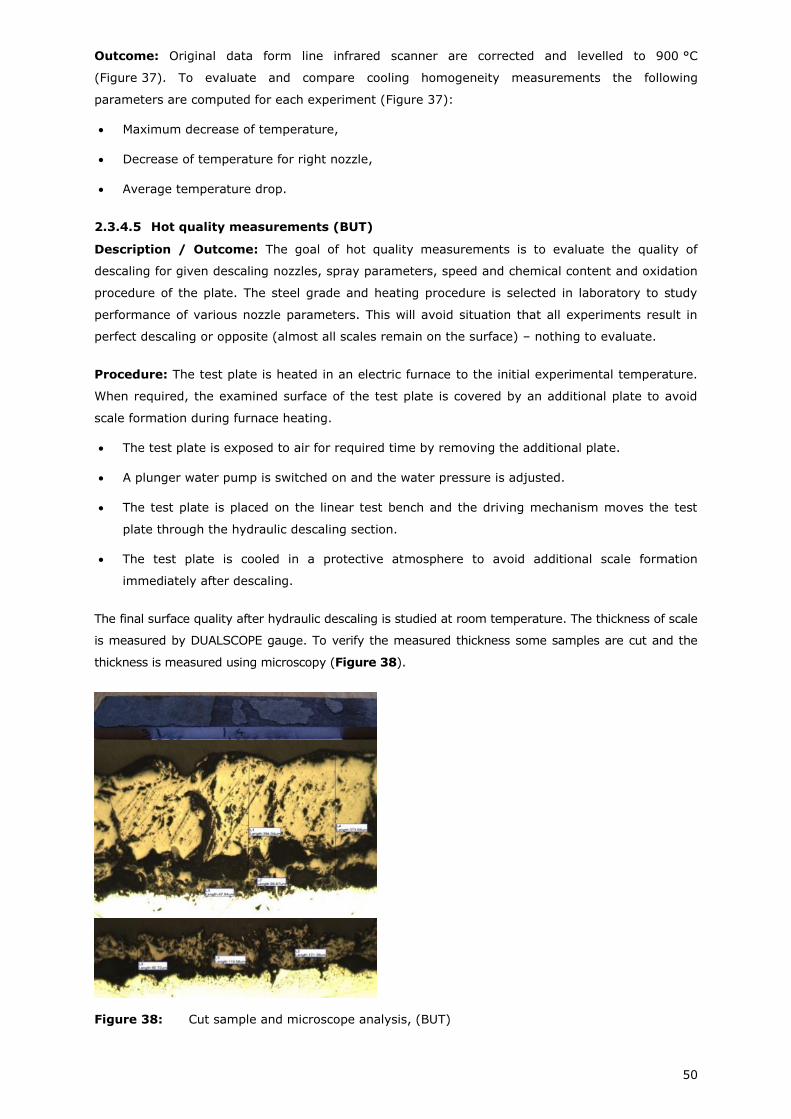
50
Outcome: Original data form line infrared scanner are corrected and levelled to 900 °C
(Figure 37). To evaluate and compare cooling homogeneity measurements the following
parameters are computed for each experiment (Figure 37):
Maximum decrease of temperature,
Decrease of temperature for right nozzle,
Average temperature drop.
2.3.4.5 Hot quality measurements (BUT)
Description / Outcome: The goal of hot quality measurements is to evaluate the quality of
descaling for given descaling nozzles, spray parameters, speed and chemical content and oxidation
procedure of the plate. The steel grade and heating procedure is selected in laboratory to study
performance of various nozzle parameters. This will avoid situation that all experiments result in
perfect descaling or opposite (almost all scales remain on the surface) – nothing to evaluate.
Procedure: The test plate is heated in an electric furnace to the initial experimental temperature.
When required, the examined surface of the test plate is covered by an additional plate to avoid
scale formation during furnace heating.
The test plate is exposed to air for required time by removing the additional plate.
A plunger water pump is switched on and the water pressure is adjusted.
The test plate is placed on the linear test bench and the driving mechanism moves the test
plate through the hydraulic descaling section.
The test plate is cooled in a protective atmosphere to avoid additional scale formation
immediately after descaling.
The final surface quality after hydraulic descaling is studied at room temperature. The thickness of scale
is measured by DUALSCOPE gauge. To verify the measured thickness some samples are cut and the
thickness is measured using microscopy (Figure 38).
Figure 38: Cut sample and microscope analysis, (BUT)
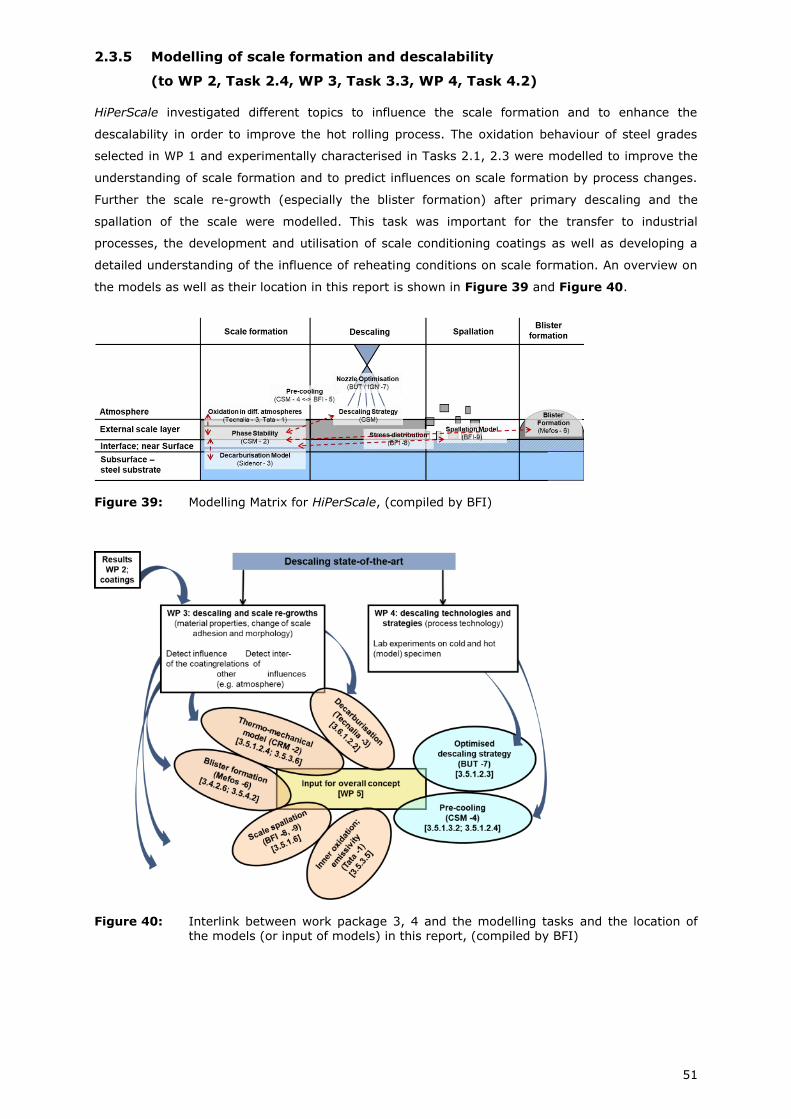
51
2.3.5 Modelling of scale formation and descalability
(to WP 2, Task 2.4, WP 3, Task 3.3, WP 4, Task 4.2)
HiPerScale investigated different topics to influence the scale formation and to enhance the
descalability in order to improve the hot rolling process. The oxidation behaviour of steel grades
selected in WP 1 and experimentally characterised in Tasks 2.1, 2.3 were modelled to improve the
understanding of scale formation and to predict influences on scale formation by process changes.
Further the scale re-growth (especially the blister formation) after primary descaling and the
spallation of the scale were modelled. This task was important for the transfer to industrial
processes, the development and utilisation of scale conditioning coatings as well as developing a
detailed understanding of the influence of reheating conditions on scale formation. An overview on
the models as well as their location in this report is shown in Figure 39 and Figure 40.
Figure 39: Modelling Matrix for HiPerScale, (compiled by BFI)
Figure 40: Interlink between work package 3, 4 and the modelling tasks and the location of the models (or input of models) in this report, (compiled by BFI)

52
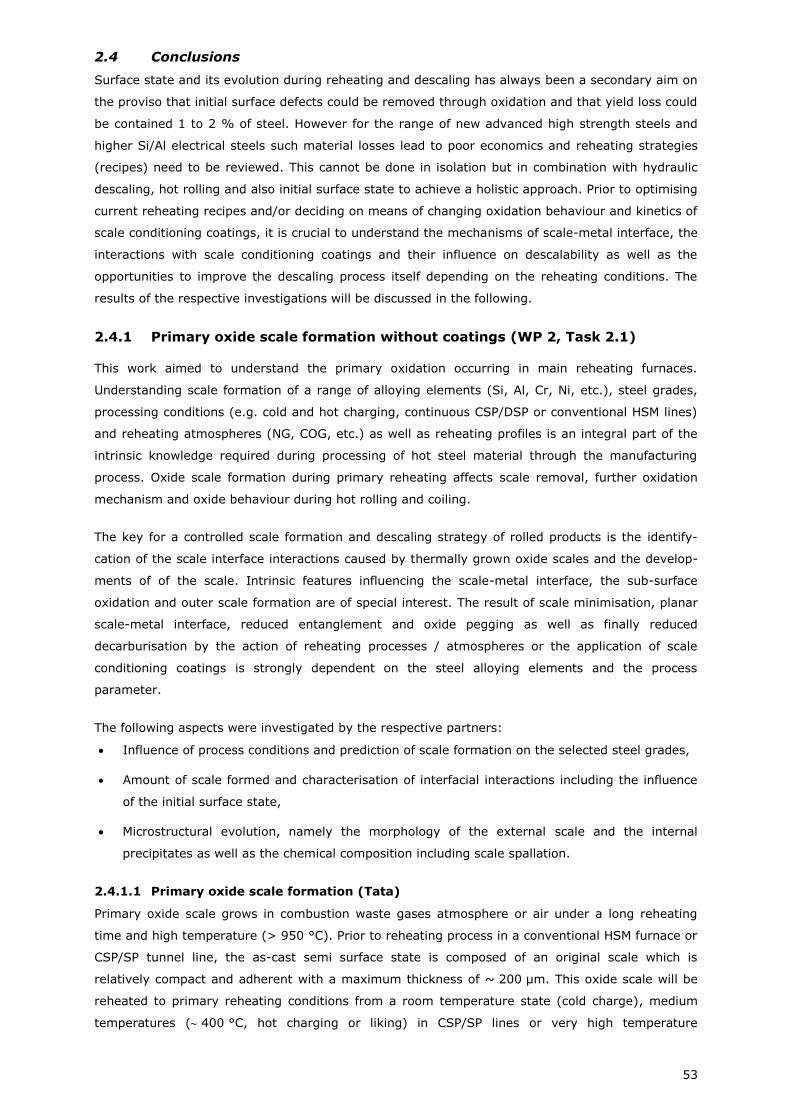
53
2.4 Conclusions
Surface state and its evolution during reheating and descaling has always been a secondary aim on
the proviso that initial surface defects could be removed through oxidation and that yield loss could
be contained 1 to 2 % of steel. However for the range of new advanced high strength steels and
higher Si/Al electrical steels such material losses lead to poor economics and reheating strategies
(recipes) need to be reviewed. This cannot be done in isolation but in combination with hydraulic
descaling, hot rolling and also initial surface state to achieve a holistic approach. Prior to optimising
current reheating recipes and/or deciding on means of changing oxidation behaviour and kinetics of
scale conditioning coatings, it is crucial to understand the mechanisms of scale-metal interface, the
interactions with scale conditioning coatings and their influence on descalability as well as the
opportunities to improve the descaling process itself depending on the reheating conditions. The
results of the respective investigations will be discussed in the following.
2.4.1 Primary oxide scale formation without coatings (WP 2, Task 2.1)
This work aimed to understand the primary oxidation occurring in main reheating furnaces.
Understanding scale formation of a range of alloying elements (Si, Al, Cr, Ni, etc.), steel grades,
processing conditions (e.g. cold and hot charging, continuous CSP/DSP or conventional HSM lines)
and reheating atmospheres (NG, COG, etc.) as well as reheating profiles is an integral part of the
intrinsic knowledge required during processing of hot steel material through the manufacturing
process. Oxide scale formation during primary reheating affects scale removal, further oxidation
mechanism and oxide behaviour during hot rolling and coiling.
The key for a controlled scale formation and descaling strategy of rolled products is the identify-
cation of the scale interface interactions caused by thermally grown oxide scales and the develop-
ments of of the scale. Intrinsic features influencing the scale-metal interface, the sub-surface
oxidation and outer scale formation are of special interest. The result of scale minimisation, planar
scale-metal interface, reduced entanglement and oxide pegging as well as finally reduced
decarburisation by the action of reheating processes / atmospheres or the application of scale
conditioning coatings is strongly dependent on the steel alloying elements and the process
parameter.
The following aspects were investigated by the respective partners:
Influence of process conditions and prediction of scale formation on the selected steel grades,
Amount of scale formed and characterisation of interfacial interactions including the influence
of the initial surface state,
Microstructural evolution, namely the morphology of the external scale and the internal
precipitates as well as the chemical composition including scale spallation.
2.4.1.1 Primary oxide scale formation (Tata)
Primary oxide scale grows in combustion waste gases atmosphere or air under a long reheating
time and high temperature (> 950 °C). Prior to reheating process in a conventional HSM furnace or
CSP/SP tunnel line, the as-cast semi surface state is composed of an original scale which is
relatively compact and adherent with a maximum thickness of ~ 200 µm. This oxide scale will be
reheated to primary reheating conditions from a room temperature state (cold charge), medium
temperatures ( 400 °C, hot charging or liking) in CSP/SP lines or very high temperature
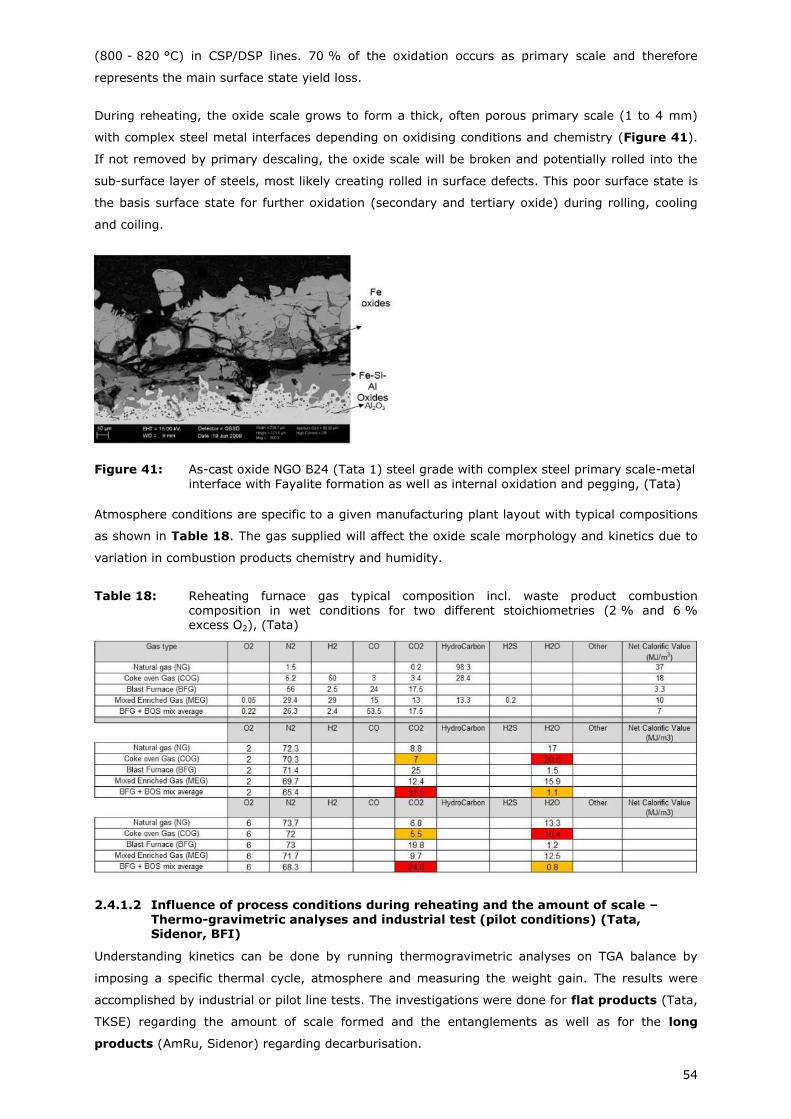
54
(800 - 820 °C) in CSP/DSP lines. 70 % of the oxidation occurs as primary scale and therefore
represents the main surface state yield loss.
During reheating, the oxide scale grows to form a thick, often porous primary scale (1 to 4 mm)
with complex steel metal interfaces depending on oxidising conditions and chemistry (Figure 41).
If not removed by primary descaling, the oxide scale will be broken and potentially rolled into the
sub-surface layer of steels, most likely creating rolled in surface defects. This poor surface state is
the basis surface state for further oxidation (secondary and tertiary oxide) during rolling, cooling
and coiling.
Figure 41: As-cast oxide NGO B24 (Tata 1) steel grade with complex steel primary scale-metal
interface with Fayalite formation as well as internal oxidation and pegging, (Tata)
Atmosphere conditions are specific to a given manufacturing plant layout with typical compositions
as shown in Table 18. The gas supplied will affect the oxide scale morphology and kinetics due to
variation in combustion products chemistry and humidity.
Table 18: Reheating furnace gas typical composition incl. waste product combustion composition in wet conditions for two different stoichiometries (2 % and 6 % excess O2), (Tata)
2.4.1.2 Influence of process conditions during reheating and the amount of scale – Thermo-gravimetric analyses and industrial test (pilot conditions) (Tata, Sidenor, BFI)
Understanding kinetics can be done by running thermogravimetric analyses on TGA balance by
imposing a specific thermal cycle, atmosphere and measuring the weight gain. The results were
accomplished by industrial or pilot line tests. The investigations were done for flat products (Tata,
TKSE) regarding the amount of scale formed and the entanglements as well as for the long
products (AmRu, Sidenor) regarding decarburisation.
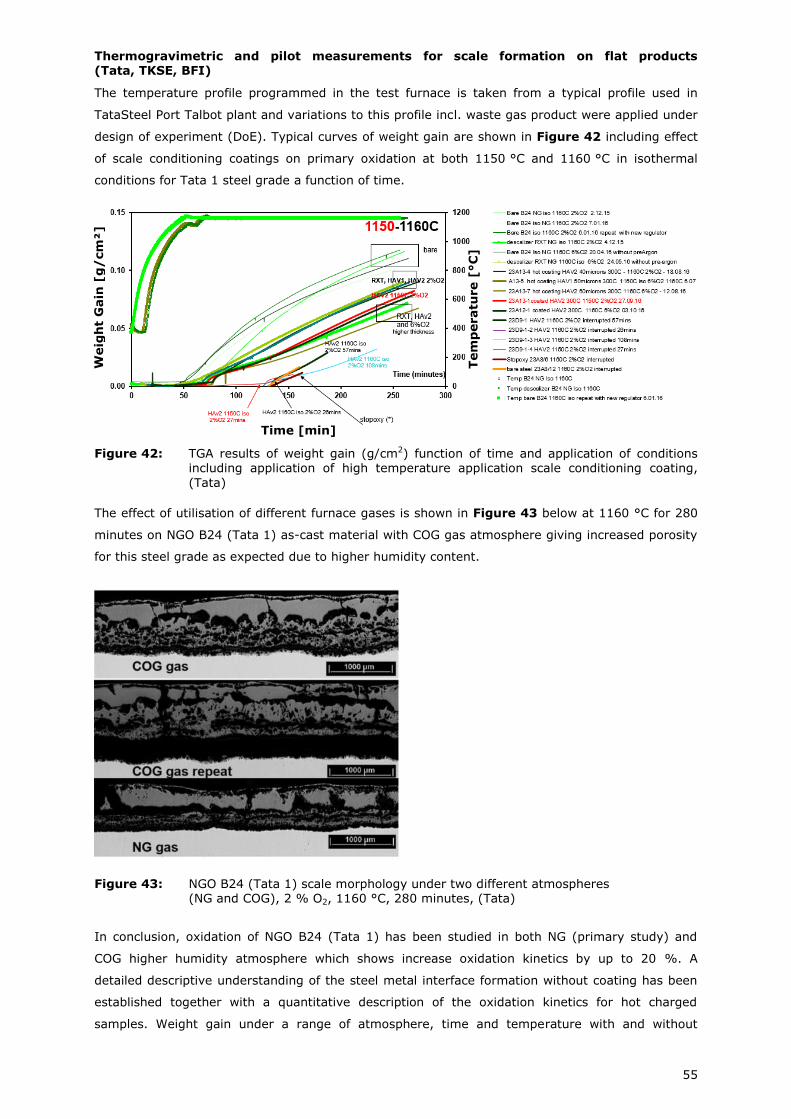
55
Thermogravimetric and pilot measurements for scale formation on flat products (Tata, TKSE, BFI)
The temperature profile programmed in the test furnace is taken from a typical profile used in
TataSteel Port Talbot plant and variations to this profile incl. waste gas product were applied under
design of experiment (DoE). Typical curves of weight gain are shown in Figure 42 including effect
of scale conditioning coatings on primary oxidation at both 1150 °C and 1160 °C in isothermal
conditions for Tata 1 steel grade a function of time.
Figure 42: TGA results of weight gain (g/cm2) function of time and application of conditions including application of high temperature application scale conditioning coating,
(Tata)
The effect of utilisation of different furnace gases is shown in Figure 43 below at 1160 °C for 280
minutes on NGO B24 (Tata 1) as-cast material with COG gas atmosphere giving increased porosity
for this steel grade as expected due to higher humidity content.
Figure 43: NGO B24 (Tata 1) scale morphology under two different atmospheres (NG and COG), 2 % O2, 1160 °C, 280 minutes, (Tata)
In conclusion, oxidation of NGO B24 (Tata 1) has been studied in both NG (primary study) and
COG higher humidity atmosphere which shows increase oxidation kinetics by up to 20 %. A
detailed descriptive understanding of the steel metal interface formation without coating has been
established together with a quantitative description of the oxidation kinetics for hot charged
samples. Weight gain under a range of atmosphere, time and temperature with and without
Weig
ht
Gain
[g
/cm
²]
Tem
peratu
re [
°C
]
Time [min]
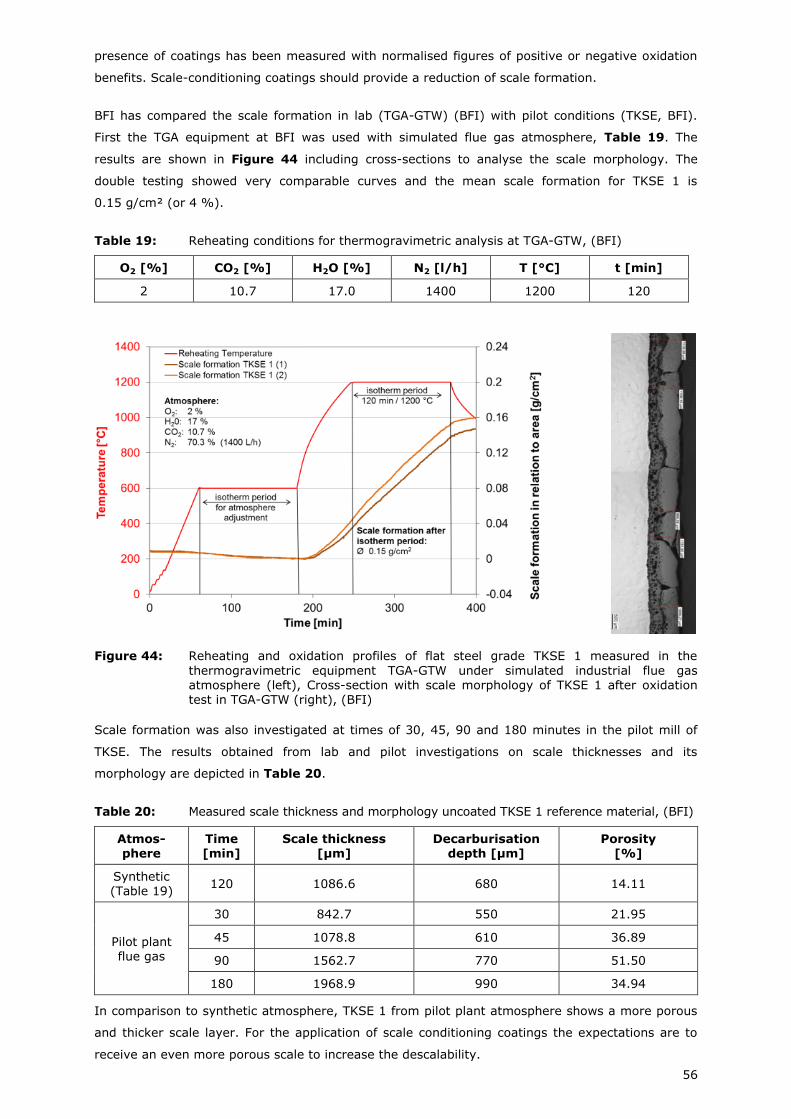
56
presence of coatings has been measured with normalised figures of positive or negative oxidation
benefits. Scale-conditioning coatings should provide a reduction of scale formation.
BFI has compared the scale formation in lab (TGA-GTW) (BFI) with pilot conditions (TKSE, BFI).
First the TGA equipment at BFI was used with simulated flue gas atmosphere, Table 19. The
results are shown in Figure 44 including cross-sections to analyse the scale morphology. The
double testing showed very comparable curves and the mean scale formation for TKSE 1 is
0.15 g/cm² (or 4 %).
Table 19: Reheating conditions for thermogravimetric analysis at TGA-GTW, (BFI)
O2 [%] CO2 [%] H2O [%] N2 [l/h] T [°C] t [min]
2 10.7 17.0 1400 1200 120
Figure 44: Reheating and oxidation profiles of flat steel grade TKSE 1 measured in the
thermogravimetric equipment TGA-GTW under simulated industrial flue gas atmosphere (left), Cross-section with scale morphology of TKSE 1 after oxidation test in TGA-GTW (right), (BFI)
Scale formation was also investigated at times of 30, 45, 90 and 180 minutes in the pilot mill of
TKSE. The results obtained from lab and pilot investigations on scale thicknesses and its
morphology are depicted in Table 20.
Table 20: Measured scale thickness and morphology uncoated TKSE 1 reference material, (BFI)
Atmos-phere
Time [min]
Scale thickness [µm]
Decarburisation depth [µm]
Porosity [%]
Synthetic (Table 19)
120 1086.6 680 14.11
Pilot plant flue gas
30 842.7 550 21.95
45 1078.8 610 36.89
90 1562.7 770 51.50
180 1968.9 990 34.94
In comparison to synthetic atmosphere, TKSE 1 from pilot plant atmosphere shows a more porous
and thicker scale layer. For the application of scale conditioning coatings the expectations are to
receive an even more porous scale to increase the descalability.
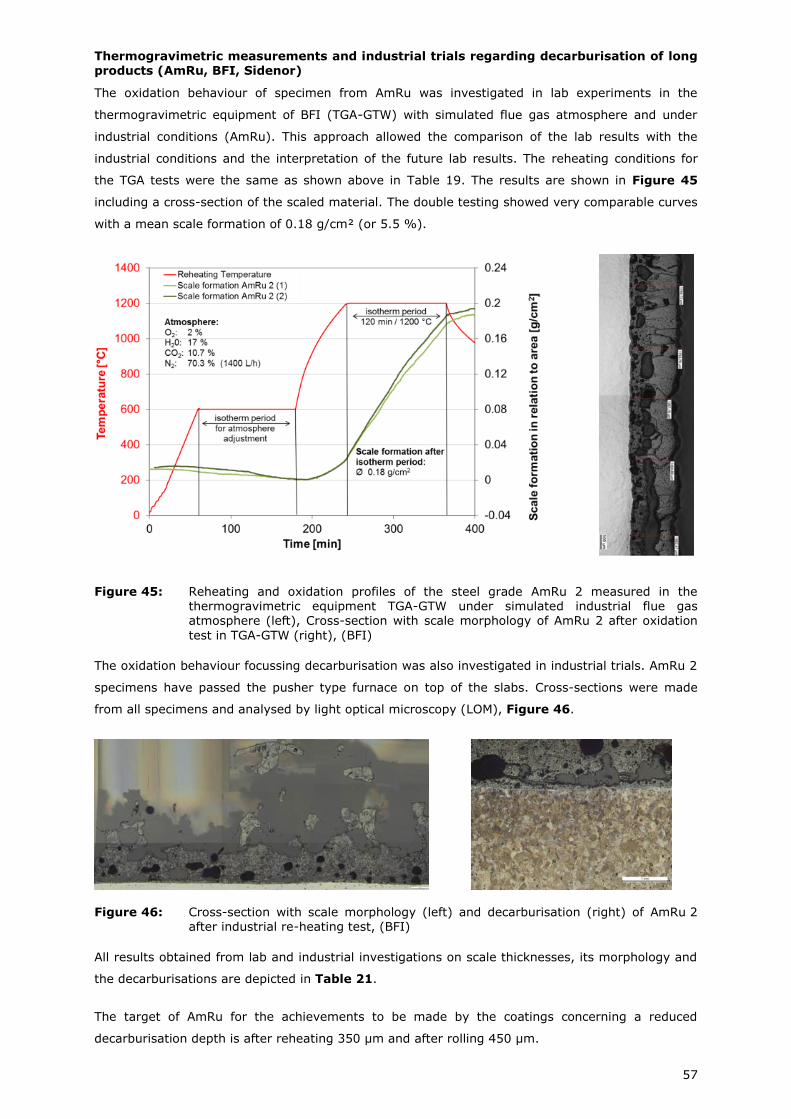
57
Thermogravimetric measurements and industrial trials regarding decarburisation of long products (AmRu, BFI, Sidenor)
The oxidation behaviour of specimen from AmRu was investigated in lab experiments in the
thermogravimetric equipment of BFI (TGA-GTW) with simulated flue gas atmosphere and under
industrial conditions (AmRu). This approach allowed the comparison of the lab results with the
industrial conditions and the interpretation of the future lab results. The reheating conditions for
the TGA tests were the same as shown above in Table 19. The results are shown in Figure 45
including a cross-section of the scaled material. The double testing showed very comparable curves
with a mean scale formation of 0.18 g/cm² (or 5.5 %).
Figure 45: Reheating and oxidation profiles of the steel grade AmRu 2 measured in the thermogravimetric equipment TGA-GTW under simulated industrial flue gas atmosphere (left), Cross-section with scale morphology of AmRu 2 after oxidation
test in TGA-GTW (right), (BFI)
The oxidation behaviour focussing decarburisation was also investigated in industrial trials. AmRu 2
specimens have passed the pusher type furnace on top of the slabs. Cross-sections were made
from all specimens and analysed by light optical microscopy (LOM), Figure 46.
Figure 46: Cross-section with scale morphology (left) and decarburisation (right) of AmRu 2 after industrial re-heating test, (BFI)
All results obtained from lab and industrial investigations on scale thicknesses, its morphology and
the decarburisations are depicted in Table 21.
The target of AmRu for the achievements to be made by the coatings concerning a reduced
decarburisation depth is after reheating 350 µm and after rolling 450 µm.
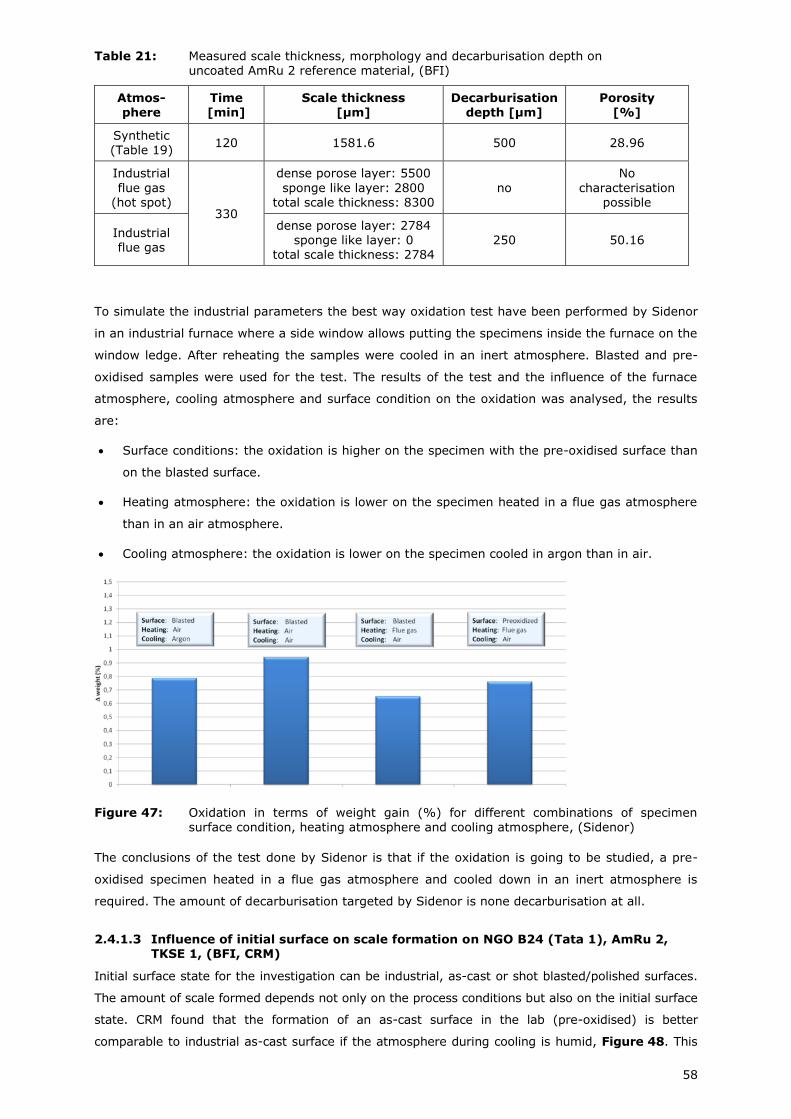
58
Table 21: Measured scale thickness, morphology and decarburisation depth on uncoated AmRu 2 reference material, (BFI)
Atmos-phere
Time [min]
Scale thickness [µm]
Decarburisation depth [µm]
Porosity [%]
Synthetic (Table 19)
120 1581.6 500 28.96
Industrial
flue gas (hot spot)
330
dense porose layer: 5500
sponge like layer: 2800 total scale thickness: 8300
no
No
characterisation possible
Industrial flue gas
dense porose layer: 2784 sponge like layer: 0
total scale thickness: 2784 250 50.16
To simulate the industrial parameters the best way oxidation test have been performed by Sidenor
in an industrial furnace where a side window allows putting the specimens inside the furnace on the
window ledge. After reheating the samples were cooled in an inert atmosphere. Blasted and pre-
oxidised samples were used for the test. The results of the test and the influence of the furnace
atmosphere, cooling atmosphere and surface condition on the oxidation was analysed, the results
are:
Surface conditions: the oxidation is higher on the specimen with the pre-oxidised surface than
on the blasted surface.
Heating atmosphere: the oxidation is lower on the specimen heated in a flue gas atmosphere
than in an air atmosphere.
Cooling atmosphere: the oxidation is lower on the specimen cooled in argon than in air.
Figure 47: Oxidation in terms of weight gain (%) for different combinations of specimen
surface condition, heating atmosphere and cooling atmosphere, (Sidenor)
The conclusions of the test done by Sidenor is that if the oxidation is going to be studied, a pre-
oxidised specimen heated in a flue gas atmosphere and cooled down in an inert atmosphere is
required. The amount of decarburisation targeted by Sidenor is none decarburisation at all.
2.4.1.3 Influence of initial surface on scale formation on NGO B24 (Tata 1), AmRu 2, TKSE 1, (BFI, CRM)
Initial surface state for the investigation can be industrial, as-cast or shot blasted/polished surfaces.
The amount of scale formed depends not only on the process conditions but also on the initial surface
state. CRM found that the formation of an as-cast surface in the lab (pre-oxidised) is better
comparable to industrial as-cast surface if the atmosphere during cooling is humid, Figure 48. This
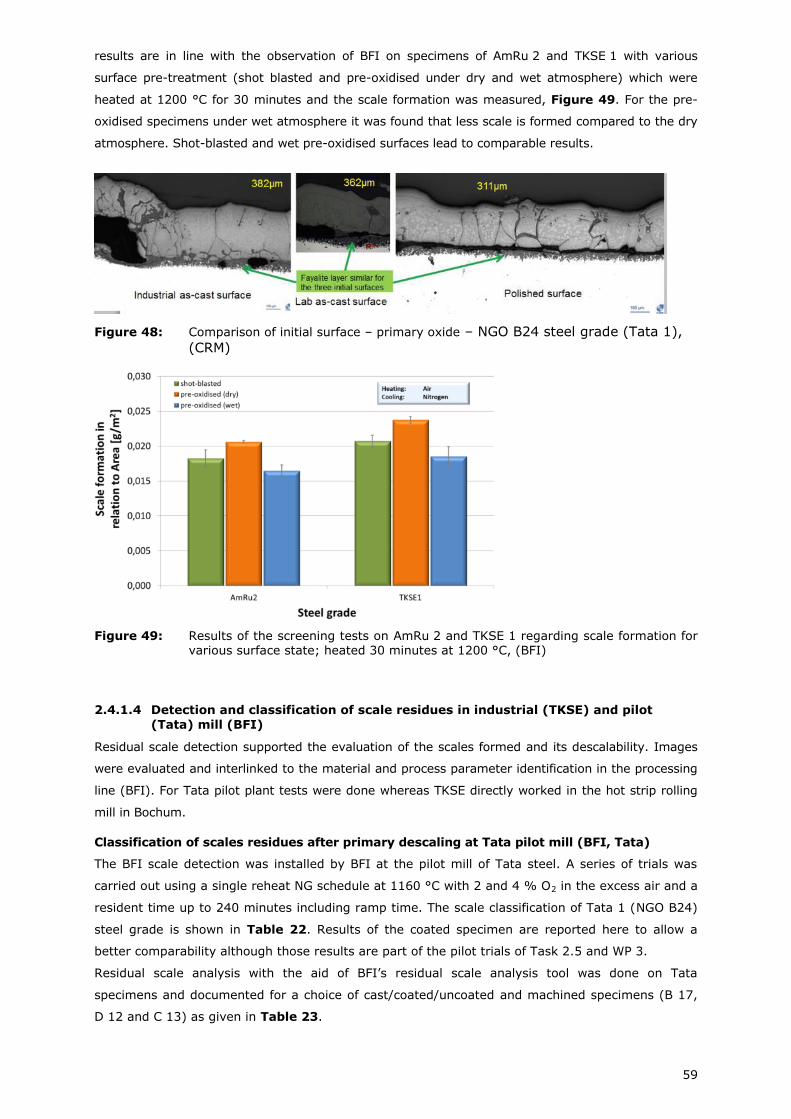
59
results are in line with the observation of BFI on specimens of AmRu 2 and TKSE 1 with various
surface pre-treatment (shot blasted and pre-oxidised under dry and wet atmosphere) which were
heated at 1200 °C for 30 minutes and the scale formation was measured, Figure 49. For the pre-
oxidised specimens under wet atmosphere it was found that less scale is formed compared to the dry
atmosphere. Shot-blasted and wet pre-oxidised surfaces lead to comparable results.
Figure 48: Comparison of initial surface – primary oxide – NGO B24 steel grade (Tata 1),
(CRM)
Figure 49: Results of the screening tests on AmRu 2 and TKSE 1 regarding scale formation for various surface state; heated 30 minutes at 1200 °C, (BFI)
2.4.1.4 Detection and classification of scale residues in industrial (TKSE) and pilot
(Tata) mill (BFI)
Residual scale detection supported the evaluation of the scales formed and its descalability. Images
were evaluated and interlinked to the material and process parameter identification in the processing
line (BFI). For Tata pilot plant tests were done whereas TKSE directly worked in the hot strip rolling
mill in Bochum.
Classification of scales residues after primary descaling at Tata pilot mill (BFI, Tata)
The BFI scale detection was installed by BFI at the pilot mill of Tata steel. A series of trials was
carried out using a single reheat NG schedule at 1160 °C with 2 and 4 % O2 in the excess air and a
resident time up to 240 minutes including ramp time. The scale classification of Tata 1 (NGO B24)
steel grade is shown in Table 22. Results of the coated specimen are reported here to allow a
better comparability although those results are part of the pilot trials of Task 2.5 and WP 3.
Residual scale analysis with the aid of BFI’s residual scale analysis tool was done on Tata
specimens and documented for a choice of cast/coated/uncoated and machined specimens (B 17,
D 12 and C 13) as given in Table 23.
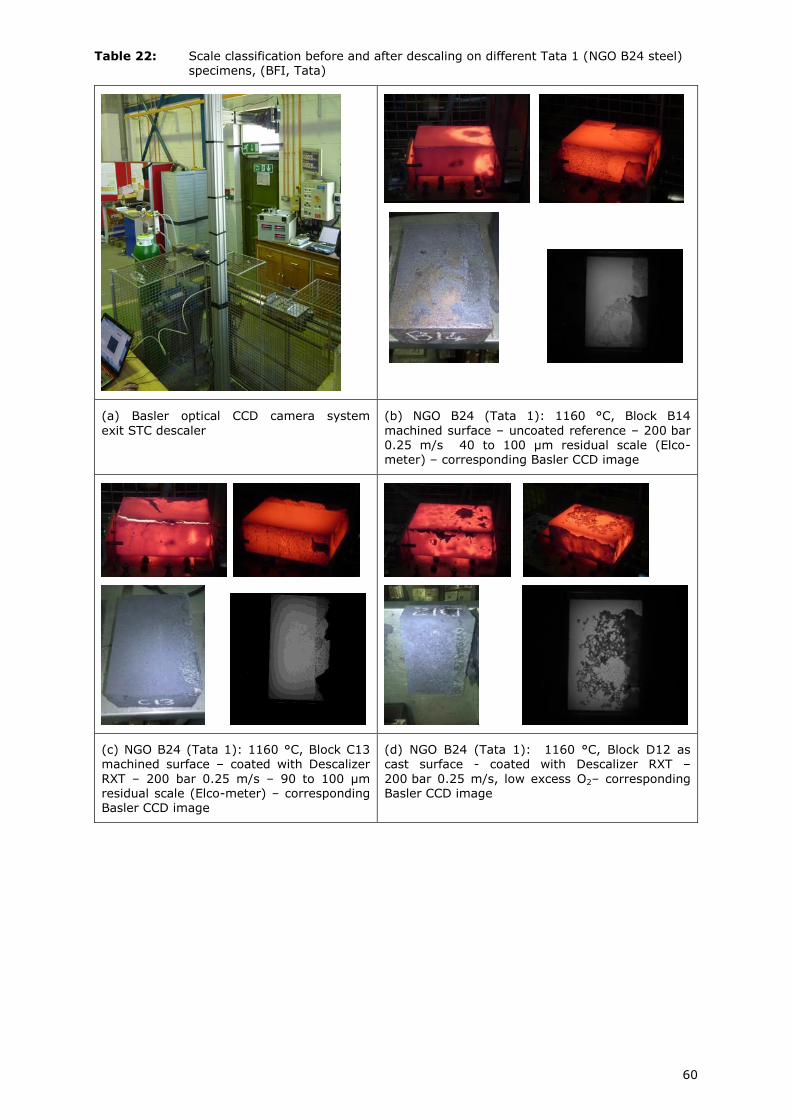
60
Table 22: Scale classification before and after descaling on different Tata 1 (NGO B24 steel) specimens, (BFI, Tata)
(a) Basler optical CCD camera system
exit STC descaler
(b) NGO B24 (Tata 1): 1160 °C, Block B14
machined surface – uncoated reference – 200 bar 0.25 m/s 40 to 100 µm residual scale (Elco-meter) – corresponding Basler CCD image
(c) NGO B24 (Tata 1): 1160 °C, Block C13 machined surface – coated with Descalizer
RXT – 200 bar 0.25 m/s – 90 to 100 µm residual scale (Elco-meter) – corresponding Basler CCD image
(d) NGO B24 (Tata 1): 1160 °C, Block D12 as cast surface - coated with Descalizer RXT –
200 bar 0.25 m/s, low excess O2– corresponding Basler CCD image
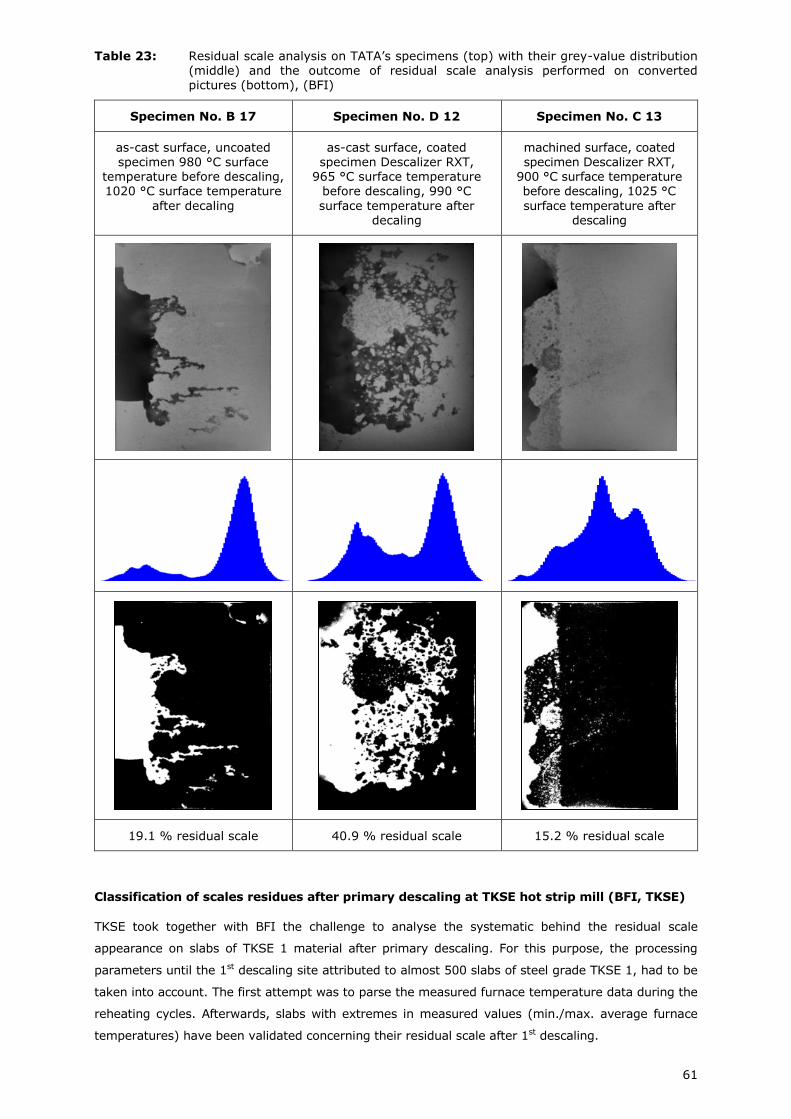
61
Table 23: Residual scale analysis on TATA’s specimens (top) with their grey-value distribution (middle) and the outcome of residual scale analysis performed on converted pictures (bottom), (BFI)
Specimen No. B 17 Specimen No. D 12 Specimen No. C 13
as-cast surface, uncoated specimen 980 °C surface
temperature before descaling, 1020 °C surface temperature
after decaling
as-cast surface, coated specimen Descalizer RXT,
965 °C surface temperature before descaling, 990 °C
surface temperature after decaling
machined surface, coated specimen Descalizer RXT,
900 °C surface temperature before descaling, 1025 °C
surface temperature after descaling
19.1 % residual scale 40.9 % residual scale 15.2 % residual scale
Classification of scales residues after primary descaling at TKSE hot strip mill (BFI, TKSE)
TKSE took together with BFI the challenge to analyse the systematic behind the residual scale
appearance on slabs of TKSE 1 material after primary descaling. For this purpose, the processing
parameters until the 1st descaling site attributed to almost 500 slabs of steel grade TKSE 1, had to be
taken into account. The first attempt was to parse the measured furnace temperature data during the
reheating cycles. Afterwards, slabs with extremes in measured values (min./max. average furnace
temperatures) have been validated concerning their residual scale after 1st descaling.
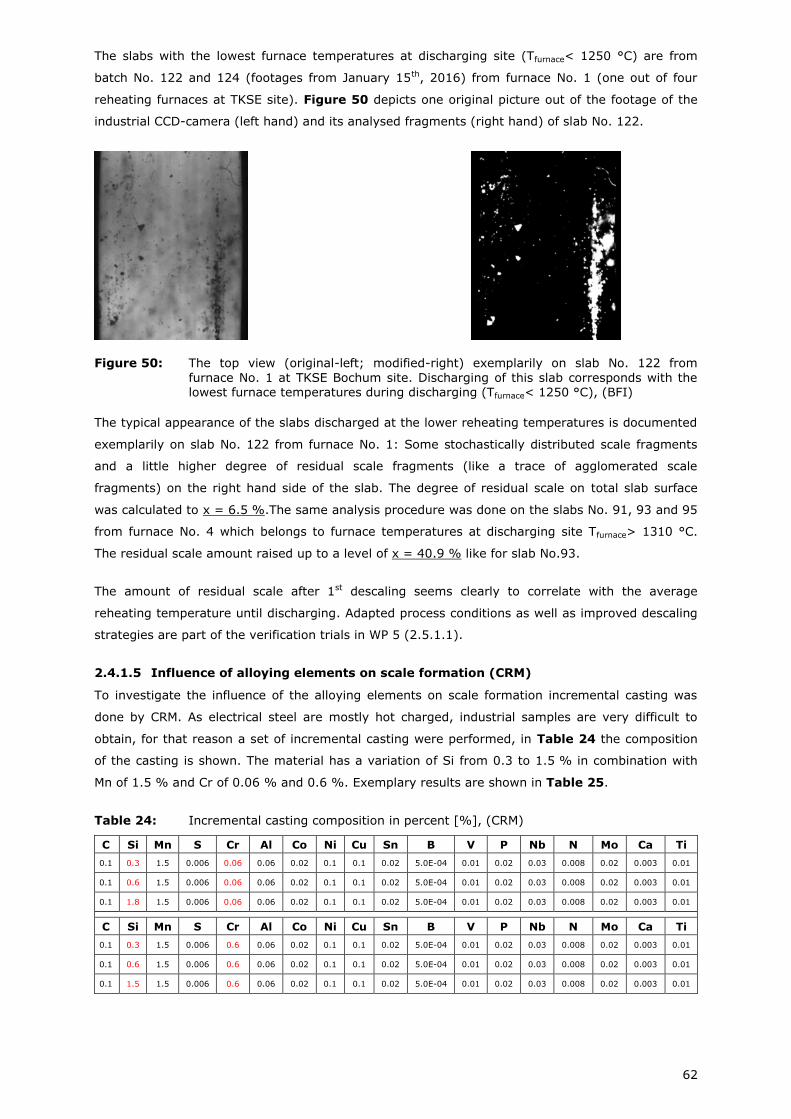
62
The slabs with the lowest furnace temperatures at discharging site (Tfurnace< 1250 °C) are from
batch No. 122 and 124 (footages from January 15th, 2016) from furnace No. 1 (one out of four
reheating furnaces at TKSE site). Figure 50 depicts one original picture out of the footage of the
industrial CCD-camera (left hand) and its analysed fragments (right hand) of slab No. 122.
Figure 50: The top view (original-left; modified-right) exemplarily on slab No. 122 from
furnace No. 1 at TKSE Bochum site. Discharging of this slab corresponds with the lowest furnace temperatures during discharging (Tfurnace< 1250 °C), (BFI)
The typical appearance of the slabs discharged at the lower reheating temperatures is documented
exemplarily on slab No. 122 from furnace No. 1: Some stochastically distributed scale fragments
and a little higher degree of residual scale fragments (like a trace of agglomerated scale
fragments) on the right hand side of the slab. The degree of residual scale on total slab surface
was calculated to x = 6.5 %.The same analysis procedure was done on the slabs No. 91, 93 and 95
from furnace No. 4 which belongs to furnace temperatures at discharging site Tfurnace> 1310 °C.
The residual scale amount raised up to a level of x = 40.9 % like for slab No.93.
The amount of residual scale after 1st descaling seems clearly to correlate with the average
reheating temperature until discharging. Adapted process conditions as well as improved descaling
strategies are part of the verification trials in WP 5 (2.5.1.1).
2.4.1.5 Influence of alloying elements on scale formation (CRM)
To investigate the influence of the alloying elements on scale formation incremental casting was
done by CRM. As electrical steel are mostly hot charged, industrial samples are very difficult to
obtain, for that reason a set of incremental casting were performed, in Table 24 the composition
of the casting is shown. The material has a variation of Si from 0.3 to 1.5 % in combination with
Mn of 1.5 % and Cr of 0.06 % and 0.6 %. Exemplary results are shown in Table 25.
Table 24: Incremental casting composition in percent [%], (CRM)
C Si Mn S Cr Al Co Ni Cu Sn B V P Nb N Mo Ca Ti
0.1 0.3 1.5 0.006 0.06 0.06 0.02 0.1 0.1 0.02 5.0E-04 0.01 0.02 0.03 0.008 0.02 0.003 0.01
0.1 0.6 1.5 0.006 0.06 0.06 0.02 0.1 0.1 0.02 5.0E-04 0.01 0.02 0.03 0.008 0.02 0.003 0.01
0.1 1.8 1.5 0.006 0.06 0.06 0.02 0.1 0.1 0.02 5.0E-04 0.01 0.02 0.03 0.008 0.02 0.003 0.01
C Si Mn S Cr Al Co Ni Cu Sn B V P Nb N Mo Ca Ti
0.1 0.3 1.5 0.006 0.6 0.06 0.02 0.1 0.1 0.02 5.0E-04 0.01 0.02 0.03 0.008 0.02 0.003 0.01
0.1 0.6 1.5 0.006 0.6 0.06 0.02 0.1 0.1 0.02 5.0E-04 0.01 0.02 0.03 0.008 0.02 0.003 0.01
0.1 1.5 1.5 0.006 0.6 0.06 0.02 0.1 0.1 0.02 5.0E-04 0.01 0.02 0.03 0.008 0.02 0.003 0.01
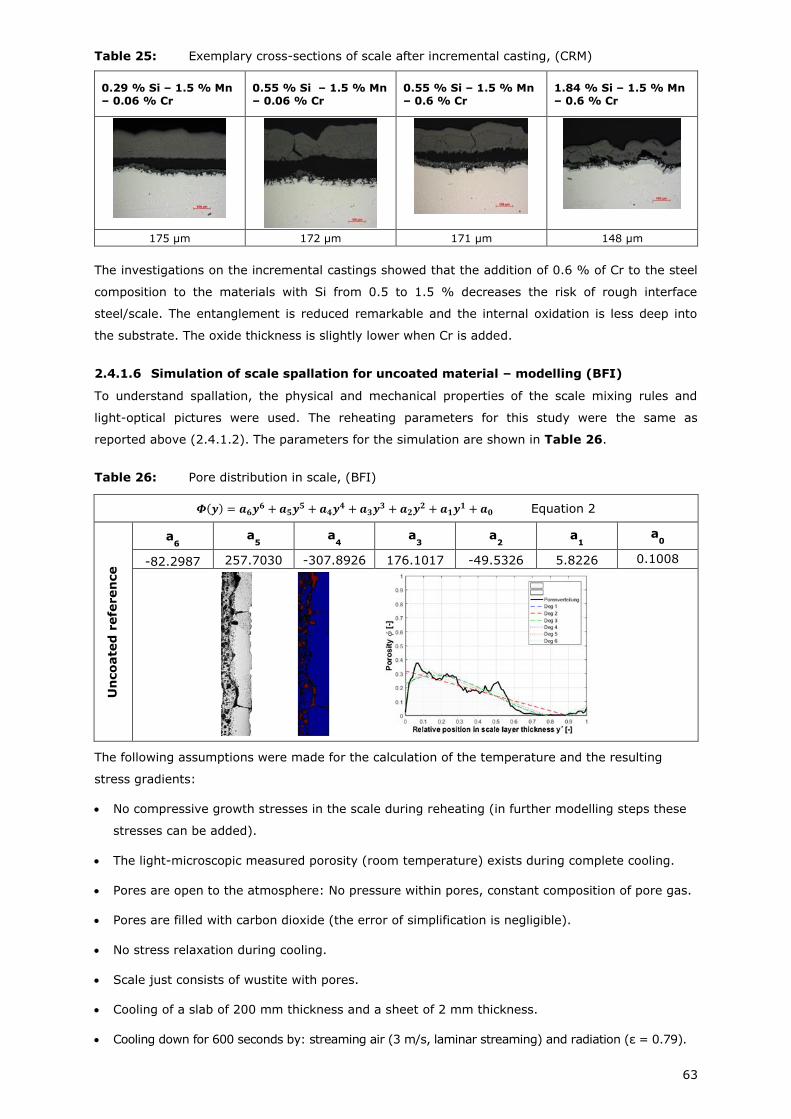
63
Table 25: Exemplary cross-sections of scale after incremental casting, (CRM)
0.29 % Si – 1.5 % Mn – 0.06 % Cr
0.55 % Si – 1.5 % Mn – 0.06 % Cr
0.55 % Si – 1.5 % Mn – 0.6 % Cr
1.84 % Si – 1.5 % Mn – 0.6 % Cr
175 µm 172 µm 171 µm 148 µm
The investigations on the incremental castings showed that the addition of 0.6 % of Cr to the steel
composition to the materials with Si from 0.5 to 1.5 % decreases the risk of rough interface
steel/scale. The entanglement is reduced remarkable and the internal oxidation is less deep into
the substrate. The oxide thickness is slightly lower when Cr is added.
2.4.1.6 Simulation of scale spallation for uncoated material – modelling (BFI)
To understand spallation, the physical and mechanical properties of the scale mixing rules and
light-optical pictures were used. The reheating parameters for this study were the same as
reported above (2.4.1.2). The parameters for the simulation are shown in Table 26.
Table 26: Pore distribution in scale, (BFI)
𝜱(𝒚) = 𝒂𝟔𝒚𝟔 + 𝒂𝟓𝒚𝟓 + 𝒂𝟒𝒚𝟒 + 𝒂𝟑𝒚𝟑 + 𝒂𝟐𝒚𝟐 + 𝒂𝟏𝒚𝟏 + 𝒂𝟎 Equation 2
Un
co
ate
d r
efe
ren
ce
a6 a
5 a
4 a
3 a
2 a
1 a
0
-82.2987 257.7030 -307.8926 176.1017 -49.5326 5.8226 0.1008
The following assumptions were made for the calculation of the temperature and the resulting
stress gradients:
No compressive growth stresses in the scale during reheating (in further modelling steps these
stresses can be added).
The light-microscopic measured porosity (room temperature) exists during complete cooling.
Pores are open to the atmosphere: No pressure within pores, constant composition of pore gas.
Pores are filled with carbon dioxide (the error of simplification is negligible).
No stress relaxation during cooling.
Scale just consists of wustite with pores.
Cooling of a slab of 200 mm thickness and a sheet of 2 mm thickness.
Cooling down for 600 seconds by: streaming air (3 m/s, laminar streaming) and radiation (ε = 0.79).
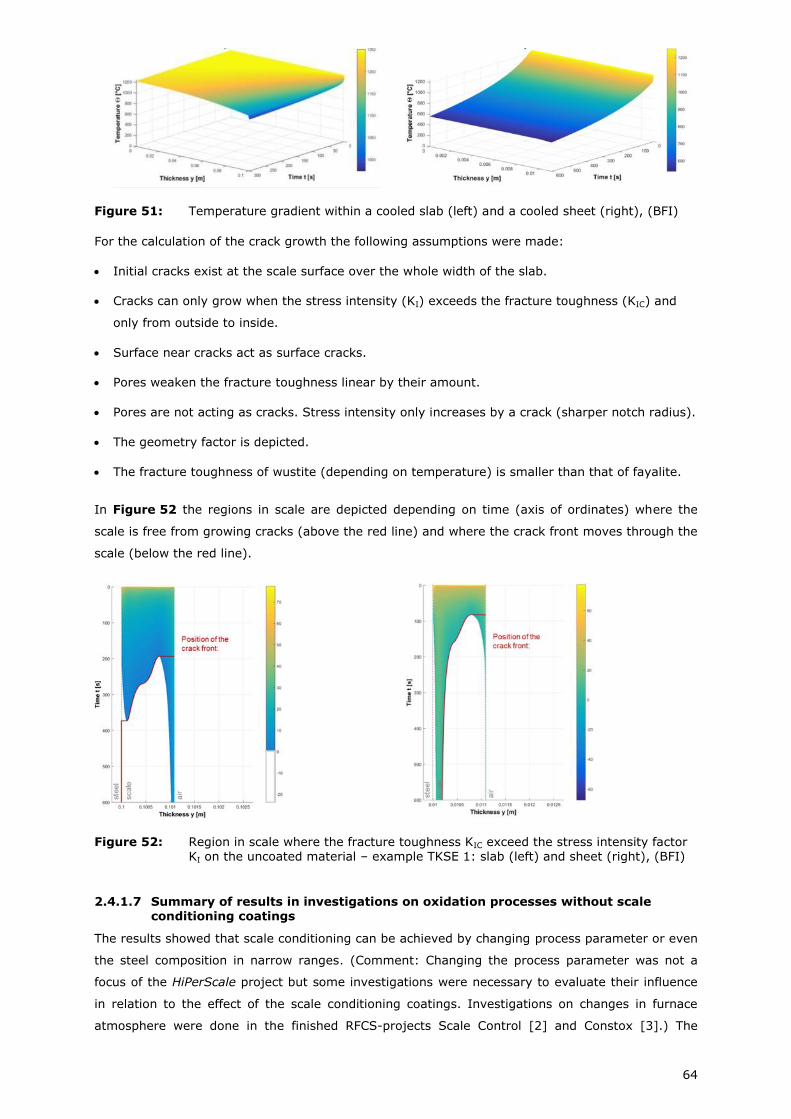
64
Figure 51: Temperature gradient within a cooled slab (left) and a cooled sheet (right), (BFI)
For the calculation of the crack growth the following assumptions were made:
Initial cracks exist at the scale surface over the whole width of the slab.
Cracks can only grow when the stress intensity (KI) exceeds the fracture toughness (KIC) and
only from outside to inside.
Surface near cracks act as surface cracks.
Pores weaken the fracture toughness linear by their amount.
Pores are not acting as cracks. Stress intensity only increases by a crack (sharper notch radius).
The geometry factor is depicted.
The fracture toughness of wustite (depending on temperature) is smaller than that of fayalite.
In Figure 52 the regions in scale are depicted depending on time (axis of ordinates) where the
scale is free from growing cracks (above the red line) and where the crack front moves through the
scale (below the red line).
Figure 52: Region in scale where the fracture toughness KIC exceed the stress intensity factor KI on the uncoated material – example TKSE 1: slab (left) and sheet (right), (BFI)
2.4.1.7 Summary of results in investigations on oxidation processes without scale conditioning coatings
The results showed that scale conditioning can be achieved by changing process parameter or even
the steel composition in narrow ranges. (Comment: Changing the process parameter was not a
focus of the HiPerScale project but some investigations were necessary to evaluate their influence
in relation to the effect of the scale conditioning coatings. Investigations on changes in furnace
atmosphere were done in the finished RFCS-projects Scale Control [2] and Constox [3].) The
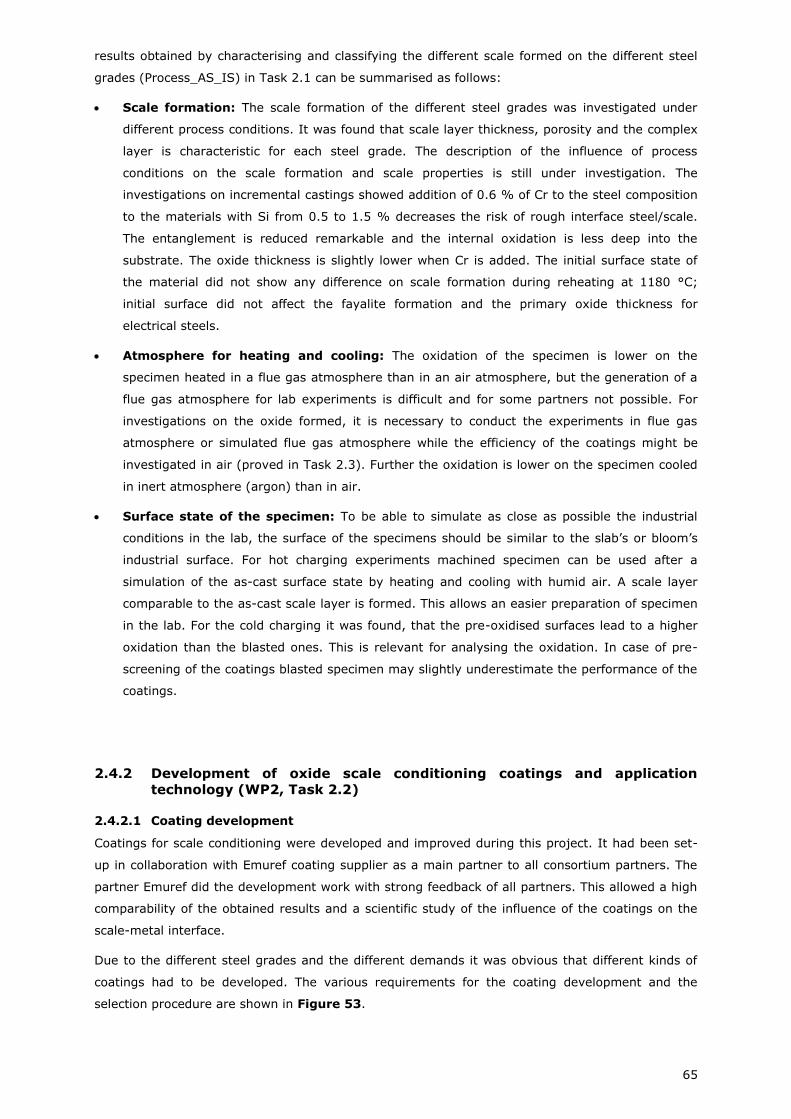
65
results obtained by characterising and classifying the different scale formed on the different steel
grades (Process_AS_IS) in Task 2.1 can be summarised as follows:
Scale formation: The scale formation of the different steel grades was investigated under
different process conditions. It was found that scale layer thickness, porosity and the complex
layer is characteristic for each steel grade. The description of the influence of process
conditions on the scale formation and scale properties is still under investigation. The
investigations on incremental castings showed addition of 0.6 % of Cr to the steel composition
to the materials with Si from 0.5 to 1.5 % decreases the risk of rough interface steel/scale.
The entanglement is reduced remarkable and the internal oxidation is less deep into the
substrate. The oxide thickness is slightly lower when Cr is added. The initial surface state of
the material did not show any difference on scale formation during reheating at 1180 °C;
initial surface did not affect the fayalite formation and the primary oxide thickness for
electrical steels.
Atmosphere for heating and cooling: The oxidation of the specimen is lower on the
specimen heated in a flue gas atmosphere than in an air atmosphere, but the generation of a
flue gas atmosphere for lab experiments is difficult and for some partners not possible. For
investigations on the oxide formed, it is necessary to conduct the experiments in flue gas
atmosphere or simulated flue gas atmosphere while the efficiency of the coatings might be
investigated in air (proved in Task 2.3). Further the oxidation is lower on the specimen cooled
in inert atmosphere (argon) than in air.
Surface state of the specimen: To be able to simulate as close as possible the industrial
conditions in the lab, the surface of the specimens should be similar to the slab’s or bloom’s
industrial surface. For hot charging experiments machined specimen can be used after a
simulation of the as-cast surface state by heating and cooling with humid air. A scale layer
comparable to the as-cast scale layer is formed. This allows an easier preparation of specimen
in the lab. For the cold charging it was found, that the pre-oxidised surfaces lead to a higher
oxidation than the blasted ones. This is relevant for analysing the oxidation. In case of pre-
screening of the coatings blasted specimen may slightly underestimate the performance of the
coatings.
2.4.2 Development of oxide scale conditioning coatings and application
technology (WP2, Task 2.2)
2.4.2.1 Coating development
Coatings for scale conditioning were developed and improved during this project. It had been set-
up in collaboration with Emuref coating supplier as a main partner to all consortium partners. The
partner Emuref did the development work with strong feedback of all partners. This allowed a high
comparability of the obtained results and a scientific study of the influence of the coatings on the
scale-metal interface.
Due to the different steel grades and the different demands it was obvious that different kinds of
coatings had to be developed. The various requirements for the coating development and the
selection procedure are shown in Figure 53.
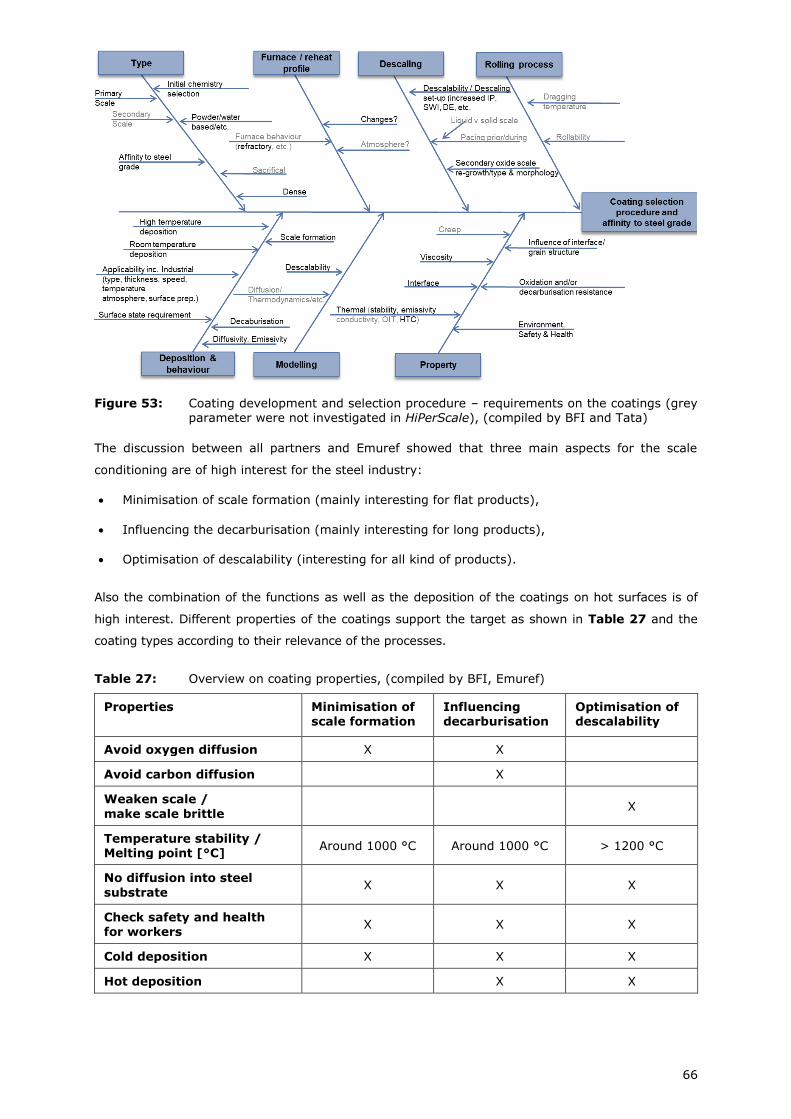
66
Figure 53: Coating development and selection procedure – requirements on the coatings (grey parameter were not investigated in HiPerScale), (compiled by BFI and Tata)
The discussion between all partners and Emuref showed that three main aspects for the scale
conditioning are of high interest for the steel industry:
Minimisation of scale formation (mainly interesting for flat products),
Influencing the decarburisation (mainly interesting for long products),
Optimisation of descalability (interesting for all kind of products).
Also the combination of the functions as well as the deposition of the coatings on hot surfaces is of
high interest. Different properties of the coatings support the target as shown in Table 27 and the
coating types according to their relevance of the processes.
Table 27: Overview on coating properties, (compiled by BFI, Emuref)
Properties Minimisation of scale formation
Influencing decarburisation
Optimisation of descalability
Avoid oxygen diffusion X X
Avoid carbon diffusion
X
Weaken scale /
make scale brittle X
Temperature stability / Melting point [°C]
Around 1000 °C Around 1000 °C > 1200 °C
No diffusion into steel
substrate X X X
Check safety and health for workers
X X X
Cold deposition X X X
Hot deposition
X X
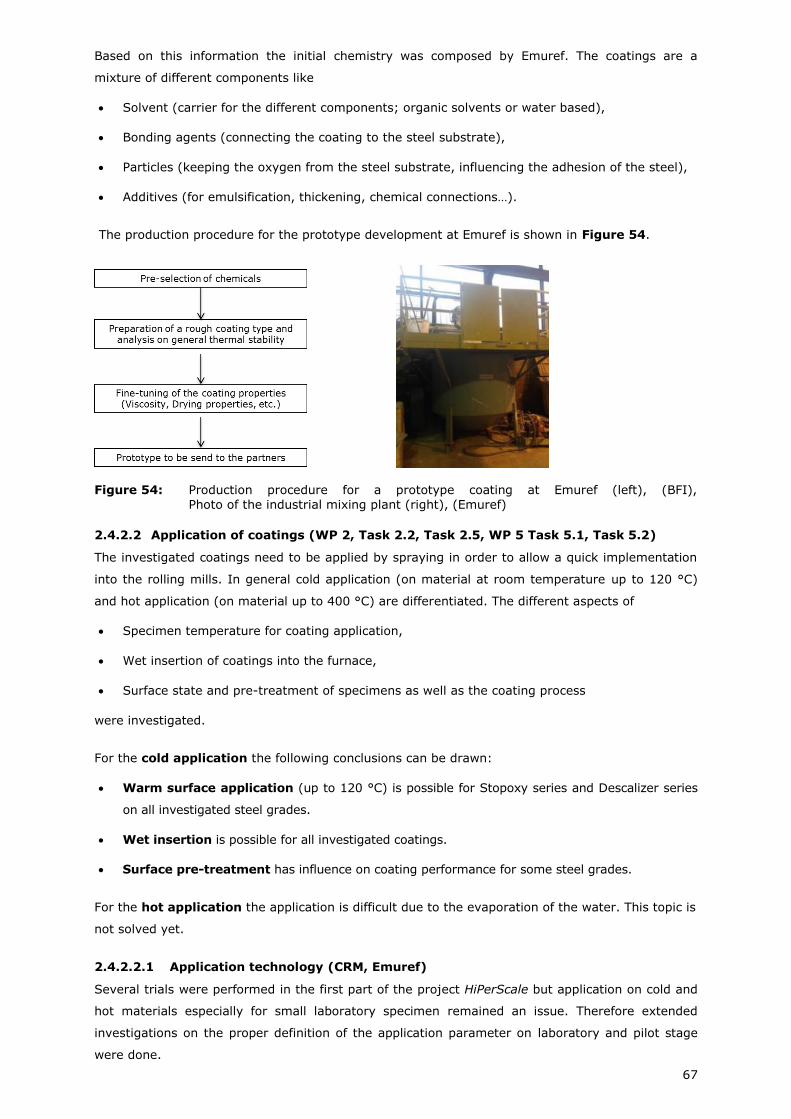
67
Based on this information the initial chemistry was composed by Emuref. The coatings are a
mixture of different components like
Solvent (carrier for the different components; organic solvents or water based),
Bonding agents (connecting the coating to the steel substrate),
Particles (keeping the oxygen from the steel substrate, influencing the adhesion of the steel),
Additives (for emulsification, thickening, chemical connections…).
The production procedure for the prototype development at Emuref is shown in Figure 54.
Figure 54: Production procedure for a prototype coating at Emuref (left), (BFI),
Photo of the industrial mixing plant (right), (Emuref)
2.4.2.2 Application of coatings (WP 2, Task 2.2, Task 2.5, WP 5 Task 5.1, Task 5.2)
The investigated coatings need to be applied by spraying in order to allow a quick implementation
into the rolling mills. In general cold application (on material at room temperature up to 120 °C)
and hot application (on material up to 400 °C) are differentiated. The different aspects of
Specimen temperature for coating application,
Wet insertion of coatings into the furnace,
Surface state and pre-treatment of specimens as well as the coating process
were investigated.
For the cold application the following conclusions can be drawn:
Warm surface application (up to 120 °C) is possible for Stopoxy series and Descalizer series
on all investigated steel grades.
Wet insertion is possible for all investigated coatings.
Surface pre-treatment has influence on coating performance for some steel grades.
For the hot application the application is difficult due to the evaporation of the water. This topic is
not solved yet.
2.4.2.2.1 Application technology (CRM, Emuref)
Several trials were performed in the first part of the project HiPerScale but application on cold and
hot materials especially for small laboratory specimen remained an issue. Therefore extended
investigations on the proper definition of the application parameter on laboratory and pilot stage
were done.
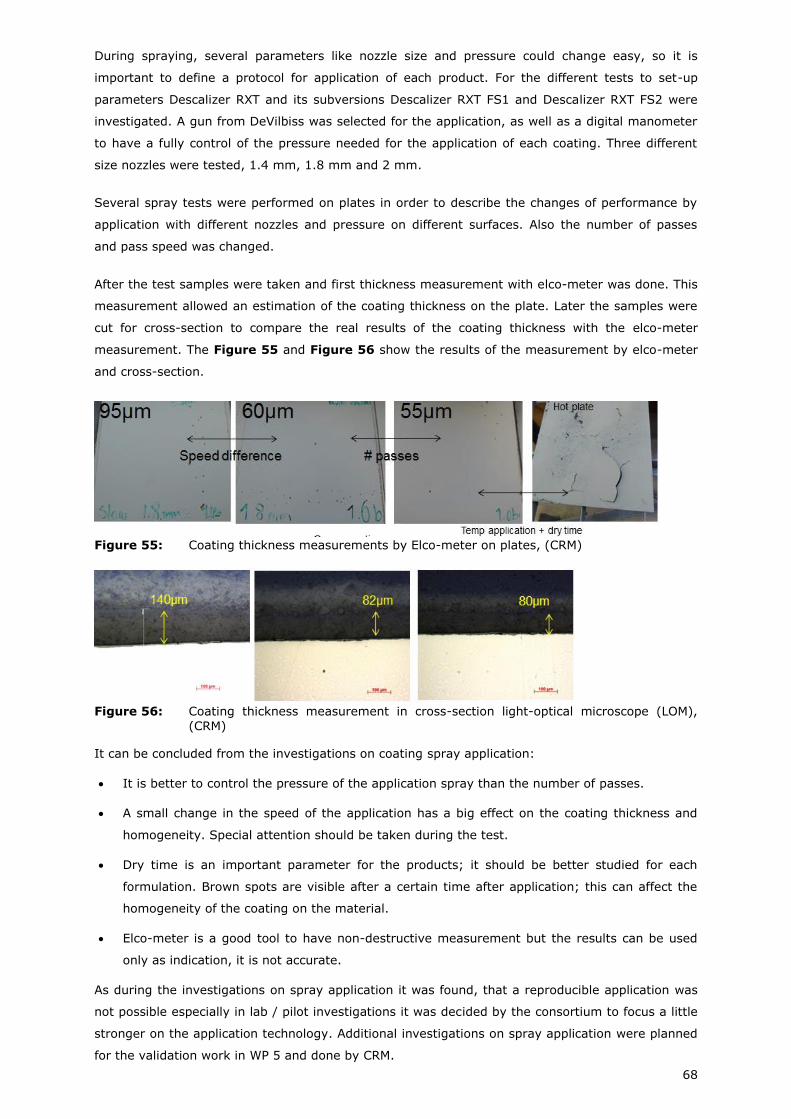
68
During spraying, several parameters like nozzle size and pressure could change easy, so it is
important to define a protocol for application of each product. For the different tests to set-up
parameters Descalizer RXT and its subversions Descalizer RXT FS1 and Descalizer RXT FS2 were
investigated. A gun from DeVilbiss was selected for the application, as well as a digital manometer
to have a fully control of the pressure needed for the application of each coating. Three different
size nozzles were tested, 1.4 mm, 1.8 mm and 2 mm.
Several spray tests were performed on plates in order to describe the changes of performance by
application with different nozzles and pressure on different surfaces. Also the number of passes
and pass speed was changed.
After the test samples were taken and first thickness measurement with elco-meter was done. This
measurement allowed an estimation of the coating thickness on the plate. Later the samples were
cut for cross-section to compare the real results of the coating thickness with the elco-meter
measurement. The Figure 55 and Figure 56 show the results of the measurement by elco-meter
and cross-section.
Figure 55: Coating thickness measurements by Elco-meter on plates, (CRM)
Figure 56: Coating thickness measurement in cross-section light-optical microscope (LOM),
(CRM)
It can be concluded from the investigations on coating spray application:
It is better to control the pressure of the application spray than the number of passes.
A small change in the speed of the application has a big effect on the coating thickness and
homogeneity. Special attention should be taken during the test.
Dry time is an important parameter for the products; it should be better studied for each
formulation. Brown spots are visible after a certain time after application; this can affect the
homogeneity of the coating on the material.
Elco-meter is a good tool to have non-destructive measurement but the results can be used
only as indication, it is not accurate.
As during the investigations on spray application it was found, that a reproducible application was
not possible especially in lab / pilot investigations it was decided by the consortium to focus a little
stronger on the application technology. Additional investigations on spray application were planned
for the validation work in WP 5 and done by CRM.
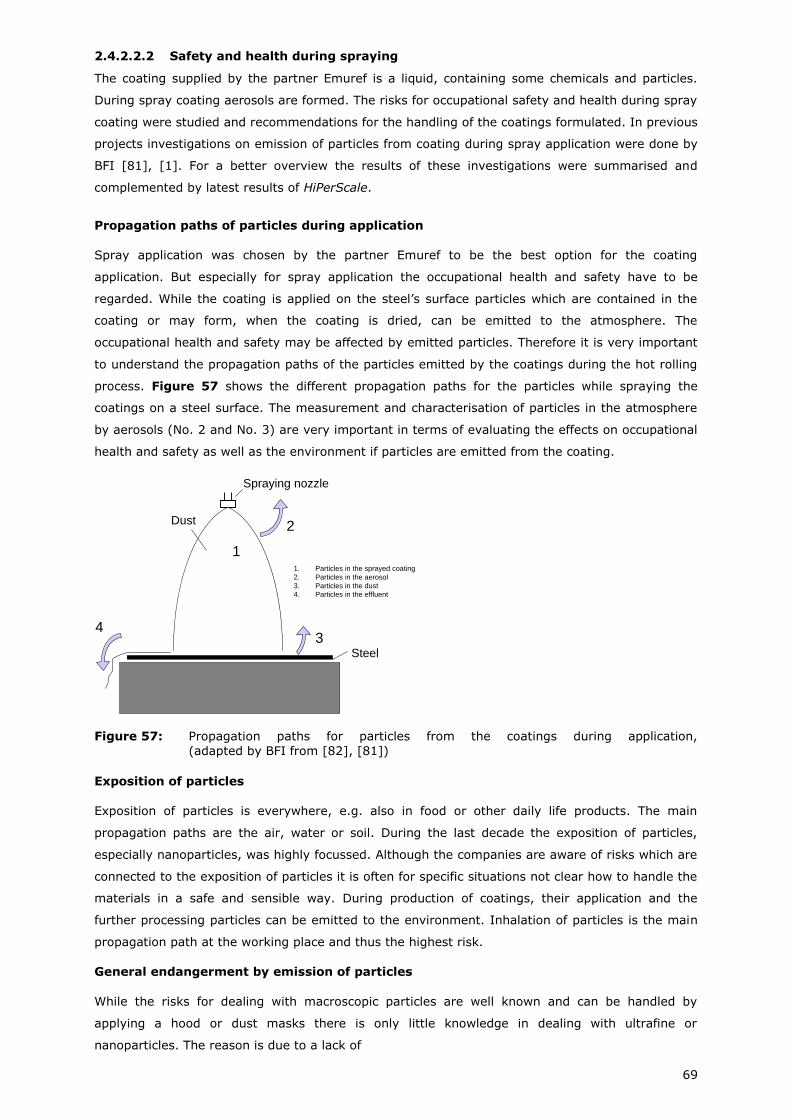
69
2.4.2.2.2 Safety and health during spraying
The coating supplied by the partner Emuref is a liquid, containing some chemicals and particles.
During spray coating aerosols are formed. The risks for occupational safety and health during spray
coating were studied and recommendations for the handling of the coatings formulated. In previous
projects investigations on emission of particles from coating during spray application were done by
BFI [81], [1]. For a better overview the results of these investigations were summarised and
complemented by latest results of HiPerScale.
Propagation paths of particles during application
Spray application was chosen by the partner Emuref to be the best option for the coating
application. But especially for spray application the occupational health and safety have to be
regarded. While the coating is applied on the steel’s surface particles which are contained in the
coating or may form, when the coating is dried, can be emitted to the atmosphere. The
occupational health and safety may be affected by emitted particles. Therefore it is very important
to understand the propagation paths of the particles emitted by the coatings during the hot rolling
process. Figure 57 shows the different propagation paths for the particles while spraying the
coatings on a steel surface. The measurement and characterisation of particles in the atmosphere
by aerosols (No. 2 and No. 3) are very important in terms of evaluating the effects on occupational
health and safety as well as the environment if particles are emitted from the coating.
Figure 57: Propagation paths for particles from the coatings during application,
(adapted by BFI from [82], [81])
Exposition of particles
Exposition of particles is everywhere, e.g. also in food or other daily life products. The main
propagation paths are the air, water or soil. During the last decade the exposition of particles,
especially nanoparticles, was highly focussed. Although the companies are aware of risks which are
connected to the exposition of particles it is often for specific situations not clear how to handle the
materials in a safe and sensible way. During production of coatings, their application and the
further processing particles can be emitted to the environment. Inhalation of particles is the main
propagation path at the working place and thus the highest risk.
General endangerment by emission of particles
While the risks for dealing with macroscopic particles are well known and can be handled by
applying a hood or dust masks there is only little knowledge in dealing with ultrafine or
nanoparticles. The reason is due to a lack of
Spraying nozzle
2
1
34
Steel
Dust
1. Particles in the sprayed coating
2. Particles in the aerosol
3. Particles in the dust
4. Particles in the effluent
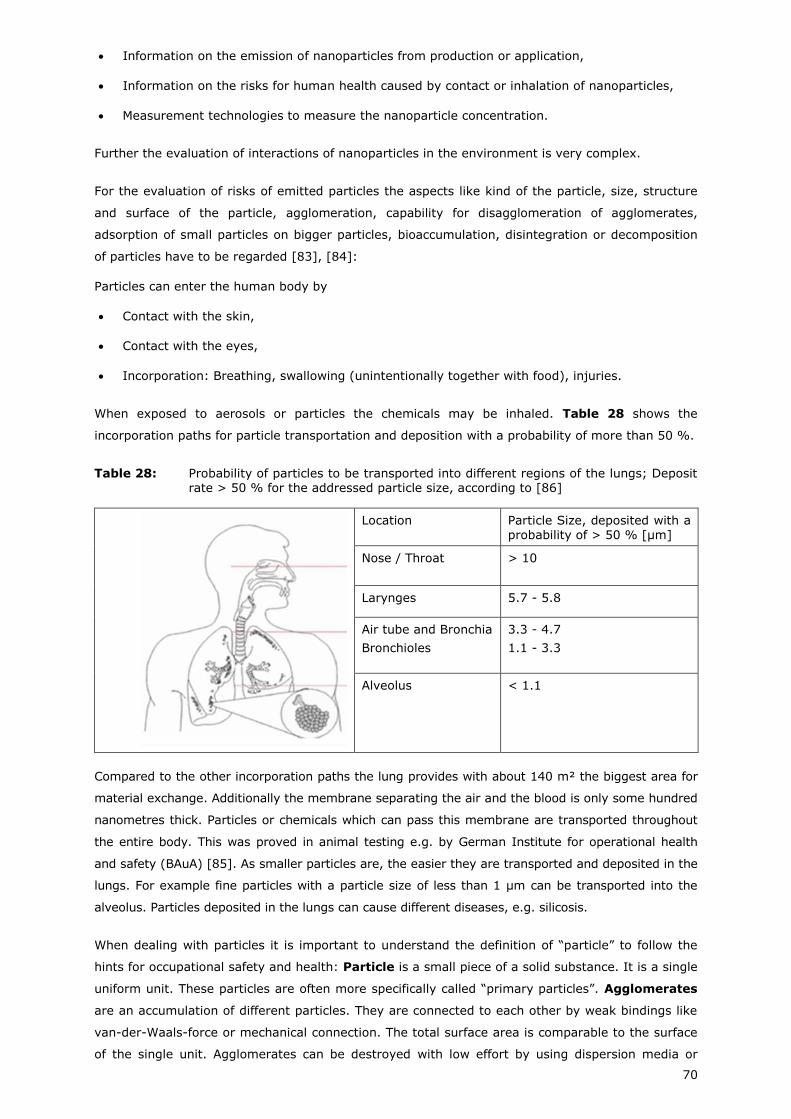
70
Information on the emission of nanoparticles from production or application,
Information on the risks for human health caused by contact or inhalation of nanoparticles,
Measurement technologies to measure the nanoparticle concentration.
Further the evaluation of interactions of nanoparticles in the environment is very complex.
For the evaluation of risks of emitted particles the aspects like kind of the particle, size, structure
and surface of the particle, agglomeration, capability for disagglomeration of agglomerates,
adsorption of small particles on bigger particles, bioaccumulation, disintegration or decomposition
of particles have to be regarded [83], [84]:
Particles can enter the human body by
Contact with the skin,
Contact with the eyes,
Incorporation: Breathing, swallowing (unintentionally together with food), injuries.
When exposed to aerosols or particles the chemicals may be inhaled. Table 28 shows the
incorporation paths for particle transportation and deposition with a probability of more than 50 %.
Table 28: Probability of particles to be transported into different regions of the lungs; Deposit rate > 50 % for the addressed particle size, according to [86]
Location Particle Size, deposited with a probability of > 50 % [µm]
Nose / Throat > 10
Larynges 5.7 - 5.8
Air tube and Bronchia
Bronchioles
3.3 - 4.7
1.1 - 3.3
Alveolus < 1.1
Compared to the other incorporation paths the lung provides with about 140 m² the biggest area for
material exchange. Additionally the membrane separating the air and the blood is only some hundred
nanometres thick. Particles or chemicals which can pass this membrane are transported throughout
the entire body. This was proved in animal testing e.g. by German Institute for operational health
and safety (BAuA) [85]. As smaller particles are, the easier they are transported and deposited in the
lungs. For example fine particles with a particle size of less than 1 µm can be transported into the
alveolus. Particles deposited in the lungs can cause different diseases, e.g. silicosis.
When dealing with particles it is important to understand the definition of “particle” to follow the
hints for occupational safety and health: Particle is a small piece of a solid substance. It is a single
uniform unit. These particles are often more specifically called “primary particles”. Agglomerates
are an accumulation of different particles. They are connected to each other by weak bindings like
van-der-Waals-force or mechanical connection. The total surface area is comparable to the surface
of the single unit. Agglomerates can be destroyed with low effort by using dispersion media or
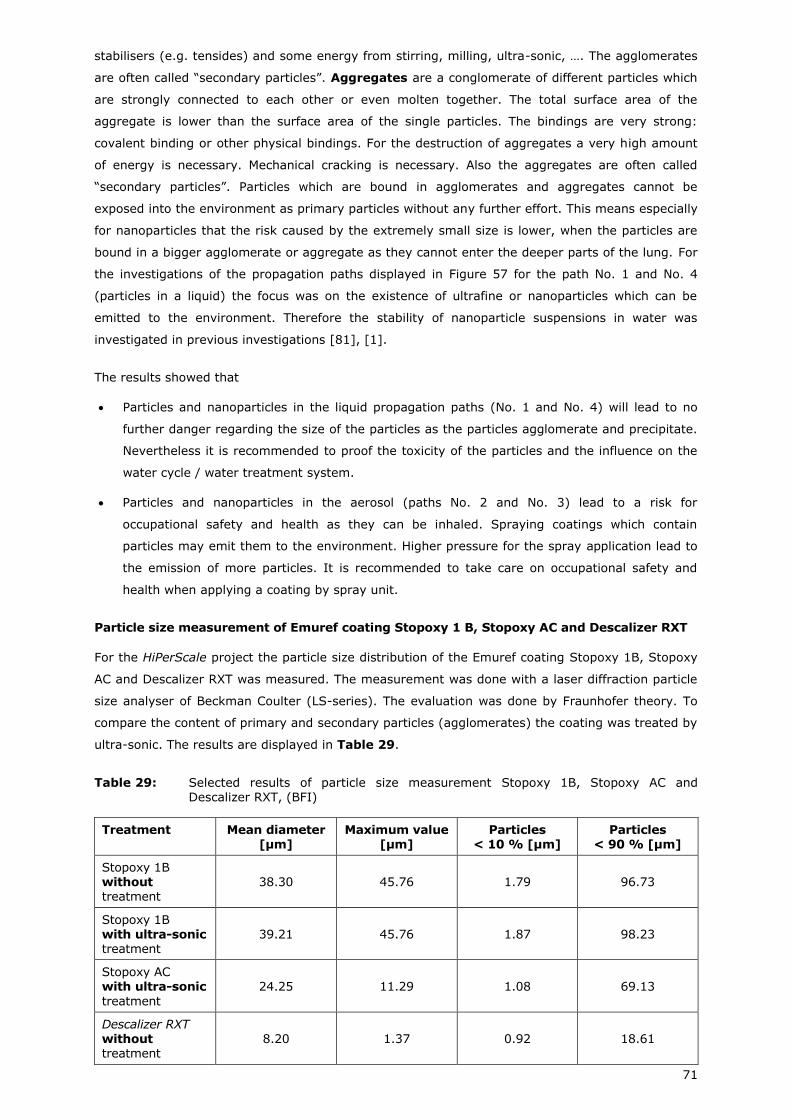
71
stabilisers (e.g. tensides) and some energy from stirring, milling, ultra-sonic, …. The agglomerates
are often called “secondary particles”. Aggregates are a conglomerate of different particles which
are strongly connected to each other or even molten together. The total surface area of the
aggregate is lower than the surface area of the single particles. The bindings are very strong:
covalent binding or other physical bindings. For the destruction of aggregates a very high amount
of energy is necessary. Mechanical cracking is necessary. Also the aggregates are often called
“secondary particles”. Particles which are bound in agglomerates and aggregates cannot be
exposed into the environment as primary particles without any further effort. This means especially
for nanoparticles that the risk caused by the extremely small size is lower, when the particles are
bound in a bigger agglomerate or aggregate as they cannot enter the deeper parts of the lung. For
the investigations of the propagation paths displayed in Figure 57 for the path No. 1 and No. 4
(particles in a liquid) the focus was on the existence of ultrafine or nanoparticles which can be
emitted to the environment. Therefore the stability of nanoparticle suspensions in water was
investigated in previous investigations [81], [1].
The results showed that
Particles and nanoparticles in the liquid propagation paths (No. 1 and No. 4) will lead to no
further danger regarding the size of the particles as the particles agglomerate and precipitate.
Nevertheless it is recommended to proof the toxicity of the particles and the influence on the
water cycle / water treatment system.
Particles and nanoparticles in the aerosol (paths No. 2 and No. 3) lead to a risk for
occupational safety and health as they can be inhaled. Spraying coatings which contain
particles may emit them to the environment. Higher pressure for the spray application lead to
the emission of more particles. It is recommended to take care on occupational safety and
health when applying a coating by spray unit.
Particle size measurement of Emuref coating Stopoxy 1 B, Stopoxy AC and Descalizer RXT
For the HiPerScale project the particle size distribution of the Emuref coating Stopoxy 1B, Stopoxy
AC and Descalizer RXT was measured. The measurement was done with a laser diffraction particle
size analyser of Beckman Coulter (LS-series). The evaluation was done by Fraunhofer theory. To
compare the content of primary and secondary particles (agglomerates) the coating was treated by
ultra-sonic. The results are displayed in Table 29.
Table 29: Selected results of particle size measurement Stopoxy 1B, Stopoxy AC and Descalizer RXT, (BFI)
Treatment Mean diameter [µm]
Maximum value [µm]
Particles < 10 % [µm]
Particles < 90 % [µm]
Stopoxy 1B without treatment
38.30 45.76 1.79 96.73
Stopoxy 1B with ultra-sonic treatment
39.21 45.76 1.87 98.23
Stopoxy AC with ultra-sonic
treatment
24.25 11.29 1.08 69.13
Descalizer RXT without treatment
8.20 1.37 0.92 18.61
72
The comparison between the treated and the untreated particles of Stopoxy 1B shows that the
particles either do not aggregate or the aggregates cannot be destroyed by ultra-sonic. The results
show that 50 % of the particles are less than 25 µm. That means that half of the particles cannot
be inhaled (not even into the nose) but half of the particles can. Approximately 30 % of the
particles are < 10 µm and can enter the nose and throat. Further 10 % of the particles have a size
< 2 µm and can be transported into the bronchioles and alveolus.
The comparison of the particle size distribution between Stopoxy 1B and Stopoxy AC shows, that
the particles of Stopoxy AC are much smaller than those mixed into Stopoxy 1B. The results show
that 27 % of the particles are less than 25 µm. That means that more than 75 % of the particles
could be inhaled. Approximately 50 % of the particles are < 10 µm and can enter the nose and
throat. Further 25 % of the particles have a size below 3.6 µm and can be transported into the
bronchioles and alveolus.
The particle size distribution of Descalizer RXT shows, that the particles of Stopoxy AC are much
smaller than those mixed into the Stopoxy series. The results show that all particles (respective
more than 90 % but less than 100 %) are less than 25 µm. That means all the particles could be
inhaled. Approximately 75 % of the particles are < 10 µm and can enter the nose and throat.
Further 25 % of the particles have a size below 2.7 µm and can be transported into the bronchioles
and alveolus.
For all coatings it is recommended to take care on occupational safety and health when
applying the coating by spray unit (hood / dust mask). This is especially true for spray
coating of Stopoxy AC and Descalizer RXT.
Discussion on occupational health and safety – recommendations
The German Institute for operational health and safety (BAuA) recommends for the dealing with
particles and nanoparticles to apply the guidelines for safety and health according to the laws [87]-
[89]. Latest results from research dealing with the safety of nanomaterials show strong
shortcoming concerning the knowledge on the safety and a high uncertainty in politics and general
public [90]-[92]. Although the number of publications increased significantly the comparability of
the results is poor.
Regarding the particle content in the coatings investigated in HiPerScale the following approach for
the experiments are recommended:
Lab experiments: dipping of the cold material is preferred as no aerosols will be produced. The
handling of the material is simple (please use gloves!) and the coating layers will be uniform
for the lab experiments. If this is not possible (e.g. for hot samples) ventilation or a hood
during spraying or personal protection equipment like a dust mask should be used.
Pilot and industrial plants: For single tests personal protection equipment like a dusk mask
should be used. When installing a spraying unit for permanent spray application the
installation of housing, ventilation or hood is recommended.
These discussion and recommendations do neither include any hazardous materials in the coating
nor a potential toxicity of the particles itself. The safety data sheets supplied by Emuref and the
guidelines for safety and health of the individual country and company have to be respected.
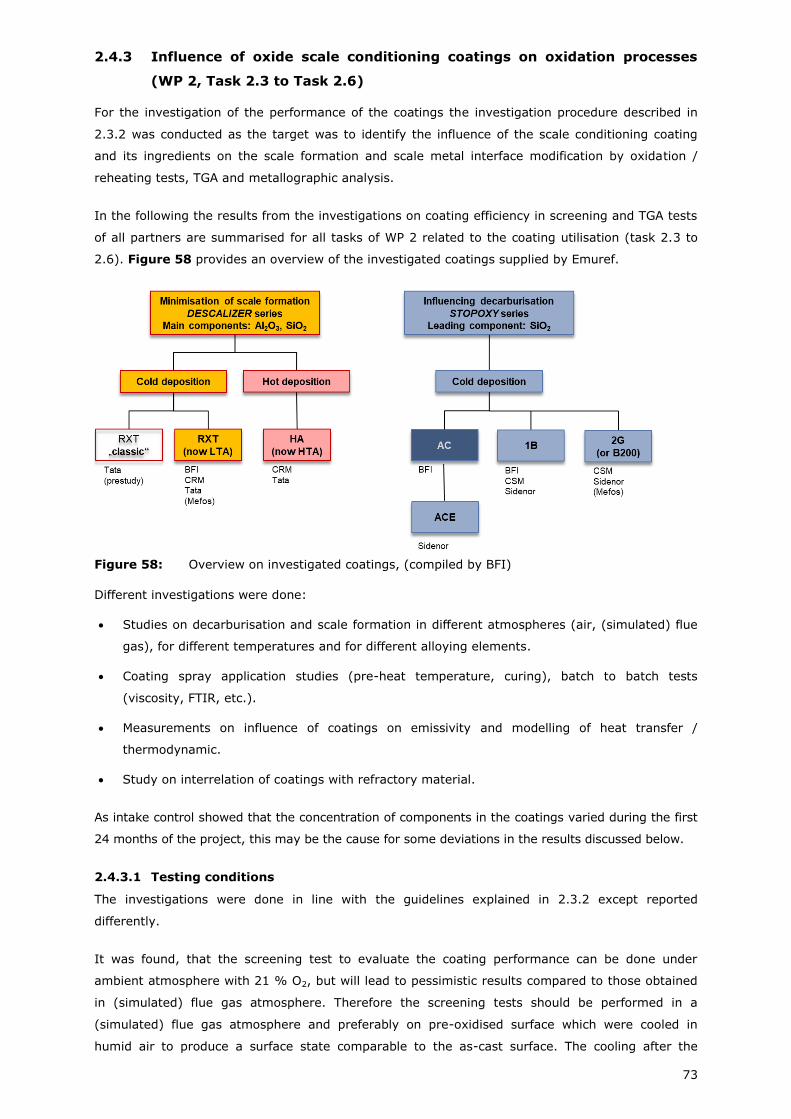
73
2.4.3 Influence of oxide scale conditioning coatings on oxidation processes
(WP 2, Task 2.3 to Task 2.6)
For the investigation of the performance of the coatings the investigation procedure described in
2.3.2 was conducted as the target was to identify the influence of the scale conditioning coating
and its ingredients on the scale formation and scale metal interface modification by oxidation /
reheating tests, TGA and metallographic analysis.
In the following the results from the investigations on coating efficiency in screening and TGA tests
of all partners are summarised for all tasks of WP 2 related to the coating utilisation (task 2.3 to
2.6). Figure 58 provides an overview of the investigated coatings supplied by Emuref.
Figure 58: Overview on investigated coatings, (compiled by BFI)
Different investigations were done:
Studies on decarburisation and scale formation in different atmospheres (air, (simulated) flue
gas), for different temperatures and for different alloying elements.
Coating spray application studies (pre-heat temperature, curing), batch to batch tests
(viscosity, FTIR, etc.).
Measurements on influence of coatings on emissivity and modelling of heat transfer /
thermodynamic.
Study on interrelation of coatings with refractory material.
As intake control showed that the concentration of components in the coatings varied during the first
24 months of the project, this may be the cause for some deviations in the results discussed below.
2.4.3.1 Testing conditions
The investigations were done in line with the guidelines explained in 2.3.2 except reported
differently.
It was found, that the screening test to evaluate the coating performance can be done under
ambient atmosphere with 21 % O2, but will lead to pessimistic results compared to those obtained
in (simulated) flue gas atmosphere. Therefore the screening tests should be performed in a
(simulated) flue gas atmosphere and preferably on pre-oxidised surface which were cooled in
humid air to produce a surface state comparable to the as-cast surface. The cooling after the
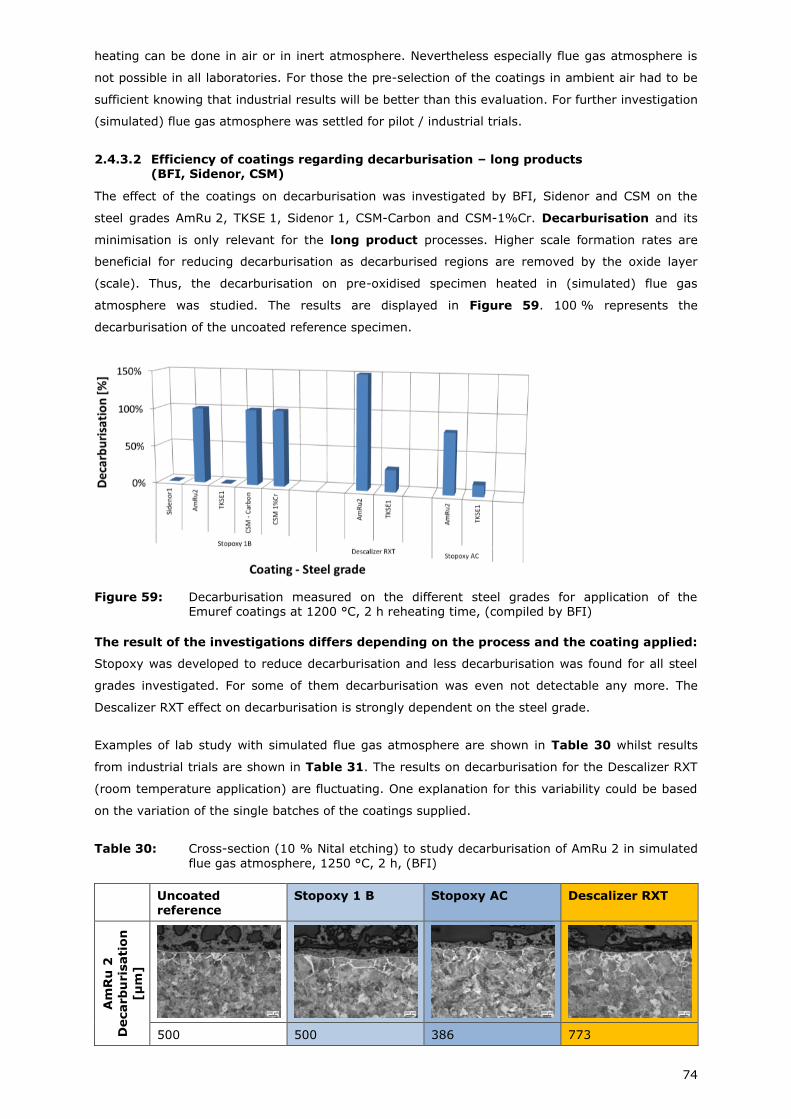
74
heating can be done in air or in inert atmosphere. Nevertheless especially flue gas atmosphere is
not possible in all laboratories. For those the pre-selection of the coatings in ambient air had to be
sufficient knowing that industrial results will be better than this evaluation. For further investigation
(simulated) flue gas atmosphere was settled for pilot / industrial trials.
2.4.3.2 Efficiency of coatings regarding decarburisation – long products (BFI, Sidenor, CSM)
The effect of the coatings on decarburisation was investigated by BFI, Sidenor and CSM on the
steel grades AmRu 2, TKSE 1, Sidenor 1, CSM-Carbon and CSM-1%Cr. Decarburisation and its
minimisation is only relevant for the long product processes. Higher scale formation rates are
beneficial for reducing decarburisation as decarburised regions are removed by the oxide layer
(scale). Thus, the decarburisation on pre-oxidised specimen heated in (simulated) flue gas
atmosphere was studied. The results are displayed in Figure 59. 100 % represents the
decarburisation of the uncoated reference specimen.
Figure 59: Decarburisation measured on the different steel grades for application of the Emuref coatings at 1200 °C, 2 h reheating time, (compiled by BFI)
The result of the investigations differs depending on the process and the coating applied:
Stopoxy was developed to reduce decarburisation and less decarburisation was found for all steel
grades investigated. For some of them decarburisation was even not detectable any more. The
Descalizer RXT effect on decarburisation is strongly dependent on the steel grade.
Examples of lab study with simulated flue gas atmosphere are shown in Table 30 whilst results
from industrial trials are shown in Table 31. The results on decarburisation for the Descalizer RXT
(room temperature application) are fluctuating. One explanation for this variability could be based
on the variation of the single batches of the coatings supplied.
Table 30: Cross-section (10 % Nital etching) to study decarburisation of AmRu 2 in simulated
flue gas atmosphere, 1250 °C, 2 h, (BFI)
Uncoated reference
Stopoxy 1 B Stopoxy AC Descalizer RXT
Am
Ru
2
Decarb
uris
ati
on
[µ
m]
500 500 386 773
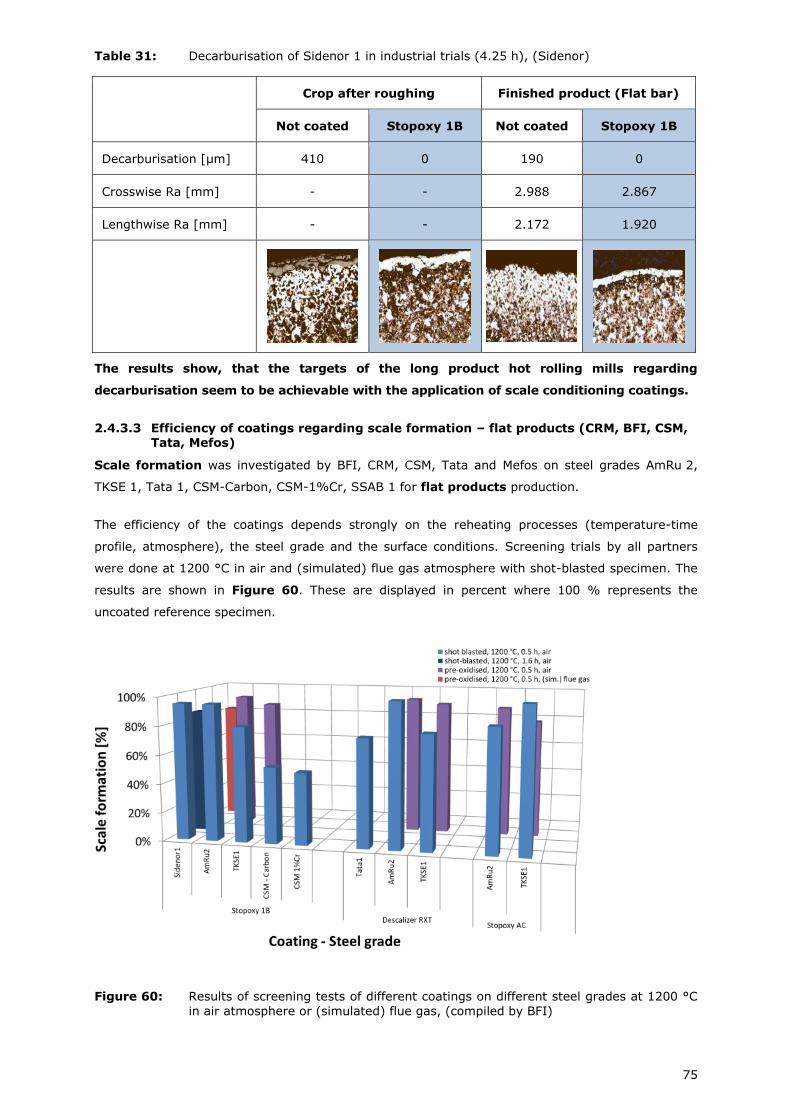
75
Table 31: Decarburisation of Sidenor 1 in industrial trials (4.25 h), (Sidenor)
Crop after roughing Finished product (Flat bar)
Not coated Stopoxy 1B Not coated Stopoxy 1B
Decarburisation [µm] 410 0 190 0
Crosswise Ra [mm] - - 2.988 2.867
Lengthwise Ra [mm] - - 2.172 1.920
The results show, that the targets of the long product hot rolling mills regarding
decarburisation seem to be achievable with the application of scale conditioning coatings.
2.4.3.3 Efficiency of coatings regarding scale formation – flat products (CRM, BFI, CSM, Tata, Mefos)
Scale formation was investigated by BFI, CRM, CSM, Tata and Mefos on steel grades AmRu 2,
TKSE 1, Tata 1, CSM-Carbon, CSM-1%Cr, SSAB 1 for flat products production.
The efficiency of the coatings depends strongly on the reheating processes (temperature-time
profile, atmosphere), the steel grade and the surface conditions. Screening trials by all partners
were done at 1200 °C in air and (simulated) flue gas atmosphere with shot-blasted specimen. The
results are shown in Figure 60. These are displayed in percent where 100 % represents the
uncoated reference specimen.
Figure 60: Results of screening tests of different coatings on different steel grades at 1200 °C
in air atmosphere or (simulated) flue gas, (compiled by BFI)
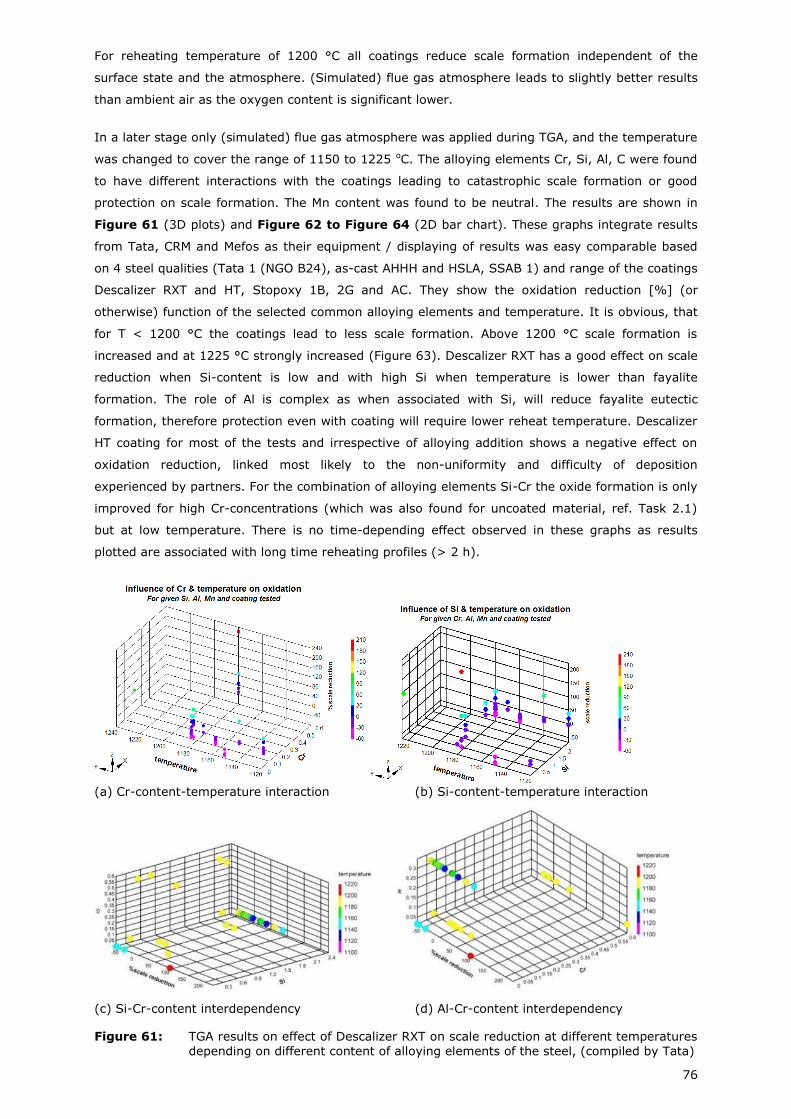
76
For reheating temperature of 1200 °C all coatings reduce scale formation independent of the
surface state and the atmosphere. (Simulated) flue gas atmosphere leads to slightly better results
than ambient air as the oxygen content is significant lower.
In a later stage only (simulated) flue gas atmosphere was applied during TGA, and the temperature
was changed to cover the range of 1150 to 1225 oC. The alloying elements Cr, Si, Al, C were found
to have different interactions with the coatings leading to catastrophic scale formation or good
protection on scale formation. The Mn content was found to be neutral. The results are shown in
Figure 61 (3D plots) and Figure 62 to Figure 64 (2D bar chart). These graphs integrate results
from Tata, CRM and Mefos as their equipment / displaying of results was easy comparable based
on 4 steel qualities (Tata 1 (NGO B24), as-cast AHHH and HSLA, SSAB 1) and range of the coatings
Descalizer RXT and HT, Stopoxy 1B, 2G and AC. They show the oxidation reduction [%] (or
otherwise) function of the selected common alloying elements and temperature. It is obvious, that
for T < 1200 °C the coatings lead to less scale formation. Above 1200 °C scale formation is
increased and at 1225 °C strongly increased (Figure 63). Descalizer RXT has a good effect on scale
reduction when Si-content is low and with high Si when temperature is lower than fayalite
formation. The role of Al is complex as when associated with Si, will reduce fayalite eutectic
formation, therefore protection even with coating will require lower reheat temperature. Descalizer
HT coating for most of the tests and irrespective of alloying addition shows a negative effect on
oxidation reduction, linked most likely to the non-uniformity and difficulty of deposition
experienced by partners. For the combination of alloying elements Si-Cr the oxide formation is only
improved for high Cr-concentrations (which was also found for uncoated material, ref. Task 2.1)
but at low temperature. There is no time-depending effect observed in these graphs as results
plotted are associated with long time reheating profiles (> 2 h).
(a) Cr-content-temperature interaction (b) Si-content-temperature interaction
(c) Si-Cr-content interdependency (d) Al-Cr-content interdependency
Figure 61: TGA results on effect of Descalizer RXT on scale reduction at different temperatures
depending on different content of alloying elements of the steel, (compiled by Tata)
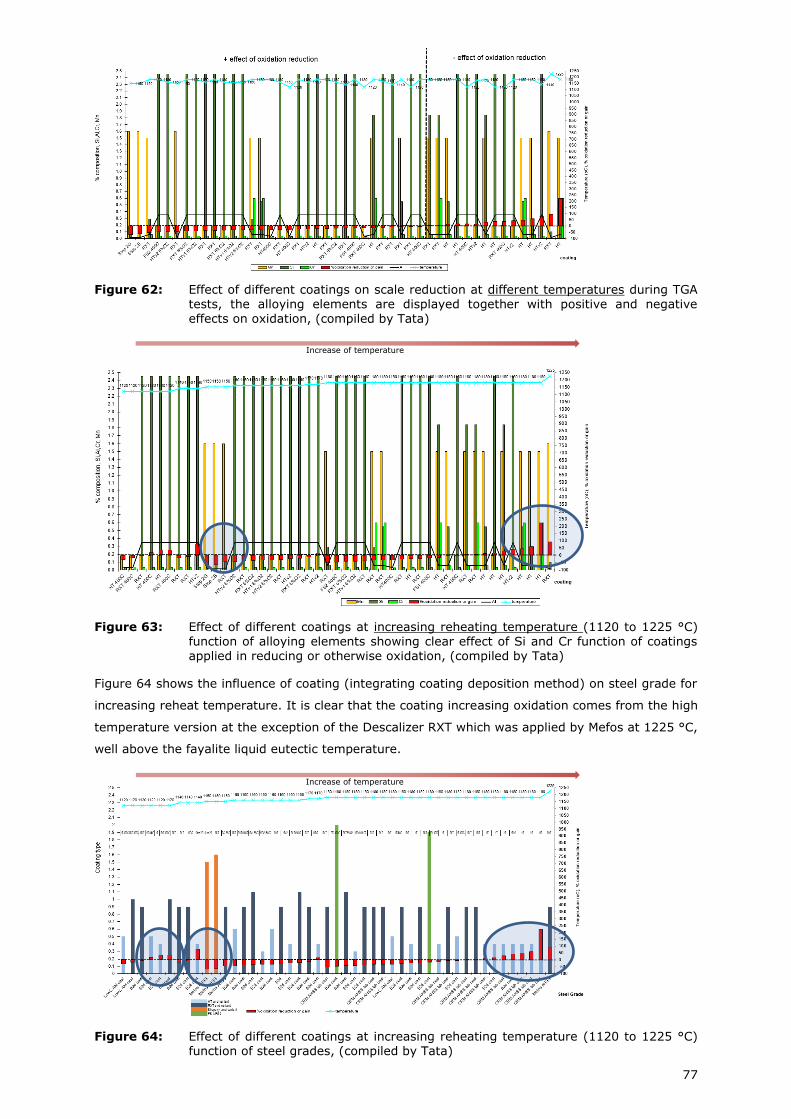
77
Figure 62: Effect of different coatings on scale reduction at different temperatures during TGA tests, the alloying elements are displayed together with positive and negative effects on oxidation, (compiled by Tata)
Figure 63: Effect of different coatings at increasing reheating temperature (1120 to 1225 °C) function of alloying elements showing clear effect of Si and Cr function of coatings applied in reducing or otherwise oxidation, (compiled by Tata)
Figure 64 shows the influence of coating (integrating coating deposition method) on steel grade for
increasing reheat temperature. It is clear that the coating increasing oxidation comes from the high
temperature version at the exception of the Descalizer RXT which was applied by Mefos at 1225 °C,
well above the fayalite liquid eutectic temperature.
Figure 64: Effect of different coatings at increasing reheating temperature (1120 to 1225 °C) function of steel grades, (compiled by Tata)
Increase of temperature
Increase of temperature
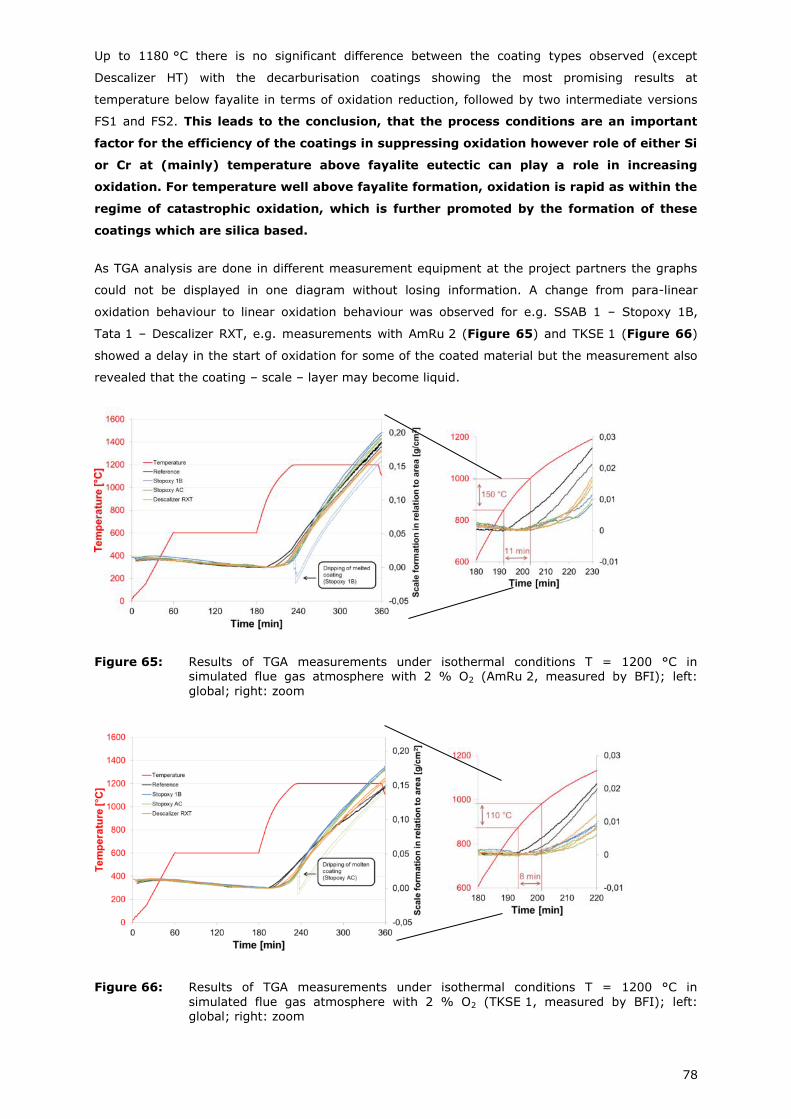
78
Up to 1180 °C there is no significant difference between the coating types observed (except
Descalizer HT) with the decarburisation coatings showing the most promising results at
temperature below fayalite in terms of oxidation reduction, followed by two intermediate versions
FS1 and FS2. This leads to the conclusion, that the process conditions are an important
factor for the efficiency of the coatings in suppressing oxidation however role of either Si
or Cr at (mainly) temperature above fayalite eutectic can play a role in increasing
oxidation. For temperature well above fayalite formation, oxidation is rapid as within the
regime of catastrophic oxidation, which is further promoted by the formation of these
coatings which are silica based.
As TGA analysis are done in different measurement equipment at the project partners the graphs
could not be displayed in one diagram without losing information. A change from para-linear
oxidation behaviour to linear oxidation behaviour was observed for e.g. SSAB 1 – Stopoxy 1B,
Tata 1 – Descalizer RXT, e.g. measurements with AmRu 2 (Figure 65) and TKSE 1 (Figure 66)
showed a delay in the start of oxidation for some of the coated material but the measurement also
revealed that the coating – scale – layer may become liquid.
Figure 65: Results of TGA measurements under isothermal conditions T = 1200 °C in simulated flue gas atmosphere with 2 % O2 (AmRu 2, measured by BFI); left:
global; right: zoom
Figure 66: Results of TGA measurements under isothermal conditions T = 1200 °C in
simulated flue gas atmosphere with 2 % O2 (TKSE 1, measured by BFI); left: global; right: zoom
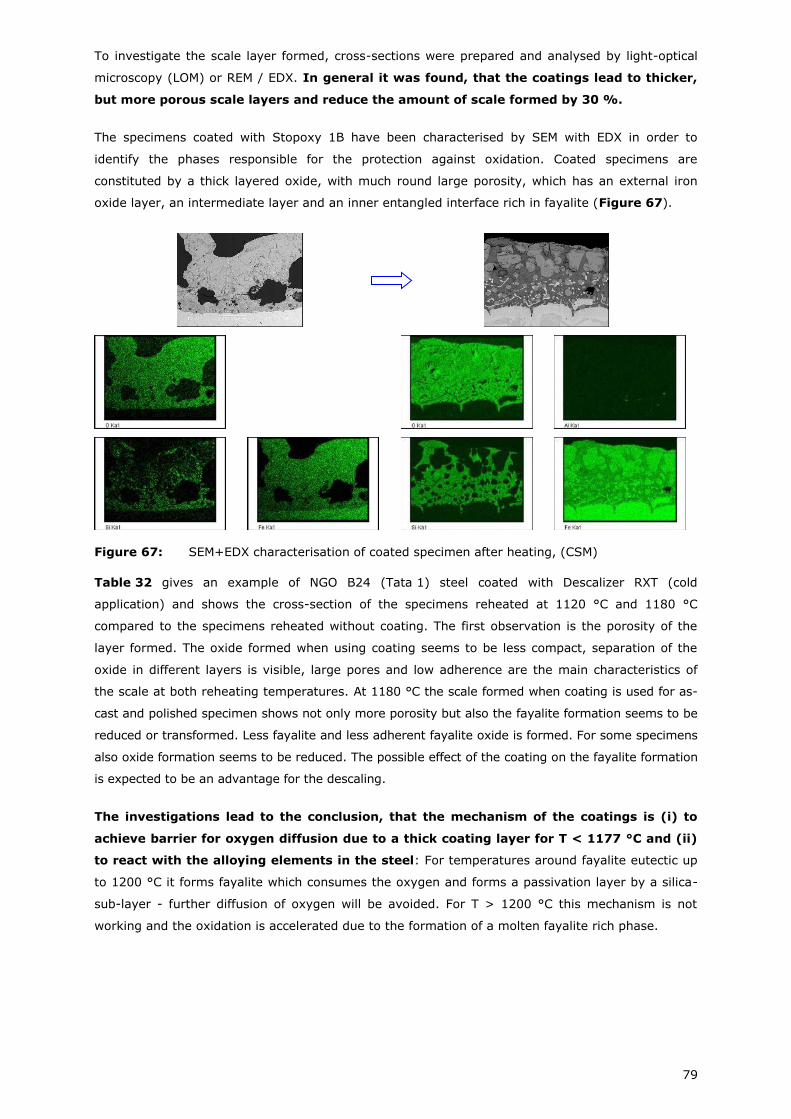
79
To investigate the scale layer formed, cross-sections were prepared and analysed by light-optical
microscopy (LOM) or REM / EDX. In general it was found, that the coatings lead to thicker,
but more porous scale layers and reduce the amount of scale formed by 30 %.
The specimens coated with Stopoxy 1B have been characterised by SEM with EDX in order to
identify the phases responsible for the protection against oxidation. Coated specimens are
constituted by a thick layered oxide, with much round large porosity, which has an external iron
oxide layer, an intermediate layer and an inner entangled interface rich in fayalite (Figure 67).
Figure 67: SEM+EDX characterisation of coated specimen after heating, (CSM)
Table 32 gives an example of NGO B24 (Tata 1) steel coated with Descalizer RXT (cold
application) and shows the cross-section of the specimens reheated at 1120 °C and 1180 °C
compared to the specimens reheated without coating. The first observation is the porosity of the
layer formed. The oxide formed when using coating seems to be less compact, separation of the
oxide in different layers is visible, large pores and low adherence are the main characteristics of
the scale at both reheating temperatures. At 1180 °C the scale formed when coating is used for as-
cast and polished specimen shows not only more porosity but also the fayalite formation seems to be
reduced or transformed. Less fayalite and less adherent fayalite oxide is formed. For some specimens
also oxide formation seems to be reduced. The possible effect of the coating on the fayalite formation
is expected to be an advantage for the descaling.
The investigations lead to the conclusion, that the mechanism of the coatings is (i) to
achieve barrier for oxygen diffusion due to a thick coating layer for T < 1177 °C and (ii)
to react with the alloying elements in the steel: For temperatures around fayalite eutectic up
to 1200 °C it forms fayalite which consumes the oxygen and forms a passivation layer by a silica-
sub-layer - further diffusion of oxygen will be avoided. For T > 1200 °C this mechanism is not
working and the oxidation is accelerated due to the formation of a molten fayalite rich phase.
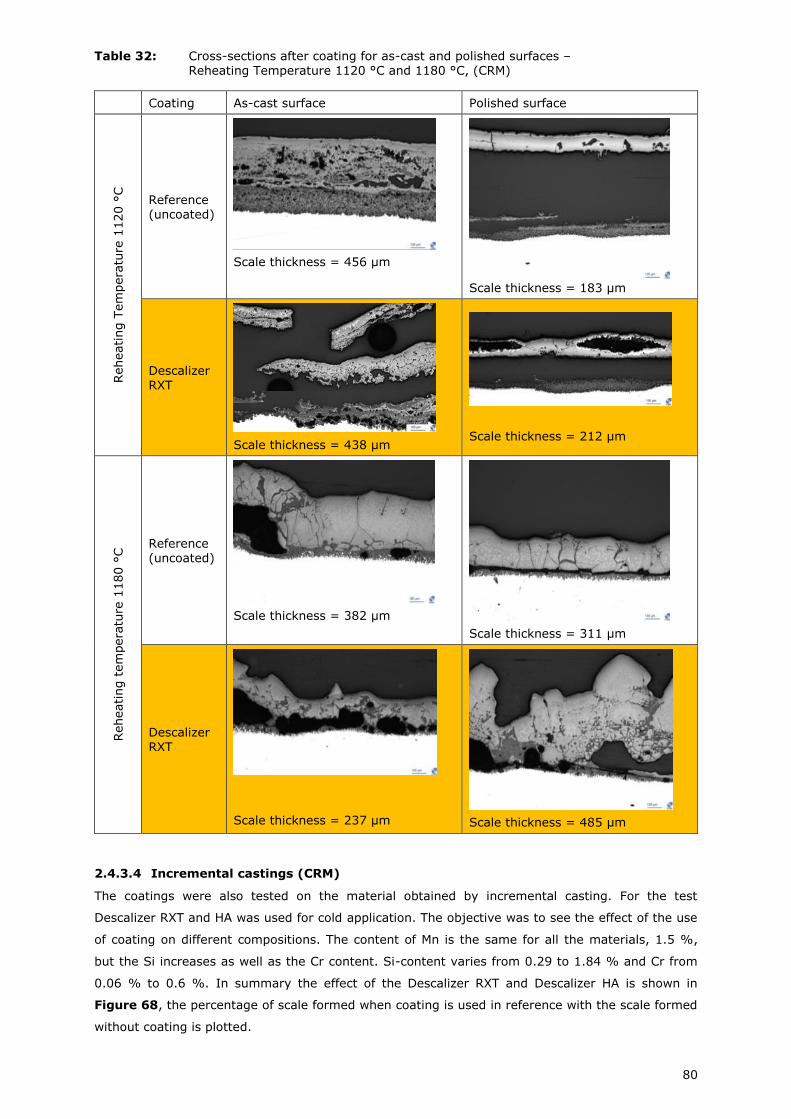
80
Table 32: Cross-sections after coating for as-cast and polished surfaces – Reheating Temperature 1120 °C and 1180 °C, (CRM)
Coating As-cast surface Polished surface
Reheating T
em
pera
ture
1120 °
C
Reference (uncoated)
Scale thickness = 456 µm
Scale thickness = 183 µm
Descalizer RXT
Scale thickness = 438 µm
Scale thickness = 212 µm
Reheating t
em
pera
ture
1180 °
C Reference
(uncoated)
Scale thickness = 382 µm
Scale thickness = 311 µm
Descalizer RXT
Scale thickness = 237 µm
Scale thickness = 485 µm
2.4.3.4 Incremental castings (CRM)
The coatings were also tested on the material obtained by incremental casting. For the test
Descalizer RXT and HA was used for cold application. The objective was to see the effect of the use
of coating on different compositions. The content of Mn is the same for all the materials, 1.5 %,
but the Si increases as well as the Cr content. Si-content varies from 0.29 to 1.84 % and Cr from
0.06 % to 0.6 %. In summary the effect of the Descalizer RXT and Descalizer HA is shown in
Figure 68, the percentage of scale formed when coating is used in reference with the scale formed
without coating is plotted.
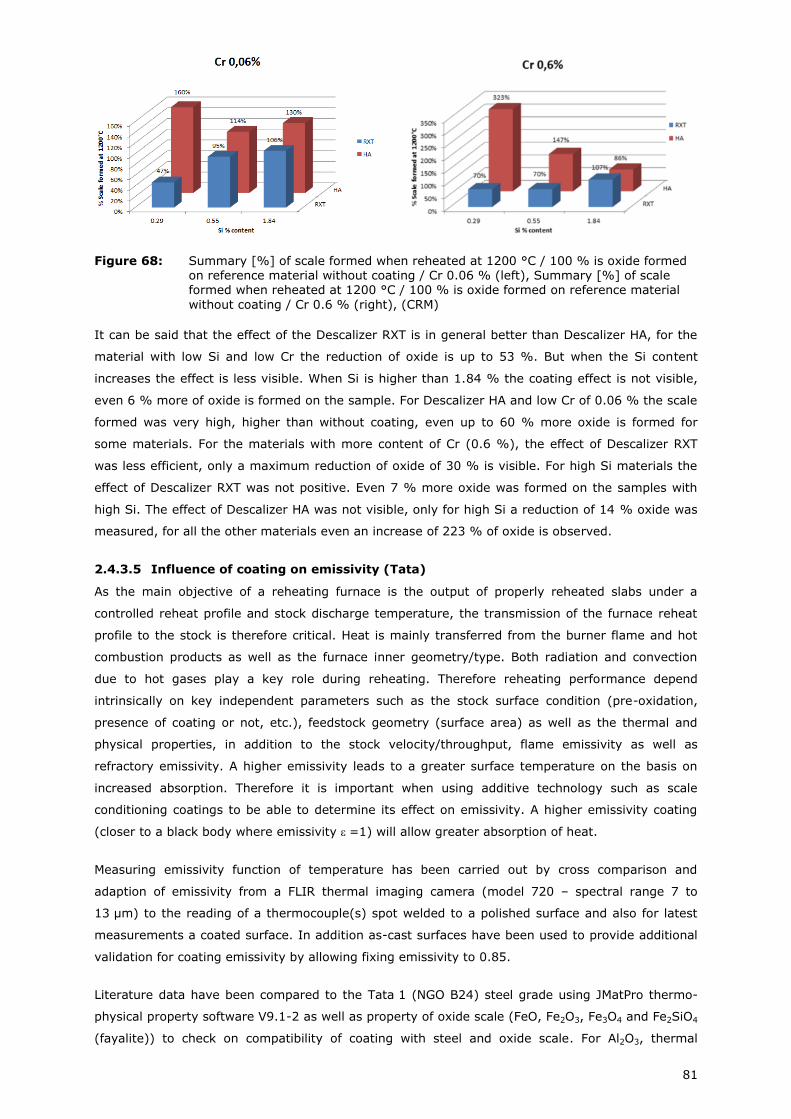
81
Figure 68: Summary [%] of scale formed when reheated at 1200 °C / 100 % is oxide formed on reference material without coating / Cr 0.06 % (left), Summary [%] of scale formed when reheated at 1200 °C / 100 % is oxide formed on reference material
without coating / Cr 0.6 % (right), (CRM)
It can be said that the effect of the Descalizer RXT is in general better than Descalizer HA, for the
material with low Si and low Cr the reduction of oxide is up to 53 %. But when the Si content
increases the effect is less visible. When Si is higher than 1.84 % the coating effect is not visible,
even 6 % more of oxide is formed on the sample. For Descalizer HA and low Cr of 0.06 % the scale
formed was very high, higher than without coating, even up to 60 % more oxide is formed for
some materials. For the materials with more content of Cr (0.6 %), the effect of Descalizer RXT
was less efficient, only a maximum reduction of oxide of 30 % is visible. For high Si materials the
effect of Descalizer RXT was not positive. Even 7 % more oxide was formed on the samples with
high Si. The effect of Descalizer HA was not visible, only for high Si a reduction of 14 % oxide was
measured, for all the other materials even an increase of 223 % of oxide is observed.
2.4.3.5 Influence of coating on emissivity (Tata)
As the main objective of a reheating furnace is the output of properly reheated slabs under a
controlled reheat profile and stock discharge temperature, the transmission of the furnace reheat
profile to the stock is therefore critical. Heat is mainly transferred from the burner flame and hot
combustion products as well as the furnace inner geometry/type. Both radiation and convection
due to hot gases play a key role during reheating. Therefore reheating performance depend
intrinsically on key independent parameters such as the stock surface condition (pre-oxidation,
presence of coating or not, etc.), feedstock geometry (surface area) as well as the thermal and
physical properties, in addition to the stock velocity/throughput, flame emissivity as well as
refractory emissivity. A higher emissivity leads to a greater surface temperature on the basis on
increased absorption. Therefore it is important when using additive technology such as scale
conditioning coatings to be able to determine its effect on emissivity. A higher emissivity coating
(closer to a black body where emissivity =1) will allow greater absorption of heat.
Measuring emissivity function of temperature has been carried out by cross comparison and
adaption of emissivity from a FLIR thermal imaging camera (model 720 – spectral range 7 to
13 µm) to the reading of a thermocouple(s) spot welded to a polished surface and also for latest
measurements a coated surface. In addition as-cast surfaces have been used to provide additional
validation for coating emissivity by allowing fixing emissivity to 0.85.
Literature data have been compared to the Tata 1 (NGO B24) steel grade using JMatPro thermo-
physical property software V9.1-2 as well as property of oxide scale (FeO, Fe2O3, Fe3O4 and Fe2SiO4
(fayalite)) to check on compatibility of coating with steel and oxide scale. For Al2O3, thermal
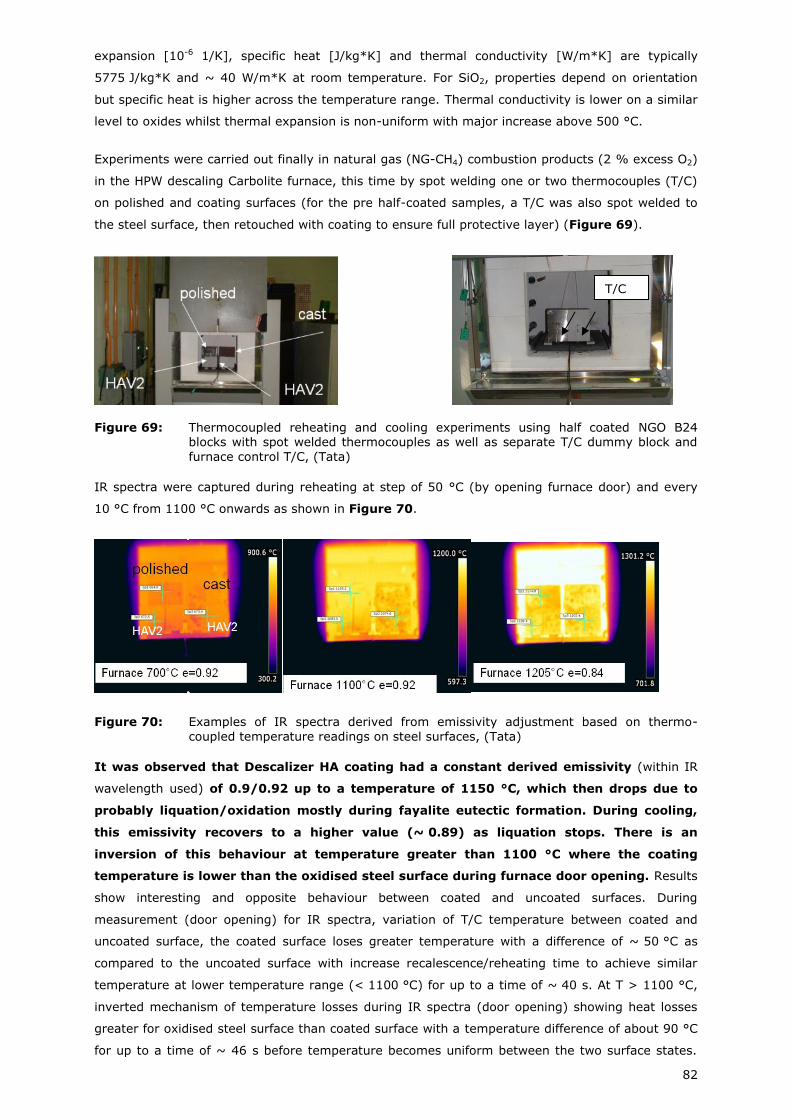
82
expansion [10-6 1/K], specific heat [J/kg*K] and thermal conductivity [W/m*K] are typically
5775 J/kg*K and ~ 40 W/m*K at room temperature. For SiO2, properties depend on orientation
but specific heat is higher across the temperature range. Thermal conductivity is lower on a similar
level to oxides whilst thermal expansion is non-uniform with major increase above 500 °C.
Experiments were carried out finally in natural gas (NG-CH4) combustion products (2 % excess O2)
in the HPW descaling Carbolite furnace, this time by spot welding one or two thermocouples (T/C)
on polished and coating surfaces (for the pre half-coated samples, a T/C was also spot welded to
the steel surface, then retouched with coating to ensure full protective layer) (Figure 69).
Figure 69: Thermocoupled reheating and cooling experiments using half coated NGO B24 blocks with spot welded thermocouples as well as separate T/C dummy block and
furnace control T/C, (Tata)
IR spectra were captured during reheating at step of 50 °C (by opening furnace door) and every
10 °C from 1100 °C onwards as shown in Figure 70.
Figure 70: Examples of IR spectra derived from emissivity adjustment based on thermo-
coupled temperature readings on steel surfaces, (Tata)
It was observed that Descalizer HA coating had a constant derived emissivity (within IR
wavelength used) of 0.9/0.92 up to a temperature of 1150 °C, which then drops due to
probably liquation/oxidation mostly during fayalite eutectic formation. During cooling,
this emissivity recovers to a higher value (~ 0.89) as liquation stops. There is an
inversion of this behaviour at temperature greater than 1100 °C where the coating
temperature is lower than the oxidised steel surface during furnace door opening. Results
show interesting and opposite behaviour between coated and uncoated surfaces. During
measurement (door opening) for IR spectra, variation of T/C temperature between coated and
uncoated surface, the coated surface loses greater temperature with a difference of ~ 50 °C as
compared to the uncoated surface with increase recalescence/reheating time to achieve similar
temperature at lower temperature range (< 1100 °C) for up to a time of ~ 40 s. At T > 1100 °C,
inverted mechanism of temperature losses during IR spectra (door opening) showing heat losses
greater for oxidised steel surface than coated surface with a temperature difference of about 90 °C
for up to a time of ~ 46 s before temperature becomes uniform between the two surface states.
T/C
83
During reheating, a higher emissivity surface such as the coated surface will allow greater
absorption of heat. The coating will affect the convective heat transfer and also the thermal
conductivity. The two principle terms during furnace door opening are convection and radiation. For
the coated surface during initial reheating (T < 1100 °C), surface temperature will be lower due to
greater heat losses through radiation (due to emissivity), implying also that for same initial
temperature prior door opening, the convective heat transfer has to reduce assuming same initial
bloc thermal energy. For temperature greater than 1100 °C, an opposite behaviour is
observed where the emissivity of the coating has reduced. The coating has also lower
conductivity compared to steel from literature data.
On the assumption that convective heat transfer (during reheating and not door opening) is similar
between coated and uncoated surfaces, the ratio between the hot applied (HA) coated surface
emissivity to the uncoated steel surface can be back-calculated. It can be observed that
emissivity during pre-heating compared to a polished steel surface is much higher but
then converge as oxidation takes place at T > 1000 °C.
2.4.3.6 Influence of coatings on heat transfer / thermodynamic (CSM)
The work on the influence of coatings on heat transfer was combined with the development of a
model describing the effect of oxidation conditions on the structure of the scale formed. The idea
behind the model is that the structure of the scale affects the descalability. The availability of a
mathematical model giving indications on the effect of operating conditions and to perform
sensitivity analysis is a useful tool to perform a preliminary selection of the most appropriate
operating conditions and descaling strategy.
Up to some years ago the models of scale evolution were limited to the estimation of scale
thickness as a function of oxidation conditions, such as temperature, gas composition, gas velocity.
In these models the impact of steel composition is considered only from an empirical point of view,
using experimental thermogravimetric measurements. Latest research in HiPerScale and other
projects, e.g. [3] applied thermodynamic analysis to individuate the phases formed under different
conditions, taking into account temperature and both the chemistry of the gas and the steel,
producing “phase stability maps”. These maps give information about the phases to be expected in
different zones of the scale. For instance the phases in equilibrium with steel are the phases to be
expected in the zone of the interface steel/scale. This information is directly useful to evaluate the
descalability. Despite its usefulness, a pure thermodynamic calculation cannot give information on
the evolution in time of the scale characteristics. This improvement can be obtained with the
integration of thermodynamic equilibrium and transport phenomena calculations in a reaction-
diffusion model. This approach was adopted to realise a model of the evolution of the scale, in
terms of type and composition of the phases formed, and the evolution of the metallic matrix under
the scale. In particular the model has been realised in order to take into account the presence of
external oxides, which constitute the coatings experimented in this project, in order to evaluate the
impact of these oxide on the scale characteristics.
Aim of the model
The aim of the model is to predict:
the thickness of the scale,
the phases formed inside the scale,
the evolution of the metallic matrix composition in terms of internal oxidation,
the distribution of the concentrations of the species in metallic solid solution.
84
An important task is the application of the model to the steel oxidation in presence of coating. The
final goal of the model is to investigate the effect of operating conditions and steel composition of
the scale characteristics and to help to evaluate the benefits of the coating, limiting the need of
experimental characterisations.
Description of the model
The model is based on the basic mechanisms governing steel oxidation based on [3]. The physics
of the process is well known [95] and a detailed description is out of the scope of HiPerScale. The
macro effect is the occurrence of effective flows of oxygen, moving from the interface gas/oxide to
the interface oxide/metal, and metallic species in the opposite direction. The flow rates of the
species in the metallic matrix and in the oxide layer can be represented by phenomenological laws
written, as diffusion phenomena, according to the Fick’s law of diffusion. In parallel with the
transport, reactions occur between metallic species and oxygen and between carbon and oxygen,
forming metallic oxides and CO. The formation of the metallic oxides can be considered much
faster than the transport rate. To represent these phenomena the system is schematised as a set
of reactors in series: multi-tanks system.
Oxygen, from outside enters in the first tank (or in the coating) and moves from a tank to the next
tank. Metals move in counter-current respect to oxygen. Oxygen and metals move both inside the
scale and inside the metal. The presence of a coating layer gives two effects: it changes the flow
rate of oxygen supplied to the system; the oxides of the coating interact with the oxides of the
scale. The transport rates of the species, from tank to tank, are considered proportional to the
difference between the two chemical concentrations and to the diffusion coefficient, whose values
are known from literature and databases. The size of the tank is the scale length at which the
system can be considered at thermodynamic equilibrium. As a consequence of the diffusion of the
species in each tank a new composition is produced. Chemical reactions occur between metal
components and oxygen. Under the hypothesis of fast reaction rates the products of the reactions
can be calculated assuming a local thermodynamic equilibrium. The thermodynamic calculations
are performed using a commercial code: Thermocalc and the database TCOX5, which is specific for
metals and oxide solutions [96]. The thermodynamic code calculates mass and composition of the
phases present in the tank. The reaction rate of the reaction between oxygen and carbon depends
on the velocity of formation and removal of CO. The determination of the CO flow rate as a function
of scale thickness and characteristics and over all on the characteristics of the coating requires a
dedicated experimentation and has been not included in the model. This aspect could be
investigated and implemented in future occasions.
The model calculates:
Scale mass and thickness as a function of time (that should be comparable with typical
parabolic model results),
Mass and distribution of oxide phases inside the scale layer,
Distribution of concentration of components inside the steel.
How the model works
The two key points of the model are the calculation of transport by diffusion of species, which
occurs in metal matrix and in the oxide system of the scale, and the thermodynamic equilibrium
calculation. The transport of species in metallic matrix is calculated from tank to tank using the
diffusion coefficients of the species in solid solution in the metallic phases stable in the considered
steel at the considered temperature. The velocity of oxygen transport through the scale layer is
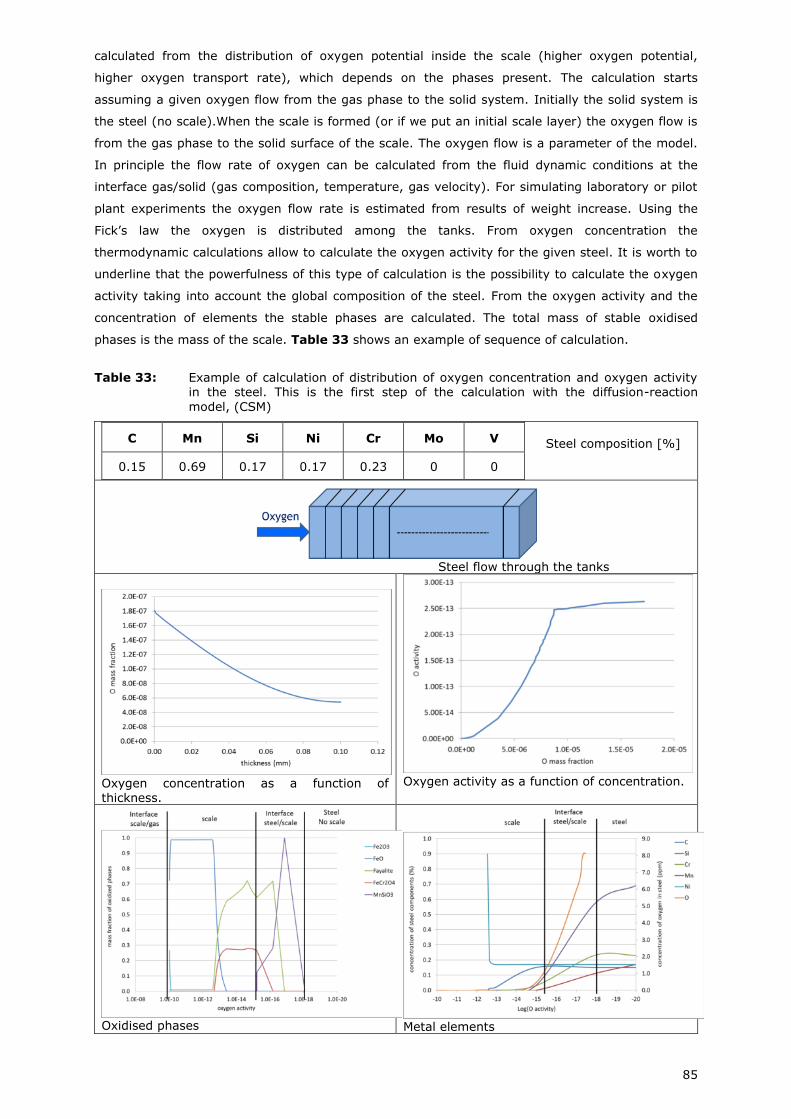
85
calculated from the distribution of oxygen potential inside the scale (higher oxygen potential,
higher oxygen transport rate), which depends on the phases present. The calculation starts
assuming a given oxygen flow from the gas phase to the solid system. Initially the solid system is
the steel (no scale).When the scale is formed (or if we put an initial scale layer) the oxygen flow is
from the gas phase to the solid surface of the scale. The oxygen flow is a parameter of the model.
In principle the flow rate of oxygen can be calculated from the fluid dynamic conditions at the
interface gas/solid (gas composition, temperature, gas velocity). For simulating laboratory or pilot
plant experiments the oxygen flow rate is estimated from results of weight increase. Using the
Fick’s law the oxygen is distributed among the tanks. From oxygen concentration the
thermodynamic calculations allow to calculate the oxygen activity for the given steel. It is worth to
underline that the powerfulness of this type of calculation is the possibility to calculate the oxygen
activity taking into account the global composition of the steel. From the oxygen activity and the
concentration of elements the stable phases are calculated. The total mass of stable oxidised
phases is the mass of the scale. Table 33 shows an example of sequence of calculation.
Table 33: Example of calculation of distribution of oxygen concentration and oxygen activity in the steel. This is the first step of the calculation with the diffusion-reaction
model, (CSM)
C Mn Si Ni Cr Mo V
0.15 0.69 0.17 0.17 0.23 0 0
Steel flow through the tanks
Oxygen concentration as a function of thickness.
Oxygen activity as a function of concentration.
Oxidised phases
Metal elements
Steel composition [%]
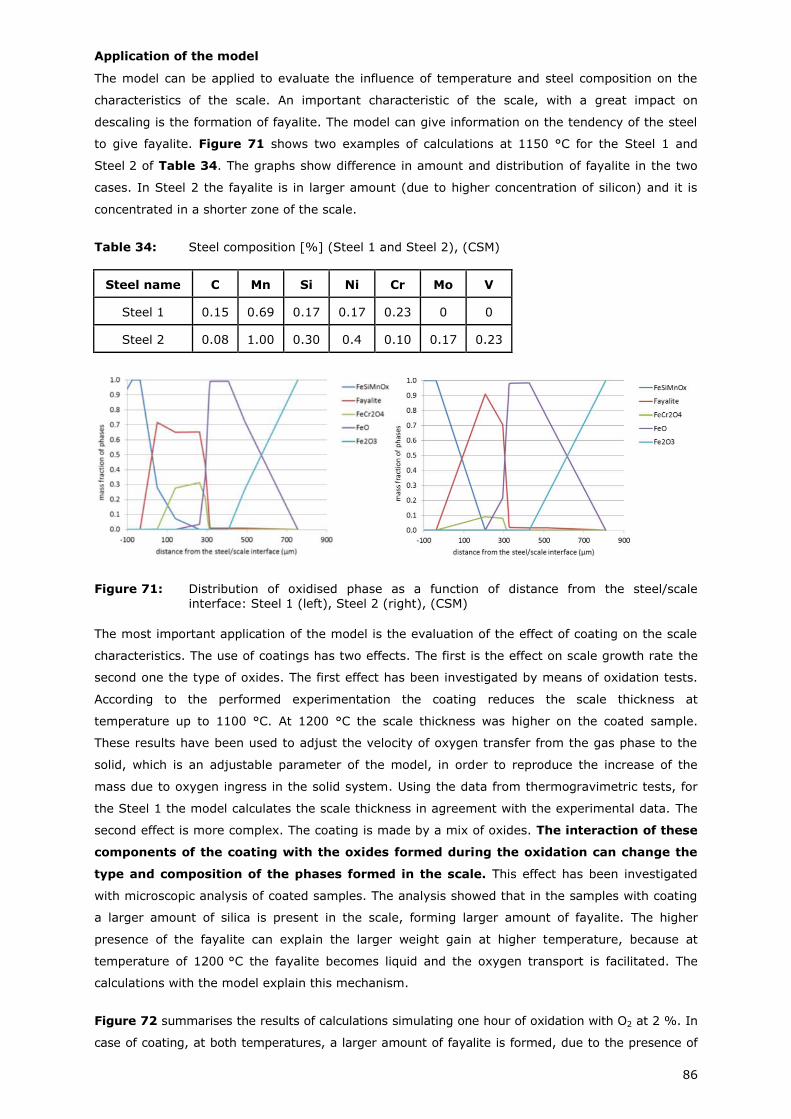
86
Application of the model
The model can be applied to evaluate the influence of temperature and steel composition on the
characteristics of the scale. An important characteristic of the scale, with a great impact on
descaling is the formation of fayalite. The model can give information on the tendency of the steel
to give fayalite. Figure 71 shows two examples of calculations at 1150 °C for the Steel 1 and
Steel 2 of Table 34. The graphs show difference in amount and distribution of fayalite in the two
cases. In Steel 2 the fayalite is in larger amount (due to higher concentration of silicon) and it is
concentrated in a shorter zone of the scale.
Table 34: Steel composition [%] (Steel 1 and Steel 2), (CSM)
Steel name C Mn Si Ni Cr Mo V
Steel 1 0.15 0.69 0.17 0.17 0.23 0 0
Steel 2 0.08 1.00 0.30 0.4 0.10 0.17 0.23
Figure 71: Distribution of oxidised phase as a function of distance from the steel/scale
interface: Steel 1 (left), Steel 2 (right), (CSM)
The most important application of the model is the evaluation of the effect of coating on the scale
characteristics. The use of coatings has two effects. The first is the effect on scale growth rate the
second one the type of oxides. The first effect has been investigated by means of oxidation tests.
According to the performed experimentation the coating reduces the scale thickness at
temperature up to 1100 °C. At 1200 °C the scale thickness was higher on the coated sample.
These results have been used to adjust the velocity of oxygen transfer from the gas phase to the
solid, which is an adjustable parameter of the model, in order to reproduce the increase of the
mass due to oxygen ingress in the solid system. Using the data from thermogravimetric tests, for
the Steel 1 the model calculates the scale thickness in agreement with the experimental data. The
second effect is more complex. The coating is made by a mix of oxides. The interaction of these
components of the coating with the oxides formed during the oxidation can change the
type and composition of the phases formed in the scale. This effect has been investigated
with microscopic analysis of coated samples. The analysis showed that in the samples with coating
a larger amount of silica is present in the scale, forming larger amount of fayalite. The higher
presence of the fayalite can explain the larger weight gain at higher temperature, because at
temperature of 1200 °C the fayalite becomes liquid and the oxygen transport is facilitated. The
calculations with the model explain this mechanism.
Figure 72 summarises the results of calculations simulating one hour of oxidation with O2 at 2 %. In
case of coating, at both temperatures, a larger amount of fayalite is formed, due to the presence of
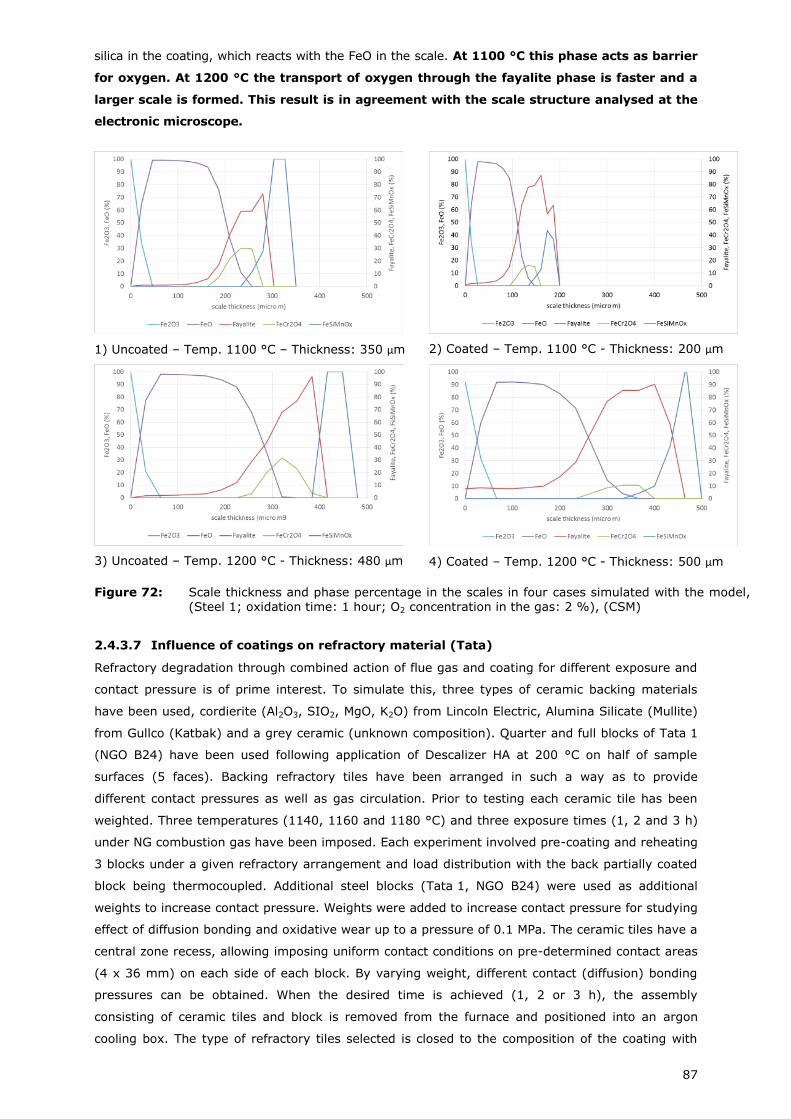
87
silica in the coating, which reacts with the FeO in the scale. At 1100 °C this phase acts as barrier
for oxygen. At 1200 °C the transport of oxygen through the fayalite phase is faster and a
larger scale is formed. This result is in agreement with the scale structure analysed at the
electronic microscope.
1) Uncoated – Temp. 1100 °C – Thickness: 350 µm
2) Coated – Temp. 1100 °C - Thickness: 200 µm
3) Uncoated – Temp. 1200 °C - Thickness: 480 µm
4) Coated – Temp. 1200 °C - Thickness: 500 µm
Figure 72: Scale thickness and phase percentage in the scales in four cases simulated with the model, (Steel 1; oxidation time: 1 hour; O2 concentration in the gas: 2 %), (CSM)
2.4.3.7 Influence of coatings on refractory material (Tata)
Refractory degradation through combined action of flue gas and coating for different exposure and
contact pressure is of prime interest. To simulate this, three types of ceramic backing materials
have been used, cordierite (Al2O3, SIO2, MgO, K2O) from Lincoln Electric, Alumina Silicate (Mullite)
from Gullco (Katbak) and a grey ceramic (unknown composition). Quarter and full blocks of Tata 1
(NGO B24) have been used following application of Descalizer HA at 200 °C on half of sample
surfaces (5 faces). Backing refractory tiles have been arranged in such a way as to provide
different contact pressures as well as gas circulation. Prior to testing each ceramic tile has been
weighted. Three temperatures (1140, 1160 and 1180 °C) and three exposure times (1, 2 and 3 h)
under NG combustion gas have been imposed. Each experiment involved pre-coating and reheating
3 blocks under a given refractory arrangement and load distribution with the back partially coated
block being thermocoupled. Additional steel blocks (Tata 1, NGO B24) were used as additional
weights to increase contact pressure. Weights were added to increase contact pressure for studying
effect of diffusion bonding and oxidative wear up to a pressure of 0.1 MPa. The ceramic tiles have a
central zone recess, allowing imposing uniform contact conditions on pre-determined contact areas
(4 x 36 mm) on each side of each block. By varying weight, different contact (diffusion) bonding
pressures can be obtained. When the desired time is achieved (1, 2 or 3 h), the assembly
consisting of ceramic tiles and block is removed from the furnace and positioned into an argon
cooling box. The type of refractory tiles selected is closed to the composition of the coating with
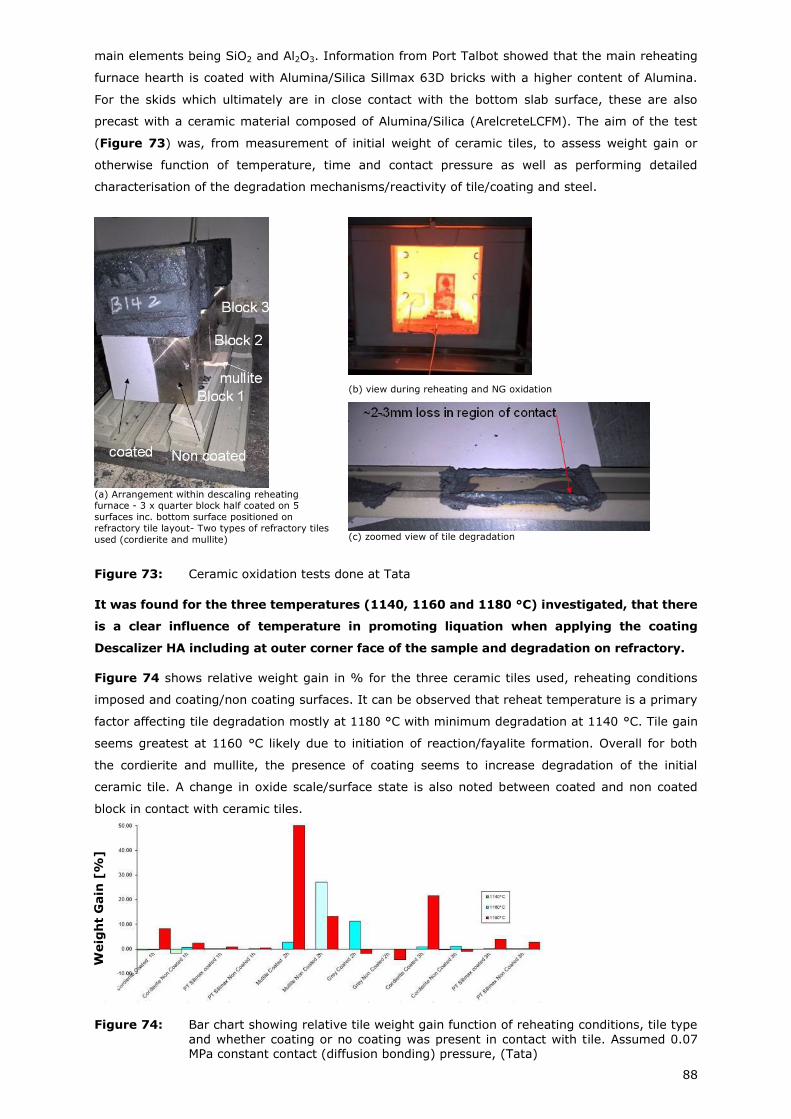
88
main elements being SiO2 and Al2O3. Information from Port Talbot showed that the main reheating
furnace hearth is coated with Alumina/Silica Sillmax 63D bricks with a higher content of Alumina.
For the skids which ultimately are in close contact with the bottom slab surface, these are also
precast with a ceramic material composed of Alumina/Silica (ArelcreteLCFM). The aim of the test
(Figure 73) was, from measurement of initial weight of ceramic tiles, to assess weight gain or
otherwise function of temperature, time and contact pressure as well as performing detailed
characterisation of the degradation mechanisms/reactivity of tile/coating and steel.
(a) Arrangement within descaling reheating furnace - 3 x quarter block half coated on 5
surfaces inc. bottom surface positioned on
refractory tile layout- Two types of refractory tiles
used (cordierite and mullite)
(b) view during reheating and NG oxidation
(c) zoomed view of tile degradation
Figure 73: Ceramic oxidation tests done at Tata
It was found for the three temperatures (1140, 1160 and 1180 °C) investigated, that there
is a clear influence of temperature in promoting liquation when applying the coating
Descalizer HA including at outer corner face of the sample and degradation on refractory.
Figure 74 shows relative weight gain in % for the three ceramic tiles used, reheating conditions
imposed and coating/non coating surfaces. It can be observed that reheat temperature is a primary
factor affecting tile degradation mostly at 1180 °C with minimum degradation at 1140 °C. Tile gain
seems greatest at 1160 °C likely due to initiation of reaction/fayalite formation. Overall for both
the cordierite and mullite, the presence of coating seems to increase degradation of the initial
ceramic tile. A change in oxide scale/surface state is also noted between coated and non coated
block in contact with ceramic tiles.
Figure 74: Bar chart showing relative tile weight gain function of reheating conditions, tile type
and whether coating or no coating was present in contact with tile. Assumed 0.07 MPa constant contact (diffusion bonding) pressure, (Tata)
Weig
ht
Gain
[%
]
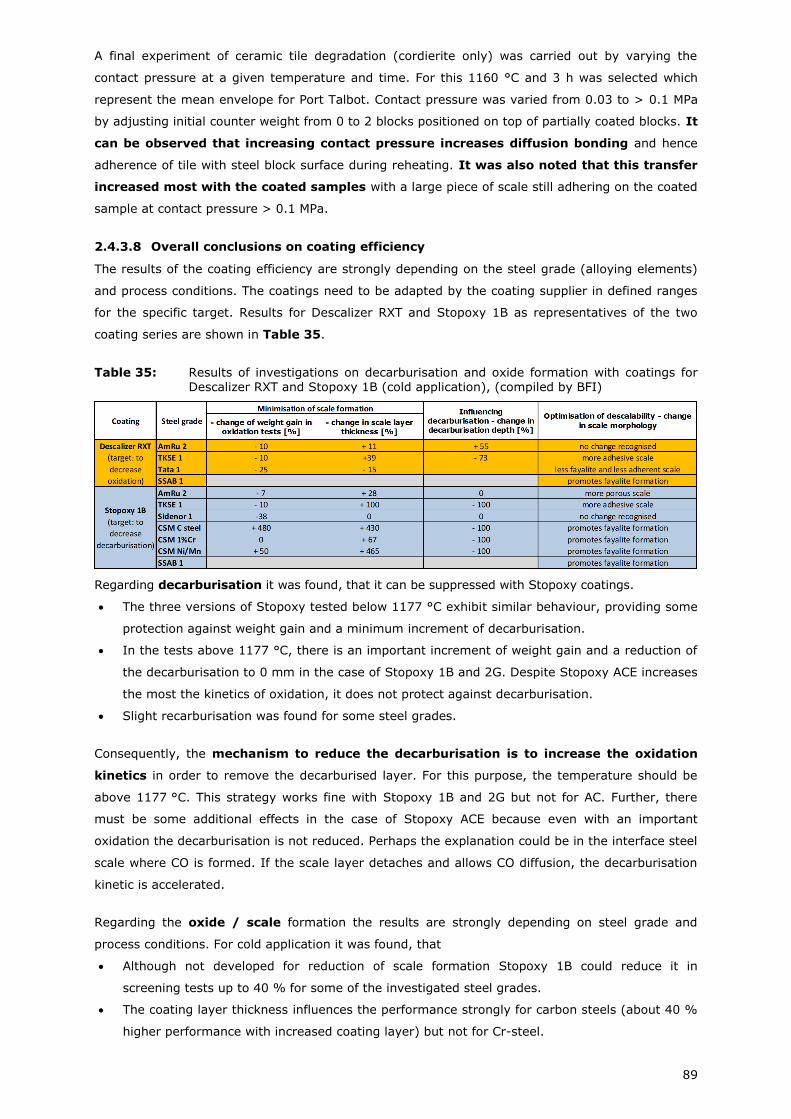
89
A final experiment of ceramic tile degradation (cordierite only) was carried out by varying the
contact pressure at a given temperature and time. For this 1160 °C and 3 h was selected which
represent the mean envelope for Port Talbot. Contact pressure was varied from 0.03 to > 0.1 MPa
by adjusting initial counter weight from 0 to 2 blocks positioned on top of partially coated blocks. It
can be observed that increasing contact pressure increases diffusion bonding and hence
adherence of tile with steel block surface during reheating. It was also noted that this transfer
increased most with the coated samples with a large piece of scale still adhering on the coated
sample at contact pressure > 0.1 MPa.
2.4.3.8 Overall conclusions on coating efficiency
The results of the coating efficiency are strongly depending on the steel grade (alloying elements)
and process conditions. The coatings need to be adapted by the coating supplier in defined ranges
for the specific target. Results for Descalizer RXT and Stopoxy 1B as representatives of the two
coating series are shown in Table 35.
Table 35: Results of investigations on decarburisation and oxide formation with coatings for Descalizer RXT and Stopoxy 1B (cold application), (compiled by BFI)
Regarding decarburisation it was found, that it can be suppressed with Stopoxy coatings.
The three versions of Stopoxy tested below 1177 °C exhibit similar behaviour, providing some
protection against weight gain and a minimum increment of decarburisation.
In the tests above 1177 °C, there is an important increment of weight gain and a reduction of
the decarburisation to 0 mm in the case of Stopoxy 1B and 2G. Despite Stopoxy ACE increases
the most the kinetics of oxidation, it does not protect against decarburisation.
Slight recarburisation was found for some steel grades.
Consequently, the mechanism to reduce the decarburisation is to increase the oxidation
kinetics in order to remove the decarburised layer. For this purpose, the temperature should be
above 1177 °C. This strategy works fine with Stopoxy 1B and 2G but not for AC. Further, there
must be some additional effects in the case of Stopoxy ACE because even with an important
oxidation the decarburisation is not reduced. Perhaps the explanation could be in the interface steel
scale where CO is formed. If the scale layer detaches and allows CO diffusion, the decarburisation
kinetic is accelerated.
Regarding the oxide / scale formation the results are strongly depending on steel grade and
process conditions. For cold application it was found, that
Although not developed for reduction of scale formation Stopoxy 1B could reduce it in
screening tests up to 40 % for some of the investigated steel grades.
The coating layer thickness influences the performance strongly for carbon steels (about 40 %
higher performance with increased coating layer) but not for Cr-steel.
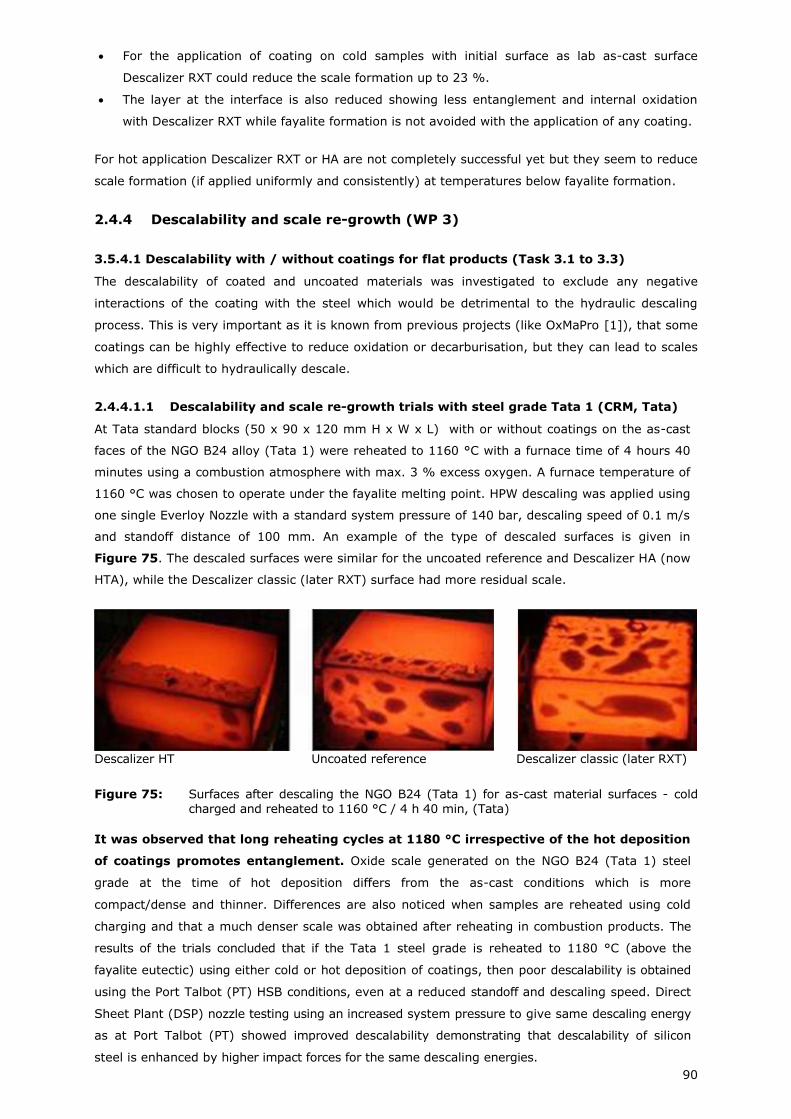
90
For the application of coating on cold samples with initial surface as lab as-cast surface
Descalizer RXT could reduce the scale formation up to 23 %.
The layer at the interface is also reduced showing less entanglement and internal oxidation
with Descalizer RXT while fayalite formation is not avoided with the application of any coating.
For hot application Descalizer RXT or HA are not completely successful yet but they seem to reduce
scale formation (if applied uniformly and consistently) at temperatures below fayalite formation.
2.4.4 Descalability and scale re-growth (WP 3)
3.5.4.1 Descalability with / without coatings for flat products (Task 3.1 to 3.3)
The descalability of coated and uncoated materials was investigated to exclude any negative
interactions of the coating with the steel which would be detrimental to the hydraulic descaling
process. This is very important as it is known from previous projects (like OxMaPro [1]), that some
coatings can be highly effective to reduce oxidation or decarburisation, but they can lead to scales
which are difficult to hydraulically descale.
2.4.4.1.1 Descalability and scale re-growth trials with steel grade Tata 1 (CRM, Tata)
At Tata standard blocks (50 x 90 x 120 mm H x W x L) with or without coatings on the as-cast
faces of the NGO B24 alloy (Tata 1) were reheated to 1160 °C with a furnace time of 4 hours 40
minutes using a combustion atmosphere with max. 3 % excess oxygen. A furnace temperature of
1160 °C was chosen to operate under the fayalite melting point. HPW descaling was applied using
one single Everloy Nozzle with a standard system pressure of 140 bar, descaling speed of 0.1 m/s
and standoff distance of 100 mm. An example of the type of descaled surfaces is given in
Figure 75. The descaled surfaces were similar for the uncoated reference and Descalizer HA (now
HTA), while the Descalizer classic (later RXT) surface had more residual scale.
Descalizer HT Uncoated reference Descalizer classic (later RXT)
Figure 75: Surfaces after descaling the NGO B24 (Tata 1) for as-cast material surfaces - cold
charged and reheated to 1160 °C / 4 h 40 min, (Tata)
It was observed that long reheating cycles at 1180 °C irrespective of the hot deposition
of coatings promotes entanglement. Oxide scale generated on the NGO B24 (Tata 1) steel
grade at the time of hot deposition differs from the as-cast conditions which is more
compact/dense and thinner. Differences are also noticed when samples are reheated using cold
charging and that a much denser scale was obtained after reheating in combustion products. The
results of the trials concluded that if the Tata 1 steel grade is reheated to 1180 °C (above the
fayalite eutectic) using either cold or hot deposition of coatings, then poor descalability is obtained
using the Port Talbot (PT) HSB conditions, even at a reduced standoff and descaling speed. Direct
Sheet Plant (DSP) nozzle testing using an increased system pressure to give same descaling energy
as at Port Talbot (PT) showed improved descalability demonstrating that descalability of silicon
steel is enhanced by higher impact forces for the same descaling energies.
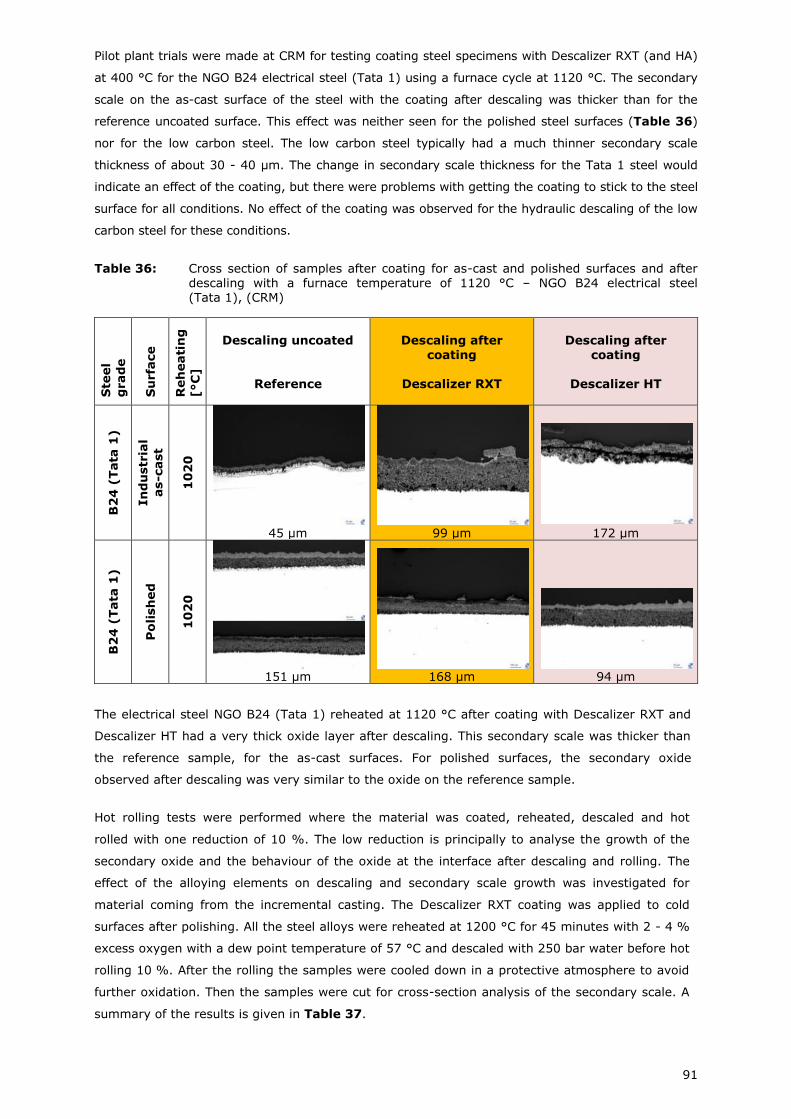
91
Pilot plant trials were made at CRM for testing coating steel specimens with Descalizer RXT (and HA)
at 400 °C for the NGO B24 electrical steel (Tata 1) using a furnace cycle at 1120 °C. The secondary
scale on the as-cast surface of the steel with the coating after descaling was thicker than for the
reference uncoated surface. This effect was neither seen for the polished steel surfaces (Table 36)
nor for the low carbon steel. The low carbon steel typically had a much thinner secondary scale
thickness of about 30 - 40 µm. The change in secondary scale thickness for the Tata 1 steel would
indicate an effect of the coating, but there were problems with getting the coating to stick to the steel
surface for all conditions. No effect of the coating was observed for the hydraulic descaling of the low
carbon steel for these conditions.
Table 36: Cross section of samples after coating for as-cast and polished surfaces and after descaling with a furnace temperature of 1120 °C – NGO B24 electrical steel (Tata 1), (CRM)
Ste
el
grad
e
Su
rfa
ce
Reh
eati
ng
[°C
]
Descaling uncoated
Reference
Descaling after
coating
Descalizer RXT
Descaling after
coating
Descalizer HT
B2
4 (
Tata
1)
In
du
str
ial
as-c
ast
10
20
45 µm
99 µm
172 µm
B2
4 (
Tata
1)
Po
lish
ed
10
20
151 µm
168 µm
94 µm
The electrical steel NGO B24 (Tata 1) reheated at 1120 °C after coating with Descalizer RXT and
Descalizer HT had a very thick oxide layer after descaling. This secondary scale was thicker than
the reference sample, for the as-cast surfaces. For polished surfaces, the secondary oxide
observed after descaling was very similar to the oxide on the reference sample.
Hot rolling tests were performed where the material was coated, reheated, descaled and hot
rolled with one reduction of 10 %. The low reduction is principally to analyse the growth of the
secondary oxide and the behaviour of the oxide at the interface after descaling and rolling. The
effect of the alloying elements on descaling and secondary scale growth was investigated for
material coming from the incremental casting. The Descalizer RXT coating was applied to cold
surfaces after polishing. All the steel alloys were reheated at 1200 °C for 45 minutes with 2 - 4 %
excess oxygen with a dew point temperature of 57 °C and descaled with 250 bar water before hot
rolling 10 %. After the rolling the samples were cooled down in a protective atmosphere to avoid
further oxidation. Then the samples were cut for cross-section analysis of the secondary scale. A
summary of the results is given in Table 37.
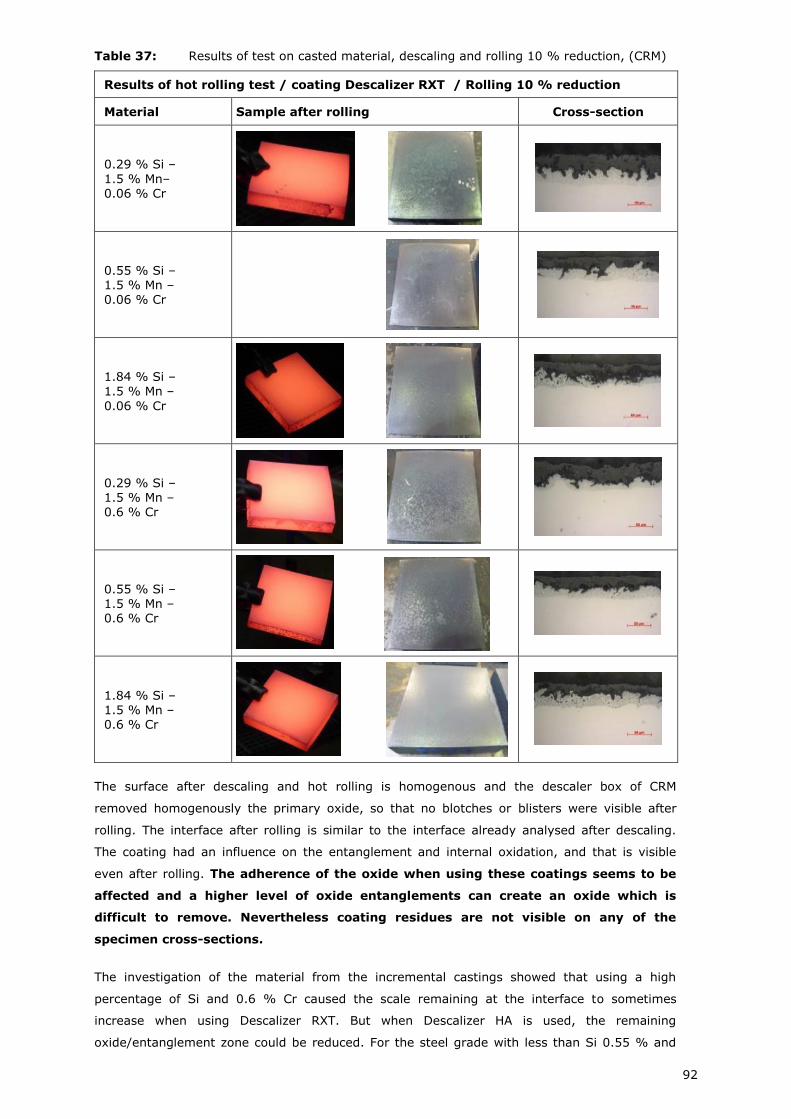
92
Table 37: Results of test on casted material, descaling and rolling 10 % reduction, (CRM)
Results of hot rolling test / coating Descalizer RXT / Rolling 10 % reduction
Material Sample after rolling Cross-section
0.29 % Si –
1.5 % Mn– 0.06 % Cr
0.55 % Si – 1.5 % Mn – 0.06 % Cr
1.84 % Si – 1.5 % Mn –
0.06 % Cr
0.29 % Si – 1.5 % Mn – 0.6 % Cr
0.55 % Si – 1.5 % Mn – 0.6 % Cr
1.84 % Si – 1.5 % Mn – 0.6 % Cr
The surface after descaling and hot rolling is homogenous and the descaler box of CRM
removed homogenously the primary oxide, so that no blotches or blisters were visible after
rolling. The interface after rolling is similar to the interface already analysed after descaling.
The coating had an influence on the entanglement and internal oxidation, and that is visible
even after rolling. The adherence of the oxide when using these coatings seems to be
affected and a higher level of oxide entanglements can create an oxide which is
difficult to remove. Nevertheless coating residues are not visible on any of the
specimen cross-sections.
The investigation of the material from the incremental castings showed that using a high
percentage of Si and 0.6 % Cr caused the scale remaining at the interface to sometimes
increase when using Descalizer RXT. But when Descalizer HA is used, the remaining
oxide/entanglement zone could be reduced. For the steel grade with less than Si 0.55 % and
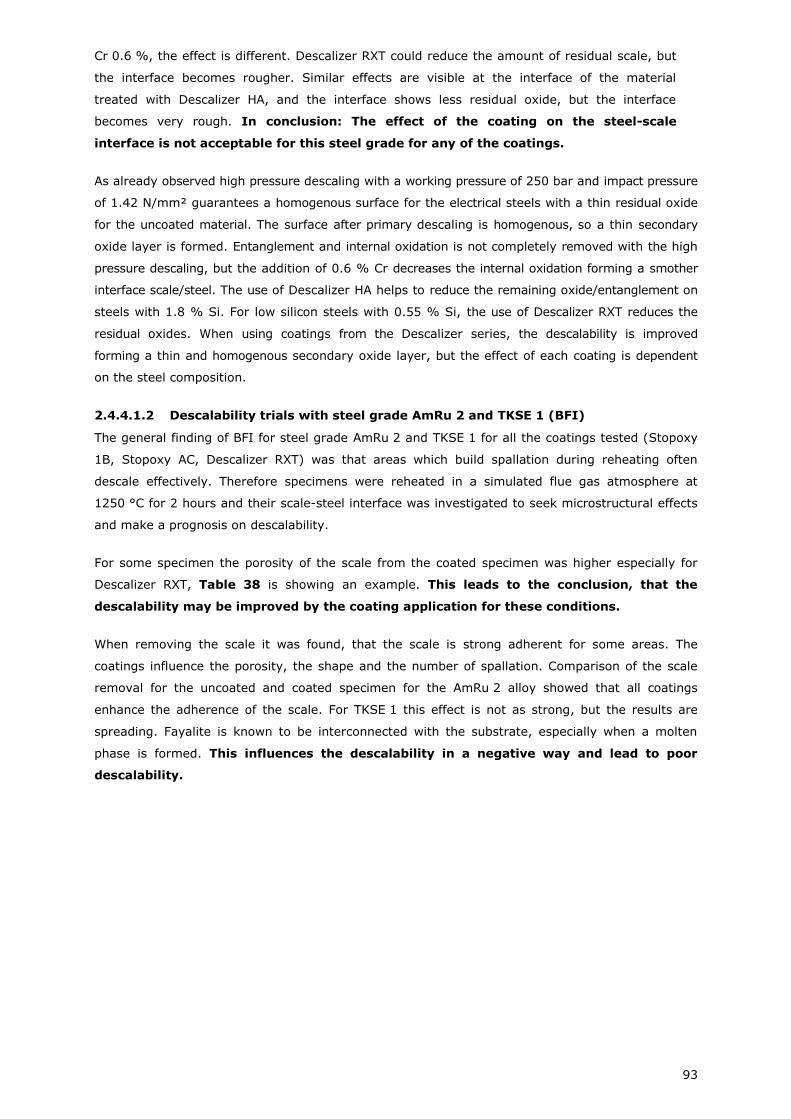
93
Cr 0.6 %, the effect is different. Descalizer RXT could reduce the amount of residual scale, but
the interface becomes rougher. Similar effects are visible at the interface of the material
treated with Descalizer HA, and the interface shows less residual oxide, but the interface
becomes very rough. In conclusion: The effect of the coating on the steel-scale
interface is not acceptable for this steel grade for any of the coatings.
As already observed high pressure descaling with a working pressure of 250 bar and impact pressure
of 1.42 N/mm² guarantees a homogenous surface for the electrical steels with a thin residual oxide
for the uncoated material. The surface after primary descaling is homogenous, so a thin secondary
oxide layer is formed. Entanglement and internal oxidation is not completely removed with the high
pressure descaling, but the addition of 0.6 % Cr decreases the internal oxidation forming a smother
interface scale/steel. The use of Descalizer HA helps to reduce the remaining oxide/entanglement on
steels with 1.8 % Si. For low silicon steels with 0.55 % Si, the use of Descalizer RXT reduces the
residual oxides. When using coatings from the Descalizer series, the descalability is improved
forming a thin and homogenous secondary oxide layer, but the effect of each coating is dependent
on the steel composition.
2.4.4.1.2 Descalability trials with steel grade AmRu 2 and TKSE 1 (BFI)
The general finding of BFI for steel grade AmRu 2 and TKSE 1 for all the coatings tested (Stopoxy
1B, Stopoxy AC, Descalizer RXT) was that areas which build spallation during reheating often
descale effectively. Therefore specimens were reheated in a simulated flue gas atmosphere at
1250 °C for 2 hours and their scale-steel interface was investigated to seek microstructural effects
and make a prognosis on descalability.
For some specimen the porosity of the scale from the coated specimen was higher especially for
Descalizer RXT, Table 38 is showing an example. This leads to the conclusion, that the
descalability may be improved by the coating application for these conditions.
When removing the scale it was found, that the scale is strong adherent for some areas. The
coatings influence the porosity, the shape and the number of spallation. Comparison of the scale
removal for the uncoated and coated specimen for the AmRu 2 alloy showed that all coatings
enhance the adherence of the scale. For TKSE 1 this effect is not as strong, but the results are
spreading. Fayalite is known to be interconnected with the substrate, especially when a molten
phase is formed. This influences the descalability in a negative way and lead to poor
descalability.
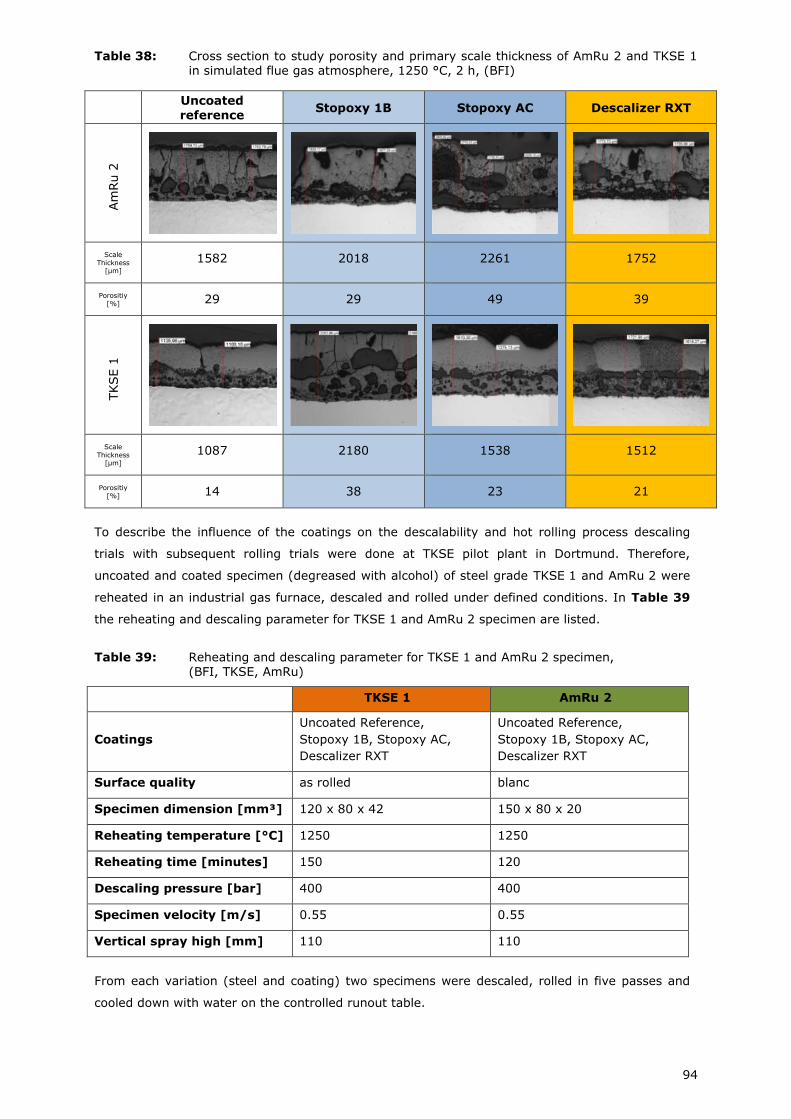
94
Table 38: Cross section to study porosity and primary scale thickness of AmRu 2 and TKSE 1 in simulated flue gas atmosphere, 1250 °C, 2 h, (BFI)
Uncoated
reference Stopoxy 1B Stopoxy AC Descalizer RXT
Am
Ru 2
Scale Thickness
[µm]
1582 2018 2261 1752
Porositiy [%] 29 29 49 39
TKSE 1
Scale Thickness
[µm]
1087 2180 1538 1512
Porositiy [%] 14 38 23 21
To describe the influence of the coatings on the descalability and hot rolling process descaling
trials with subsequent rolling trials were done at TKSE pilot plant in Dortmund. Therefore,
uncoated and coated specimen (degreased with alcohol) of steel grade TKSE 1 and AmRu 2 were
reheated in an industrial gas furnace, descaled and rolled under defined conditions. In Table 39
the reheating and descaling parameter for TKSE 1 and AmRu 2 specimen are listed.
Table 39: Reheating and descaling parameter for TKSE 1 and AmRu 2 specimen, (BFI, TKSE, AmRu)
TKSE 1 AmRu 2
Coatings
Uncoated Reference,
Stopoxy 1B, Stopoxy AC,
Descalizer RXT
Uncoated Reference,
Stopoxy 1B, Stopoxy AC,
Descalizer RXT
Surface quality as rolled blanc
Specimen dimension [mm³] 120 x 80 x 42 150 x 80 x 20
Reheating temperature [°C] 1250 1250
Reheating time [minutes] 150 120
Descaling pressure [bar] 400 400
Specimen velocity [m/s] 0.55 0.55
Vertical spray high [mm] 110 110
From each variation (steel and coating) two specimens were descaled, rolled in five passes and
cooled down with water on the controlled runout table.
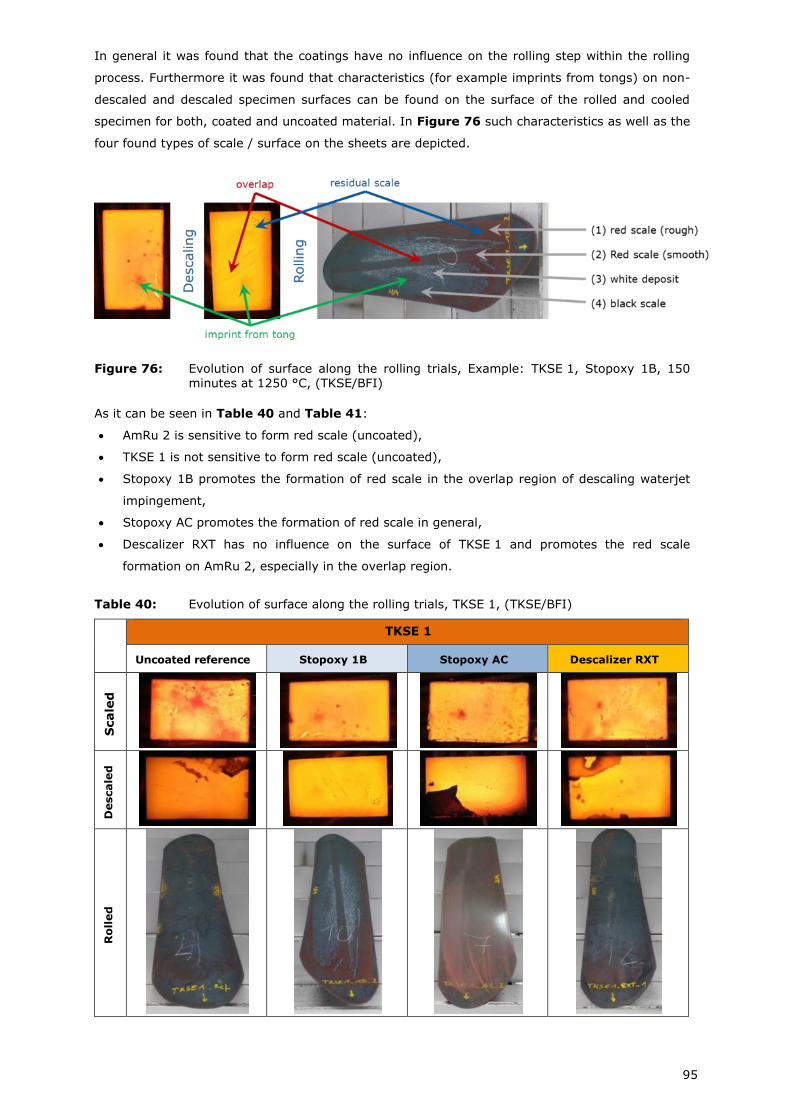
95
In general it was found that the coatings have no influence on the rolling step within the rolling
process. Furthermore it was found that characteristics (for example imprints from tongs) on non-
descaled and descaled specimen surfaces can be found on the surface of the rolled and cooled
specimen for both, coated and uncoated material. In Figure 76 such characteristics as well as the
four found types of scale / surface on the sheets are depicted.
Figure 76: Evolution of surface along the rolling trials, Example: TKSE 1, Stopoxy 1B, 150 minutes at 1250 °C, (TKSE/BFI)
As it can be seen in Table 40 and Table 41:
AmRu 2 is sensitive to form red scale (uncoated),
TKSE 1 is not sensitive to form red scale (uncoated),
Stopoxy 1B promotes the formation of red scale in the overlap region of descaling waterjet
impingement,
Stopoxy AC promotes the formation of red scale in general,
Descalizer RXT has no influence on the surface of TKSE 1 and promotes the red scale
formation on AmRu 2, especially in the overlap region.
Table 40: Evolution of surface along the rolling trials, TKSE 1, (TKSE/BFI)
TKSE 1
Uncoated reference Stopoxy 1B Stopoxy AC Descalizer RXT
Scale
d
Descale
d
Ro
lled
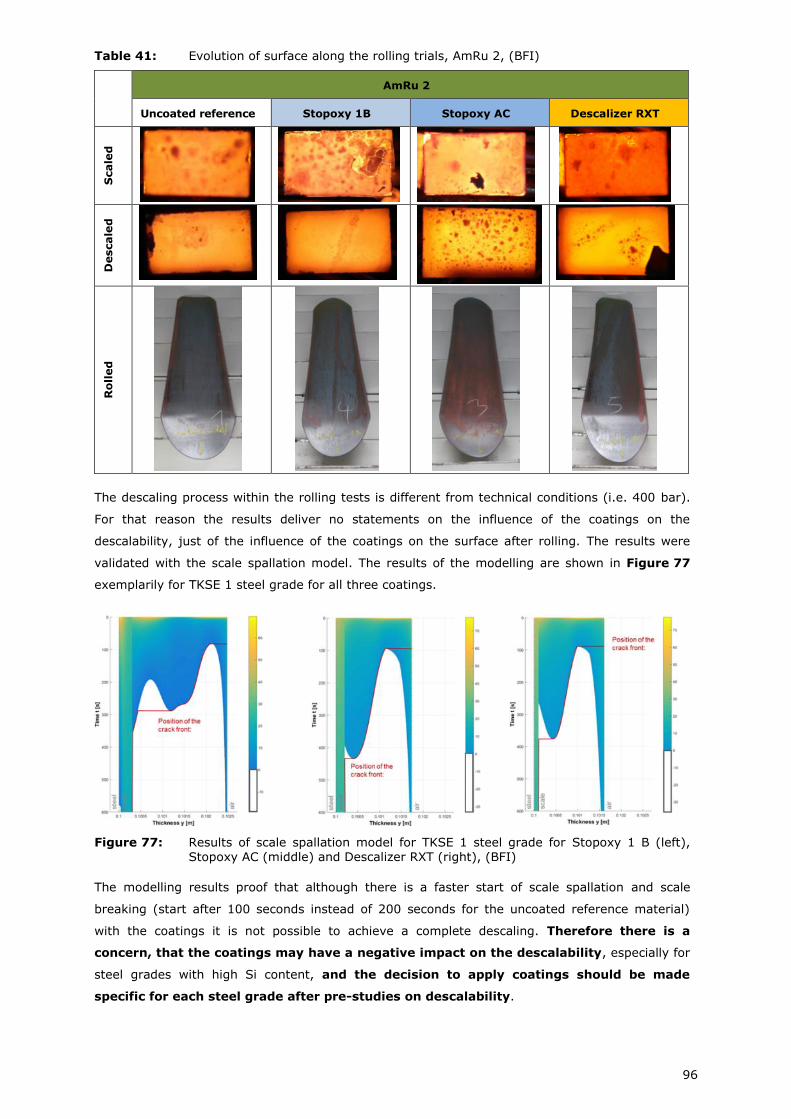
96
Table 41: Evolution of surface along the rolling trials, AmRu 2, (BFI)
AmRu 2
Uncoated reference Stopoxy 1B Stopoxy AC Descalizer RXT S
cale
d
Descale
d
Ro
lled
The descaling process within the rolling tests is different from technical conditions (i.e. 400 bar).
For that reason the results deliver no statements on the influence of the coatings on the
descalability, just of the influence of the coatings on the surface after rolling. The results were
validated with the scale spallation model. The results of the modelling are shown in Figure 77
exemplarily for TKSE 1 steel grade for all three coatings.
Figure 77: Results of scale spallation model for TKSE 1 steel grade for Stopoxy 1 B (left), Stopoxy AC (middle) and Descalizer RXT (right), (BFI)
The modelling results proof that although there is a faster start of scale spallation and scale
breaking (start after 100 seconds instead of 200 seconds for the uncoated reference material)
with the coatings it is not possible to achieve a complete descaling. Therefore there is a
concern, that the coatings may have a negative impact on the descalability, especially for
steel grades with high Si content, and the decision to apply coatings should be made
specific for each steel grade after pre-studies on descalability.
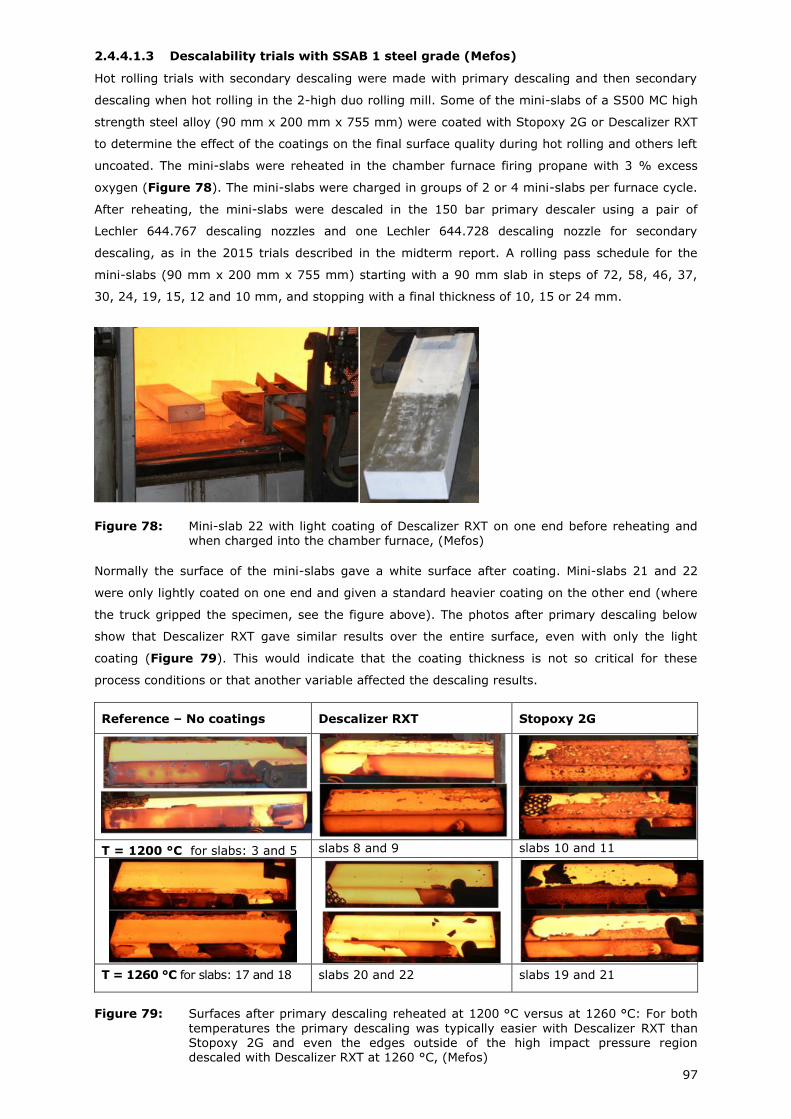
97
2.4.4.1.3 Descalability trials with SSAB 1 steel grade (Mefos)
Hot rolling trials with secondary descaling were made with primary descaling and then secondary
descaling when hot rolling in the 2-high duo rolling mill. Some of the mini-slabs of a S500 MC high
strength steel alloy (90 mm x 200 mm x 755 mm) were coated with Stopoxy 2G or Descalizer RXT
to determine the effect of the coatings on the final surface quality during hot rolling and others left
uncoated. The mini-slabs were reheated in the chamber furnace firing propane with 3 % excess
oxygen (Figure 78). The mini-slabs were charged in groups of 2 or 4 mini-slabs per furnace cycle.
After reheating, the mini-slabs were descaled in the 150 bar primary descaler using a pair of
Lechler 644.767 descaling nozzles and one Lechler 644.728 descaling nozzle for secondary
descaling, as in the 2015 trials described in the midterm report. A rolling pass schedule for the
mini-slabs (90 mm x 200 mm x 755 mm) starting with a 90 mm slab in steps of 72, 58, 46, 37,
30, 24, 19, 15, 12 and 10 mm, and stopping with a final thickness of 10, 15 or 24 mm.
Figure 78: Mini-slab 22 with light coating of Descalizer RXT on one end before reheating and when charged into the chamber furnace, (Mefos)
Normally the surface of the mini-slabs gave a white surface after coating. Mini-slabs 21 and 22
were only lightly coated on one end and given a standard heavier coating on the other end (where
the truck gripped the specimen, see the figure above). The photos after primary descaling below
show that Descalizer RXT gave similar results over the entire surface, even with only the light
coating (Figure 79). This would indicate that the coating thickness is not so critical for these
process conditions or that another variable affected the descaling results.
Reference – No coatings Descalizer RXT Stopoxy 2G
T = 1200 °C for slabs: 3 and 5 slabs 8 and 9 slabs 10 and 11
T = 1260 °C for slabs: 17 and 18 slabs 20 and 22 slabs 19 and 21
Figure 79: Surfaces after primary descaling reheated at 1200 °C versus at 1260 °C: For both
temperatures the primary descaling was typically easier with Descalizer RXT than Stopoxy 2G and even the edges outside of the high impact pressure region descaled with Descalizer RXT at 1260 °C, (Mefos)
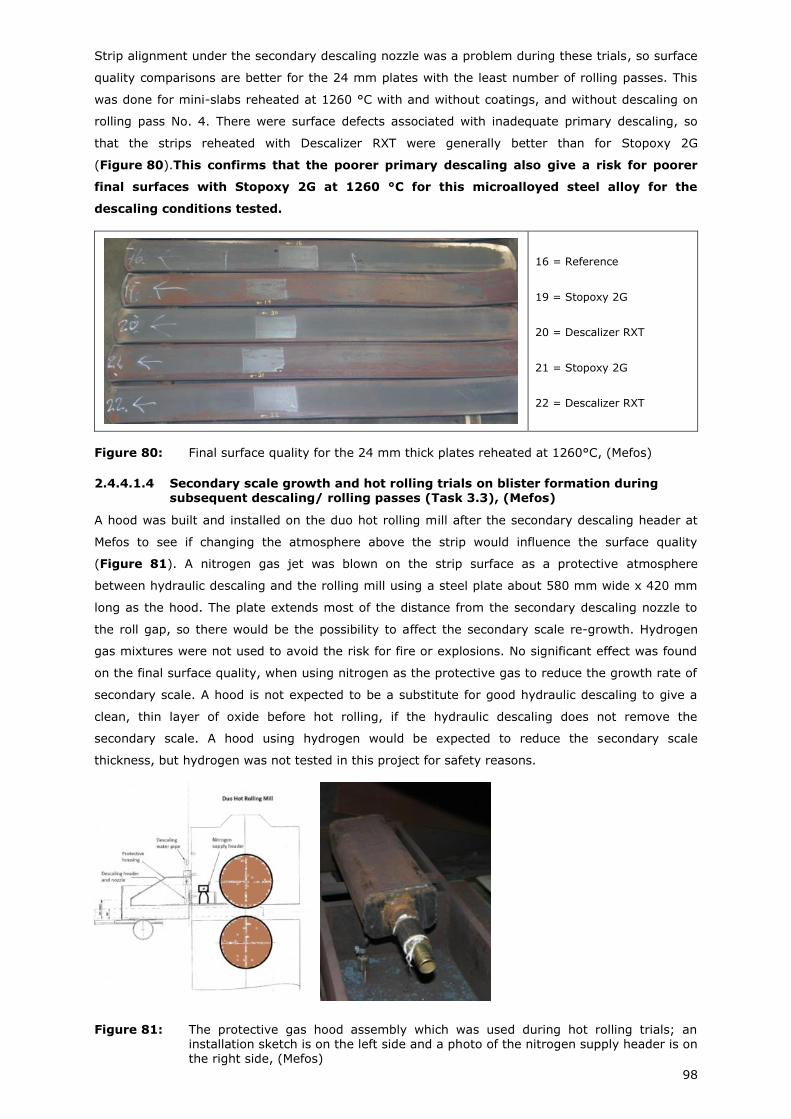
98
Strip alignment under the secondary descaling nozzle was a problem during these trials, so surface
quality comparisons are better for the 24 mm plates with the least number of rolling passes. This
was done for mini-slabs reheated at 1260 °C with and without coatings, and without descaling on
rolling pass No. 4. There were surface defects associated with inadequate primary descaling, so
that the strips reheated with Descalizer RXT were generally better than for Stopoxy 2G
(Figure 80).This confirms that the poorer primary descaling also give a risk for poorer
final surfaces with Stopoxy 2G at 1260 °C for this microalloyed steel alloy for the
descaling conditions tested.
16 = Reference
19 = Stopoxy 2G
20 = Descalizer RXT
21 = Stopoxy 2G
22 = Descalizer RXT
Figure 80: Final surface quality for the 24 mm thick plates reheated at 1260°C, (Mefos)
2.4.4.1.4 Secondary scale growth and hot rolling trials on blister formation during subsequent descaling/ rolling passes (Task 3.3), (Mefos)
A hood was built and installed on the duo hot rolling mill after the secondary descaling header at
Mefos to see if changing the atmosphere above the strip would influence the surface quality
(Figure 81). A nitrogen gas jet was blown on the strip surface as a protective atmosphere
between hydraulic descaling and the rolling mill using a steel plate about 580 mm wide x 420 mm
long as the hood. The plate extends most of the distance from the secondary descaling nozzle to
the roll gap, so there would be the possibility to affect the secondary scale re-growth. Hydrogen
gas mixtures were not used to avoid the risk for fire or explosions. No significant effect was found
on the final surface quality, when using nitrogen as the protective gas to reduce the growth rate of
secondary scale. A hood is not expected to be a substitute for good hydraulic descaling to give a
clean, thin layer of oxide before hot rolling, if the hydraulic descaling does not remove the
secondary scale. A hood using hydrogen would be expected to reduce the secondary scale
thickness, but hydrogen was not tested in this project for safety reasons.
Figure 81: The protective gas hood assembly which was used during hot rolling trials; an installation sketch is on the left side and a photo of the nitrogen supply header is on the right side, (Mefos)
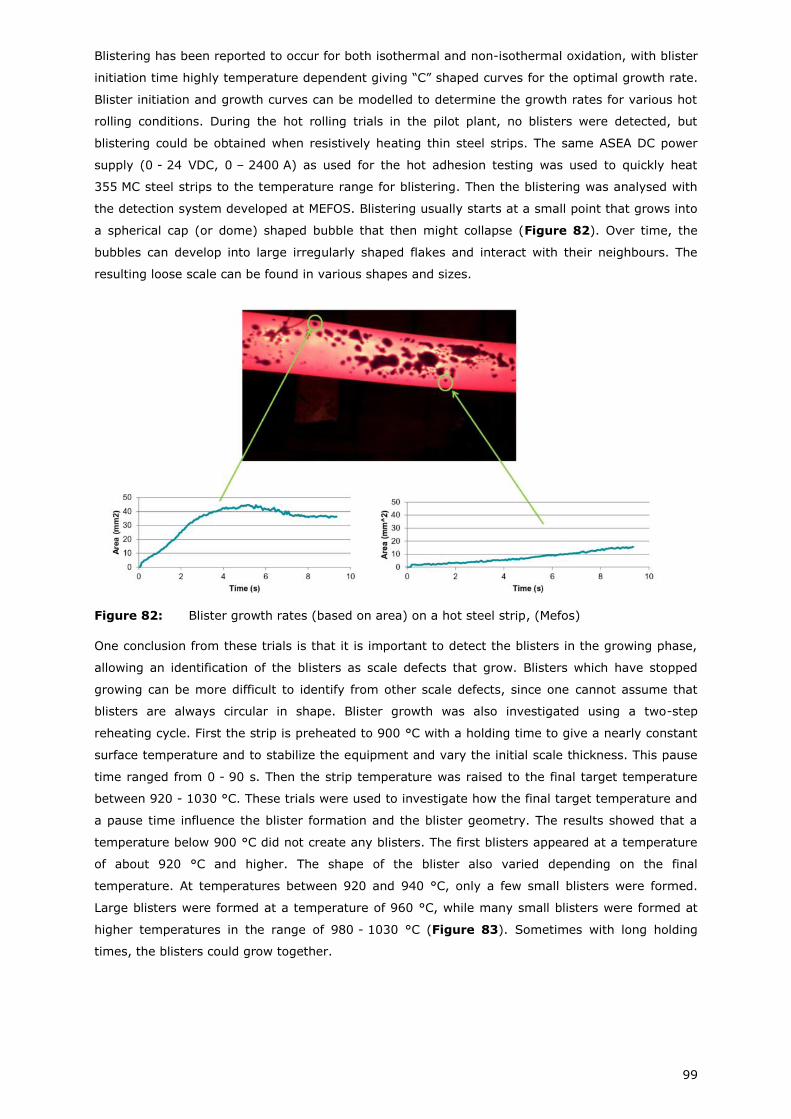
99
Blistering has been reported to occur for both isothermal and non-isothermal oxidation, with blister
initiation time highly temperature dependent giving “C” shaped curves for the optimal growth rate.
Blister initiation and growth curves can be modelled to determine the growth rates for various hot
rolling conditions. During the hot rolling trials in the pilot plant, no blisters were detected, but
blistering could be obtained when resistively heating thin steel strips. The same ASEA DC power
supply (0 - 24 VDC, 0 – 2400 A) as used for the hot adhesion testing was used to quickly heat
355 MC steel strips to the temperature range for blistering. Then the blistering was analysed with
the detection system developed at MEFOS. Blistering usually starts at a small point that grows into
a spherical cap (or dome) shaped bubble that then might collapse (Figure 82). Over time, the
bubbles can develop into large irregularly shaped flakes and interact with their neighbours. The
resulting loose scale can be found in various shapes and sizes.
Figure 82: Blister growth rates (based on area) on a hot steel strip, (Mefos)
One conclusion from these trials is that it is important to detect the blisters in the growing phase,
allowing an identification of the blisters as scale defects that grow. Blisters which have stopped
growing can be more difficult to identify from other scale defects, since one cannot assume that
blisters are always circular in shape. Blister growth was also investigated using a two-step
reheating cycle. First the strip is preheated to 900 °C with a holding time to give a nearly constant
surface temperature and to stabilize the equipment and vary the initial scale thickness. This pause
time ranged from 0 - 90 s. Then the strip temperature was raised to the final target temperature
between 920 - 1030 °C. These trials were used to investigate how the final target temperature and
a pause time influence the blister formation and the blister geometry. The results showed that a
temperature below 900 °C did not create any blisters. The first blisters appeared at a temperature
of about 920 °C and higher. The shape of the blister also varied depending on the final
temperature. At temperatures between 920 and 940 °C, only a few small blisters were formed.
Large blisters were formed at a temperature of 960 °C, while many small blisters were formed at
higher temperatures in the range of 980 - 1030 °C (Figure 83). Sometimes with long holding
times, the blisters could grow together.
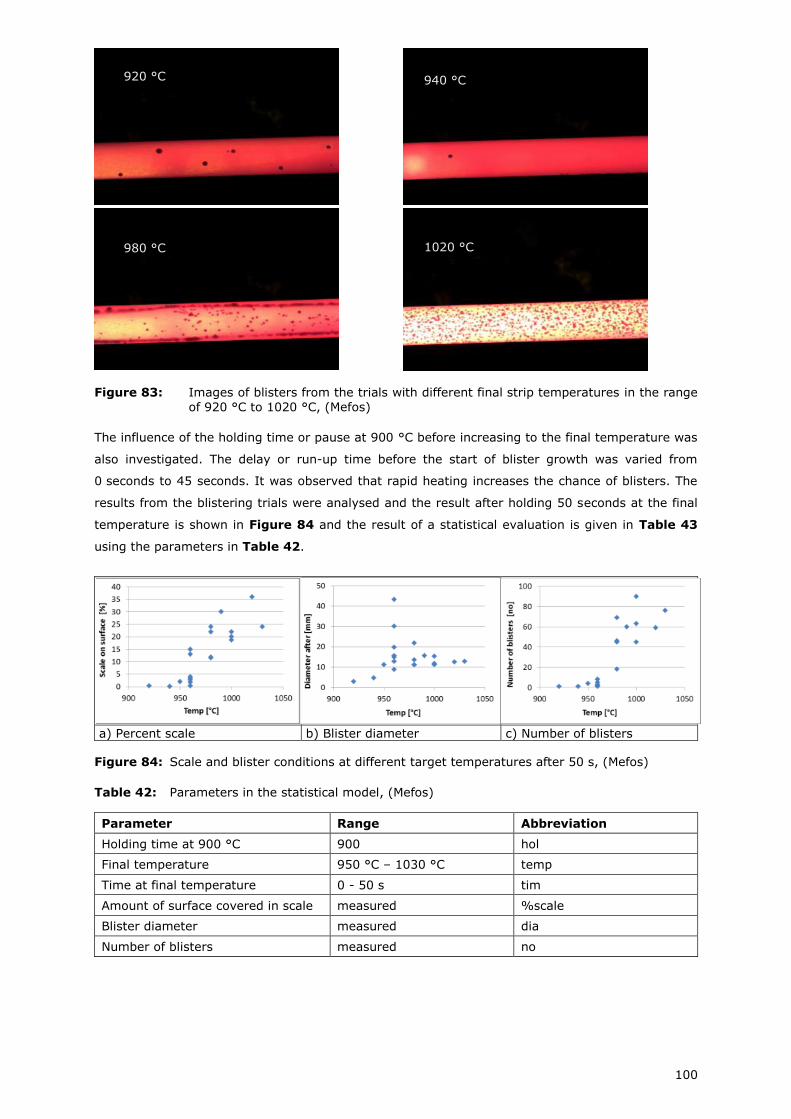
100
Figure 83: Images of blisters from the trials with different final strip temperatures in the range
of 920 °C to 1020 °C, (Mefos)
The influence of the holding time or pause at 900 °C before increasing to the final temperature was
also investigated. The delay or run-up time before the start of blister growth was varied from
0 seconds to 45 seconds. It was observed that rapid heating increases the chance of blisters. The
results from the blistering trials were analysed and the result after holding 50 seconds at the final
temperature is shown in Figure 84 and the result of a statistical evaluation is given in Table 43
using the parameters in Table 42.
a) Percent scale b) Blister diameter c) Number of blisters
Figure 84: Scale and blister conditions at different target temperatures after 50 s, (Mefos)
Table 42: Parameters in the statistical model, (Mefos)
Parameter Range Abbreviation
Holding time at 900 °C 900 hol
Final temperature 950 °C – 1030 °C temp
Time at final temperature 0 - 50 s tim
Amount of surface covered in scale measured %scale
Blister diameter measured dia
Number of blisters measured no
920 °C 940 °C
980 °C 1020 °C
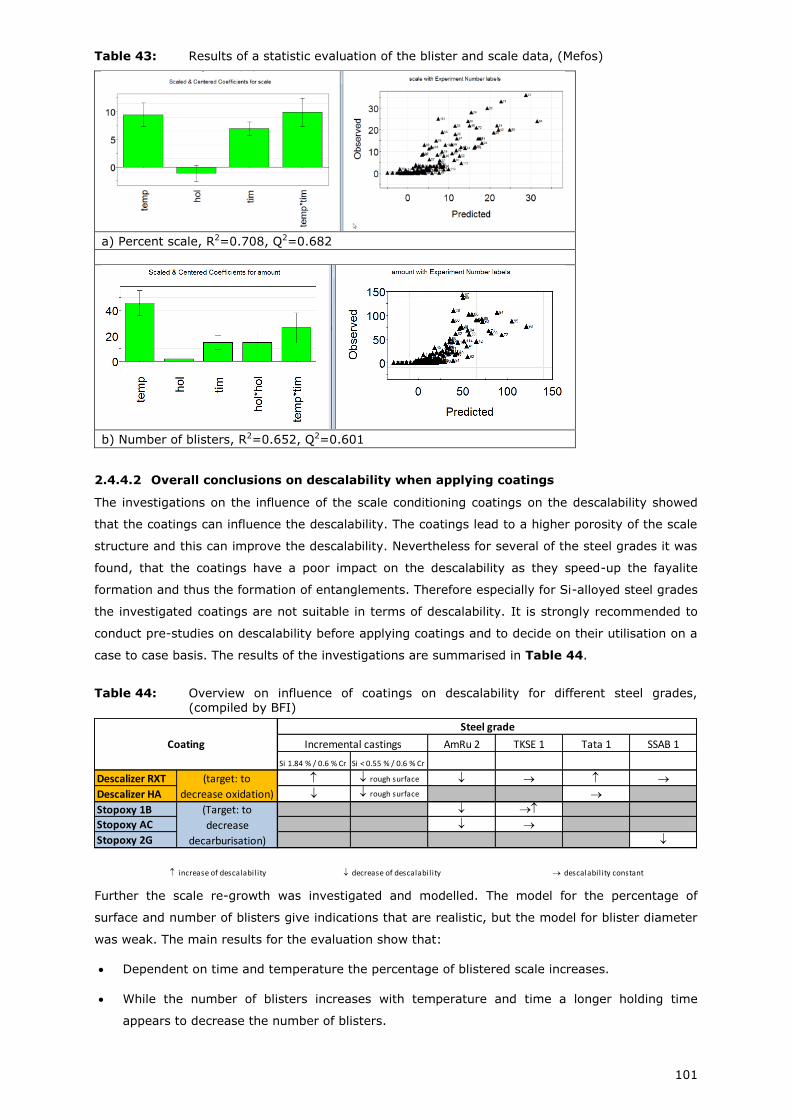
101
Table 43: Results of a statistic evaluation of the blister and scale data, (Mefos)
a) Percent scale, R2=0.708, Q2=0.682
b) Number of blisters, R2=0.652, Q2=0.601
2.4.4.2 Overall conclusions on descalability when applying coatings
The investigations on the influence of the scale conditioning coatings on the descalability showed
that the coatings can influence the descalability. The coatings lead to a higher porosity of the scale
structure and this can improve the descalability. Nevertheless for several of the steel grades it was
found, that the coatings have a poor impact on the descalability as they speed-up the fayalite
formation and thus the formation of entanglements. Therefore especially for Si-alloyed steel grades
the investigated coatings are not suitable in terms of descalability. It is strongly recommended to
conduct pre-studies on descalability before applying coatings and to decide on their utilisation on a
case to case basis. The results of the investigations are summarised in Table 44.
Table 44: Overview on influence of coatings on descalability for different steel grades, (compiled by BFI)
Further the scale re-growth was investigated and modelled. The model for the percentage of
surface and number of blisters give indications that are realistic, but the model for blister diameter
was weak. The main results for the evaluation show that:
Dependent on time and temperature the percentage of blistered scale increases.
While the number of blisters increases with temperature and time a longer holding time
appears to decrease the number of blisters.
AmRu 2 TKSE 1 Tata 1 SSAB 1
Si 1.84 % / 0.6 % Cr Si < 0.55 % / 0.6 % Cr
Descalizer RXT rough surface
Descalizer HA rough surface
Stopoxy 1B
Stopoxy AC
Stopoxy 2G
increase of descalability decrease of descalability descalability constant
(target: to
decrease oxidation)
(Target: to
decrease
decarburisation)
Coating
Steel grade
Incremental castings
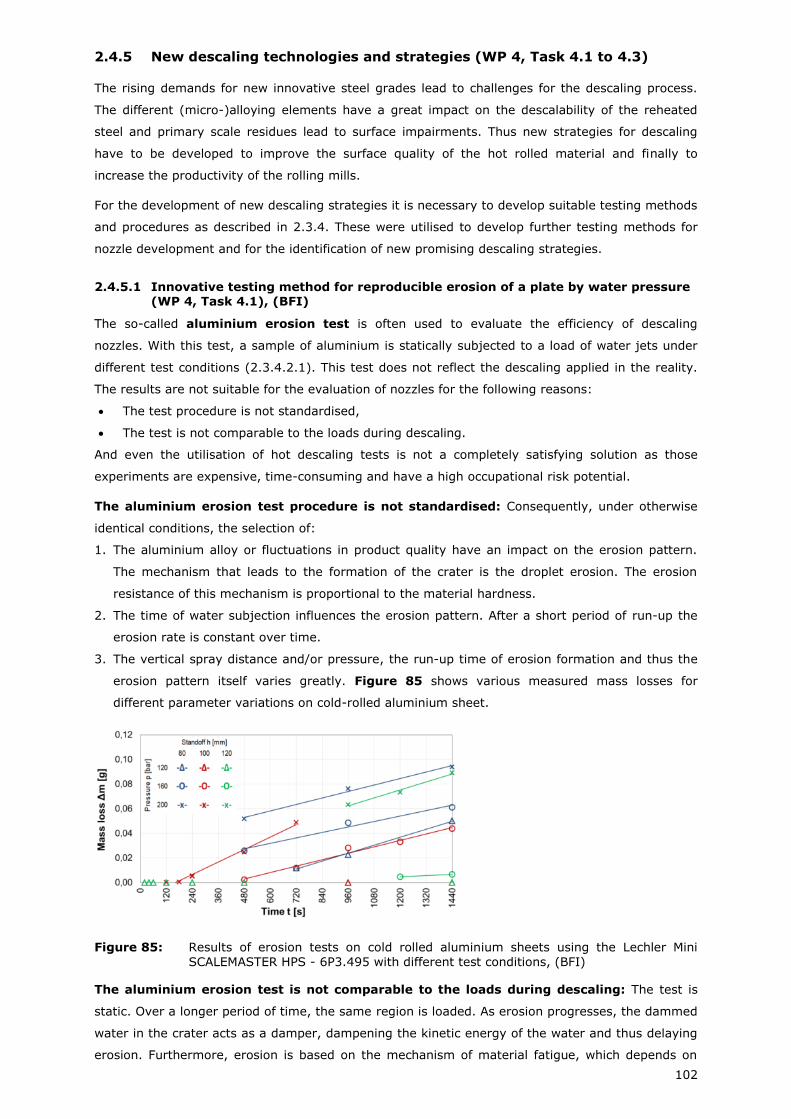
102
2.4.5 New descaling technologies and strategies (WP 4, Task 4.1 to 4.3)
The rising demands for new innovative steel grades lead to challenges for the descaling process.
The different (micro-)alloying elements have a great impact on the descalability of the reheated
steel and primary scale residues lead to surface impairments. Thus new strategies for descaling
have to be developed to improve the surface quality of the hot rolled material and finally to
increase the productivity of the rolling mills.
For the development of new descaling strategies it is necessary to develop suitable testing methods
and procedures as described in 2.3.4. These were utilised to develop further testing methods for
nozzle development and for the identification of new promising descaling strategies.
2.4.5.1 Innovative testing method for reproducible erosion of a plate by water pressure (WP 4, Task 4.1), (BFI)
The so-called aluminium erosion test is often used to evaluate the efficiency of descaling
nozzles. With this test, a sample of aluminium is statically subjected to a load of water jets under
different test conditions (2.3.4.2.1). This test does not reflect the descaling applied in the reality.
The results are not suitable for the evaluation of nozzles for the following reasons:
The test procedure is not standardised,
The test is not comparable to the loads during descaling.
And even the utilisation of hot descaling tests is not a completely satisfying solution as those
experiments are expensive, time-consuming and have a high occupational risk potential.
The aluminium erosion test procedure is not standardised: Consequently, under otherwise
identical conditions, the selection of:
1. The aluminium alloy or fluctuations in product quality have an impact on the erosion pattern.
The mechanism that leads to the formation of the crater is the droplet erosion. The erosion
resistance of this mechanism is proportional to the material hardness.
2. The time of water subjection influences the erosion pattern. After a short period of run-up the
erosion rate is constant over time.
3. The vertical spray distance and/or pressure, the run-up time of erosion formation and thus the
erosion pattern itself varies greatly. Figure 85 shows various measured mass losses for
different parameter variations on cold-rolled aluminium sheet.
Figure 85: Results of erosion tests on cold rolled aluminium sheets using the Lechler Mini
SCALEMASTER HPS - 6P3.495 with different test conditions, (BFI)
The aluminium erosion test is not comparable to the loads during descaling: The test is
static. Over a longer period of time, the same region is loaded. As erosion progresses, the dammed
water in the crater acts as a damper, dampening the kinetic energy of the water and thus delaying
erosion. Furthermore, erosion is based on the mechanism of material fatigue, which depends on
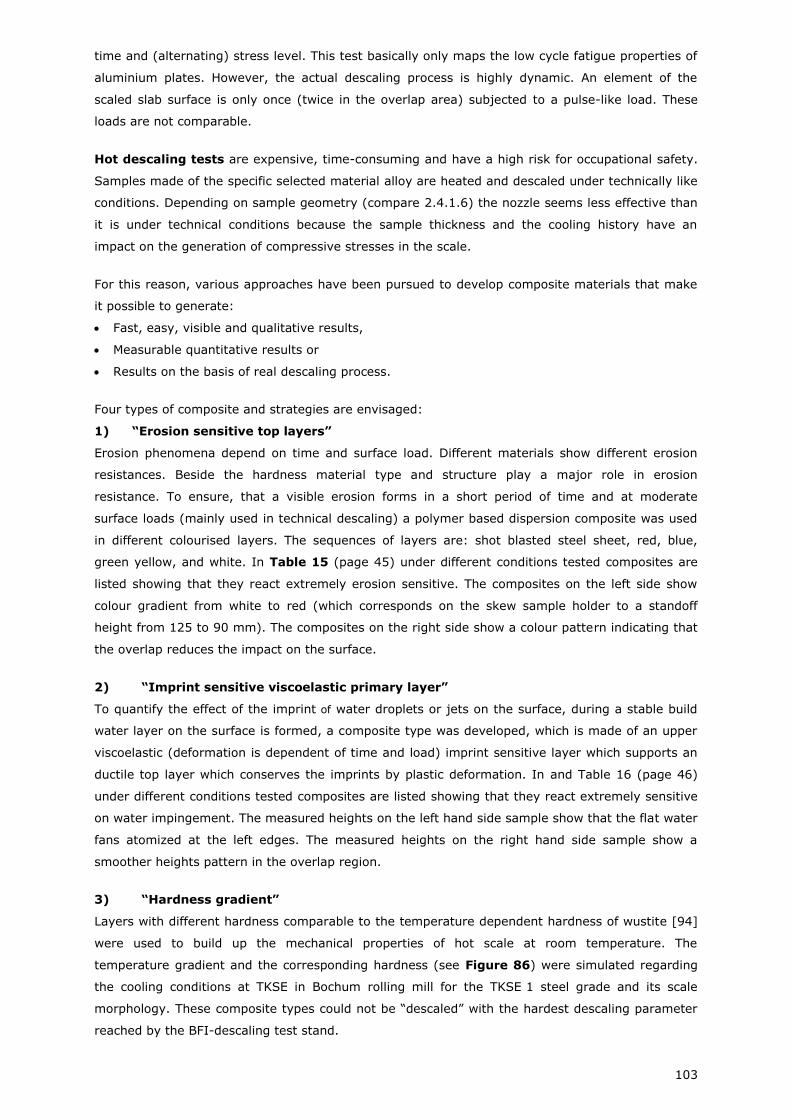
103
time and (alternating) stress level. This test basically only maps the low cycle fatigue properties of
aluminium plates. However, the actual descaling process is highly dynamic. An element of the
scaled slab surface is only once (twice in the overlap area) subjected to a pulse-like load. These
loads are not comparable.
Hot descaling tests are expensive, time-consuming and have a high risk for occupational safety.
Samples made of the specific selected material alloy are heated and descaled under technically like
conditions. Depending on sample geometry (compare 2.4.1.6) the nozzle seems less effective than
it is under technical conditions because the sample thickness and the cooling history have an
impact on the generation of compressive stresses in the scale.
For this reason, various approaches have been pursued to develop composite materials that make
it possible to generate:
Fast, easy, visible and qualitative results,
Measurable quantitative results or
Results on the basis of real descaling process.
Four types of composite and strategies are envisaged:
1) “Erosion sensitive top layers”
Erosion phenomena depend on time and surface load. Different materials show different erosion
resistances. Beside the hardness material type and structure play a major role in erosion
resistance. To ensure, that a visible erosion forms in a short period of time and at moderate
surface loads (mainly used in technical descaling) a polymer based dispersion composite was used
in different colourised layers. The sequences of layers are: shot blasted steel sheet, red, blue,
green yellow, and white. In Table 15 (page 45) under different conditions tested composites are
listed showing that they react extremely erosion sensitive. The composites on the left side show
colour gradient from white to red (which corresponds on the skew sample holder to a standoff
height from 125 to 90 mm). The composites on the right side show a colour pattern indicating that
the overlap reduces the impact on the surface.
2) “Imprint sensitive viscoelastic primary layer”
To quantify the effect of the imprint of water droplets or jets on the surface, during a stable build
water layer on the surface is formed, a composite type was developed, which is made of an upper
viscoelastic (deformation is dependent of time and load) imprint sensitive layer which supports an
ductile top layer which conserves the imprints by plastic deformation. In and Table 16 (page 46)
under different conditions tested composites are listed showing that they react extremely sensitive
on water impingement. The measured heights on the left hand side sample show that the flat water
fans atomized at the left edges. The measured heights on the right hand side sample show a
smoother heights pattern in the overlap region.
3) “Hardness gradient”
Layers with different hardness comparable to the temperature dependent hardness of wustite [94]
were used to build up the mechanical properties of hot scale at room temperature. The
temperature gradient and the corresponding hardness (see Figure 86) were simulated regarding
the cooling conditions at TKSE in Bochum rolling mill for the TKSE 1 steel grade and its scale
morphology. These composite types could not be “descaled” with the hardest descaling parameter
reached by the BFI-descaling test stand.
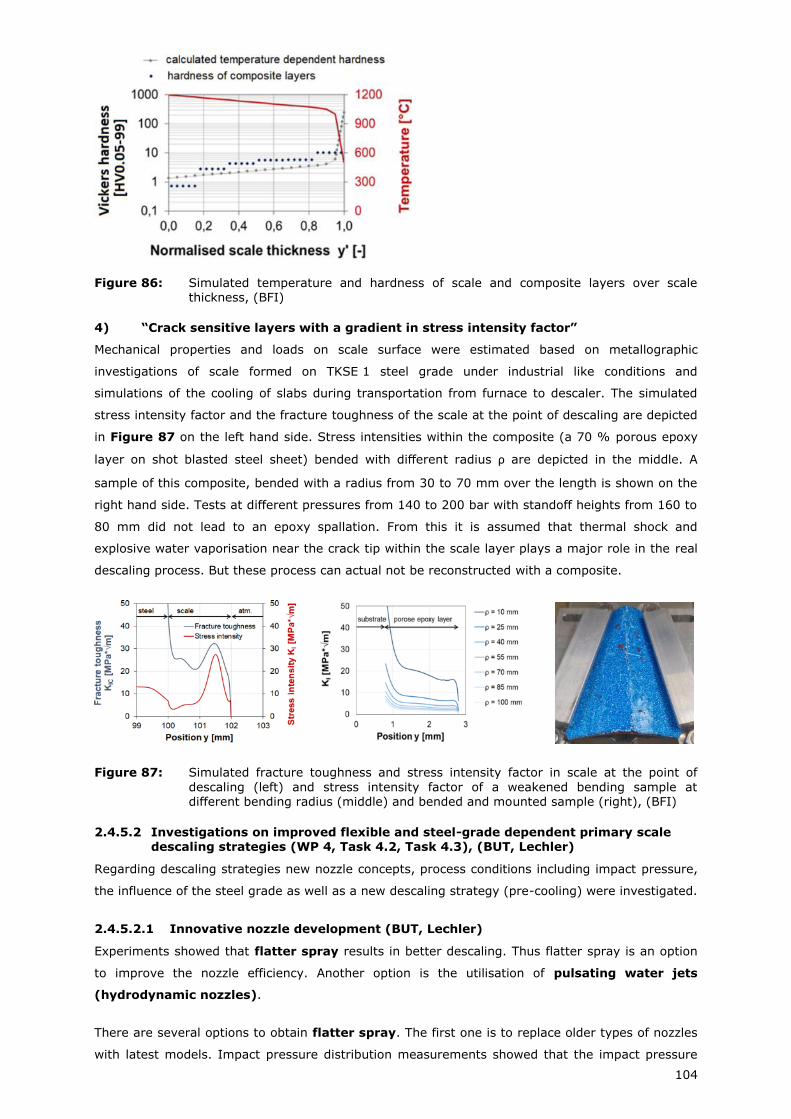
104
Figure 86: Simulated temperature and hardness of scale and composite layers over scale thickness, (BFI)
4) “Crack sensitive layers with a gradient in stress intensity factor”
Mechanical properties and loads on scale surface were estimated based on metallographic
investigations of scale formed on TKSE 1 steel grade under industrial like conditions and
simulations of the cooling of slabs during transportation from furnace to descaler. The simulated
stress intensity factor and the fracture toughness of the scale at the point of descaling are depicted
in Figure 87 on the left hand side. Stress intensities within the composite (a 70 % porous epoxy
layer on shot blasted steel sheet) bended with different radius ρ are depicted in the middle. A
sample of this composite, bended with a radius from 30 to 70 mm over the length is shown on the
right hand side. Tests at different pressures from 140 to 200 bar with standoff heights from 160 to
80 mm did not lead to an epoxy spallation. From this it is assumed that thermal shock and
explosive water vaporisation near the crack tip within the scale layer plays a major role in the real
descaling process. But these process can actual not be reconstructed with a composite.
Figure 87: Simulated fracture toughness and stress intensity factor in scale at the point of
descaling (left) and stress intensity factor of a weakened bending sample at different bending radius (middle) and bended and mounted sample (right), (BFI)
2.4.5.2 Investigations on improved flexible and steel-grade dependent primary scale descaling strategies (WP 4, Task 4.2, Task 4.3), (BUT, Lechler)
Regarding descaling strategies new nozzle concepts, process conditions including impact pressure,
the influence of the steel grade as well as a new descaling strategy (pre-cooling) were investigated.
2.4.5.2.1 Innovative nozzle development (BUT, Lechler)
Experiments showed that flatter spray results in better descaling. Thus flatter spray is an option
to improve the nozzle efficiency. Another option is the utilisation of pulsating water jets
(hydrodynamic nozzles).
There are several options to obtain flatter spray. The first one is to replace older types of nozzles
with latest models. Impact pressure distribution measurements showed that the impact pressure
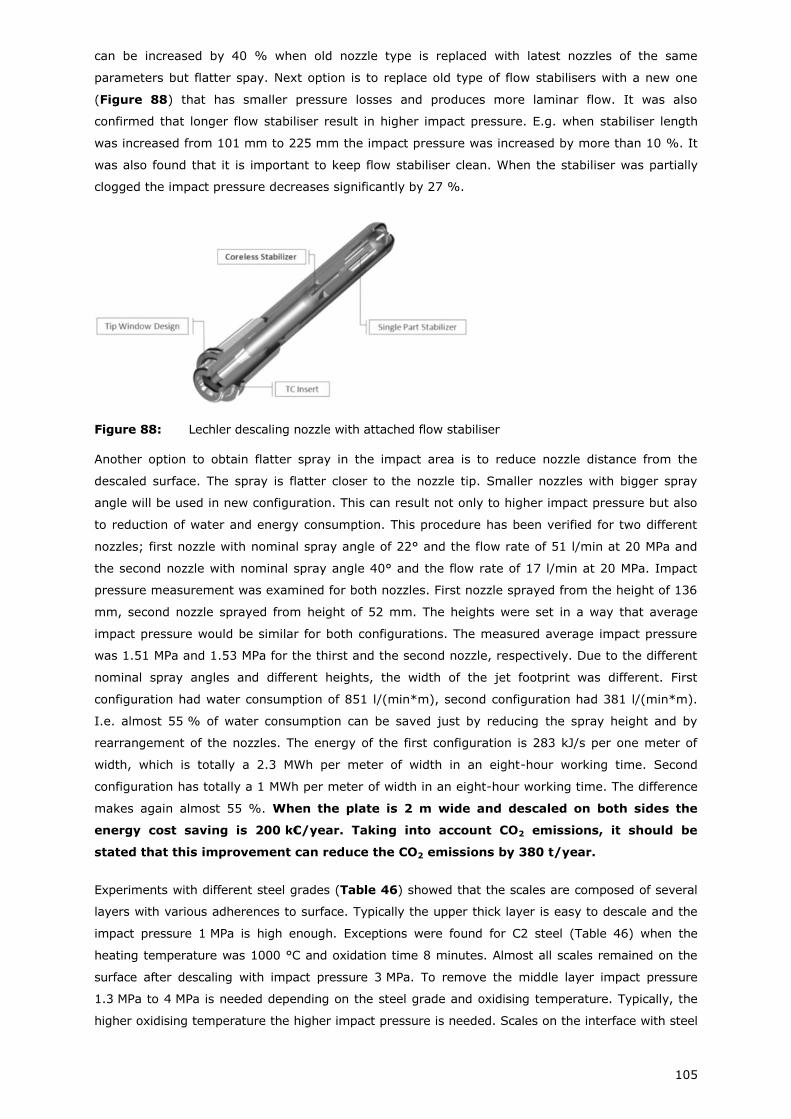
105
can be increased by 40 % when old nozzle type is replaced with latest nozzles of the same
parameters but flatter spay. Next option is to replace old type of flow stabilisers with a new one
(Figure 88) that has smaller pressure losses and produces more laminar flow. It was also
confirmed that longer flow stabiliser result in higher impact pressure. E.g. when stabiliser length
was increased from 101 mm to 225 mm the impact pressure was increased by more than 10 %. It
was also found that it is important to keep flow stabiliser clean. When the stabiliser was partially
clogged the impact pressure decreases significantly by 27 %.
Figure 88: Lechler descaling nozzle with attached flow stabiliser
Another option to obtain flatter spray in the impact area is to reduce nozzle distance from the
descaled surface. The spray is flatter closer to the nozzle tip. Smaller nozzles with bigger spray
angle will be used in new configuration. This can result not only to higher impact pressure but also
to reduction of water and energy consumption. This procedure has been verified for two different
nozzles; first nozzle with nominal spray angle of 22° and the flow rate of 51 l/min at 20 MPa and
the second nozzle with nominal spray angle 40° and the flow rate of 17 l/min at 20 MPa. Impact
pressure measurement was examined for both nozzles. First nozzle sprayed from the height of 136
mm, second nozzle sprayed from height of 52 mm. The heights were set in a way that average
impact pressure would be similar for both configurations. The measured average impact pressure
was 1.51 MPa and 1.53 MPa for the thirst and the second nozzle, respectively. Due to the different
nominal spray angles and different heights, the width of the jet footprint was different. First
configuration had water consumption of 851 l/(min*m), second configuration had 381 l/(min*m).
I.e. almost 55 % of water consumption can be saved just by reducing the spray height and by
rearrangement of the nozzles. The energy of the first configuration is 283 kJ/s per one meter of
width, which is totally a 2.3 MWh per meter of width in an eight-hour working time. Second
configuration has totally a 1 MWh per meter of width in an eight-hour working time. The difference
makes again almost 55 %. When the plate is 2 m wide and descaled on both sides the
energy cost saving is 200 k€/year. Taking into account CO2 emissions, it should be
stated that this improvement can reduce the CO2 emissions by 380 t/year.
Experiments with different steel grades (Table 46) showed that the scales are composed of several
layers with various adherences to surface. Typically the upper thick layer is easy to descale and the
impact pressure 1 MPa is high enough. Exceptions were found for C2 steel (Table 46) when the
heating temperature was 1000 °C and oxidation time 8 minutes. Almost all scales remained on the
surface after descaling with impact pressure 3 MPa. To remove the middle layer impact pressure
1.3 MPa to 4 MPa is needed depending on the steel grade and oxidising temperature. Typically, the
higher oxidising temperature the higher impact pressure is needed. Scales on the interface with steel
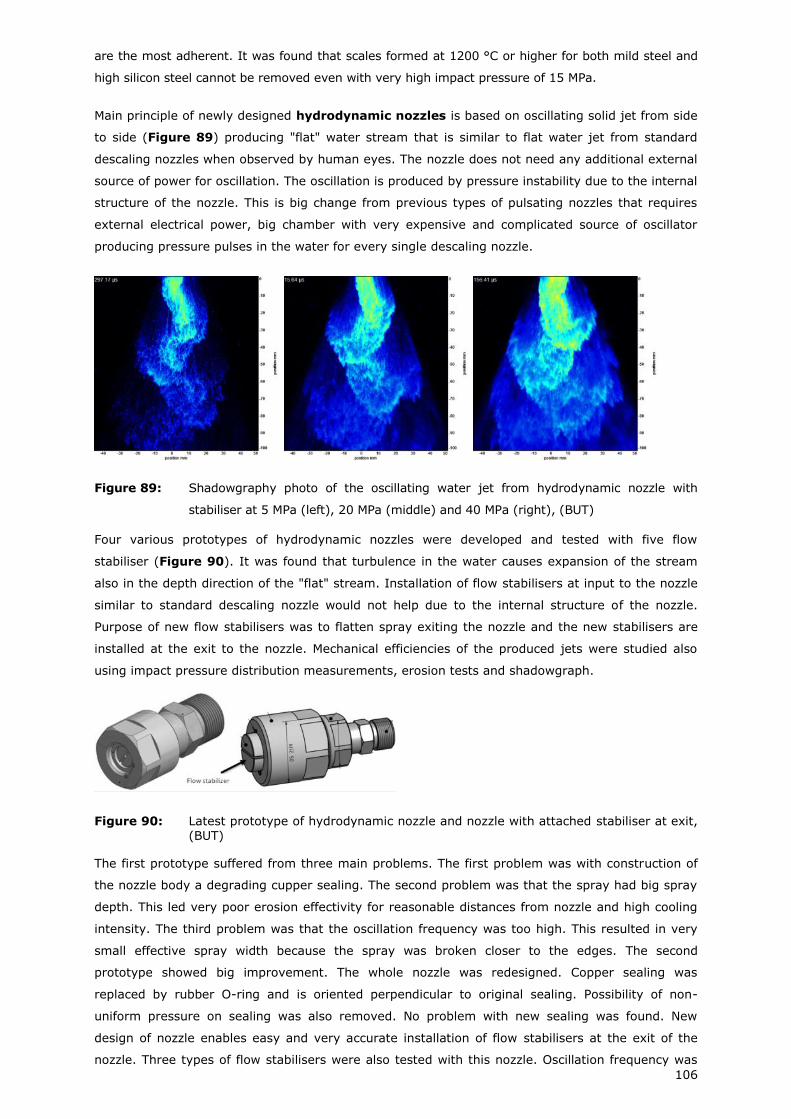
106
are the most adherent. It was found that scales formed at 1200 °C or higher for both mild steel and
high silicon steel cannot be removed even with very high impact pressure of 15 MPa.
Main principle of newly designed hydrodynamic nozzles is based on oscillating solid jet from side
to side (Figure 89) producing "flat" water stream that is similar to flat water jet from standard
descaling nozzles when observed by human eyes. The nozzle does not need any additional external
source of power for oscillation. The oscillation is produced by pressure instability due to the internal
structure of the nozzle. This is big change from previous types of pulsating nozzles that requires
external electrical power, big chamber with very expensive and complicated source of oscillator
producing pressure pulses in the water for every single descaling nozzle.
Figure 89: Shadowgraphy photo of the oscillating water jet from hydrodynamic nozzle with
stabiliser at 5 MPa (left), 20 MPa (middle) and 40 MPa (right), (BUT)
Four various prototypes of hydrodynamic nozzles were developed and tested with five flow
stabiliser (Figure 90). It was found that turbulence in the water causes expansion of the stream
also in the depth direction of the "flat" stream. Installation of flow stabilisers at input to the nozzle
similar to standard descaling nozzle would not help due to the internal structure of the nozzle.
Purpose of new flow stabilisers was to flatten spray exiting the nozzle and the new stabilisers are
installed at the exit to the nozzle. Mechanical efficiencies of the produced jets were studied also
using impact pressure distribution measurements, erosion tests and shadowgraph.
Figure 90: Latest prototype of hydrodynamic nozzle and nozzle with attached stabiliser at exit,
(BUT)
The first prototype suffered from three main problems. The first problem was with construction of
the nozzle body a degrading cupper sealing. The second problem was that the spray had big spray
depth. This led very poor erosion effectivity for reasonable distances from nozzle and high cooling
intensity. The third problem was that the oscillation frequency was too high. This resulted in very
small effective spray width because the spray was broken closer to the edges. The second
prototype showed big improvement. The whole nozzle was redesigned. Copper sealing was
replaced by rubber O-ring and is oriented perpendicular to original sealing. Possibility of non-
uniform pressure on sealing was also removed. No problem with new sealing was found. New
design of nozzle enables easy and very accurate installation of flow stabilisers at the exit of the
nozzle. Three types of flow stabilisers were also tested with this nozzle. Oscillation frequency was
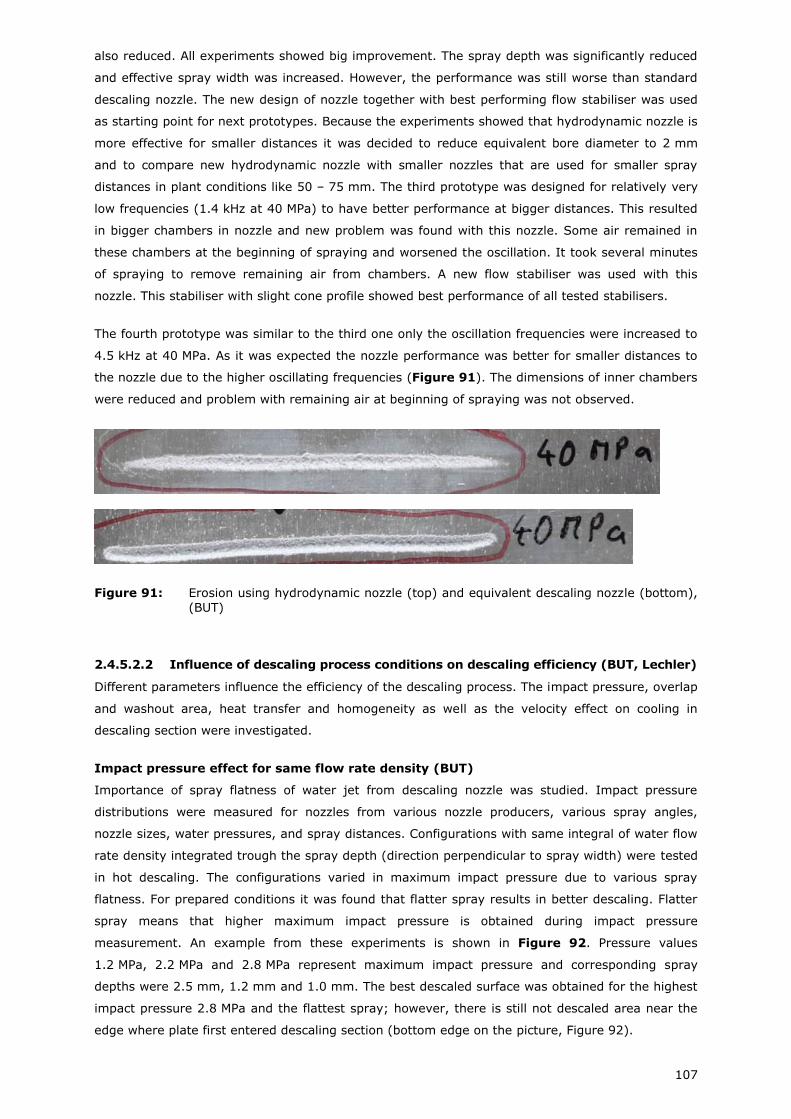
107
also reduced. All experiments showed big improvement. The spray depth was significantly reduced
and effective spray width was increased. However, the performance was still worse than standard
descaling nozzle. The new design of nozzle together with best performing flow stabiliser was used
as starting point for next prototypes. Because the experiments showed that hydrodynamic nozzle is
more effective for smaller distances it was decided to reduce equivalent bore diameter to 2 mm
and to compare new hydrodynamic nozzle with smaller nozzles that are used for smaller spray
distances in plant conditions like 50 – 75 mm. The third prototype was designed for relatively very
low frequencies (1.4 kHz at 40 MPa) to have better performance at bigger distances. This resulted
in bigger chambers in nozzle and new problem was found with this nozzle. Some air remained in
these chambers at the beginning of spraying and worsened the oscillation. It took several minutes
of spraying to remove remaining air from chambers. A new flow stabiliser was used with this
nozzle. This stabiliser with slight cone profile showed best performance of all tested stabilisers.
The fourth prototype was similar to the third one only the oscillation frequencies were increased to
4.5 kHz at 40 MPa. As it was expected the nozzle performance was better for smaller distances to
the nozzle due to the higher oscillating frequencies (Figure 91). The dimensions of inner chambers
were reduced and problem with remaining air at beginning of spraying was not observed.
Figure 91: Erosion using hydrodynamic nozzle (top) and equivalent descaling nozzle (bottom),
(BUT)
2.4.5.2.2 Influence of descaling process conditions on descaling efficiency (BUT, Lechler)
Different parameters influence the efficiency of the descaling process. The impact pressure, overlap
and washout area, heat transfer and homogeneity as well as the velocity effect on cooling in
descaling section were investigated.
Impact pressure effect for same flow rate density (BUT)
Importance of spray flatness of water jet from descaling nozzle was studied. Impact pressure
distributions were measured for nozzles from various nozzle producers, various spray angles,
nozzle sizes, water pressures, and spray distances. Configurations with same integral of water flow
rate density integrated trough the spray depth (direction perpendicular to spray width) were tested
in hot descaling. The configurations varied in maximum impact pressure due to various spray
flatness. For prepared conditions it was found that flatter spray results in better descaling. Flatter
spray means that higher maximum impact pressure is obtained during impact pressure
measurement. An example from these experiments is shown in Figure 92. Pressure values
1.2 MPa, 2.2 MPa and 2.8 MPa represent maximum impact pressure and corresponding spray
depths were 2.5 mm, 1.2 mm and 1.0 mm. The best descaled surface was obtained for the highest
impact pressure 2.8 MPa and the flattest spray; however, there is still not descaled area near the
edge where plate first entered descaling section (bottom edge on the picture, Figure 92).
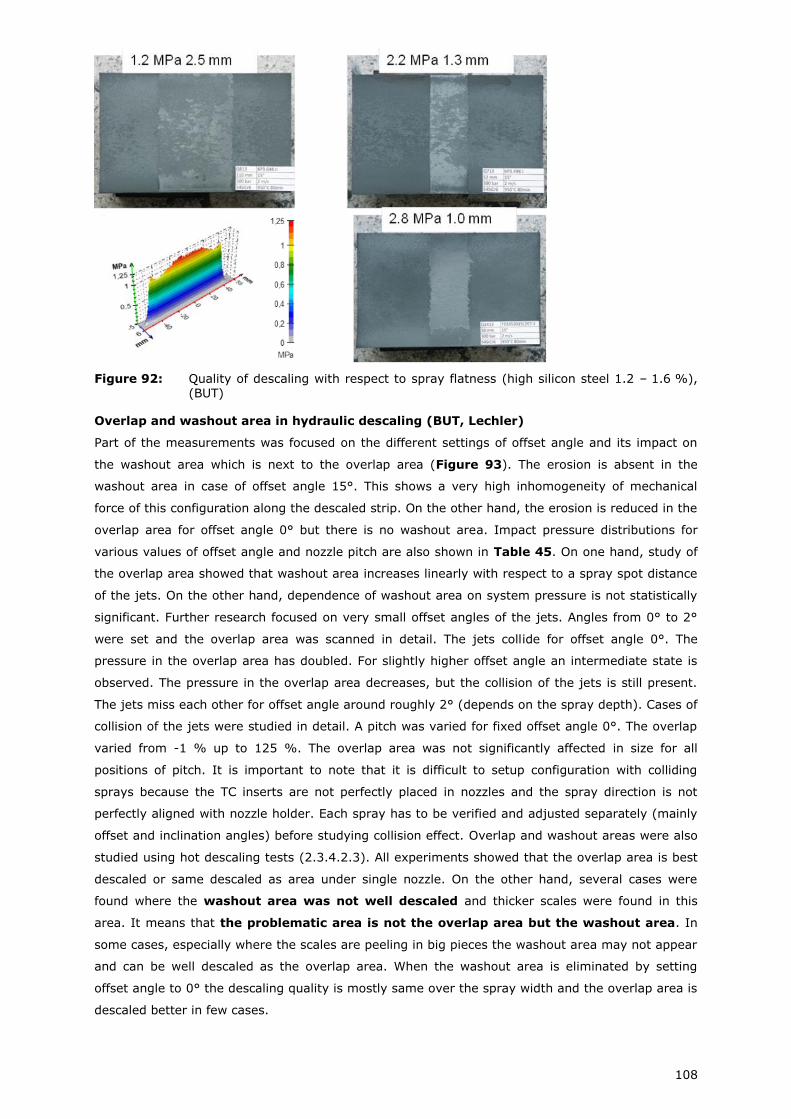
108
Figure 92: Quality of descaling with respect to spray flatness (high silicon steel 1.2 – 1.6 %), (BUT)
Overlap and washout area in hydraulic descaling (BUT, Lechler)
Part of the measurements was focused on the different settings of offset angle and its impact on
the washout area which is next to the overlap area (Figure 93). The erosion is absent in the
washout area in case of offset angle 15°. This shows a very high inhomogeneity of mechanical
force of this configuration along the descaled strip. On the other hand, the erosion is reduced in the
overlap area for offset angle 0° but there is no washout area. Impact pressure distributions for
various values of offset angle and nozzle pitch are also shown in Table 45. On one hand, study of
the overlap area showed that washout area increases linearly with respect to a spray spot distance
of the jets. On the other hand, dependence of washout area on system pressure is not statistically
significant. Further research focused on very small offset angles of the jets. Angles from 0° to 2°
were set and the overlap area was scanned in detail. The jets collide for offset angle 0°. The
pressure in the overlap area has doubled. For slightly higher offset angle an intermediate state is
observed. The pressure in the overlap area decreases, but the collision of the jets is still present.
The jets miss each other for offset angle around roughly 2° (depends on the spray depth). Cases of
collision of the jets were studied in detail. A pitch was varied for fixed offset angle 0°. The overlap
varied from -1 % up to 125 %. The overlap area was not significantly affected in size for all
positions of pitch. It is important to note that it is difficult to setup configuration with colliding
sprays because the TC inserts are not perfectly placed in nozzles and the spray direction is not
perfectly aligned with nozzle holder. Each spray has to be verified and adjusted separately (mainly
offset and inclination angles) before studying collision effect. Overlap and washout areas were also
studied using hot descaling tests (2.3.4.2.3). All experiments showed that the overlap area is best
descaled or same descaled as area under single nozzle. On the other hand, several cases were
found where the washout area was not well descaled and thicker scales were found in this
area. It means that the problematic area is not the overlap area but the washout area. In
some cases, especially where the scales are peeling in big pieces the washout area may not appear
and can be well descaled as the overlap area. When the washout area is eliminated by setting
offset angle to 0° the descaling quality is mostly same over the spray width and the overlap area is
descaled better in few cases.
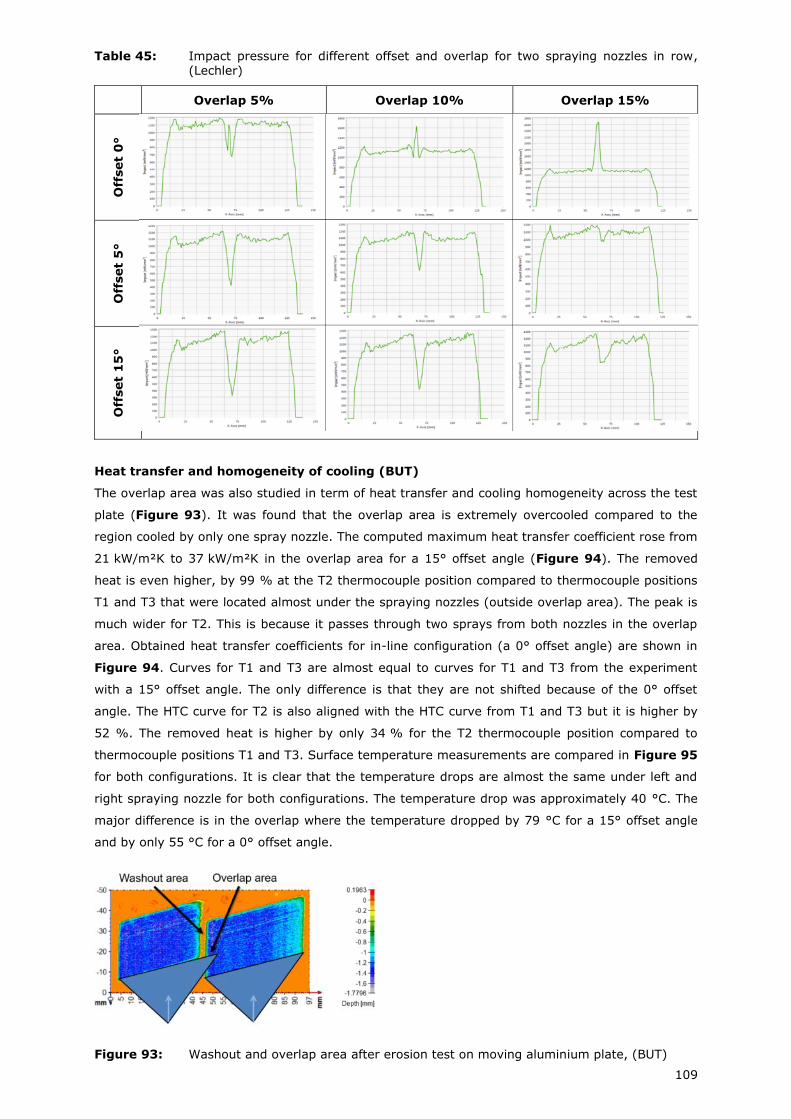
109
Table 45: Impact pressure for different offset and overlap for two spraying nozzles in row, (Lechler)
Overlap 5% Overlap 10% Overlap 15%
Off
set
0°
Off
set
5°
Off
set
15
°
Heat transfer and homogeneity of cooling (BUT)
The overlap area was also studied in term of heat transfer and cooling homogeneity across the test
plate (Figure 93). It was found that the overlap area is extremely overcooled compared to the
region cooled by only one spray nozzle. The computed maximum heat transfer coefficient rose from
21 kW/m²K to 37 kW/m²K in the overlap area for a 15° offset angle (Figure 94). The removed
heat is even higher, by 99 % at the T2 thermocouple position compared to thermocouple positions
T1 and T3 that were located almost under the spraying nozzles (outside overlap area). The peak is
much wider for T2. This is because it passes through two sprays from both nozzles in the overlap
area. Obtained heat transfer coefficients for in-line configuration (a 0° offset angle) are shown in
Figure 94. Curves for T1 and T3 are almost equal to curves for T1 and T3 from the experiment
with a 15° offset angle. The only difference is that they are not shifted because of the 0° offset
angle. The HTC curve for T2 is also aligned with the HTC curve from T1 and T3 but it is higher by
52 %. The removed heat is higher by only 34 % for the T2 thermocouple position compared to
thermocouple positions T1 and T3. Surface temperature measurements are compared in Figure 95
for both configurations. It is clear that the temperature drops are almost the same under left and
right spraying nozzle for both configurations. The temperature drop was approximately 40 °C. The
major difference is in the overlap where the temperature dropped by 79 °C for a 15° offset angle
and by only 55 °C for a 0° offset angle.
Figure 93: Washout and overlap area after erosion test on moving aluminium plate, (BUT)
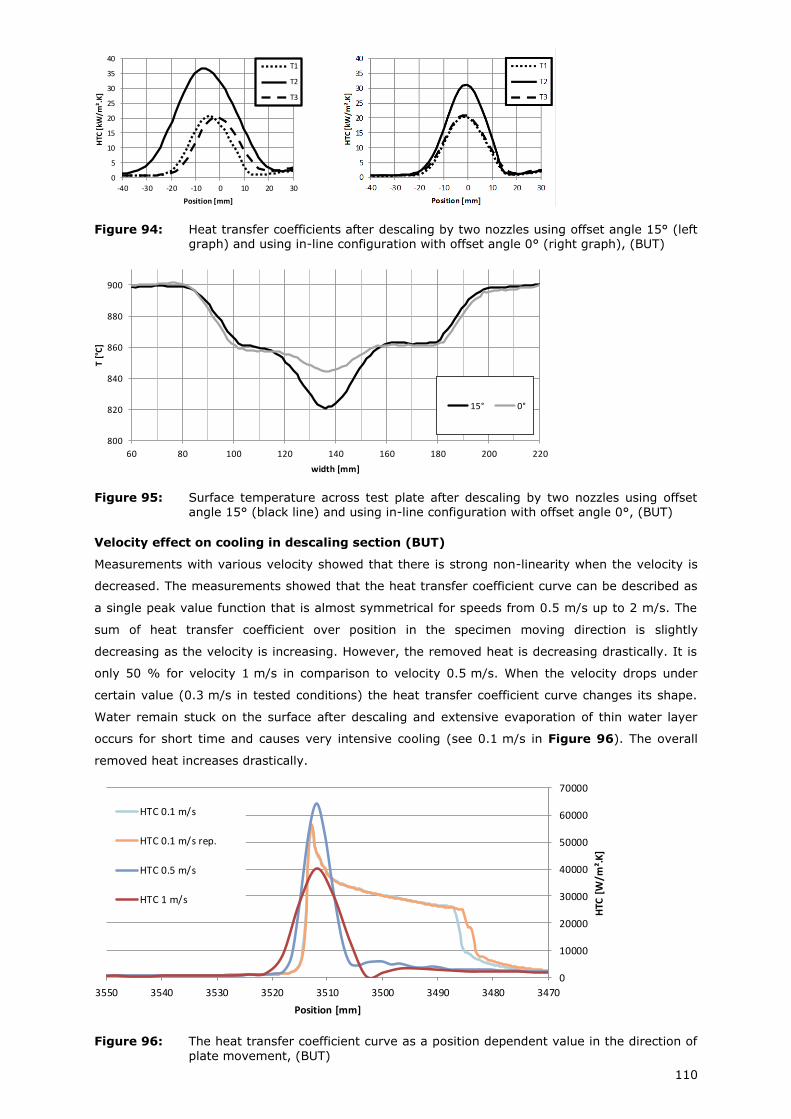
110
Figure 94: Heat transfer coefficients after descaling by two nozzles using offset angle 15° (left graph) and using in-line configuration with offset angle 0° (right graph), (BUT)
Figure 95: Surface temperature across test plate after descaling by two nozzles using offset angle 15° (black line) and using in-line configuration with offset angle 0°, (BUT)
Velocity effect on cooling in descaling section (BUT)
Measurements with various velocity showed that there is strong non-linearity when the velocity is
decreased. The measurements showed that the heat transfer coefficient curve can be described as
a single peak value function that is almost symmetrical for speeds from 0.5 m/s up to 2 m/s. The
sum of heat transfer coefficient over position in the specimen moving direction is slightly
decreasing as the velocity is increasing. However, the removed heat is decreasing drastically. It is
only 50 % for velocity 1 m/s in comparison to velocity 0.5 m/s. When the velocity drops under
certain value (0.3 m/s in tested conditions) the heat transfer coefficient curve changes its shape.
Water remain stuck on the surface after descaling and extensive evaporation of thin water layer
occurs for short time and causes very intensive cooling (see 0.1 m/s in Figure 96). The overall
removed heat increases drastically.
Figure 96: The heat transfer coefficient curve as a position dependent value in the direction of
plate movement, (BUT)
0
5
10
15
20
25
30
35
40
-40 -30 -20 -10 0 10 20 30
HTC
[kW
/m².
K]
Position [mm]
T1
T2
T3
800
820
840
860
880
900
60 80 100 120 140 160 180 200 220
T [°
C]
width [mm]
15° 0°
0
10000
20000
30000
40000
50000
60000
70000
347034803490350035103520353035403550
HTC
[W
/m².
K]
Position [mm]
HTC 0.1 m/s
HTC 0.1 m/s rep.
HTC 0.5 m/s
HTC 1 m/s
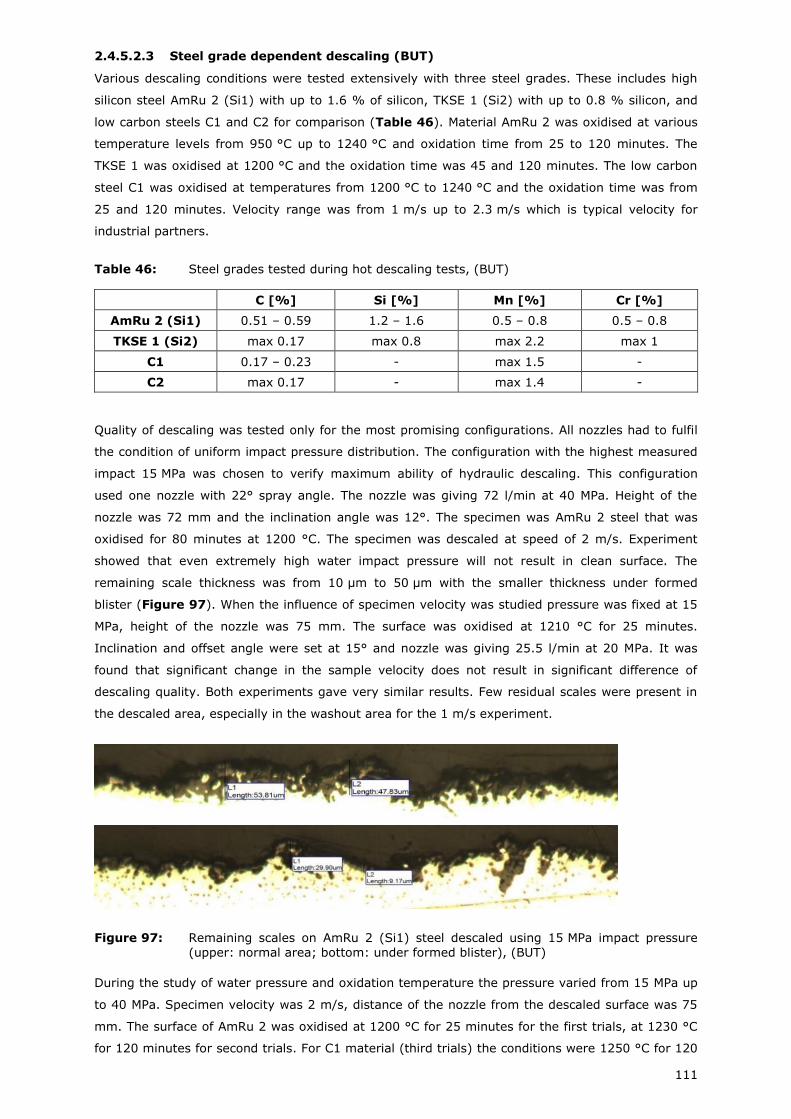
111
2.4.5.2.3 Steel grade dependent descaling (BUT)
Various descaling conditions were tested extensively with three steel grades. These includes high
silicon steel AmRu 2 (Si1) with up to 1.6 % of silicon, TKSE 1 (Si2) with up to 0.8 % silicon, and
low carbon steels C1 and C2 for comparison (Table 46). Material AmRu 2 was oxidised at various
temperature levels from 950 °C up to 1240 °C and oxidation time from 25 to 120 minutes. The
TKSE 1 was oxidised at 1200 °C and the oxidation time was 45 and 120 minutes. The low carbon
steel C1 was oxidised at temperatures from 1200 °C to 1240 °C and the oxidation time was from
25 and 120 minutes. Velocity range was from 1 m/s up to 2.3 m/s which is typical velocity for
industrial partners.
Table 46: Steel grades tested during hot descaling tests, (BUT)
C [%] Si [%] Mn [%] Cr [%]
AmRu 2 (Si1) 0.51 – 0.59 1.2 – 1.6 0.5 – 0.8 0.5 – 0.8
TKSE 1 (Si2) max 0.17 max 0.8 max 2.2 max 1
C1 0.17 – 0.23 - max 1.5 -
C2 max 0.17 - max 1.4 -
Quality of descaling was tested only for the most promising configurations. All nozzles had to fulfil
the condition of uniform impact pressure distribution. The configuration with the highest measured
impact 15 MPa was chosen to verify maximum ability of hydraulic descaling. This configuration
used one nozzle with 22° spray angle. The nozzle was giving 72 l/min at 40 MPa. Height of the
nozzle was 72 mm and the inclination angle was 12°. The specimen was AmRu 2 steel that was
oxidised for 80 minutes at 1200 °C. The specimen was descaled at speed of 2 m/s. Experiment
showed that even extremely high water impact pressure will not result in clean surface. The
remaining scale thickness was from 10 μm to 50 μm with the smaller thickness under formed
blister (Figure 97). When the influence of specimen velocity was studied pressure was fixed at 15
MPa, height of the nozzle was 75 mm. The surface was oxidised at 1210 °C for 25 minutes.
Inclination and offset angle were set at 15° and nozzle was giving 25.5 l/min at 20 MPa. It was
found that significant change in the sample velocity does not result in significant difference of
descaling quality. Both experiments gave very similar results. Few residual scales were present in
the descaled area, especially in the washout area for the 1 m/s experiment.
Figure 97: Remaining scales on AmRu 2 (Si1) steel descaled using 15 MPa impact pressure
(upper: normal area; bottom: under formed blister), (BUT)
During the study of water pressure and oxidation temperature the pressure varied from 15 MPa up
to 40 MPa. Specimen velocity was 2 m/s, distance of the nozzle from the descaled surface was 75
mm. The surface of AmRu 2 was oxidised at 1200 °C for 25 minutes for the first trials, at 1230 °C
for 120 minutes for second trials. For C1 material (third trials) the conditions were 1250 °C for 120
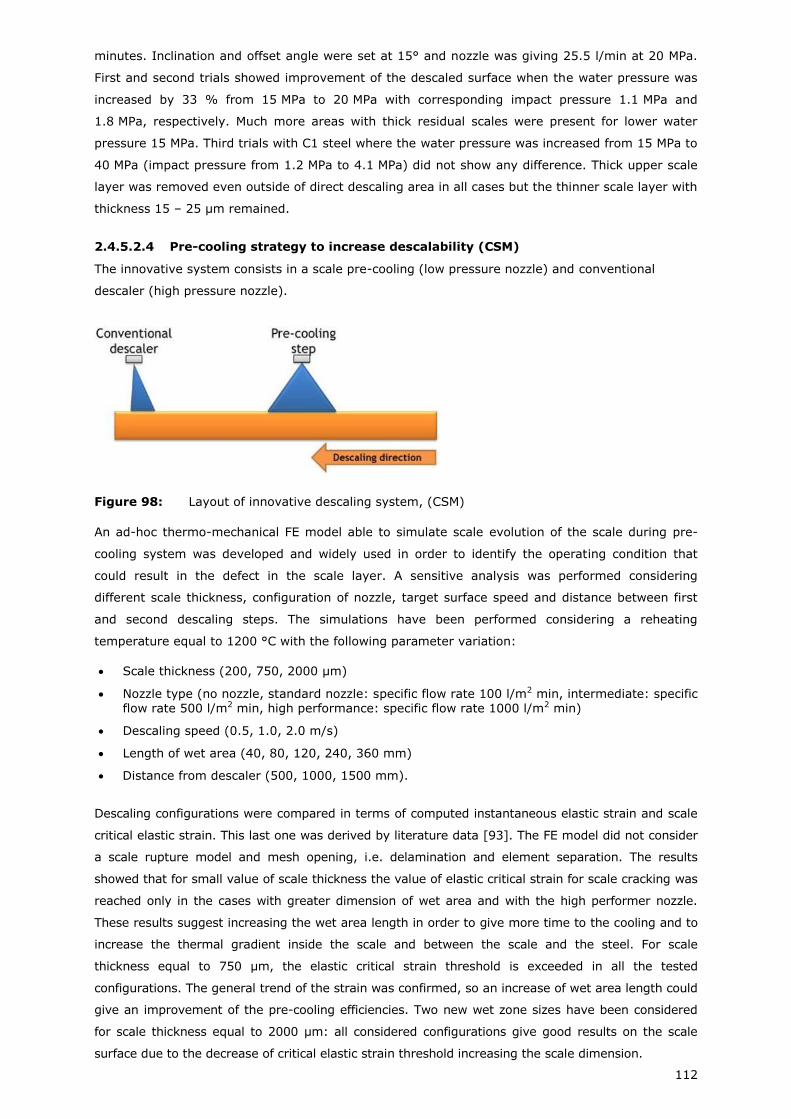
112
minutes. Inclination and offset angle were set at 15° and nozzle was giving 25.5 l/min at 20 MPa.
First and second trials showed improvement of the descaled surface when the water pressure was
increased by 33 % from 15 MPa to 20 MPa with corresponding impact pressure 1.1 MPa and
1.8 MPa, respectively. Much more areas with thick residual scales were present for lower water
pressure 15 MPa. Third trials with C1 steel where the water pressure was increased from 15 MPa to
40 MPa (impact pressure from 1.2 MPa to 4.1 MPa) did not show any difference. Thick upper scale
layer was removed even outside of direct descaling area in all cases but the thinner scale layer with
thickness 15 – 25 μm remained.
2.4.5.2.4 Pre-cooling strategy to increase descalability (CSM)
The innovative system consists in a scale pre-cooling (low pressure nozzle) and conventional
descaler (high pressure nozzle).
Figure 98: Layout of innovative descaling system, (CSM)
An ad-hoc thermo-mechanical FE model able to simulate scale evolution of the scale during pre-
cooling system was developed and widely used in order to identify the operating condition that
could result in the defect in the scale layer. A sensitive analysis was performed considering
different scale thickness, configuration of nozzle, target surface speed and distance between first
and second descaling steps. The simulations have been performed considering a reheating
temperature equal to 1200 °C with the following parameter variation:
Scale thickness (200, 750, 2000 µm)
Nozzle type (no nozzle, standard nozzle: specific flow rate 100 l/m2 min, intermediate: specific flow rate 500 l/m2 min, high performance: specific flow rate 1000 l/m2 min)
Descaling speed (0.5, 1.0, 2.0 m/s)
Length of wet area (40, 80, 120, 240, 360 mm)
Distance from descaler (500, 1000, 1500 mm).
Descaling configurations were compared in terms of computed instantaneous elastic strain and scale
critical elastic strain. This last one was derived by literature data [93]. The FE model did not consider
a scale rupture model and mesh opening, i.e. delamination and element separation. The results
showed that for small value of scale thickness the value of elastic critical strain for scale cracking was
reached only in the cases with greater dimension of wet area and with the high performer nozzle.
These results suggest increasing the wet area length in order to give more time to the cooling and to
increase the thermal gradient inside the scale and between the scale and the steel. For scale
thickness equal to 750 µm, the elastic critical strain threshold is exceeded in all the tested
configurations. The general trend of the strain was confirmed, so an increase of wet area length could
give an improvement of the pre-cooling efficiencies. Two new wet zone sizes have been considered
for scale thickness equal to 2000 µm: all considered configurations give good results on the scale
surface due to the decrease of critical elastic strain threshold increasing the scale dimension.
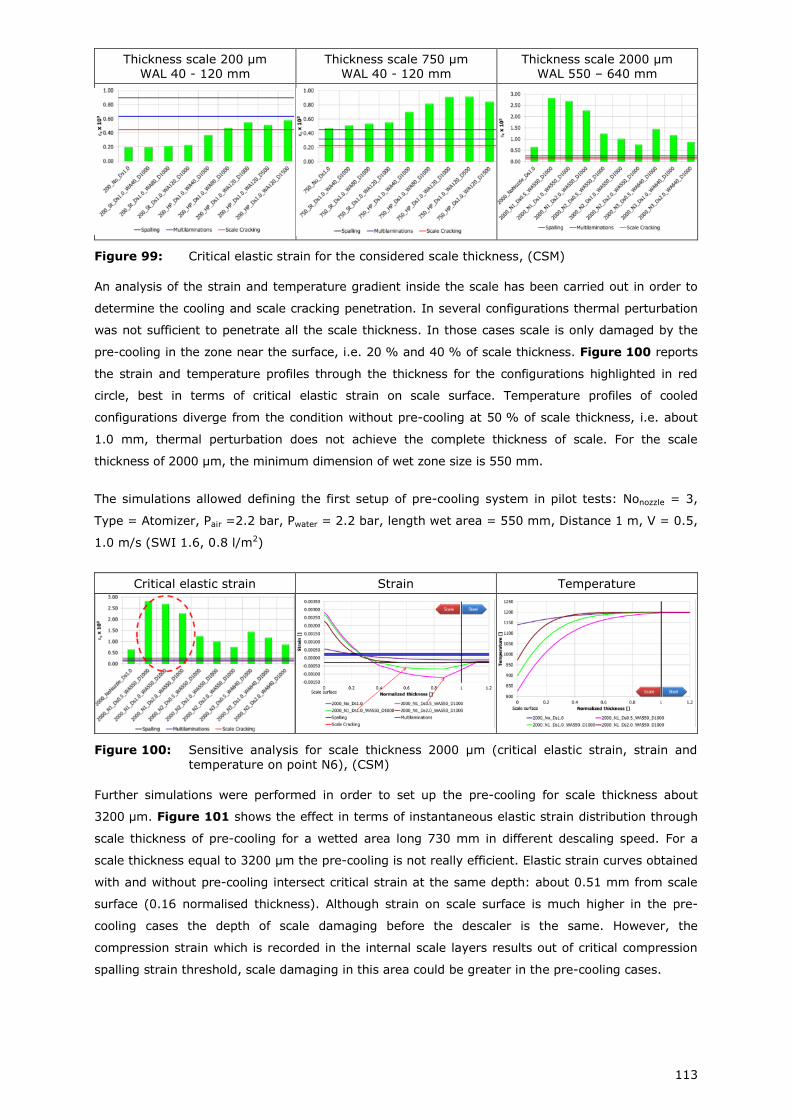
113
Thickness scale 200 µm WAL 40 - 120 mm
Thickness scale 750 µm WAL 40 - 120 mm
Thickness scale 2000 µm WAL 550 – 640 mm
Figure 99: Critical elastic strain for the considered scale thickness, (CSM)
An analysis of the strain and temperature gradient inside the scale has been carried out in order to
determine the cooling and scale cracking penetration. In several configurations thermal perturbation
was not sufficient to penetrate all the scale thickness. In those cases scale is only damaged by the
pre-cooling in the zone near the surface, i.e. 20 % and 40 % of scale thickness. Figure 100 reports
the strain and temperature profiles through the thickness for the configurations highlighted in red
circle, best in terms of critical elastic strain on scale surface. Temperature profiles of cooled
configurations diverge from the condition without pre-cooling at 50 % of scale thickness, i.e. about
1.0 mm, thermal perturbation does not achieve the complete thickness of scale. For the scale
thickness of 2000 µm, the minimum dimension of wet zone size is 550 mm.
The simulations allowed defining the first setup of pre-cooling system in pilot tests: Nonozzle = 3,
Type = Atomizer, Pair =2.2 bar, Pwater = 2.2 bar, length wet area = 550 mm, Distance 1 m, V = 0.5,
1.0 m/s (SWI 1.6, 0.8 l/m2)
Critical elastic strain Strain Temperature
Figure 100: Sensitive analysis for scale thickness 2000 µm (critical elastic strain, strain and
temperature on point N6), (CSM)
Further simulations were performed in order to set up the pre-cooling for scale thickness about
3200 µm. Figure 101 shows the effect in terms of instantaneous elastic strain distribution through
scale thickness of pre-cooling for a wetted area long 730 mm in different descaling speed. For a
scale thickness equal to 3200 µm the pre-cooling is not really efficient. Elastic strain curves obtained
with and without pre-cooling intersect critical strain at the same depth: about 0.51 mm from scale
surface (0.16 normalised thickness). Although strain on scale surface is much higher in the pre-
cooling cases the depth of scale damaging before the descaler is the same. However, the
compression strain which is recorded in the internal scale layers results out of critical compression
spalling strain threshold, scale damaging in this area could be greater in the pre-cooling cases.
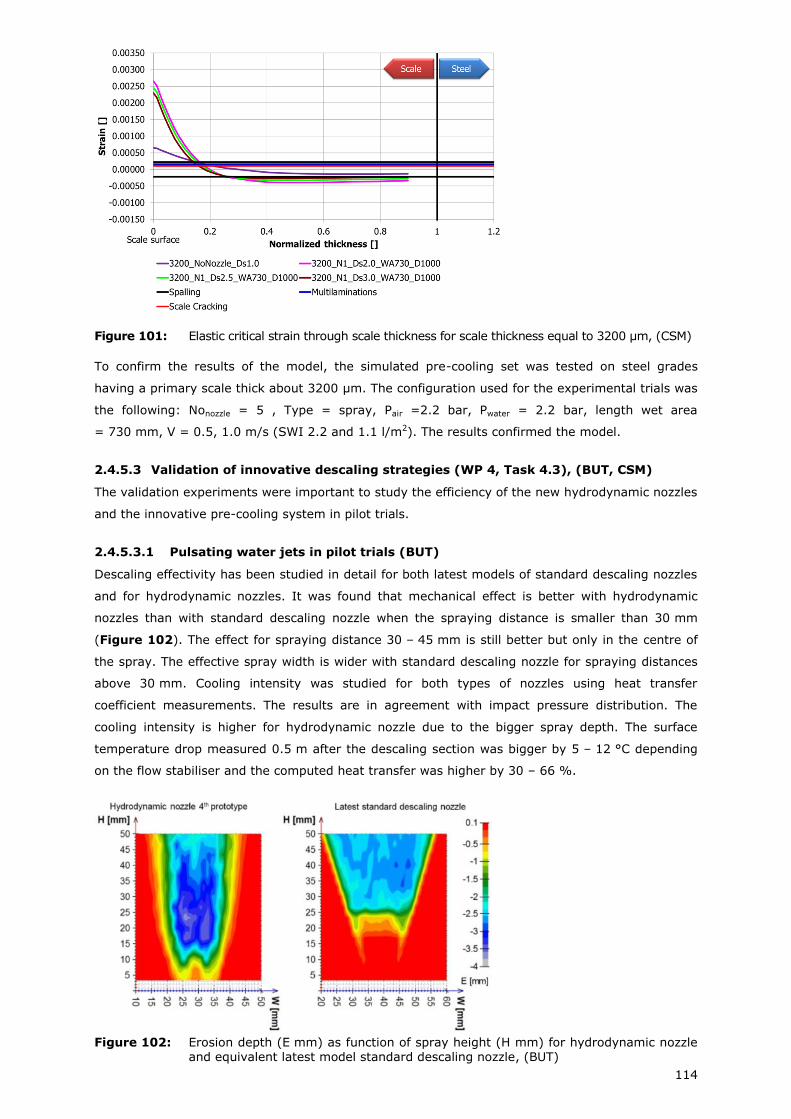
114
Figure 101: Elastic critical strain through scale thickness for scale thickness equal to 3200 µm, (CSM)
To confirm the results of the model, the simulated pre-cooling set was tested on steel grades
having a primary scale thick about 3200 µm. The configuration used for the experimental trials was
the following: Nonozzle = 5 , Type = spray, Pair =2.2 bar, Pwater = 2.2 bar, length wet area
= 730 mm, V = 0.5, 1.0 m/s (SWI 2.2 and 1.1 l/m2). The results confirmed the model.
2.4.5.3 Validation of innovative descaling strategies (WP 4, Task 4.3), (BUT, CSM)
The validation experiments were important to study the efficiency of the new hydrodynamic nozzles
and the innovative pre-cooling system in pilot trials.
2.4.5.3.1 Pulsating water jets in pilot trials (BUT)
Descaling effectivity has been studied in detail for both latest models of standard descaling nozzles
and for hydrodynamic nozzles. It was found that mechanical effect is better with hydrodynamic
nozzles than with standard descaling nozzle when the spraying distance is smaller than 30 mm
(Figure 102). The effect for spraying distance 30 – 45 mm is still better but only in the centre of
the spray. The effective spray width is wider with standard descaling nozzle for spraying distances
above 30 mm. Cooling intensity was studied for both types of nozzles using heat transfer
coefficient measurements. The results are in agreement with impact pressure distribution. The
cooling intensity is higher for hydrodynamic nozzle due to the bigger spray depth. The surface
temperature drop measured 0.5 m after the descaling section was bigger by 5 – 12 °C depending
on the flow stabiliser and the computed heat transfer was higher by 30 – 66 %.
Figure 102: Erosion depth (E mm) as function of spray height (H mm) for hydrodynamic nozzle
and equivalent latest model standard descaling nozzle, (BUT)
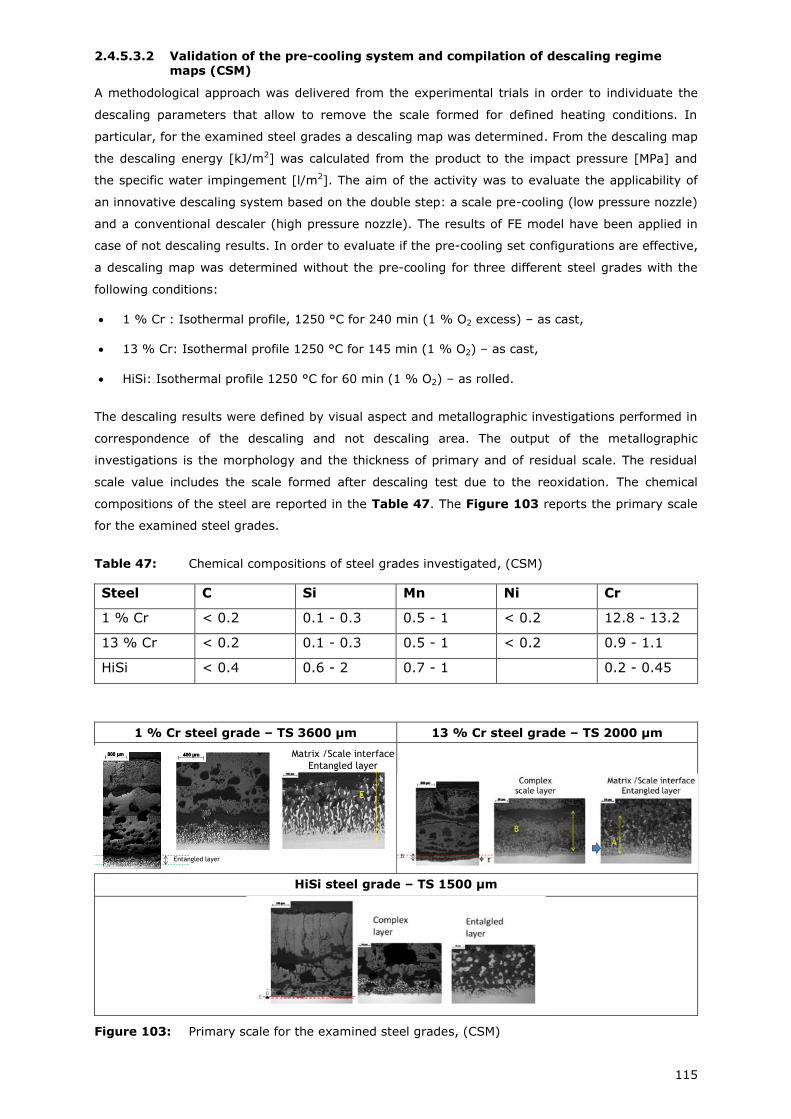
115
2.4.5.3.2 Validation of the pre-cooling system and compilation of descaling regime maps (CSM)
A methodological approach was delivered from the experimental trials in order to individuate the
descaling parameters that allow to remove the scale formed for defined heating conditions. In
particular, for the examined steel grades a descaling map was determined. From the descaling map
the descaling energy [kJ/m2] was calculated from the product to the impact pressure [MPa] and
the specific water impingement [l/m2]. The aim of the activity was to evaluate the applicability of
an innovative descaling system based on the double step: a scale pre-cooling (low pressure nozzle)
and a conventional descaler (high pressure nozzle). The results of FE model have been applied in
case of not descaling results. In order to evaluate if the pre-cooling set configurations are effective,
a descaling map was determined without the pre-cooling for three different steel grades with the
following conditions:
1 % Cr : Isothermal profile, 1250 °C for 240 min (1 % O2 excess) – as cast,
13 % Cr: Isothermal profile 1250 °C for 145 min (1 % O2) – as cast,
HiSi: Isothermal profile 1250 °C for 60 min (1 % O2) – as rolled.
The descaling results were defined by visual aspect and metallographic investigations performed in
correspondence of the descaling and not descaling area. The output of the metallographic
investigations is the morphology and the thickness of primary and of residual scale. The residual
scale value includes the scale formed after descaling test due to the reoxidation. The chemical
compositions of the steel are reported in the Table 47. The Figure 103 reports the primary scale
for the examined steel grades.
Table 47: Chemical compositions of steel grades investigated, (CSM)
Steel C Si Mn Ni Cr
1 % Cr < 0.2 0.1 - 0.3 0.5 - 1 < 0.2 12.8 - 13.2
13 % Cr < 0.2 0.1 - 0.3 0.5 - 1 < 0.2 0.9 - 1.1
HiSi < 0.4 0.6 - 2 0.7 - 1 0.2 - 0.45
1 % Cr steel grade – TS 3600 µm 13 % Cr steel grade – TS 2000 µm
HiSi steel grade – TS 1500 µm
Figure 103: Primary scale for the examined steel grades, (CSM)
Entangled layer
E
Matrix /Scale interface
Entangled layer
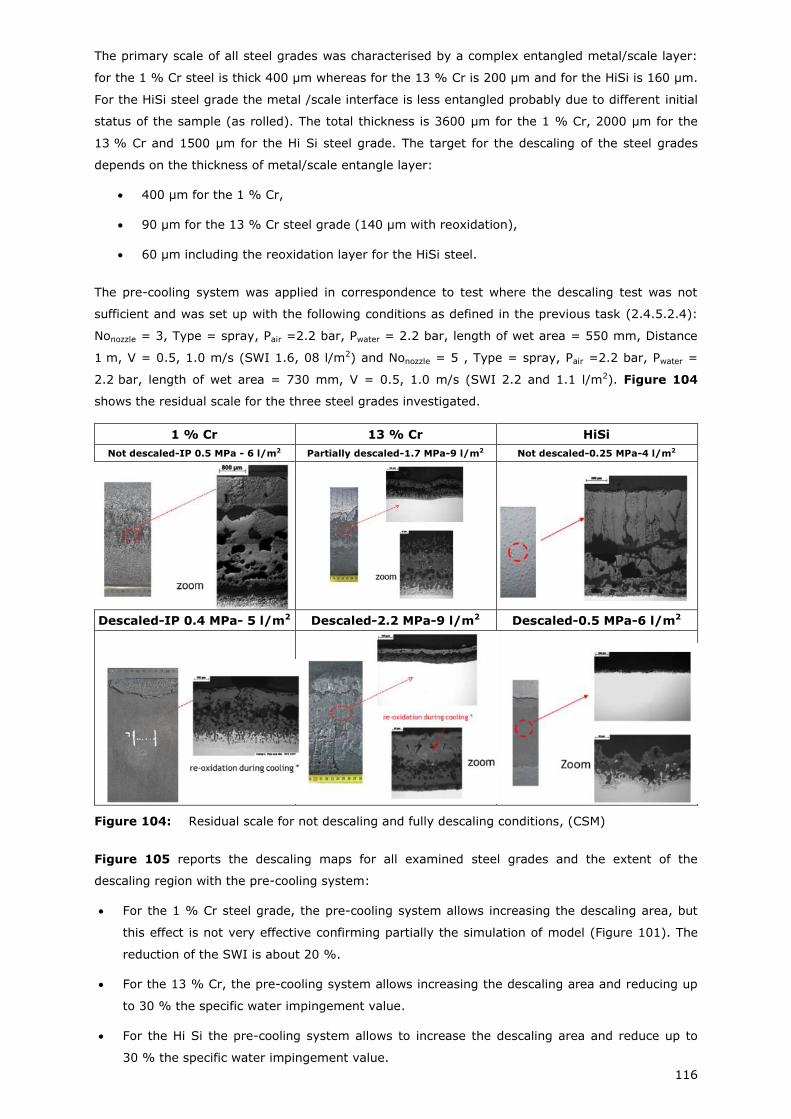
116
The primary scale of all steel grades was characterised by a complex entangled metal/scale layer:
for the 1 % Cr steel is thick 400 µm whereas for the 13 % Cr is 200 µm and for the HiSi is 160 µm.
For the HiSi steel grade the metal /scale interface is less entangled probably due to different initial
status of the sample (as rolled). The total thickness is 3600 µm for the 1 % Cr, 2000 µm for the
13 % Cr and 1500 µm for the Hi Si steel grade. The target for the descaling of the steel grades
depends on the thickness of metal/scale entangle layer:
400 µm for the 1 % Cr,
90 µm for the 13 % Cr steel grade (140 µm with reoxidation),
60 µm including the reoxidation layer for the HiSi steel.
The pre-cooling system was applied in correspondence to test where the descaling test was not
sufficient and was set up with the following conditions as defined in the previous task (2.4.5.2.4):
Nonozzle = 3, Type = spray, Pair =2.2 bar, Pwater = 2.2 bar, length of wet area = 550 mm, Distance
1 m, V = 0.5, 1.0 m/s (SWI 1.6, 08 l/m2) and Nonozzle = 5 , Type = spray, Pair =2.2 bar, Pwater =
2.2 bar, length of wet area = 730 mm, V = 0.5, 1.0 m/s (SWI 2.2 and 1.1 l/m2). Figure 104
shows the residual scale for the three steel grades investigated.
1 % Cr 13 % Cr HiSi
Not descaled-IP 0.5 MPa - 6 l/m2 Partially descaled-1.7 MPa-9 l/m2 Not descaled-0.25 MPa-4 l/m2
Descaled-IP 0.4 MPa- 5 l/m2 Descaled-2.2 MPa-9 l/m2 Descaled-0.5 MPa-6 l/m2
Figure 104: Residual scale for not descaling and fully descaling conditions, (CSM)
Figure 105 reports the descaling maps for all examined steel grades and the extent of the
descaling region with the pre-cooling system:
For the 1 % Cr steel grade, the pre-cooling system allows increasing the descaling area, but
this effect is not very effective confirming partially the simulation of model (Figure 101). The
reduction of the SWI is about 20 %.
For the 13 % Cr, the pre-cooling system allows increasing the descaling area and reducing up
to 30 % the specific water impingement value.
For the Hi Si the pre-cooling system allows to increase the descaling area and reduce up to
30 % the specific water impingement value.
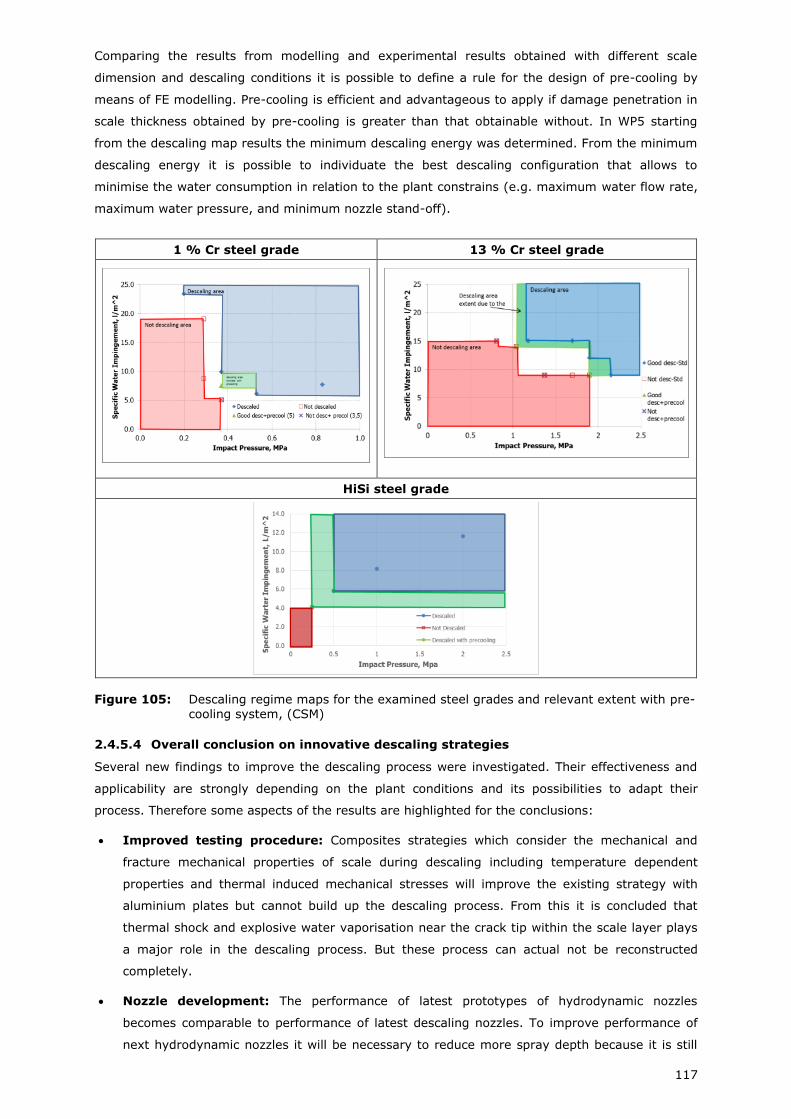
117
Comparing the results from modelling and experimental results obtained with different scale
dimension and descaling conditions it is possible to define a rule for the design of pre-cooling by
means of FE modelling. Pre-cooling is efficient and advantageous to apply if damage penetration in
scale thickness obtained by pre-cooling is greater than that obtainable without. In WP5 starting
from the descaling map results the minimum descaling energy was determined. From the minimum
descaling energy it is possible to individuate the best descaling configuration that allows to
minimise the water consumption in relation to the plant constrains (e.g. maximum water flow rate,
maximum water pressure, and minimum nozzle stand-off).
1 % Cr steel grade 13 % Cr steel grade
HiSi steel grade
Figure 105: Descaling regime maps for the examined steel grades and relevant extent with pre-
cooling system, (CSM)
2.4.5.4 Overall conclusion on innovative descaling strategies
Several new findings to improve the descaling process were investigated. Their effectiveness and
applicability are strongly depending on the plant conditions and its possibilities to adapt their
process. Therefore some aspects of the results are highlighted for the conclusions:
Improved testing procedure: Composites strategies which consider the mechanical and
fracture mechanical properties of scale during descaling including temperature dependent
properties and thermal induced mechanical stresses will improve the existing strategy with
aluminium plates but cannot build up the descaling process. From this it is concluded that
thermal shock and explosive water vaporisation near the crack tip within the scale layer plays
a major role in the descaling process. But these process can actual not be reconstructed
completely.
Nozzle development: The performance of latest prototypes of hydrodynamic nozzles
becomes comparable to performance of latest descaling nozzles. To improve performance of
next hydrodynamic nozzles it will be necessary to reduce more spray depth because it is still

118
bigger by factor 2.2 when the jet is investigated using impact pressure distribution
measurement.
Descaling process conditions: Several parameters influence the descaling process
conditions. Most important findings are: (i) The investigations on overlap and washout area
showed that the problematic area is not the overlap area but the washout area. This area can
be significantly reduced when twist angle is reduced while the feeding pressure does not
change the size of washout area.(ii) Latest models of descaling nozzles and flow stabilisers can
significantly increase impact pressure with the same water flow rate and pressure.
Measurement showed increase by 50 %. (iii) Measurements with various material velocities
showed that there is strong non-linearity when the velocity is decreased.
Descaling strategy: The results (pilot plant and modelling) on pre-cooling showed a positive
impact on descalability when the slab is pre-cooled.
119
2.5 Exploitation and impact of the research results
During the finalising work of HiPerScale the results were demonstrated and validated in industrial
or pilot trials in order to develop overall guidelines. These will support industry to decide on
strategies to improve primary descalability and surface quality properties of rolled products
dependent on steel-grade, scale formation descalability, scale conditioning coatings and efficient
descaling strategies. The results are intended to enhance the hot rolling process to an integrated
intelligent production system combining the synergistic effects of alloy composition, reheating
operation, scale morphology and interface, descaling and rolling with / without application of scale-
conditioning coatings.
2.5.1 Effects on oxidation behaviour and descalability in industrial verification
(WP5, Task 5.1, Task 5.2)
The three different aspects
Secondary scale detection systems,
Coating application and utilisation,
Improved descalability
were focused during the verification trials. The trials led to the compilation of suggestions for a
decision, key production indicators (KPI) and descaling regime maps (DRM) for the Process_HI_PER
evaluating also the combined effects on hot rolling and cleaner surfaces.
Outcome of the laboratory and pilot investigations during the HiPerScale project were the
installation of a pilot secondary scale detection system at SSAB roughing mill in Raahe, industrial
trials for coating application and reduction of decarburisation at the site of Sidenor, the installation
of a spraying plant and regular utilisation of coatings at AmRu as well as the installation of new
nozzles in the descaling plant of TKSE. The verification trials were used to proof industrial
applicability of the measures and to demonstrate the benefits.
2.5.1.1 Industrial trials on scale monitoring at SSAB roughing mill in Raahe (Mefos)
Scale monitoring was made to follow the scale evaluation during rolling in the roughing mill. The
monitoring is made by using automatic triggered cameras at each side of the roughing mill. The
images make it possible to follow the scale status. The images can be used together with image
processing for on-line status logging or afterwards during manual inspection for instance when
investigating surface issues. The study of the images shows that it is common that part of
remaining primary scale comes off in the rougher. Scale that has been rolled on can spall off in
subsequent passes. Spots with remaining scale can become cleaner and hotter than the other strip
when scale spalls off. If scale remains it will be partly rolled out, elongated and it can get rolled in
appearing as dark spots on the surface. From the study in the roughing mill it is evident that to
follow the evaluation of scale status the knowledge of the previous rolling passes must be utilised.
A condition occurring in one pass can be the key for interpreting the next pass.
Measuring campaign
A four week measuring campaign was made in the hot strip mill in Raahe. The monitoring system
consists of two colour cameras, Sony IMX174, having 2.3 Mpixels. For this application a frame rate
of 10 fps was suitable. (The frame rate limit is 50 fps since this causes memory/speed problems.)
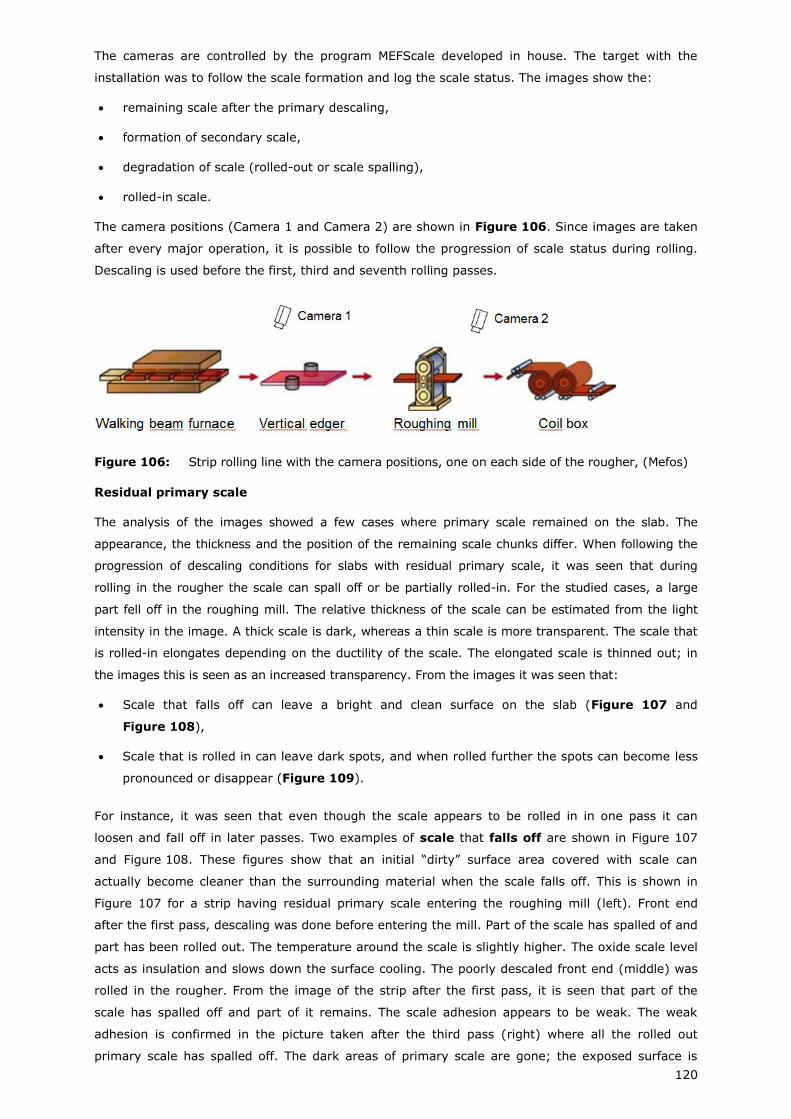
120
The cameras are controlled by the program MEFScale developed in house. The target with the
installation was to follow the scale formation and log the scale status. The images show the:
remaining scale after the primary descaling,
formation of secondary scale,
degradation of scale (rolled-out or scale spalling),
rolled-in scale.
The camera positions (Camera 1 and Camera 2) are shown in Figure 106. Since images are taken
after every major operation, it is possible to follow the progression of scale status during rolling.
Descaling is used before the first, third and seventh rolling passes.
Figure 106: Strip rolling line with the camera positions, one on each side of the rougher, (Mefos)
Residual primary scale
The analysis of the images showed a few cases where primary scale remained on the slab. The
appearance, the thickness and the position of the remaining scale chunks differ. When following the
progression of descaling conditions for slabs with residual primary scale, it was seen that during
rolling in the rougher the scale can spall off or be partially rolled-in. For the studied cases, a large
part fell off in the roughing mill. The relative thickness of the scale can be estimated from the light
intensity in the image. A thick scale is dark, whereas a thin scale is more transparent. The scale that
is rolled-in elongates depending on the ductility of the scale. The elongated scale is thinned out; in
the images this is seen as an increased transparency. From the images it was seen that:
Scale that falls off can leave a bright and clean surface on the slab (Figure 107 and
Figure 108),
Scale that is rolled in can leave dark spots, and when rolled further the spots can become less
pronounced or disappear (Figure 109).
For instance, it was seen that even though the scale appears to be rolled in in one pass it can
loosen and fall off in later passes. Two examples of scale that falls off are shown in Figure 107
and Figure 108. These figures show that an initial “dirty” surface area covered with scale can
actually become cleaner than the surrounding material when the scale falls off. This is shown in
Figure 107 for a strip having residual primary scale entering the roughing mill (left). Front end
after the first pass, descaling was done before entering the mill. Part of the scale has spalled of and
part has been rolled out. The temperature around the scale is slightly higher. The oxide scale level
acts as insulation and slows down the surface cooling. The poorly descaled front end (middle) was
rolled in the rougher. From the image of the strip after the first pass, it is seen that part of the
scale has spalled off and part of it remains. The scale adhesion appears to be weak. The weak
adhesion is confirmed in the picture taken after the third pass (right) where all the rolled out
primary scale has spalled off. The dark areas of primary scale are gone; the exposed surface is
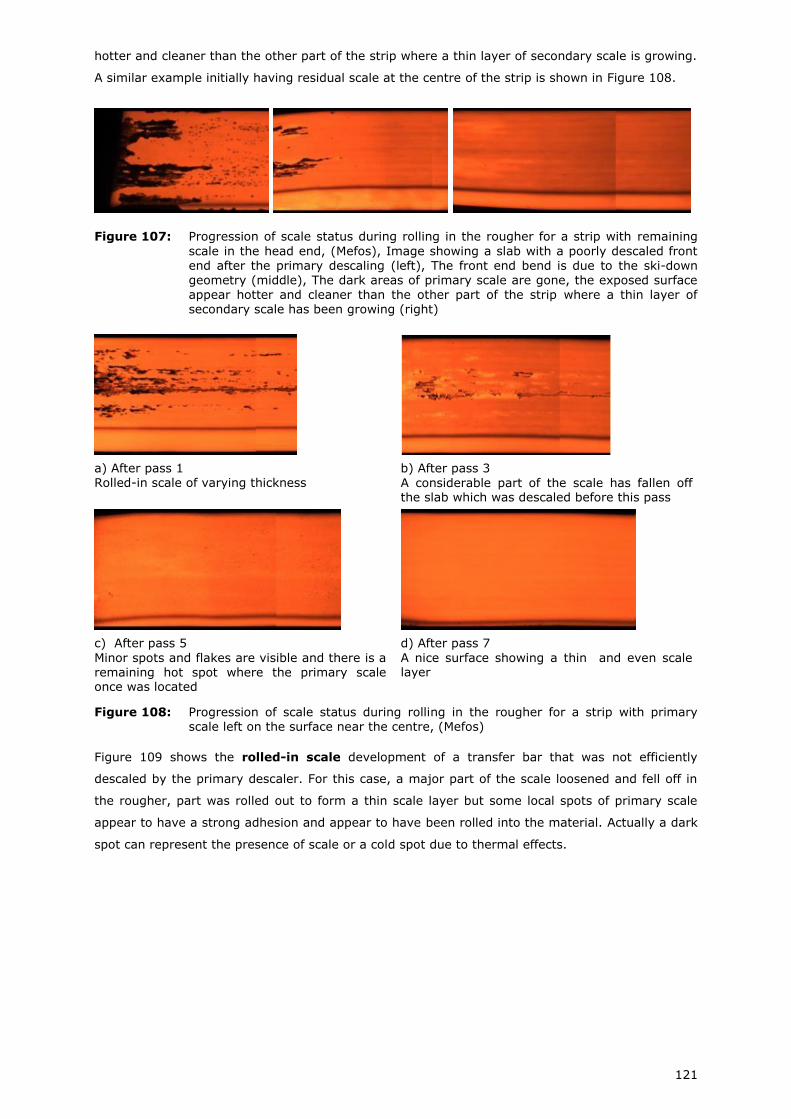
121
hotter and cleaner than the other part of the strip where a thin layer of secondary scale is growing.
A similar example initially having residual scale at the centre of the strip is shown in Figure 108.
Figure 107: Progression of scale status during rolling in the rougher for a strip with remaining
scale in the head end, (Mefos), Image showing a slab with a poorly descaled front end after the primary descaling (left), The front end bend is due to the ski-down geometry (middle), The dark areas of primary scale are gone, the exposed surface appear hotter and cleaner than the other part of the strip where a thin layer of secondary scale has been growing (right)
a) After pass 1 Rolled-in scale of varying thickness
b) After pass 3
A considerable part of the scale has fallen off the slab which was descaled before this pass
c) After pass 5
Minor spots and flakes are visible and there is a remaining hot spot where the primary scale once was located
d) After pass 7
A nice surface showing a thin and even scale layer
Figure 108: Progression of scale status during rolling in the rougher for a strip with primary scale left on the surface near the centre, (Mefos)
Figure 109 shows the rolled-in scale development of a transfer bar that was not efficiently
descaled by the primary descaler. For this case, a major part of the scale loosened and fell off in
the rougher, part was rolled out to form a thin scale layer but some local spots of primary scale
appear to have a strong adhesion and appear to have been rolled into the material. Actually a dark
spot can represent the presence of scale or a cold spot due to thermal effects.
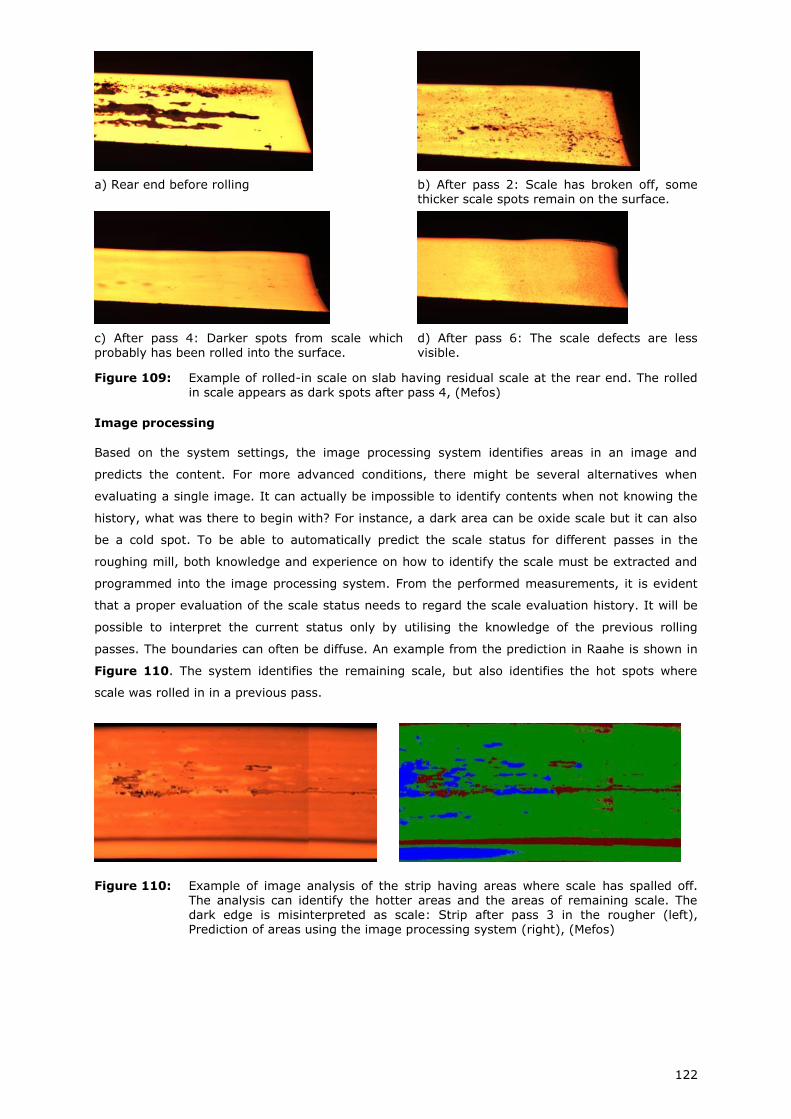
122
a) Rear end before rolling b) After pass 2: Scale has broken off, some thicker scale spots remain on the surface.
c) After pass 4: Darker spots from scale which
probably has been rolled into the surface.
d) After pass 6: The scale defects are less
visible.
Figure 109: Example of rolled-in scale on slab having residual scale at the rear end. The rolled in scale appears as dark spots after pass 4, (Mefos)
Image processing
Based on the system settings, the image processing system identifies areas in an image and
predicts the content. For more advanced conditions, there might be several alternatives when
evaluating a single image. It can actually be impossible to identify contents when not knowing the
history, what was there to begin with? For instance, a dark area can be oxide scale but it can also
be a cold spot. To be able to automatically predict the scale status for different passes in the
roughing mill, both knowledge and experience on how to identify the scale must be extracted and
programmed into the image processing system. From the performed measurements, it is evident
that a proper evaluation of the scale status needs to regard the scale evaluation history. It will be
possible to interpret the current status only by utilising the knowledge of the previous rolling
passes. The boundaries can often be diffuse. An example from the prediction in Raahe is shown in
Figure 110. The system identifies the remaining scale, but also identifies the hot spots where
scale was rolled in in a previous pass.
Figure 110: Example of image analysis of the strip having areas where scale has spalled off. The analysis can identify the hotter areas and the areas of remaining scale. The dark edge is misinterpreted as scale: Strip after pass 3 in the rougher (left), Prediction of areas using the image processing system (right), (Mefos)
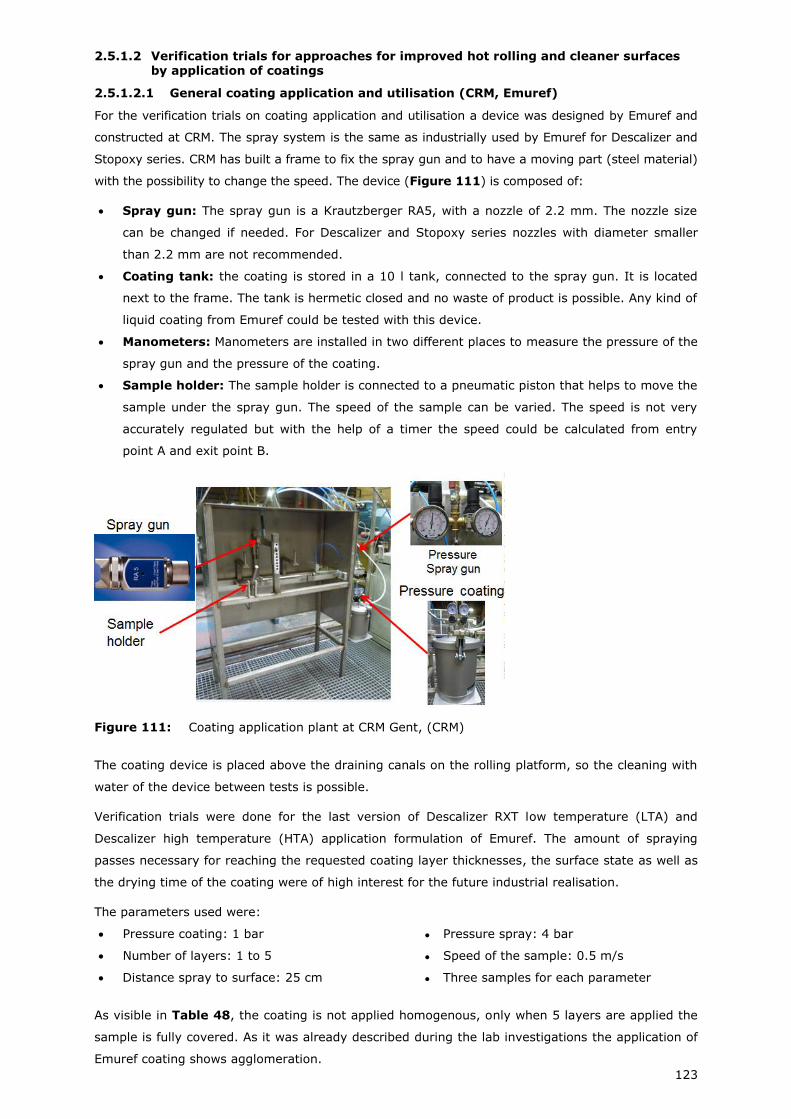
123
2.5.1.2 Verification trials for approaches for improved hot rolling and cleaner surfaces by application of coatings
2.5.1.2.1 General coating application and utilisation (CRM, Emuref)
For the verification trials on coating application and utilisation a device was designed by Emuref and
constructed at CRM. The spray system is the same as industrially used by Emuref for Descalizer and
Stopoxy series. CRM has built a frame to fix the spray gun and to have a moving part (steel material)
with the possibility to change the speed. The device (Figure 111) is composed of:
Spray gun: The spray gun is a Krautzberger RA5, with a nozzle of 2.2 mm. The nozzle size
can be changed if needed. For Descalizer and Stopoxy series nozzles with diameter smaller
than 2.2 mm are not recommended.
Coating tank: the coating is stored in a 10 l tank, connected to the spray gun. It is located
next to the frame. The tank is hermetic closed and no waste of product is possible. Any kind of
liquid coating from Emuref could be tested with this device.
Manometers: Manometers are installed in two different places to measure the pressure of the
spray gun and the pressure of the coating.
Sample holder: The sample holder is connected to a pneumatic piston that helps to move the
sample under the spray gun. The speed of the sample can be varied. The speed is not very
accurately regulated but with the help of a timer the speed could be calculated from entry
point A and exit point B.
Figure 111: Coating application plant at CRM Gent, (CRM)
The coating device is placed above the draining canals on the rolling platform, so the cleaning with
water of the device between tests is possible.
Verification trials were done for the last version of Descalizer RXT low temperature (LTA) and
Descalizer high temperature (HTA) application formulation of Emuref. The amount of spraying
passes necessary for reaching the requested coating layer thicknesses, the surface state as well as
the drying time of the coating were of high interest for the future industrial realisation.
The parameters used were:
Pressure coating: 1 bar ● Pressure spray: 4 bar
Number of layers: 1 to 5 ● Speed of the sample: 0.5 m/s
Distance spray to surface: 25 cm ● Three samples for each parameter
As visible in Table 48, the coating is not applied homogenous, only when 5 layers are applied the
sample is fully covered. As it was already described during the lab investigations the application of
Emuref coating shows agglomeration.
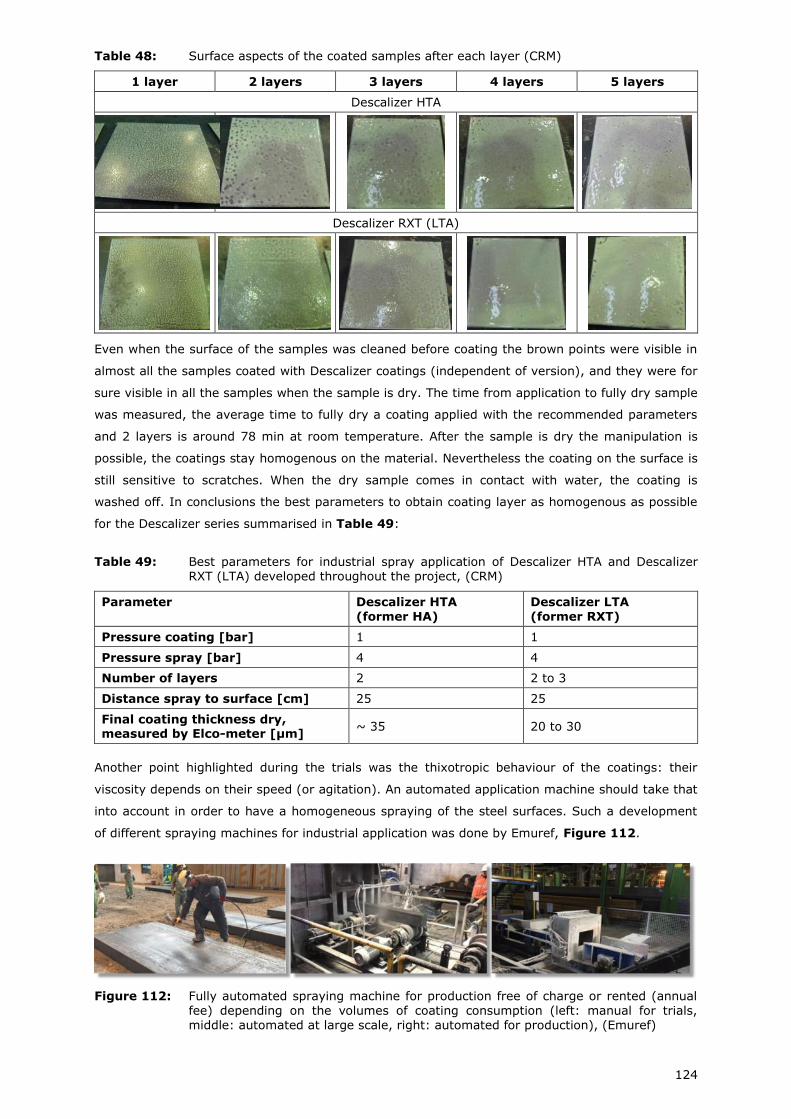
124
Table 48: Surface aspects of the coated samples after each layer (CRM)
1 layer 2 layers 3 layers 4 layers 5 layers
Descalizer HTA
Descalizer RXT (LTA)
Even when the surface of the samples was cleaned before coating the brown points were visible in
almost all the samples coated with Descalizer coatings (independent of version), and they were for
sure visible in all the samples when the sample is dry. The time from application to fully dry sample
was measured, the average time to fully dry a coating applied with the recommended parameters
and 2 layers is around 78 min at room temperature. After the sample is dry the manipulation is
possible, the coatings stay homogenous on the material. Nevertheless the coating on the surface is
still sensitive to scratches. When the dry sample comes in contact with water, the coating is
washed off. In conclusions the best parameters to obtain coating layer as homogenous as possible
for the Descalizer series summarised in Table 49:
Table 49: Best parameters for industrial spray application of Descalizer HTA and Descalizer RXT (LTA) developed throughout the project, (CRM)
Parameter Descalizer HTA (former HA)
Descalizer LTA (former RXT)
Pressure coating [bar] 1 1
Pressure spray [bar] 4 4
Number of layers 2 2 to 3
Distance spray to surface [cm] 25 25
Final coating thickness dry, measured by Elco-meter [µm]
~ 35 20 to 30
Another point highlighted during the trials was the thixotropic behaviour of the coatings: their
viscosity depends on their speed (or agitation). An automated application machine should take that
into account in order to have a homogeneous spraying of the steel surfaces. Such a development
of different spraying machines for industrial application was done by Emuref, Figure 112.
Figure 112: Fully automated spraying machine for production free of charge or rented (annual fee) depending on the volumes of coating consumption (left: manual for trials, middle: automated at large scale, right: automated for production), (Emuref)
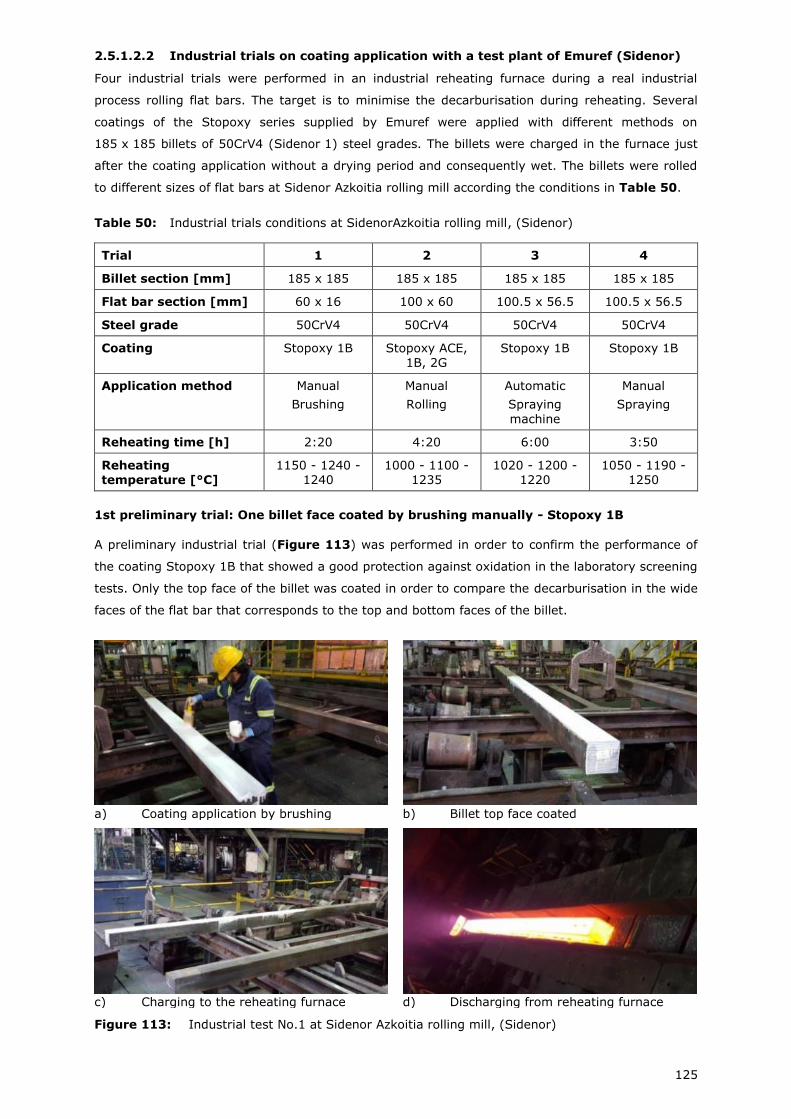
125
2.5.1.2.2 Industrial trials on coating application with a test plant of Emuref (Sidenor)
Four industrial trials were performed in an industrial reheating furnace during a real industrial
process rolling flat bars. The target is to minimise the decarburisation during reheating. Several
coatings of the Stopoxy series supplied by Emuref were applied with different methods on
185 x 185 billets of 50CrV4 (Sidenor 1) steel grades. The billets were charged in the furnace just
after the coating application without a drying period and consequently wet. The billets were rolled
to different sizes of flat bars at Sidenor Azkoitia rolling mill according the conditions in Table 50.
Table 50: Industrial trials conditions at SidenorAzkoitia rolling mill, (Sidenor)
Trial 1 2 3 4
Billet section [mm] 185 x 185 185 x 185 185 x 185 185 x 185
Flat bar section [mm] 60 x 16 100 x 60 100.5 x 56.5 100.5 x 56.5
Steel grade 50CrV4 50CrV4 50CrV4 50CrV4
Coating Stopoxy 1B Stopoxy ACE,
1B, 2G
Stopoxy 1B Stopoxy 1B
Application method Manual
Brushing
Manual
Rolling
Automatic
Spraying
machine
Manual
Spraying
Reheating time [h] 2:20 4:20 6:00 3:50
Reheating temperature [°C]
1150 - 1240 -1240
1000 - 1100 -1235
1020 - 1200 -1220
1050 - 1190 -1250
1st preliminary trial: One billet face coated by brushing manually - Stopoxy 1B
A preliminary industrial trial (Figure 113) was performed in order to confirm the performance of
the coating Stopoxy 1B that showed a good protection against oxidation in the laboratory screening
tests. Only the top face of the billet was coated in order to compare the decarburisation in the wide
faces of the flat bar that corresponds to the top and bottom faces of the billet.
a) Coating application by brushing b) Billet top face coated
c) Charging to the reheating furnace d) Discharging from reheating furnace
Figure 113: Industrial test No.1 at Sidenor Azkoitia rolling mill, (Sidenor)
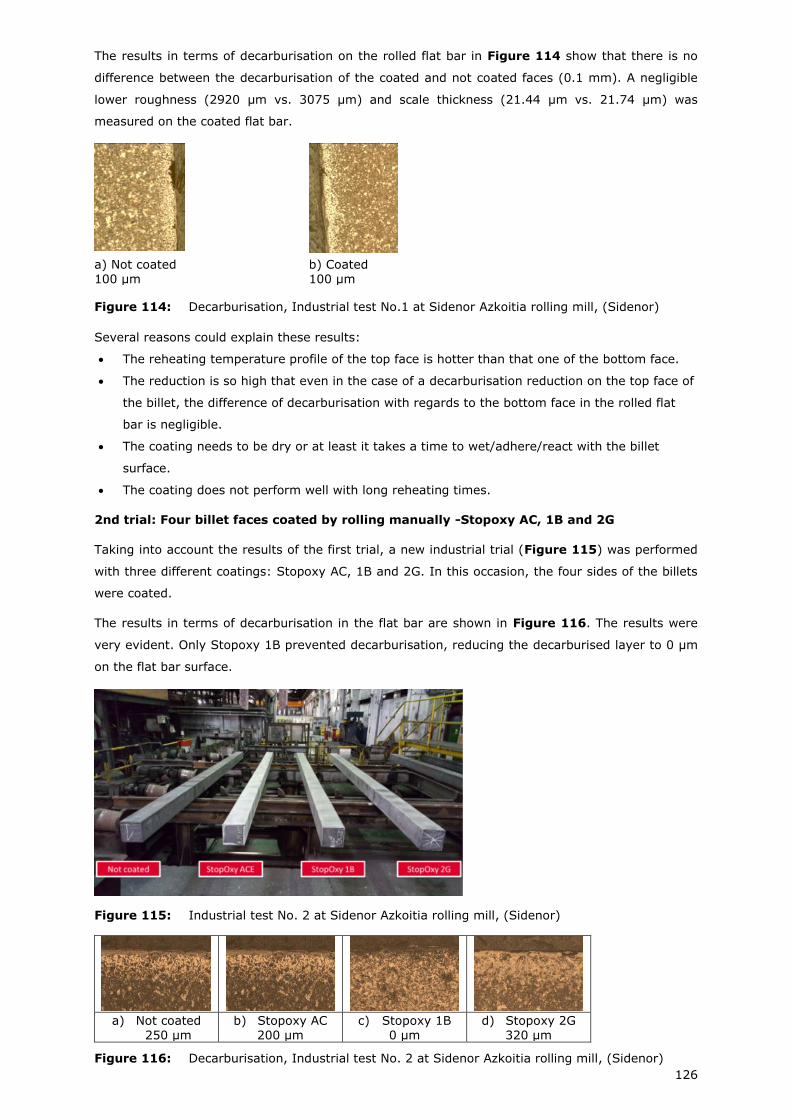
126
The results in terms of decarburisation on the rolled flat bar in Figure 114 show that there is no
difference between the decarburisation of the coated and not coated faces (0.1 mm). A negligible
lower roughness (2920 µm vs. 3075 µm) and scale thickness (21.44 µm vs. 21.74 µm) was
measured on the coated flat bar.
a) Not coated 100 µm
b) Coated 100 µm
Figure 114: Decarburisation, Industrial test No.1 at Sidenor Azkoitia rolling mill, (Sidenor)
Several reasons could explain these results:
The reheating temperature profile of the top face is hotter than that one of the bottom face.
The reduction is so high that even in the case of a decarburisation reduction on the top face of
the billet, the difference of decarburisation with regards to the bottom face in the rolled flat
bar is negligible.
The coating needs to be dry or at least it takes a time to wet/adhere/react with the billet
surface.
The coating does not perform well with long reheating times.
2nd trial: Four billet faces coated by rolling manually -Stopoxy AC, 1B and 2G
Taking into account the results of the first trial, a new industrial trial (Figure 115) was performed
with three different coatings: Stopoxy AC, 1B and 2G. In this occasion, the four sides of the billets
were coated.
The results in terms of decarburisation in the flat bar are shown in Figure 116. The results were
very evident. Only Stopoxy 1B prevented decarburisation, reducing the decarburised layer to 0 µm
on the flat bar surface.
Figure 115: Industrial test No. 2 at Sidenor Azkoitia rolling mill, (Sidenor)
a) Not coated 250 µm
b) Stopoxy AC 200 µm
c) Stopoxy 1B 0 µm
d) Stopoxy 2G 320 µm
Figure 116: Decarburisation, Industrial test No. 2 at Sidenor Azkoitia rolling mill, (Sidenor)
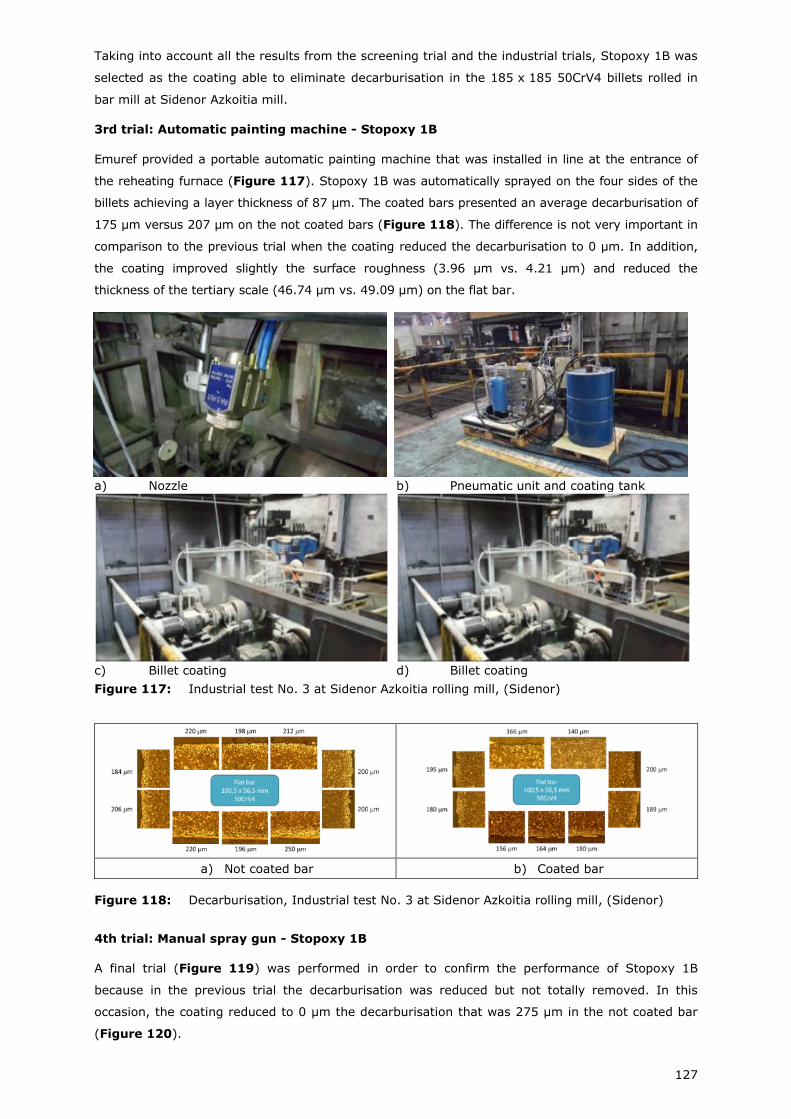
127
Taking into account all the results from the screening trial and the industrial trials, Stopoxy 1B was
selected as the coating able to eliminate decarburisation in the 185 x 185 50CrV4 billets rolled in
bar mill at Sidenor Azkoitia mill.
3rd trial: Automatic painting machine - Stopoxy 1B
Emuref provided a portable automatic painting machine that was installed in line at the entrance of
the reheating furnace (Figure 117). Stopoxy 1B was automatically sprayed on the four sides of the
billets achieving a layer thickness of 87 µm. The coated bars presented an average decarburisation of
175 µm versus 207 µm on the not coated bars (Figure 118). The difference is not very important in
comparison to the previous trial when the coating reduced the decarburisation to 0 µm. In addition,
the coating improved slightly the surface roughness (3.96 µm vs. 4.21 µm) and reduced the
thickness of the tertiary scale (46.74 µm vs. 49.09 µm) on the flat bar.
a) Nozzle b) Pneumatic unit and coating tank
c) Billet coating d) Billet coating
Figure 117: Industrial test No. 3 at Sidenor Azkoitia rolling mill, (Sidenor)
a) Not coated bar b) Coated bar
Figure 118: Decarburisation, Industrial test No. 3 at Sidenor Azkoitia rolling mill, (Sidenor)
4th trial: Manual spray gun - Stopoxy 1B
A final trial (Figure 119) was performed in order to confirm the performance of Stopoxy 1B
because in the previous trial the decarburisation was reduced but not totally removed. In this
occasion, the coating reduced to 0 µm the decarburisation that was 275 µm in the not coated bar
(Figure 120).
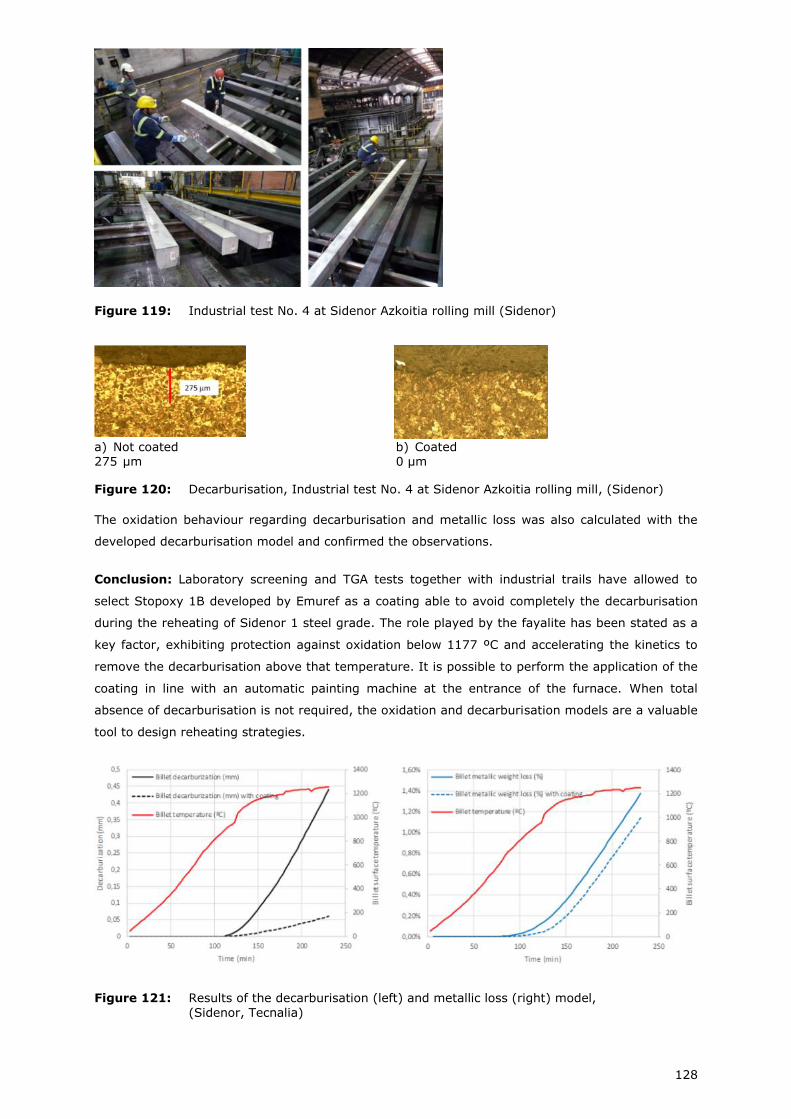
128
Figure 119: Industrial test No. 4 at Sidenor Azkoitia rolling mill (Sidenor)
a) Not coated 275 µm
b) Coated 0 µm
Figure 120: Decarburisation, Industrial test No. 4 at Sidenor Azkoitia rolling mill, (Sidenor)
The oxidation behaviour regarding decarburisation and metallic loss was also calculated with the
developed decarburisation model and confirmed the observations.
Conclusion: Laboratory screening and TGA tests together with industrial trails have allowed to
select Stopoxy 1B developed by Emuref as a coating able to avoid completely the decarburisation
during the reheating of Sidenor 1 steel grade. The role played by the fayalite has been stated as a
key factor, exhibiting protection against oxidation below 1177 ºC and accelerating the kinetics to
remove the decarburisation above that temperature. It is possible to perform the application of the
coating in line with an automatic painting machine at the entrance of the furnace. When total
absence of decarburisation is not required, the oxidation and decarburisation models are a valuable
tool to design reheating strategies.
Figure 121: Results of the decarburisation (left) and metallic loss (right) model,
(Sidenor, Tecnalia)
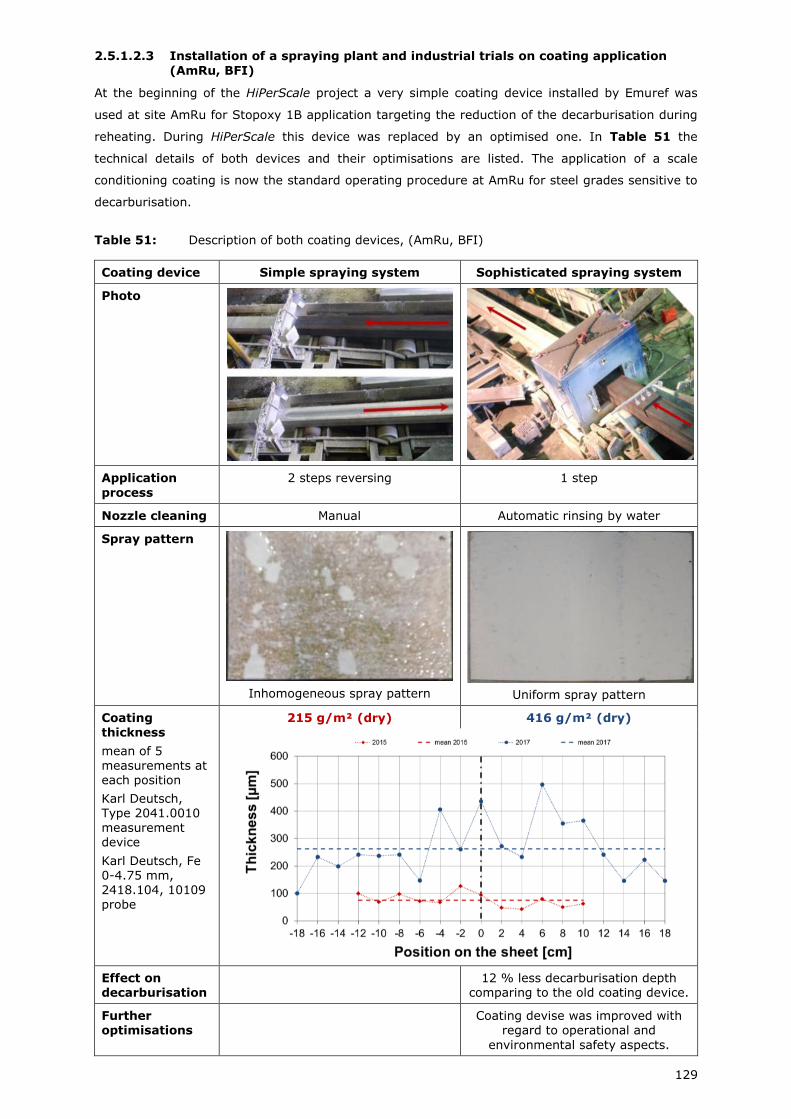
129
2.5.1.2.3 Installation of a spraying plant and industrial trials on coating application
(AmRu, BFI)
At the beginning of the HiPerScale project a very simple coating device installed by Emuref was
used at site AmRu for Stopoxy 1B application targeting the reduction of the decarburisation during
reheating. During HiPerScale this device was replaced by an optimised one. In Table 51 the
technical details of both devices and their optimisations are listed. The application of a scale
conditioning coating is now the standard operating procedure at AmRu for steel grades sensitive to
decarburisation.
Table 51: Description of both coating devices, (AmRu, BFI)
Coating device Simple spraying system Sophisticated spraying system
Photo
Application
process
2 steps reversing 1 step
Nozzle cleaning Manual Automatic rinsing by water
Spray pattern
Inhomogeneous spray pattern
Uniform spray pattern
Coating thickness
mean of 5 measurements at each position
Karl Deutsch, Type 2041.0010
measurement device
Karl Deutsch, Fe 0-4.75 mm, 2418.104, 10109 probe
215 g/m² (dry) 416 g/m² (dry)
Effect on decarburisation
12 % less decarburisation depth
comparing to the old coating device.
Further optimisations
Coating devise was improved with regard to operational and
environmental safety aspects.
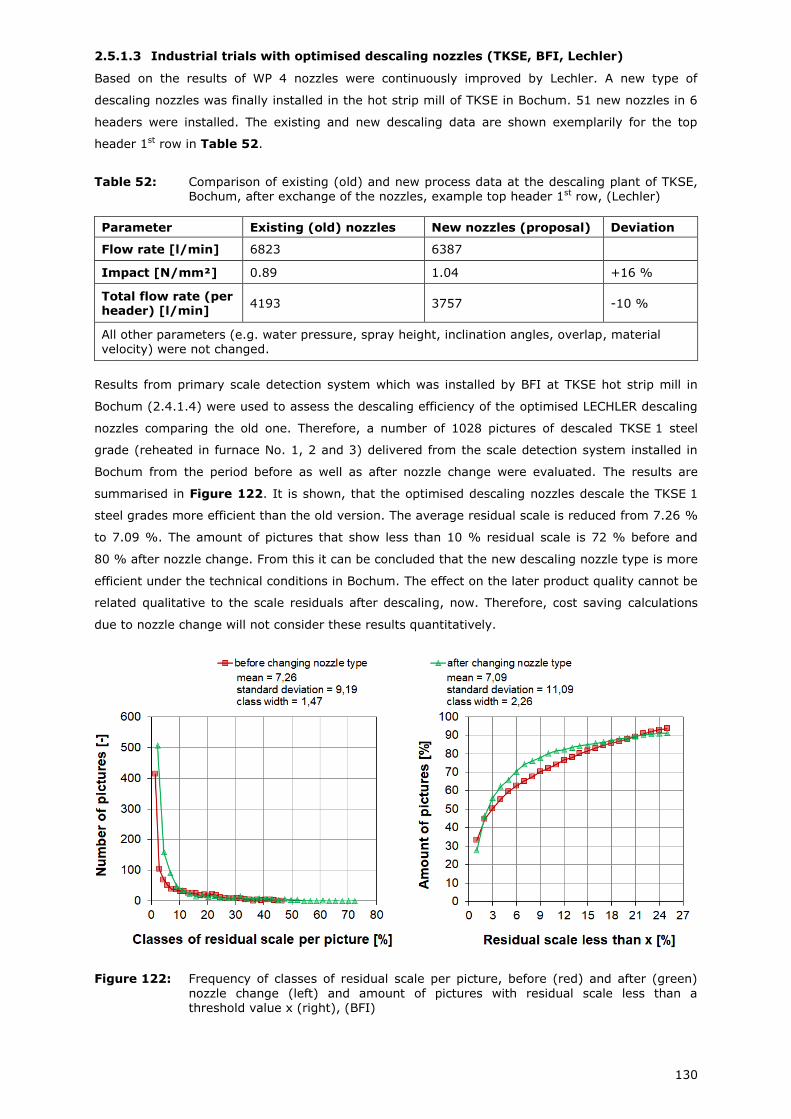
130
2.5.1.3 Industrial trials with optimised descaling nozzles (TKSE, BFI, Lechler)
Based on the results of WP 4 nozzles were continuously improved by Lechler. A new type of
descaling nozzles was finally installed in the hot strip mill of TKSE in Bochum. 51 new nozzles in 6
headers were installed. The existing and new descaling data are shown exemplarily for the top
header 1st row in Table 52.
Table 52: Comparison of existing (old) and new process data at the descaling plant of TKSE, Bochum, after exchange of the nozzles, example top header 1st row, (Lechler)
Parameter Existing (old) nozzles New nozzles (proposal) Deviation
Flow rate [l/min] 6823 6387
Impact [N/mm²] 0.89 1.04 +16 %
Total flow rate (per header) [l/min]
4193 3757 -10 %
All other parameters (e.g. water pressure, spray height, inclination angles, overlap, material velocity) were not changed.
Results from primary scale detection system which was installed by BFI at TKSE hot strip mill in
Bochum (2.4.1.4) were used to assess the descaling efficiency of the optimised LECHLER descaling
nozzles comparing the old one. Therefore, a number of 1028 pictures of descaled TKSE 1 steel
grade (reheated in furnace No. 1, 2 and 3) delivered from the scale detection system installed in
Bochum from the period before as well as after nozzle change were evaluated. The results are
summarised in Figure 122. It is shown, that the optimised descaling nozzles descale the TKSE 1
steel grades more efficient than the old version. The average residual scale is reduced from 7.26 %
to 7.09 %. The amount of pictures that show less than 10 % residual scale is 72 % before and
80 % after nozzle change. From this it can be concluded that the new descaling nozzle type is more
efficient under the technical conditions in Bochum. The effect on the later product quality cannot be
related qualitative to the scale residuals after descaling, now. Therefore, cost saving calculations
due to nozzle change will not consider these results quantitatively.
Figure 122: Frequency of classes of residual scale per picture, before (red) and after (green)
nozzle change (left) and amount of pictures with residual scale less than a threshold value x (right), (BFI)
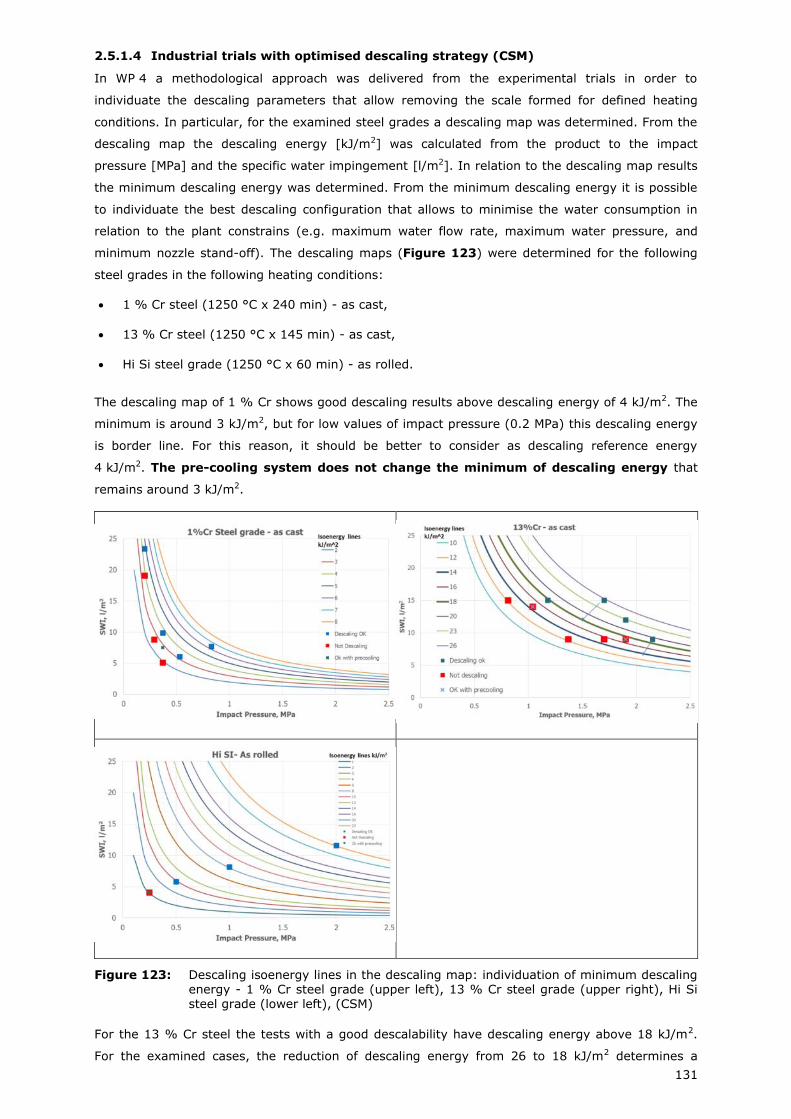
131
2.5.1.4 Industrial trials with optimised descaling strategy (CSM)
In WP 4 a methodological approach was delivered from the experimental trials in order to
individuate the descaling parameters that allow removing the scale formed for defined heating
conditions. In particular, for the examined steel grades a descaling map was determined. From the
descaling map the descaling energy [kJ/m2] was calculated from the product to the impact
pressure [MPa] and the specific water impingement [l/m2]. In relation to the descaling map results
the minimum descaling energy was determined. From the minimum descaling energy it is possible
to individuate the best descaling configuration that allows to minimise the water consumption in
relation to the plant constrains (e.g. maximum water flow rate, maximum water pressure, and
minimum nozzle stand-off). The descaling maps (Figure 123) were determined for the following
steel grades in the following heating conditions:
1 % Cr steel (1250 °C x 240 min) - as cast,
13 % Cr steel (1250 °C x 145 min) - as cast,
Hi Si steel grade (1250 °C x 60 min) - as rolled.
The descaling map of 1 % Cr shows good descaling results above descaling energy of 4 kJ/m2. The
minimum is around 3 kJ/m2, but for low values of impact pressure (0.2 MPa) this descaling energy
is border line. For this reason, it should be better to consider as descaling reference energy
4 kJ/m2. The pre-cooling system does not change the minimum of descaling energy that
remains around 3 kJ/m2.
Figure 123: Descaling isoenergy lines in the descaling map: individuation of minimum descaling energy - 1 % Cr steel grade (upper left), 13 % Cr steel grade (upper right), Hi Si steel grade (lower left), (CSM)
For the 13 % Cr steel the tests with a good descalability have descaling energy above 18 kJ/m2.
For the examined cases, the reduction of descaling energy from 26 to 18 kJ/m2 determines a
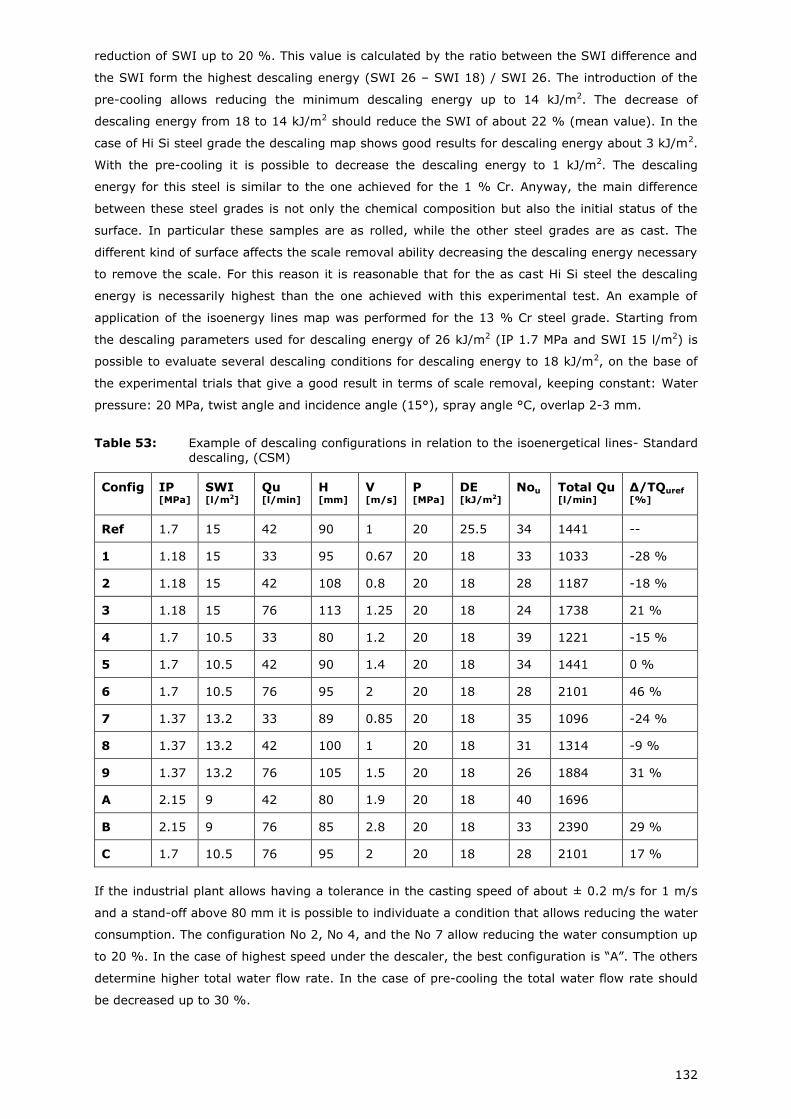
132
reduction of SWI up to 20 %. This value is calculated by the ratio between the SWI difference and
the SWI form the highest descaling energy (SWI 26 – SWI 18) / SWI 26. The introduction of the
pre-cooling allows reducing the minimum descaling energy up to 14 kJ/m2. The decrease of
descaling energy from 18 to 14 kJ/m2 should reduce the SWI of about 22 % (mean value). In the
case of Hi Si steel grade the descaling map shows good results for descaling energy about 3 kJ/m2.
With the pre-cooling it is possible to decrease the descaling energy to 1 kJ/m2. The descaling
energy for this steel is similar to the one achieved for the 1 % Cr. Anyway, the main difference
between these steel grades is not only the chemical composition but also the initial status of the
surface. In particular these samples are as rolled, while the other steel grades are as cast. The
different kind of surface affects the scale removal ability decreasing the descaling energy necessary
to remove the scale. For this reason it is reasonable that for the as cast Hi Si steel the descaling
energy is necessarily highest than the one achieved with this experimental test. An example of
application of the isoenergy lines map was performed for the 13 % Cr steel grade. Starting from
the descaling parameters used for descaling energy of 26 kJ/m2 (IP 1.7 MPa and SWI 15 l/m2) is
possible to evaluate several descaling conditions for descaling energy to 18 kJ/m2, on the base of
the experimental trials that give a good result in terms of scale removal, keeping constant: Water
pressure: 20 MPa, twist angle and incidence angle (15°), spray angle °C, overlap 2-3 mm.
Table 53: Example of descaling configurations in relation to the isoenergetical lines- Standard
descaling, (CSM)
Config IP [MPa]
SWI [l/m2]
Qu [l/min]
H [mm]
V [m/s]
P [MPa]
DE [kJ/m2]
Nou
Total Qu [l/min]
∆/TQuref
[%]
Ref 1.7 15 42 90 1 20 25.5 34 1441 --
1 1.18 15 33 95 0.67 20 18 33 1033 -28 %
2 1.18 15 42 108 0.8 20 18 28 1187 -18 %
3 1.18 15 76 113 1.25 20 18 24 1738 21 %
4 1.7 10.5 33 80 1.2 20 18 39 1221 -15 %
5 1.7 10.5 42 90 1.4 20 18 34 1441 0 %
6 1.7 10.5 76 95 2 20 18 28 2101 46 %
7 1.37 13.2 33 89 0.85 20 18 35 1096 -24 %
8 1.37 13.2 42 100 1 20 18 31 1314 -9 %
9 1.37 13.2 76 105 1.5 20 18 26 1884 31 %
A 2.15 9 42 80 1.9 20 18 40 1696
B 2.15 9 76 85 2.8 20 18 33 2390 29 %
C 1.7 10.5 76 95 2 20 18 28 2101 17 %
If the industrial plant allows having a tolerance in the casting speed of about ± 0.2 m/s for 1 m/s
and a stand-off above 80 mm it is possible to individuate a condition that allows reducing the water
consumption. The configuration No 2, No 4, and the No 7 allow reducing the water consumption up
to 20 %. In the case of highest speed under the descaler, the best configuration is “A”. The others
determine higher total water flow rate. In the case of pre-cooling the total water flow rate should
be decreased up to 30 %.
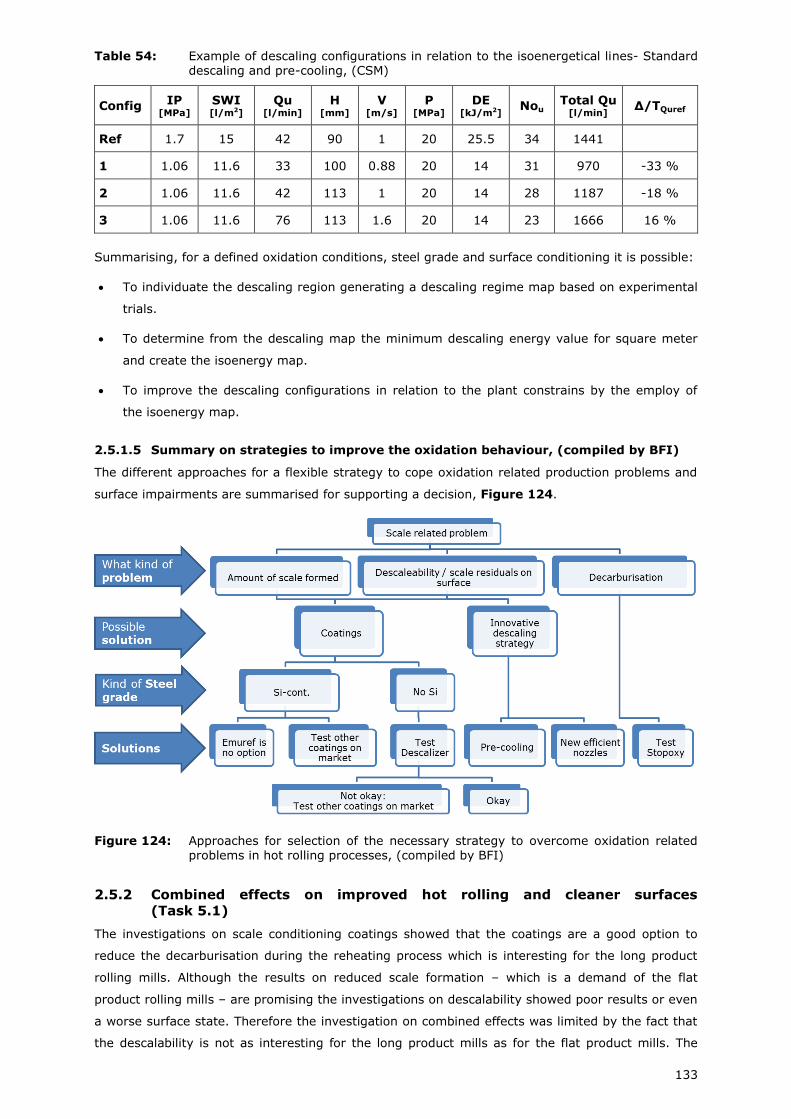
133
Table 54: Example of descaling configurations in relation to the isoenergetical lines- Standard descaling and pre-cooling, (CSM)
Config IP [MPa]
SWI [l/m2]
Qu [l/min]
H [mm]
V [m/s]
P [MPa]
DE [kJ/m2]
Nou Total Qu
[l/min] ∆/TQuref
Ref 1.7 15 42 90 1 20 25.5 34 1441
1 1.06 11.6 33 100 0.88 20 14 31 970 -33 %
2 1.06 11.6 42 113 1 20 14 28 1187 -18 %
3 1.06 11.6 76 113 1.6 20 14 23 1666 16 %
Summarising, for a defined oxidation conditions, steel grade and surface conditioning it is possible:
To individuate the descaling region generating a descaling regime map based on experimental
trials.
To determine from the descaling map the minimum descaling energy value for square meter
and create the isoenergy map.
To improve the descaling configurations in relation to the plant constrains by the employ of
the isoenergy map.
2.5.1.5 Summary on strategies to improve the oxidation behaviour, (compiled by BFI)
The different approaches for a flexible strategy to cope oxidation related production problems and
surface impairments are summarised for supporting a decision, Figure 124.
Figure 124: Approaches for selection of the necessary strategy to overcome oxidation related problems in hot rolling processes, (compiled by BFI)
2.5.2 Combined effects on improved hot rolling and cleaner surfaces
(Task 5.1)
The investigations on scale conditioning coatings showed that the coatings are a good option to
reduce the decarburisation during the reheating process which is interesting for the long product
rolling mills. Although the results on reduced scale formation – which is a demand of the flat
product rolling mills – are promising the investigations on descalability showed poor results or even
a worse surface state. Therefore the investigation on combined effects was limited by the fact that
the descalability is not as interesting for the long product mills as for the flat product mills. The
134
focus was on the compilation of modelling results and the validation of measuring indicators like
key production indicators and descaling regime maps.
2.5.2.1 Modelling results and their validation (compiled by BFI)
A major application of all models generated or enhanced throughout HiPerScale project is the
evaluation of the effect of coating on scale growth, scale characteristics and sub surface
degradation, e.g. that model of the oxidation of steel from CSM (2, 3) describes the evolution of
scale regarding its chemical structure over the time. The calculations are performed taking into
account the complete steel composition and the presence of pre-existing oxides, such as those
present in coatings applied to the steel. The comparison between model prediction and
experimental data of scale thickness and chemical structure confirms the reliability of the model.
Modelling (2, 5) demonstrated that the presence of silicon oxide in the coating increases the
amount of fayalite. This fact can reduce the oxidation at temperatures at which the fayalite is solid;
on the contrary at temperatures above the melting point of fayalite enhances the oxidation of steel.
Modelling allows reducing the number of experimental tests by simulating the effect of temperature
and composition of steel (study of scenarios and sensitivity analysis). Any model provides a
number of information, not easily obtainable without long and expensive investigations. Oxidation
models (1, 2, 3) calculate the concentration gradients of species in steel, such as carbon. Hence
the deep of the decarburised layer can be evaluated. This information is essential to both adjust
time and temperature of oxidative processes and to design the optimum descaling conditions, in
integration of the descaling maps. Therefore modelling is useful to support the design of coating
and, finally, the integration of information from the model with information about descalability can
help to better define descaling strategy without or even in presence of coatings. The major
application of the single models for HiPerScale is summarised in Figure 125. These are:
1) Inner oxidation (Tata): This model can be used for sub surface reaction of steel and its
compounds with oxygen. It is possible to consider steel structure like grain size.
2) Phase stability (CSM): This model is a valid tool for the evaluation of the combined effect of
steel composition and coating composition on the formation of scale structure, also when a scale
influencing coating is used.
3) Decarburisation and metallic loss (Sidenor / Tecnalia): That model enables the calculation
for metallic loss due to oxide formation and that of decarburisation depth. The benefit of using a
coating in combination with the heating curves can be estimated.
4) Pre-cooling (CSM): Temperature gradients from slab centre to scale surface before descaling
can be calculated, depending on steel and scale thickness, nozzle type, descaling speed, pre-
cooling conditions and distance of that to descaler.
5) Scale morphology and pre-cooling (BFI): Temperature gradients can be calculated like
described above, with the special consideration of the thermal and mechanical properties of
steel and scale depending on temperature and scale porosity. The result is crack growth rates.
6) Blister formation (Mefos): Depending on steel grade, atmosphere and temperature the blister
formation can be predicted.
7) Nozzle optimisation and steel grade dependent descaling (BUT): The impact
measurement and calculation of the HTC can be used to further develop the nozzles and
improve the steel grade dependent descaling process.
8) Stress distribution due to impact (BFI): Stress distribution within scale layer due to cooling
and impact load can be simulated.
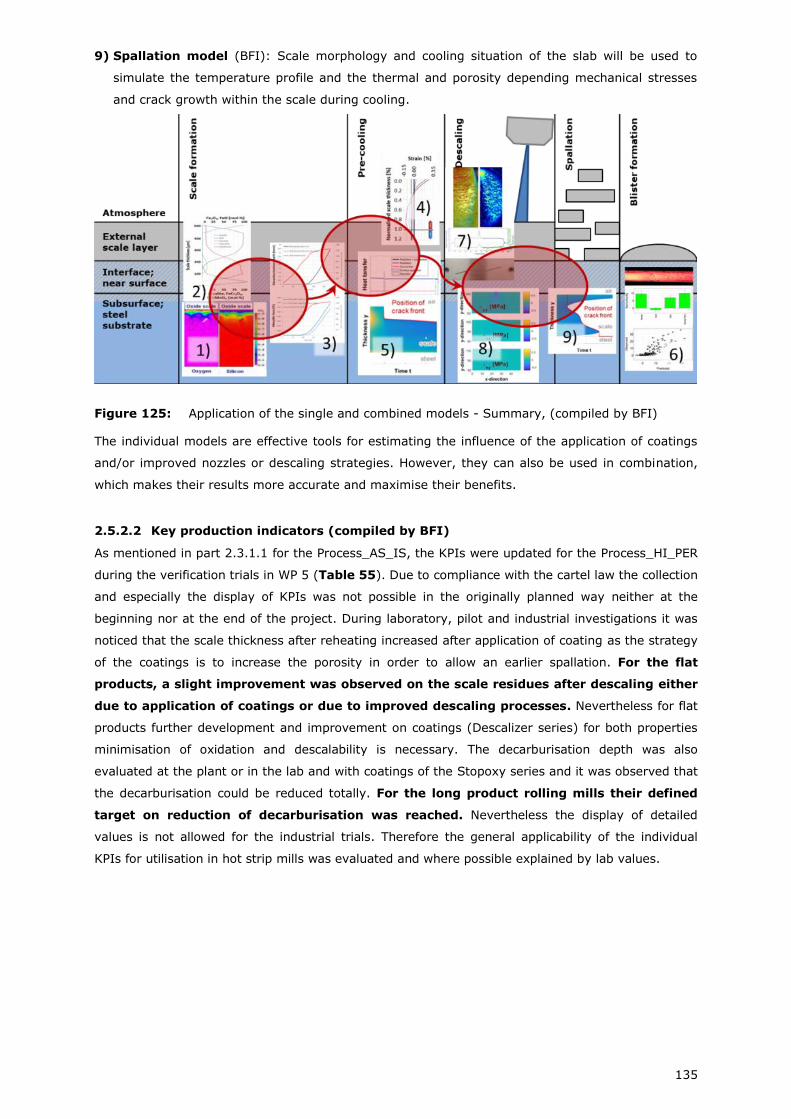
135
9) Spallation model (BFI): Scale morphology and cooling situation of the slab will be used to
simulate the temperature profile and the thermal and porosity depending mechanical stresses
and crack growth within the scale during cooling.
Figure 125: Application of the single and combined models - Summary, (compiled by BFI)
The individual models are effective tools for estimating the influence of the application of coatings
and/or improved nozzles or descaling strategies. However, they can also be used in combination,
which makes their results more accurate and maximise their benefits.
2.5.2.2 Key production indicators (compiled by BFI)
As mentioned in part 2.3.1.1 for the Process_AS_IS, the KPIs were updated for the Process_HI_PER
during the verification trials in WP 5 (Table 55). Due to compliance with the cartel law the collection
and especially the display of KPIs was not possible in the originally planned way neither at the
beginning nor at the end of the project. During laboratory, pilot and industrial investigations it was
noticed that the scale thickness after reheating increased after application of coating as the strategy
of the coatings is to increase the porosity in order to allow an earlier spallation. For the flat
products, a slight improvement was observed on the scale residues after descaling either
due to application of coatings or due to improved descaling processes. Nevertheless for flat
products further development and improvement on coatings (Descalizer series) for both properties
minimisation of oxidation and descalability is necessary. The decarburisation depth was also
evaluated at the plant or in the lab and with coatings of the Stopoxy series and it was observed that
the decarburisation could be reduced totally. For the long product rolling mills their defined
target on reduction of decarburisation was reached. Nevertheless the display of detailed
values is not allowed for the industrial trials. Therefore the general applicability of the individual
KPIs for utilisation in hot strip mills was evaluated and where possible explained by lab values.
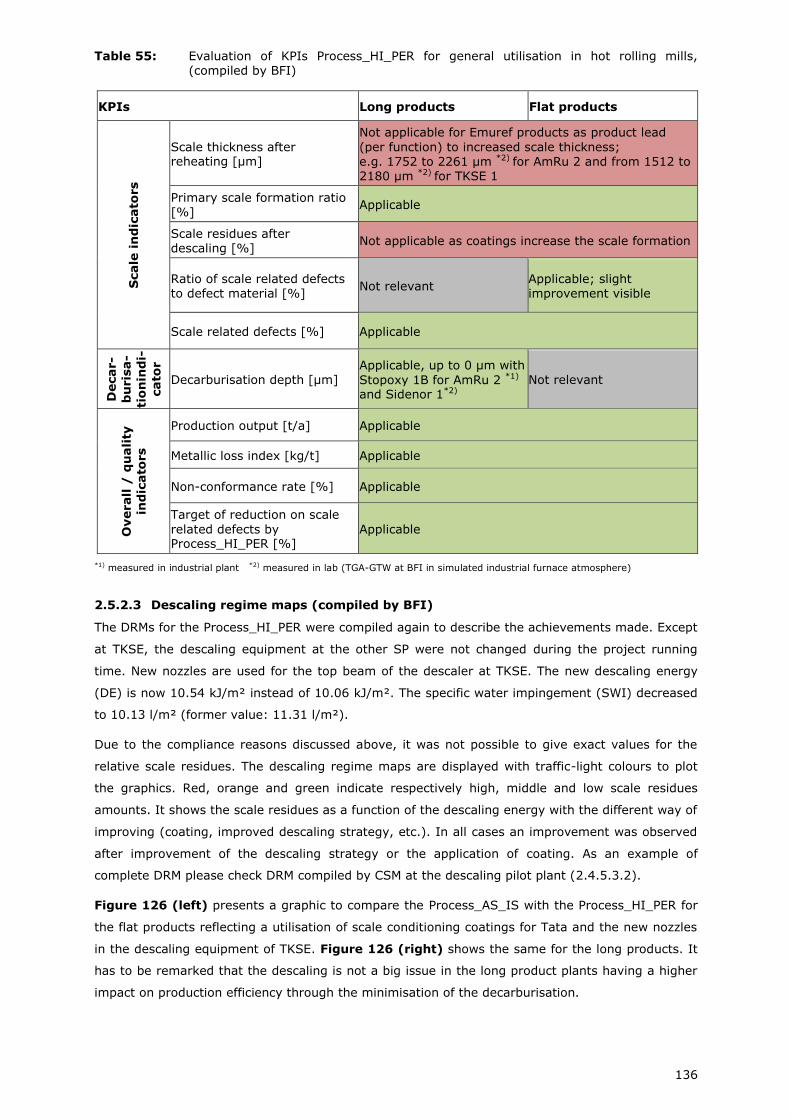
136
Table 55: Evaluation of KPIs Process_HI_PER for general utilisation in hot rolling mills, (compiled by BFI)
KPIs Long products Flat products
Scale
in
dic
ato
rs
Scale thickness after reheating [µm]
Not applicable for Emuref products as product lead
(per function) to increased scale thickness; e.g. 1752 to 2261 µm *2) for AmRu 2 and from 1512 to 2180 µm *2) for TKSE 1
Primary scale formation ratio [%]
Applicable
Scale residues after descaling [%]
Not applicable as coatings increase the scale formation
Ratio of scale related defects to defect material [%]
Not relevant Applicable; slight improvement visible
Scale related defects [%] Applicable
Decar-
bu
ris
a-
tio
nin
di-
cato
r
Decarburisation depth [µm] Applicable, up to 0 µm with
Stopoxy 1B for AmRu 2 *1) and Sidenor 1*2)
Not relevant
Overall
/ q
uali
ty
ind
icato
rs
Production output [t/a] Applicable
Metallic loss index [kg/t] Applicable
Non-conformance rate [%] Applicable
Target of reduction on scale
related defects by Process_HI_PER [%]
Applicable
*1) measured in industrial plant *2) measured in lab (TGA-GTW at BFI in simulated industrial furnace atmosphere)
2.5.2.3 Descaling regime maps (compiled by BFI)
The DRMs for the Process_HI_PER were compiled again to describe the achievements made. Except
at TKSE, the descaling equipment at the other SP were not changed during the project running
time. New nozzles are used for the top beam of the descaler at TKSE. The new descaling energy
(DE) is now 10.54 kJ/m² instead of 10.06 kJ/m². The specific water impingement (SWI) decreased
to 10.13 l/m² (former value: 11.31 l/m²).
Due to the compliance reasons discussed above, it was not possible to give exact values for the
relative scale residues. The descaling regime maps are displayed with traffic-light colours to plot
the graphics. Red, orange and green indicate respectively high, middle and low scale residues
amounts. It shows the scale residues as a function of the descaling energy with the different way of
improving (coating, improved descaling strategy, etc.). In all cases an improvement was observed
after improvement of the descaling strategy or the application of coating. As an example of
complete DRM please check DRM compiled by CSM at the descaling pilot plant (2.4.5.3.2).
Figure 126 (left) presents a graphic to compare the Process_AS_IS with the Process_HI_PER for
the flat products reflecting a utilisation of scale conditioning coatings for Tata and the new nozzles
in the descaling equipment of TKSE. Figure 126 (right) shows the same for the long products. It
has to be remarked that the descaling is not a big issue in the long product plants having a higher
impact on production efficiency through the minimisation of the decarburisation.
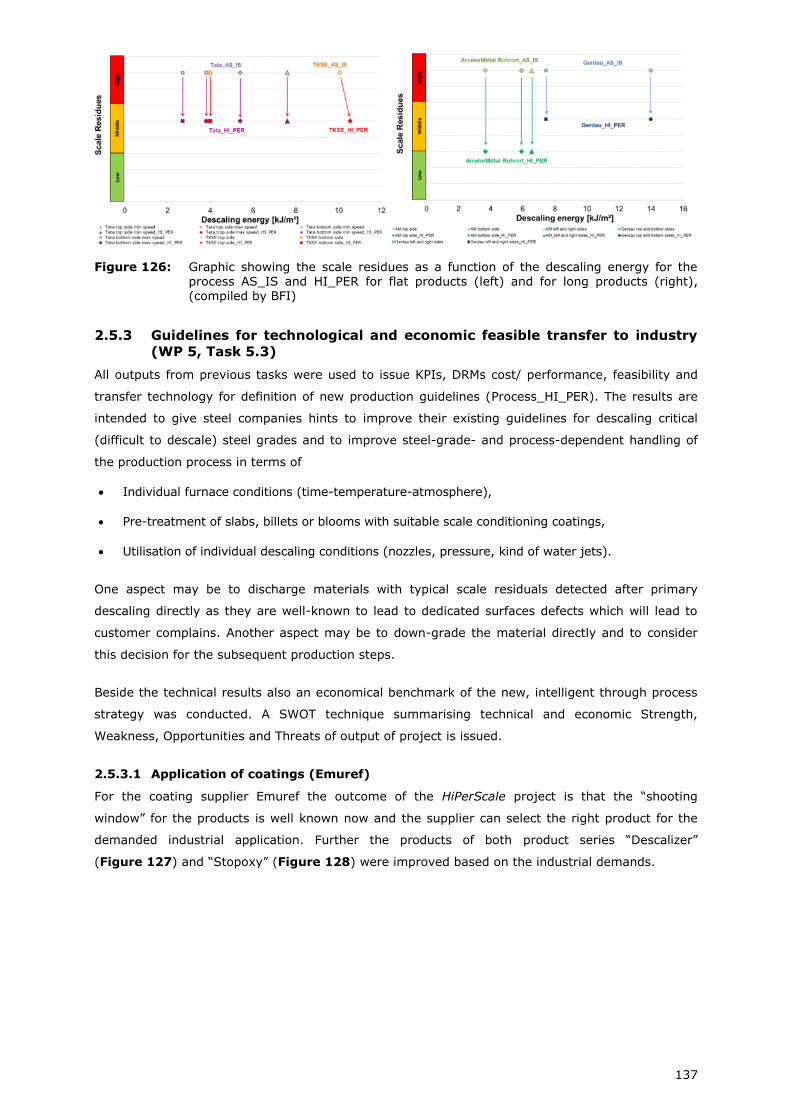
137
Figure 126: Graphic showing the scale residues as a function of the descaling energy for the process AS_IS and HI_PER for flat products (left) and for long products (right), (compiled by BFI)
2.5.3 Guidelines for technological and economic feasible transfer to industry
(WP 5, Task 5.3)
All outputs from previous tasks were used to issue KPIs, DRMs cost/ performance, feasibility and
transfer technology for definition of new production guidelines (Process_HI_PER). The results are
intended to give steel companies hints to improve their existing guidelines for descaling critical
(difficult to descale) steel grades and to improve steel-grade- and process-dependent handling of
the production process in terms of
Individual furnace conditions (time-temperature-atmosphere),
Pre-treatment of slabs, billets or blooms with suitable scale conditioning coatings,
Utilisation of individual descaling conditions (nozzles, pressure, kind of water jets).
One aspect may be to discharge materials with typical scale residuals detected after primary
descaling directly as they are well-known to lead to dedicated surfaces defects which will lead to
customer complains. Another aspect may be to down-grade the material directly and to consider
this decision for the subsequent production steps.
Beside the technical results also an economical benchmark of the new, intelligent through process
strategy was conducted. A SWOT technique summarising technical and economic Strength,
Weakness, Opportunities and Threats of output of project is issued.
2.5.3.1 Application of coatings (Emuref)
For the coating supplier Emuref the outcome of the HiPerScale project is that the “shooting
window” for the products is well known now and the supplier can select the right product for the
demanded industrial application. Further the products of both product series “Descalizer”
(Figure 127) and “Stopoxy” (Figure 128) were improved based on the industrial demands.
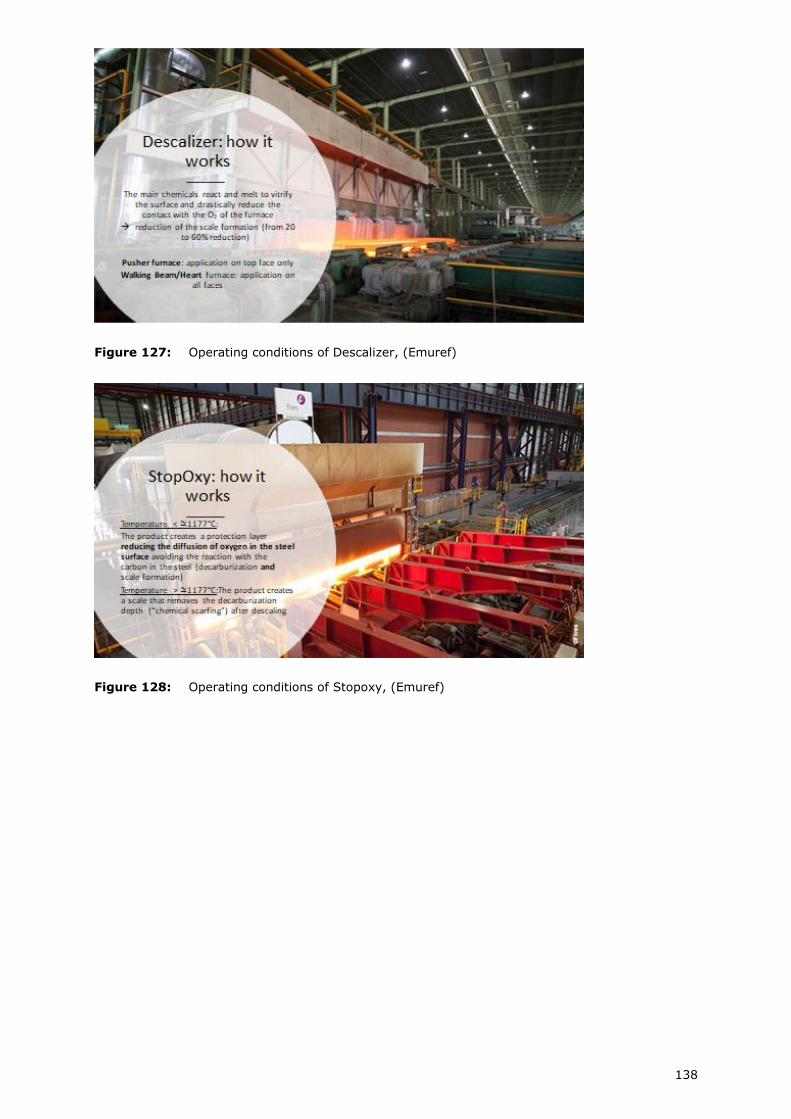
138
Figure 127: Operating conditions of Descalizer, (Emuref)
Figure 128: Operating conditions of Stopoxy, (Emuref)
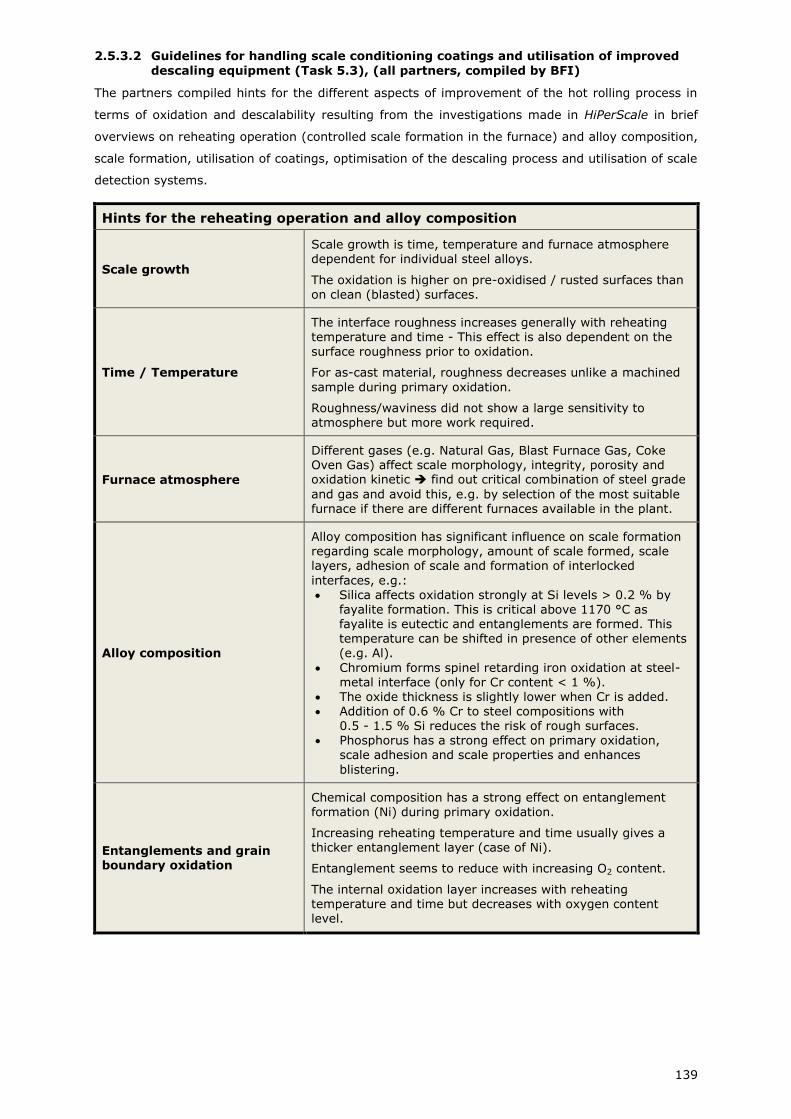
139
2.5.3.2 Guidelines for handling scale conditioning coatings and utilisation of improved
descaling equipment (Task 5.3), (all partners, compiled by BFI)
The partners compiled hints for the different aspects of improvement of the hot rolling process in
terms of oxidation and descalability resulting from the investigations made in HiPerScale in brief
overviews on reheating operation (controlled scale formation in the furnace) and alloy composition,
scale formation, utilisation of coatings, optimisation of the descaling process and utilisation of scale
detection systems.
Hints for the reheating operation and alloy composition
Scale growth
Scale growth is time, temperature and furnace atmosphere dependent for individual steel alloys.
The oxidation is higher on pre-oxidised / rusted surfaces than on clean (blasted) surfaces.
Time / Temperature
The interface roughness increases generally with reheating temperature and time - This effect is also dependent on the
surface roughness prior to oxidation.
For as-cast material, roughness decreases unlike a machined
sample during primary oxidation.
Roughness/waviness did not show a large sensitivity to atmosphere but more work required.
Furnace atmosphere
Different gases (e.g. Natural Gas, Blast Furnace Gas, Coke Oven Gas) affect scale morphology, integrity, porosity and oxidation kinetic find out critical combination of steel grade
and gas and avoid this, e.g. by selection of the most suitable furnace if there are different furnaces available in the plant.
Alloy composition
Alloy composition has significant influence on scale formation regarding scale morphology, amount of scale formed, scale layers, adhesion of scale and formation of interlocked
interfaces, e.g.:
Silica affects oxidation strongly at Si levels > 0.2 % by fayalite formation. This is critical above 1170 °C as fayalite is eutectic and entanglements are formed. This temperature can be shifted in presence of other elements (e.g. Al).
Chromium forms spinel retarding iron oxidation at steel-metal interface (only for Cr content < 1 %).
The oxide thickness is slightly lower when Cr is added. Addition of 0.6 % Cr to steel compositions with
0.5 - 1.5 % Si reduces the risk of rough surfaces. Phosphorus has a strong effect on primary oxidation,
scale adhesion and scale properties and enhances
blistering.
Entanglements and grain boundary oxidation
Chemical composition has a strong effect on entanglement formation (Ni) during primary oxidation.
Increasing reheating temperature and time usually gives a thicker entanglement layer (case of Ni).
Entanglement seems to reduce with increasing O2 content.
The internal oxidation layer increases with reheating temperature and time but decreases with oxygen content level.
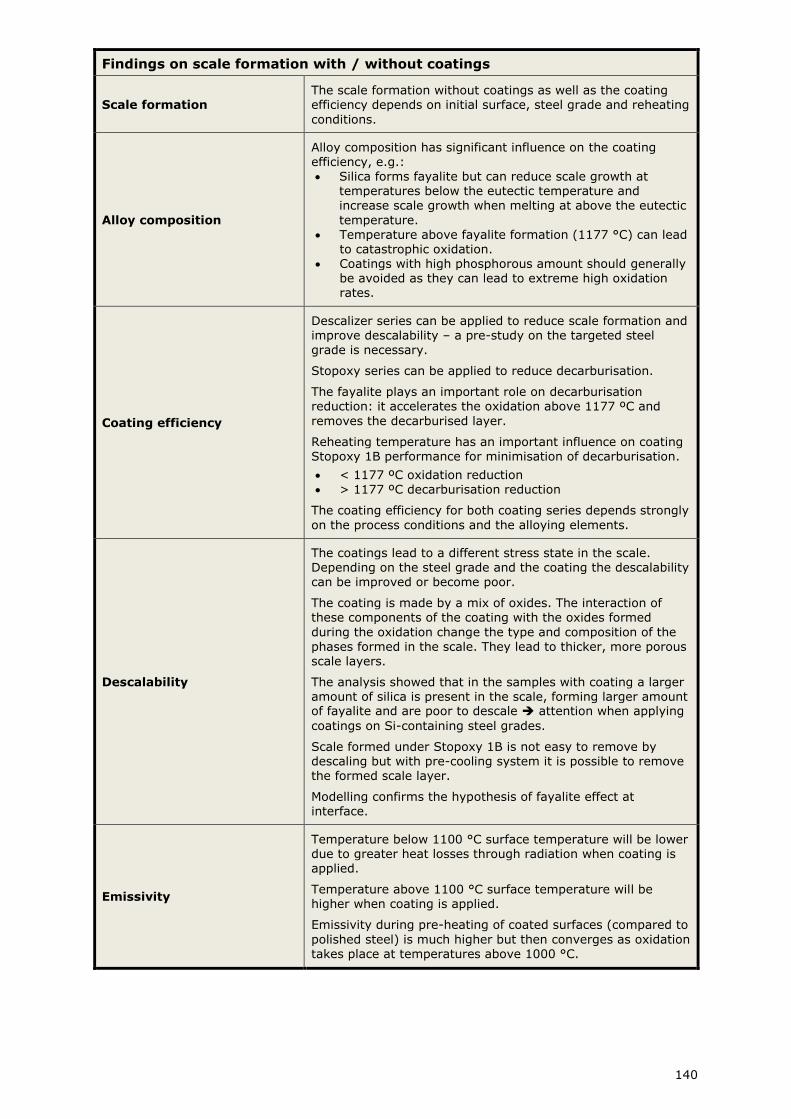
140
Findings on scale formation with / without coatings
Scale formation The scale formation without coatings as well as the coating efficiency depends on initial surface, steel grade and reheating
conditions.
Alloy composition
Alloy composition has significant influence on the coating efficiency, e.g.: Silica forms fayalite but can reduce scale growth at
temperatures below the eutectic temperature and increase scale growth when melting at above the eutectic
temperature. Temperature above fayalite formation (1177 °C) can lead
to catastrophic oxidation. Coatings with high phosphorous amount should generally
be avoided as they can lead to extreme high oxidation rates.
Coating efficiency
Descalizer series can be applied to reduce scale formation and improve descalability – a pre-study on the targeted steel
grade is necessary.
Stopoxy series can be applied to reduce decarburisation.
The fayalite plays an important role on decarburisation reduction: it accelerates the oxidation above 1177 ºC and
removes the decarburised layer.
Reheating temperature has an important influence on coating Stopoxy 1B performance for minimisation of decarburisation.
< 1177 ºC oxidation reduction > 1177 ºC decarburisation reduction
The coating efficiency for both coating series depends strongly
on the process conditions and the alloying elements.
Descalability
The coatings lead to a different stress state in the scale. Depending on the steel grade and the coating the descalability can be improved or become poor.
The coating is made by a mix of oxides. The interaction of these components of the coating with the oxides formed
during the oxidation change the type and composition of the phases formed in the scale. They lead to thicker, more porous scale layers.
The analysis showed that in the samples with coating a larger amount of silica is present in the scale, forming larger amount of fayalite and are poor to descale attention when applying
coatings on Si-containing steel grades.
Scale formed under Stopoxy 1B is not easy to remove by descaling but with pre-cooling system it is possible to remove the formed scale layer.
Modelling confirms the hypothesis of fayalite effect at interface.
Emissivity
Temperature below 1100 °C surface temperature will be lower due to greater heat losses through radiation when coating is applied.
Temperature above 1100 °C surface temperature will be higher when coating is applied.
Emissivity during pre-heating of coated surfaces (compared to
polished steel) is much higher but then converges as oxidation takes place at temperatures above 1000 °C.
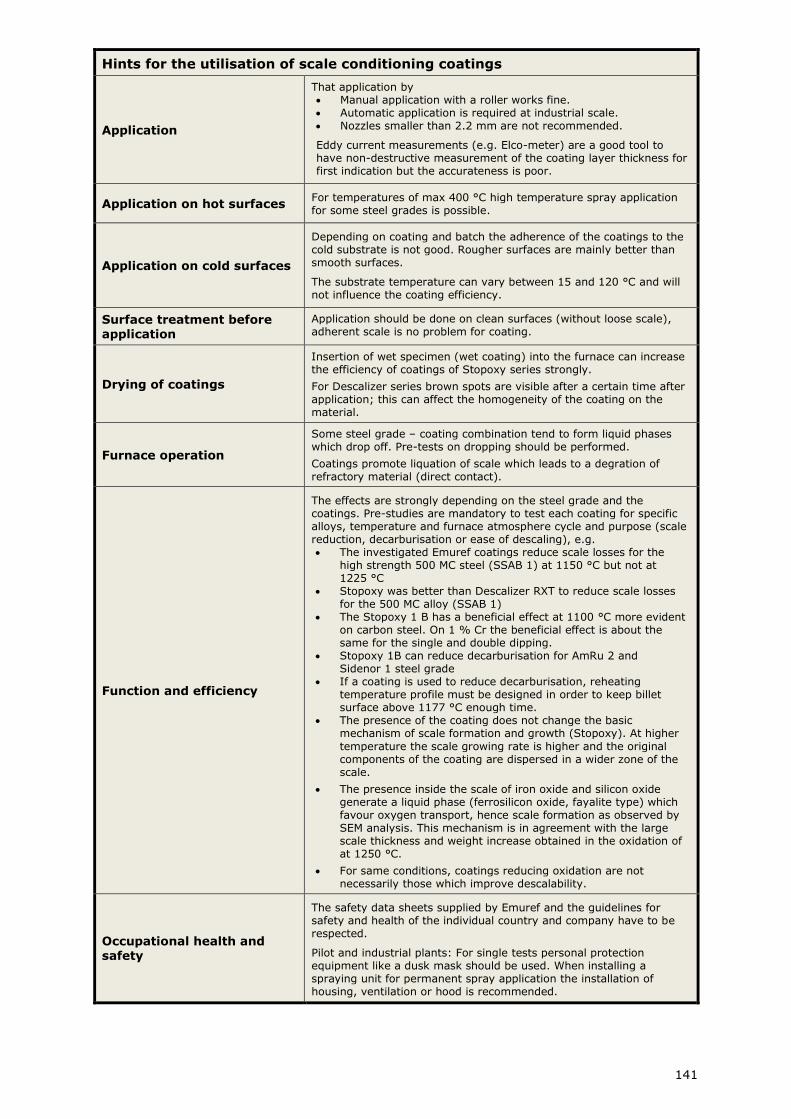
141
Hints for the utilisation of scale conditioning coatings
Application
That application by Manual application with a roller works fine. Automatic application is required at industrial scale. Nozzles smaller than 2.2 mm are not recommended.
Eddy current measurements (e.g. Elco-meter) are a good tool to have non-destructive measurement of the coating layer thickness for first indication but the accurateness is poor.
Application on hot surfaces For temperatures of max 400 °C high temperature spray application for some steel grades is possible.
Application on cold surfaces
Depending on coating and batch the adherence of the coatings to the cold substrate is not good. Rougher surfaces are mainly better than smooth surfaces.
The substrate temperature can vary between 15 and 120 °C and will not influence the coating efficiency.
Surface treatment before application
Application should be done on clean surfaces (without loose scale), adherent scale is no problem for coating.
Drying of coatings
Insertion of wet specimen (wet coating) into the furnace can increase the efficiency of coatings of Stopoxy series strongly.
For Descalizer series brown spots are visible after a certain time after application; this can affect the homogeneity of the coating on the material.
Furnace operation
Some steel grade – coating combination tend to form liquid phases which drop off. Pre-tests on dropping should be performed.
Coatings promote liquation of scale which leads to a degration of refractory material (direct contact).
Function and efficiency
The effects are strongly depending on the steel grade and the coatings. Pre-studies are mandatory to test each coating for specific alloys, temperature and furnace atmosphere cycle and purpose (scale reduction, decarburisation or ease of descaling), e.g. The investigated Emuref coatings reduce scale losses for the
high strength 500 MC steel (SSAB 1) at 1150 °C but not at 1225 °C
Stopoxy was better than Descalizer RXT to reduce scale losses for the 500 MC alloy (SSAB 1)
The Stopoxy 1 B has a beneficial effect at 1100 °C more evident on carbon steel. On 1 % Cr the beneficial effect is about the same for the single and double dipping.
Stopoxy 1B can reduce decarburisation for AmRu 2 and Sidenor 1 steel grade
If a coating is used to reduce decarburisation, reheating temperature profile must be designed in order to keep billet surface above 1177 °C enough time.
The presence of the coating does not change the basic mechanism of scale formation and growth (Stopoxy). At higher
temperature the scale growing rate is higher and the original components of the coating are dispersed in a wider zone of the scale.
The presence inside the scale of iron oxide and silicon oxide generate a liquid phase (ferrosilicon oxide, fayalite type) which favour oxygen transport, hence scale formation as observed by SEM analysis. This mechanism is in agreement with the large scale thickness and weight increase obtained in the oxidation of at 1250 °C.
For same conditions, coatings reducing oxidation are not necessarily those which improve descalability.
Occupational health and safety
The safety data sheets supplied by Emuref and the guidelines for safety and health of the individual country and company have to be respected.
Pilot and industrial plants: For single tests personal protection equipment like a dusk mask should be used. When installing a spraying unit for permanent spray application the installation of housing, ventilation or hood is recommended.
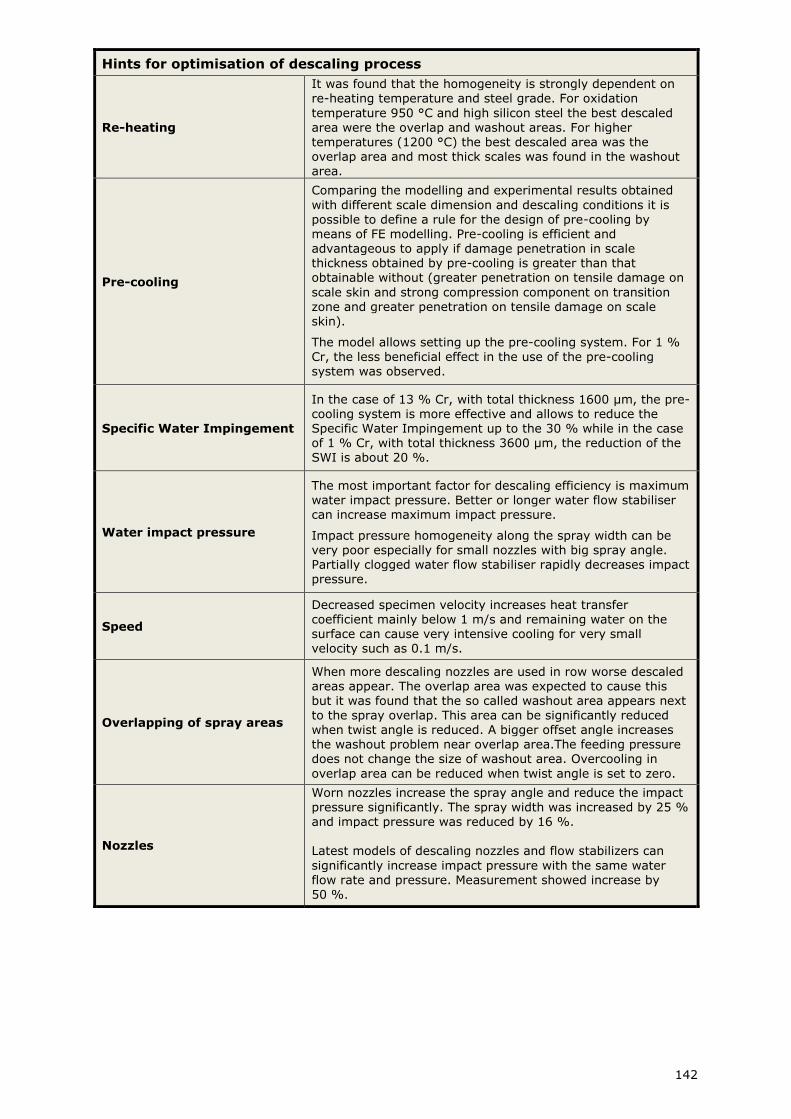
142
Hints for optimisation of descaling process
Re-heating
It was found that the homogeneity is strongly dependent on re-heating temperature and steel grade. For oxidation
temperature 950 °C and high silicon steel the best descaled
area were the overlap and washout areas. For higher temperatures (1200 °C) the best descaled area was the overlap area and most thick scales was found in the washout area.
Pre-cooling
Comparing the modelling and experimental results obtained
with different scale dimension and descaling conditions it is possible to define a rule for the design of pre-cooling by means of FE modelling. Pre-cooling is efficient and advantageous to apply if damage penetration in scale thickness obtained by pre-cooling is greater than that obtainable without (greater penetration on tensile damage on
scale skin and strong compression component on transition zone and greater penetration on tensile damage on scale skin).
The model allows setting up the pre-cooling system. For 1 %
Cr, the less beneficial effect in the use of the pre-cooling system was observed.
Specific Water Impingement
In the case of 13 % Cr, with total thickness 1600 µm, the pre-cooling system is more effective and allows to reduce the Specific Water Impingement up to the 30 % while in the case of 1 % Cr, with total thickness 3600 µm, the reduction of the SWI is about 20 %.
Water impact pressure
The most important factor for descaling efficiency is maximum water impact pressure. Better or longer water flow stabiliser can increase maximum impact pressure.
Impact pressure homogeneity along the spray width can be very poor especially for small nozzles with big spray angle. Partially clogged water flow stabiliser rapidly decreases impact pressure.
Speed
Decreased specimen velocity increases heat transfer coefficient mainly below 1 m/s and remaining water on the surface can cause very intensive cooling for very small velocity such as 0.1 m/s.
Overlapping of spray areas
When more descaling nozzles are used in row worse descaled areas appear. The overlap area was expected to cause this but it was found that the so called washout area appears next to the spray overlap. This area can be significantly reduced when twist angle is reduced. A bigger offset angle increases the washout problem near overlap area.The feeding pressure does not change the size of washout area. Overcooling in
overlap area can be reduced when twist angle is set to zero.
Nozzles
Worn nozzles increase the spray angle and reduce the impact pressure significantly. The spray width was increased by 25 % and impact pressure was reduced by 16 %.
Latest models of descaling nozzles and flow stabilizers can
significantly increase impact pressure with the same water flow rate and pressure. Measurement showed increase by 50 %.
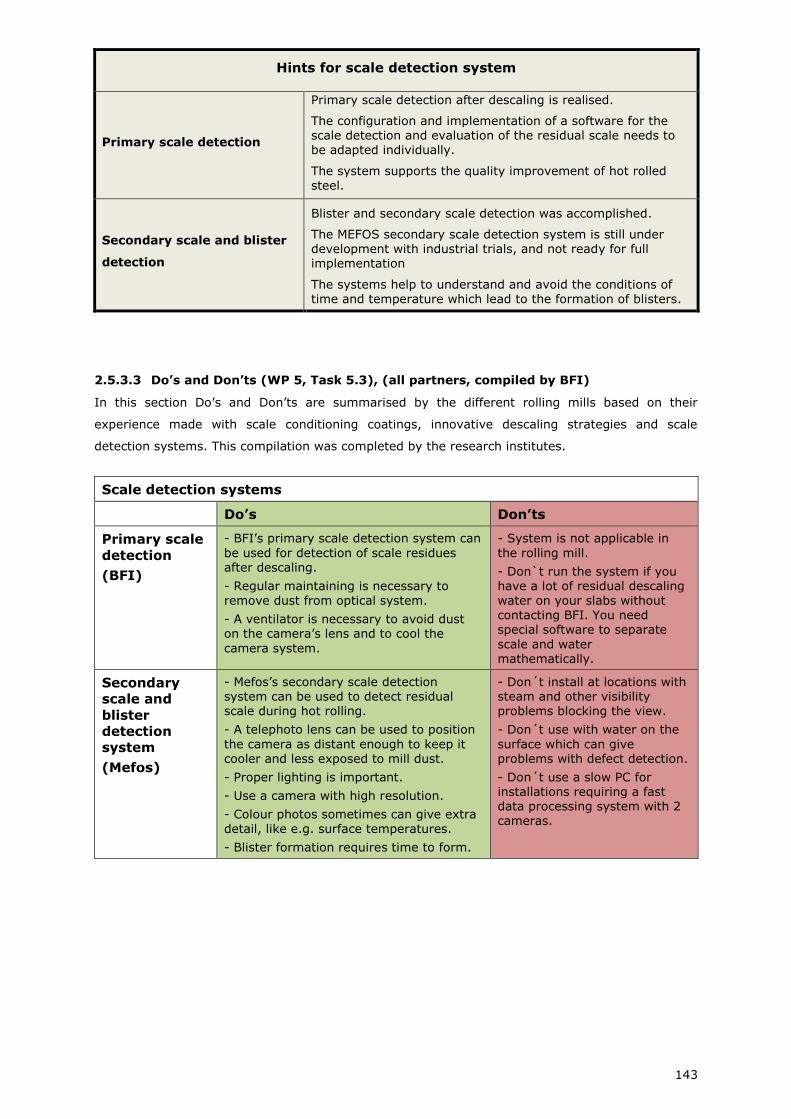
143
Hints for scale detection system
Primary scale detection
Primary scale detection after descaling is realised.
The configuration and implementation of a software for the scale detection and evaluation of the residual scale needs to be adapted individually.
The system supports the quality improvement of hot rolled steel.
Secondary scale and blister
detection
Blister and secondary scale detection was accomplished.
The MEFOS secondary scale detection system is still under development with industrial trials, and not ready for full implementation
The systems help to understand and avoid the conditions of time and temperature which lead to the formation of blisters.
2.5.3.3 Do’s and Don’ts (WP 5, Task 5.3), (all partners, compiled by BFI)
In this section Do’s and Don’ts are summarised by the different rolling mills based on their
experience made with scale conditioning coatings, innovative descaling strategies and scale
detection systems. This compilation was completed by the research institutes.
Scale detection systems
Do’s Don’ts
Primary scale
detection
(BFI)
- BFI’s primary scale detection system can
be used for detection of scale residues after descaling.
- Regular maintaining is necessary to
remove dust from optical system.
- A ventilator is necessary to avoid dust on the camera’s lens and to cool the
camera system.
- System is not applicable in
the rolling mill.
- Don`t run the system if you have a lot of residual descaling
water on your slabs without contacting BFI. You need special software to separate
scale and water mathematically.
Secondary
scale and
blister
detection
system
(Mefos)
- Mefos’s secondary scale detection system can be used to detect residual scale during hot rolling.
- A telephoto lens can be used to position
the camera as distant enough to keep it cooler and less exposed to mill dust.
- Proper lighting is important.
- Use a camera with high resolution.
- Colour photos sometimes can give extra
detail, like e.g. surface temperatures.
- Blister formation requires time to form.
- Don´t install at locations with steam and other visibility problems blocking the view.
- Don´t use with water on the
surface which can give problems with defect detection.
- Don´t use a slow PC for installations requiring a fast data processing system with 2 cameras.
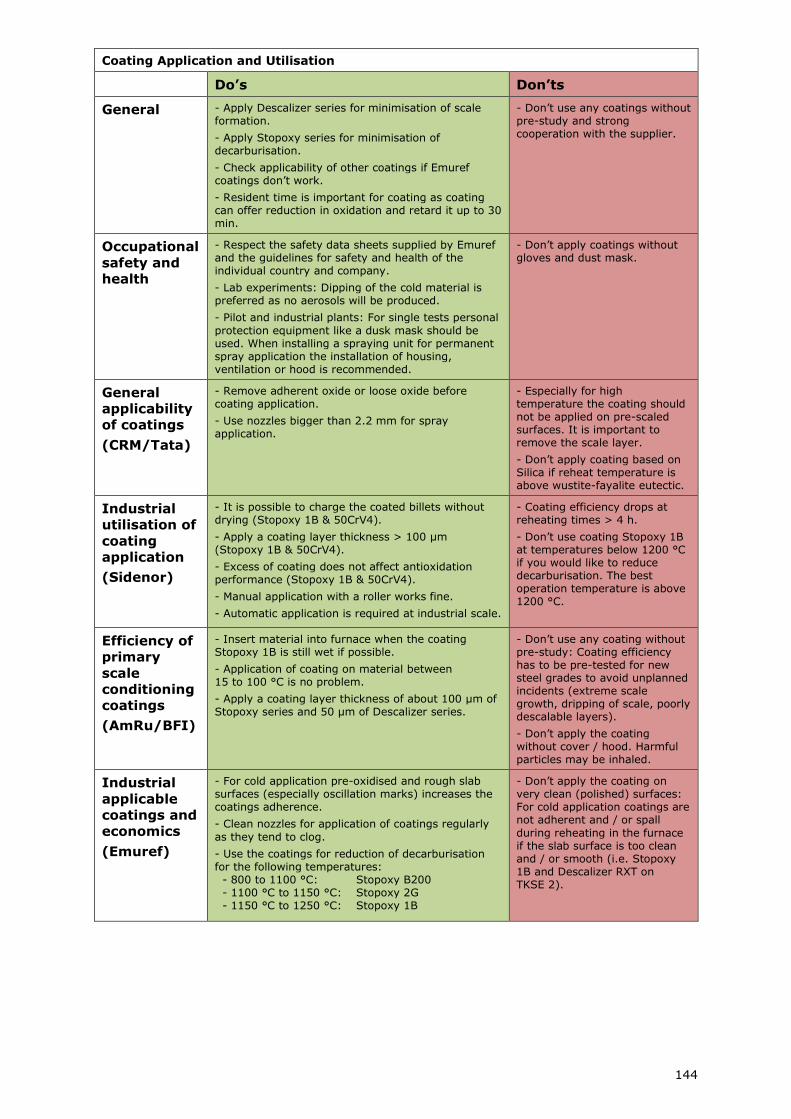
144
Coating Application and Utilisation
Do’s Don’ts
General - Apply Descalizer series for minimisation of scale formation.
- Apply Stopoxy series for minimisation of decarburisation.
- Check applicability of other coatings if Emuref coatings don’t work.
- Resident time is important for coating as coating can offer reduction in oxidation and retard it up to 30 min.
- Don’t use any coatings without pre-study and strong cooperation with the supplier.
Occupational
safety and
health
- Respect the safety data sheets supplied by Emuref and the guidelines for safety and health of the individual country and company.
- Lab experiments: Dipping of the cold material is preferred as no aerosols will be produced.
- Pilot and industrial plants: For single tests personal
protection equipment like a dusk mask should be used. When installing a spraying unit for permanent spray application the installation of housing, ventilation or hood is recommended.
- Don’t apply coatings without gloves and dust mask.
General
applicability
of coatings
(CRM/Tata)
- Remove adherent oxide or loose oxide before coating application.
- Use nozzles bigger than 2.2 mm for spray application.
- Especially for high temperature the coating should not be applied on pre-scaled surfaces. It is important to remove the scale layer.
- Don’t apply coating based on Silica if reheat temperature is above wustite-fayalite eutectic.
Industrial
utilisation of
coating
application
(Sidenor)
- It is possible to charge the coated billets without drying (Stopoxy 1B & 50CrV4).
- Apply a coating layer thickness > 100 µm (Stopoxy 1B & 50CrV4).
- Excess of coating does not affect antioxidation performance (Stopoxy 1B & 50CrV4).
- Manual application with a roller works fine.
- Automatic application is required at industrial scale.
- Coating efficiency drops at reheating times > 4 h.
- Don’t use coating Stopoxy 1B at temperatures below 1200 °C if you would like to reduce decarburisation. The best operation temperature is above 1200 °C.
Efficiency of
primary
scale
conditioning
coatings
(AmRu/BFI)
- Insert material into furnace when the coating Stopoxy 1B is still wet if possible.
- Application of coating on material between 15 to 100 °C is no problem.
- Apply a coating layer thickness of about 100 µm of Stopoxy series and 50 µm of Descalizer series.
- Don’t use any coating without pre-study: Coating efficiency has to be pre-tested for new steel grades to avoid unplanned incidents (extreme scale growth, dripping of scale, poorly descalable layers).
- Don’t apply the coating without cover / hood. Harmful particles may be inhaled.
Industrial
applicable
coatings and
economics
(Emuref)
- For cold application pre-oxidised and rough slab surfaces (especially oscillation marks) increases the coatings adherence.
- Clean nozzles for application of coatings regularly
as they tend to clog.
- Use the coatings for reduction of decarburisation for the following temperatures: - 800 to 1100 °C: Stopoxy B200 - 1100 °C to 1150 °C: Stopoxy 2G - 1150 °C to 1250 °C: Stopoxy 1B
- Don’t apply the coating on very clean (polished) surfaces: For cold application coatings are not adherent and / or spall
during reheating in the furnace if the slab surface is too clean and / or smooth (i.e. Stopoxy 1B and Descalizer RXT on TKSE 2).
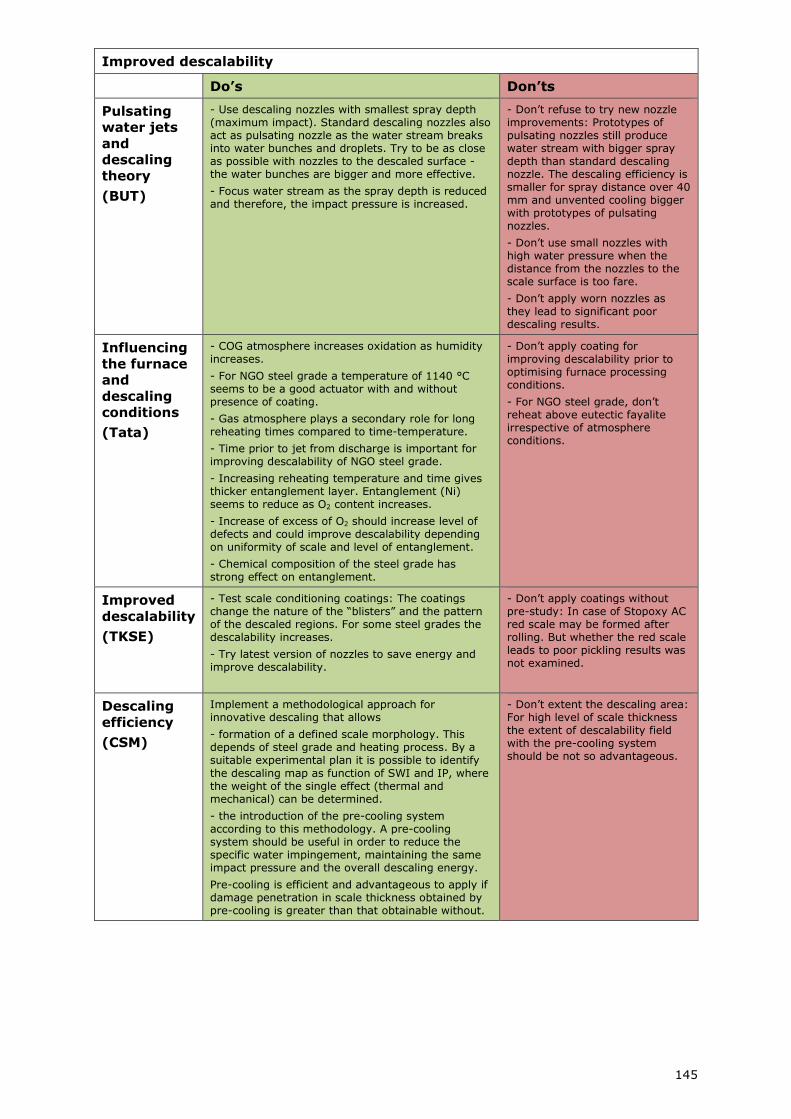
145
Improved descalability
Do’s Don’ts
Pulsating
water jets
and
descaling
theory
(BUT)
- Use descaling nozzles with smallest spray depth (maximum impact). Standard descaling nozzles also act as pulsating nozzle as the water stream breaks into water bunches and droplets. Try to be as close as possible with nozzles to the descaled surface - the water bunches are bigger and more effective.
- Focus water stream as the spray depth is reduced and therefore, the impact pressure is increased.
- Don’t refuse to try new nozzle improvements: Prototypes of pulsating nozzles still produce water stream with bigger spray depth than standard descaling nozzle. The descaling efficiency is smaller for spray distance over 40 mm and unvented cooling bigger with prototypes of pulsating nozzles.
- Don’t use small nozzles with high water pressure when the distance from the nozzles to the scale surface is too fare.
- Don’t apply worn nozzles as they lead to significant poor descaling results.
Influencing
the furnace
and
descaling
conditions
(Tata)
- COG atmosphere increases oxidation as humidity increases.
- For NGO steel grade a temperature of 1140 °C seems to be a good actuator with and without presence of coating.
- Gas atmosphere plays a secondary role for long reheating times compared to time-temperature.
- Time prior to jet from discharge is important for improving descalability of NGO steel grade.
- Increasing reheating temperature and time gives thicker entanglement layer. Entanglement (Ni) seems to reduce as O2 content increases.
- Increase of excess of O2 should increase level of defects and could improve descalability depending on uniformity of scale and level of entanglement.
- Chemical composition of the steel grade has strong effect on entanglement.
- Don’t apply coating for improving descalability prior to optimising furnace processing conditions.
- For NGO steel grade, don’t reheat above eutectic fayalite irrespective of atmosphere conditions.
Improved
descalability
(TKSE)
- Test scale conditioning coatings: The coatings change the nature of the “blisters” and the pattern of the descaled regions. For some steel grades the descalability increases.
- Try latest version of nozzles to save energy and improve descalability.
- Don’t apply coatings without pre-study: In case of Stopoxy AC red scale may be formed after rolling. But whether the red scale leads to poor pickling results was not examined.
Descaling
efficiency
(CSM)
Implement a methodological approach for innovative descaling that allows
- formation of a defined scale morphology. This depends of steel grade and heating process. By a suitable experimental plan it is possible to identify
the descaling map as function of SWI and IP, where the weight of the single effect (thermal and mechanical) can be determined.
- the introduction of the pre-cooling system according to this methodology. A pre-cooling system should be useful in order to reduce the specific water impingement, maintaining the same impact pressure and the overall descaling energy.
Pre-cooling is efficient and advantageous to apply if damage penetration in scale thickness obtained by pre-cooling is greater than that obtainable without.
- Don’t extent the descaling area: For high level of scale thickness the extent of descalability field with the pre-cooling system should be not so advantageous.
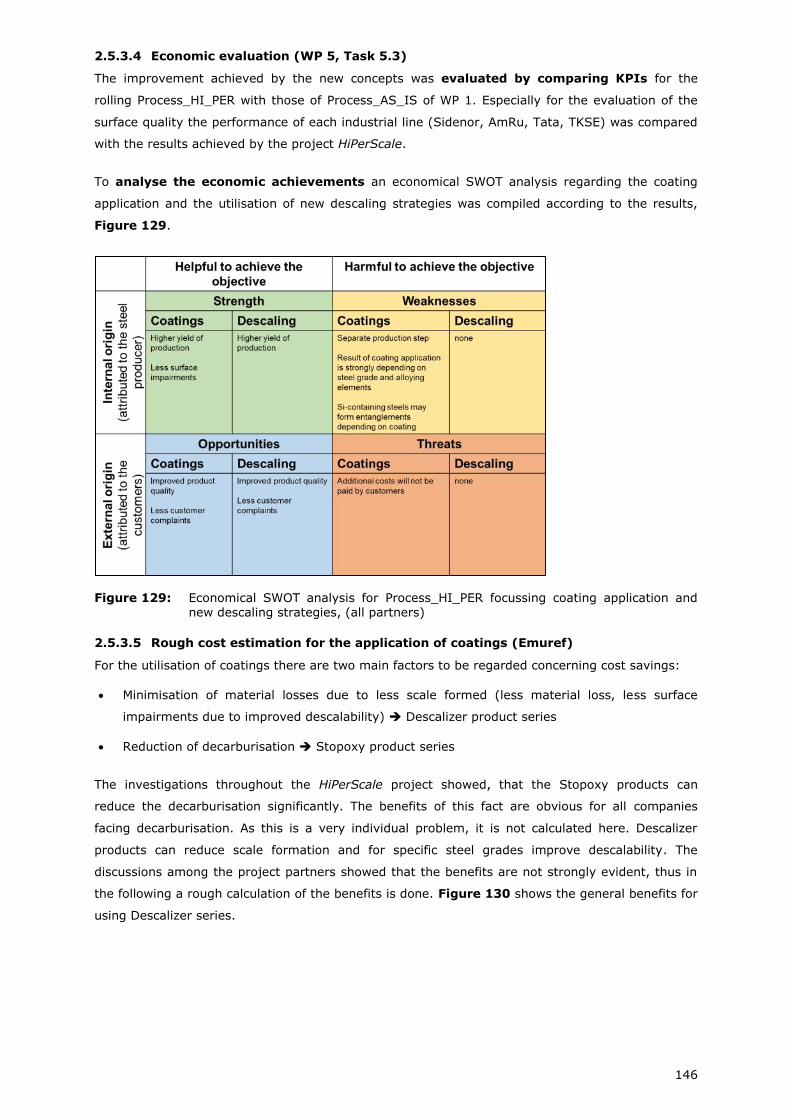
146
2.5.3.4 Economic evaluation (WP 5, Task 5.3)
The improvement achieved by the new concepts was evaluated by comparing KPIs for the
rolling Process_HI_PER with those of Process_AS_IS of WP 1. Especially for the evaluation of the
surface quality the performance of each industrial line (Sidenor, AmRu, Tata, TKSE) was compared
with the results achieved by the project HiPerScale.
To analyse the economic achievements an economical SWOT analysis regarding the coating
application and the utilisation of new descaling strategies was compiled according to the results,
Figure 129.
Figure 129: Economical SWOT analysis for Process_HI_PER focussing coating application and new descaling strategies, (all partners)
2.5.3.5 Rough cost estimation for the application of coatings (Emuref)
For the utilisation of coatings there are two main factors to be regarded concerning cost savings:
Minimisation of material losses due to less scale formed (less material loss, less surface
impairments due to improved descalability) Descalizer product series
Reduction of decarburisation Stopoxy product series
The investigations throughout the HiPerScale project showed, that the Stopoxy products can
reduce the decarburisation significantly. The benefits of this fact are obvious for all companies
facing decarburisation. As this is a very individual problem, it is not calculated here. Descalizer
products can reduce scale formation and for specific steel grades improve descalability. The
discussions among the project partners showed that the benefits are not strongly evident, thus in
the following a rough calculation of the benefits is done. Figure 130 shows the general benefits for
using Descalizer series.
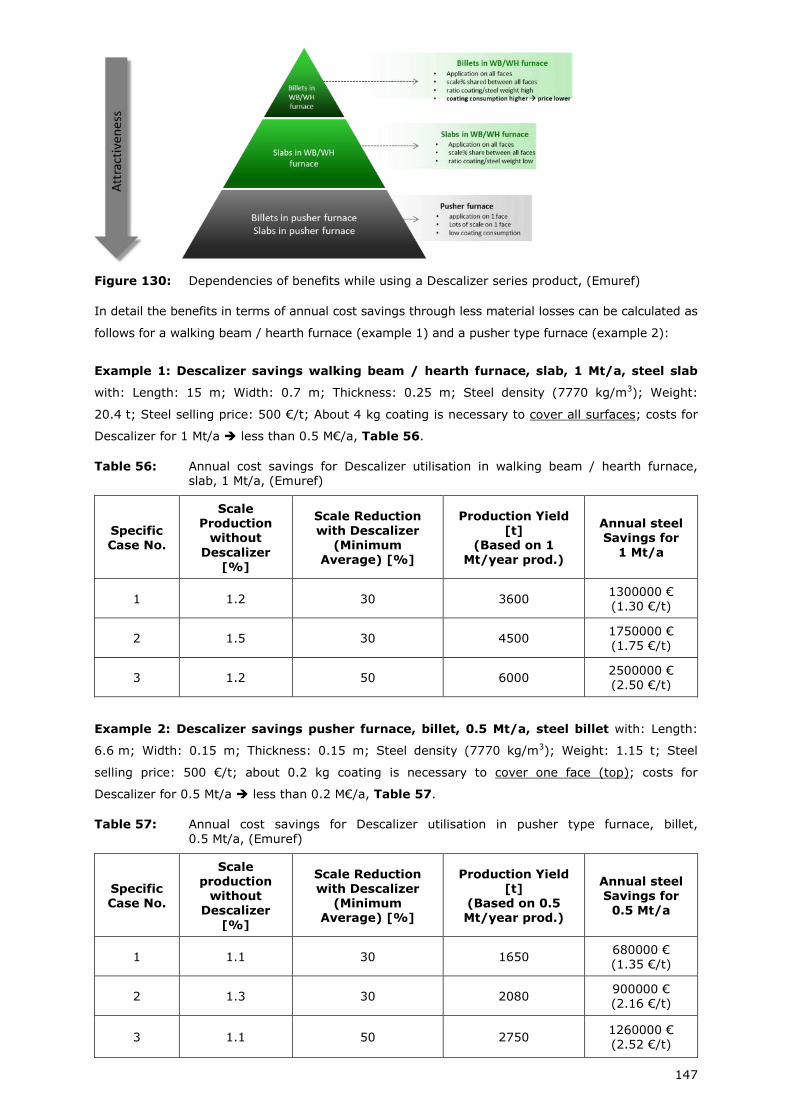
147
Figure 130: Dependencies of benefits while using a Descalizer series product, (Emuref)
In detail the benefits in terms of annual cost savings through less material losses can be calculated as
follows for a walking beam / hearth furnace (example 1) and a pusher type furnace (example 2):
Example 1: Descalizer savings walking beam / hearth furnace, slab, 1 Mt/a, steel slab
with: Length: 15 m; Width: 0.7 m; Thickness: 0.25 m; Steel density (7770 kg/m3); Weight:
20.4 t; Steel selling price: 500 €/t; About 4 kg coating is necessary to cover all surfaces; costs for
Descalizer for 1 Mt/a less than 0.5 M€/a, Table 56.
Table 56: Annual cost savings for Descalizer utilisation in walking beam / hearth furnace, slab, 1 Mt/a, (Emuref)
Specific Case No.
Scale Production
without
Descalizer [%]
Scale Reduction with Descalizer
(Minimum Average) [%]
Production Yield [t]
(Based on 1 Mt/year prod.)
Annual steel Savings for
1 Mt/a
1 1.2 30 3600 1300000 € (1.30 €/t)
2 1.5 30 4500 1750000 € (1.75 €/t)
3 1.2 50 6000 2500000 € (2.50 €/t)
Example 2: Descalizer savings pusher furnace, billet, 0.5 Mt/a, steel billet with: Length:
6.6 m; Width: 0.15 m; Thickness: 0.15 m; Steel density (7770 kg/m3); Weight: 1.15 t; Steel
selling price: 500 €/t; about 0.2 kg coating is necessary to cover one face (top); costs for
Descalizer for 0.5 Mt/a less than 0.2 M€/a, Table 57.
Table 57: Annual cost savings for Descalizer utilisation in pusher type furnace, billet,
0.5 Mt/a, (Emuref)
Specific Case No.
Scale production
without Descalizer
[%]
Scale Reduction with Descalizer
(Minimum Average) [%]
Production Yield [t]
(Based on 0.5 Mt/year prod.)
Annual steel Savings for
0.5 Mt/a
1 1.1 30 1650 680000 € (1.35 €/t)
2 1.3 30 2080 900000 € (2.16 €/t)
3 1.1 50 2750 1260000 € (2.52 €/t)
148
2.5.3.6 Rough cost estimation for new descaling nozzles (Lechler)
The cost savings for the installation of the new descaling nozzles in the descaler of the hot strip mill
of tkSE in the Bochum plant (2.5.1.3) were calculated by Lechler. There are 6 headers with 51
descaling nozzles. The installation of the new nozzles leads to the saving potentials as shown in
Table 58. For the calculation the following operation parameter were assumed: 300 annual
operation days; 535 g/KWh CO2 emissions; 0.07 €/kWh; 1.3 daily operating hours for the descaling
plant; 0.8 pump efficiency.
Table 58: Annual cost saving potentials for the exchanged descaling nozzles, (Lechler)
Parameter Saving potential [%] Annual Saving potential
Energy 6 44 MW/a
CO2 Emissions 6 24 t/a
Energy costs 6 3100 €/a
Water flow 6 436 l/min
2.5.4 Publications
Sartor, M.; Wunde, M.; Lemke, A.: Investigations on scale conditioning coatings for prevention of scale formation and influencing the descalability and / or the tribological system, Rolling 2016
(10th International Rolling Conference and the 7th European Rolling Conference), June 2016, Graz, Austria Niska, J; Sartor, M.; Wunde, M.; Goldblatt, Y.; Santisteban Mendive, V.: Protective Coatings for the
Stock in Steel Reheating Furnaces, Nordic Flame Days, 2017, October 2017, Stockholm, Sweden Sartor, M.; Wunde, M.: Bruchmechanische Charakterisierung von Zunderschichten auf wiedererwärmten Brammen nach einer definierten Abkühlung, Werkstoffwoche 2017, September 2017, Dresden, Germany
2.5.5 Seminar
On 23.11.2017 the seminar "Oxide formation and flexible descaling during steel processing"
(Figure 131) was held by BFI in cooperation with Steel Academy. More than 60 participants from
more than 10 countries attended the seminar (Figure 132).
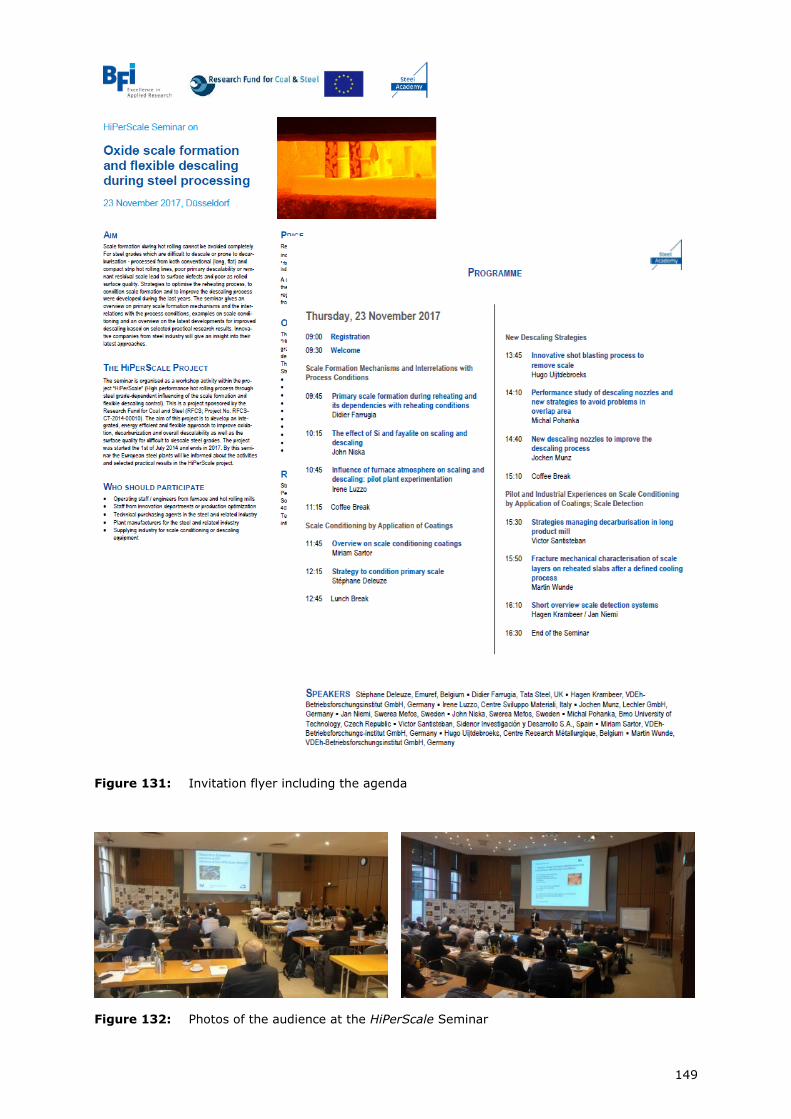
149
Figure 131: Invitation flyer including the agenda
Figure 132: Photos of the audience at the HiPerScale Seminar

150
151
List of Figures
Figure 1: Structure of the project HiPerScale, (compiled by BFI) 7
Figure 2: Structure of Work package 1 (SP = steel producer, RI = research
institute), (compiled by BFI) 7
Figure 3: Structure of work package 2, (compiled by BFI) 10
Figure 4: Overview on investigated coatings (names in brackets indicate the change of function and therefore the name due to the project results), (compiled by BFI) 12
Figure 5: Structure of WP 3, (compiled by BFI) 14
Figure 6: Structure of WP 4, (compiled by BFI) 15
Figure 7: Structure of WP 5, (compiled by BFI) 17
Figure 8: Definition of key static descaling parameters for compiling DRM, (Tata) 25
Figure 9: Example of graphic showing the scale residues as a function of the descaling energy with or without coating and after an optimisation of the descaling equipment, (compiled by BFI) 28
Figure 10: Example of the descaling system at TKSE at the hot rolling plant 3 in Bochum, (information supplied by SC Lechler) 29
Figure 11: Available TGA equipment for HiPerScale, (BFI, CSM, Sidenor, Tata, Mefos) 30
Figure 12: Typical weight/kinetics curve for progressive transient tests showing effect of gas atmosphere at key pedigree samples, (example, measured by Tata) 30
Figure 13: Varied oxidised surfaces following a DOE on mixed enriched gas composition and total resident time as well as initial surface state (left example), (Tata), Scale in a cross-section by optical microscope (right example), (BFI) 31
Figure 14: Heating equipment Misura® (left) and sample specimen inside furnace (right),
(Tata) 31
Figure 15: Misura® profile output for mixed coating Descalizer HT Emuref (50 %) with FeO (50 %) (left), Misura® sample profile pure coating Descalizer HT Emuref
(right), (Tata) 32
Figure 16: Specimen-holder with crucibles for four specimens, (BFI) 33
Figure 17: CCD-camera in a protective housing (ventilated) close after the primary descaler of the hot strip mill at TKSE Bochum (left) and at Tata pilot
(right), (BFI, TKSE, Tata) 37
Figure 18: User interface of the software tool for the statistical analysis of residual scale fragments remained on blooms (here: scale fragments after primary descaling), (BFI) 37
Figure 19: Secondary scale defect and blister detection system at SwereaMEFOS and SSAB 38
Figure 20: A comparison of 4 image processing techniques (left), Scale defect identification using the Gaussian algorithm (right), (Mefos) 38
Figure 21: Sample areas after hot coating application, reheating and descaling,
(CRM) 39
Figure 22: Test procedure for coating hot deposition and descaling, (CRM) 39
Figure 23: Example of the analysing procedure after cold deposition descaling test, (BFI) 39
Figure 24: Sample holder (left), illustration of inclination angle (middle) and resulting impinged area (right), (BFI) 40
Figure 25: Example of samples from TKSE 1 coated with Stopoxy 1B (brighter side) and notches to mark the coated side, (BFI) 40
Figure 26: Bending of a beam as a model for the bending of a steel strip [79] (left), the resistive heating system and a specimen during hot deformation (right), (Mefos) 41
Figure 27: Scheme of experimental apparatus (left), experimental apparatus (right) (BUT) 42
152
Figure 28: Equidistant spacing of impact measurement is 0.1 mm and 0.5 mm (left), Front view on the pressure distribution and explanation of computed parameters (right) (BUT) 43
Figure 29: Aluminium plate after erosion test (left), 3D scan of test plate (right),
(BUT) 44
Figure 30: Main characteristics of the erosion test (left), Definition of the middle section of the profile (right), (BUT) 44
Figure 31: Descaled surface by one nozzle after single pass under the nozzle (movement from left to right), (BUT) 47
Figure 32: Pressure distribution vs. erosion test, (BUT) 47
Figure 33: Structure (left) and velocity profile (right) of two colliding flat jets in the overlap area for offset angle 0°, (BUT) 47
Figure 34: Experimental stand used for tests with moving samples, (BUT) 48
Figure 35: Heat transfer coefficient measurement (left), Thermocouple positions for heat transfer coefficient measurement (right), (BUT) 48
Figure 36: Example of measured and computed data, (BUT) 49
Figure 37: Example of result of cooling homogeneity measurements and positions of
thermocouples, (BUT) 49
Figure 38: Cut sample and microscope analysis, (BUT) 50
Figure 39: Modelling Matrix for HiPerScale, (compiled by BFI) 51
Figure 40: Interlink between work package 3, 4 and the modelling tasks and the location of the models (or input of models) in this report, (compiled by BFI) 51
Figure 41: As-cast oxide NGO B24 (Tata 1) steel grade with complex steel primary scale-metal interface with Fayalite formation as well as internal oxidation and pegging, (Tata) 54
Figure 42: TGA results of weight gain (g/cm2) function of time and application of conditions including application of high temperature application scale conditioning coating, (Tata) 55
Figure 43: NGO B24 (Tata 1) scale morphology under two different atmospheres (NG
and COG), 2 % O2, 1160 oC, 280 minutes, (Tata) 55
Figure 44: Reheating and oxidation profiles of flat steel grade TKSE 1 measured in the thermogravimetric equipment TGA-GTW under simulated industrial flue gas atmosphere (left), Cross-section with scale morphology of TKSE 1 after oxidation test in TGA-GTW (right), (BFI) 56
Figure 45: Reheating and oxidation profiles of the steel grade AmRu 2 measured in the thermogravimetric equipment TGA-GTW under simulated industrial
flue gas atmosphere (left), Cross-section with scale morphology of AmRu 2 after oxidation test in TGA-GTW (right), (BFI) 57
Figure 46: Cross-section with scale morphology (left) and decarburisation (right) of AmRu 2 after industrial re-heating test, (BFI) 57
Figure 47: Oxidation in terms of weight gain (%) for different combinations of specimen surface condition, heating atmosphere and cooling atmosphere,
(Sidenor) 58
Figure 48: Comparison of initial surface – primary oxide – NGO B24 steel grade (Tata 1), (CRM) 59
Figure 49: Results of the screening tests on AmRu 2 and TKSE 1 regarding scale formation for various surface state; heated 30 minutes at 1200 °C, (BFI) 59
Figure 50: The top view (original-left; modified-right) exemplarily on slab No. 122 from furnace No. 1 at TKSE Bochum site. Discharging of this slab
corresponds with the lowest furnace temperatures during discharging (Tfurnace< 1250 °C), (BFI) 62
Figure 51: Temperature gradient within a cooled slab (left) and a cooled sheet (right), (BFI) 64
153
Figure 52: Region in scale where the fracture toughness KIC exceed the stress intensity factor KI on the uncoated material – example TKSE 1: slab (left) and sheet (right), (BFI) 64
Figure 53: Coating development and selection procedure – requirements on the
coatings (grey parameter were not investigated in HiPerScale), (compiled by BFI and Tata) 66
Figure 54: Production procedure for a prototype coating at Emuref (left), (BFI), Photo of the industrial mixing plant (right), (Emuref) 67
Figure 55: Coating thickness measurements by Elco-meter on plates, (CRM) 68
Figure 56: Coating thickness measurement in cross-section light-optical microscope
(LOM), (CRM) 68
Figure 57: Propagation paths for particles from the coatings during application, (adapted by BFI from [82], [81]) 69
Figure 58: Overview on investigated coatings, (compiled by BFI) 73
Figure 59: Decarburisation measured on the different steel grades for application of the Emuref coatings at 1200 °C, 2 h reheating time, (compiled by BFI) 74
Figure 60: Results of screening tests of different coatings on different steel grades at
1200 °C in air atmosphere or (simulated) flue gas, (compiled by BFI) 75
Figure 61: TGA results on effect of Descalizer RXT on scale reduction at different temperatures depending on different content of alloying elements of the steel, (compiled by Tata) 76
Figure 62: Effect of different coatings on scale reduction at different temperatures during TGA tests, the alloying elements are displayed together with
positive and negative effects on oxidation, (compiled by Tata) 77
Figure 63: Effect of different coatings at increasing reheating temperature (1120 to 1225 °C) function of alloying elements showing clear effect of Si and Cr function of coatings applied in reducing or otherwise oxidation, (compiled by Tata) 77
Figure 64: Effect of different coatings at increasing reheating temperature (1120 to 1225 °C) function of steel grades, (compiled by Tata) 77
Figure 65: Results of TGA measurements under isothermal conditions T = 1200 °C in simulated flue gas atmosphere with 2 % O2 (AmRu 2, measured by BFI); left: global; right: zoom 78
Figure 66: Results of TGA measurements under isothermal conditions T = 1200 °C in simulated flue gas atmosphere with 2 % O2 (TKSE 1, measured by BFI); left: global; right: zoom 78
Figure 67: SEM+EDX characterisation of coated specimen after heating, (CSM) 79
Figure 68: Summary [%] of scale formed when reheated at 1200 °C / 100 % is oxide formed on reference material without coating / Cr 0.06 % (left), Summary [%] of scale formed when reheated at 1200 °C / 100 % is oxide formed on reference material without coating / Cr 0.6 % (right), (CRM) 81
Figure 69: Thermocoupled reheating and cooling experiments using half coated NGO B24 blocks with spot welded thermocouples as well as separate T/C
dummy block and furnace control T/C, (Tata) 82
Figure 70: Examples of IR spectra derived from emissivity adjustment based on thermo-coupled temperature readings on steel surfaces, (Tata) 82
Figure 71: Distribution of oxidised phase as a function of distance from the steel/scale interface: Steel 1 (left), Steel 2 (right), (CSM) 86
Figure 72: Scale thickness and phase percentage in the scales in four cases simulated with the model, (Steel1; oxidation time: 1 hour; O2
concentration in the gas: 2%), (CSM) 87
Figure 73: Ceramic oxidation tests done at Tata 88
Figure 74: Bar chart showing relative tile weight gain function of reheating conditions, tile type and whether coating or no coating was present in contact with tile. Assumed 0.07 MPa constant contact (diffusion bonding) pressure, (Tata) 88
154
Figure 75: Surfaces after descaling the NGO B24 (Tata 1) for as-cast material surfaces - cold charged and reheated to 1160 °C / 4h 40min, (Tata) 90
Figure 76: Evolution of surface along the rolling trials, Example: TKSE 1, Stopoxy 1B,
150 minutes at 1250 °C, (TKSE/BFI) 95
Figure 77: Results of scale spallation model for TKSE 1 steel grade for Stopoxy 1 B (left), Stopoxy AC (middle) and Descalizer RXT (right), (BFI) 96
Figure 78: Mini-slab 22 with light coating of Descalizer RXT on one end before reheating and when charged into the chamber furnace, (Mefos) 97
Figure 79: Surfaces after primary descaling reheated at 1200 °C versus at 1260°C: For both temperatures the primary descaling was typically easier with
Descalizer RXT than Stopoxy 2G and even the edges outside of the high impact pressure region descaled with Descalizer RXT at 1260 °C, (Mefos) 97
Figure 80: Final surface quality for the 24 mm thick plates reheated at 1260°C, (Mefos) 98
Figure 81: The protective gas hood assembly which was used during hot rolling trials; an installation sketch is on the left side and a photo of the nitrogen supply header is on the right side, (Mefos) 98
Figure 82: Blister growth rates (based on area) on a hot steel strip, (Mefos) 99
Figure 83: Images of blisters from the trials with different final strip temperatures in the range of 920 °C to 1020 °C, (Mefos) 100
Figure 84: Scale and blister conditions at different target temperatures after 50 s, (Mefos) 100
Figure 85: Results of erosion tests on cold rolled aluminium sheets using the Lechler
Mini SCALEMASTER HPS - 6P3.495 with different test conditions, (BFI) 102
Figure 86: Simulated temperature and hardness of scale and composite layers over scale thickness, (BFI) 104
Figure 87: Simulated fracture toughness and stress intensity factor in scale at the point of descaling (left) and stress intensity factor of a weakened bending sample at different bending radius (middle) and bended and mounted sample (right), (BFI) 104
Figure 88: Lechler descaling nozzle with attached flow stabiliser 105
Figure 89: Shadowgraphy photo of the oscillating water jet from hydrodynamic nozzle with stabiliser at 5 MPa (left), 20 MPa (middle) and 40 MPa (right), (BUT) 106
Figure 90: Latest prototype of hydrodynamic nozzle and nozzle with attached stabiliser at exit, (BUT) 106
Figure 91: Erosion using hydrodynamic nozzle (top) and equivalent descaling nozzle
(bottom), (BUT) 107
Figure 92: Quality of descaling with respect to spray flatness (high silicon steel 1.2–1.6 %), (BUT) 108
Figure 93: Washout and overlap area after erosion test on moving aluminium plate, (BUT) 109
Figure 94: Heat transfer coefficients after descaling by two nozzles using offset angle
15° (left graph) and using in-line configuration with offset angle 0° (right graph), (BUT) 110
Figure 95: Surface temperature across test plate after descaling by two nozzles using offset angle 15° (black line) and using in-line configuration with offset angle 0°, (BUT) 110
Figure 96: The heat transfer coefficient curve as a position dependent value in the direction of plate movement, (BUT) 110
Figure 97: Remaining scales on AmRu 2 (Si1) steel descaled using 15 MPa impact pressure (upper: normal area; bottom: under formed blister), (BUT) 111
Figure 98: Layout of innovative descaling system, (CSM) 112
Figure 99: Critical elastic strain for the considered scale thickness, (CSM) 113
Figure 100: Sensitive analysis for scale thickness 2000 µm (critical elastic strain, strain and temperature on point N6), (CSM) 113
155
Figure 101: Elastic critical strain through scale thickness for scale thickness equal to 3200 µm, (CSM) 114
Figure 102: Erosion depth (E mm) as function of spray height (H mm) for
hydrodynamic nozzle and equivalent latest model standard descaling
nozzle, (BUT) 114
Figure 103: Primary scale for the examined steel grades, (CSM) 115
Figure 104: Residual scale for not descaling and fully descaling conditions, (CSM) 116
Figure 105: Descaling regime maps for the examined steel grades and relevant extent with pre-cooling system, (CSM) 117
Figure 106: Strip rolling line with the camera positions, one on each side of the rougher,
(Mefos) 120
Figure 107: Progression of scale status during rolling in the rougher for a strip with remaining scale in the head end, (Mefos), Image showing a slab with a poorly descaled front end after the primary descaling (left), The front end bend is due to the ski-down geometry (middle), The dark areas of primary scale are gone, the exposed surface appear hotter and cleaner than the other part of the strip where a thin layer of secondary scale has been
growing (right) 121
Figure 108: Progression of scale status during rolling in the rougher for a strip with primary scale left on the surface near the centre, (Mefos) 121
Figure 109: Example of rolled-in scale on slab having residual scale at the rear end. The rolled in scale appears as dark spots after pass 4, (Mefos) 122
Figure 110: Example of image analysis of the strip having areas where scale has
spalled off. The analysis can identify the hotter areas and the areas of remaining scale. The dark edge is misinterpreted as scale: Strip after pass 3 in the rougher (left), Prediction of areas using the image processing system (right), (Mefos) 122
Figure 111: Coating application plant at CRM Gent, (CRM) 123
Figure 112: Fully automated spraying machine for production free of charge or rented (annual fee) depending on the volumes of coating consumption (left:
manual for trials, middle: automated at large scale, right: automated for
production), (Emuref) 124
Figure 113: Industrial test No.1 at Sidenor Azkoitia rolling mill, (Sidenor) 125
Figure 114: Decarburisation, Industrial test No.1 at Sidenor Azkoitia rolling mill, (Sidenor) 126
Figure 115: Industrial test No. 2 at Sidenor Azkoitia rolling mill, (Sidenor) 126
Figure 116: Decarburisation, Industrial test No. 2 at Sidenor Azkoitia rolling mill,
(Sidenor) 126
Figure 117: Industrial test No. 3 at SidenorAzkoitia rolling mill, (Sidenor) 127
Figure 118: Decarburisation, Industrial test No. 3 at SidenorAzkoitia rolling mill (Sidenor) 127
Figure 119: Industrial test No. 4 at Sidenor Azkoitia rolling mill, (Sidenor) 128
Figure 120: Decarburisation, Industrial test No. 4 at SidenorAzkoitia rolling mill,
(Sidenor) 128
Figure 121: Results of the decarburisation (left) and metallic loss (right) model, (Sidenor, Tecnalia) 128
Figure 122: Frequency of classes of residual scale per picture, before (red) and after (green) nozzle change (left) and amount of pictures with residual scale less than a threshold value x (right), (BFI) 130
Figure 123: Descaling isoenergy lines in the descaling map: individuation of minimum
descaling energy- 1 % Cr steel grade (upper left), 13 % Cr steel grade (upper right), Hi SI steel grade (lower left), (CSM) 131
Figure 124: Approaches for selection of the necessary strategy to overcome oxidation related problems in hot rolling processes, (compiled by BFI) 133
Figure 125: Application of the single and combined models - Summary, (compiled by BFI) 135

156
Figure 126: Graphic showing the scale residues as a function of the descaling energy for the process AS_IS and HI_PER for flat products (left) and for long products (right), (compiled by BFI) 137
Figure 127: Operating conditions of Descalizer, (Emuref) 138
Figure 128: Operating conditions of Stopoxy, (Emuref) 138
Figure 129: Economical SWOT analysis for Process_HI_PER focussing coating application and new descaling strategies, (all partners) 146
Figure 130: Dependencies of benefits while using a Descalizer series product, (Emuref) 147
Figure 131: Invitation flyer including the agenda 149
Figure 132: Photos of the audience at the HiPerScale Seminar 149
157
List of Tables
Table 1: Overview on selected steel grades and oxidation related problems, (compiled by BFI) 8
Table 2: Overview on selected steel grades, material dimensions and furnace conditions, (compiled by BFI) 8
Table 3: Overview on descaling parameter and equipment at the steel producers, (compiled by BFI) 9
Table 4: Recommendations for usage of Descalizer and Stopoxy coatings, (Emuref) 13
Table 5: Selected KPIs Process_AS_IS, marked ones already exist in some plants
but either not determined continuously or covering other parameter than oxidation related issues, (discussed by all partners, compiled by BFI) 23
Table 6: Collected and measured KPIs Process_AS_IS, (SP) 24
Table 7: Analytical equations for HPW descaling, (Tata, BFI) 26
Table 8: Summary of inputs for descaling regime, (BFI) 28
Table 9: Procedure for screening tests, (BFI) 33
Table 10: Test parameter and interface characterisation, (Mefos) 34
Table 11: Test parameter and interface characterisation, (CRM) 35
Table 12: Example for a sound description of an oxidation-affected interface, (CRM) 36
Table 13: Parameters used during water impingement test with composite type “erosion sensitive top layer”, (BFI, Lechler) 45
Table 14: Parameters used during water impingement test with composite type “imprint sensitive viscoelastic primary layer”, (BFI, Lechler) 45
Table 15: Selected results of tested “Erosion sensitive layers” composite, (BFI,
Lechler) 45
Table 16: Selected results of tested “Imprint sensitive viscoelastic primary layer” composite, (BFI, Lechler) 46
Table 17: Test procedure for testing the two different composite types, (BFI,
Lechler) 46
Table 18: Reheating furnace gas typical composition incl. waste product combustion
composition in wet conditions for two different stoichiometries (2 % and 6 % excess O2), (Tata) 54
Table 19: Reheating conditions for thermogravimetric analysis at TGA-GTW, (BFI) 56
Table 20: Measured scale thickness and morphology uncoated TKSE 1 reference material, (BFI) 56
Table 21: Measured scale thickness, morphology and decarburisation depth on uncoated AmRu 2 reference material, (BFI) 58
Table 22: Scale classification before and after descaling on different Tata 1 (NGO B24 steel) specimens, (BFI, Tata) 60
Table 23: Residual scale analysis on TATA’s specimens (top) with their grey-value distribution (middle) and the outcome of residual scale analysis performed
on converted pictures (bottom), (BFI) 61
Table 24: Incremental casting composition in percent [%], (CRM) 62
Table 25: Exemplary cross-sections of scale after incremental casting, (CRM) 63
Table 26: Pore distribution in scale, (BFI) 63
Table 27: Overview on coating properties, (compiled by BFI, Emuref) 66
Table 28: Probability of particles to be transported into different regions of the lungs; Deposit rate > 50 % for the addressed particle size, according to [86] 70
Table 29: Selected results of particle size measurement Stopoxy 1B, Stopoxy AC
and Descalizer RXT, (BFI) 71
Table 30: Cross-section (10 % Nital etching) to study decarburisation of AmRu 2 in simulated flue gas atmosphere, 1250 °C, 2 h, (BFI) 74
158
Table 31: Decarburisation of Sidenor 1 in industrial trials (4.25 h), (Sidenor) 75
Table 32: Cross-sections after coating for as-cast and polished surfaces – Reheating Temperature 1120 °C and 1180 °C, (CRM) 80
Table 33: Example of calculation of distribution of oxygen concentration and oxygen activity in the steel. This is the first step of the calculation with the diffusion-reaction model, (CSM) 85
Table 34: Steel composition [%] (Steel 1 and Steel 2), (CSM) 86
Table 35: Results of investigations on decarburisation and oxide formation with coatings for Descalizer RXT and Stopoxy 1B (cold application), (compiled by BFI) 89
Table 36: Cross section of samples after coating for as-cast and polished surfaces and after descaling with a furnace temperature of 1120 °C – NGO B24 electrical steel (Tata 1), (CRM) 91
Table 37: Results of test on casted material, descaling and rolling 10% reduction, (CRM) 92
Table 38: Cross section to study porosity and primary scale thickness of AmRu 2 and TKSE 1 in simulated flue gas atmosphere, 1250 °C, 2 h, (BFI) 94
Table 39: Reheating and descaling parameter for TKSE 1 and AmRu 2 specimen, (BFI, TKSE, AmRu) 94
Table 40: Evolution of surface along the rolling trials, TKSE 1, (TKSE/BFI) 95
Table 41: Evolution of surface along the rolling trials, AmRu 2, (BFI) 96
Table 42: Parameters in the statistical model, (Mefos) 100
Table 43: Results of a statistic evaluation of the blister and scale data, (Mefos) 101
Table 44: Overview on influence of coatings on descalability for different steel grades, (compiled by BFI) 101
Table 45: Impact pressure for different offset and overlap for two spraying nozzles in row, (Lechler) 109
Table 46: Steel grades tested during hot descaling tests, (BUT) 111
Table 47: Chemical compositions of steel grades investigated, (CSM) 115
Table 48: Surface aspects of the coated samples after each layer (CRM) 124
Table 49: Best parameters for industrial spray application of Descalizer HTA and Descalizer RXT (LTA) developed throughout the project, (CRM) 124
Table 50: Industrial trials conditions at SidenorAzkoitia rolling mill, (Sidenor) 125
Table 51: Description of both coating devices, (AmRu, BFI) 129
Table 52: Comparison of existing (old) and new process data at the descaling plant of TKSE, Bochum, after exchange of the nozzles, example top header 1st row, (Lechler) 130
Table 53: Example of descaling configurations in relation to the isoenergetical lines- Standard descaling, (CSM) 132
Table 54: Example of descaling configurations in relation to the isoenergetical lines- Standard descaling and pre-cooling, (CSM) 133
Table 55: Evaluation of KPIs Process_HI_PER for general utilisation in hot rolling mills, (compiled by BFI) 136
Table 56: Annual cost savings for Descalizer utilisation in walking beam / hearth furnace, slab, 1 Mt/a, (Emuref) 147
Table 57: Annual cost savings for Descalizer utilisation in pusher type furnace, billet, 0.5 Mt/a, (Emuref) 147
Table 58: Annual cost saving potentials for the exchanged descaling nozzles, (Lechler) 148

159
List of Acronyms and Abbreviations
% Percent ° degree (angle) °C Temperature in degree Celsius A Area Al Aluminium Al2O3 Aluminium oxide B Boron B Spray width
bar Bar (pressure) C Spray width in rolling direction Ca Calcium CD coefficient of discharge nozzle Cf Flow rate coefficient cm Centimetre CMn Carbon Manganese Steel Co Cobalt CO2 Carbon dioxide COG Coke oven gas Cr Chromium CSP Continous Steel Plant Cu Copper Cv atmospheric velocity deceleration coefficient D Overlap d spray thickness DE Descaling energy DRM Descaling regime map DSP Special steel grade (from Durgarpur Steel Plant) E Nozzle pitch / Nozzle distance e.g. example given EDX Energy dispersive X-ray spectroscopy FE Finite Element Fe2O3 Hematite Fe2SiO4 Fayalite Fe3O4 Magnetite FeO Wustite Fi Impact force FLIR FLIR thermal imaging camera FTIR Fourier-Transform-Infrared spectroscopy g gram g gravitational constant h Hour H Stand-off height / vertical spray height H Height h2 Stand-off high / vertical spray height H2O Water HA Hot application HPW High Pressure Water descaling HSLA High strength low alloy steel HSM Hot Strip Mill HTA Higher Temperature Application HTC Heat transfer coefficient i.e. id est (This is to say) IP Impact pressure / Mean impact pressure
IPmax Maximum impact pressure IR Infrared J Joule K Degree Kelvin K2O Potassium oxide kg Kilogramme kHz kilo Hertz KPI Key production indicator L Length l Litre lab Laboratory LCFM Special type of refractory material LOM Light-optical microscopy LTA Lower Temperature Application m Meter m2 Square metre m3 Cubic metre MgO Magnesium oxide min Minute mm Millimetre mm2 Square millimetre Mn Manganese Mo Molybdenum

160
MPa Mega pascal N Nitrogen N Newton N Nitrogen
N2 Nitrogen Nb Niobium NG Natural gas NGO Non-frain oriented steel Ni Nickel No. Number nr. Number O2 Oxygen OR Overlap ration P Phosphorus p Pressure P Capacity PT Port Talbot Q Flow rate Ra Roughness Ref Reference REM Electron microscope RFCS Research Fund for Coal and steel RI Research institute S Sulphur s Second SC Subcontractor SEM scanning electron microscope Si Silicon SiO2 Silicon oxide Sn Tin SP Steel producer SP System pressure SWI Specific water impingement SWOT Strength - Weaknesses - Opportunities - Threats Analysis T temperature t time t ton T/C Thermocouple temp Temperature TGA Thermogravimetric analysis TGA-GTW “big” TGA at BFI TGS 4 Technical Group 4 Ti Titanium V Vanadium v Velocity V velocity Vf Fluid velocity Vs. versus W Width
WP Work package XRD X-ray diffractometer α Thermal expansion α spray angle β rake angle / angel of inclination γ twist angel / offset angel μm Micro metre ρ Density φ spray thickness angel
161
List of References
[1] RFS-PR-07095 Oxidation management in hot rolling processes - OxMaPro - 01/07/2008-31/12/2011
[2] RFS-CR-05016 Control of scale during steel processing - Scale Control 01/07/2005-31/12/2008
[3] RFS-PR-10047 Control of sheet oxidation in reheating operation carried out with alternative fuels and new combustion technologies - CONSTOX - 01/07/2011-30/06/2014
[4] RFSR-CT-2009-00009 Innovative high temperature and mechanical descaling - HIDES - 01/07/2009-31/12/2012
[5] RFSR-CT-2006-00014 New cooling techniques for enhanced roll bite lubrication during cold
rolling of high strength steels and thin packaging steels - OptCooLub - 30/06/2009
[6] 7210-PR/153 Investigation of the formation, constitution and properties of scale formed during the finishing rolling, cooling and coiling of thin hot strips 30/06/2002
[7] RFS-PR-04001 Real-time intelligent diagnostics and optimisation of reheating furnace performance - Smartfire - 31/12/2008
[8] 7210-PR/336: Control of the strip surface oxide layer for pickle-free hot rolled steel 30/06/2005
[9] 7210-EB/306 Adhesion test at high temperatures on scales formed on low-carbon steel
30/06/1995
[10] 7210-EB/309 Descaling Adherent Scales While Reducing Hot Bar Heat Losses 30/06/1999
[11] 7210-PR/019 Oxidation and decarburisation of high carbon, special and general steels 31/12/2000
[12] 7210-GB/314 Improvement of automatic surface inspection in flat steel products 30/06/1999
[13] 7210-PR/155 Improvement of rolled strip surface & geometry by advanced automatic diagnosis of surface defects & optimisation of friction in the roll gap 31/12/2002
[14] 7215-PP/069 Application of data-based technologies to demonstrate online quality control of mini-mills 31/05/2005
[15] 7210-PR/214 Tailoring scale characteristics during steel processing 31/12/2003
[16] 7210-PR/020 Optimisation of beam reheating conditions in the reheating furnace 31/12/2000
[17] 7210-EC/804 Oxidation and decarburisation of high carbon steels 30/06/1996
[18] 7210-EA/818 Descaling of steels in rolling mills - 30/06/1991
[19] 7210-EB/409 Development of new slab based oxidation inhibitors as protective layers for slabs during reheating - 30/11/1992
[20] 7210-KB/809 Investigation of the formation, constitution and properties of scale formed in the reheating furnaces - 30/06/1990
[21] 7210-EB/203 New method of descaling 30/06/1995
[22] 7210-EA/818 Descaling of steels in rolling mills 30/06/1991
[23] 7210-PR/102 Non-polluting stainless steel descaling & pickling by use of high pressure water
jets 30/06/2001
[24] 7210-KB/809 An investigation of the formation, constitution and properties of scale formed in the reheating furnace during the hot-rolling process 30/06/1990
[25] 7210-EC/804 Oxidation and decarburisation of high carbon steels 30/06/1996
[26] 7210-EB/108 Improved atmosphere control for product quality and combustion efficiency in reheating furnaces. 30/06/1999
[27] Krzyzanowski, M.; Beynon, J. H.; Farrugia, D. C. J.: Oxide Scale Behavior in High Temperature
Metal Processing, Wiley, VCH, Weinheim, 2010
[28] Revie, R.W.; Uhlig, H.H.: Corrosion and Corrosion Control – An Introduction to Corrosion Science and Engineering, Wiley-Interscience, New York, 4. Auflage, 2008
[29] Chen, R.Y.; Yuen, W.Y.D.: Oxide-Scale Structures Formed on Commercial Hot-Rolled Steel Strip and Their Formation Mechanisms, Oxidation of Metals, Vol. 56, pp. 89-119, 2001
[30] Hara, K.; Doi, S.; Utsunomiya, H.; Matsumoto, R.: Influence of Scale on Hot Rolling
Characteristics of Stainless Steel Sheets, Metal Forming, (83), pp. 1011-1014, 2012
162
[31] Wei, D.B.; Huang, J.X.; Zhang, A.W.; Jiang, Z.Y.; Tieu, A.K.; Shi, X; Jiao, S.H.: The effect of
oxide scale of stainless steels on friction and surface roughness in hot rolling, Wear (271), pp. 2417-2425, 9-10 2011
[32] Sartor, M.; Orosz, R.; Reichardt, T.; Hänsch, W.: Transportdauer hat Einfluss auf die
Rotzunderbildung, Stahl und Eisen, 132, pp. 55-59, 03/2012
[33] Yin, H.; Yuen, W.Y.D, Young, D.J.: Effects of water vapour and oxygen partial pressures on low carbon steel oxidation in N2-H2-H2O mixtures, Materials and Corrosion, (63), 10, pp. 869-877, 2012
[34] Li, X.-L.; Bai, S.-Q.; Dong, X.-F.; Shi, L.; Wang, W.: Anti-decarburisation coating for GCr15 steel, Heat Treatment of Metals (China),pp. 52-53, 5/2002
[35] Zhang, P.; Research on protective material for decarburisation of high silicon steel, GangtieYanjiu (Research on Iron and Steel (China)), pp. 44-46, 1-2/2001
[36] Wilkes, M.; Schneider, A.: New material concepts for press hardening, 4th ICAFT / 19th SFU, pp.129-134, 2012
[37] Yekehtaz, M.; Klesen, C.; Benfer, S.; Bleck, W.; Fürbeth, W.: Effect of nano-oarticulate sol-gel coatings on the oxidation resistance of high-strength steel alloys during press-hardening process, Materials and Corrosion, (63), pp. 940-947, 10/2012
[38] Sartor, M.; Reichardt. T.: Verminderung von Hochtemperaturkorrosion bei der Wiedererwärmung von Stahl durch diffusionshemmende Beschichtungen. ZVO Oberflächentage 2012, Darmstadt, 9/2012
[39] Sartor, M.; Wunde, M.; Treuheit, A.: Einsatz nanoskaliger Beschichtungssysteme zur
Verringerung der Hochtemperaturkorrosion bei der Warmumformung, Proceedings 19. Symposium Verbundwerkstoffe und Werkstoffverbunde, Karlsruhe, pp. 720-729, 2013
[40] Torkar, M.; Ursic, V.: ’The application of waste silica cyclone powder for the protective coating of steel billets,’ Metalurgija. Vol. 45, No. 3, pp. 230, July-Sept. 2006
[41] Wei, L.; Liu, P.; Ye, S.; Xie, Y.; Chen, Y.: ‘Preparation and properties of antioxidation inorganic nano-coating for low carbon steel at an elevated temperature,’ Journal of Wuhan University of Technology (Materials Science Edition) Vol. 21, No. 4, pp. 48-52, 2006
[42] Patent EP0976849A1 Sollac CRPC, Moran,C.: 'Procédé de traitement limitant la suroxydation des rives d’une bande de tôle laminée à chaud et bobinée en sortie d’un train à bandes.' 02/02/2000
[43] Patent Request Mitsubishi Heavy Industry: EP0920927A3 'Method and system for suppressing
formation of scale in hot finishing mill system.'
[44] Patent SU 533556: Frit for temporary anti oxidation enamelling of stainless steel - containing oxides of silicon, aluminium, boron, calcium, magnesium, sodium and barium to improve
corrosion and heat resistance
[45] Patent WO 2009/021490, „Verfahren Zum Korrosionsschutz von Karosserie-, Fahrwerks-, Motorbauteilen oder Abgasanlagen“, Sepeur, S.; (DE), Goedicke, S.; (DE), Paar, U.; 2009
[46] Patent DE 10 2008 020 216 B4, „Verfahren zum Schützen eines Metalls vor Korrosion und Verwendung des Verfahrens“, Sepeur S.; Goedicke, S.; Breyer, C.; Weniger, 2008
[47] Patent DE 10 2007 038 215 A1, „Verfahren zur Herstellung einer aktiven Korrosions-schutzbeschichtung auf Bauteilen aus Stahl“, Breyer, C.; Goedicke, S.; Sepeur, S.; 2007
[48] Patent DE 10 2006 008 308 A1, „Polysilazane enthaltende Beschichtungen zur Vermeidung von Zunderbildung und Korrosion“, Brand, S.; Dierdorf, A.; Günthner, M.;Liebe, H.; Motz, G.; Osterod, F., Weniger, 2006
[49] Patent WO 2011/144603, „Nanopartikelbasiertes Zunderschutzsystem“, Kiesen, C.P.; Bleck, W.; Benfer, S.; Feil, F.; Fürbeth, W., 2011
[50] Sartor, M.; Wunde, M.; Lemke, A.; Roth, M.; Böhm, S.; Owczarek, K.; Napierkowski, N.; Rod, T.: Materialverlust durch Zunderbildung beim Wiedererwärmen mit Beschichtung verringern,
Coatingdecreases material lossescausedbyscaleformationduringreheating, stahl und eisen, (136), No. 2, pp. 55-59, 2016
[51] Patent WO002011154133A1 „Method for producing seamless pipes“, Peltoniemi, R.; Peltoniemi, D., 2011
[52] Information on supplier for refractories Emuref: www.emuref.com, from 15.02.2018
[53] Schütze, M.; Corrosion and Environmental Degradation, Wiley-VCH, Weinheim, 2008
[54] Schütze, M.: Protective oxide scales and their breakdown, Wiley, 1997
163
[55] Hara, K.; Utsunomiya, H.; Sakai, T.: Influence of oxide scale on hot rolling characteristics of
steel sheet, Steel Research Int., pp. 74-77, 2011
[56] Sartor, M.; Wunde, M.; Lemke, A.; Dwuletzki, H.; Wächter, A.; Khalil, T.; Barz, U.; Henneke, T.: Nanopartikelhaltige Beschichtungssysteme zur Zunder-konditionierung am Beispiel einer
verringerten Zunderbildung und optimierter tribologischer Eigenschaften, 57. FachtagungTribologie, Göttingen, pp. 68/1-10, 2016
[57] Pawlitzki, P.; Rehbein R.: Innovative Lösungen für Entzunderungsanlagen-Innovative solutionsfordescalingsystems, stahl und eisen, No. 8, pp.63-70, 2007
[58] Frick, J.W.: Audits of existing hydro mechanical descaling systems in hot rolling mills as a method to enhance product quality, Iron&Steel Technology, pp. 425-436, 5/2005
[59] Robb, L: Effect of spray height, lead angle and offset angle on impact, AISTech (2005), AISTech, Iron and Steel Technology Conf., Vol. 2, Charlotte, US, May 9-12, pp.449-456, 2005
[60] Eco-Pickled Surface: An Advantageous Alternative To Conventional Acid Pickling by K. Voges and A. Mueth, Iron & Steel Technology, August 2008.
[61] Strip Descaling and Surface Conditioning by Eco Pickled Surface Technology by K. Voges, Metallurgical Plant and Technology International, Issue 2, 2009
[62] RFSR-CT-2010-00014, High pressure water jet descaling for wire rod – HiJetRod – 31/12/2013
[63] RFCS 709435, Resource-efficient hydromechanical descaling system for wire coils – HiJetRod Pilot – 31.12.2019
[64] Hrabovsky, J.; Horsky, J.: Influence of the water chamber and position of the stabiliser on the impact pressure at high pressure descaling, Metal, 2012, pp. 1-6
[65] FedorciucOnisa, C.; Farrugia, D. J.;, Steer, M.: Investigation into Mechanisms of Heat Losses and Mechanical Descalability during High Pressure Water Descaling, The 12th International Conference of Metal Forming, Krakow (Poland), 1-3 September, 2008
[66] Ramirez Cuellar J. et al., “Modelling descaling during hot rolling of steel”, Journal of Physics, IV, vol. 120, pp. 209-215, 2004
[67] ISRA VISION PARSYTEC GmbH: www.parsytec.de
[68] Cognition Experts (COGNEX): www.cognex.com
[69] Neuer, G.: Ermittlung der Emissionsgrade zur Korrektur pyrometrisch gemessener
Temperaturen, VDI Bildungswerk, BW 6045
[70] Neuer, G.: Lösung pyrometrischer Temperaturmeß- und Regelungsprobleme in der Industrie, VDI Bildungswerk BW 8325.
[71] Degner, M.; Kuhfuß, W.; Mentrum, H.-C.; Risse, W.; Thewes, J.; Thiemann, G.: Erfassung des Temperaturquerprofils von warmgewalzten Bändern, Stahl und Eisen, Band 118, 10/1998
[72] Hlobil, H.; Reisinger, J.; Trinkl, G.; Wurm, A.: Optical measurement technique to improve quality in hot strip mill and plate mill technology, CCR Proc., Linz, pp. 1-4, 2004
[73] Peters, H.; Heckentaler, T.: Efficient utilisation of surface inspection data - application examples and results, Surface inspection Summit, Aachen, 2004
[74] Uijtdebroeks, H.; Franssen, R.; Sonck, G.; Moerkerke, J.: On-line detection of hot strip surface defects and work roll degradation at the hot strip mill of Sidmar, METEC Congress proceedings, Düsseldorf, 1999
[75] Karube, K and Nishiyama, T: New Descale Nozzle Technology Greatly Enhance the Removal of
Scale while Reducing the Consumption of Electricity and Descale Water through which energy is Saved, AISTech Proceedings – Volume II, 2006
[76] D. Espinosa D, D. Farrugia, A. David, A. Erz: Innovative high temperature and mechanical descaling, RFSR-CT-2009-00009, EU bookshop KI-NA-26177-EN-N, 2012
[77] Sartor, M.; Wunde, M.: Prevention of scale formation and influence of scale properties in steel re-heating by use of diffusion inhibiting coatings, European Oxide Scale Conference 2014,
pp. 47-50, London, 12.-13.02.2014
[78] Mikler, M.; et al.: “Descaling adherent scales while reducing hot bar heat losses”, ECSC Project-7210/EB/309 903, Final report EUR 19856, 2001
[79] “Bending” in Wikipedia, The Free Encyclopedia, at: https://en.wikipedia.org/wiki/Beam_bending#, accessed Jan 2016
[80] ASTM D522-93a, “Standard Test Methods for Mandrel Bend Test of Attached Organic Coatings”,
ASTM International, West Conshohocken, PA, www.astm.org, 2001
164
[81] Siegmann, A.; Sartor, M.; Deli, H.; Reichardt, T: Emission von nanoskaligen Partikeln beim
Einsatz von Suspensionen als Schmier- oder Beschichtungssystemen bei der Metallumformung, Jahrbuch Oberflächentechnik, pp. 3232-328, 2011
[82] Gazo, A., Greßler, A., Schiemer, F.: Nano, Chancen und Risiken aktueller Technologien,
1. Auflage, Springer Verlag, Berlin, Heidelberg, Wien 2007
[83] Tesseraux, I., Wehrle, G. und von der Trenk, T.: Nanomaterialien: Toxikologie/Ökotoxikologie. LUBW Landesanstalt für Umwelt, Messungen und Naturschutz Baden-Württemberg, Karlsruhe 2010
[84] Krug, H.F.: Auswirkungen nanotechnischer Entwicklungen auf die Umwelt. UWSF – Z. Umweltchem. Ökotox.17, pp. 223-230, 2005
[85] Meili, C., et al.: „Synthetische Nanomaterialien. Risikobeurteilung und Risikomanagement. Grundlagenbericht zum Aktionsplan“, Umwelt-Wissen Nr. 721, Bundesamt für Umwelt (BAFU) und Bundesamt für Gesundheit (BAG), Bern, 2007
[86] Air quality -- Particle size fraction definitions for health-related sampling. DIN ISO 7708:1995
[87] http://www.baua.de/de/Themen-von-A-Z/Gefahrstoffe/Nanotechnologie/Gesetzeslage.html (from 16.01.2015)
[88] Bundesanstalt für Arbeitsschutz und Arbeitsmedizin (BAuA) und VCI: Empfehlung für die
Gefährdungsbeurteilung bei Tätigkeiten mit Nanomaterialien am Arbeitsplatz, Mai 2012
[89] http://www.baua.de/de/Themen-von-A-Z/Gefahrstoffe/Nanotechnologie/Nanomaterialien.html (from 16.01.2015)
[90] Jahnel, J.: Verantwortlichkeit zwischen Evidenz und Aushandlung, Präsentation 6. NRW-
Nanokonferenz, 01.-02.12.2014
[91] Krug, H.F.: Nanosicherheitsforschung – sind wir auf dem richtigen Weg?, Angewandte Chemie, 126, pp. 12502-12518, 2014
[92] Wagner, S.; Gondikas, A.; Neubauer, E.; Hofmann, T.; von der Kammer, F.: Finde den Unterschied: synthetische und natürliche Nanopartikel in der Umwelt – Freisetzung, Verhalten und Verbleib, Angewandte Chemie, 126, pp. 12604-12626, 2014
[93] Schütze, Michael, et al. "Mechanical properties and adherence of oxide scales." Materials science
forum, Vol. 522, 2006
[94] VAGNARD, G.; MANENC, J. Etude de la plasticité du protoxyde de fer et de l’oxyde cuivreux.
Mem. Et. Sci. Rev. Met. LXI, 11. Jg., S. 768-776, 1964
[95] Birks, N. and Meier, G.H., Introduction to High Temperature Oxidation of Metals, Edward Arnold, London, 1983
[96] www.thermocalc.com, from 15.02.2018

Getting in touch with the EU
In person
All over the European Union there are hundreds of Europe Direct information centres. You can find the address of the centre nearest you at: https://europa.eu/european-union/contact_en
On the phone or by email
Europe Direct is a service that answers your questions about the European Union. You can contact this service:
– by freephone: 00 800 6 7 8 9 10 11 (certain operators may charge for these calls),
– at the following standard number: +32 22999696 or
– by email via: https://europa.eu/european-union/contact_en
Finding information about the EU
Online
Information about the European Union in all the official languages of the EU is available on the Europa website at: https://europa.eu/european-union/index_en
EU publications
You can download or order free and priced EU publications at: https://publications.europa.eu/en/publications. Multiple copies of free publications may be obtained by contacting Europe Direct or your local information centre (see https://europa.eu/european-union/contact_en).
EU law and related documents
For access to legal information from the EU, including all EU law since 1952 in all the official language versions, go to EUR-Lex at: http://eur-lex.europa.eu
Open data from the EU
The EU Open Data Portal (http://data.europa.eu/euodp/en) provides access to datasets from the EU. Data can be downloaded and reused for free, for both commercial and non-commercial purposes.

HiPerScale developed an integrated, energy efficient and
flexible approach to influence oxidation, decarburisation,
overall descalability and surface quality for steel grades
suffering from oxidation processes. The focus was on
primary scale formation and various investigations were
done to improve the knowledge on scale formation
conditions, development, application and investigation on
scale conditioning coatings as well as on improvement of
descaling technologies including nozzle development.
To improve the existing knowledge and to enable steel
industry to conduct their own studies procedures for
characterisation of primary scale formation including
decarburisation, descalability and descaling efficiency were
compiled and key production indicators were defined.
Investigations on scale formation with focus on scale-metal
interface and morphology led to a better understanding of
the scale formation behaviour and its conditioning. Lab
investigations showed that coatings can minimise the scale
formation in terms of weight gain by 23 to 40 %, but the
results are strongly depending on the coatings and the steel
grade. Decarburisation could be suppressed almost totally
which was shown in both lab and industrial trials. The
coatings may impair the descalability of the reheated steel
depending on the steel grade and process conditions. Studies
on the descaling processes led to approaches for improved
descaling strategies (concept of pre-cooling) and
improvement of descaling nozzles although the latter topic
needs continuous improvements. Finally guidelines (Hints
and a list of Do’s and Don’ts) were compiled to support the
steel companies in integrating the results for influencing
scale formation and behaviour into their plants.
Studies and reports
Related Documents