HAL Id: hal-01070569 https://hal.archives-ouvertes.fr/hal-01070569 Submitted on 1 Oct 2014 HAL is a multi-disciplinary open access archive for the deposit and dissemination of sci- entific research documents, whether they are pub- lished or not. The documents may come from teaching and research institutions in France or abroad, or from public or private research centers. L’archive ouverte pluridisciplinaire HAL, est destinée au dépôt et à la diffusion de documents scientifiques de niveau recherche, publiés ou non, émanant des établissements d’enseignement et de recherche français ou étrangers, des laboratoires publics ou privés. High-growth firms and technological knowledge: do gazelles follow exploration or exploitation strategies? Alessandra Colombelli, Jackie Krafft, Francesco Quatraro To cite this version: Alessandra Colombelli, Jackie Krafft, Francesco Quatraro. High-growth firms and technological knowl- edge: do gazelles follow exploration or exploitation strategies?. Industrial and Corporate Change, Oxford University Press (OUP), 2014, 23 (1), pp.261-291. hal-01070569

Welcome message from author
This document is posted to help you gain knowledge. Please leave a comment to let me know what you think about it! Share it to your friends and learn new things together.
Transcript

HAL Id: hal-01070569https://hal.archives-ouvertes.fr/hal-01070569
Submitted on 1 Oct 2014
HAL is a multi-disciplinary open accessarchive for the deposit and dissemination of sci-entific research documents, whether they are pub-lished or not. The documents may come fromteaching and research institutions in France orabroad, or from public or private research centers.
L’archive ouverte pluridisciplinaire HAL, estdestinée au dépôt et à la diffusion de documentsscientifiques de niveau recherche, publiés ou non,émanant des établissements d’enseignement et derecherche français ou étrangers, des laboratoirespublics ou privés.
High-growth firms and technological knowledge: dogazelles follow exploration or exploitation strategies?
Alessandra Colombelli, Jackie Krafft, Francesco Quatraro
To cite this version:Alessandra Colombelli, Jackie Krafft, Francesco Quatraro. High-growth firms and technological knowl-edge: do gazelles follow exploration or exploitation strategies?. Industrial and Corporate Change,Oxford University Press (OUP), 2014, 23 (1), pp.261-291. �hal-01070569�

1
High Growth Firms and Technological Knowledge:
Do gazelles follow exploration or exploitation strategies?1
Alessandra Colombelli University of Nice Sophia Antipolis
GREDEG-CNRS
250 rue Ablert Einstein
06560 Valbonne, France
DIGEP
Politecnico di Torino
Corso Duca degli Abruzzi, 24
10129 Torino, Italy
BRICK
Collegio Carlo Alberto
Via Real Collegio, 30
10024 Moncalieri, Italy
Jackie Krafft University of Nice Sophia Antipolis
GREDEG-CNRS
250 rue Ablert Einstein
06560 Valbonne, France
Francesco Quatraro (corresponding author) University of Nice Sophia Antipolis
GREDEG-CNRS
250 rue Ablert Einstein
06560 Valbonne, France
BRICK
Collegio Carlo Alberto
Via Real Collegio, 30
10024 Moncalieri, Italy
1 A preliminary version of this paper was discussed at the European Meeting on Applied Evolutionary
Economics (EMAEE) held in Pisa in February 2011, the Workshop on “High-Growth Firms” organized at the
RATIO Institute in Stockholm 19th
-20th
May 2011, the second conference organized by the Journal of Industrial
and Business Economics in Parma on 20th
-21st June 2011, the seminar series of the GREDEG-CNRS, University
of Nice and at the SEIKE seminar series organized at the BRICK, Collegio Carlo Alberto. We want to thank
Cristiano Antonelli, Giulio Bottazzi, Alex Coad, Lionel Nesta, Marco Vivarelli and Pier Paolo Patrucco for their
useful comments. The authors acknowledge the financial support of the European Union D.G. Research with the
Grant number 266959 to the research project ‘Policy Incentives for the Creation of Knowledge: Methods and
Evidence’ (PICK-ME), within the context of the Cooperation Program / Theme 8 / Socio-economic Sciences and
Humanities (SSH).

2
High Growth Firms and Technological Knowledge:
Do gazelles follow exploration or exploitation strategies?
ABSTRACT.
This paper analyses the contribution of high-growth firms to the process of knowledge creation. We articulate a demand-pull innovation framework in which knowledge creation is driven by sales growth, and knowledge stems from creative recombination. Building on the literature on high growth firms and economic growth, we investigate whether ‘gazelles’ follow patterns of knowledge creation dominated by exploration or exploitation strategies. We construct indicators for the structure of knowledge and identify firms’ innovation strategies. The empirical results show that increasing growth rates are associated with exploration, supporting the idea that high growth firms are key actors in the creation of new technological knowledge, and showing also that firms that achieve higher than average growth focus on exploration based on familiar technology. This suggests that exploration is less random than has been suggested. Our main result is that high growth firms, especially gazelles, predominantly adopt exploration strategies that have the characteristics of organized search more often observed among firms following an exploitation strategy.
Keywords: Gazelles; Recombinant Knowledge, Schumpeterian innovation patterns
JEL Classification Codes: L20, L10, 032

3
1 Introduction
The process of firm growth has long fascinated economists. Most empirical work draws on the
seminal paper by Gibrat (1931), who proposed that firm growth is predominantly a random process
(see Lotti, Santarelli and Vivarelli, 2003, 2009).
In recent years, analysis of firm growth has gained momentum, with particular attention on the
distributional properties of firm growth rates, their persistence over time, and their determinants
(Bottazzi and Secchi, 2006; Coad, 2007; Coad and Hölzl, 2011, Parker et al., 2010; Acs and Mueller,
2008; Lee, 2010).
Much of the focus of empirical work on the determinants of firm growth has shifted to analysis of
firms showing growth rates that are much higher than the average. Henrekson and Johansson (2010)
point out that this strand in the literature derives from Birch’s (1979, 1981) contributions, which
describe high growth firms as ‘gazelles’. Birch maintains that these gazelles are the main source of
job creation in the economic system. Understanding the conditions that make firms gazelles and the
channels through which they contribute to the dynamics of aggregate economic growth could help
policymakers to devise targeted supporting policy measures (Nightingale and Coad, 2014).
The analysis of the relationship between innovation and faster rates of growth is a more recent
exercise, conducted mostly within empirical settings and based on quantile regressions (Coad and
Rao, 2008 and 2010; Hoelzl, 2009).
This literature uses firm growth as a dependent variable, and attempts to understand what are the
main factors affecting the outperforming behaviour of gazelles. When other dependent variables
(such as R&D, see Coad and Rao, 2010) are taken into account, estimation of quantile regressions
assigns firms to different classes according to rate of growth of R&D expenditure rather than firm
growth. Therefore, the contribution of gazelles to innovation dynamics is still unclear.
4
In this paper we try to fill this gap by investigating the differential contribution of high-growth firms
to the creation of technological knowledge. The literature on gazelles indeed emphasizes that their
economic contribution is due mostly to the process of creative destruction that they engender, so
that the net job creation ascribed to high growth firms stems from an ongoing dynamic process in
which new opportunities emerge and likely replace obsolete activities (Hölzl, 2009, 2010; Henrekson
and Johansson, 2010; Daunfeldt and Elert, 2013).
We are especially interested in the extent to which gazelles can be thought as featuring the
population of firms in sectors dominated by Schumpeterian Mark I or Mark II patterns of innovation
(Malerba and Orsenigo, 1995, 1997). Whether gazelles can be considered hybrids in relation to their
innovation patterns is one of the main research questions investigated here. We combine a demand-
pull innovation background with an approach to technological knowledge that emphasizes its
collective and recombinant nature, and allows the identification of properties that characterize
innovation strategies as random screening or organized search (Krafft, Quatraro and Saviotti, 2009).
While a similar approach has been used to analyse productivity performance at various levels (Nesta,
2008; Quatraro, 2010; Antonelli, Krafft and Quatraro, 2010, Colombelli, Krafft and Quatraro, 2013),
there are no studies to date that use it to investigate high-growth firms.
Our results show that gazelles cannot be strictly categorized as belonging to one mode or the other,
but would appear to represent a mix, adopting a combination of exploration and organized search
strategies.
The rest of the paper is organized as follows. Section 2 presents the theoretical underpinnings of the
analysis, and outlines the working hypotheses. Section 3 describes the data and the methodology,
with particular emphasis on the implementation of knowledge related indicators. Section 4 presents
and discusses the empirical results and Section 5 concludes.

5
2 High-growth firms and technological knowledge: a Schumpeterian
story?
There is a large literature on innovation. It consists of two main strands, one emphasizing the
importance of the accumulation of skills and scientific knowledge as the drivers of innovation, the
other emphasizing the role of economic mechanisms on the demand side. The first strand is usually
described as technology-push and the second as demand-pull.
The pioneer of the demand-pull approach in its modern form was Jacob Schmookler.2 He observed
how time series on technology creation, proxied by patent applications, tended to follow time series
on output (Schmookler, 1954, 1962). He interpreted this as that “more money will be available for
invention when the industry’s sales are high than when they are low. Increased sales imply that both
the producing firms and their employees will be in a better position than before to bear the expenses
of invention” (Schmookler, 1962: p.17). In this framework, the ability to finance knowledge creation
activities plays a central role (Schmookler, 1966). Empirical analyses of the effects of firm
performance on knowledge creation have been confined to the level of innovation, without any
attempt to qualify the patterns of innovation (Griliches and Schmookler, 1963; Scherer, 1982; Crespi
and Pianta, 2007 and 2008).
In this context, the identification of two distinct Schumpeterian patterns of innovation by Malerba
and Orsenigo (1995, 1997) is useful. They describe Schumpeter Mark I as characterized by ‘creative
destruction’, ease of entry and the emergence of new firms based on business opportunities, which
challenge incumbents and continuously disrupt current modes of production, organization and
distribution. Schumpeter Mark II is characterized by ‘creative accumulation’, the relevance of
industrial R&D laboratories and the key role of large firms. The authors also apply the labels of
‘widening’ and ‘deepening’ to these patterns. The former description applies to an innovative base
2 Of course, the seeds of the argument go back to Adam Smith (1776), who emphasized the indirect effects of
increasing demand on technological change through the positive effects of the division of labour. This argument was developed and integrated by Marshall (1890) and Young (1928).
6
that is continuously growing, the latter describes accumulation strategies based on existing
technological premises. In this direction, the positive relationship between firms’ growth and
innovation may either be channeled by Schumpeter Mark I or Schumpeter Mark II dynamics.
The grafting of the recombinant knowledge approach onto the investigation of the relationship
between high-growth firms and patterns of innovation may be far reaching. While traditional
approaches to technological knowledge tend to represent it as a homogeneous stock (Griliches,
1979; Mansfield, 1980), according to recombinant knowledge approach, the creation of new
knowledge can be represented as a search process across a set of alternative components that can
be combined with one another. Here the cognitive mechanisms underlying the search process are
important for exploring the knowledge space to identify which pieces of knowledge might be
combined (Weitzmann, 1998; Kauffman, 1993). The set of potentially combinable pieces is a subset
of the whole knowledge space. Search is supposed to be local rather than global; influenced by
cognitive, social and technological factors. The ability to engage in a search process in more distant
spaces is likely to generate breakthroughs based on combinations of new components (Nightingale,
1998; Fleming, 2001).
If knowledge stems from the combination of different technologies, a firm’s knowledge base can be
represented as a web of connected elements. The nodes of this network represent the elements of
the knowledge space that could be combined, while the links represent their actual combination. The
frequency with which two technologies are combined provides useful information for how we
characterize the internal structure of the knowledge base. Such characterization takes account of the
average degree of complementarity of the technologies comprising the knowledge bases, and also
the variety of the observed pairs of technologies, which allows us to define three properties of
knowledge structure:
Knowledge Variety is related to technological differentiation within the knowledge base, in
particular with respect to the possible different combinations of pieces of knowledge in the
7
sector, from the creation of radically new types of knowledge to more incremental
recombinations of already existing types of knowledge.
Knowledge Coherence can be defined as the extent to which the pieces of knowledge that
agents within the sector combine to create new knowledge are complementary.
Knowledge Similarity refers to the extent to which the pieces of knowledge used in the
sector are close in the technology space.
The dynamics of technological knowledge, therefore, can be understood as the patterns of change to
its internal structure, that is, the patterns of recombination across the elements in the knowledge
space. This captures the cumulative character of knowledge creation and the key role played by the
properties describing knowledge structure, and also the possible link to the relative stage of
development in the technological trajectory (Dosi, 1982; Saviotti, 2004, 2007; Krafft, Quatraro and
Saviotti, 2009).
This approach allows a better distinction between innovation strategies, that is, between exploration
and exploitation (March, 1991). The view of knowledge as an outcome of a recombination activity
allows the idea of two nested dimensions, defined according to the degree to which agents decide to
rely on exploration or exploitation, or a combination of the two, which has suggested concepts such
as ‘search depth’ and ‘search scope’ (Katila and Ahuja, 2002). Search depth refers to degree to which
agents draw upon prior knowledge, search scope refers to the degree to which agents rely on the
exploration of new areas in the knowledge space.
Combining the demand-pull framework with the recombinant knowledge approach and analysis of
Schumpeterian patterns of gazelles’ innovation activities, allow us to refine our main working
hypotheses as follows.
Sales growth is a key factor in high levels of innovations. For this reason, gazelles are expected to be
characterized by demand-driven dynamics of knowledge creation based on search behaviours aimed

8
at widening or deepening the firm’s technological competences. Our main research question is
whether the important contribution of gazelles to economic growth can be ascribed to search
behaviours typical of a Schumpeter Mark I pattern of innovation activities or a Schumpeter Mark II
pattern. In the first pattern, the positive impact of high-growth firms is based on their capacity to
undertake search behaviours directed towards the exploration of untried technological fields, which
broadens the existing knowledge base initially in a rather random way. Extending the knowledge
base means extending beyond the boundaries of what the firm already knows. Exploration tends to
be a key part of the destructive creativity of gazelles that follow a widening pattern. The search
behaviour of high-growth firms can be expected to depart to some extent from established
trajectories to discover new fields in the technology landscape in order to increase search scope.
According to this pattern, search behaviours will be more focused on a range of ‘successful’
technological fields, leading to a deepening of the existing knowledge base. Exploitation is intended
to combine knowledge in a more organized way, and is likely to apply to high growth firms.
Figure 1 maps the paths followed by gazelles, distinguishing between: i) strategies (exploration
versus exploitation); and ii) the way they implement these strategies (random search versus
organized search). The result is a two-by-two conceptual matrix, with a horizontal axis (strategies)
and a vertical axis (type of search).
Figure 1 allows us to visualize the typical Schumpeterian Mark 1 and Mark 2 patterns of innovation
(1st and 3rd quarter). In Mark 1, firms are depicted as developing different characteristics of product
innovation, in a situation of high uncertainty, which implies a predominance of trial and error system
of development; in Mark 2, firms draw on their experience, which reduces uncertainty, in selecting
the ways to innovate successfully. After a period of exploration where firms try several possible
combinations to produce innovation, there is a period of more stabilized choice around a smaller set
of possibilities.
>>> INSERT FIGURE 1 ABOUT HERE <<<
9
Gazelles do not necessarily follow pure models of innovation patterns. Due to their multifaceted
characteristics in terms of size, innovation behaviour, etc., it is necessary to consider them in a
dynamic framework where they may evolve from one model to another (e.g. from Mark 1 to Mark 2),
or extend the characteristics of one model to overlap with characteristics assumed to belong to the
other model. For instance, gazelles may be small firms, highly oriented towards a model of
innovation by exploration, but they may pursue this strategy in a more organized way than predicted
by Mark 1. Alternatively, large gazelle firms, which engage in an exploitation strategy (i.e. Mark 2
characteristics), may adopt some random screening activities that combine pieces of knowledge that
are usually exclusively attributed to Mark 1.
There is a growing literature on the relation between diversity in the knowledge base and the
performance of firms (see also Ostergaard et al., 2011, for an investigation of the relationship
between diversity in intangible assets and innovation), but the present paper is the first attempt to
study the link between high growth firms and knowledge base heterogeneity, based on the
properties of variety, coherence and similarity of the knowledge base.
In the next section we describe the data and the methodology used to provide an operational
definition of the concept of recombinant knowledge and the properties of knowledge structure, and
to characterize the search behaviour of high-growth firms.
3 Data, Variables and Methodology
3.1 Dataset
The dataset is an unbalanced panel of publicly traded firms in UK, Germany, France, Sweden, Italy
and the Netherlands. Our main source of market and accounting data is Thomson Datastream. To
obtain additional relevant variables, we include in the dataset information collected from AMADEUS
by Bureau Van Dijk. The period of observation for all the countries examined is 1988 to 2005. We also
use data from the OECD REGPAT database, which provides regional information on the addresses of

10
patent applicants and inventors as well as on technological classes cited in patents granted by the
European Patent Office (EPO) and the World Intellectual Property Organization (WIPO), under the
Patent Co-operation Treaty (PCT), from 1978 to 2006.
In order to match the firm level data with data on patents, we draw on the work of Thoma et al.
(2010), which develops a method for harmonization and combination of large-scale patent and
trademark datasets with other sources of data, through standardization of applicant and inventor
names.
We pooled the dataset by adding industry level information from the OECD STAN database. STAN is
based on ISIC revision 3 sectoral classifications; Thomson Datastream uses the four digit level ICB
industry classification ( Appendix B provides the sectoral concordance table used to link the two
classifications).
Our final dataset is an unbalanced panel of 335 active companies listed on the main European
financial market that submitted at least one patent application to the EPO in the period analysed.3
Table 1 reports the sample distribution by macro-sector, country and size classes. High and medium-
high technology firms account for around 30% and 37% of observations, respectively. Medium low
and low technology firms account for 3% and 10% respective, and knowledge intensive firms
represent some 7% of observations. The other economic groups each account for less than 10% of
the observations.
>>>INSERT TABLE 1 ABOUT HERE<<<
As expected, most of the sampled firms (80.9%) are large firms, that is, firms with more than 250
employees; 13.43% of the sample is medium sized firms. The country distribution is more diverse,
3 This relatively small number of firms is the outcome of merging the dataset with company-level information
and patent applications. They are firms that are listed on the relevant markets and which submitted more than 1
patent application during the observed period. The firms in the sample are observed for at least 6 years for the
sales variable. Average observation time is 9.4 years.

11
although 34% of the sampled firms are German and 25% are French. Sweden and the UK follow with
13% and 14% of sampled firms respectively.
3.2 The Variables
Since we are interested in the dynamic aspects of the relationship between sales and knowledge
creation, we use the growth rates of the relevant variables. At the general level, growth rates can be
defined as follows:
)ln()ln( 1,,, tititi XXGrowth (1)
where X is measured as sales, knowledge capital stock, knowledge coherence, cognitive distance,
knowledge variety, related knowledge variety and unrelated knowledge variety. All these variables
are explained below and in Appendix A, and are calculated for firm i at time t. In line with previous
empirical work (Bottazzi et al., 2010; Coad, 2011), the growth rate distributions are normalized
around zero in each year by removing the means as follows:
∑ (2)
where N is the total number of firms in the sample. This procedure effectively removes average time
trends common to all the firms caused by factors such as inflation and business cycles.
3.2.1 Knowledge Indicators
To define our knowledge related variables, we start with the firm’s knowledge stock. This is
computed by applying the permanent inventory method to patent applications. We calculate it as
the cumulated stock of patent applications using a rate of obsolescence of 15% per annum:
1,,, )1(
tititi EhE , where tih ,
is the flow of patent applications and δ is the rate of
obsolescence.
12
Implementation of knowledge characteristics proxying for variety, coherence and similarity, rests on
the recombinant knowledge approach. In order to provide an operational translation of these
variables we need to identify a proxy for the bits of knowledge, and a proxy for their structural
elements. We could use scientific publications as a proxy for knowledge, and use keywords or
scientific classification (e.g. the JEL code for economists) to proxy for knowledge structure. However,
we chose to use patents as a proxy for knowledge, and use the technological classes to which the
patents are assigned as structural elements, that is, the nodes in the network representation of
recombinant knowledge.4 Each technological class j is linked to another class m if the same patent is
assigned to both classes. The higher the number of patents assigned to both classes j and m, the
stronger is the link. Since the technological classes attributed to patents are reported in the patent
documents, we refer to the link between j and m as their co-occurrence within the same patent
document.5 This allows us to calculate the following three characteristics of the firm’s knowledge
bases (see appendix A for methodological details):
a) Knowledge variety (KV) measures the degree of technological diversification of the
knowledge base. It is derived from the information entropy index and can be decomposed
into related knowledge variety (RKV) and unrelated knowledge variety (UKV).
b) Knowledge coherence (COH) measures the degree of complementarity among technologies.
c) Cognitive distance (CD) expresses knowledge dissimilarities amongst different types of
knowledge.
4 The limitations of patent statistics as indicators of technological activities are well known. They include sector-specificity,
existence of non-patentable innovations and the fact that they are not the only means of protection. Also, the propensity to patent tends to vary over time as a function of the cost of patenting, and is more frequent in large firms (Pavitt, 1985; Griliches, 1990). However, previous studies highlight the utility of patents as a measure of the production of new knowledge. Studies show that patents are very reliable proxies for knowledge and innovation compared to analyses that use data from surveys on the dynamics of process and product innovation (Acs et al., 2002). Alongside the debate on patents as outputs rather than inputs of innovation activity, empirical analyses show that patents and R&D are dominated by a contemporaneous relationship, providing further support for patents to proxy for technological activities (Hall et al., 1986). 5 Note that to compensate for intrinsic volatility in patenting behaviour, patent applications refer to the last five years.
13
Use of these variables represents progress in the operational translation of knowledge creation
processes. They deal explicitly with the heterogeneity of knowledge and allow a better appreciation
of the collective dimension of knowledge dynamics. Knowledge is viewed as the outcome of
combinatorial activity in which intentional and unintentional exchange among innovating agents
provides access to external knowledge inputs (Fleming et al., 2007). The network dynamics of
innovating agents constitute a foundation for the emergence of new technological knowledge, which
in turn is represented as organic in structure, characterized by elementary units and the connections
amongst them. The use of these variables implies a mapping between technology as an activity and
technology as an artefact (Arthur, 2009; Lane et al., 2009; Krafft and Quatraro, 2011). Co-occurrence
matrices are similar to design structure matrices (DSM) (Baldwin and Clark, 2000; Murmann and
Frenken, 2006; Baldwin, 2007), in that they can be considered adjacency matrices in which our
interest is in both the link between the elements and the frequency of these links.
In other words, these measures capture the design complexity of the knowledge structure, and allow
observation of firm behaviour in relation to innovation, and its evolution with the changing
architecture of the knowledge structure (Henderson and Clark, 1990; Murmann and Frenken, 2006).
In this perspective, knowledge variety is likely to increase when new combinations of knowledge are
introduced into the system. However, the balance between related and unrelated variety should be
such that related variety dominates during the exploitation phase and unrelated variety dominates in
exploration phases (Krafft, Quatraro, Saviotti, 2009). An increase in knowledge coherence is likely to
signal the change to an exploitation strategy, while a decrease is likely to be linked to an exploration
strategy. Increasing values for cognitive distance are likely to be related to random screening of the
technology landscape, while decreasing cognitive distance is likely to be linked to organized search
behaviour. Looking again at Figure 1, and bearing in mind the above trends, we can interpret the
innovation behaviour of high growth firms. The inner boxes provide some clues about the expected
signs of the knowledge variables for different innovation patterns.

14
The next section discusses the results of the empirical analysis.
3.2.2 Descriptive statistics
Figure 2 shows the distribution of firms’ growth rates, for all the relevant variables. The empirical
distribution of growth rates seems closer to a Laplacian than to a Gaussian distribution. This is in line
with studies analysing the distribution of firm growth rates (Bottazzi et al., 2010; Bottazzi and Secchi,
2003; Castaldi and Dosi, 2009). Table 2 reports the descriptive statistics for knowledge indicators and
the other variables in our model, expressed as growth rates normalized according to Equation 2. The
values on kurtosis and on the percentiles confirm that growth rates are characterized by fat tailed
(although highly skewed) distributions.
>>>INSERT FIGURE 2 AND TABLE 2 ABOUT HERE<<<
This suggests that standard regression estimators, such as ordinary least squares (OLS), and assuming
Gaussian residuals, may perform poorly if applied to these data. To cope with this, a viable and
increasingly popular alternative is to implement least absolute deviation (LAD) techniques, which are
based on minimizing the absolute deviation from the median, rather than the squares of the
deviation from the mean.
Figure 3 depicts the distribution of firm sales growth by macro-sector (see Appendix B for the
definitions of macro-sectors). It shows that firm growth rates are highly dispersed in high-tech
sectors and that the dispersion decreases from high-tech to low-tech sectors. Knowledge intensive
sectors (denoted KIS) show highly dispersed growth rates.
>>>INSERT FIGURE 3 ABOUT HERE<<<
Table 3 presents the matrix of correlations among the variables used for the empirical exercise, at a
significance level of 1%. Although some significant patterns of correlation can be identified, these
involve mostly the variety-related variables, and (except for the three variety measures, which, as

15
expected, are characterized by non-negligible correlations) the coefficients are not high enough to
generate huge concern.
>>>INSERT TABLE 3 ABOUT HERE<<<
3.3 Methodology
Many of the empirical works analysing the determinants of firm growth are based on Gibrat’s Law,
which holds that firm growth is independent of firm size. However, some scholars claim that Gibrat’s
Law cannot be assumed to be a general law and its validity cannot be taken for granted ex ante (see
Lotti, Santarelli and Vivarelli, 2003 and 2009). Some studies find that growth rates are
autocorrelated.
The original contribution of the present paper is that we reverse the traditional line of reasoning by
adopting a demand-pull approach in which sales growth provides the incentive to commit resources
to knowledge creation activities. Thus, our empirical strategy differs from other empirical work in the
field based on the seminal contributions of Griliches and Schmookler (1963) and Scherer (1982). We
directly test the effect of sales growth rates on knowledge creation, emphasizing the demand pull
side of innovation. Another novelty of our approach is that we are not interested so much in
understanding whether increasing sales affect the level of knowledge creation. Rather we investigate
the qualitative aspects of the knowledge creation process by examining the properties of knowledge
structure (i.e. variety, coherence and similarity). Our empirical implementation is described in the
next section. It distinguishes the present analysis from contributions in the Schmooklerian tradition,
and work that emphasizes the relative weak effect of firm sales on R&D intensity (see e.g. Pakes and
Schankerman, 1977, 1984).
We are interested in the extent to which knowledge is (or is not) a determinant of firm growth, and
whether the properties of the knowledge structure are related to one another and to the level of

16
knowledge creation. An empirical strategy that investigates coevolution of the series is useful in not
imposing any a priori relationship amongst the variables at stake. In order to identify the potential
co-evolutionary patterns of the interdependent variables we implement the analysis in a (reduced
form) vector autoregression (VAR) model (Coad, 2010). First, recall the generic operational definition
of the variables we use in the analysis sit, that is, growth rate detrended through normalization. The
baseline VAR model can then be written as:
tititi sas ,1,, (3)
where sit is an m1 vector of the random variables for firm i at time t, is an mm matrix of the
slope coefficients to be estimated. In our case m=7 and corresponds to the vector [sales growth (i,t),
knowledge capital growth (i,t), coherence growth (i,t), increase in cognitive distance (i,t), increase in
variety (i,t), growth of related variety (i,t), growth of unrelated variety (i,t)]. is an m1 vector of
disturbances. The 7 structural equations are therefore the following (the variables has to be
understood as normalized growth rates according to equation (2)):
tititititititititi UTVRTVTVCDCOHESalesaSales ,,11,7,11,6,11,5,11,4,11,3,11,2,11,1,11, (3a)
tititititititititi UTVRTVTVCDCOHESalesaE ,,21,7,21,6,21,5,21,4,21,3,21,2,21,1,22, (3b)
tititititititititi UTVRTVTVCDCOHESalesaCOH ,,31,7,31,6,31,5,31,4,31,3,31,2,31,1,33, (3c)
tititititititititi UTVRTVTVCDCOHESalesaCD ,,41,7,41,6,41,5,41,4,41,3,41,2,41,1,44, (3d)
tititititititititi UTVRTVTVCDCOHESalesaTV ,,51,7,51,6,51,5,51,4,51,3,51,2,51,1,55, (3e)
tititititititititi UTVRTVTVCDCOHESalesaRTV ,,61,7,61,6,61,5,61,4,61,3,61,2,61,1,66, (3f)
tititititititititi UTVRTVTVCDCOHESalesaUTV ,,71,7,71,6,71,5,71,4,71,3,71,2,71,1,77, (3g)
Since we are interested in the differential impact of high growth firms, we use indicator variables.
First, we build a simple dummy variable, which we call HGF, which identifies gazelles as firms whose
average growth rate is at least 20% over the whole period.6 This identifies 116 out of 335 firms as
6 Our data do not contain information on firm age; so we cannot use this in defining high growth firms. We
acknowledge that high growth firms may be the result of rather heterogenous growth patterns. For example,
merger and acquisition may introduce some noise in their identification (Delmar et al., 2003). Unfortunately, our
dataset did not allow us to check for the influence of these issues.

17
high growth and allows us to investigate shifts in the intercept in the estimated equations for
gazelles. We calculate the interaction variable [HGFsales growth(t-1)], which allows us to detect any
modification in the slope coefficient of sales growth of gazelles.
Following Coad (2010), we do not include individual dummies in the analysis. Although unobserved
heterogeneity, due, for example, to sector of activity, location, etc., can have important effects on
the estimation results, the inclusion of firm-specific dummies along with lagged variables could
produce biases in the fixed-effects estimation of the dynamic panel-data models, a problem known
as Nickell-bias. An alternative approach would be to use instrumental variables (IV) or GMM
estimators (Blundell and Bond, 1998). However, it is difficult to find good instruments, particularly
when dealing with growth rates. If the instruments are weak, IV estimation of panel VAR could lead
to imprecise estimates. Binder et al. (2005) propose a panel VAR model including firm-specific
effects, which is based on the assumption of normally distributed errors, but this assumption does
not apply to the growth rates of the variables in our regressions.
Since we are dealing with rates rather than levels of growth, in our view any firm-specific
components have been mostly removed. We follow the large literature on analysis of firm growth
rates which states that the non-Gaussian nature of growth rate residuals is a more important
econometric problem and deserving of careful attention.
In view of this, equation (3) is estimated via reduced form VARs, to avoid any ex ante definition of the
causal structure on the relationships between variables. Reduced form VARs correspond to a series
of m individual regressions. Given the distributional properties of the variables, we prefer to
implement LAD estimators.
18
4 Discussion of Empirical Results
Table 4 reports the results of the VAR estimation for the baseline model7. The rows correspond to
the regressions in the vector autoregression model. The columns present the differential effect of
each (lagged) explanatory variable on each dependent variable. For the purposes of the present
paper the first column contains the most important information because it shows the effect of lagged
sales growth rates on the seven model variables. However, it should be noted that all the coefficients
along the diagonal of the matrix are statistically significant, and with the exception of sales and
knowledge capital, are negative. This suggests that while growth of knowledge properties shows little
persistence, we observe some persistence in the case of sales and even more in the case of
knowledge capital. This result contrasts with previous findings (Coad, 2007, 2011) showing that the
lagged values of sales growth has a negative effect on present values. However, this difference may
be due to a peculiarity of the sampled firms, which is that they are all publicly listed and, therefore,
may be affected by positive performance in final markets.
>>> INSERT TABLE 4 ABOUT HERE <<<
In relation to the coefficients, in the first column we observe a positive relationship between lagged
sales growth and knowledge capital. This provides further support for the demand pull hypothesis
according to which increasing sales provide firms with the resources required for the production of
technological knowledge. For the effects on the properties of knowledge structure, we find that sales
growth is negatively related to knowledge coherence and cognitive distance, but positively related to
total variety. This suggests that the more firms grow, the more likely that their technology portfolios
will show more variety. Technological variety is characterized by low levels of complementarity
(coherence) (which supports the idea of an exploration strategy) but also by low levels of
dissimilarity. This would suggest that increasing sales growth is associated with exploration directed
7 The models discussed in this section have also been estimated by using OLS. The results obtained are similar to
those obtained with LAD estimations in terms of coefficients’ signs and significance, especially for what
concerns the HGF dummy.

19
towards the discovery of new, complementary fields that are not too distant from the firm’s existing
technological competences.
In order to understand whether high-growth firms show idiosyncratic patterns, Table 5 includes the
dummy HGF as a regressor in all the VAR equations. If we look at the first two columns in Table 5, we
can see that the results for patterns of persistence of the observed variables do not vary much. Note
also that the effects of sales growth on these patterns are similar to the effects in Table 4. Increasing
sales growth rates stimulates rates of growth of knowledge capital and knowledge variety, achieved
by the adoption of search strategies directed to exploring new complementary fields that are still
close to the firm’s existing technological capabilities.
>>> INSERT TABLE 5 ABOUT HERE <<<
If we look at the HGF dummy, we see that, as expected, the coefficient of sales growth is positive and
significant. It is also positive and significant for rate of growth of knowledge capital, suggesting that
the economic influences on knowledge creation operating via the demand side are even stronger in
the case of gazelles. If we look at the effects on the properties of knowledge structure, we find that
the dummy is significant only in the case of cognitive distance, where the coefficient is negative. This
suggests that, provided that increasing growth rates are associated with a reduction in cognitive
distance, high growth firms tend to adopt search strategies characterized, on average, by lower levels
of dissimilarity. The dummy does not show any other significant effects on the knowledge variables.
In Table 6, we include the interaction variable [sales growth(t-1)HGF]. The pattern does not change
much in relation to rates of growth rates of the variables under scrutiny; the coefficient relating the
lagged to the present value of each of the properties of knowledge structure is negative and
significant, but the sign on knowledge capital is positive and significant.
>>> INSERT TABLE 6 ABOUT HERE <<<
20
The effect of lagged sales growth on knowledge is in line with the previous estimates, suggesting that
increasing growth rates are likely to provide economic incentives for the commitment of resources
for knowledge creation activities. Even in this case, the patterns of effects on the properties of the
knowledge base confirm that increasing growth rates lead to the introduction of knowledge variety
through exploration strategies directed towards the widening of complementary technologies
(coherence), which are similar to the existing technology portfolio. This interpretation is supported
also by the positive and significant coefficient of related variety.
Columns 2 and 3 of Table 6 refer to the subgroup of high growth firms. The coefficients of the
dummy variable suggest that it promotes higher rates of growth of knowledge capital. In addition,
and importantly, gazelles are characterized on average by lower rates of growth of coherence, which
is consistent with the tendency to adopt exploratory behaviours, although the negative coefficient of
sales growth is mitigated by the coefficient of the interaction variables. That is, high growth firms on
average tend to adopt exploration strategies, although in that subgroup increasing rates of growth
do not lead to consistent variations in this behaviour. The value and the negative sign of the variety
variables confirms that increasing growth rates in the group of gazelles are associated with fairly
stable technological variety.
The analysis would seem to support the idea that gazelles cannot be unambiguously categorized as
Schumpeter Mark I or Mark II innovating firms. They seem to follow a hybrid pattern of search
behaviour, characterized both by exploration and implementation of organized search strategies.
Thus, gazelles are associated more with an organized exploration pattern, and would fit in the
bottom-left quadrant of Figure 1. On average, increasing sales growth rates stimulate the creation of
new technological knowledge through the adoption of search behaviours directed more to screening
new complementary fields, which are compatible with an exploration strategy. However, the
screening activity is not random: it seems that fast growing firms prefer to remain reasonably close
to their existing technological competences. In the group of gazelles this pattern of behaviour is

21
especially marked since they appear to be characterized by lower rates of growth of coherence and
cognitive distance, and related variety on average. We find therefore, that high growth firms, and
especially gazelles, predominantly follow exploration strategies that have some of the characteristics
of organized search more typical of an exploitation strategy.
5 Conclusions
The process of firm growth has attracted the attention of economists for many years. A relatively
recent strand in the literature on high-growth firms refers to gazelles or fast growing firms, based on
evidence of their exceptional contribution to aggregate economic growth. However, few studies look
at the relationship between high-growth firms and innovation. The literature mostly analyses
innovation as a determinant of high rates of growth. There are no studies of the contribution made
by gazelles to the process of knowledge creation.
The main objective of this paper was to investigate the differential contribution of high growth firms
to the process of knowledge creation drawing on the literature on Schumpeterian patterns of
innovation to construct a demand-pull framework à la Schmookler in which sales growth is the
motivation for the creation of new technological knowledge. We investigated whether gazelles are
more likely to follow Mark I or Mark II patterns of knowledge creation.
The inclusion of recombinant knowledge theory in our framework allowed us to propose the concept
of knowledge structure characterized by three properties - variety (related and unrelated),
coherence, and similarity - which can be usefully employed to distinguish between ‘random
screening’ and ‘organized search’ strategies.
The analysis was based on data on listed companies and patent applications. We implemented a
series of VARs estimated by means of LAD estimators, including a dummy and interaction variable to
detect differential performance by gazelles. The empirical results suggest that within the group of
high growth firms, increasing sales growth rates stimulate the creation of new technological

22
knowledge and also drive search behaviours characterized by the screening of complementary fields
across the technology landscape that are not too far removed from the firm’s existing technological
competences. In this respect, the distinctive knowledge dynamics of gazelles are likely to shape their
positive impacts on industry dynamics (Bos and Stam, 2014).
This paper is a first attempt to investigate the contribution of gazelles to the process of knowledge
creation. Future work could analyse the relationship by splitting the sample according to different
quantile definitions. Empirical implementations of knowledge coherence, such as in this paper, have
been criticized by Bottazzi and Pirino (2010); it would be interesting to use the corrected index they
propose, to check whether our results still hold. It would be interesting also to check the robustness
of our results, by implementing different estimators to account for the distribution of explanatory
variables and the impact of outliers.
Moreover, the evidence provided by this paper constitutes a basis for further interesting
investigations, and especially in the domain of innovation and technology policies. Because high-
growth firms are important knowledge producers, the dynamics leading them to be innovative and to
take stock of their ability to broaden their knowledge bases, should be taken into account by policy
makers. Moreover, they require special consideration as they are spread across all industries in the
economy. Innovation policies should in this respect be careful and valorise the contribution made by
gazelles through the processes of creative destruction.

23
6 References
Acs, Z., Anselin, L. and Varga, A. (2002), ‘Patents and Innovation Counts as Measures of Regional
Production of New Knowledge,’ Research Policy, 2002, 31(7), 1069-1085.
Acs, Z. and Mueller, P. (2008), ‘Employment effect of business dynamics: mice, gazelles and
elephants,’ Small Business Economics, 30, 85-100.
Antonelli, C., Krafft, J. and Quatraro, F. (2010), ‘Recombinant Knowledge and Growth: The Case of
ICTs,’ Structural Change and Economic Dynamics, 21(1), 50-69.
Arthur, W.B. (2009), The Nature of Technology. What It Is and How It Evolves. The Free Press: New
York.
Attaran, M. (1985), ‘Industrial diversity and economic performance in U.S. areas’, The Annals of
Regional Science, 20, 44-54.
Baldwin, C. Y. (2007), ‘Where do transactions come from? Modularity, transactions, and the
boundaries of firms,’ Industrial and Corporate Change, 17, 155-195.
Baldwin, C. Y. and Clark, K.B. (2000), Design Rules, Volume I, The power of Modularity. The MIT Press:
Cambridge MA.
Binder, M., C. Hsiao and C. H. Pesaran (2005), ‘Estimation and inference in short panel vector
autoregressions with unit roots and cointegration,’ Econometric Theory, 21, 795–837.
Birch, D. (1979), The job generation process. The MIT Press: Cambridge MA.
Birch, D. (1981), ‘Who creates jobs?,’ The Public interest, 65(fall), 3-14.
Blundell R.W and Bond S.R. (1998), ‘Initial conditions and moment restrictions in dynamic panel data
models,’ Journal of Econometrics, 87, 115-143.

24
Bos, J. and Stam, E. (2014), ‘Gazelles and industry growth,’ Industrial and Corporate Change, this
issue.
Boschma R. and Iammarino, S. (2009), ‘Related variety, trade linkages, and regional growth in Italy,’
Economic Geography, 85, 289-311.
Bottazzi, G., Coad, A., Jacoby, N. and Secchi, A. (2011), ‘Corporate growth and industrial dynamics:
evidence from French manufacturing,’ Applied Economics, 43, 103-116.
Bottazzi, G. And Pirino, D. (2010), ‘Measuring Industry Relatedness and Corporate Coherence,’ LEM
Working Paper 10/2010, Sant’Anna School of Advanced Studies, Pisa.
Bottazzi, G. and Secchi, A. (2006), ‘Explaining the Distribution of Firms Growth Rates,’ Rand Journal of
Economics, 37, 234–263.
Bottazzi, G., Secchi, A. (2003), ‘Common properties and sectoral specificities in the dynamics of U.S.
manufacturing companies,’ Review of Industrial Organization, 23, 217–232.
Breschi S., Lissoni, F. and Malerba, F. (2003), ‘Knowledge relatedness in firm technological
diversification,’ Research Policy, 32, 69-97.
Castaldi, C. and Dosi, G. (2009), ‘The patterns of output growth of firms and countries: Scale
invariances and scale specificities,’ Empirical Economics, 37, 475-495.
Coad, A. and Hölzl, W. (2011), ‘Firms growth: empirical analysis,’ in M. Dietrich and J. Krafft (eds),
Handbook on the economics and theory of the firm. Edward Elgar: Cheltenham.
Coad, A. and Rao, R. (2008), ‘Innovation and firm growth in high tech sectors: a quantile regression
approach,’ Research Policy, 37(4), 633-648.
Coad, A. and Rao, R. (2010), ‘Firm growth and R&D expenditure,’ Economics of Innovation and New
Technology, 19(2), 127–145.
Coad, A. (2011), ‘Appropriate business strategy for leaders and laggards,’ Industrial and Corporate
Change, 20, 1049-1079.

25
Coad, A. (2010), ‘Exploring the processes of firm growth: evidence from a vector auto-regression,’
Industrial and Corporate Change, 19, 1677-1703.
Coad, A. (2007), ‘A Closer Look at Serial Growth Rate Correlation,’ Review of Industrial Organization,
31(1), 69–82.
Colombelli, A., Krafft, J. And Quatraro, F. (2013), ‘Properties of knowledge base and firm survival:
Evidence from a sample of French manufacturing firms,’ Technological Forecasting and Social
Change, 80, 1469-1483.
Crespi, F. and Pianta, M. (2008), ‘Demand and innovation in productivity growth,’ International
Review of Applied Economics, 22, 655-672.
Crespi, F. and Pianta, M. (2007), ‘Demand and Innovation in European Industries,’ Economia Politica,
1/2007, 79-111.
Daunfeldt, S.O. and Elert, N. (2013), ‘When is Gibrats law a law?,’ Small Business Economics, 41, 133-
147.
Dosi, G. (1982), ‘Technological paradigms and technological trajectories,’ Research Policy, 11, 147–
162.
Fleming, L. (2001), ‘Recombinant Uncertainty in Technological Search,’ Management Science 47(1),
117-132.
Fleming, L., Mingo, S. and Chen, D. (2007), ‘Collaborative brokerage, generative creativity and
creative success,’ Administrative Science Quarterly, 52, 443-475.
Frenken K., van Oort, F. and Verbug, T. (2007), ‘Related Variety, Unrelated Variety and Regional
Economic Growth,’ Regional Studies, 41(5), 685-97.
Frenken, K. and Nuvolari, A. (2004), ‘Entropy Statistics as a Framework to Analyse Technological
Evolution,’ in J. Foster and W. Hölzl (eds), Applied Evolutionary Economics and Complex
Systems. Edward Elgar: Cheltenham, U.K. and Northampton, Mass.

26
Gibrat, R. (1931), Les inégalités économiques. Recueil Sirey, Paris.
Griliches, Z. (1979), ‘Issues in assessing the contribution of research and development to productivity
growth,’ The Bell Journal of Economics, 10, 92-116.
Griliches, Z. (1990), ‘Patent statistics as economic indicators: a survey,’ Journal of Economic
Literature, 28, 1661-1707.
Griliches, Z. and Schmookler, J. (1963), ‘Inventing and maximizing,’ American Economic Review, 53,
725-29.
Hall, B.H., Griliches Z. and Hausman J.A. (1986), ‘Patents and R and D: Is there a lag?,’ International
Economic Review, 27, 265-283.
Henderson, R.M and Clark, K.B. (1990), ‘Architectural innovation: The reconfiguration of existing
product technologies and the failure of established firms,’ Administrative Science Quarterly,
35, 9-30.
Henrekson, M. and Johansson, D. (2010), ‘Gazelles as Job Creators - A Survey and Interpretation of
the Evidence,’ Small Business Economics, 35(2), 227-244.
Hölzl, W. (2009), ‘Is the R&D behaviour of fast-growing SMEs different? Evidence from CIS III data for
16 countries,’ Small Business Economics, 33(1), 59-75.
Hölzl,W. (2010), ‘The Economics of Entrepreneurship Policy: Introduction to the Special Issue,’
Journal of Industry, Competition and Trade, 10(3), 187-197.
Jaffe, A. (1986), ‘Technological Opportunity and Spillovers of R&D: Evidence from Firms' Patents,
Profits, and Market Value,’ American Economic Review, 76(5), 984-1001.
Jaffe, A. (1989), ‘Real Effects of Academic Research,’ American Economic Review, 79(5), 957-70.
Katila, R. and Ahuja, G. (2002), ‘Something old, something new: a Longitudinal Study of Search
Behaviour and New Product Introduction,’ Academy of Management Journal, 45(6), 1183-
1194.

27
Kauffman, S.A. (1993), Origins of order: Self-Organization and selection in evolution. Oxford
University Press: Oxford.
Krafft, J. and Quatraro, F. (2011), ‘The dynamics of technological knowledge: from linearity to
recombination,’ in Antonelli, C. (ed) Handbook on the Economic Complexity of Technological
Change. Edward Elgar: Cheltenham.
Krafft, J., Quatraro, F. and Saviotti, P.P. (2009), ‘Evolution of the knowledge base in knowledge
intensive sectors,’ LEI-BRICK Working Paper no 06/2009.
Krafft, J., Quatraro, F. and Saviotti, P.P. (2011), ‘The knowledge base evolution in biotechnology: A
social network analysis,’ Economics of Innovation and New Technology, 20, 445-477.
Lane, D.A., van Der Leeuw, S.E., Pumain, D., West, G. (eds.) (2009), Complexity perspectives in
innovation and social change. Springer, Berlin.
Lee, K. (2010), ‘A theory of firm growth: learning capability, knowledge threshold, and patterns of
growth,’ Research Policy, 39, 278-289.
Lotti, F., Santarelli, E. and Vivarelli, M. (2003), ‘Does Gibrats Law Hold Among Young, Small Firms?,’
Journal of Evolutionary Economics, 13, 213-35
Lotti, F., Santarelli, E. and Vivarelli, M. (2009), ‘Defending Gibrat's Law as a Long-Run Regularity,’
Small Business Economics, 32, 31-44
Malerba, F. and Orsenigo, L. (1995), ‘Schumpeterian Patterns of Innovation,’ Cambridge Journal of
Economics, 19(1), 47-65.
Malerba, F. and Orsenigo, L. (1997), ‘The Dynamics and Evolution of Industries,’ Industrial and
Corporate Change, 5(1), 51-87.
Mansfield, E. (1980), ‘Basic research and productivity increase in manufacturing,’ American Economic
Review, 70, 863-73.

28
March, J. (1991), ‘Exploration and exploitation in organizational learning,’ Organization Science, 2(1),
71-87.
Murmann, J.P. and Frenken, K. (2006), ‘Towards a systematic framework for research on dominant
designs, technological innovations, and industrial change,’ Research Policy, 35, 925-952.
Nelson, R.R. and Winter, S.W. (1982), An Evolutionary Theory of Economic Change. Harvard
University Press: Cambridge, MA.
Nesta, L. and Saviotti, P.P. (2005), ‘Coherence of the Knowledge Base and the Firm's Innovative
Performance: Evidence from the U.S. Pharmaceutical Industry,’ Journal of Industrial
Economics, 53(1) 123-42.
Nesta, L. and Saviotti, P.P. (2006), ‘Firm Knowledge and Market Value in Biotechnology,’ Industrial
and Corporate Change, 15(4) 625-52.
Nesta, L. (2008), ‘Knowledge and productivity in the world’s largest manufacturing corporations,’
Journal of Economic Behaviour and Organization, 67, 886-902.
Nightingale, P. (1998), ‘A cognitive model of innovation,’ Research Policy, 27, 689-709.
Nightingale, P. and Coad, A. (2014), ‘Gazelles and MUPPETS: Ideological and Methodological Biases in
Entrepreneurship Research,’ Industrial and Corporate Change, this issue.
Nooteboom, B. (2000), Learning and innovation in organizations and economies, Oxford: Oxford
University Press.
Ostergaard, C., Timmermans, B., and Kristinssson, K. (2011), ‘Does a different view create something
new? The effect of employee diversity on innovation,’ Research Policy, 40, 500-509.
Pakes, A., Schankerman, M. (1984), ‘The rate of obsolescence of patents, research gestation lags, and
the private rate of return to research resources,’ in: Griliches, Z. (Ed.)., R&D, Patents, and
Productivity. University of Chicago Press: Chicago.
29
Pakes, A. and Schankerman, M. (1977), ‘A decomposition of the intraindustry and interindustry
variance in research intensity in American manufacturing: Demand inducement,
technological opportunity, and appropriability,’ Harvard University. Manuscript.
Parker, S.C, Storey, D.J. and van Witteloostuijn, A. (2010), ‘What happens to gazelles? The
importance of dynamic management strategy,’ Small Business Economics, 35, 203-226.
Pavitt, K. (1985), ‘Patent statistics as indicators of innovative activities: Possibilities and problems,’
Scientometrics, 7, 77-99.
Quatraro, F. (2010), ‘Knowledge Coherence, Variety and Productivity Growth: Manufacturing
Evidence from Italian Regions,’ Research Policy, 39, 1289-1302.
Saviotti, P.P. (1988), ‘Information, variety and entropy in technoeconomic development,’ Research
Policy, 17(2), 89-103.
Saviotti, P.P. (2004), ‘Considerations about the production and utilization of knowledge,’ Journal of
Institutional and Theoretical Economics, 160, 100-121.
Saviotti, P.P. (2007), ‘On the dynamics of generation and utilisation of knowledge: The local character
of knowledge,’ Structural Change and Economic Dynamics, 18, 387-408.
Scherer, F.M. (1982), ‘Demand-Pull and Technological Invention: Schmookler Revisted,’ Journal of
Industrial Economics, 30, 225-237.
Schmookler, J. (1954), ‘The level of inventive activity,’ The Review of Economics and Statistics, 36,
183-190.
Schmookler, J. (1962), ‘Economic Sources of Inventive Activity,’ The Journal of Economic History, 22,
1-20.
Schmookler, J. (1966), Invention and Economic Growth. Harvard University Press: Cambridge, MA.
Teece, D., Rumelt, R., Dosi, G. and Winter, S. (1994), ‘Understanding Corporate Coherence: Theory
and Evidence,’ Journal of Economic Behaviour and Organization, 23(1), 1-30.

30
Theil, H. (1967), Economics and Information Theory. Amsterdam: North Holland.
Thoma, G., Torrisi, S., Gambardella, A., Guellec, D., Hall, B.H. and Haroff, D. (2010), ’ Harmonizing and
combining large datasets – an application to firm-level patent and accounting data,’ NBER
Working Paper 15851.
Weitzmann, M.L. (1998), ‘Recombinant growth,’ Quarterly Journal of Economics, 113, 331-360.

31
APPENDIX A – The properties of knowledge structure
Knowledge Variety
We measure variety in the firm’s knowledge base using the information entropy index. Entropy
measures the degree of disorder or randomness of the system, so that systems characterized by high
entropy will also be characterized by high levels of uncertainty (Saviotti, 1988).
The index was introduced to economic analysis by Theil (1967). Its earlier applications aimed at
measuring the degree of diversity of industrial activity (or of a sample of firms within an industry)
against a uniform distribution of economic activities in all sectors, or among firms (Attaran, 1985;
Frenken et al., 2007; Boschma and Iammarino, 2009).
Compared to common measures of variety and concentration, information entropy has some
interesting properties (Frenken and Nuvolari, 2004). An important feature of the entropy measure,
which we exploit in our analysis, is its multidimensional extension. Consider a pair of events (Xj, Ym),
and the probability of their co-occurrence pjm. A two dimensional (total) entropy measure can be
expressed as follows (firm and time subscripts are omitted for the sake of clarity):
q
j
w
m jm
jmp
pYXH1 1
2
1log),( (A1)
If pjm is assumed to be the probability that two technological classes j and m co-occur within the
same patent, then the measure of multidimensional entropy focuses on the variety of co-
occurrences of technological classes within firms’ patent portfolios.
Moreover, the total index can be decomposed in a ‘within’ and a ‘between’ part whenever the
events to be investigated can be aggregated to form a smaller numbers of subsets. Within-entropy
measures the average degree of disorder or variety within the subsets, between-entropy focuses on

32
the subsets measuring the variety across them. It can be easily shown that the decomposition
theorem also holds for the multidimensional case. Hence if one allows jSg and mSz (g = 1,…,G; z =
1,…, Z), we can rewrite H(X,Y) as follows:
G
g
Z
z
gzgzQ HPHYXH1 1
),( (A2)
where the first term on the right-hand-side is the between-group entropy and the second term is the
(weighted) within-group entropy. In particular:
G
g
Z
z gz
gzQP
PH1 1
2
1log (A2a)
g ZSj Sm
jmgz pP (A2b)
g zSj Sm gzjmgz
ij
gzPpP
pH
/
1log2 (A2c)
Following Frenken et al. (2007), we can refer to between-group and within-group entropy
respectively as unrelated technological variety (UTV) and related technological variety (RTV), while
total information entropy is referred to as general technological variety (TV). The distinction between
related and unrelated variety is based on the assumption that any pair of entities included in the
former generally are more closely related or more similar to any pair of entities included in the latter.
This assumption is reasonable given that a type of entity (patent, industrial sector, trade categories
etc.) is organized according to a hierarchical classification. In this case each class at a given level of
aggregation contains ‘smaller’ classes, which, in turn contain yet ‘smaller’ classes. Here, small refers
to a low level of aggregation.
We can reasonably expect then that the average pair of entities at a given level of aggregation will be
more similar than the average pair of entities at a higher level of aggregation. Thus, what we call

33
related variety is measured at a lower level of aggregation (3 digit class within a 1 digit macro-class)
than unrelated variety (across 1 digit macro-classes). This distinction is important because we can
expect unrelated (or inter-group) variety to affect productivity growth negatively, while related (or
intra-group) variety is expected to be positively related to productivity growth. Moreover, the
evolution of total variety is heavily influenced by the relative dynamics of related and unrelated
variety, such that if unrelated variety is dominant the effects of total variety on productivity growth
can be expected to be negative, while the opposite holds if related technological variety dominates
the total index (Krafft, Quatraro, Saviotti, 2011).
Knowledge Coherence
Third, we calculated the coherence (R) of firms’ knowledge bases, defined as the average
complementarity of any technology randomly chosen within the firm’s portfolio with respect to any
other technology (Nesta and Saviotti, 2005, 2006; Nesta, 2008).
To yield the knowledge coherence index, a number of steps is required. In what follows we
describe how to derive the index at the firm level. First, we need to calculate the weighted average
relatedness WARi of technology i with respect to all other technologies present in the sector. Such a
measure builds on the measure of technological relatedness ,. The calculation of such a measure
builds on the relatedness matrix. The technological universe consists of k patent applications. Let Pmk
= 1 if the patent k is assigned the technology m [m = 1, …, n], and 0 otherwise. The total number of
patents assigned to technology m is k mkm PO . Similarly, the total number of patents assigned to
technology j is k jkj PO . Since two technologies may occur within the same patent,
jm OO , and thus the observed the number of observed co-occurrences of technologies m and

34
j is k jkmkmj PPJ .. Applying this relationship to all possible pairs yields a square matrix (n n)
whose generic cell is the observed number of co-occurrences:
nnmnn
njmjj
nm
JJJ
JJJ
JJJ
1
1
1111
(A1)
We assume that the number xmj of patents assigned to both technologies m and j is a
hypergeometric random variable of mean and variance:
K
OOxXE
jm
mjmj )( (A2)
1
2
K
OK
K
OK jmijmj (A3)
If the observed number of co-occurrences Jmj is larger than the expected number of random
co-occurrences mj, then the two technologies are closely related: the fact the two technologies
occur together in the number of patents xij is not casual. The measure of relatedness hence is given
by the difference between the observed number and the expected number of co-occurrences,
weighted by their standard deviation:
mj
mjmj
mj
J
(A4)
It is worth noting that our relatedness measure has no lower and upper bounds:
;mj . Moreover, the index shows a distribution similar to a t-student, so that if
96.1;96.1 mj , one can safely accept the null hypothesis of non-relatedness of the two
technologies i and j. The technological relatedness matrix ’ may hence be thought about as a
weighting scheme to evaluate the technological portfolio of firms.

35
Following Teece et al. (1994), WARj is defined as the degree to which technology j is related to all
other technologies mj within the firm i, weighted by patent count Pmit:
im mit
jm mitjm
jitP
PWAR
(A3)
Finally, knowledge base coherence within the firm is defined as the weighted average of the WARjit
measure:
mj j jit
jit
jititP
PWARR (A4)
This measure captures the degree to which the technologies making up the firm’s knowledge base
are complementary. The relatedness measure jm indicates that utilization of technology j implies
utilization of technology m in order to perform specific functions that are not reducible to their
independent use. This makes the coherence index appropriate for the purposes of this study.
Cognitive Distance
We implement a measure of knowledge similarity, proxied by cognitive distance (Nooteboom, 2000),
which expresses the dissimilarities amongst different types of knowledge. A useful index of distance
can be derived from the measure of technological proximity, originally proposed by Jaffe (1986,
1989), who investigated the proximity of firms’ technological portfolios. Breschi et al. (2003) adapted
the index in order to measure the proximity, or relatedness, between two technologies. The idea is
that each firm is characterized by a vector V of the k technologies that occur in its patents.
Knowledge similarity can first be calculated for a pair of technologies l and j as the angular separation

36
or uncentred correlation of the vectors Vlk and Vjk. The similarities between technologies l and j can
then be defined as follows:
n
k jk
n
k lk
n
k jklk
lj
VV
VVS
1
2
1
2
1
(A5)
The idea behind the calculation of this index is that two technologies j and i are similar to the extent
that they co-occur with a third technology k. The cognitive distance between j and i is the
complement of their index of the similarity:
ljlj Sd 1 (A6)
Once an index is calculated for all possible pairs, it needs to be aggregated at the firm level to obtain
a synthetic index of technological distance. This is done in two steps. First we compute the weighted
average distance of technology i, i.e. the average distance of i from all other technologies.
lj jit
lj jitlj
ltP
PdWAD (A7)
where Pj is the number of patents in which the technology j is observed. Then we can obtain the
average cognitive distance at time t as follows:
l
l lit
litlitt
P
PWADCD (A8)

37
Appendix B - Sectoral classification and concordance Macro sectors Sector STAN (ISIC 3) Datastream
Pharmaceuticals 2423 4577 High-technology manufactures Office, accounting and computing machinery 30 9572, 9574
HT Radio, television and communication equipment 32 2737, 3743, 3745,3747,9576, 9578 Medical, precision and optical instruments 33 4535, 4537, 4573 Aircraft and spacecraft 353 2713, 2717
Chemicals excluding pharmaceuticals 24ex2423 1353, 1357 Medium-high technology manuf. Machinery and equipment, n.e.c. 29 573, 583, 2757
MHT Electrical machinery and apparatus, nec 31 2733, 3722
Motor vehicles, trailers and semi-trailers and other transport equipment, aircraft excluded
34, 351, 352-359 2753, 3353, 3355
Coke, refined petroleum products and nuclear fuel 23 533, 537, 577, 587 Medium-low technology manuf. Rubber, plastics products and other non-metallic mineral products 25-26 2353, 2723, 3357
MLT Basic metals and fabricated metal products 27-28 1753, 1755, 1757
Food products and beverages 15 3533, 3535, 3537, 3577 Tobacco products 16 3785
Low technology manufactures Textiles, textile products, leather and footwear 17-19 3763, 3765 LT Pulp, paper and paper products 21 1737
Printing and publishing 22 5557 Manufacturing nec and recycling 36-37 2727, 3724, 3726, 3767
Post and telecommunications 64 5553, 6535, 6575 Financial intermediation (excl insurance, pension) 65 8355, 8773, 8779
Knowledge intensive sectors Insurance and pension funding 66 8532, 8534, 8536, 8538, 8575 KIS Activities related to financial intermediation 67 8775, 8777, 8985, 8995
Real estate activities 70 8633, 8637, 8671, 8672, 8673, 8674, 8675, 8676, 8677, 8771
Renting of m&eq and other business activities 71-74 2791, 2793, 2795, 2799, 5555, 9533, 9535, 9537 Health and social work 85 4533 Recreational cultural and sporting activities 92 5752, 5755
Less knowledge intensive sectors Wholesale, trade (excl. Motor vehicles) 51 2797, 5379 LKIS Retail trade; repair of household goods 52 5333, 5337, 5371, 5373, 5375
Hotels and restaurants 55 5753, 5757
Other services Transport and storage 60-63 2771, 2773, 2775, 2777, 2779, 5751, 5759 OS Community social and personal services 75-99 5377
Energy producing activities Mining, quarrying of energy producing materials 10-12 1771 EP Mining, quarrying (excl energy) 13-14 1773, 1775, 1777, 1779
Electricity, gas, and water supply 40-41 7535, 7537, 7573, 7575, 7577
Constr Construction 45 2357, 3728

38
Figure 1
Random search
Organized search
Exploration strategy Exploitation strategy
Schumpeter Mark 1
Schumpeter Mark 2 Organized Exploration
Random Exploitation
CD + KOH – UKV + RKV-
CD - KOH – UKV + RKV-
CD + KOH + UKV - RKV+
CD - KOH + UKV - RKV+
Note: The outer boxes refer to the possible innovation patterns described in Section 2. The inner
boxes report the expected signs of the variables introduced in Section 3.2.

39
Figure 2 – Kernel density estimation of growth rates distribution of the main variables

40
Figure 3 – Box plot of sales growth by macro-sector
Note: See Appendix B for the definition of macro-sectors.

41
Table 1 – Distribution of sampled firmsby macro-sector, size and country, 1988-2005
Macro Sector Country Size
Freq. Percent Freq. Percent Freq. Percent
HT 102 30.45 France 83 24.78 Large 271 80.9
MHT 123 36.72 Germany 114 34.03 Medium 45 13.43
MLT 11 3.28 Italy 34 10.15 Micro 1 0.3
LT 34 10.15 Netherlands 13 3.88 Small 18 5.37
KIS 26 7.76 Sweden 43 12.84
LKIS 1 0.30 UK 48 14.33
OS 5 1.49
Constr 23 6.87
EP 10 2.99
Total 335 100.00 335 100.00 335 100.00

42
Table 2 - Descriptive statistics (All variables are expressed in normalized growth rates according to Eq. 2).
Std. Dev. skewness kurtosis p10 p25 p50 p75 p90 Obs.
Sales Growth 0.395 1.716 33.500 -0.099 0.012 0.112 0.250 0.557 2819
Knowledge Coherence 0.353 -0.628 33.390 -0.288 -0.104 -0.007 0.089 0.285 2819
Knowledge Capital 0.178 2.351 13.146 -0.096 -0.032 0.041 0.138 0.272 2819
Cognitive Distance 0.242 0.278 11.531 -0.169 -0.032 -0.006 0.029 0.177 1448
Knowledge Variety 0.132 0.401 25.337 -0.058 -0.018 0.004 0.033 0.103 2554
Related Variety 0.231 0.553 10.983 -0.180 -0.049 0.001 0.067 0.235 2287
Unrelated Variety 0.167 0.088 10.986 -0.128 -0.031 0.006 0.043 0.151 2394

43
Table 3- Spearman’s Rank Correlation Matrix
Sales Growth Knowledge Coherence
Knowledge Capital
Cognitive Distance
Related Variety
Unrelated Variety
Knowledge Variety
Sales Growth 1.0000
Kn. Coherence -0.0048 1.0000
Knowledge Capital 0.0114 0.0862* 1.0000
Cognitive Distance -0.0212 0.0651* 0.0211 1.0000
Related Variety -0.0618* -0.1138* 0.3226* -0.0624* 1.0000
Unrelated Variety -0.0225 -0.1224* 0.1262* -0.0428 0.3677* 1.0000
Knowledge Variety 0.0124 0.0150 0.2184* -0.0098 0.4753* -0.3906* 1.0000
Note: * Significant at 5% level.

44
Table 4 – Results of VAR estimation, one-year lag. Baseline model (All variables are expressed in normalized growth rates according to Eq. 2).
Sales Growth(t-1)
Knowledge Coherence (t-1)
Knowledge Capital (t-1)
Cognitive Distance (t-1)
Related Variety (t-1)
Unrelated Variety (t-1)
Knowledge Variety (t-1)
N. Obs.
Sales Growth
.101*** (.008)
.007 (.012)
-.103*** (.028)
.031* (.016)
-.026 (.039)
-.003 (.055)
.091 (.104)
1366
Knowledge Coherence
-.021*** (.007)
-.303*** (.009)
.035 (.022)
.016 (.013)
.072** (.031)
.113*** (.044)
-.282*** (.082)
1366
Knowledge Capital
.013*** (.003)
.006 (.005)
.699*** (.011)
.0001 (.006)
-.037** (.015)
-.044** (.022)
.119*** (.041)
1366
Cognitive Distance
-.008*** (.003)
.002 (.004)
.011 (.009)
-.013** (.005)
.004 (.014)
-.012 (.019)
.057 (.037)
1288
Related Variety
.0004 (.005)
.010 (.007)
.130*** (.017)
.020** (.010)
-.240*** (.024)
-.021 (.033)
.195*** (.063)
1366
Unrelated Variety
-.00006 (.004)
-.0001 (.005)
.004 (.013)
.003 (.008)
.042** (.019)
-.072*** (.027)
.015 (.051)
1366
Knowledge Variety
.005** (.002)
.001 (.003)
.081*** (.008)
-.010** (.004)
.026** (.011)
.036** (.016)
-.239*** (.030)
1366
Note: bootstrapped standard errors between parentheses. p<0.1; ** : p<0.05; *** : p<0.01.

45
Table 5 - Results of VAR estimation. One-year lag. Model including a dummy for HGFs (All variables are expressed in normalized growth rates according to Eq. 2).
Sales Growth(t-1)
HGF (dummy)
Knowledge Coherence (t-1)
Knowledge Capital (t-1)
Cognitive Distance (t-1)
Related Variety (t-1)
Unrelated Variety (t-1)
Knowledge Variety (t-1)
N. Obs.
Sales Growth
.063*** (.009)
.218*** (.009)
.030** (.012)
-.097*** (.029)
.001 (.017)
.049 (.040)
.050 (.057)
-.066 (.107)
1366
Knowledge Coherence
-.020*** (.006)
-.008 (.006)
-.299*** (.008)
.031* (.019)
.018* (.011)
.062** (.026)
.094*** (.038)
-.262*** (.071)
1366
Knowledge Capital
.0137*** (.004)
.009** (.004)
.006 (.005)
.694*** (.012)
-.003 (.007)
-.025 (.018)
-.030 (.025)
.092** (.047)
1366
Cognitive Distance
-.009*** (.003)
-.005* (.003)
.002 (.004)
.011 (.009)
-.011** (.006)
-.006 (.014)
-.028 (.020)
.093** (.038)
1228
Related Variety
-.0002 (.005)
.001 (.006)
.010 (.007)
.129*** (.018)
.020* (.010)
-.236*** (.026)
-.018 (.036)
.187*** (.068)
1366
Unrelated Variety
-.0007 (.004)
.005 (.004)
.0004 (.006)
.010 (.014)
.0014 (.008)
.051*** (.020)
-.065** (.029)
-.011 (.054)
1366
Knowledge Variety
.005** (.002)
.002 (.003)
.001 (.003)
.081*** (.008)
-.009** (.004)
.025** (.011)
.035** (.016)
-.235*** (.031)
1366
Note: bootstrapped standard errors between parentheses. p<0.1; ** : p<0.05; *** : p<0.01.
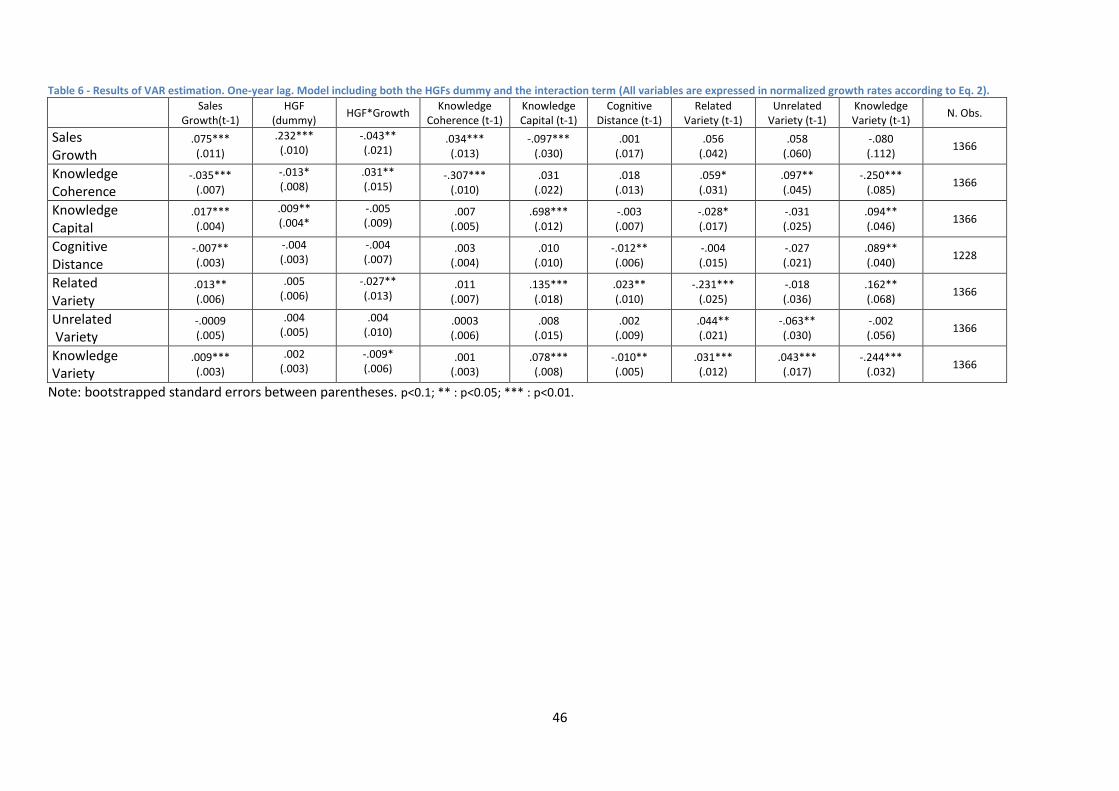
46
Table 6 - Results of VAR estimation. One-year lag. Model including both the HGFs dummy and the interaction term (All variables are expressed in normalized growth rates according to Eq. 2).
Sales
Growth(t-1) HGF
(dummy) HGF*Growth
Knowledge Coherence (t-1)
Knowledge Capital (t-1)
Cognitive Distance (t-1)
Related Variety (t-1)
Unrelated Variety (t-1)
Knowledge Variety (t-1)
N. Obs.
Sales Growth
.075*** (.011)
.232*** (.010)
-.043** (.021)
.034*** (.013)
-.097*** (.030)
.001 (.017)
.056 (.042)
.058 (.060)
-.080 (.112)
1366
Knowledge Coherence
-.035*** (.007)
-.013* (.008)
.031** (.015)
-.307*** (.010)
.031 (.022)
.018 (.013)
.059* (.031)
.097** (.045)
-.250*** (.085)
1366
Knowledge Capital
.017*** (.004)
.009** (.004*
-.005 (.009)
.007 (.005)
.698*** (.012)
-.003 (.007)
-.028* (.017)
-.031 (.025)
.094** (.046)
1366
Cognitive Distance
-.007** (.003)
-.004 (.003)
-.004 (.007)
.003 (.004)
.010 (.010)
-.012** (.006)
-.004 (.015)
-.027 (.021)
.089** (.040)
1228
Related Variety
.013** (.006)
.005 (.006)
-.027** (.013)
.011 (.007)
.135*** (.018)
.023** (.010)
-.231*** (.025)
-.018 (.036)
.162** (.068)
1366
Unrelated Variety
-.0009 (.005)
.004 (.005)
.004 (.010)
.0003 (.006)
.008 (.015)
.002 (.009)
.044** (.021)
-.063** (.030)
-.002 (.056)
1366
Knowledge Variety
.009*** (.003)
.002 (.003)
-.009* (.006)
.001 (.003)
.078*** (.008)
-.010** (.005)
.031*** (.012)
.043*** (.017)
-.244*** (.032)
1366
Note: bootstrapped standard errors between parentheses. p<0.1; ** : p<0.05; *** : p<0.01.
Related Documents