Mark G. Turner University of Cincinnati, Cincinnati, Ohio Andrew Norris Ohio Aerospace Institute, Brook Park, Ohio Joseph P. Veres Glenn Research Center, Cleveland, Ohio High-Fidelity Three-Dimensional Simulation of the GE90 NASA/TM—2004-212981 March 2004 AIAA–2003–3996 https://ntrs.nasa.gov/search.jsp?R=20040045342 2020-03-13T09:25:31+00:00Z

Welcome message from author
This document is posted to help you gain knowledge. Please leave a comment to let me know what you think about it! Share it to your friends and learn new things together.
Transcript
Mark G. TurnerUniversity of Cincinnati, Cincinnati, Ohio
Andrew NorrisOhio Aerospace Institute, Brook Park, Ohio
Joseph P. VeresGlenn Research Center, Cleveland, Ohio
High-Fidelity Three-DimensionalSimulation of the GE90
NASA/TM—2004-212981
March 2004
AIAA–2003–3996
https://ntrs.nasa.gov/search.jsp?R=20040045342 2020-03-13T09:25:31+00:00Z

The NASA STI Program Office . . . in Profile
Since its founding, NASA has been dedicated tothe advancement of aeronautics and spacescience. The NASA Scientific and TechnicalInformation (STI) Program Office plays a key partin helping NASA maintain this important role.
The NASA STI Program Office is operated byLangley Research Center, the Lead Center forNASA’s scientific and technical information. TheNASA STI Program Office provides access to theNASA STI Database, the largest collection ofaeronautical and space science STI in the world.The Program Office is also NASA’s institutionalmechanism for disseminating the results of itsresearch and development activities. These resultsare published by NASA in the NASA STI ReportSeries, which includes the following report types:
∑ TECHNICAL PUBLICATION. Reports ofcompleted research or a major significantphase of research that present the results ofNASA programs and include extensive dataor theoretical analysis. Includes compilationsof significant scientific and technical data andinformation deemed to be of continuingreference value. NASA’s counterpart of peer-reviewed formal professional papers buthas less stringent limitations on manuscriptlength and extent of graphic presentations.
∑ TECHNICAL MEMORANDUM. Scientificand technical findings that are preliminary orof specialized interest, e.g., quick releasereports, working papers, and bibliographiesthat contain minimal annotation. Does notcontain extensive analysis.
∑ CONTRACTOR REPORT. Scientific andtechnical findings by NASA-sponsoredcontractors and grantees.
∑ CONFERENCE PUBLICATION. Collectedpapers from scientific and technicalconferences, symposia, seminars, or othermeetings sponsored or cosponsored byNASA.
∑ SPECIAL PUBLICATION. Scientific,technical, or historical information fromNASA programs, projects, and missions,often concerned with subjects havingsubstantial public interest.
∑ TECHNICAL TRANSLATION. English-language translations of foreign scientificand technical material pertinent to NASA’smission.
Specialized services that complement the STIProgram Office’s diverse offerings includecreating custom thesauri, building customizeddatabases, organizing and publishing researchresults . . . even providing videos.
For more information about the NASA STIProgram Office, see the following:
∑ Access the NASA STI Program Home Pageat http://www.sti.nasa.gov
∑ E-mail your question via the Internet [email protected]
∑ Fax your question to the NASA AccessHelp Desk at 301–621–0134
∑ Telephone the NASA Access Help Desk at301–621–0390
∑ Write to: NASA Access Help Desk NASA Center for AeroSpace Information 7121 Standard Drive Hanover, MD 21076
Mark G. TurnerUniversity of Cincinnati, Cincinnati, Ohio
Andrew NorrisOhio Aerospace Institute, Brook Park, Ohio
Joseph P. VeresGlenn Research Center, Cleveland, Ohio
High-Fidelity Three-DimensionalSimulation of the GE90
NASA/TM—2004-212981
March 2004
National Aeronautics andSpace Administration
Glenn Research Center
Prepared for the16th Computational Fluid Dynamics Conference andthe 33rd Fluid Dynamics Conference and Exhibitsponsored by the American Institute of Aeronautics and AstronauticsOrlando, Florida, June 23–26, 2003
AIAA–2003–3996
Acknowledgments
The authors wish to thank the support received from the Aerospace Propulsion and Power Program at NASAGlenn Research Center under the Vehicle Systems Program and Office of Aerospace Technology. The authors also
appreciate the continued interest by GE Aircraft Engines in the simulation of the GE90.
Available from
NASA Center for Aerospace Information7121 Standard DriveHanover, MD 21076
National Technical Information Service5285 Port Royal RoadSpringfield, VA 22100
This report is a formal draft or workingpaper, intended to solicit comments and
ideas from a technical peer group.
Trade names or manufacturers’ names are used in this report foridentification only. This usage does not constitute an officialendorsement, either expressed or implied, by the National
Aeronautics and Space Administration.
Available electronically at http://gltrs.grc.nasa.gov
This work was sponsored by the Low Emissions AlternativePower Project of the Vehicle Systems Program at the
NASA Glenn Research Center.
NASA/TM—2004-212981 1
High-Fidelity Three-Dimensional Simulation of the GE90
Mark G. Turner
University of Cincinnati Cincinnati, Ohio 45220
Andrew Norris
Ohio Aerospace Institute Brook Park, Ohio 44142
Joseph P. Veres
National Aeronautics and Space Administration Glenn Research Center Cleveland, Ohio 44135
Summary A full-engine simulation of the three-dimensional flow in the GE90–94B high bypass ratio turbofan engine has been achieved. It would take less than 11 hr of wall clock time if starting from scratch through the exploitation of parallel processing. The simulation of the compressor components, the cooled high-pressure turbine, and the low-pressure turbine was performed using the APNASA turbomachinery flow code. The com-bustor flow and chemistry were simulated using the National Combustor Code (NCC). The engine simulation matches the engine thermodynamic cycle for a sea-level takeoff condition. The simula-tion is started at the inlet of the fan and progresses downstream. Comparisons with the cycle point are presented. A detailed look at the blockage in the turbomachinery is presented as one measure to assess and view the solution and the multistage interaction effects.
Introduction One of the goals of the Numerical Propulsion System Simulation (NPSS) Program at the NASA Glenn Research Center has been to demonstrate a high-fidelity three-dimensional turbofan engine simulation. This simulation will support the mult-dimensional, multifidelity, multidiscipline concept of the design and analysis of propulsion systems for the future. This paper describes the
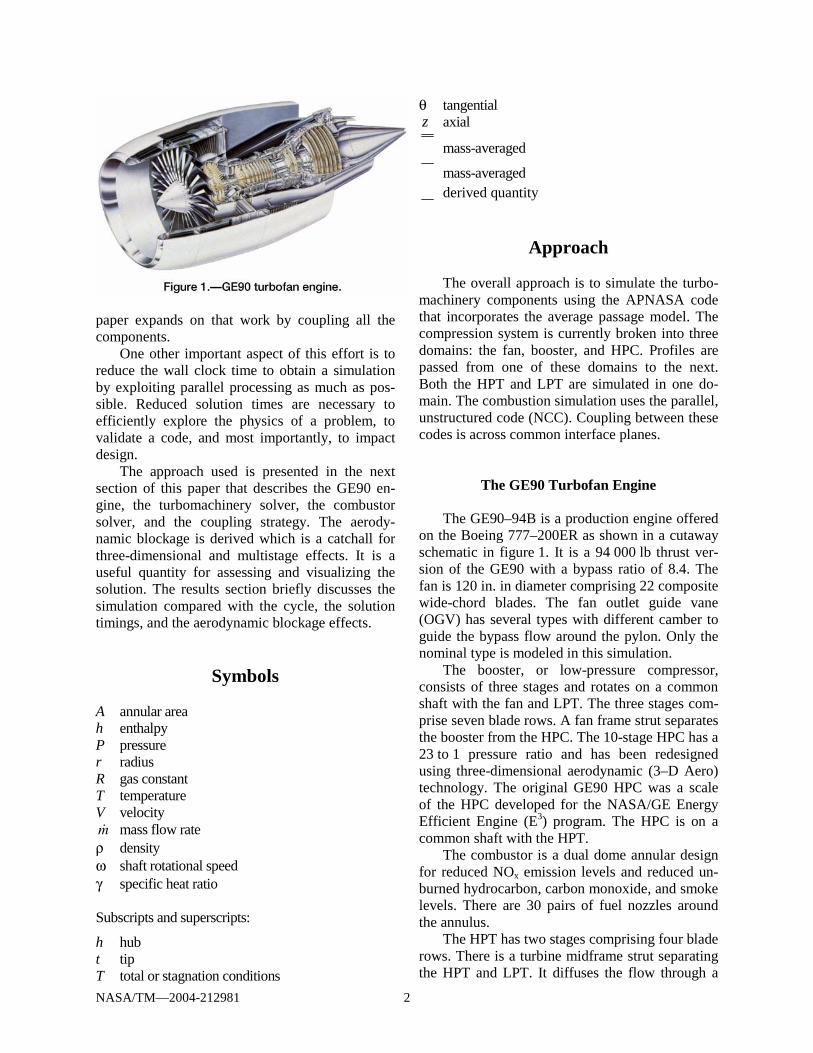
current status of one major part of that goal: the complete turbofan engine simulation using an advanced three-dimensional Navier-Stokes turbo-machinery solver, APNASA, coupled with the National Combustion Code (NCC). A production engine has been chosen for this demonstration: the GE90 turbofan engine shown in figure 1. A sea-level, Mach 0.25, takeoff condi-tion has been used for the simulation. The main reason is that detailed cooling flows for the turbine are well known at takeoff since this represents the cooled turbine design condition. Since the cooling flow represents a significant amount of the re-quired boundary condition information, it was felt this was a good point for the simulation. It also represents a condition where there are the highest temperatures and most stress in the engine, and is therefore a practical point to gain further understanding. The GE90 development program included component testing of all the turbomachinery as well as the combustor. The full engine simulation effort has taken advantage of this. All the turbo-machinery components have been analyzed and compared to component test data to validate and calibrate the approach. These efforts have been presented by Adamczyk (ref. 2), Turner et al. (ref. 11), and Turner (ref. 12). Also presented by Turner et al. (ref. 11) was the coupled high- and low-pressure turbine run at engine conditions. Turner (ref. 13) has presented an uncoupled fan and booster with a coupled high-pressure com-pressor (HPC) combustor, high-pressure turbine (HPT), and low-pressure turbine (LPT). This
NASA/TM—2004-212981 2
paper expands on that work by coupling all the components. One other important aspect of this effort is to reduce the wall clock time to obtain a simulation by exploiting parallel processing as much as pos-sible. Reduced solution times are necessary to efficiently explore the physics of a problem, to validate a code, and most importantly, to impact design. The approach used is presented in the next section of this paper that describes the GE90 en-gine, the turbomachinery solver, the combustor solver, and the coupling strategy. The aerody-namic blockage is derived which is a catchall for three-dimensional and multistage effects. It is a useful quantity for assessing and visualizing the solution. The results section briefly discusses the simulation compared with the cycle, the solution timings, and the aerodynamic blockage effects.
Symbols A annular area h enthalpy P pressure r radius R gas constant T temperature V velocity m mass flow rate ρ density ω shaft rotational speed γ specific heat ratio Subscripts and superscripts:
h hub t tip T total or stagnation conditions
θ tangential z axial
mass-averaged
mass-averaged derived quantity
Approach The overall approach is to simulate the turbo-machinery components using the APNASA code that incorporates the average passage model. The compression system is currently broken into three domains: the fan, booster, and HPC. Profiles are passed from one of these domains to the next. Both the HPT and LPT are simulated in one do-main. The combustion simulation uses the parallel, unstructured code (NCC). Coupling between these codes is across common interface planes.
The GE90 Turbofan Engine The GE90–94B is a production engine offered on the Boeing 777–200ER as shown in a cutaway schematic in figure 1. It is a 94 000 lb thrust ver-sion of the GE90 with a bypass ratio of 8.4. The fan is 120 in. in diameter comprising 22 composite wide-chord blades. The fan outlet guide vane (OGV) has several types with different camber to guide the bypass flow around the pylon. Only the nominal type is modeled in this simulation. The booster, or low-pressure compressor, consists of three stages and rotates on a common shaft with the fan and LPT. The three stages com-prise seven blade rows. A fan frame strut separates the booster from the HPC. The 10-stage HPC has a 23 to 1 pressure ratio and has been redesigned using three-dimensional aerodynamic (3–D Aero) technology. The original GE90 HPC was a scale of the HPC developed for the NASA/GE Energy Efficient Engine (E3) program. The HPC is on a common shaft with the HPT. The combustor is a dual dome annular design for reduced NOx emission levels and reduced un-burned hydrocarbon, carbon monoxide, and smoke levels. There are 30 pairs of fuel nozzles around the annulus. The HPT has two stages comprising four blade rows. There is a turbine midframe strut separating the HPT and LPT. It diffuses the flow through a
NASA/TM—2004-212981 3
high-angle outer diameter casing to a high diame-ter for an improved efficiency LPT. The LPT has 6 stages comprising 12 blade rows. A turbine rear frame strut follows this. The simulation consists of 49 blade rows of turbomachinery and a 24° sector of the combustor. The 49 blade rows include the fan, bypass splitter, nominal OGV (the pylon and different OGV types are not modeled), the 3-stage booster (7 blade rows), the fan frame strut, the 10-stage HPC (21 blade rows), the 2-stage HPT (4 blade rows), the turbine midframe strut, the 6-stage LPT (12 blade rows), and the turbine rear frame strut. Although there are 30 pairs of fuel nozzles, actual periodicity of the geometry requires the modeling of two pairs of fuel nozzles, or a 24° sector. Unique cooling arrangements make one pair of fuel nozzles a-periodic.
Turbomachinery Simulation The average passage approach is incorporated in the code APNASA as discussed by Adamczyk et al. (ref. 1). Adamczyk (ref. 2) in another paper also discusses the use of this tool to support turbomachinery aerodynamic design. Kirtley et al. (ref. 5) generalized the closure and allowed grids with less shear to be used. Some of the numerical details used in APNASA are
1. Four-stage Runge-Kutta explicit three-dimensional RANS solver
2. Local time steps 3. Implicit residual smoothing 4. Implicit k–ε turbulence model 5. Two levels of parallel using MPI message
passing Some of the physical models APNASA can handle are
1. Multistage effects modeled using the aver-age passage formulation of Adamczyk and generalized for nonpure H-grids
2. Wall functions 3. Rotor tip clearance flow 4. Compressor bleed, stator leakage, and tur-
bine cooling flow through inflow and out-flow leakage boundary conditions or source terms
5. Stator button geometry 6. Real gas effects with a linear relation
between the ratio of specific heats and temperature
7. Flow-path modifications directed by work of Hunter (ref. 4) to simulate cavities
All turbomachinery components have been simulated at engine conditions. The HPC simulation in this full engine simula-tion builds on the HPC component simulation presented by Adamczyk (ref. 2). To match the thermodynamic cycle model of the HPC, APNASA was run by adjusting the inlet total pres-sure to match the exit corrected mass flow. The turbine simulation is identical to that presented by Turner et al. (ref. 10) except that the combustor profiles have been used as a boundary condition and the shaft speeds were set to the cycle values. The corrected and physical shaft rotational speeds were held constant at cycle values.
Combustor Simulation The combustor has been simulated using the NCC explained by Ebrahimi et al. (ref. 3), Liu (ref. 6), and Ryder and McDivitt (ref. 8). This is a parallel-unstructured solver that uses a precondi-tioner to efficiently handle low Mach number flows. The Navier-Stokes flow solver is based on an explicit four-stage Runge-Kutta scheme. Turbu-lence closure is obtained via the standard k–ε model with a high Reynolds number wall function or a nonlinear k–ε model for swirling flows. The solver can be linked to any computer-aided design system via the Patran file system. CAD geometry can then be imported into the NCC system rela-tively easily. The NCC can be run with a gaseous fuel or by modeling the spray combustion process. Gaseous fuel with finite-rate chemistry has been used in the simulations thus far.
Coupling The coupling between APNASA and NCC takes place at an interface plane. There are many issues to address when coupling codes that are very different, and even have different models for properties. Several key quantities must be
NASA/TM—2004-212981 4
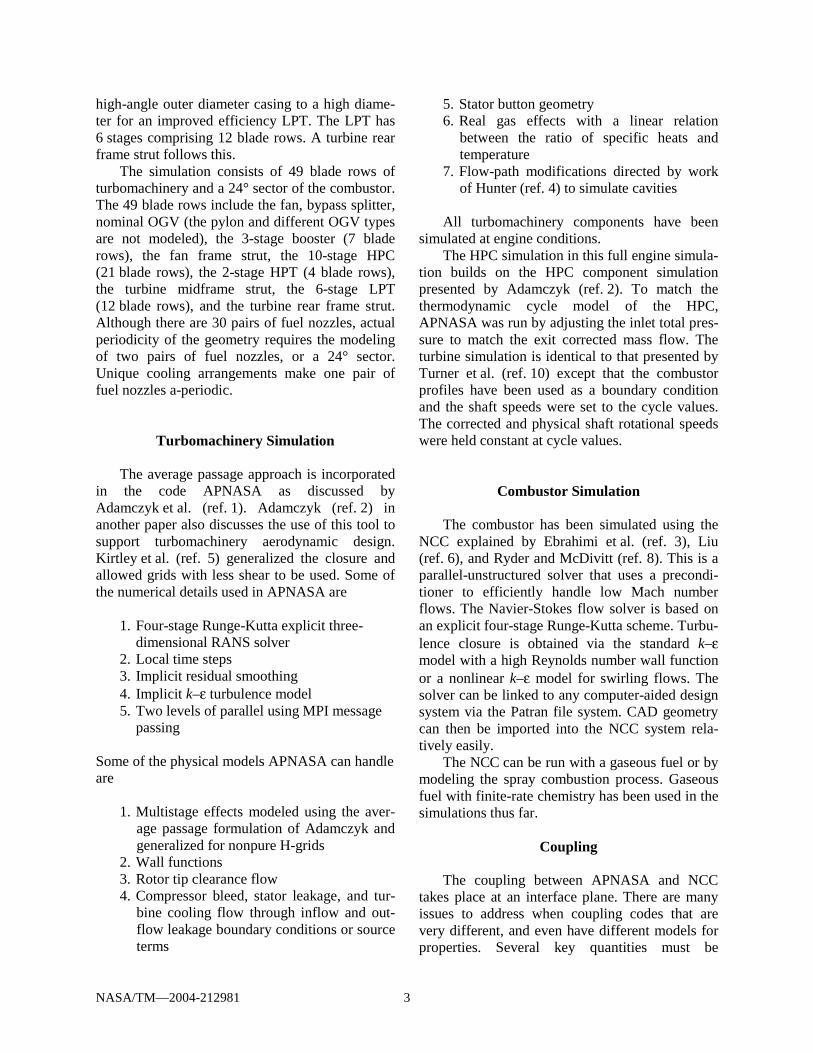
conserved from one code to the next. The mass flow must be conserved and is the most critical. The next most important quantity to conserve is the mass averaged total enthalpy. Since mass flow is conserved, this guarantees the total enthalpy flux is also conserved. For turbomachinery appli-cations, the next important conserved quantity is the angular momentum. After this, the total pres-sure is conserved, and finally the profiles of these quantities. Turner et al. (ref. 13) have presented details of this coupling. Figure 2 shows the five domains simulated. Each component had been run near the cycle condition, and matched fairly well. The simulation is then run se-quentially with the fan first, followed by the booster, HPC, combustor, and turbine. Scripts on the Ori-gin 3000 at NASA Ames have been written so the downstream domain boundary condition is set up and the downstream component is submitted to the batch queue automatically after the solution of the current domain has completed.
Blockage Analysis Blockage is derived as a way to integrate overall three-dimensional effects in the tangential direction. It is often a quantity used as a catchall for analyzing experimental results when trying to match continuity and using measured flow angles, total temperature, and total and static pressure. Adamczyk (ref. 2) presented some spanwise inte-grated blockage calculations just downstream of blade row trailing edges for the GE90 compressor. Turner et al. (ref. 13) have presented the blockage for the GE90 turbine. The following analysis dif-fers from those definitions of blockage in that the mass-averaged total pressure has been used instead of the momentum-averaged total pressure. This
was done because a mass average has somewhat more meaning in a turbine. Also the radial flow angle uses the area averaged axial and radial fluxes rather than finding the radial angle that would have zero normal momentum flux. This was done for convenience of the calculation. The following are defined at each spanwise grid-face of an axisymmetric grid by integrating the flow field: the mass-averaged values of total
pressure ( TP ), total enthalpy ( Th ), and angular
momentum ( θrV ). The mass flow rate ( m ) evalu-ated by integrating in the tangential direction and the area projections in the axial and radial direc-tion (Az and Ar) are also needed. The following area averages are also used: radial momentum ( rVρ ), axial momentum (Az zVρ ), and pressure
( p ). The area averages are obtained using the weights and pointers needed for the closure as described by Kirtley (ref. 5). The mass-averaged quantities use area averages of fluxes. Quantities with an under-bar are derived.
r
rVV θ
θ = (1)
⎟⎟⎠
⎞⎜⎜⎝
⎛
ρρ=φ −
z
r
V
V1tan (2)
222θ++= VVVV rz (3)
φ= tanzr VV (4)
NASA/TM—2004-212981 5
From equations (3) and (4), therefore
φ+
−= θ
2
22
tan1
VVVz (5)
The total enthalpy is defined such that
2
2Vhh T −= (6)
T and TT are calculated from h and Th using the linear function of γ with temperature as described by Turner (ref. 10). An approximation to the isen-tropic relation using an average γ yields
))1/(( −γγ
⎟⎟⎠
⎞⎜⎜⎝
⎛=
TTT
T
P
P (7)
Equations (5) to (7) and the relations of γ on temperature are iterated because of the nonlinear enthalpy-temperature relation. The equation of state is
TR
P=ρ (8)
The flow rate is
)( rrzzmetalaero AVAVbbm +ρ= (9)
where bmetal is the metal blockage in the tangential direction. The term baero is the aero blockage and
has been introduced as an overall parameter to represent the three-dimensional effects. Solving for aero blockage yields:
)( rrzzmetal
aero AVAVb
mb
+ρ= . (10)
The derived absolute and relative flow angles can be calculated: ω−= θθ rVW (11)
zV
Vθ−=α 1tan (12)
zV
Wθ−=β 1tan (13)
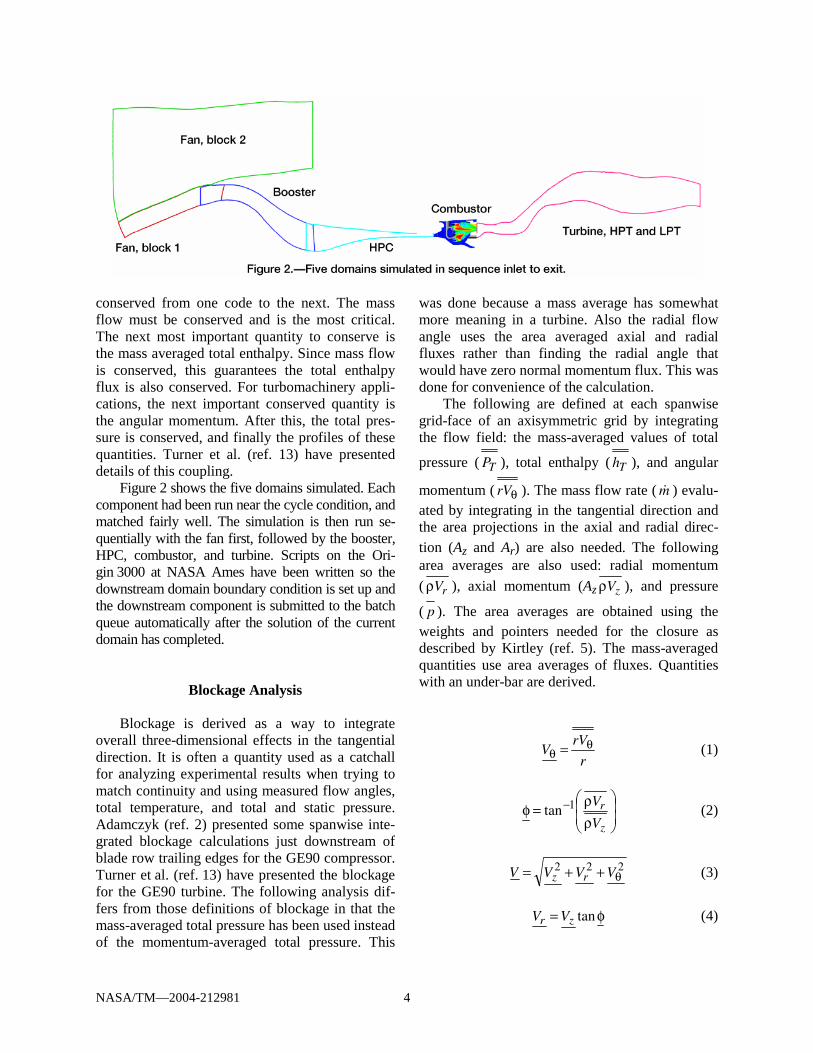
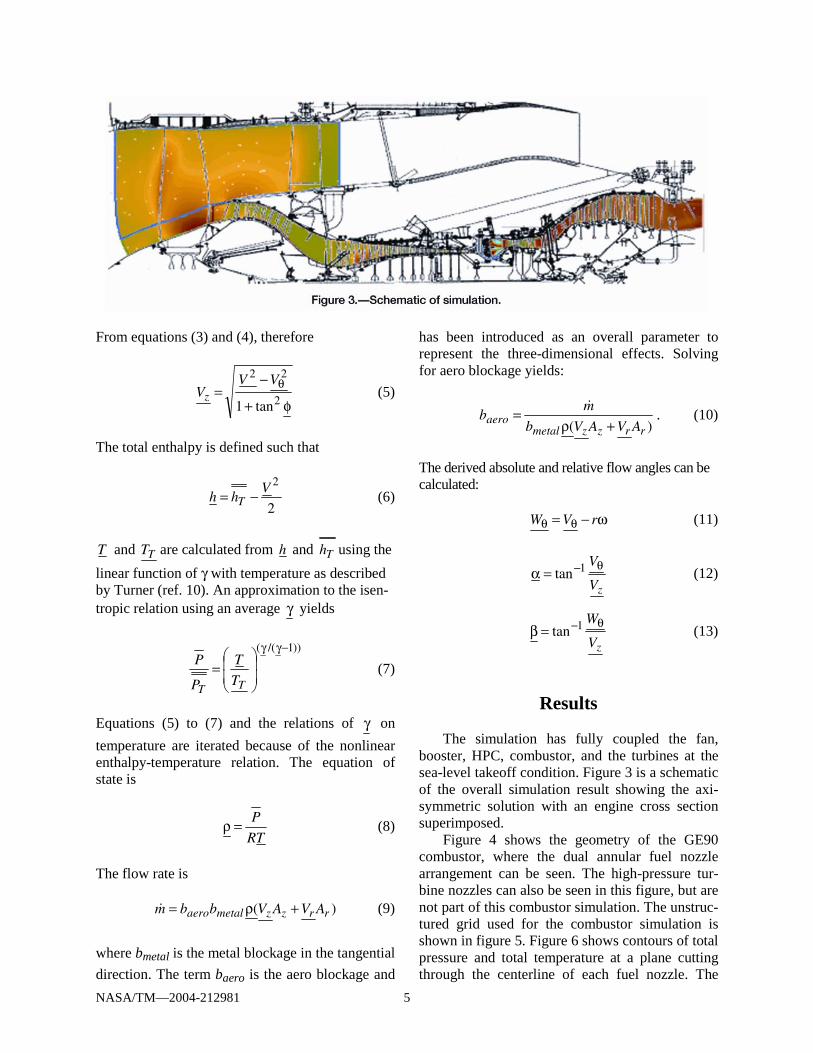
Results The simulation has fully coupled the fan, booster, HPC, combustor, and the turbines at the sea-level takeoff condition. Figure 3 is a schematic of the overall simulation result showing the axi-symmetric solution with an engine cross section superimposed. Figure 4 shows the geometry of the GE90 combustor, where the dual annular fuel nozzle arrangement can be seen. The high-pressure tur-bine nozzles can also be seen in this figure, but are not part of this combustor simulation. The unstruc-tured grid used for the combustor simulation is shown in figure 5. Figure 6 shows contours of total pressure and total temperature at a plane cutting through the centerline of each fuel nozzle. The
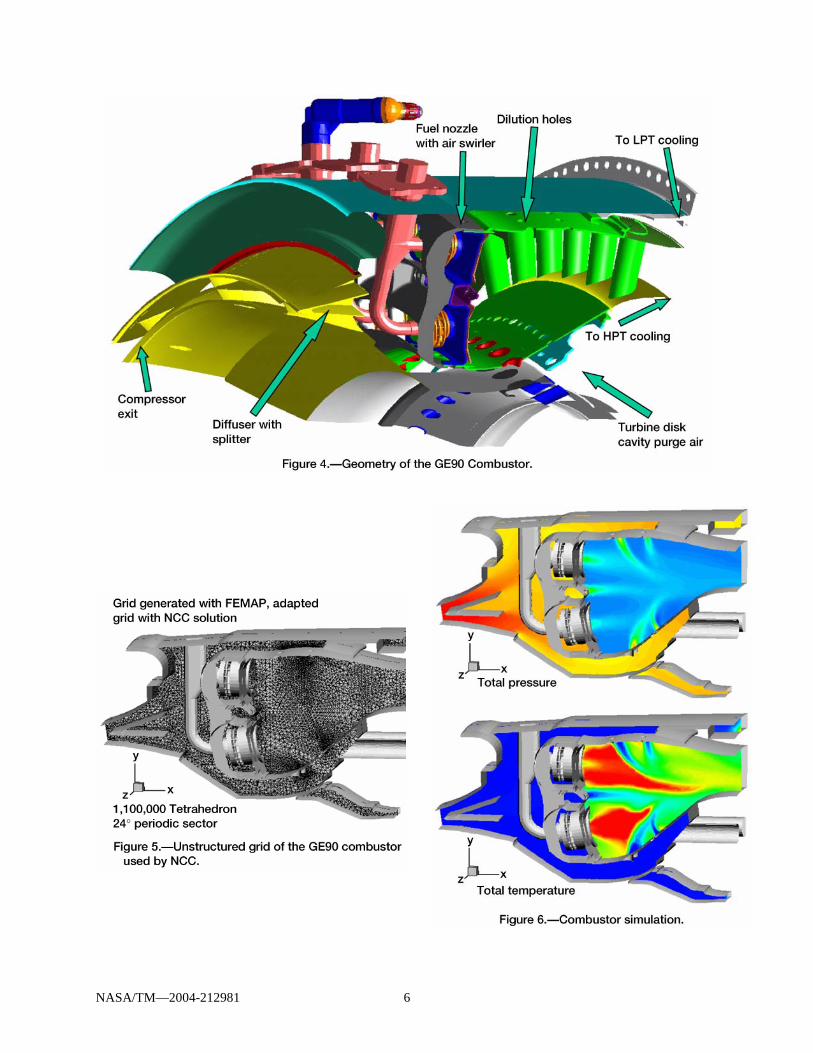
NASA/TM—2004-212981 6
NASA/TM—2004-212981 7
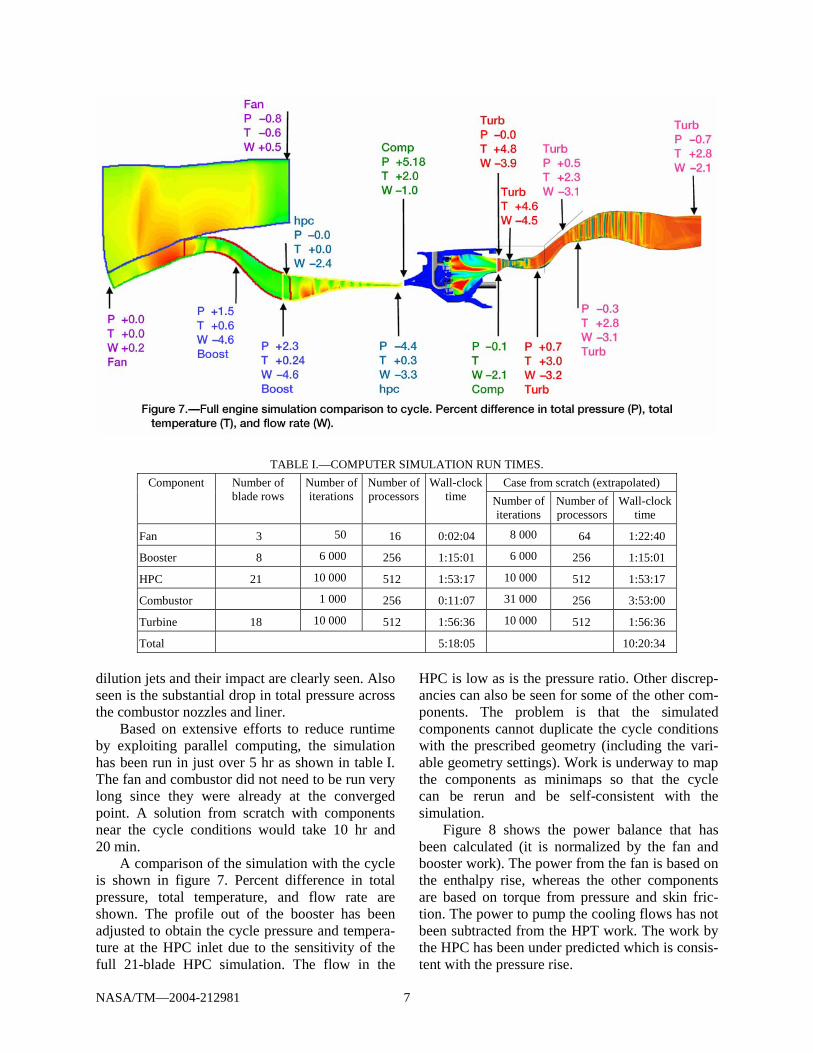
TABLE I.—COMPUTER SIMULATION RUN TIMES. Case from scratch (extrapolated) Component Number of
blade rows Number ofiterations
Number ofprocessors
Wall-clocktime Number of
iterations Number of processors
Wall-clock time
Fan 3 50 16 0:02:04 8 000 64 1:22:40
Booster 8 6 000 256 1:15:01 6 000 256 1:15:01
HPC 21 10 000 512 1:53:17 10 000 512 1:53:17
Combustor 1 000 256 0:11:07 31 000 256 3:53:00
Turbine 18 10 000 512 1:56:36 10 000 512 1:56:36
Total 5:18:05 10:20:34 dilution jets and their impact are clearly seen. Also seen is the substantial drop in total pressure across the combustor nozzles and liner. Based on extensive efforts to reduce runtime by exploiting parallel computing, the simulation has been run in just over 5 hr as shown in table I. The fan and combustor did not need to be run very long since they were already at the converged point. A solution from scratch with components near the cycle conditions would take 10 hr and 20 min. A comparison of the simulation with the cycle is shown in figure 7. Percent difference in total pressure, total temperature, and flow rate are shown. The profile out of the booster has been adjusted to obtain the cycle pressure and tempera-ture at the HPC inlet due to the sensitivity of the full 21-blade HPC simulation. The flow in the
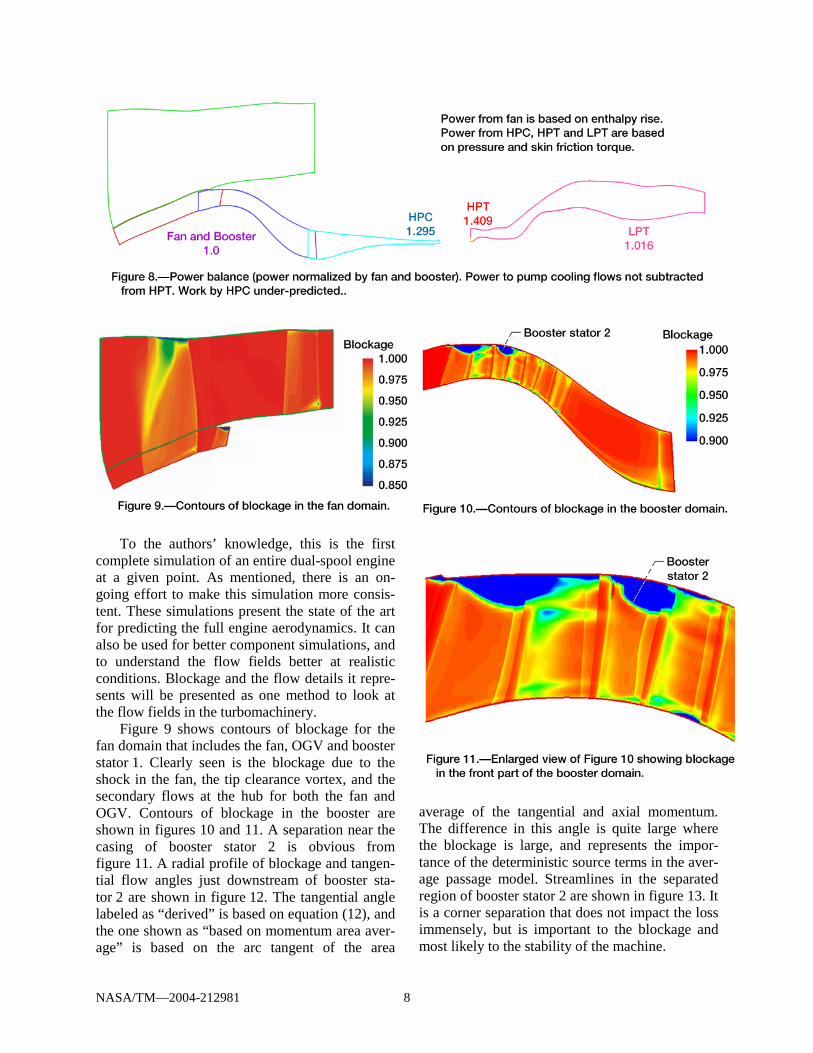
HPC is low as is the pressure ratio. Other discrep-ancies can also be seen for some of the other com-ponents. The problem is that the simulated components cannot duplicate the cycle conditions with the prescribed geometry (including the vari-able geometry settings). Work is underway to map the components as minimaps so that the cycle can be rerun and be self-consistent with the simulation. Figure 8 shows the power balance that has been calculated (it is normalized by the fan and booster work). The power from the fan is based on the enthalpy rise, whereas the other components are based on torque from pressure and skin fric-tion. The power to pump the cooling flows has not been subtracted from the HPT work. The work by the HPC has been under predicted which is consis-tent with the pressure rise.
NASA/TM—2004-212981 8
To the authors’ knowledge, this is the first complete simulation of an entire dual-spool engine at a given point. As mentioned, there is an on-going effort to make this simulation more consis-tent. These simulations present the state of the art for predicting the full engine aerodynamics. It can also be used for better component simulations, and to understand the flow fields better at realistic conditions. Blockage and the flow details it repre-sents will be presented as one method to look at the flow fields in the turbomachinery.
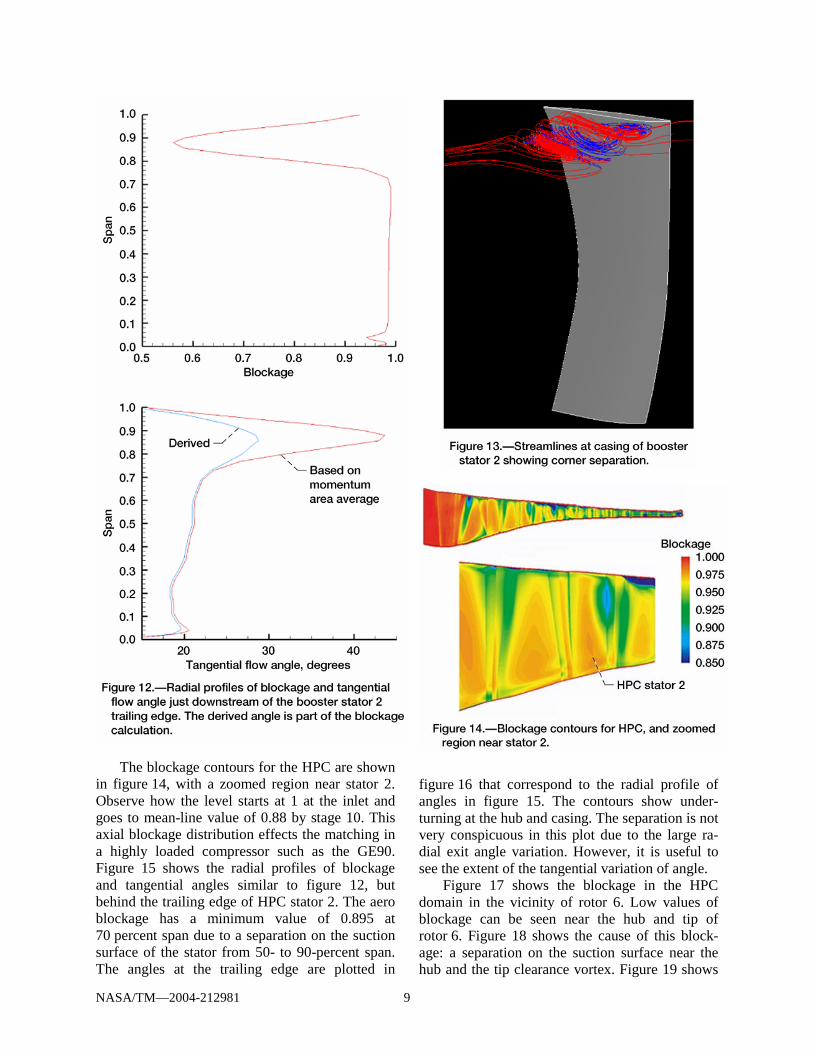
Figure 9 shows contours of blockage for the fan domain that includes the fan, OGV and booster stator 1. Clearly seen is the blockage due to the shock in the fan, the tip clearance vortex, and the secondary flows at the hub for both the fan and OGV. Contours of blockage in the booster are shown in figures 10 and 11. A separation near the casing of booster stator 2 is obvious from figure 11. A radial profile of blockage and tangen-tial flow angles just downstream of booster sta-tor 2 are shown in figure 12. The tangential angle labeled as “derived” is based on equation (12), and the one shown as “based on momentum area aver-age” is based on the arc tangent of the area
average of the tangential and axial momentum. The difference in this angle is quite large where the blockage is large, and represents the impor-tance of the deterministic source terms in the aver-age passage model. Streamlines in the separated region of booster stator 2 are shown in figure 13. It is a corner separation that does not impact the loss immensely, but is important to the blockage and most likely to the stability of the machine.
NASA/TM—2004-212981 9
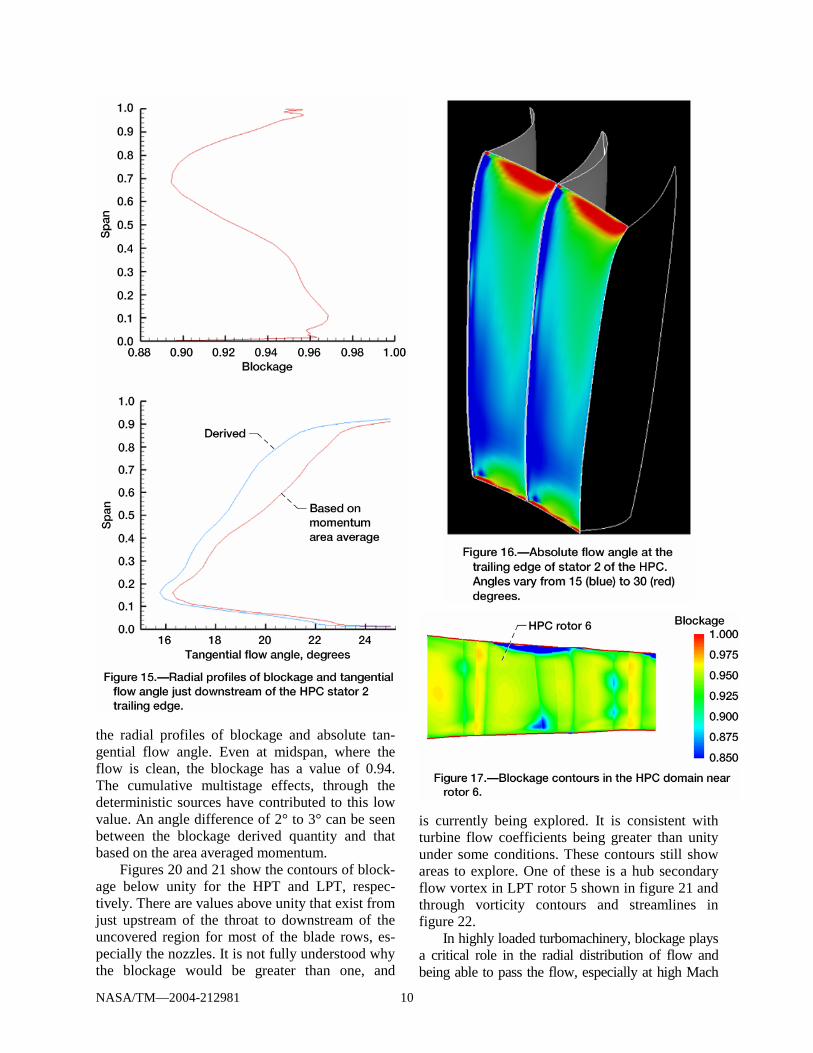
The blockage contours for the HPC are shown in figure 14, with a zoomed region near stator 2. Observe how the level starts at 1 at the inlet and goes to mean-line value of 0.88 by stage 10. This axial blockage distribution effects the matching in a highly loaded compressor such as the GE90. Figure 15 shows the radial profiles of blockage and tangential angles similar to figure 12, but behind the trailing edge of HPC stator 2. The aero blockage has a minimum value of 0.895 at 70 percent span due to a separation on the suction surface of the stator from 50- to 90-percent span. The angles at the trailing edge are plotted in
figure 16 that correspond to the radial profile of angles in figure 15. The contours show under-turning at the hub and casing. The separation is not very conspicuous in this plot due to the large ra-dial exit angle variation. However, it is useful to see the extent of the tangential variation of angle. Figure 17 shows the blockage in the HPC domain in the vicinity of rotor 6. Low values of blockage can be seen near the hub and tip of rotor 6. Figure 18 shows the cause of this block-age: a separation on the suction surface near the hub and the tip clearance vortex. Figure 19 shows
NASA/TM—2004-212981 10
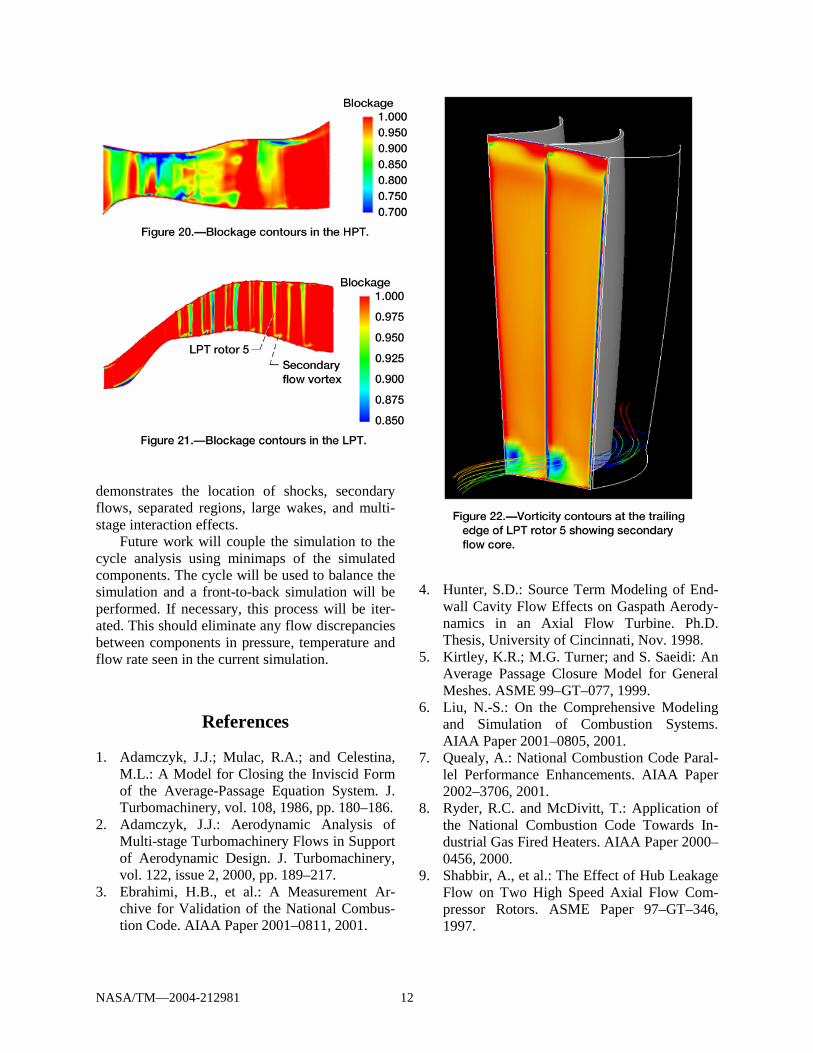
the radial profiles of blockage and absolute tan-gential flow angle. Even at midspan, where the flow is clean, the blockage has a value of 0.94. The cumulative multistage effects, through the deterministic sources have contributed to this low value. An angle difference of 2° to 3° can be seen between the blockage derived quantity and that based on the area averaged momentum. Figures 20 and 21 show the contours of block-age below unity for the HPT and LPT, respec-tively. There are values above unity that exist from just upstream of the throat to downstream of the uncovered region for most of the blade rows, es-pecially the nozzles. It is not fully understood why the blockage would be greater than one, and
is currently being explored. It is consistent with turbine flow coefficients being greater than unity under some conditions. These contours still show areas to explore. One of these is a hub secondary flow vortex in LPT rotor 5 shown in figure 21 and through vorticity contours and streamlines in figure 22. In highly loaded turbomachinery, blockage plays a critical role in the radial distribution of flow and being able to pass the flow, especially at high Mach

NASA/TM—2004-212981 11
numbers. As demonstrated, aerodynamic blockage demonstrates the location of shocks, secondary flows, separated regions, large wakes, and multi-stage interaction effects. These multistage effects come from the deterministic sources that are part of the average passage approach. A mixing-plane approach would produce a loss, and a discontinu-ity at the interface, and not a blockage. The aero-dynamic effect is not the same. Often a compressor rotor and stator are analyzed as iso-lated blade rows. It is very difficult to get the ef-fects of blockage that are implicit in the average passage solution, except by running at a lower flow and lower speed and modifying the boundary conditions. However, this does not fully mimic the total effect of blockage since the machine runs differently at higher speeds and the variation of blockage is not uniform spanwise as shown for a few of the blade rows. Flow angles for the stator are also very difficult to get right when the level of blockage is not correct. Turbines are also affected by blockage such as turbine throat setting and turbine thrust balance. These can be predicted better when blockage is addressed in the design process.
Conclusions and Future Work A successful simulation of the three-dimensional flow in the primary flow path of the GE90–94B high bypass ratio turbofan engine has been achieved. It would take less than 11 hr of wall clock time if starting from scratch through the exploitation of parallel processing. The engine simulation matches the engine thermodynamic cycle at a sea-level takeoff condition. Compari-sons with the cycle are presented. Details of the turbomachinery solution using a blockage analysis have also been presented. Aerodynamic blockage
NASA/TM—2004-212981 12
demonstrates the location of shocks, secondary flows, separated regions, large wakes, and multi-stage interaction effects.
Future work will couple the simulation to the cycle analysis using minimaps of the simulated components. The cycle will be used to balance the simulation and a front-to-back simulation will be performed. If necessary, this process will be iter-ated. This should eliminate any flow discrepancies between components in pressure, temperature and flow rate seen in the current simulation.
References 1. Adamczyk, J.J.; Mulac, R.A.; and Celestina,
M.L.: A Model for Closing the Inviscid Form of the Average-Passage Equation System. J. Turbomachinery, vol. 108, 1986, pp. 180–186.
2. Adamczyk, J.J.: Aerodynamic Analysis of Multi-stage Turbomachinery Flows in Support of Aerodynamic Design. J. Turbomachinery, vol. 122, issue 2, 2000, pp. 189–217.
3. Ebrahimi, H.B., et al.: A Measurement Ar-chive for Validation of the National Combus-tion Code. AIAA Paper 2001–0811, 2001.
4. Hunter, S.D.: Source Term Modeling of End-
wall Cavity Flow Effects on Gaspath Aerody-namics in an Axial Flow Turbine. Ph.D. Thesis, University of Cincinnati, Nov. 1998.
5. Kirtley, K.R.; M.G. Turner; and S. Saeidi: An Average Passage Closure Model for General Meshes. ASME 99–GT–077, 1999.
6. Liu, N.-S.: On the Comprehensive Modeling and Simulation of Combustion Systems. AIAA Paper 2001–0805, 2001.
7. Quealy, A.: National Combustion Code Paral-lel Performance Enhancements. AIAA Paper 2002–3706, 2001.
8. Ryder, R.C. and McDivitt, T.: Application of the National Combustion Code Towards In-dustrial Gas Fired Heaters. AIAA Paper 2000–0456, 2000.
9. Shabbir, A., et al.: The Effect of Hub Leakage Flow on Two High Speed Axial Flow Com-pressor Rotors. ASME Paper 97–GT–346, 1997.

NASA/TM—2004-212981 13
10. Turner, M.G.: Multistage Turbine Simulations with Vortex-Blade Interaction. J. Turbo-machinery, vol. 118, no. 4, 1996, pp. 643–653.
11. Turner, M.G., et al.: Multi-stage Simulations of the GE90 Turbine. ASME 99–GT–98, 1999.
12. Turner, M.G.: Full 3D Analysis of the GE90 Turbofan Primary Flowpath. NASA/CR—2000-209951, 2000.
13. Turner, M.G., et al.: High Fidelity 3D Turbofan Engine Simulation With Emphasis on Turbomachinery-Combustor Coupling. AIAA–2002–3769, 2002.
This publication is available from the NASA Center for AeroSpace Information, 301–621–0390.
REPORT DOCUMENTATION PAGE
2. REPORT DATE
19. SECURITY CLASSIFICATION OF ABSTRACT
18. SECURITY CLASSIFICATION OF THIS PAGE
Public reporting burden for this collection of information is estimated to average 1 hour per response, including the time for reviewing instructions, searching existing data sources,gathering and maintaining the data needed, and completing and reviewing the collection of information. Send comments regarding this burden estimate or any other aspect of thiscollection of information, including suggestions for reducing this burden, to Washington Headquarters Services, Directorate for Information Operations and Reports, 1215 JeffersonDavis Highway, Suite 1204, Arlington, VA 22202-4302, and to the Office of Management and Budget, Paperwork Reduction Project (0704-0188), Washington, DC 20503.
NSN 7540-01-280-5500 Standard Form 298 (Rev. 2-89)Prescribed by ANSI Std. Z39-18298-102
Form Approved
OMB No. 0704-0188
12b. DISTRIBUTION CODE
8. PERFORMING ORGANIZATION REPORT NUMBER
5. FUNDING NUMBERS
3. REPORT TYPE AND DATES COVERED
4. TITLE AND SUBTITLE
6. AUTHOR(S)
7. PERFORMING ORGANIZATION NAME(S) AND ADDRESS(ES)
11. SUPPLEMENTARY NOTES
12a. DISTRIBUTION/AVAILABILITY STATEMENT
13. ABSTRACT (Maximum 200 words)
14. SUBJECT TERMS
17. SECURITY CLASSIFICATION OF REPORT
16. PRICE CODE
15. NUMBER OF PAGES
20. LIMITATION OF ABSTRACT
Unclassified Unclassified
Technical Memorandum
Unclassified
National Aeronautics and Space AdministrationJohn H. Glenn Research Center at Lewis FieldCleveland, Ohio 44135–3191
1. AGENCY USE ONLY (Leave blank)
10. SPONSORING/MONITORING AGENCY REPORT NUMBER
9. SPONSORING/MONITORING AGENCY NAME(S) AND ADDRESS(ES)
National Aeronautics and Space AdministrationWashington, DC 20546–0001
Available electronically at http://gltrs.grc.nasa.gov
March 2004
NASA TM—2004-212981AIAA–2003–3996
E–14456
WBS–22–708–87–01
19
High-Fidelity Three-Dimensional Simulation of the GE90
Mark G. Turner, Andrew Norris, and Joseph P. Veres
Turbine engines; Propulsion; System model; Computational fluid dynamics; Fan;Compressor; Turbine; Combustor; Turbomachine
Unclassified -UnlimitedSubject Categories: 02 and 07 Distribution: Nonstandard
Prepared for the 16th Computational Fluid Dynamics Conference and the 33rd Fluid Dynamics Conference andExhibit sponsored by the American Institute of Aeronautics and Astronautics, Orlando, Florida, June 23–26, 2003.Mark G. Turner, University of Cincinnati, Cincinnati, Ohio 45220–2873; Andrew Norris, Ohio Aerospace Institute,Brook Park, Ohio 44142; and Joseph P. Veres, NASA Glenn Research Center. Responsible person, Joseph P. Veres,organization code 2900, 216–433–2436.
A full-engine simulation of the three-dimensional flow in the GE90–94B high-bypass ratio turbofan engine has beenachieved. It would take less than 11 hr of wall clock time if starting from scratch through the exploitation of parallelprocessing. The simulation of the compressor components, the cooled high-pressure turbine, and the low-pressureturbine was performed using the APNASA turbomachinery flow code. The combustor flow and chemistry weresimulated using the National Combustor Code (NCC). The engine simulation matches the engine thermodynamic cyclefor a sea-level takeoff condition. The simulation is started at the inlet of the fan and progresses downstream. Compari-sons with the cycle point are presented. A detailed look at the blockage in the turbomachinery is presented as onemeasure to assess and view the solution and the multistage interaction effects.
Related Documents