High energy resolution five-crystal spectrometer for high quality fluorescence and absorption measurements on an x-ray absorption spectroscopy beamline Isabelle Llorens, Eric Lahera, William Delnet, Olivier Proux, Aurélien Braillard et al. Citation: Rev. Sci. Instrum. 83, 063104 (2012); doi: 10.1063/1.4728414 View online: http://dx.doi.org/10.1063/1.4728414 View Table of Contents: http://rsi.aip.org/resource/1/RSINAK/v83/i6 Published by the AIP Publishing LLC. Additional information on Rev. Sci. Instrum. Journal Homepage: http://rsi.aip.org Journal Information: http://rsi.aip.org/about/about_the_journal Top downloads: http://rsi.aip.org/features/most_downloaded Information for Authors: http://rsi.aip.org/authors Downloaded 06 Oct 2013 to 202.116.1.149. This article is copyrighted as indicated in the abstract. Reuse of AIP content is subject to the terms at: http://rsi.aip.org/about/rights_and_permissions

Welcome message from author
This document is posted to help you gain knowledge. Please leave a comment to let me know what you think about it! Share it to your friends and learn new things together.
Transcript
High energy resolution five-crystal spectrometer for high qualityfluorescence and absorption measurements on an x-ray absorptionspectroscopy beamlineIsabelle Llorens, Eric Lahera, William Delnet, Olivier Proux, Aurélien Braillard et al. Citation: Rev. Sci. Instrum. 83, 063104 (2012); doi: 10.1063/1.4728414 View online: http://dx.doi.org/10.1063/1.4728414 View Table of Contents: http://rsi.aip.org/resource/1/RSINAK/v83/i6 Published by the AIP Publishing LLC. Additional information on Rev. Sci. Instrum.Journal Homepage: http://rsi.aip.org Journal Information: http://rsi.aip.org/about/about_the_journal Top downloads: http://rsi.aip.org/features/most_downloaded Information for Authors: http://rsi.aip.org/authors
Downloaded 06 Oct 2013 to 202.116.1.149. This article is copyrighted as indicated in the abstract. Reuse of AIP content is subject to the terms at: http://rsi.aip.org/about/rights_and_permissions
REVIEW OF SCIENTIFIC INSTRUMENTS 83, 063104 (2012)
High energy resolution five-crystal spectrometer for high qualityfluorescence and absorption measurements on an x-ray absorptionspectroscopy beamline
Isabelle Llorens,1,2 Eric Lahera,3,4 William Delnet,3,4 Olivier Proux,3,4 Aurélien Braillard,4,5
Jean-Louis Hazemann,4,5 Alain Prat,4,5 Denis Testemale,4,5 Quentin Dermigny,6
Frederic Gelebart,6 Marc Morand,6 Abhay Shukla,6 Nathalie Bardou,7 Olivier Ulrich,1,8
Stéphan Arnaud,5,9 Jean-François Berar,5,9 Nathalie Boudet,5,9 Bernard Caillot,5,9
Perrine Chaurand,10 Jérôme Rose,10 Emmanuel Doelsch,11 Philippe Martin,12
and Pier Lorenzo Solari21CEA/DSM/INAC/SP2M/NRS, F-38054 Grenoble cedex 9, France2Synchrotron SOLEIL – MARS beamline, L’Orme des Merisiers, F-91192 Gif sur Yvette, France3Observatoire des Sciences de l’Univers de Grenoble, UMS 832 CNRS Université Joseph Fourier, F-38041Grenoble cedex 9, France4BM30B/FAME beamline, ESRF, F-38043 Grenoble cedex 9, France5Institut Néel, UPR 2940 CNRS, F-38042 Grenoble cedex 9, France6Institut de Minéralogie et de Physique des Milieux Condensés, UMR 7590, 4 place Jussieu,F-75005 Paris, France7Laboratoire de Photonique et de Nanostructures, UPR 20 CNRS, Route de Nozay,F-91460 Marcoussis, France8BM32/IF beamline, ESRF, F-38043 Grenoble cedex 9, France9BM02/D2AM beamline, ESRF, F-38043 Grenoble cedex 9, France10Centre Européen de Recherche et d’Enseignement des Géosciences de l’Environnement, UMR 7730,F-13545 Aix en Provence, France11CIRAD, UPR Recyclage et risque, Montpellier, France12CEA/DEN/DEC/SESC/LLCC, F-13108 Saint Paul lez Durance cedex, France
(Received 5 April 2012; accepted 26 May 2012; published online 12 June 2012)
Fluorescence detection is classically achieved with a solid state detector (SSD) on x-ray absorptionspectroscopy (XAS) beamlines. This kind of detection however presents some limitations related tothe limited energy resolution and saturation. Crystal analyzer spectrometers (CAS) based on a Johann-type geometry have been developed to overcome these limitations. We have tested and installed sucha system on the BM30B/CRG-FAME XAS beamline at the ESRF dedicated to the structural inves-tigation of very dilute systems in environmental, material and biological sciences. The spectrometerhas been designed to be a mobile device for easy integration in multi-purpose hard x-ray synchrotronbeamlines or even with a laboratory x-ray source. The CAS allows to collect x-ray photons froma large solid angle with five spherically bent crystals. It will cover a large energy range allowing toprobe fluorescence lines characteristic of all the elements from Ca (Z = 20) to U (Z = 92). It providesan energy resolution of 1–2 eV. XAS spectroscopy is the main application of this device even if otherspectroscopic techniques (RIXS, XES, XRS, etc.) can be also achieved with it. The performancesof the CAS are illustrated by two experiments that are difficult or impossible to perform with SSDand the complementarity of the CAS vs SSD detectors is discussed. © 2012 American Institute ofPhysics. [http://dx.doi.org/10.1063/1.4728414]
I. INTRODUCTION
The BM30B/CRG-FAME (Ref. 1) beamline at the Eu-ropean Synchrotron Radiation Facility (ESRF, Grenoble,France) is dedicated to x-ray absorption spectroscopy (XAS)applied to a wide variety of research fields: condensed matterphysics, materials science, biophysics, chemistry, and mainlygeochemical topics, with special emphasis on highly dilutedsamples. As such, the optics of the beamline has been de-signed to optimize both the incident photon flux on the sampleand the optical stability to reduce non-statistical noise. A 30-element CANBERRA solid state detector (SSD) with a typ-ical energy resolution of 150–300 eV is used for an optimalacquisition of fluorescence signal. As we show in this paper, away to improve the fluorescence detection significantly in the
case of complex or highly diluted samples (see Sec. III) is touse a crystal analyzer spectrometer. With this aim, a focusingJohann type spectrometer has been built and recently commis-sioned on the beamline so as to improve both the sensitivityin terms of sample concentration and the signal quality.
In general, it is considered that such a spectrometer canbe used in the following fields: (i) x-ray absorption fine struc-ture (XAFS) spectroscopy in samples with multi elemen-tal composition matrices, (ii) lifetime-broadening-removedXAFS spectroscopy,2 (iii) site-selective XAFS spectroscopy,3
(iv) x-ray emission spectroscopy (XES),4 (v) resonant in-elastic x-ray scattering (RIXS),5 and (vi) x-ray Raman scat-tering (XRS).6, 7 A complete overview of possible applica-tions can be found in reviews by de Groot,8 Kotani and
0034-6748/2012/83(6)/063104/9/$30.00 © 2012 American Institute of Physics83, 063104-1
Downloaded 06 Oct 2013 to 202.116.1.149. This article is copyrighted as indicated in the abstract. Reuse of AIP content is subject to the terms at: http://rsi.aip.org/about/rights_and_permissions
063104-2 Llorens et al. Rev. Sci. Instrum. 83, 063104 (2012)
Shin,9 Schülke,10 and Rueff and Shukla.11 In our case, thespectrometer is dedicated for an improvement of fluores-cence detection to improve signal to noise in XAFS mea-surements and mostly used to distinguish a weak fluores-cence emission signal from a multitude of undesirable intensepeaks.
A description of the prototype of the present spectrom-eter which used solitary crystal analyser has already beenpublished12 as well as results of experiments performed withit.13 The main limitation of this prototype is the small solidangle of detection corresponding to one crystal (0.03 sr)and thus the limited counting statistics of the measurement.To overcome this, a new spectrometer including five bentcrystals has been designed and installed on the beamline.With this design, the integrated solid angle of detection isincreased to 0.15 sr. In this paper, we report the completeoriginal design of this spectrometer and results from firstexperiments.
II. SOURCE
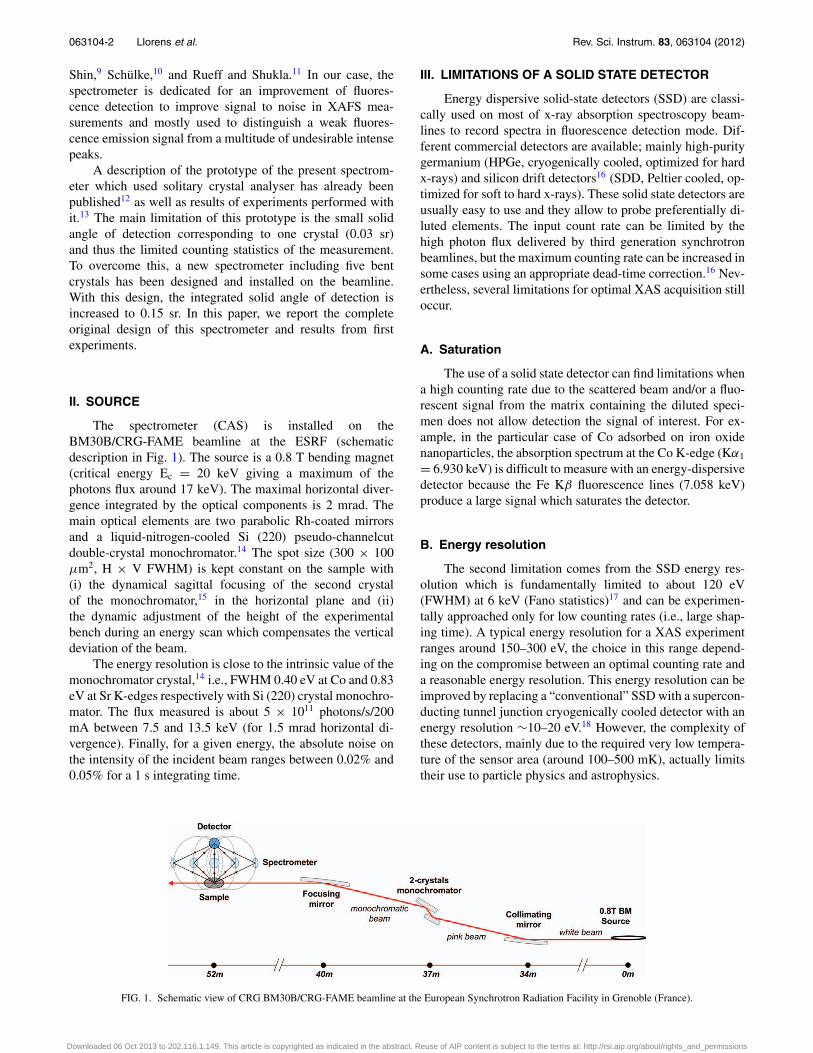
The spectrometer (CAS) is installed on theBM30B/CRG-FAME beamline at the ESRF (schematicdescription in Fig. 1). The source is a 0.8 T bending magnet(critical energy Ec = 20 keV giving a maximum of thephotons flux around 17 keV). The maximal horizontal diver-gence integrated by the optical components is 2 mrad. Themain optical elements are two parabolic Rh-coated mirrorsand a liquid-nitrogen-cooled Si (220) pseudo-channelcutdouble-crystal monochromator.14 The spot size (300 × 100μm2, H × V FWHM) is kept constant on the sample with(i) the dynamical sagittal focusing of the second crystalof the monochromator,15 in the horizontal plane and (ii)the dynamic adjustment of the height of the experimentalbench during an energy scan which compensates the verticaldeviation of the beam.
The energy resolution is close to the intrinsic value of themonochromator crystal,14 i.e., FWHM 0.40 eV at Co and 0.83eV at Sr K-edges respectively with Si (220) crystal monochro-mator. The flux measured is about 5 × 10¹¹ photons/s/200mA between 7.5 and 13.5 keV (for 1.5 mrad horizontal di-vergence). Finally, for a given energy, the absolute noise onthe intensity of the incident beam ranges between 0.02% and0.05% for a 1 s integrating time.
III. LIMITATIONS OF A SOLID STATE DETECTOR
Energy dispersive solid-state detectors (SSD) are classi-cally used on most of x-ray absorption spectroscopy beam-lines to record spectra in fluorescence detection mode. Dif-ferent commercial detectors are available; mainly high-puritygermanium (HPGe, cryogenically cooled, optimized for hardx-rays) and silicon drift detectors16 (SDD, Peltier cooled, op-timized for soft to hard x-rays). These solid state detectors areusually easy to use and they allow to probe preferentially di-luted elements. The input count rate can be limited by thehigh photon flux delivered by third generation synchrotronbeamlines, but the maximum counting rate can be increased insome cases using an appropriate dead-time correction.16 Nev-ertheless, several limitations for optimal XAS acquisition stilloccur.
A. Saturation
The use of a solid state detector can find limitations whena high counting rate due to the scattered beam and/or a fluo-rescent signal from the matrix containing the diluted speci-men does not allow detection the signal of interest. For ex-ample, in the particular case of Co adsorbed on iron oxidenanoparticles, the absorption spectrum at the Co K-edge (Kα1
= 6.930 keV) is difficult to measure with an energy-dispersivedetector because the Fe Kβ fluorescence lines (7.058 keV)produce a large signal which saturates the detector.
B. Energy resolution
The second limitation comes from the SSD energy res-olution which is fundamentally limited to about 120 eV(FWHM) at 6 keV (Fano statistics)17 and can be experimen-tally approached only for low counting rates (i.e., large shap-ing time). A typical energy resolution for a XAS experimentranges around 150–300 eV, the choice in this range depend-ing on the compromise between an optimal counting rate anda reasonable energy resolution. This energy resolution can beimproved by replacing a “conventional” SSD with a supercon-ducting tunnel junction cryogenically cooled detector with anenergy resolution ∼10–20 eV.18 However, the complexity ofthese detectors, mainly due to the required very low tempera-ture of the sensor area (around 100–500 mK), actually limitstheir use to particle physics and astrophysics.
FIG. 1. Schematic view of CRG BM30B/CRG-FAME beamline at the European Synchrotron Radiation Facility in Grenoble (France).
Downloaded 06 Oct 2013 to 202.116.1.149. This article is copyrighted as indicated in the abstract. Reuse of AIP content is subject to the terms at: http://rsi.aip.org/about/rights_and_permissions
063104-3 Llorens et al. Rev. Sci. Instrum. 83, 063104 (2012)
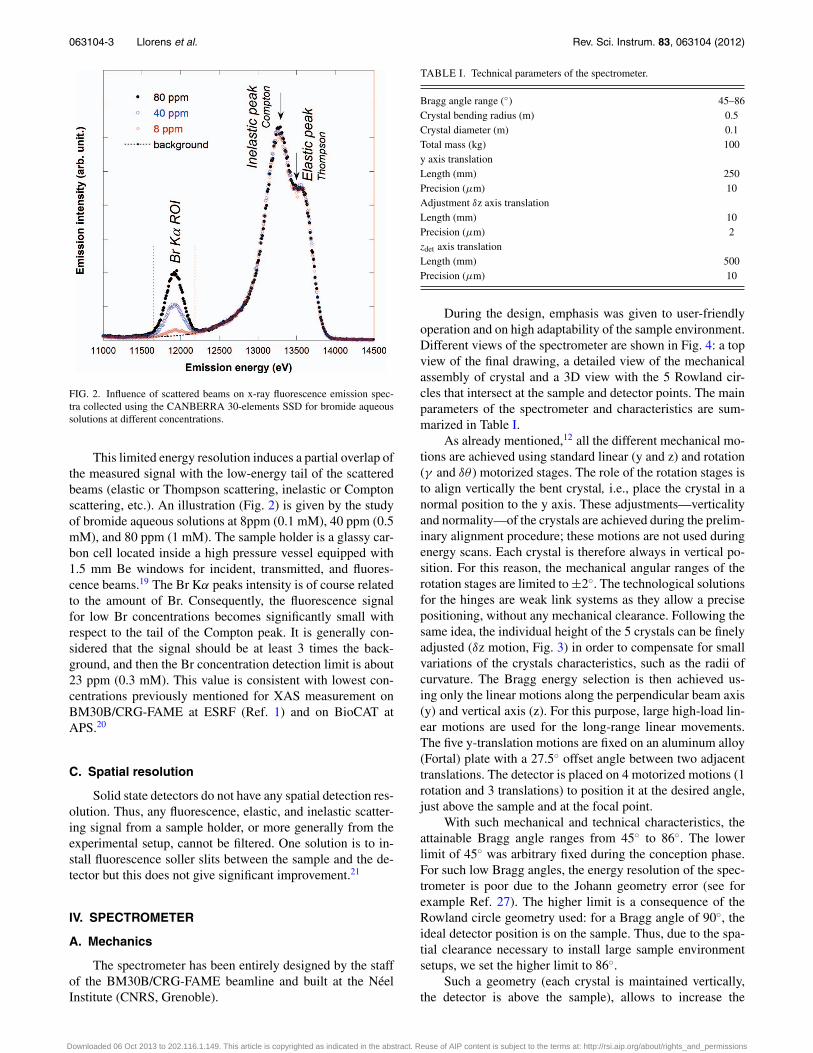
FIG. 2. Influence of scattered beams on x-ray fluorescence emission spec-tra collected using the CANBERRA 30-elements SSD for bromide aqueoussolutions at different concentrations.
This limited energy resolution induces a partial overlap ofthe measured signal with the low-energy tail of the scatteredbeams (elastic or Thompson scattering, inelastic or Comptonscattering, etc.). An illustration (Fig. 2) is given by the studyof bromide aqueous solutions at 8ppm (0.1 mM), 40 ppm (0.5mM), and 80 ppm (1 mM). The sample holder is a glassy car-bon cell located inside a high pressure vessel equipped with1.5 mm Be windows for incident, transmitted, and fluores-cence beams.19 The Br Kα peaks intensity is of course relatedto the amount of Br. Consequently, the fluorescence signalfor low Br concentrations becomes significantly small withrespect to the tail of the Compton peak. It is generally con-sidered that the signal should be at least 3 times the back-ground, and then the Br concentration detection limit is about23 ppm (0.3 mM). This value is consistent with lowest con-centrations previously mentioned for XAS measurement onBM30B/CRG-FAME at ESRF (Ref. 1) and on BioCAT atAPS.20
C. Spatial resolution
Solid state detectors do not have any spatial detection res-olution. Thus, any fluorescence, elastic, and inelastic scatter-ing signal from a sample holder, or more generally from theexperimental setup, cannot be filtered. One solution is to in-stall fluorescence soller slits between the sample and the de-tector but this does not give significant improvement.21
IV. SPECTROMETER
A. Mechanics
The spectrometer has been entirely designed by the staffof the BM30B/CRG-FAME beamline and built at the NéelInstitute (CNRS, Grenoble).
TABLE I. Technical parameters of the spectrometer.
Bragg angle range (◦) 45–86Crystal bending radius (m) 0.5Crystal diameter (m) 0.1Total mass (kg) 100y axis translationLength (mm) 250Precision (μm) 10Adjustment δz axis translationLength (mm) 10Precision (μm) 2zdet axis translationLength (mm) 500Precision (μm) 10
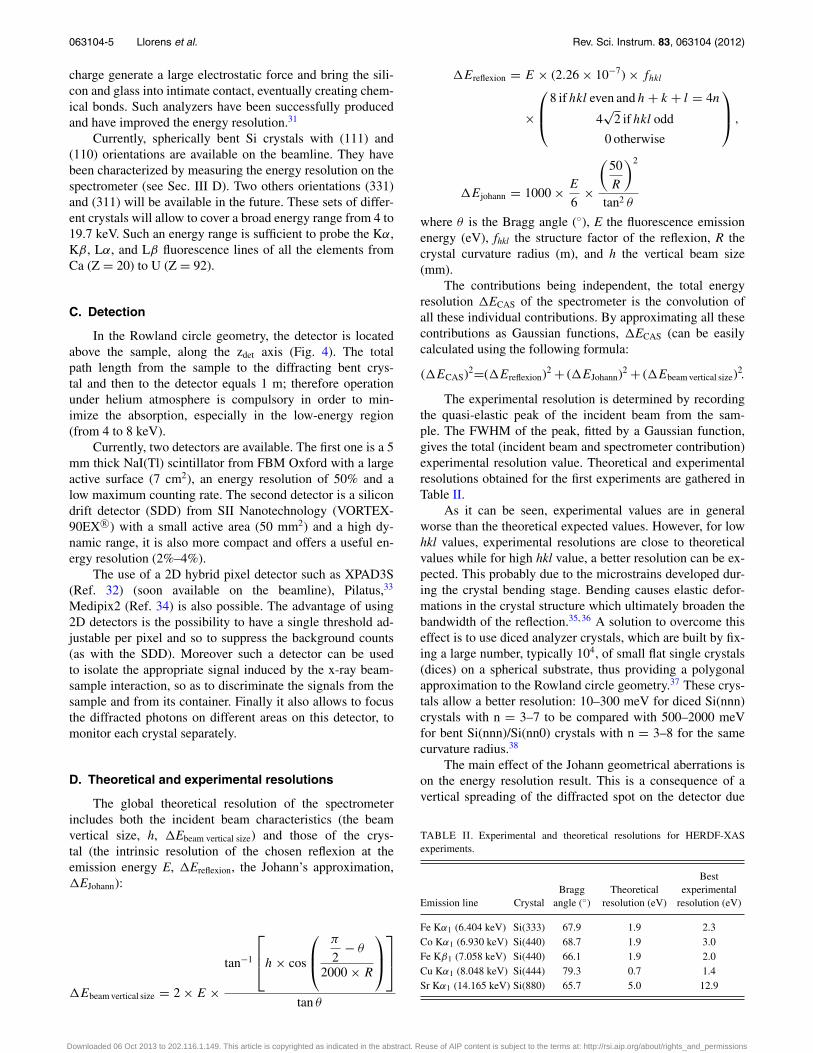
During the design, emphasis was given to user-friendlyoperation and on high adaptability of the sample environment.Different views of the spectrometer are shown in Fig. 4: a topview of the final drawing, a detailed view of the mechanicalassembly of crystal and a 3D view with the 5 Rowland cir-cles that intersect at the sample and detector points. The mainparameters of the spectrometer and characteristics are sum-marized in Table I.
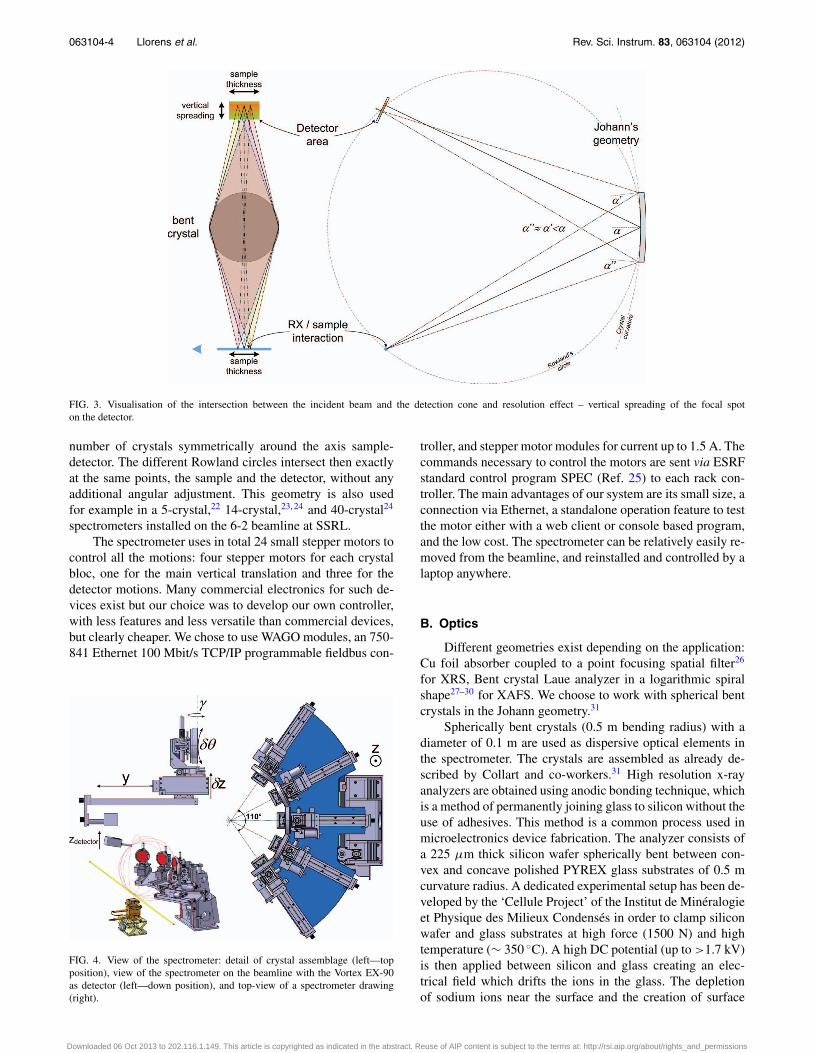
As already mentioned,12 all the different mechanical mo-tions are achieved using standard linear (y and z) and rotation(γ and δθ ) motorized stages. The role of the rotation stages isto align vertically the bent crystal, i.e., place the crystal in anormal position to the y axis. These adjustments—verticalityand normality—of the crystals are achieved during the prelim-inary alignment procedure; these motions are not used duringenergy scans. Each crystal is therefore always in vertical po-sition. For this reason, the mechanical angular ranges of therotation stages are limited to ±2◦. The technological solutionsfor the hinges are weak link systems as they allow a precisepositioning, without any mechanical clearance. Following thesame idea, the individual height of the 5 crystals can be finelyadjusted (δz motion, Fig. 3) in order to compensate for smallvariations of the crystals characteristics, such as the radii ofcurvature. The Bragg energy selection is then achieved us-ing only the linear motions along the perpendicular beam axis(y) and vertical axis (z). For this purpose, large high-load lin-ear motions are used for the long-range linear movements.The five y-translation motions are fixed on an aluminum alloy(Fortal) plate with a 27.5◦ offset angle between two adjacenttranslations. The detector is placed on 4 motorized motions (1rotation and 3 translations) to position it at the desired angle,just above the sample and at the focal point.
With such mechanical and technical characteristics, theattainable Bragg angle ranges from 45◦ to 86◦. The lowerlimit of 45◦ was arbitrary fixed during the conception phase.For such low Bragg angles, the energy resolution of the spec-trometer is poor due to the Johann geometry error (see forexample Ref. 27). The higher limit is a consequence of theRowland circle geometry used: for a Bragg angle of 90◦, theideal detector position is on the sample. Thus, due to the spa-tial clearance necessary to install large sample environmentsetups, we set the higher limit to 86◦.
Such a geometry (each crystal is maintained vertically,the detector is above the sample), allows to increase the
Downloaded 06 Oct 2013 to 202.116.1.149. This article is copyrighted as indicated in the abstract. Reuse of AIP content is subject to the terms at: http://rsi.aip.org/about/rights_and_permissions
063104-4 Llorens et al. Rev. Sci. Instrum. 83, 063104 (2012)
FIG. 3. Visualisation of the intersection between the incident beam and the detection cone and resolution effect – vertical spreading of the focal spoton the detector.
number of crystals symmetrically around the axis sample-detector. The different Rowland circles intersect then exactlyat the same points, the sample and the detector, without anyadditional angular adjustment. This geometry is also usedfor example in a 5-crystal,22 14-crystal,23, 24 and 40-crystal24
spectrometers installed on the 6-2 beamline at SSRL.The spectrometer uses in total 24 small stepper motors to
control all the motions: four stepper motors for each crystalbloc, one for the main vertical translation and three for thedetector motions. Many commercial electronics for such de-vices exist but our choice was to develop our own controller,with less features and less versatile than commercial devices,but clearly cheaper. We chose to use WAGO modules, an 750-841 Ethernet 100 Mbit/s TCP/IP programmable fieldbus con-
FIG. 4. View of the spectrometer: detail of crystal assemblage (left—topposition), view of the spectrometer on the beamline with the Vortex EX-90as detector (left—down position), and top-view of a spectrometer drawing(right).
troller, and stepper motor modules for current up to 1.5 A. Thecommands necessary to control the motors are sent via ESRFstandard control program SPEC (Ref. 25) to each rack con-troller. The main advantages of our system are its small size, aconnection via Ethernet, a standalone operation feature to testthe motor either with a web client or console based program,and the low cost. The spectrometer can be relatively easily re-moved from the beamline, and reinstalled and controlled by alaptop anywhere.
B. Optics
Different geometries exist depending on the application:Cu foil absorber coupled to a point focusing spatial filter26
for XRS, Bent crystal Laue analyzer in a logarithmic spiralshape27–30 for XAFS. We choose to work with spherical bentcrystals in the Johann geometry.31
Spherically bent crystals (0.5 m bending radius) with adiameter of 0.1 m are used as dispersive optical elements inthe spectrometer. The crystals are assembled as already de-scribed by Collart and co-workers.31 High resolution x-rayanalyzers are obtained using anodic bonding technique, whichis a method of permanently joining glass to silicon without theuse of adhesives. This method is a common process used inmicroelectronics device fabrication. The analyzer consists ofa 225 μm thick silicon wafer spherically bent between con-vex and concave polished PYREX glass substrates of 0.5 mcurvature radius. A dedicated experimental setup has been de-veloped by the ‘Cellule Project’ of the Institut de Minéralogieet Physique des Milieux Condensés in order to clamp siliconwafer and glass substrates at high force (1500 N) and hightemperature (∼ 350 ◦C). A high DC potential (up to >1.7 kV)is then applied between silicon and glass creating an elec-trical field which drifts the ions in the glass. The depletionof sodium ions near the surface and the creation of surface
Downloaded 06 Oct 2013 to 202.116.1.149. This article is copyrighted as indicated in the abstract. Reuse of AIP content is subject to the terms at: http://rsi.aip.org/about/rights_and_permissions
063104-5 Llorens et al. Rev. Sci. Instrum. 83, 063104 (2012)
charge generate a large electrostatic force and bring the sili-con and glass into intimate contact, eventually creating chem-ical bonds. Such analyzers have been successfully producedand have improved the energy resolution.31
Currently, spherically bent Si crystals with (111) and(110) orientations are available on the beamline. They havebeen characterized by measuring the energy resolution on thespectrometer (see Sec. III D). Two others orientations (331)and (311) will be available in the future. These sets of differ-ent crystals will allow to cover a broad energy range from 4 to19.7 keV. Such an energy range is sufficient to probe the Kα,Kβ, Lα, and Lβ fluorescence lines of all the elements fromCa (Z = 20) to U (Z = 92).
C. Detection
In the Rowland circle geometry, the detector is locatedabove the sample, along the zdet axis (Fig. 4). The totalpath length from the sample to the diffracting bent crys-tal and then to the detector equals 1 m; therefore operationunder helium atmosphere is compulsory in order to min-imize the absorption, especially in the low-energy region(from 4 to 8 keV).
Currently, two detectors are available. The first one is a 5mm thick NaI(Tl) scintillator from FBM Oxford with a largeactive surface (7 cm2), an energy resolution of 50% and alow maximum counting rate. The second detector is a silicondrift detector (SDD) from SII Nanotechnology (VORTEX-90EX R©) with a small active area (50 mm2) and a high dy-namic range, it is also more compact and offers a useful en-ergy resolution (2%–4%).
The use of a 2D hybrid pixel detector such as XPAD3S(Ref. 32) (soon available on the beamline), Pilatus,33
Medipix2 (Ref. 34) is also possible. The advantage of using2D detectors is the possibility to have a single threshold ad-justable per pixel and so to suppress the background counts(as with the SDD). Moreover such a detector can be usedto isolate the appropriate signal induced by the x-ray beam-sample interaction, so as to discriminate the signals from thesample and from its container. Finally it also allows to focusthe diffracted photons on different areas on this detector, tomonitor each crystal separately.
D. Theoretical and experimental resolutions
The global theoretical resolution of the spectrometerincludes both the incident beam characteristics (the beamvertical size, h, �Ebeam vertical size) and those of the crys-tal (the intrinsic resolution of the chosen reflexion at theemission energy E, �Ereflexion, the Johann’s approximation,�EJohann):
�Ebeam vertical size = 2 × E ×
tan−1
⎡⎢⎣h × cos
⎛⎜⎝
π
2− θ
2000 × R
⎞⎟⎠
⎤⎥⎦
tan θ
�Ereflexion = E × (2.26 × 10⁻⁷) × fhkl
×
⎛⎜⎝
8 if hkl even and h + k + l = 4n
4√
2 if hkl odd
0 otherwise
⎞⎟⎠ ,
�Ejohann = 1000 × E
6×
(50
R
)2
tan2 θ
where θ is the Bragg angle (◦), E the fluorescence emissionenergy (eV), fhkl the structure factor of the reflexion, R thecrystal curvature radius (m), and h the vertical beam size(mm).
The contributions being independent, the total energyresolution �ECAS of the spectrometer is the convolution ofall these individual contributions. By approximating all thesecontributions as Gaussian functions, �ECAS (can be easilycalculated using the following formula:
(�ECAS)2=(�Ereflexion)2 + (�EJohann)2 + (�Ebeam vertical size)2.
The experimental resolution is determined by recordingthe quasi-elastic peak of the incident beam from the sam-ple. The FWHM of the peak, fitted by a Gaussian function,gives the total (incident beam and spectrometer contribution)experimental resolution value. Theoretical and experimentalresolutions obtained for the first experiments are gathered inTable II.
As it can be seen, experimental values are in generalworse than the theoretical expected values. However, for lowhkl values, experimental resolutions are close to theoreticalvalues while for high hkl value, a better resolution can be ex-pected. This probably due to the microstrains developed dur-ing the crystal bending stage. Bending causes elastic defor-mations in the crystal structure which ultimately broaden thebandwidth of the reflection.35, 36 A solution to overcome thiseffect is to use diced analyzer crystals, which are built by fix-ing a large number, typically 104, of small flat single crystals(dices) on a spherical substrate, thus providing a polygonalapproximation to the Rowland circle geometry.37 These crys-tals allow a better resolution: 10–300 meV for diced Si(nnn)crystals with n = 3–7 to be compared with 500–2000 meVfor bent Si(nnn)/Si(nn0) crystals with n = 3–8 for the samecurvature radius.38
The main effect of the Johann geometrical aberrations ison the energy resolution result. This is a consequence of avertical spreading of the diffracted spot on the detector due
TABLE II. Experimental and theoretical resolutions for HERDF-XASexperiments.
Emission line CrystalBragg
angle (◦)Theoretical
resolution (eV)
Bestexperimental
resolution (eV)
Fe Kα1 (6.404 keV) Si(333) 67.9 1.9 2.3Co Kα1 (6.930 keV) Si(440) 68.7 1.9 3.0Fe Kβ1 (7.058 keV) Si(440) 66.1 1.9 2.0Cu Kα1 (8.048 keV) Si(444) 79.3 0.7 1.4Sr Kα1 (14.165 keV) Si(880) 65.7 5.0 12.9
Downloaded 06 Oct 2013 to 202.116.1.149. This article is copyrighted as indicated in the abstract. Reuse of AIP content is subject to the terms at: http://rsi.aip.org/about/rights_and_permissions

063104-6 Llorens et al. Rev. Sci. Instrum. 83, 063104 (2012)
to the incidence angle α of the x-ray arriving at the center ofthe bend crystal, higher than an x-ray arriving in another areaof it (Fig. 3). To decrease this contribution and so to increasethe energy resolution, it is possible to limit the detection area,i.e., to limit the crystal collecting area to its center.
V. EXPERIMENTAL VALIDATION
We have seen in Sec. III several limitations of solidstate detectors (saturation, energy, and spatial resolution).This paragraph presents a solution to overcome some of theselimitations. The first measurements were dedicated to XAFSspectroscopy applications: (i) the matrix fluorescence removal(see Sec. III A) with the study of Co adsorbed on iron oxidenanoparticles and (ii) the probe of a weak fluorescence at highenergy (see Sec. III B) in a crystalline matrix with the exam-ple of diluted Sr in UO2 simulated irradiated nuclear fuel.
A. Beyond the saturation: Co adsorbed on iron oxidenanoparticles
During the last decade, interest in nanotechnology andmanufactured nanoparticles has grown and a wide range ofapplications for emerging nanomaterials has been proposed.For instance differences in reactivity might be exploited toimprove surface-based reactions as it could be used for arsenicremoval processes. Oxyhydroxide iron particles smaller than20 nm exhibit an increase of adsorption capacity and those of11 nm in diameter adsorbs 3 times more As per nm2 than 20nm particles.39–41
In our experiment, we focus on the mechanisms of Coadsorption at the surface of nanomaghemite (γ -Fe2O3). Thedifficulty, here, is to probe an element (Co, atomic no. Z) ad-sorbed on another (Fe, atomic no. Z – 1) which dominates thefluorescence signal. Co K-edge total fluorescence and highenergy resolution fluorescence detected (HERFD)-XANESspectra are presented in Fig. 5.
The integrated counts after edge are 4.8 × 10⁵ using SSDand 3.6 × 10⁴ using CAS corresponding to count-rates of 8× 10⁴ s−1 and 300 s−1, respectively. These values do not re-flect the data quality. One way to quantify the detector ef-ficiency for a given kind of sample is then to calculate the
effective number of counts (Neff)12 defined asN2
signal
Nsignal+Nbackground.
For this particular system, Neff is ∼150 c/s for SSD and 250c/s for CAS. In the last case, the total count-rate is dominatedby useful events (250 out of 300 s−1) are effective counts. Itis thus reasonable to multiply the number of acquisitions toincrease the data quality. Moreover, the background on CASspectrum is very low, constant and due to photons scattered(not diffracted) by the crystals. Inversely, the background onSSD spectrum is high and increases with energy. Indepen-dently from statistical considerations, the spectrum shape as-sociated with very small absorption edge (∼0.002) makes thenormalization of SSD data very complicated for this particu-lar system.
HERFD data have been analyzed and preliminary resultsshow that with this high surface coverage, Co atoms are ad-sorbed on ferrihydrite surface.
FIG. 5. Co K-edge XANES of Co adsorbed on ferrihydrite collected in totalfluorescence yield using a solid state detector (SSD) and in high energy res-olution fluorescence detected using the crystal analyzer spectrometer (CAS).Integrated counts after edge are ∼5 × 10⁵ using SSD and ∼4 × 10⁴ usingCAS for counting times of 6 s and 120 s, respectively.
B. Energy resolution: Sr in simulated irradiatedUO2 nuclear fuel
One of the main goals of research in nuclear energy is toimprove the economic and safety performance of nuclear fu-els. One solution is to extend its life time in reactor. But in thiscase, the behavior of fission products becomes the limitingfactor and more specifically their segregation/precipitation.Thus, increasing fuel burn up must be accompanied by an ef-fort to improve our understanding of the nature and behaviorof the material as fission products accumulate. One courseof action is to collect experimental data relative to irradiatedfuel. Due to the very high radioactivity of the samples, thisdata can only be obtained through post-irradiation examina-tion of irradiated fuels in dedicated facilities. To overcomethe former difficulty, the use of simulated high burn up UO2
nuclear fuel, termed SIMFUEL, is a good alternative.42
This experiment has a double interest. The first one is toprobe a diluted element (Sr at 1400 ppm) in a crystalline UO2
sample doped with 11 elements (Ba, Ce, La, Mo, Sr, Y, Zr, Rh,Pd, Ru, and Nd) simulating the chemical composition of irra-diated nuclear fuel. The second more technical interest is tosee if we can limit the impact on the XAS spectra of the Braggpeaks originating from the well-crystallized UO2 matrix. Forthe experiment detailed here, we focused our interest on Sr.
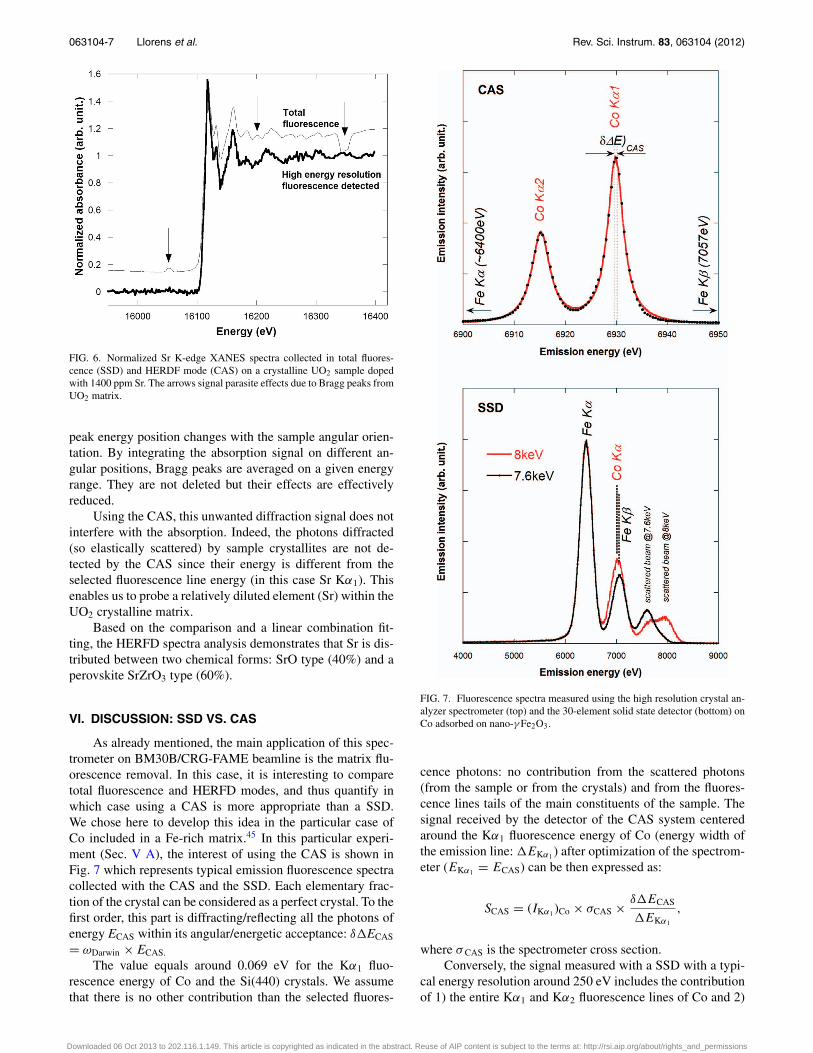
The data are collected both in HERFD and total fluo-rescence modes at Sr K-edge. In total fluorescence detec-tion using SSD, the XANES/EXAFS spectra cannot be ex-ploited due to Bragg peaks in the pre-edge and at the endof the EXAFS region (Fig. 6). Several orientations of thesample relative to the incident beam are tested but providedno improvement. However, different solutions exist to reducethe spurious signal given by Bragg peaks using rotating43
or vibrating44 sample holder. With such systems, the Bragg
Downloaded 06 Oct 2013 to 202.116.1.149. This article is copyrighted as indicated in the abstract. Reuse of AIP content is subject to the terms at: http://rsi.aip.org/about/rights_and_permissions
063104-7 Llorens et al. Rev. Sci. Instrum. 83, 063104 (2012)
FIG. 6. Normalized Sr K-edge XANES spectra collected in total fluores-cence (SSD) and HERDF mode (CAS) on a crystalline UO2 sample dopedwith 1400 ppm Sr. The arrows signal parasite effects due to Bragg peaks fromUO2 matrix.
peak energy position changes with the sample angular orien-tation. By integrating the absorption signal on different an-gular positions, Bragg peaks are averaged on a given energyrange. They are not deleted but their effects are effectivelyreduced.
Using the CAS, this unwanted diffraction signal does notinterfere with the absorption. Indeed, the photons diffracted(so elastically scattered) by sample crystallites are not de-tected by the CAS since their energy is different from theselected fluorescence line energy (in this case Sr Kα1). Thisenables us to probe a relatively diluted element (Sr) within theUO2 crystalline matrix.
Based on the comparison and a linear combination fit-ting, the HERFD spectra analysis demonstrates that Sr is dis-tributed between two chemical forms: SrO type (40%) and aperovskite SrZrO3 type (60%).
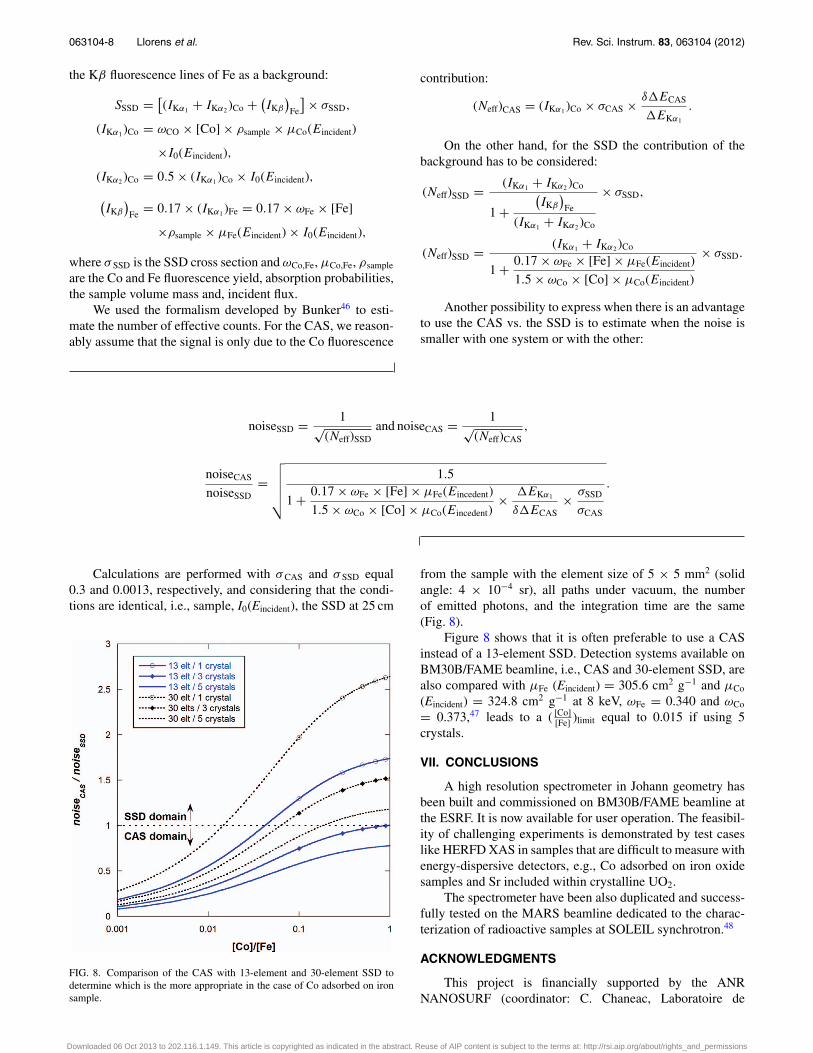
VI. DISCUSSION: SSD VS. CAS
As already mentioned, the main application of this spec-trometer on BM30B/CRG-FAME beamline is the matrix flu-orescence removal. In this case, it is interesting to comparetotal fluorescence and HERFD modes, and thus quantify inwhich case using a CAS is more appropriate than a SSD.We chose here to develop this idea in the particular case ofCo included in a Fe-rich matrix.45 In this particular experi-ment (Sec. V A), the interest of using the CAS is shown inFig. 7 which represents typical emission fluorescence spectracollected with the CAS and the SSD. Each elementary frac-tion of the crystal can be considered as a perfect crystal. To thefirst order, this part is diffracting/reflecting all the photons ofenergy ECAS within its angular/energetic acceptance: δ�ECAS
= ωDarwin × ECAS.
The value equals around 0.069 eV for the Kα1 fluo-rescence energy of Co and the Si(440) crystals. We assumethat there is no other contribution than the selected fluores-
FIG. 7. Fluorescence spectra measured using the high resolution crystal an-alyzer spectrometer (top) and the 30-element solid state detector (bottom) onCo adsorbed on nano-γ Fe2O3.
cence photons: no contribution from the scattered photons(from the sample or from the crystals) and from the fluores-cence lines tails of the main constituents of the sample. Thesignal received by the detector of the CAS system centeredaround the Kα1 fluorescence energy of Co (energy width ofthe emission line: �EKα1 ) after optimization of the spectrom-eter (EKα1 = ECAS) can be then expressed as:
SCAS = (IKα1 )Co × σCAS × δ�ECAS
�EKα1
,
where σ CAS is the spectrometer cross section.Conversely, the signal measured with a SSD with a typi-
cal energy resolution around 250 eV includes the contributionof 1) the entire Kα1 and Kα2 fluorescence lines of Co and 2)
Downloaded 06 Oct 2013 to 202.116.1.149. This article is copyrighted as indicated in the abstract. Reuse of AIP content is subject to the terms at: http://rsi.aip.org/about/rights_and_permissions
063104-8 Llorens et al. Rev. Sci. Instrum. 83, 063104 (2012)
the Kβ fluorescence lines of Fe as a background:
SSSD = [(IKα1 + IKα2 )Co + (
IKβ
)Fe
] × σSSD,
(IKα1 )Co = ωCO × [Co] × ρsample × μCo(Eincident)
×I0(Eincident),
(IKα2 )Co = 0.5 × (IKα1 )Co × I0(Eincident),
(IKβ
)Fe = 0.17 × (IKα1 )Fe = 0.17 × ωFe × [Fe]
×ρsample × μFe(Eincident) × I0(Eincident),
where σ SSD is the SSD cross section and ωCo,Fe, μCo,Fe, ρsample
are the Co and Fe fluorescence yield, absorption probabilities,the sample volume mass and, incident flux.
We used the formalism developed by Bunker46 to esti-mate the number of effective counts. For the CAS, we reason-ably assume that the signal is only due to the Co fluorescence
contribution:
(Neff)CAS = (IKα1 )Co × σCAS × δ�ECAS
�EKα1
.
On the other hand, for the SSD the contribution of thebackground has to be considered:
(Neff)SSD = (IKα1 + IKα2 )Co
1 +(IKβ
)Fe
(IKα1 + IKα2 )Co
× σSSD,
(Neff)SSD = (IKα1 + IKα2 )Co
1 + 0.17 × ωFe × [Fe] × μFe(Eincident)
1.5 × ωCo × [Co] × μCo(Eincident)
× σSSD.
Another possibility to express when there is an advantageto use the CAS vs. the SSD is to estimate when the noise issmaller with one system or with the other:
noiseSSD = 1√(Neff)SSD
and noiseCAS = 1√(Neff)CAS
,
noiseCAS
noiseSSD=
√√√√√1.5
1 + 0.17 × ωFe × [Fe] × μFe(Eincedent)
1.5 × ωCo × [Co] × μCo(Eincedent)× �EKα1
δ�ECAS× σSSD
σCAS
.
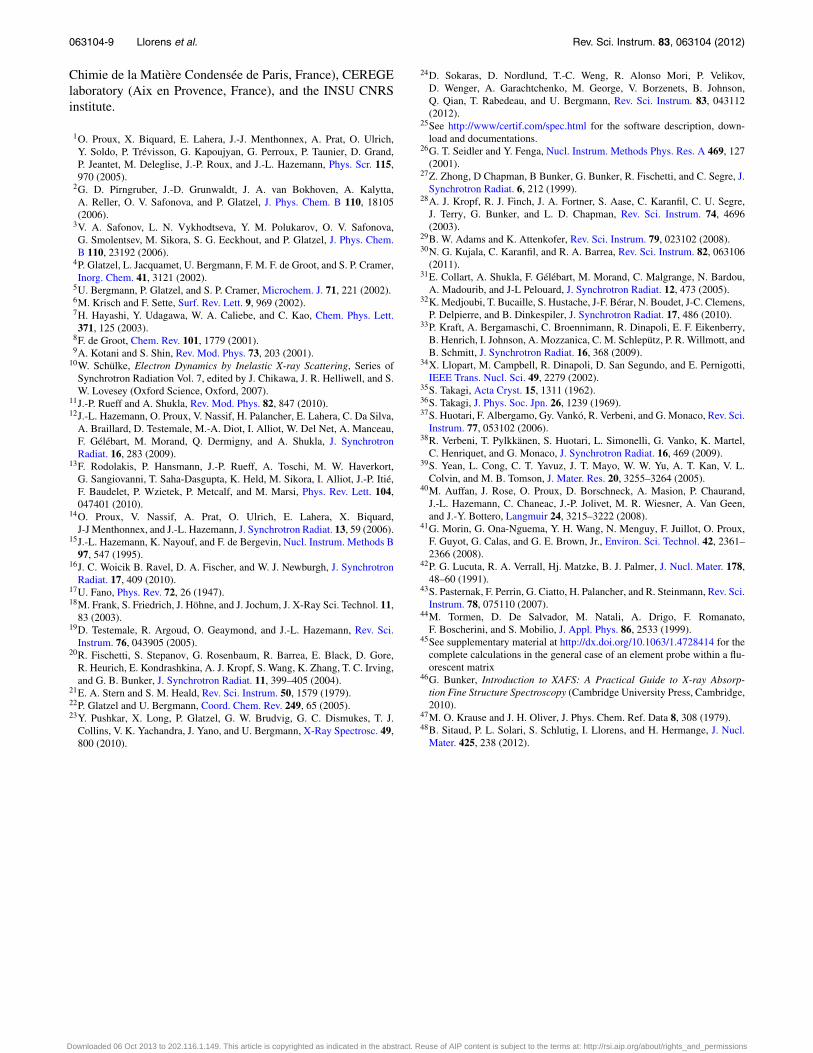
Calculations are performed with σ CAS and σ SSD equal0.3 and 0.0013, respectively, and considering that the condi-tions are identical, i.e., sample, I0(Eincident), the SSD at 25 cm
FIG. 8. Comparison of the CAS with 13-element and 30-element SSD todetermine which is the more appropriate in the case of Co adsorbed on ironsample.
from the sample with the element size of 5 × 5 mm2 (solidangle: 4 × 10⁻⁴ sr), all paths under vacuum, the numberof emitted photons, and the integration time are the same(Fig. 8).
Figure 8 shows that it is often preferable to use a CASinstead of a 13-element SSD. Detection systems available onBM30B/FAME beamline, i.e., CAS and 30-element SSD, arealso compared with μFe (Eincident) = 305.6 cm2 g−1 and μCo
(Eincident) = 324.8 cm2 g−1 at 8 keV, ωFe = 0.340 and ωCo
= 0.373,47 leads to a ( [Co][Fe] )limit equal to 0.015 if using 5
crystals.
VII. CONCLUSIONS
A high resolution spectrometer in Johann geometry hasbeen built and commissioned on BM30B/FAME beamline atthe ESRF. It is now available for user operation. The feasibil-ity of challenging experiments is demonstrated by test caseslike HERFD XAS in samples that are difficult to measure withenergy-dispersive detectors, e.g., Co adsorbed on iron oxidesamples and Sr included within crystalline UO2.
The spectrometer have been also duplicated and success-fully tested on the MARS beamline dedicated to the charac-terization of radioactive samples at SOLEIL synchrotron.48
ACKNOWLEDGMENTS
This project is financially supported by the ANRNANOSURF (coordinator: C. Chaneac, Laboratoire de
Downloaded 06 Oct 2013 to 202.116.1.149. This article is copyrighted as indicated in the abstract. Reuse of AIP content is subject to the terms at: http://rsi.aip.org/about/rights_and_permissions
063104-9 Llorens et al. Rev. Sci. Instrum. 83, 063104 (2012)
Chimie de la Matière Condensée de Paris, France), CEREGElaboratory (Aix en Provence, France), and the INSU CNRSinstitute.
1O. Proux, X. Biquard, E. Lahera, J.-J. Menthonnex, A. Prat, O. Ulrich,Y. Soldo, P. Trévisson, G. Kapoujyan, G. Perroux, P. Taunier, D. Grand,P. Jeantet, M. Deleglise, J.-P. Roux, and J.-L. Hazemann, Phys. Scr. 115,970 (2005).
2G. D. Pirngruber, J.-D. Grunwaldt, J. A. van Bokhoven, A. Kalytta,A. Reller, O. V. Safonova, and P. Glatzel, J. Phys. Chem. B 110, 18105(2006).
3V. A. Safonov, L. N. Vykhodtseva, Y. M. Polukarov, O. V. Safonova,G. Smolentsev, M. Sikora, S. G. Eeckhout, and P. Glatzel, J. Phys. Chem.B 110, 23192 (2006).
4P. Glatzel, L. Jacquamet, U. Bergmann, F. M. F. de Groot, and S. P. Cramer,Inorg. Chem. 41, 3121 (2002).
5U. Bergmann, P. Glatzel, and S. P. Cramer, Microchem. J. 71, 221 (2002).6M. Krisch and F. Sette, Surf. Rev. Lett. 9, 969 (2002).7H. Hayashi, Y. Udagawa, W. A. Caliebe, and C. Kao, Chem. Phys. Lett.371, 125 (2003).
8F. de Groot, Chem. Rev. 101, 1779 (2001).9A. Kotani and S. Shin, Rev. Mod. Phys. 73, 203 (2001).
10W. Schülke, Electron Dynamics by Inelastic X-ray Scattering, Series ofSynchrotron Radiation Vol. 7, edited by J. Chikawa, J. R. Helliwell, and S.W. Lovesey (Oxford Science, Oxford, 2007).
11J.-P. Rueff and A. Shukla, Rev. Mod. Phys. 82, 847 (2010).12J.-L. Hazemann, O. Proux, V. Nassif, H. Palancher, E. Lahera, C. Da Silva,
A. Braillard, D. Testemale, M.-A. Diot, I. Alliot, W. Del Net, A. Manceau,F. Gélébart, M. Morand, Q. Dermigny, and A. Shukla, J. SynchrotronRadiat. 16, 283 (2009).
13F. Rodolakis, P. Hansmann, J.-P. Rueff, A. Toschi, M. W. Haverkort,G. Sangiovanni, T. Saha-Dasgupta, K. Held, M. Sikora, I. Alliot, J.-P. Itié,F. Baudelet, P. Wzietek, P. Metcalf, and M. Marsi, Phys. Rev. Lett. 104,047401 (2010).
14O. Proux, V. Nassif, A. Prat, O. Ulrich, E. Lahera, X. Biquard,J-J Menthonnex, and J.-L. Hazemann, J. Synchrotron Radiat. 13, 59 (2006).
15J.-L. Hazemann, K. Nayouf, and F. de Bergevin, Nucl. Instrum. Methods B97, 547 (1995).
16J. C. Woicik B. Ravel, D. A. Fischer, and W. J. Newburgh, J. SynchrotronRadiat. 17, 409 (2010).
17U. Fano, Phys. Rev. 72, 26 (1947).18M. Frank, S. Friedrich, J. Höhne, and J. Jochum, J. X-Ray Sci. Technol. 11,
83 (2003).19D. Testemale, R. Argoud, O. Geaymond, and J.-L. Hazemann, Rev. Sci.
Instrum. 76, 043905 (2005).20R. Fischetti, S. Stepanov, G. Rosenbaum, R. Barrea, E. Black, D. Gore,
R. Heurich, E. Kondrashkina, A. J. Kropf, S. Wang, K. Zhang, T. C. Irving,and G. B. Bunker, J. Synchrotron Radiat. 11, 399–405 (2004).
21E. A. Stern and S. M. Heald, Rev. Sci. Instrum. 50, 1579 (1979).22P. Glatzel and U. Bergmann, Coord. Chem. Rev. 249, 65 (2005).23Y. Pushkar, X. Long, P. Glatzel, G. W. Brudvig, G. C. Dismukes, T. J.
Collins, V. K. Yachandra, J. Yano, and U. Bergmann, X-Ray Spectrosc. 49,800 (2010).
24D. Sokaras, D. Nordlund, T.-C. Weng, R. Alonso Mori, P. Velikov,D. Wenger, A. Garachtchenko, M. George, V. Borzenets, B. Johnson,Q. Qian, T. Rabedeau, and U. Bergmann, Rev. Sci. Instrum. 83, 043112(2012).
25See http://www/certif.com/spec.html for the software description, down-load and documentations.
26G. T. Seidler and Y. Fenga, Nucl. Instrum. Methods Phys. Res. A 469, 127(2001).
27Z. Zhong, D Chapman, B Bunker, G. Bunker, R. Fischetti, and C. Segre, J.Synchrotron Radiat. 6, 212 (1999).
28A. J. Kropf, R. J. Finch, J. A. Fortner, S. Aase, C. Karanfil, C. U. Segre,J. Terry, G. Bunker, and L. D. Chapman, Rev. Sci. Instrum. 74, 4696(2003).
29B. W. Adams and K. Attenkofer, Rev. Sci. Instrum. 79, 023102 (2008).30N. G. Kujala, C. Karanfil, and R. A. Barrea, Rev. Sci. Instrum. 82, 063106
(2011).31E. Collart, A. Shukla, F. Gélébart, M. Morand, C. Malgrange, N. Bardou,
A. Madourib, and J-L Pelouard, J. Synchrotron Radiat. 12, 473 (2005).32K. Medjoubi, T. Bucaille, S. Hustache, J-F. Bérar, N. Boudet, J-C. Clemens,
P. Delpierre, and B. Dinkespiler, J. Synchrotron Radiat. 17, 486 (2010).33P. Kraft, A. Bergamaschi, C. Broennimann, R. Dinapoli, E. F. Eikenberry,
B. Henrich, I. Johnson, A. Mozzanica, C. M. Schlepütz, P. R. Willmott, andB. Schmitt, J. Synchrotron Radiat. 16, 368 (2009).
34X. Llopart, M. Campbell, R. Dinapoli, D. San Segundo, and E. Pernigotti,IEEE Trans. Nucl. Sci. 49, 2279 (2002).
35S. Takagi, Acta Cryst. 15, 1311 (1962).36S. Takagi, J. Phys. Soc. Jpn. 26, 1239 (1969).37S. Huotari, F. Albergamo, Gy. Vankó, R. Verbeni, and G. Monaco, Rev. Sci.
Instrum. 77, 053102 (2006).38R. Verbeni, T. Pylkkänen, S. Huotari, L. Simonelli, G. Vanko, K. Martel,
C. Henriquet, and G. Monaco, J. Synchrotron Radiat. 16, 469 (2009).39S. Yean, L. Cong, C. T. Yavuz, J. T. Mayo, W. W. Yu, A. T. Kan, V. L.
Colvin, and M. B. Tomson, J. Mater. Res. 20, 3255–3264 (2005).40M. Auffan, J. Rose, O. Proux, D. Borschneck, A. Masion, P. Chaurand,
J.-L. Hazemann, C. Chaneac, J.-P. Jolivet, M. R. Wiesner, A. Van Geen,and J.-Y. Bottero, Langmuir 24, 3215–3222 (2008).
41G. Morin, G. Ona-Nguema, Y. H. Wang, N. Menguy, F. Juillot, O. Proux,F. Guyot, G. Calas, and G. E. Brown, Jr., Environ. Sci. Technol. 42, 2361–2366 (2008).
42P. G. Lucuta, R. A. Verrall, Hj. Matzke, B. J. Palmer, J. Nucl. Mater. 178,48–60 (1991).
43S. Pasternak, F. Perrin, G. Ciatto, H. Palancher, and R. Steinmann, Rev. Sci.Instrum. 78, 075110 (2007).
44M. Tormen, D. De Salvador, M. Natali, A. Drigo, F. Romanato,F. Boscherini, and S. Mobilio, J. Appl. Phys. 86, 2533 (1999).
45See supplementary material at http://dx.doi.org/10.1063/1.4728414 for thecomplete calculations in the general case of an element probe within a flu-orescent matrix
46G. Bunker, Introduction to XAFS: A Practical Guide to X-ray Absorp-tion Fine Structure Spectroscopy (Cambridge University Press, Cambridge,2010).
47M. O. Krause and J. H. Oliver, J. Phys. Chem. Ref. Data 8, 308 (1979).48B. Sitaud, P. L. Solari, S. Schlutig, I. Llorens, and H. Hermange, J. Nucl.
Mater. 425, 238 (2012).
Downloaded 06 Oct 2013 to 202.116.1.149. This article is copyrighted as indicated in the abstract. Reuse of AIP content is subject to the terms at: http://rsi.aip.org/about/rights_and_permissions
Related Documents