PROCEEDINGS OF THE SIXTEENTH LUNAR AND PLANETARY SCIENCE CONFERENCE, PART 2 JOURNAL OF GEOPHYSICAL RESEARCH, VOL. 91, NO. B4, PAGES D495-D504, MARCH 30, 1986 High Energy Irradiations Simulating Cosmic-ray-induced Planetary Gamma Ray Production: I. Fe Target ALBERT E. METZGER, RICHARD H. PARKER •, AND JOSEPH YELLIN 2 Jet Propulsion Laboratory, California Institute of Technology A series of 6 GeVproton irradiations at the Argonne National Laboratory's ZeroGradient Synchrocyclotron included the bombardment of two thick Fetargets forthe purpose of simulating the cosmic ray bombardment ofplanetary objects in space. Cosmic ray bombardment leads to characteristic gamma ray production, from which, by measuring their energy andintensity, surface composition may bederived. In this experiment, gamma ray energy spectra were obtained with a germanlure solid state detector during the bombardment. The spectra show much detail, with 46ofthe gamma ray lines ascribed to theFe targets. The background includes recoil-broadened lines due to energetic neutron interactions in the Ge detector. A comparison with values predicted bymodeling shows good agreement forFelines from neutron inelastic scattering andspallation reactions, andless satisfactory agreement for neutron capture reactions, the latter found to bedue primarily to thedifference in composition between the Fe target andthe mean lunar abundance used in the modeling. Analysis of the irradiation results combined with continuum data obtained in lunar orbit indicatesthat 100 hours of measurementwith a state-of- the-art instrument should generate a spectrum containing approximately 20 lines dueto Fe alone, with' a 2a sensitivity for detection of about 0.2%. INTRODUCTION Galactic cosmic rays pervade the innersolar system with a' flux density averaging-2 particles cm-2s -• and a mean energy of-1.8 GeV per nucleon [Ormes and Webber, 1965; Charakhchyan and Charakhchyan, !969], values that are modulated by about a factor of twoover the1 l-year solar cycle. Their interaction with planetary surface material results in a cascade of various secondary particles, some of which induce nuclear reactions yielding gamma rays of characteristic energy. Most of the latter are initiated by secondary neutrons, either through the inelastic scattering of neutrons with energies up to about 20 MeV, or by the capture of thermalized neutrons. Energetic cosmicray particles, principally protons,initiate nuclear reactions directly that lead to prompt as wellasdelayed gamma ray emission. Low energy secondary charged particles contribute little as their ionization range is short compared to the mean free path for nuclear interaction. The production and detection of these characteristic gamma raysprovides a means of obtaining compositional analyses of planetary surfaces. They comprise about 20% of the photon flux generated in the cascade process; theremainder produces a continuum of no geochemical relevance. Gamma ray linefluxes generated by cosmic rays bombarding the moon have been computed byGorenstein and Gursky [1970], Armstrong [1972], Reedy eta!. [1973], and Reedy [1978]. Consideration has alsobeen given to cosmic ray induced line emission from other planetary objects such asMarsandcomet nu•:lei [Metzger and Arnold, 1970; Lapides, 1981; R.C.Reedy, peisonal communication, 1980]. The gamma ray response functions depend on the general chemistry of the object inasmuch as changes in the neutron moderating or absorbing environment will strongly influence thereaction yield. •Now at TRW, Redondo Beach, California 2Now at TheHebrew University ofJerusalem, Israel Copyright 1986 bytheAmerican Geophysical Union. Paper number 5B7107. 0148-0227/86/005B-7107505.00 Computing the yield of nuclear gammaraysdueto incident cosmic raysrequires combining the flux and energy spectrum of the secondary particles, which vary as a function of target depth, with the corresponding excitation function for each nuclear reaction of interest. Reedy etal. [1973] and Reedy [1978] haveused the cascade model of Reedyand Arnold [1972] for the former and experimental cross sections reportedin the literature for the latter. The resultant unit concentration source responsefunctions have been applied to measurements performed at themoonwith a gamma ray spectrometer carried in lunarorbitby Apollos 15and 16. The results are in reasonable agreement with measurements on typical soil sample compo- sitions from sites assumed to represent ground truthwithinthe fieldof viewof the instrument [Bielefeld et al., 1976]. However, theimprovement provided by applying offset correction factors shows that the accuracy of the model hasbeen a limiting factor in reporting absolute results for Fe, Ti, and Mg. Gamma ray spectroscopy is a candidate experiment for the forthcoming Mars Observer orbital mission and for other contemplated planetary missions aswell. For bodies otherthan the moon, ground truth will not be available. It is therefore important to have good source response values in order to derive accurate concentrations.High energy particle accelerator experiments and balloon flights thatsimulate orduplicate cosmic rayplanetary irradiation can play animportant part in validating, modifying, andextending modelcalculations. Accelerators offer configurational flexibility, control over a range of operating conditions, such as incident particle energy, precise duration,and the use of large target masses. Energies comparable to the mean cosmic ray proton energy of about 1.8 GeV are available.If the targets possess sufficient mass, they can containthe entire cascade so that the complement of nuclear reactions takes place overthe full range of secondary particle energy and intensity, modifiedby target composition in the sameway as it occurs for planetary objects. If the test conditions cannot be def'med well enough to determine absolute crosssections, relative line strengths also provide valuable information. Simulation measuremenu can serve to validate and modify an emission model by identifying thefamilyof detectable lines, their relative strengths, resolution-limited interferences, D495

Welcome message from author
This document is posted to help you gain knowledge. Please leave a comment to let me know what you think about it! Share it to your friends and learn new things together.
Transcript
PROCEEDINGS OF THE SIXTEENTH LUNAR AND PLANETARY SCIENCE CONFERENCE, PART 2 JOURNAL OF GEOPHYSICAL RESEARCH, VOL. 91, NO. B4, PAGES D495-D504, MARCH 30, 1986
High Energy Irradiations Simulating Cosmic-ray-induced Planetary Gamma Ray Production: I. Fe Target
ALBERT E. METZGER, RICHARD H. PARKER •, AND JOSEPH YELLIN 2
Jet Propulsion Laboratory, California Institute of Technology
A series of 6 GeV proton irradiations at the Argonne National Laboratory's Zero Gradient Synchrocyclotron included the bombardment of two thick Fe targets for the purpose of simulating the cosmic ray bombardment of planetary objects in space. Cosmic ray bombardment leads to characteristic gamma ray production, from which, by measuring their energy and intensity, surface composition may be derived. In this experiment, gamma ray energy spectra were obtained with a germanlure solid state detector during the bombardment. The spectra show much detail, with 46 of the gamma ray lines ascribed to the Fe targets. The background includes recoil-broadened lines due to energetic neutron interactions in the Ge detector. A comparison with values predicted by modeling shows good agreement for Fe lines from neutron inelastic scattering and spallation reactions, and less satisfactory agreement for neutron capture reactions, the latter found to be due primarily to the difference in composition between the Fe target and the mean lunar abundance used in the modeling. Analysis of the irradiation results combined with continuum data obtained in lunar orbit indicates that 100 hours of measurement with a state-of- the-art instrument should generate a spectrum containing approximately 20 lines due to Fe alone, with' a 2a sensitivity for detection of about 0.2%.
INTRODUCTION
Galactic cosmic rays pervade the inner solar system with a' flux density averaging-2 particles cm-2s -• and a mean energy of-1.8 GeV per nucleon [Ormes and Webber, 1965; Charakhchyan and Charakhchyan, !969], values that are modulated by about a factor of two over the 1 l-year solar cycle. Their interaction with planetary surface material results in a cascade of various secondary particles, some of which induce nuclear reactions yielding gamma rays of characteristic energy. Most of the latter are initiated by secondary neutrons, either through the inelastic scattering of neutrons with energies up to about 20 MeV, or by the capture of thermalized neutrons. Energetic cosmic ray particles, principally protons, initiate nuclear reactions directly that lead to prompt as well as delayed gamma ray emission. Low energy secondary charged particles contribute little as their ionization range is short compared to the mean free path for nuclear interaction. The production and detection of these characteristic gamma rays provides a means of obtaining compositional analyses of planetary surfaces. They comprise about 20% of the photon flux generated in the cascade process; the remainder produces a continuum of no geochemical relevance.
Gamma ray line fluxes generated by cosmic rays bombarding the moon have been computed by Gorenstein and Gursky [1970], Armstrong [1972], Reedy eta!. [1973], and Reedy [1978]. Consideration has also been given to cosmic ray induced line emission from other planetary objects such as Mars and comet nu•:lei [Metzger and Arnold, 1970; Lapides, 1981; R. C. Reedy, peisonal communication, 1980]. The gamma ray response functions depend on the general chemistry of the object inasmuch as changes in the neutron moderating or absorbing environment will strongly influence the reaction yield.
•Now at TRW, Redondo Beach, California 2Now at The Hebrew University of Jerusalem, Israel
Copyright 1986 by the American Geophysical Union.
Paper number 5B7107. 0148-0227/86/005 B-7107505.00
Computing the yield of nuclear gamma rays due to incident cosmic rays requires combining the flux and energy spectrum of the secondary particles, which vary as a function of target depth, with the corresponding excitation function for each nuclear reaction of interest. Reedy et al. [1973] and Reedy [1978] have used the cascade model of Reedy and Arnold [1972] for the former and experimental cross sections reported in the literature for the latter. The resultant unit concentration source
response functions have been applied to measurements performed at the moon with a gamma ray spectrometer carried in lunar orbit by Apollos 15 and 16. The results are in reasonable agreement with measurements on typical soil sample compo- sitions from sites assumed to represent ground truth within the field of view of the instrument [Bielefeld et al., 1976]. However, the improvement provided by applying offset correction factors shows that the accuracy of the model has been a limiting factor in reporting absolute results for Fe, Ti, and Mg.
Gamma ray spectroscopy is a candidate experiment for the forthcoming Mars Observer orbital mission and for other contemplated planetary missions as well. For bodies other than the moon, ground truth will not be available. It is therefore important to have good source response values in order to derive accurate concentrations. High energy particle accelerator experiments and balloon flights that simulate or duplicate cosmic ray planetary irradiation can play an important part in validating, modifying, and extending model calculations.
Accelerators offer configurational flexibility, control over a range of operating conditions, such as incident particle energy, precise duration, and the use of large target masses. Energies comparable to the mean cosmic ray proton energy of about 1.8 GeV are available. If the targets possess sufficient mass, they can contain the entire cascade so that the complement of nuclear reactions takes place over the full range of secondary particle energy and intensity, modified by target composition in the same way as it occurs for planetary objects. If the test conditions cannot be def'med well enough to determine absolute cross sections, relative line strengths also provide valuable information. Simulation measuremenu can serve to validate and
modify an emission model by identifying the family of detectable lines, their relative strengths, resolution-limited interferences,
D495
D496 METZGER ET AL.: SIMULATED PLANETARY GAMMA RAY EMISSION
Fig. 1. Block diagram of the experimental arrangement.
neutron-composition effects due to thermalization and resonance absorption, and occurrences of Doppler-broadened gamma ray transitions.
Practical difficulties exist. The experiments require an external particle beam with timed operation gated to the interval of beam incidence on the target. Backgrounds from local mass are high, shielding is difficult and may be.cumbersome, beam intensity and time profile vary from pulse to pulse. To fully contain the cascade requires a target about 400 g/cm 2 in thickness. Germanlure detectors are susceptible to radiation damage from excessive particle fluxes, while their resolution and stability are affected by operating conditions at the accelerator [Lebrun et al., 1979].
Bombardments of thick targets with GeV protons for prompt gamma ray spectral measurements were first conducted by us in 1968 at the Lawrence Berkeley Laboratory Bevatron. Indications of major gamma ray line features were obtained from targets of A1 and Fe,but the NaI (T1) scintillation detector employed could not provide adequate energy resolution for useful results. Surkov et al. [1975] have also simulated cosmic- ray-induced gamma ray emission by bombarding thick targets with high energy protons and measuring the emission with a 7 cmx 7 cm NaI (T1) detector. For both sets of experiments, comparison with Apollo spectra that were obtained with a NaI (T1) detector of the same size shows few identifiable lines in the ac•lerator-produeed sp6ctra and shows spurious features that are absent from the Apollo data [Bielefeld et al., 1976]. These contrasts are presumably due to the difficulties associated with real time data collection at high energy accelerators.
In 1976, we undertook a set of accelerator bombardments using the Argonne National Laboratory (ANL) Zero Gradient Synchrocyclotron (ZGS). These were performed with 6 GeV protons on targets of Mg, AI, SiO2, Fe, and o!ivine. Instead of a Na! (TI) scintillatot, a high resolution Ge(Li) solid state detector was used to measure the emitted gamma ray spectra. This paper deals with the results obtained from bombardments of two Fe targets that differed in configuration and geometry. A succeeding paper will report on results from the remaining targets.
EXPERIMENTAL CONDITIONS
A diagram of the experimental arrangement is shown in Figure 1. After passing through a set of bending magnets for energy definition and pion separation, the collimated proton beam from the ZGS was directed through a pair of plastic scinti!lator beam monitors spaced 30 cm apart. The proportion of pions in this beam was less than 5%. The beam monitor coincidence rate
served to define the beam spill period and to measure its intensity.
The beam was characterized by a flat spill lasting 0.7 seconds every 2.5 seconds for a fractional duty cycle of 0.28. The beam intensity averaged 3.0 x 10⁵ protons per pulse and 2.6 x l0 s protons per pulse for the two Fe bombardments, varying during the runs by about +10%. Beam size and shape at the targets were measured by means of polaroid exposures of varying intensity. Intensity contours of the elliptically shaped beam have been determined by scanning the exposures with a Macbeth transmission reflectance densitometer. Shorter exposures were found to be peaked rather than flat-topped. Longer exposures produced a central plateau. Since the densitometer readings of the longest exposure showed the film continuing to darken, this plateau is ascribed, not to film saturation, but to minor beam wandering. Using the average of the four most representative exposures, the major and minor axes of the beam have been measured as 3.21 cm and 1.74 cm. A multiwire ionization chamber in front of the target monitored beam size and position during the bombardments.
The thick Fe targets were placed normal to the beam line. One was cylindrical, measuring 240 g/cm 2 (30.5 cm) in length and 260 g/cm 2 (33.0 cm) in diameter. The other, about three times larger for the purpose of observing the effect of increased target volume on the response, was rectangular, 480 g/cm 2 (61 cm) wide, 300 g/em 2 (38 cm) high, and 260 g/cm 2 (33 era) deep. The rectangular Fe target bombardment also provided a broader spectral range and a check of the experiment geometry.
A Ge(Li) detector with an active volume of 26 em 3 was used to measure the spectrum of gamma rays emitted from the thick targets. The beam-target-detector angle was close to 45 ø . Target- detector separation as measured from the midpoint of the detector to the center point of beam incidence was 31 cm for the cylindrical target, 25 cm for the rectangular target. The detector was coupled to a 4096 channel pulse height analyzer, which was gated by a one-shot pulse from the AND gate monitoring the coincidence output. The detector resolution during these runs was greatly inferior to its nominal 1332 keV value of 2.4 keV. The beam-off calibration average at the experiment site was 3.5 keV, while the value of 4.6 keV for the cylindrical Fe target was typical of the resolution during all bombardments except that of the larger Fe target. Table ! summarizes the geometrical and operational conditions for the two Fe bombardments.
RESULTS
Time-gated bombardments of 5220 seconds and 7980 seconds live'time were performed on the cylindrical and rectangular Fe
TABLE I. Experiment Characteristics ,
Fe-1 Fe-2
Target Shape cylindrical rectangular Target Dimension (cm) 33 diam. 61 wide x 38 high Target Thickness (cm) 30.5 33 Target Cross Sectional Area (cm 2) 856 2320 Target-detector Separation (cm) 31.3 24.9 Clock Time (s) 22680 34680 Live Time (s) 5220 7980 Total Protons 2.69 x 10⁹ 3.62 x 10⁹ Average Protons/Spill 2.97 x l0 s 2.62 x l0 s Beam Energy (GeV) 6.0 6.0 Beam Pulse Length (s) 0.7 0.7 Beam Duty Cycle 0.28 0.28 Detector FWHM Resolution (keV) 4.6 8.0 Energy Range (MeV) 0.13-7.6 0.!4-8.5
METZGER ET AL.: SIMULATED PLANETARY GAMMA RAY EMISSION ]2)497
10 7 : I:: •I • :* I:' l llll: Ill i Ill l i•l,l :•: :i :: :: l:i:, i::::i•: :•ii:: ll:::il::: :l:i :: i:,• :I': Ill] ll,: :I •: ::I:::: I* •:':I :: ill I :: "i ll'll I l'ill llili jill'' 'llljlllll :: ll:l ::''I::: 'I' ]l: I ll'l''il'll[lli : I III :I":: I .... I:-=
½2 106 7 me 72(;0 56Fo _Li 5}l 74-q, 69157 1238 _ - •477 • GeN Fe[ 22 6ONi 105=[ 596 Na
= 6•2 • 133249. 1275 T• 56
104: • , '•/1382 Fe •2;3 n 56 5- -•_ Z • Z / 2113 Fe OFe {
6Fe •Cr55Fe60N, 5• • l•' 10 3• •7 •5 931 1173 Fe = ..... •.•• : 1408 52Cr 56Fe •
10 2 1434 1811
• I• • •1,•1•1•,•1• •1•1• •,1,•1•, ,I,•,•1 •, •1,,,,I,,,,I,• • •1,, ,,I,,,•1 ,,,• I,, ,,I,,,•1,, • ,I,,,•!,,,,I ,,•,1,,,,I,• •1•1,•,,I,,,, I,,,,I,•,,I,, •1,,•1,,,•1• •,1,, • •1 .... i,, 0
":'1 {l Illill "'1 i" '1 "' Illll '1"' '1 ' ' 'li II'"l" ':l :"l I I ill !1'" Ill I/lllll I" I:l::l'"' I ' '"1 '"'l": 'l l' "1" :' I""l 'l'll'l ill' l: 'l ": Ill Ill' '1':' 'l'"'l""l '"'l" "l II! "1 'l':'{'"'l .... I
10 3 16 0 49Ti 49Ti 57Fe 5107DE - •.•. I 539.7DE 5740DE 57Fe 6627SE 57- 57Fe - - ' Fe 7135 -
4OOO 5000 6OOO 7OOO ENERGY (keY)
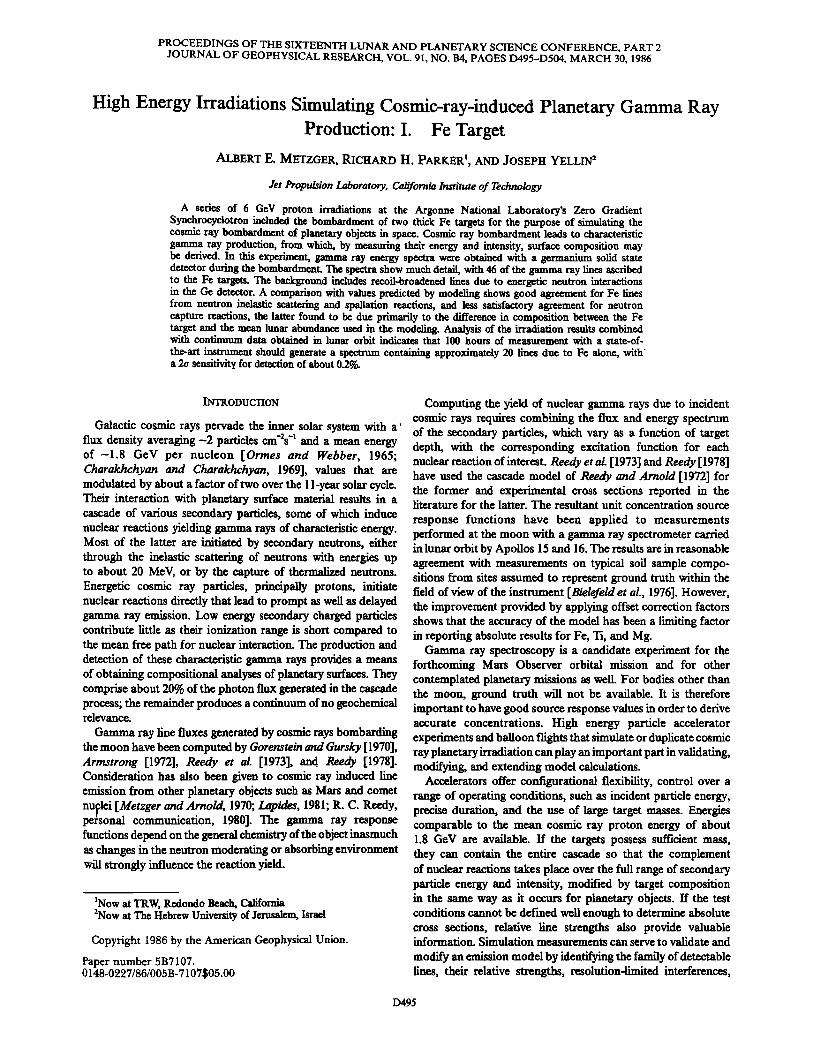
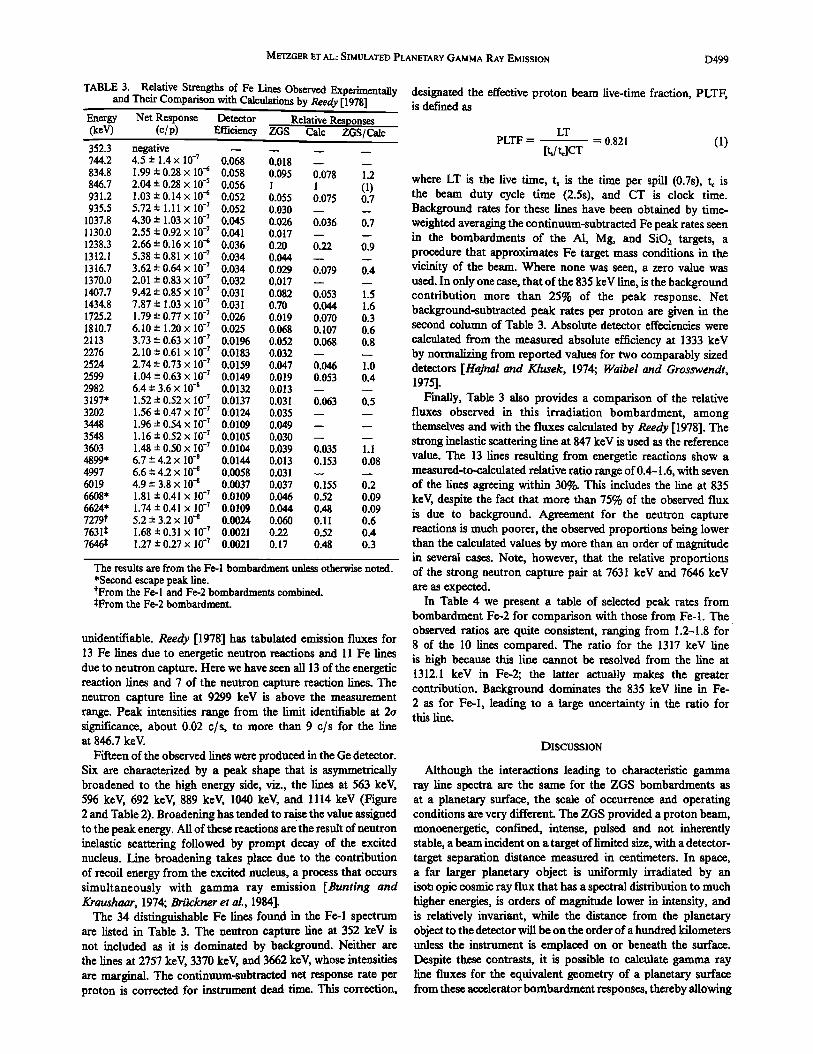
Fig. :2. Observed accumulated couut spectrum of the Fc-! bomba•dmeut. The low cucrg7 cutoff is 0.13 •e¾. The more visible lines are identified with their characteristic energies. Single escape and double escape peaks are designated SE and DE, respectively. High energy recoil broadening of the Ge lines at 596 keV and 691 keV is apparent.
targets, respectively. Bombardment of the cylindrical target (designated Fe-1) gave better results than that of the rectangular target (designated Fe-2) in regard to spectral detail, the superior energy resolution outweighing the shorter running time. The loss in resolution during beam operation is believed due to beam edge effects in the Ge(Li) detector, which was located closer to the beam line in bombardment Fe-2 than during any other. Neither target spectrum displays noisy or dropped channels.
The spectrum from bombardment Fe-1 is shown in Figure 2. The energy range covered is 0.3-7.6 MeV. A number of prominent lines are visible, particularly between 0.5 and 2 MeV. Weaker lines can be seen above the continuum over most of the energy range. The continuum is substantial at all energies and fiattens with increasing energy.
The line search was performed using HYPERMET [Philips and Marlow, 1976] and SAMPO [Routti and Prussi n, 1969] computer line fitting routines as well as visual analysis. The latter was particularly helpful for weak features. Identification
was made by reference to published data, principally Browne et al. [1978], Dickens et aL [1973], and Rasmussen et aL [1969].
Results of the spectral analysis are given in Table 2. Of the 70 lines identified, 44 are attributed to the Fe target, the remainder to background radioactivity from the surrounding mass and to reactions in the Ge detector. A few have more
than one possible origin with energies too dose to be resolved. The lines arising from the target are due to inelastic scattering, neutron capture, and spallation. The criteria for identification were an observed peak energy close to the expected value, generally within 0.1%, and an integrated intensity _> !.7 a above the surrounding continuum. Identification of the weakest lines in Table 2 is justified by association with known energy values. Lines reported in the literature whose presence is suggested but that fail to meet the criteria were noted at 1633.5 keV, 2425 keV, and 3765 keV. Twelve weak features remain unidentified, but most of these must be statistical artifacts. No strong features and only one of moderate intensity, at 6782 keV, proved
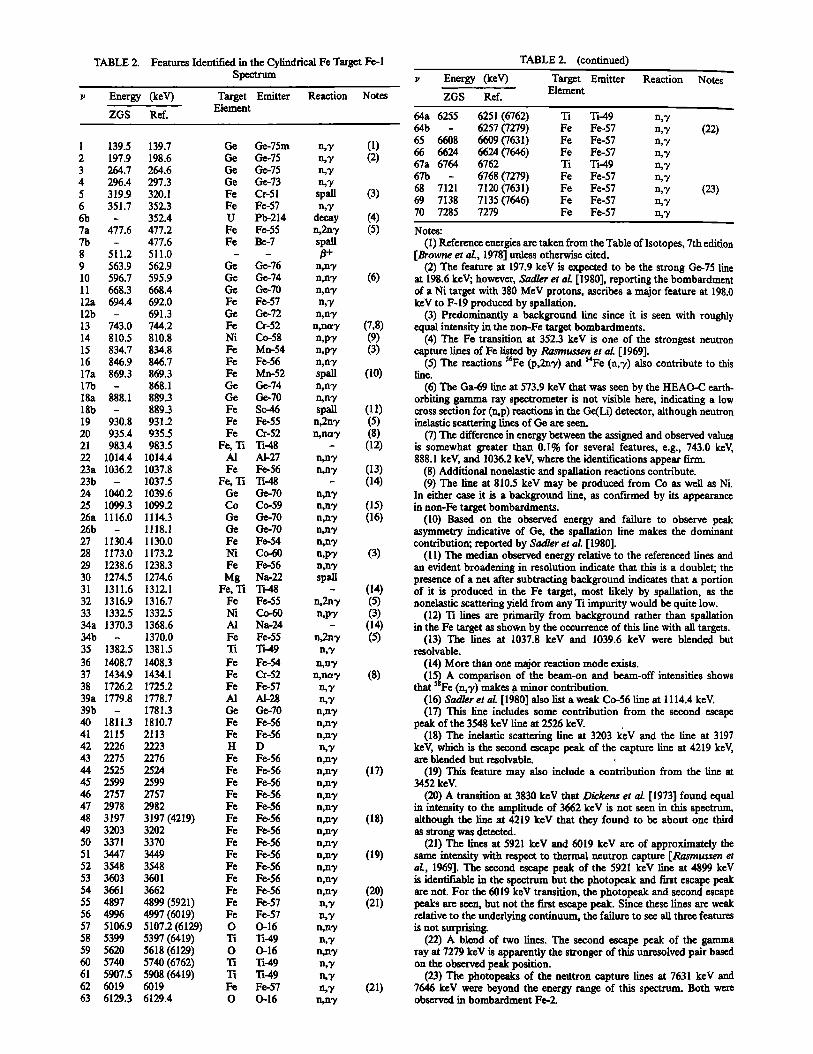
TABLE 2. Features Identified in the Cylindrical Fe Target Fe-1 Spectrum
Energy (keV) Target Emitter Reaction Element
ZGS Ref.
1 2
3 4
5
6 6b 7a 7b
8 9 10
II 12a
12b 13
14 15 16 17a
17b 18a 18b 19
2O 21 22
139.5 139.7 197.9 198.6 264.7 264.6 296.4 297.3 319.9 320.1 351.7 352.3
- 352.4
477.6 477.2 - 477.6
511.2 511.0 563.9 562.9 596.7 595.9 668.3 668.4 694.4 692.0
- 691.3 743.0 744.2 810.5 810.8 834.7 834.8 846.9 846.7 869.3 869.3
- 868.1 888.! 889.3
- 889.3 930.8 931.2 935.4 935.5 983.4 983.5
1014.4 1014.4 23a 1036.2 1037.8 23b - 1037.5 24 1040.2 1039.6 25 1099.3 1099.2 26a 1116.0 1114.3 26b - 1118.1 27 1130.4 1130.0 28 1173.0 1173.2 29 1238.6 1238.3 30 1274.5 1274.6 31 1311.6 1312.1 32 1316.9 1316.7 33 1332.5 1332.5 34a 1370.3 1368.6 34b - 1370.0 35 1382.5 1381.5
36 1408.7 1408.3 37 1434.9 1434.1 38 1726.2 1725.2 39a 1779.8 1778.7 39b - 1781.3 40 1811.3 1810.7 41 2115 2113 42 2226 2223 43 2275 2276 44 2525 2524 45 2599 2599 46 2757 2757 47 2978 2982
48 3197 3197 (4219) 49 3203 3202 50 3371 3370 51 3447 3449 52 3548 3548 53 3603 3601 54 3661 3662
55 4897 4899 (5921) 56 4996 4997 (60!9) 57 5106.9 5107.2 (6129) 58 5399 5397 (6419) 59 5620 5618 (6129) 60 5740 5740 (6762) 61 5907.5 5908 (64!9) 62 6019 6019 63 6!29.3 6129.4
Ge Ge-75m n,• Ge Ge-75 n,? Ge Ge-75 n,? Ge Ge-73 n,? Fe Cr-51 spall Fe Fe-57 n,? U Pb-214 decay Fe Fe-55 n,2n? Fe Be-7 spall
_ _ Ge Ge-76 n,n•, Ge Ge-74 n,n'i Ge Ge-70 n,n'i Fe Fe-57 Ge Ge-72 n,n'• Fe Cr-52 n, na? Ni Co-58 n,p•/ Fe Mn-54 n,p-• Fe Fe-56 n,n•/ Fe Mn-52 spall Ge Ge-74 n,n? Ge Ge-70 n,n-i Fe Se-46 spall Fe Fe-55 n,2n'i Fe Cr-52 n,na?
Fe, Ti Ti-48 - A1 A1-27 n,n-i Fe Fe-56 n,n'i
Fe, Ti Ti-48 - Ge Ge-70 n,n'i Co Co-59 n,n'i Ge Ge-70 n,n-i Ge Ge-70 n,n'i Fe Fe-54 n,n7 Ni Co-60 n,p? Fe Fe-56 n,n? Mg Na-22 spall
Fe, Ti Ti-48 - Fe Fe-55 n,2n? Ni Co-60 A1 Na-24 -
Fe Fe-55 n,2n'i Ti Ti-49 n,? Fe Fe-54 n,n? Fe Cr-52 n,na-i Fe Fe-57 n,? A1 A1-28 n,? Ge Ge-70 n,n'i Fe Fe-56 Fe Fe-56 n,n? H D n,'y Fe Fe-56 n,n-• Fe Fe-56 n,n'i Fe Fe-56 n,n-• Fe Fe-56 n,n? Fe Fe-56 n,n? Fe Fe-56 n,n3, Fe Fe-56 n,n'y Fe Fe-56 n,n-• Fe Fe-56 n,n? Fe Fe-56 n,n• Fe Fe-56 n,n? Fe Fe-56 n,n'i Fe Fe-57 n,•/ Fe Fe-57 n,•/ O O-16 n,n7 Ti Ti-49 n,7 O O-16 n,n•/ Ti Ti-49 n,•/ Ti Ti-49 Fe Fe-57 n,• O O-16 n,n7
Notes
(•) (9.)
(3)
(4) (5)
(6)
(7,8) (9) (3)
(•o)
(11) (5) (8) (12)
(13) (14)
(•)
(3)
(14) (5) (3) (14) (5)
(8)
(17)
(•8)
(19)
(2O) (21)
(21)
TABLE 2. (continued)
Energy (keV) Target Emitter Reaction Notes Element
ZGS Ref.
64a 6255 6251 (6762) Ti Ti-49 n,•, 64b - 6257 (7279) Fe Fe-57 n,'i (22) 65 6608 6609 (7631) Fe Fe-57 n,? 66 6624 6624 (7646) Fe Fe-57 n,•, 67a 6764 6762 Ti Ti-49 n,'y 67b - 6768 (7279) Fe Fe-57 n,'y 68 7121 7120 (7631) Fe Fe-57 n,'y (23) 69 7138 7135 (7646) Fe Fe-57 n,'y 70 7285 7279 Fe Fe-57 n,?
Notes:
(I) Reference energies are taken from the Table of Isotopes, 7th edition [Browne et al., 1978] unless otherwise cited.
(2) The feature at 197.9 keV is expected to be the strong Ge-75 line at 198.6 keV; however, Sadler et al. [1980], reporting the bombardment of a Ni target with 380 MeV protons, ascribes a major feature at 198.0 keV to F-19 produced by spallation.
(3) Predominantly a background line since it is seen with roughly equal intensity in the non-Fe target bombardments.
(4) The Fe transition at 352.3 keV is one of the strongest neutron capture lines of Fe listed by Rasmussen et al. [1969].
(5) The reactions •6Fe (p,2n'y) and •4Fe (n,-y) also contribute to this line.
(6) The Ga-69 line at 573.9 keV that was seen by the HEAO-C earth- orbiting gamma ray spectrometer is not visible here, indicating a low cross section for (n,p) reactions in the Ge(Li) detector, although neutron inelastic scattering lines of Ge are seen.
(7) The difference in energy between the assigned and observed values is somewhat greater than 0.!% for several features, e.g., 743.0 keV, 888.1 keV, and 1036.2 keV, where the identifications appear firm.
(8) Additional nonelastic and spallation reactions contribute. (9) The line at 810.5 keV may be produced from Co as well as Ni.
In either case it is a background line, as confirmed by its appearance in non-Fe target bombardments.
(10) Based on the observed energy and failure to observe peak asymmetry indicative of Ge, the spal!ation line makes the dominant contribution; reported by Sadlet et al. [1980].
(1 !) The median observed energy relative to the referenced lines and an evident broadening in resolution indicate that this is a doublet; the presence of a net after subtracting background indicates that a portion of it is produced in the Fe target, most likely by spallation, as the nonelastic scattering yield from any Ti impurity would be quite low.
(12) Ti lines are primarily from background rather than spallation in the Fe target as shown by the occurrence of this line with all targets.
(13) The lines at 1037.8 keV and 1039.6 keV were blended but resolvable.
(14) More than one major reaction mode exists. (15) A comparison of the beam-on and beam-off intensities shows
that 5gFe (n,•/) makes a minor contribution. (16) Sadler et al. [1980] also list a weak Co-56 line at 1114.4 keV. (17) This line includes some contribution from the second escape
peak of the 3548 keV line at 2526 keV. (18) The inelastic scattering line at 3203 keV and the line at 3197
keV, which is the second escape peak of the capture line at 4219 keV, are blended but resolvable. ,
(19) This feature may also include a contribution from the line at 3452 keV.
(20) A transition at 3830 keV that Dickens et al. [1973] found equal in intensity to the amplitude of 3662 keV is not seen in this spectrum, although the line at 4219 keV that they found to be about one third as strong was detected.
(21) The lines at 5921 keV and 6019 keV are of approximately the same intensity with respect to thermal neutron capture [Rasmussen et al., 1969]. The second escape peak of the 5921 keV line at 4899 keV is identifiable in the spectrum but the photopeak and fu-st escape peak are not. For the 6019 keV transition, the photopeak and second escape peaks are seen, but not the first escape peak. Since these lines are weak relative to the underlying continuum, the failure to see all three features is not surprising.
(22) A blend of two lines. The second escape peak of the gamma ray at 7279 keV is apparently the stronger of this unresolved pair based on the observed peak position.
(23) The photopeaks of the netitron capture lines at 7631 keV and 7646 keV were beyond the energy range of this spectrum. Both were observed in bombardment Fe-2.
METZGER ET AL.: SIMULATED PLANETARY GAMMA RAY EMISSION D499
TABLE 3. Relative Strengths of Fe Lines Observed Experimentally and Their Comparison with Calculations by Reedy [1978]
Energy Net Response Detector Relative Responses (keV) (e/p) Efficiency 'ZGS Cale ZGS/Calc 352.3 negative .... 744:2 4.5 ñ 1.4 x 10 -7 0.068 0.018 -- -- 834.8 1.99 ñ 0.28 x 10 -6 0.058 0.095 0.078 1.2 846.7 2.04 ñ 0.28 x 10 -5 0.056 I I (1) 931.2 1.03 ñ 0.14 x 10 -6 0.052 0.055 0.075 0.7 935.5 5.72 ñ 1.11 x 10 -7 0.052 0.030 -- --
1037.8 4.30 ñ 1.03 x 10 -7 0.045 0.026 0.036 0.7 1130.0 2.55 ñ 0.92 x 10 '7 0.041 0.017 -- -- 1238.3 2.66 ñ 0.16 X 10 -6 0.036 0.20 0.22 0.9 1312.1 5.38 ñ 0.81 x I0 -7 0.034 0.044 -- -- 1316.7 3.62 ñ 0.64 X 10 -7 0.034 0.029 0.079 0.4 1370.0 2.01 ñ 0.83 x 10 -7 0.032 0.017 -- -- 1407.7 9.42 ñ 0.85 X 10 -7 0.031 0.082 0.053 1.5 1434.8 7.87 ñ !.03 • 10 '7 0.031 0.70 0.044 !.6 1725.2 1.79 ñ 0.77 • 10 -7 0.026 0.019 0.070 0.3 1810.7 6.10 ñ 1.20 • 10 -7 0.025 0.068 0.107 0.6 2113 3.73 ñ 0.63 x 10 -7 0.0196 0.052 0.068 0.8 2276 2.10 ñ 0.61 x 10 -7 0.0183 0.032 -- -- 2524 2.74 ñ 0.73 x 10 -7 0.0159 0.047 0.046 1.0 2599 1.04 ñ 0.63 x 10 -7 0.0149 0.019 0.053 0.4 2982 6.4 ñ 3.6 x I0 -a 0.0132 0.013 -- • 3197' 1.52 ñ 0.52 X 10 -7 0.0137 0.031 0.063 0.5 3202 1.56 ñ 0.47 • 10 -7 0.0124 0.035 • -- 3448 1.96 ñ 0.54 x 10 -7 0.0109 0.049 -- -- 3548 1.16 ñ 0.52 • 10 -7 0.0105 0.030 -- -- 3603 1.48 ñ 0.50 x 10 -7 0.0104 0.039 0.035 1.1 4899* 6.7 ñ 4.2 x 10 -8 0.0144 0.013 0.153 0.08 4997 6.6 ñ 4.2 x 10 -8 0.0058 0.031 -- -- 6019 4.9 ñ 3.8 x 10 -8 0.0037 0.037 0.!55 0.2 6608* 1.81 ñ 0.41 x 10 -7 0.0109 0.046 0.52 0.09 6624* 1.74 ñ 0.41 x 10 -7 0.0109 0.044 0.48 0.09 7279t 5.2 ñ 3.2 x 10 -8 0.0024 0.060 0.11 0.6 7631• 1.68 ñ 0.31 x 10 '7 0.0021 0.22 0.52 0.4 76465 1.27 ñ 0.27 x 10 -7 0.0021 0.17 0.48 0.3
The results are from the Fe-1 bombardment unless otherwise noted.
*Second escape peak line. tFrom the Fe-1 and Fe-2 bombardments combined. $From the Fe-2 bombardment.
unidentifiable. Reedy [1978] has tabulated emission fluxes for 13 Fe lines due to energetic neutron reactions and 11 Fe lines due to neutron capture. Here we have seen all 13 of the energetic reaction lines and 7 of the neutron capture reaction lines. The neutron capture line at 9299 keV is above the measurement range. Peak intensities range from the limit identifiable at 2a significance, about 0.02 c/s, to more than 9 c/s for the line at 846.7 keV.
Fifteen of the observed lines were produced in the Ge detector. Six are characterized by a peak shape that is asymmetrically broadened to the high energy side, viz., the lines at 563 keV, 596 keV, 692 keV, 889 keV, 1040 keV, and 1114 keV (Figure 2 and Table 2). Broadening has tended to raise the value assigned to the peak energy. All of these reactions are the result of neutron inelastic scattering followed by prompt decay of the excited nucleus. Line broadening takes place due to the contribution of recoil energy from the excited nucleus, a process that occurs simultaneously with gamma ray emission [Bunting and Kraushaar, 1974; Bri•ckner et al., 1984].
The 34 distinguishable Fe lines found in the Fe-1 spectrum are listed in Table 3. The neutron capture line at 352 keV is not included as it is dominated by background. Neither are the lines at 2757 keV, 3370 keV, and 3662 keV, whose intensities are marginal. The continuum-subtracted net response rate per proton is corrected for instrument dead time. This correction,
designated the effective proton beam live-time fraction, PLTF, is defined as
LT PLTF = = 0.82I (1)
[4/tclCT
where LT is the live time, 4 is the time per spill (0.7s), tc is the beam duty cycle time (2.5s), and CT is clock time. Background rates for these lines have been obtained by time- weighted averaging the continuum-subtracted Fe peak rates seen in the bombardments of the Al, Mg, and SiO: targets, a procedure that approximates Fe target mass conditions in the vicinity of the beam. Where none was seen, a zero value was used. In only one case, that of the 835 keV line, is the background contribution more than 25% of the peak response. Net background-subtracted peak rates per proton are given in the second column of Table 3. Absolute detector effeciencies were
calculated from the measured absolute efficiency at 1333 keV by normalizing from reported values for two comparably sized detectors [Hajnal and Klusek, 1974; Waibel and Grosswendt, 1975].
Finally, Table 3 also provides a comparison of the relative fluxes observed in this irradiation bombardment, among themselves and with the fluxes calculated by Reedy [1978]. The strong inelastic scattering line at 847 keV is used as the reference value. The 13 lines resulting from energetic reactions show a measured-to-calculated relative ratio range of 0.4-!.6, with seven of the lines agreeing within 30%. This includes the line at 835 keV, despite the fact that more than 75% of the observed flux is due to background. Agreement for the neutron capture reactions is much poorer, the observed proportions being lower than the calculated values by more than an order of magnitude in several cases. Note, however, that the relative proportions of the strong neutron capture pair at 7631 keV and 7646 keV are as expected.
In Table 4 we present a table of selected peak rates from bombardment Fe-2 for comparison with those from Fe-1. The observed ratios are quite consistent, ranging from 1.2-1.8 for 8 of the 10 lines compared. The ratio for the 1317 keV line is high because this line cannot be resolved from the line at 1312.1 keV in Fe-2; the latter actually makes the greater contribution. Background dominates the 835 keV line in Fe- 2 as for Fe-!, leading to a large uncertainty in the ratio for this line.
DISCUSSION
Although the interactions leading to characteristic gamma ray line spectra are the same for the ZGS bombardments as at a planetary surface, the scale of occurrence and operating conditions are very different. The ZGS provided a proton beam, monoenergetic, confined, intense, pulsed and not inherently stable, a beam incident on a target of limited size, with a detector- target separation distance measured in centimeters. In space, a far larger planetary object is uniformly irradiated by an isot• opic cosmic ray flux that has a spectral distribution to much higher energies, is orders of magnitude lower in intensity, and is relatively invariant, while the distance from the planetary object to the detector will be on the order of a hundred kilometers unless the instrument is crop!aced on or beneath the surface. Despite these contrasts, it is possible to calculate gamma ray line fluxes for the equivalent geometry of a planetary surface from these accelerator bombardment responses, thereby allowing
D500 METZGER ET AL.: SIMULATED PLANETARY GAMMA RAY EMISSION
TABLE 4. Net Line Response of Bombardment Fe-2 and Comparison with Bombardment Fe-I
E (keV) Peak Rates (c/s) Net Response (c/p) Fe-2/Fe-I
692.0 5.18 + 0.48 1.52 + 0.15 x 10 -5 1.23 834.8 2.268 ñ 0.070 9.1 + 2.9 x 10 -? 0.46 846.7 10.268 + 0.147 3.170 ñ 0.049 x 10 -5 1.55
1238.3 1.082 ñ 0.044 3.22 ñ 0.15 x 10 -6 1.21 1316.7 0.293 + 0.035 9.34 + 1.12 x I0 -7 2.6 1408.3 0.479 ñ 0.036 1.50 ñ 0.12 x 10 -• 1.60 1434.1 0.400 + 0.034 1.084 ñ 0.117 x 10 -7 1.38 1810.7 0.453 ñ 0.030 1.076 + 0.124 x 10 -7 1.76 2113 0.213 +0.053 5.7! +0.17 x !0 -7 1.53 6616 0.171 + 0.015 4.16 + 0.58 x 10 -7 1.17
A comparison of selected net line intensity ratios from the two Fe targets. Fe-2 intensities are given both per unit time and per proton. The feature at 6616 keV is the combined peak due to the second escape peaks at 6606 keV and 6624 keV, which are not resolved in Fe-2.
comparison with Reedy's values. Some of the contrasts disappear in the analysis; the others can be normalized by applying appropriate scaling factors.
Since the signals corresponding to line emission are based on net peak rates, differences between the planetary and accelerator background fluxes will only affect the accompanying uncertainties. Note that since cascade shower interactions
dominate both in space and at the accelerator, the shape of the continuum is similar for the two cases. This is shown in
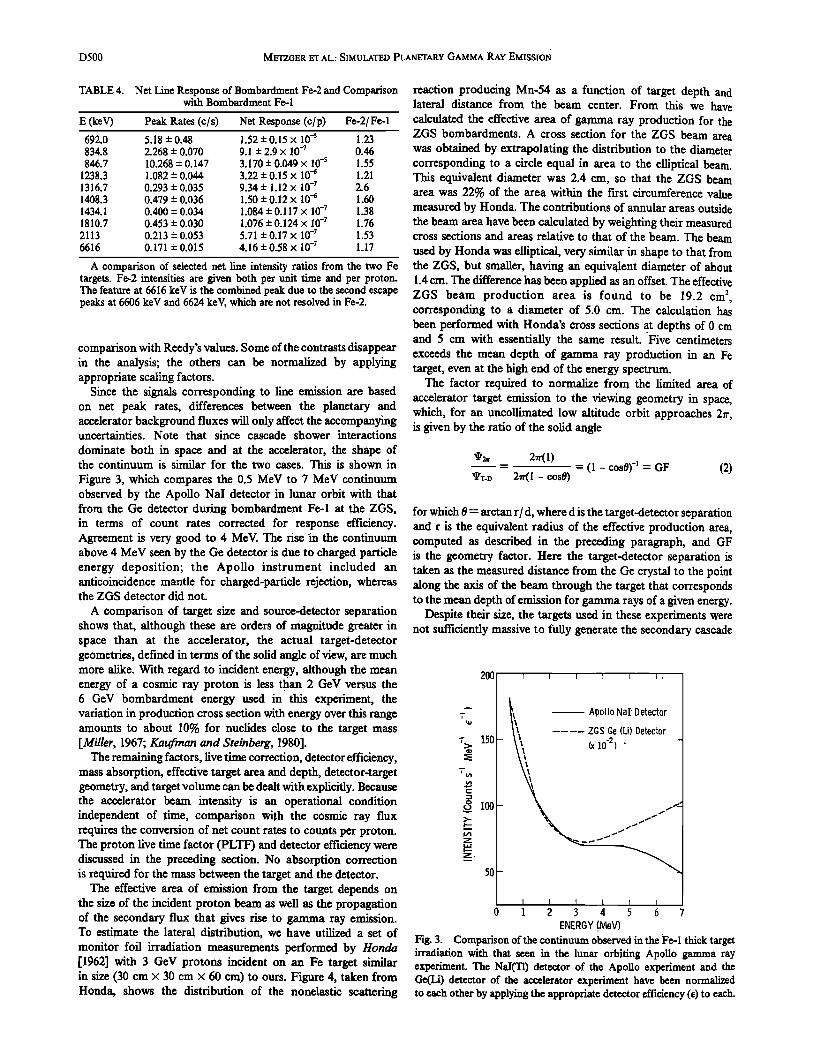
Figure 3, which compares the 0.5 MeV to 7 MeV continuum observed by the Apollo NaI detector in lunar orbit with that from the Ge detector during bombardment Fe-1 at the ZGS, in terms of count rates corrected for response efficiency. Agreement is very good to 4 MeV. The rise 'in the continuum above 4 MeV seen by the Ge detector is due to charged particle energy deposition; the Apollo instrument included an anticoincidence mantle for charged-particle rejection, whereas the ZGS detector did not.
A comparison of target size and source-detector separation shows that, although these are orders of magnitude greater in space than at the accelerator, the actual target-detector geometries, defined in terms of the solid angle of view, are much more alike. With regard to incident energy, although the mean energy of a cosmic ray proton is less than 2 GeV versus the 6 GeV bombardment energy used in this experiment, the variation in production cross section with energy over this range amounts to about 10% for nuclides close to the target mass [Miller, 1967; Kaufman and Steinberg, 1980].
The remaining factors, live time correction, detector efficiency, mass absorption, effective target area and depth, detector-target geometry, and target volume can be dealt with explicitly. Because the accelerator beam intensity is an operational condition independent of time, comparison with the cosmic ray flux requires the conversion of net count rates to counts per proton. The proton live time factor (PLTF) and detector efficiency were discussed in the preceding section. No absorption correction is required for the mass between the target and the detector.
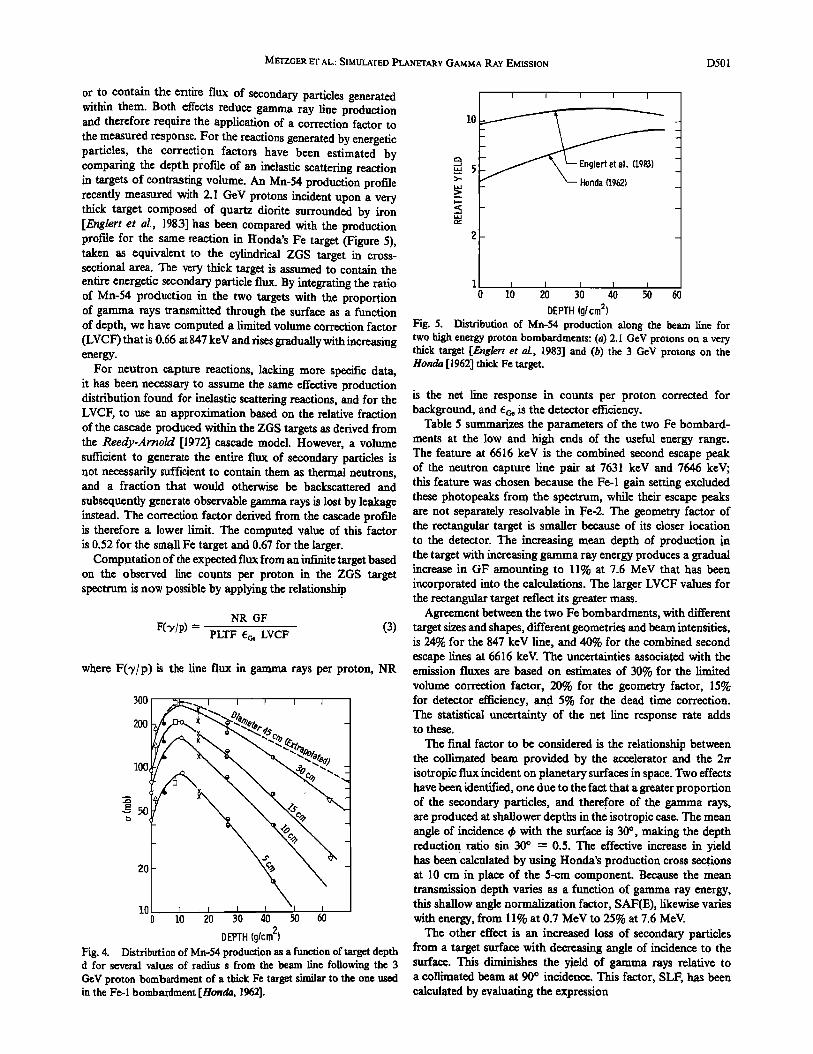
The effective area of emission from' the target depends on the size of the incident proton beam as well as the propagation of the secondary flux that gives rise to gamma ray emission. To estimate the lateral distribution, we have utilized a set of monitor foil irradiation measurements performed by Honda [!962] with 3 GeV protons incident on an Fe target similar in size (30 cm x 30 cmx 60 era) to ours. Figure 4, taken from Honda, shows the distribution of the nonelastic scattering
reaction producing Mn-54 as a function of target depth and lateral distance from the beam center. From this we have calculated the effective area of gamma ray production for the ZGS bombardments. A cross section for the ZGS beam area was obtained by extrapolating the distribution to the diameter corresponding to a circle equal in area to the elliptical beam. This equivalent diameter was 2.4 cm, so that the ZGS beam area was 22% of the area within the first circumference value measured by Honda. The contributions of annular areas outside the beam area have been calculated by weighting their measured cross sections and areas relative to that of the beam. The beam used by Honda was elliptical, very similar in shape to that from the ZGS, but smaller, having an equivalent diameter of about 1.4 cm. The difference has been applied as an offset. The effective ZGS beam production area is found to be i9.2 cm 2, corresponding to a diameter of 5.0 cm. The calculation has been performed with Honda's cross sections at depths of 0 cm and 5 cm with essentially the same result. 'Five centimeters exceeds the mean depth of gamma ray production in an Fe target, even at the high end of the energy spectrum.
The factor required to normalize from the limited area of accelerator target emission to the viewing geometry in space, which, for an uncollimated low altitude orbit .approaches 2rr, is given by the ratio of the solid angle
xlr2• 2n-(l) • = = (1 - cos0) -1= GF (2) ß ,-D 2•1 - cos0)
for which 0 --- arctan r/d, where d is the target-detector separation and r is the equivalent radius of the effective production area, computed as described in the preceding paragraph, and GF is the geometry factor. Here the target-detector separation is taken as the measured distance from the Ge crystal to the point along the axis of the beam through the target that corresponds to the mean depth of emission for gamma rays of a given energy.
Despite their size, the targets used in these experiments were not sufficiently massive to fully generate the secondary cascade
200
150
• lOO
z
z.
50
\ Apollo NaI • Detector It _
0 1 2 3 4 5 6 7 ENERGY (MeV)
Fig. 3. Comparison of the continuum observed in the Fe-1 thick target irradiation with that seen in the lunar orbiting Apollo gamma ray experiment. The NaI(T1) detector of the Apollo experiment and the Ge(Li) detector of the accelerator experiment have been normalized to each other by applying the appropriate detector efficiency (e) to each.
METZGER ET AL.: SIMULATED PLANETARY GAMMA RAY EMISSION D501
or to contain the entire flux of secondary particles generated within them. Both effects reduce gamma ray line production and therefore require the application of a correction factor to the measured response. For the reactions generated by energetic particles, the correction factors have been estimated by comparing the depth pxtoffie of an inelastic scattering reaction in targets of contrasting volume. An Mn-54 production profile recently measured with 2.1 GeV protons incident upon a very thick target composed of quartz diorite surrounded by iron [Englert et al., 1983] has been compared with the production profile for the same reaction in Honda's Fe target (Figure 5), taken as equivalent to the cylindrical ZGS target in cross- sectional area. The very thick target is assumed to contain the entire energetic secondary particle flux. By integrating the ratio of Mn-54 production in the two targets with the proportion of gamma rays transmitted through the surface as a function of depth, we have computed a limited volume correction factor (LVCF) that is 0.66 at 847 keV and rises gradually with increasing energy.
For neutron capture reactions, lacking more specific data, it has been necessary to assume the same effective production distribution found for inelastic scattering reactions, and for the LVCF, to use an approximation based on the relative fraction of the caseMe produced within the ZGS targets as derived from the Reedy-Arnold [1972] cascade model. However, a volume sufficient to generate the entire flux of secondary particles is not necessarily sufficient to contain them as thermal neutrons, and a fraction that would otherwise be backscattered and
subsequently generate observable gamma rays is lost by leakage instead. The correction factor derived from the cascade profile is therefore a lower limit. The computed value of this factor is 0.52 for the small Fe target and 0.67 for the larger.
Computation of the expected flux from an infinite target based on the observed line counts per proton in the ZGS target spectrum is now possible by applying the relationship
NR GF F('V/p) = (3)
PLTF 6c• LVCF
where F(?/p) is the line flux in gamma rays per proton, NR
3001 .•t•--- •. I • I I • I
50
20
10 0 10 20 30 '40 50 60
DEPTH (g/cm 2) •8. 4. Distdb•tio• of •-54 pmducQo• • • fu•ctiom of t•Sct dc•tb d fo• several •es of radius s from tbc beam 11•e •ollow•8 t•e 3 GcV •oto: 6ombar•mc•t of a t•ck •c t•Sct siregat to tbc o•c •cd
10
Honda {1962)
0 10 20 30 40 50 60
DEPTH (g/cm 2) Fig. 5. Distribution of Mn-54 production along the beam line for two high energy proton bombardments: (a) 2.1 GeV protons on a very thick target [Eng!ert et al., 1983] and (b) the 3 GeV protons on the Honda [I962] thick Fe target.
is the net line response in counts per proton corrected for background, and ec• is the detector efficiency.
Table 5 summarizes the parameters of the two Fe bombard- ments at the low and high ends of the useful energy range. The feature at 66!6 keV is the combined second escape peak of the neutron capture line pair at 7631 keV and 7646 keV; this feature was chosen because the Fe-! gain setting excluded these photopeaks from the spectrum, while their escape peaks are not separately resolvable in Fe-2. The geometry factor of the rectangular target is smaller because of its closer location to the detector. The increasing mean depth of production i.n the target with increasing gamma ray energy produces a gradual increase in GF amounting to 11% at 7.6 MeV that has been incorporated into the calculations. The larger LVCF values for the rectangular target reflect its greater mass.
Agreement between the two Fe bombardments, with different target sizes and shapes, different geometries and beam intensities, is 24% for the 847 keV line, and 40% for the combined second escape lines at 6616 keV. The uncertainties associated with the emission fluxes are based on estimates of 30% for the limited volume correction factor, 20% for the geometry factor, 15% for detector efficiency, and 5% for the dead time correction. The statistical uncertainty of the net line response rate adds to these.
The final factor to be considered is the relationship between the collimated beam provided by the accelerator and the 2rr isotropic flux incident on planetary surfaces in space. Two effects have been identified, one due to the fact that a greater proportion of the secondary particles, and therefore of the gamma rays, are produced at shallower depths in the isotropic ease. The mean angle of incidence (• with the surface is 30 ø, making the depth reduction ratio sin 30 ø = 0.5. The effective increase in yield has been calculated by using Honda's production cross sections at 10 cm in place of the 5-em component. Because the mean transmission depth varies as a function of gamma ray energy, this shallow angle normalization factor, SAF(E), likewise varies with energy, from 11% at 0.7 MeV to 25% at 7.6 MeV.
The other effect is an increased loss of secondary particles from a target surface with decreasing angle of incidence to the surface. This diminishes the yield of gamma rays relative to a collimated beam at 90 ø incidence. This factor, SLF, has been caleu!ated by evaluating the expression
D502 METZGER ET AL.: SIMULATED PLANETARY GAMMA RAY EMISSION
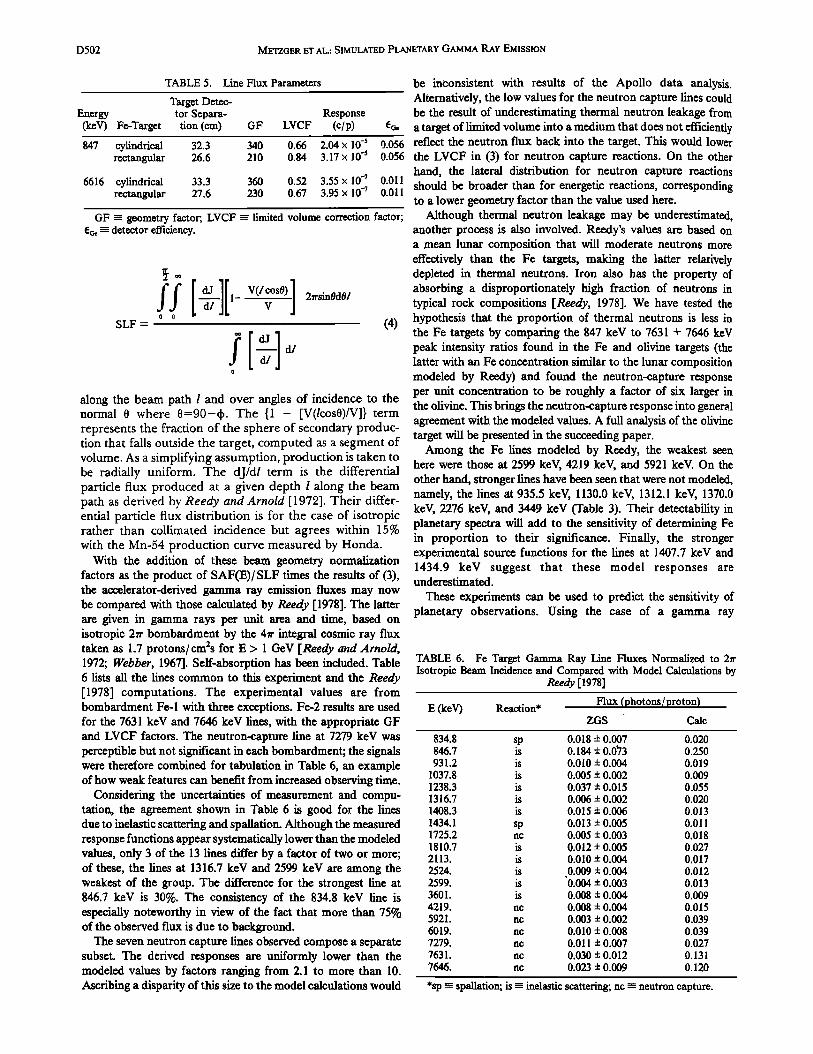
TABLE 5. Line Flux Parameters
Target Detec- Energy tor Separa- Response (keV) Fe-Target tion (era) GF LVCF (c/p)
847 cylindrical 32.3 340 0.66 2.04 x 10 -5 rectangular 26.6 210 0.84 3.17 x 10 -5
6616 cylindrical 33.3 360 0.52 3.55 x 10 -7 rectangular 27.6 230 0.67 3.95 X 10 -7
GF ----- geometry factor; LVCF ---- limited volume correction factor; t54 m detector efficiency.
SLF = /f [ d_•_.}_][!_ V(/cos0)] 2,rsin0d0! V 0 0
be inconsistent with results of the Apollo data analysis. Alternatively, the low values for the neutron capture lines could be the result of underestimating thermal neutron leakage from
e• a target of limited volume into a medium that does not efficiently 0.056 reflect the neutron flux back into the target. This would lower 0.056 the LVCF in (3) for neutron capture reactions. On the other
hand, the lateral distribution for neutron capture reactions 0.011 should be broader than for energetic reactions, corresponding 0.011
to a lower geometry factor than the value used here. Although thermal neutron leakage may be underestimated,
another process is also involved. Reedy's values are based on a mean lunar composition that will moderate neutrons more effectively than the Fe targets, making the latter relatively depleted in thermal neutrons. Iron also has the property of absorbing a disproportionately high fraction of neutrons in typical rock compositions [Reedy, 1978]. We have tested the
(4) hypothesis that the proportion of thermal neutrons is less in the Fe targets by comparing the 847 keV to 7631 + 7646 keV peak intensity ratios found in the Fe and olivine targets (the latter with an Fe concentration similar to the lunar composition modeled by Reedy) and found the neutron-capture response per unit concentration to be roughly a factor of six larger in the olivine. This brings the neutron-capture response into general agreement with the modeled values. A full analysis of the olivine target will be presented in the succeeding paper.
Among the Fe lines modeled by Reedy, the weakest seen here were those at 2599 keV, 4219 keV, and 5921 keV. On the other hand, stronger lines have been seen that were not modeled, namely, the lines at 935.5 keV, 1130.0 keV, 1312.! keV, !370.0 keV, 2276 keV, and 3449 keV (Table 3). Their detectability in planetary spectra will add to the sensitivity of determining Fe in proportion to their significance. Finally, the stronger experimental source functions for the lines at !407.7 keV and 1434.9 keV suggest that these model responses are underestimated.
These experiments can be used to predict the sensitivity of planetary observations. Using the case of a gamma ray
along the beam path l and over angles of incidence to the normal 0 where 0=90-q). The {! - [V(/cos0)/V]} term represents the fraction of the sphere of secondary produc- tion that falls outside the target, computed as a segment of volume. As a simplifying assumption, production is taken to be radially uniform. The dJ/d/ term is the differential particle flux produced at a given depth I along the beam path as derived by Reedy and Arnold [1972]. Their differ- ential particle flux distribution is for the case of isotropic rather than collimated incidence but agrees within 15% with the Mn-54 production curve measured by Honda.
With the addition of these beam geometry normalization factors as the product of SAF(E)/SLF times the results of (3), the accelerator-derived gamma ray emission fluxes may now be compared with those calculated by Reedy [1978]. The latter are given in gamma rays per unit area and time, based on isotropic 2rr bombardment by the 4rr integral cosmic ray flux taken as 1.7 protons/cm2s for E > 1 GeV [Reedy and Arnold, 1972; Webber, 1967]. Self-absorption has been included. Table 6 lists all the lines common to this experiment and the Reedy [1978] computations. The experimental values are from bombardment Fe-1 with three exceptions. Fe-2 results are used for the 7631 keV and 7646 keV lines, with the appropriate GF and LVCF factors. The neutron-capture line at 7279 keV was perceptible but not significant in each bombardment; the signals were therefore combined for tabulation in Table 6, an example of how weak features can benefit from increased observing time.
Considering the uncertainties of measurement and compu- tation, the agreement shown in Table 6 is good for the lines due to inelastic scattering and spallation. Although the measured response functions appear systematically lower than the modeled values, only 3 of the 13 lines differ by a factor of two or more; of these, the lines at 1316.7 keV and 2599 keV are among the weakest of the group. The difference for the strongest line at 846.7 keV is 30%. The consistency of the 834.8 keV line is especially noteworthy in view of the fact that more than 75% of the observed flux is due to background.
The seven neutron capture lines observed compose a separate subset. The derived responses are uniformly lower than the modeled values by factors ranging from 2.1 to more than 10. Ascribing a disparity of this size to the model calculations would
TABLE 6. Fe Target Gamma Ray Line Fluxes Normalized to 2•r Isotropic Beam Incidence and Compared with Model Calculations by
Reedy [1978]
Flux (photons / proton) E (keV) Reaction*
ZGS Calc
834.8 sp 0.018 + 0.007 0.020 846.7 is 0.184 ñ 0.073 0.250 931.2 is 0.010 ñ 0.004 0.019
1037.8 is 0.005 ñ 0.002 0.009 1238.3 is 0.037 ñ 0.015 0.055 1316.7 is 0.006 ñ 0.002 0.020 1408.3 is 0.015 ñ 0.006 0.013
1434.1 sp 0.013 ñ 0.005 0.011 1725.2 nc 0.005 ñ 0.003 0.018 1810.7 is 0.012 ñ 0.005 0.027 2113. is 0.010 ñ 0.004 0.017 2524. is 0.009 ñ 0.004 0.012 2599. is '0.004 ñ 0.003 0.013 3601. is 0.008 ñ 0.004 0.009 4219. nc 0.008 ñ 0.004 0.015 5921. nc 0.003 ñ 0.002 0.039 6019. nc 0.010 ñ 0.008 0.039 7279. nc 0.011 ñ 0.007 0.027 7631. nc 0.030 ñ 0.012 0.131 7646. nc 0.023 ñ 0.009 0.120
*sp ----- spallation; is m inelastic scattering; nc ---- neutron capture.
METZGER ET AL.: SIMULATED PLANETARY GAMMA RAY EMISSION D503
spectrometer in lunar orbit at an altitude of 100 km as an example, we can calculate the time to accumulate, with some specified detector, a signal equivalent to that observed from the Fe target at the ZGS. The expected count rate response R can be expressed as
R(c/s) = s n & e(E) [Z] (5)
in which S is the source function for emission from the target, d is the target-detector separation, CR2,• is the 2•r cosmic ray flux, II is the geometx3, factor for the moon at 100 kin, [Z] is the fractional abundance of Fe, while A• and e(E) are the effective area and photopeak efficiency of the assumed flight detector, one substantially larger than the detector used in this experiment. Basing this calculation on the line at 847 keV for which S = 0.184 'y/p (Table 6), •5(E) is taken as 0.162 with Aa '- 28 cm 2 and [Z] = 0.09, so that R is computed to be 4.36 x 10 -2 c/s. With net 847 keV peak totals of 45050 counts and 94210 counts, the observed time in lunar orbit equivalent in signal strength to the two Fe bombardments is 290 hr for Fe-1 and 600 hr for Fe-2. The more efficient the detector, the shorter the time needed to reach a given signal level.
The previous calculation does not establish the time necessary to achieve a prescribed level of sensitivity in lunar orbit because operating conditions in space will be quite different from those at the accelerator, most notably in the background level. In terms of the lunar environment, the minimum detectable limit (MDL) of element Z corresponding to a given data accumulation time t, can be computed from
t n BAE 1
[Z] naMDL'- O {i (E) ,{'1 Ad t S• CR2,r ' (6)
where the new terms axe n, the significance of observation, G, the Gaussian factor for the detector response [Metzger et al., 1975], B, the background flux, and z•E, the full width half maximum (FWHM) of the photopeak. The expected value of B at 847 keV is based on Apollo gamma ray spectrometer lunar data [BielefeM et al., 1976], to which we have applied the relative efficiency of the Ge detector assumed in (5), plus a small correction to adjust the altitude from 110 km to 100 kin. The result is 1.27 c/cm2s MeV, equivalent to 0.068 c/s. By comparison, the continuum intensity at 847 keV in the accelerator bombardment was 130 c/cm2s MeV, or 3.3 c/s, a factor of 50 greater than that expected 100 km above the moon. The consequence is a major reduction in the uncertainty associated with net line intensifies relative to the values in Table
6 and significant improvement in the sensitivity. Likewise, with regard to other sources of uncertainty, that associated with the geometry will be much less for planetary • measurements than here, while those due to limited target size and dead time will be noexistent. The uncertainties associated with orbital measurements have been discussed in Metzger et al. [1977].
the actual sensitivity since (1) much longer observing times will be available during a nominal orbital experiment, and (2) melding additional Fe lines will improve the sensitivity of measurement in proportion to their relative significance. A calculation for the weakest inelastic scattering line identified in the bombardment spectrum, that at 2982 keV, predicts it will be visible at 2a significance after 40 days of observation. This is consistent with the value obtained for the equivalent lunar time when the mean lunar concentration of 9% is substituted for the 100% Fe target in (5). Therefore all the Fe lines seen in this simulation are expected during a nominal lunar mission.
Based on the Fe-1 spectrum and typical lunar Fe concen- trations, a 100-hr lunar spectrum can be expected to contain approximately 20 features due to Fe. However, only the three or four strongest lines will contribute significantly to the overall sensitivity, adding about 25% to that provided by the dominant 847 keV line alone. At the mean lunar Fe abundance of 9%, the Fe line complement will provide a 100-hr 2a precision of better than 2% and a minimum detectable limit of 0.16%.
In conclusion, this study has demonstrated the value of accelerator bombardments in simulating planetary gamma ray spectroscopic observations by revealing the characteristic line spectra to be expected and the ability to derive absolute source functions in conjunction with predictive modeling calculations. A wealth of characteristic lines have been observed from the
high energy proton bombardment of Fe that can be expected to be observable from planetary bodies given sufficient measuring time. An important result is that the basic validity of the current predictive model has been affirmed. The experiments have suggested where further modeling for the expected response from Fe may be expanded and refined. With a knowledge of the relative emission flux, their incorporation into the analysis will serve to increase the sensitivity of detection.
Acknowledgments. We would like to express our sincere appreci- ation to the following individuals for their participation and assistance in various phases of the work. At the Argonne National Laboratory, Reed Moffett and Russ Klein provided access to and proper operation of the ZGS, while John Rundo placed his low-level counting facility at our disposal for post-irradiation measurements. Larry Varnell and Marshall Fong played major roles in preparing for the experiment and also participated in the sequences of operations, together with Charles Lucas and Larry Finnin. Varnell also contributed to the preliminary data reduction. Richard E. Parker and Robert Radocinski provided computer and computational support for the data analysis. David Deats performed the densitometer scans of the beam exposures. Finally, the analysis and the manuscript have benefited from many useful comments by Robert Reedy, James Arnold, Eldon Haines, James Willett, and an anonymous referee. The research described in this paper was carried out by the Jet Propulsion Laboratory, California Institute of Technology, under contract with the National Aeronautics and Space Administration.
REFERENCES
Armstrong, T. W., Calculation of the lunar photon albedo from galactic and solar proton bombardment, J. Geophys. Res., 77, 524-536, 1972.
Together with counting statistics, which will be time dependent, •Browne, E., J. M. Dairiki, and R. E. Doebier, Table of Isotopes, 7th the major uncertainty for planetary observations will be in the Edition, edited by C. M. Lederer and V. S. Shirley, 1523 pp., Wiley factors of gamma ray yield per unit concentration.
Substituting in (6) the values of n = 2, G = 0.84, and fie = 1.91 keV, as well as the values already given appropriate to the 847 keV Fe line including S = 0.184 •//p from bombardment Fe-1, we obtain for a one-hour observation at 20 significance a minumum detectable limit (MDL) of 2.1%, about one-fourth the mean lunar concentration. This understates
and Sons, New York, 1978. Bielefeld, M. J., R. C. Reedy, A. E. Metzger, J. I. Trombka, and J.
R. Arnold, Surface chemistry of selected lunar regions, Proc. Lunar Sci. Conf. 7th, 2661-2676, 1976.
B•ckner, J., R. C. Reedy, and H. Wgnke, Neutron-induced gamma rays from thin targets: Simulations for planetary spectroscopy (abstract), in Lunar and Planetary Science XV,, pp. 98-99, Lunar and Planetary Institute, Houston, 1984.
Bunting, R. L., and J. J. Kraushaar, Short-lived radioactivity induced
D504 METZGER ET AL.: SIMULATED PLANETARY GAMMA RAY EMISSION
in Ge(Li) gamma ray detectors by neutrons, Nucl. Instrum. Methods, 118, 565-572, 1974.
Charakhchyan, A. N., and T N. Charakhchyan, On the energy spectrum of cosmic rays in interstellar space, Proc. 11th Intl. Conf. on Cosmic Rays, OG-64, 305-308, 1969.
Dickens, J. K., G. L. Morgan, and F. G. Percy, Neutron-induced gamma ray production in iron for the energy range 0.8 _< En <- 20 MeV, Nucl. $ci. Eng., 50, 311-336, 1973.
Englert, P., R. C. Reedy, R. Fox, and J. R. Arnold, Thick target irradiations as simulation of cosmic ray bombardments, Meteoritics, 18, 294-295, 1983.
Gorenstein, P., and H. Gursky, Characteristic 3'- and X-radiation in the planetary system. Space Sci. Rev., I0, 770-829, 1970.
Hajnal, F., and C.Klusek, Semiempirical efficiency equations for Ge(Li) detectors, Nucl. Instrum. Methods, 122, 559-565, 1974.
Honda, M., Spallation products distributed in a thick iron target bombarded by 3-BeV protons, J. Geophys. Res., 67, 4847-4858, !962.
Kaufman, S. B., and E. P. Steinberg, Cross section measurements of nuclides formed by the reaction of 0.20-6.0 GeV protons with •9?Au, Phys. Rev. C., 22, 167-178, 1980.
Lapides, J. R. Planetary gamma-ray spectroscopy: The effects of hydrogen and the macroscopic thermal-neutron absorption cross section on the gamma-ray spectrum, Ph.D. thesis, University of Maryland, 1981.
Lebrun, C., M. Louvel, J. Yonnet, J. Arnold, A. Baldit, J. Castor, M. Crouau, A. Devaux, J. Fargeix, G. Landaud, M. Lorut, and G. Roche, Use of a Ge(Li) gamma detector near a 400-MeV intense proton beam in a p-gamma coincidence experiment, Nucl. Instrum. Methods, 165, 409-416, ! 979.
Metzger, A. E., and J. R. Arnold, Gamma ray spectroscopic measurements of Mars, J. Appl. Optics, 9, 1289-1303, 1970.
Metzger, A. E., E. L. Haines, R. E. Parker, and R. G. Radocinski, Thorium concentrations in the lunar surface I: Regional values and crustal content, Proc. Lunar $ci. Conf. 8th, 949-999, 1977.
Metzger, A. E., R. H. Parker, J. I. Trombka, R. C. Reedy, and J. R. Arnold, Preliminary design and performance of an advanced gamma ray spectrometer for future orbiter missions, Proc. Lunar Sci. Conf. 6th, 2769-2784, 1975.
Miller, J. M., High energy nuclear reactions, in High Energy Nuclear Reactions in Astrophysics, edited by B. S. P. Shen,pp. 19-36, W. A. Benjamin, New York, 1967.
Ormes, J. F., and W. R. Webber, Measurements of the primary proton and helium spectra and their modulations using a balloon-borne
cerenkov-scintillation counter, Proc. 9th Intl. Conf. on Cosmic Rays, pp. 349-354, Institute of Physics and The Physical Society, 1965.
Philips, G. W., and K. W. Mafiow, Automatic analysis of gamma ray spectra from germanium detectors, Nucl. Instrum. Methods, 137, 525-536, 1976.
Rasmussen, N. C., Y. Hukai, T. Inouye, and V. J. Orphan, Thermal neutron capture gamma ray spectra of the elements, AFCRL-69- 0071, 1969.
Reedy, R. C., Planetary gamma ray spectroscopy, Proc. Lunar Planet. $ci. Conf. 9th, 2961-2984, 1978.
Reedy, R. C., and J. R. Arnold, Interaction of solar and galactic cosmic ray particles with the moon, J. Geophys. Res., 77, 537-555, 1972.
Reedy, R. C., J. R. Arnold, and J. I. Trombka, Expected gamma ray emission spectra from the lunar surface as a function of chemical composition, J. Geophys. Res., 78, 5847-5866, 1973.
Routti, J. T, and A. G. Prussin, Photopeak method for the computer analysis of gamma ray spectra from semiconductor detectors, Nucl. Instrum. Methods, 72, 125-142, 1969.
Sadler, M. E., P. P. Singh, J. Jastrzebski, L. L. Rutledge, Jr., and R. E. Segel, Interaction of 80-164 MeV protons with nickel isotopes, Phys. Rev., C 21, 2303-2321, 1980.
Surkov, U. A., L. P. Moskaleva, V. P. Kharyukova, O. S. Mandelyan, and O. P. Sheheglov, Experimental simulation of the gamma radiation produced by nuclear interactions of high-energy particles with the material of the moon and planets, Kosmicheskie-lssledovaniya, I5, No. 1, !44-!51, 1975.
Waibel, E., and B. Grosswendt, Determination of detector efficiencies for gamma ray energies up to 12 MeV, I. Experimental methods, Nucl. Instrum. Methods, 131, !33-141, !975.
Webber, W. R., The spectrum and charge composition of the primary cosmic radiation, in Handbuch der Physik, vol XLI/1/2, 181-264, Springer-Verlag, Berlin, !967.
A. E. Metzger, jet Propulsion Laboratory, California Institute of Technology, Pasadena, CA 91109.
R. H. Parker, TRW, Redondo Beach, CA 90278. J. Yellin, The Hebrew University of Jerusalem, Jerusalem, Israel.
(Received May 1, !985; revised December 10, !985;
accepted December !3, 1985.)
Related Documents