Supporting Information High Energy Density Aqueous Electrochemical Capacitors with a KI-KOH Electrolyte Xingfeng Wang‡ 1 , Raghu S. Chandrabose‡ 1 , Sang-Eun Chun 2 , Tianqi Zhang 1 , Brian Evanko 3 , Zelang Jian 1 , Shannon Boettcher 2 , Galen D. Stucky 3,4 , Xiulei Ji* 1 1 Department of Chemistry, Oregon State University, Gilbert Hall, Corvallis, OR, 97331 2 Department of Chemistry and Biochemistry, University of Oregon, Eugene, OR, 97403 3 Materials Department, University of California, Santa Barbara, CA, 93106 4 Department of chemistry and biochemistry, UC Santa Barbara, Santa Barbara, CA, 93106 Corresponding author email: [email protected] ‡These authors contributed equally.

Welcome message from author
This document is posted to help you gain knowledge. Please leave a comment to let me know what you think about it! Share it to your friends and learn new things together.
Transcript
Supporting Information
High Energy Density Aqueous Electrochemical
Capacitors with a KI-KOH Electrolyte
Xingfeng Wang‡1, Raghu S. Chandrabose‡
1, Sang-Eun Chun
2, Tianqi Zhang
1, Brian Evanko
3,
Zelang Jian1, Shannon Boettcher
2, Galen D. Stucky
3,4, Xiulei Ji*
1
1 Department of Chemistry, Oregon State University, Gilbert Hall, Corvallis, OR, 97331
2 Department of Chemistry and Biochemistry, University of Oregon, Eugene, OR, 97403
3 Materials Department, University of California, Santa Barbara, CA, 93106
4 Department of chemistry and biochemistry, UC Santa Barbara, Santa Barbara, CA, 93106
Corresponding author email: [email protected]
‡These authors contributed equally.

S-1
Calculation of the Usage of Limited Electrolyte in Coin Cells:
We first estimated the total volume of two film electrodes to be 14 µL based on the electrode
area of 0.785 cm2 each, and the average thickness of the film electrode of ~90 µm. We then
calculated the solid volume occupied by carbon and binder in the electrode films. The volume
occupied by solid carbon in both electrodes is estimated to be 5.6 µL, based on the density of 1.6
g/cc of the carbon before activation, measured by Archimedes’ method. We assume that carbon
black additive shares the same density as the amorphous carbon precursor. The volume of PTFE
binder is calculated to be 0.45 µL based on its density of 2.2 g/cc. Therefore, the pore volume
inside the electrodes equals to 7.95 µL (=14 µL - 5.6 µL - 0.45 µL).
We calculated the pore volume contributed from the separator based on its volume and porosity.
The polycarbonate separator has a thickness of 9 µm and porosity of 17.7%. The total pore
volume inside one separator (diameter: 1.9 cm) is calculated to be 0.454 µL.
So the total pore volume from both electrodes and separator is 8.40 µL (7.95 µL + 0.454 µL).
Therefore, 10 µL of electrolyte is expected to be sufficient to fill up the porosity of a non-flooded
coin cell.

S-2
Figure S1. N2 isotherms of activated carbon at -196 °C, inset: Barrett-Joyner-Halenda (BJH)
pore size distribution calculated from the adsorption curve.
Specific BET surface area and pore size distribution were measured by nitrogen sorption at -196
°C. A surface area of 2405 m2/g and pore volume of 1.0 cc/g were obtained, most of which is
from pores with size less than 4 nm, exhibiting high EDL capacitance and providing surface for
redox reactions.
Different concentrations of KI with and without the presence of 1 M KOH were tested using the
galvanostatic charge-discharge technique. The specific capacitance is based on a full cell.
Apparently, at each concentration, adding KOH helps increase capacitance. From Figure S2, the
cell capacitance increases with a higher concentration of KI. With the presence of KOH, similar
capacitance was found when using 4 M KI and 5 M KI. Considering the cost and electrolyte
density, the optimal electrolyte is determined to be 4 M KI with 1 M KOH.
0.0 0.2 0.4 0.6 0.8 1.00
200
400
600
800
1000
0 5 10 15 20
0
1
2
3
4
5
6
Quantity Adsorbed (cm
3/g STP)
Relative Pressure (P/Po)
Adsorption
Desorption
dV/dlog(D) (cm
3/g)
Pore Width (nm)

S-3
Figure S2. Galvanostatic discharge potential profiles for cells containing pure KI electrolytes
with concentrations from 1 to 5 M (dashed lines) and the mixed electrolytes of KOH (1 M) plus
KI with different concentrations from 1 M to 5 M (solid lines). The specific capacitance values
here are calculated for the full cell level. For specific capacitance of individual electrode, a
factor of four should be applied.
S-4
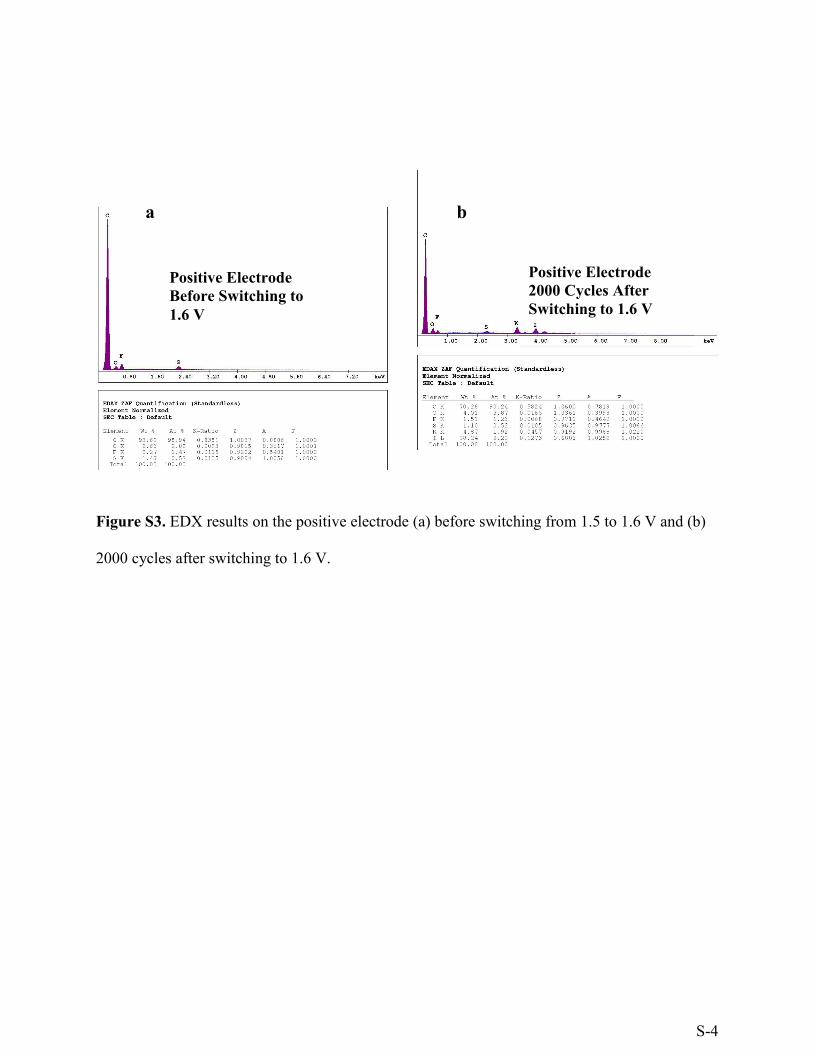
Figure S3. EDX results on the positive electrode (a) before switching from 1.5 to 1.6 V and (b)
2000 cycles after switching to 1.6 V.
Positive Electrode
Before Switching to
1.6 V
Positive Electrode
2000 Cycles After
Switching to 1.6 V
a b

S-5
Figure S4. Pourbaix diagram of iodine species. (Figure from reference S1)1
The Pourbaix diagram in Figure S4 shows the iodine-containing species existing in different
regions of potentials and pH values. At pH of 14, when I- is oxidized, the product would be IO3
-,
or H2IO63-
, corresponding to the +5 or +7 oxidation state of iodine, respectively.
S-6
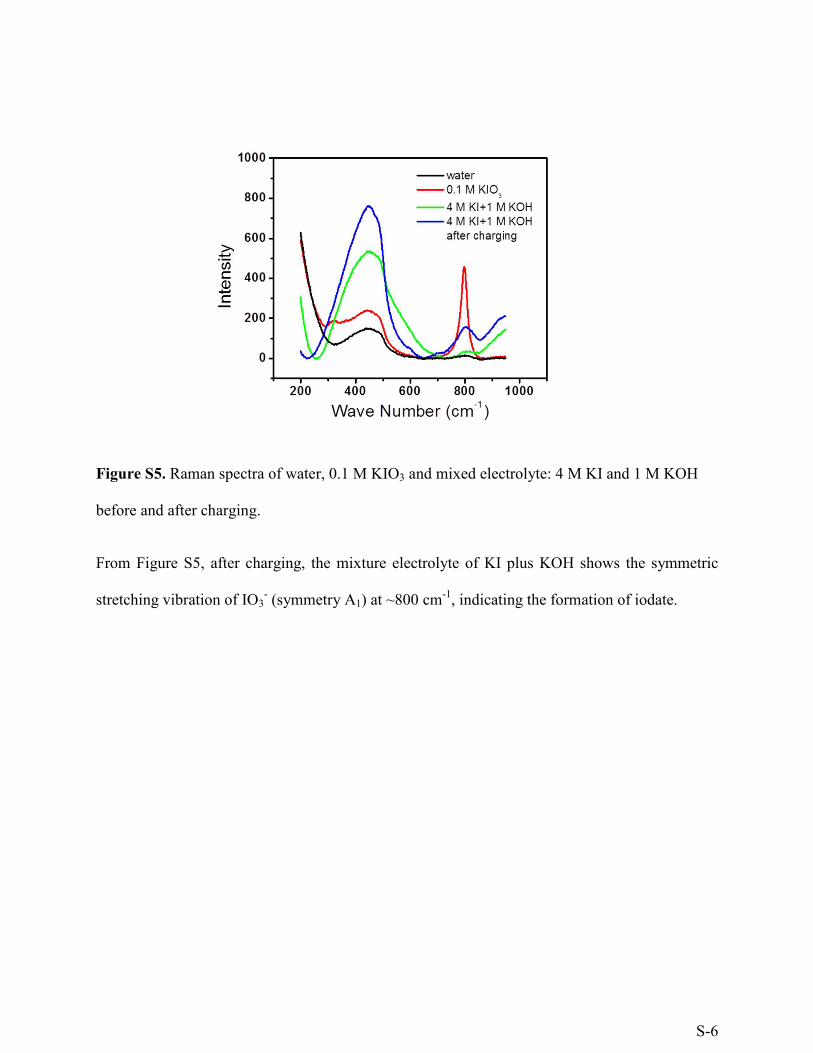
Figure S5. Raman spectra of water, 0.1 M KIO3 and mixed electrolyte: 4 M KI and 1 M KOH
before and after charging.
From Figure S5, after charging, the mixture electrolyte of KI plus KOH shows the symmetric
stretching vibration of IO3- (symmetry A1) at ~800 cm
-1, indicating the formation of iodate.

S-7
Figure S6. Comparison of electrochemical impedance spectroscopy results between the
electrolytes of pure KI and the mixture of KI plus KOH. Inset: zoomed-in region at high
frequencies.
Figure S6 shows the Nyquist plots of the pure KI electrolyte and the mixed electrolyte of KI plus
KOH. From the intercepts on x-axis, it is evident addition of KOH decreases the equivalent
series resistance (ESR) from 1.8 Ω to 1.2 Ω. The inset in Figure S6 shows a smaller diameter of
the semicircle around 0.4 Ω with KOH, compared to 0.6 Ω without KOH. The smaller
semicircle demonstrates lower Faradaic resistance, indicating that the redox reaction is
kinetically faster in the presence of KOH. Furthermore, addition of KOH leads to an almost
vertical line at lower frequency region, close to an ideal capacitor.

S-8
Figure S7. Cyclic voltammograms of pure KI (4 M) electrolyte and a mixed electrolyte of KI (4
M) + KOH (1M) for positive potentials vs. Ag/AgCl at (A) 1 mV/s, (B) 50 mV/s, and for
negative potentials vs. Ag/AgCl at (C) 1 mV/s, (D) 50 mV/s.
Figure S7 compares cyclic voltammograms of pure KI (4 M) electrolyte and a mixed electrolyte
of KI (4 M)-KOH (1M) at both cathode and anode potentials. At 1 mV/s, the cathodic peak
shifts from 0.36 to 0.46 V vs. Ag/AgCl, which could help increase the cell voltage and therefore

S-9
improve energy density. At the anode potentials, small humps around -0.9 V vs. Ag/AgCl in
Figure S6D indicate that redox reaction occurs when using KI + KOH electrolyte, which is
attributed to hydrogen adsorption/desorption. The electrolyte of KI plus KOH also shows more
desirable performance at higher scanning rates with the rectangular shape of the CV curves better
retained. From galvanostatic charge-discharge profiles in three-electrode cells in Figure S7, both
electrolytes show the well-defined plateaus close to 0.5 V vs. Ag/AgCl, but a higher current is
observed in the KI-KOH mixed electrolyte. Enhanced hydrogen adsorption/desorption in the KI-
KOH electrolyte helps increase charge storage on the anode, and therefore improves the specific
energy of the full cell.
Figure S8. Galvanostatic charge-discharge profiles in three-electrode cells at 1A/g with
electrolytes of 4 M KI (A), and 4 M KOH + 1 M KOH (B).
Reference:
S1. Parent, A. R.; Crabtree, R. H.; Brudvig, G. W. Comparison of Primary Oxidants for
Water-Oxidation Catalysis. Chem. Soc. Rev. 2013, 42, 2247-2252.
Related Documents


