305 Bulletin of the World Health Organization | April 2006, 84 (4) Objective To gain a better understanding of the health transition in Indonesia, we sought to describe the prevalence and distribution of risk factors for noncommunicable diseases and to identify the risk-factor burden among a rural population and an urban population. Methods Using the protocol of the WHO STEPwise approach to Surveillance (STEPS), risk factors for noncommunicable diseases were determined for 1502 men and 1461 women aged 15–74 years at the Purworejo Demographic Surveillance Site in 2001. Findings Smoking prevalence was high among men (913/1539; weighted percentage = 53.9.%) in both rural and urban populations; it was almost non-existent among women. A higher proportion of the urban population and the richest quintile of the rural population had high blood pressure and were classified as being overweight or obese when compared with the poorest quintile of the rural population. Those classified as being in the richest quintile who lived in the rural area were 1.5 times more likely to have raised blood pressure and 8 times more likely to be overweight than those classified as being in the poorest quintile and living in the rural area. Clustering of risk factors was higher among those classified as being in the richest quintile of those living in the rural area compared with those classified as being in the poorest quintile; and the risks of clustering were just 20–30% lower compared with the urban population. Conclusion Both the rural and urban populations in Purworejo face an unequally distributed burden of risk factors for noncommunicable diseases. The burden among the most well-off group in the rural area has already reached a level similar to that found in the urban area. The implementation of the WHO STEPS approach was feasible, and it provides a comprehensive picture of the burden of risk factors, allowing appropriate health interventions to be implemented to address health inequities. Keywords Chronic disease – epidemiology; Risk factors; Cross-sectional studies; Indonesia (source: MeSH, NLM). Mots clés Maladie chronique – épidémiologie; Facteur risque; Etude section efficace; Indonésie (source: MeSH, INSERM). Palabras clave Enfermedad crónica – epidemiología; Factores de riesgo; Estudios transversales; Indonesia (fuente: DeCS, BIREME). Bulletin of the World Health Organization 2006;84:305-313. Voir page 311 le résumé en français. En la página 312 figura un resumen en español. Introduction e epidemiological transition has res sulted in a double burden of commus nicable and chronic noncommunicable diseases in most developing countries. e Global Burden of Disease study has shown that there is an unequal distribus tion of total disease burden and health expenditure. Nearly 90% of the world’s total disease burden occurs in develops ing countries, while only 10% of health expenditures are allocated there. 1 e burden of noncommunicable diseases affects the poor less than those who are better off; however, these diseases also a Department of Public Health, Faculty of Medicine, Gadjah Mada University, IKM Building 3rd Floor, Farmako St. North Sekip, Jogjakarta 55281, Indonesia. Correspondence to this author (email: [email protected]). b Umeå International School of Public Health, Epidemiology and Public Health Sciences, Umeå University, Umeå, Sweden. c Evidence for Information and Policy, World Health Organization, Geneva, Switzerland. d The Community Health and Nutrition Research Laboratory, Department of Public Health, Faculty of Medicine, Gadjah Mada University, Jogjakarta, Indonesia. Ref. No. 05-023721 (Submitted: 9 May 2005 – Final revised version received: 27 October 2005 – Accepted: 1 November 2005 ) Preventable risk factors for noncommunicable diseases in rural Indonesia: prevalence study using WHO STEPS approach Nawi Ng, a Hans Stenlund, b Ruth Bonita, c Mohammad Hakimi, d Stig Wall, b & Lars Weinehall b .312 contribute to the excess death and diss ability among the poor in terms of mors tality and the loss of disabilitysadjusted life years. 2 Most of these noncommunicable diseases share common preventable risk factors, such as tobacco use, high alcohol consumption, raised blood pressure, seds entary lifestyle and obesity. 3 Clustering of these risk factors significantly increases the risk of morbidity and mortality from cardiovascular disease. 4–8 Not only is the burden of noncoms municable diseases unequally distributed among different social classes, but their risk factors also show variation between women and men and between different income groups. 9,10 A poorer risksfactor profile among the urban population is associated with migration from rural areas to urban areas. 11 In developing countries, obesity is positively associated with higher socioeconomic status, 12 while in developed countries blood pressure level and obesity are negatively associated with socioeconomic status. 12,13 To anticipate the epidemic in nons communicable diseases, WHO has initiated the worldwide surveillance of risk factors using the WHO STEPwise approach to Surveillance (STEPS) of risk factors for noncommunicable diseases. 14

High Blood Pressure Indonesia
Dec 15, 2015
Blood Preasure
Indonesia
Indonesia
Welcome message from author
This document is posted to help you gain knowledge. Please leave a comment to let me know what you think about it! Share it to your friends and learn new things together.
Transcript

305Bulletin of the World Health Organization | April 2006, 84 (4)
Objective To gain a better understanding of the health transition in Indonesia, we sought to describe the prevalence and distribution of risk factors for noncommunicable diseases and to identify the risk-factor burden among a rural population and an urban population.Methods Using the protocol of the WHO STEPwise approach to Surveillance (STEPS), risk factors for noncommunicable diseases were determined for 1502 men and 1461 women aged 15–74 years at the Purworejo Demographic Surveillance Site in 2001.Findings Smoking prevalence was high among men (913/1539; weighted percentage = 53.9.%) in both rural and urban populations; it was almost non-existent among women. A higher proportion of the urban population and the richest quintile of the rural population had high blood pressure and were classified as being overweight or obese when compared with the poorest quintile of the rural population. Those classified as being in the richest quintile who lived in the rural area were 1.5 times more likely to have raised blood pressure and 8 times more likely to be overweight than those classified as being in the poorest quintile and living in the rural area. Clustering of risk factors was higher among those classified as being in the richest quintile of those living in the rural area compared with those classified as being in the poorest quintile; and the risks of clustering were just 20–30% lower compared with the urban population.Conclusion Both the rural and urban populations in Purworejo face an unequally distributed burden of risk factors for noncommunicable diseases. The burden among the most well-off group in the rural area has already reached a level similar to that found in the urban area. The implementation of the WHO STEPS approach was feasible, and it provides a comprehensive picture of the burden of risk factors, allowing appropriate health interventions to be implemented to address health inequities. Keywords Chronic disease – epidemiology; Risk factors; Cross-sectional studies; Indonesia (source: MeSH, NLM).Mots clés Maladie chronique – épidémiologie; Facteur risque; Etude section efficace; Indonésie (source: MeSH, INSERM).Palabras clave Enfermedad crónica – epidemiología; Factores de riesgo; Estudios transversales; Indonesia (fuente: DeCS, BIREME).
Bulletin of the World Health Organization 2006;84:305-313.
Voir page 311 le résumé en français. En la página 312 figura un resumen en español.
IntroductionThe epidemiological transition has resssulted in a double burden of commussnicable and chronic noncommunicable diseases in most developing countries. The Global Burden of Disease study has shown that there is an unequal distribusstion of total disease burden and health expenditure. Nearly 90% of the world’s total disease burden occurs in developssing countries, while only 10% of health expenditures are allocated there.1 The burden of noncommunicable diseases affects the poor less than those who are better off; however, these diseases also
a Department of Public Health, Faculty of Medicine, Gadjah Mada University, IKM Building 3rd Floor, Farmako St. North Sekip, Jogjakarta 55281, Indonesia. Correspondence to this author (email: [email protected]).
b Umeå International School of Public Health, Epidemiology and Public Health Sciences, Umeå University, Umeå, Sweden.c Evidence for Information and Policy, World Health Organization, Geneva, Switzerland.d The Community Health and Nutrition Research Laboratory, Department of Public Health, Faculty of Medicine, Gadjah Mada University, Jogjakarta, Indonesia.Ref. No. 05-023721(Submitted: 9 May 2005 – Final revised version received: 27 October 2005 – Accepted: 1 November 2005)
Preventable risk factors for noncommunicable diseases in rural Indonesia: prevalence study using WHO STEPS approachNawi Ng,a Hans Stenlund,b Ruth Bonita,c Mohammad Hakimi,d Stig Wall,b & Lars Weinehall b
.312
contribute to the excess death and disssability among the poor in terms of morsstality and the loss of disabilitysadjusted life years.2
Most of these noncommunicable diseases share common preventable risk factors, such as tobacco use, high alcohol consumption, raised blood pressure, sedssentary lifestyle and obesity.3 Clustering of these risk factors significantly increases the risk of morbidity and mortality from cardiovascular disease.4–8
Not only is the burden of noncomssmunicable diseases unequally distributed among different social classes, but their risk factors also show variation between
women and men and between different income groups.9,10 A poorer risksfactor profile among the urban population is associated with migration from rural areas to urban areas.11 In developing countries, obesity is positively associated with higher socioeconomic status,12 while in developed countries blood pressure level and obesity are negatively associated with socioeconomic status.12,13
To anticipate the epidemic in nonsscommunicable diseases, WHO has initiated the worldwide surveillance of risk factors using the WHO STEPwise approach to Surveillance (STEPS) of risk factors for noncommunicable diseases.14

306 Bulletin of the World Health Organization | April 2006, 84 (4)
ResearchUsing STEPS to study risk factors in rural Indonesia Nawi Ng et al.
This approach uses standardized instrussments and protocols to monitor trends within countries and make comparisons between countries. STEPS focuses on the continual collection of data on key risk factors associated with major chronic diseases. Such information is useful for designing communitysbased intervensstions to reduce risk factors in the populasstion. However, longitudinal populationsbased studies to monitor trends in risk factors for chronic diseases are rare in Indonesia. The aims of this paper are to describe the prevalence of three core risk factors for noncommunicable diseases among residents in Indonesia whose data were captured by the Purworejo Demossgraphic Surveillance System using the STEPS protocol; the risk factors studied were the prevalence of tobacco use, being overweight or obese and raised blood pressure. We also sought to identify the extent to which the rural population is burdened by these risk factors compared with their urban counterparts.
MethodsThe study was conducted in the Purworejo district in 2001. The district, which is located 60 km west of Jogjakarta provssince in the southern part of Java Island, has a population of 757 000 in an area of 1035 km². Established in 1994, the Purworejo Demographic Surveilsslance System covers a representative sample of 15 000 households selected using twosstage cluster sampling. The primary sampling unit of the surveilsslance system (the enumeration areas/clusters developed by the Central Bureau
of Statistics) was selected using a probssability proportional to the number of households in the cluster. In the second stage, the same number of households was systematically sampled from each area.15
The surveillance system provided the sampling frame and data on housesshold socioeconomic status for this study.16 For this study, the socioecossnomic status of the sample was generssated by using the socioeconomic status of households as determined by an asset survey in 1999. The asset survey colsslected data on the material from which walls, roofs and flooring were made; the source of drinking water; whether toilet facilities were used; and whether a number of durable goods were owned. A weight was assigned to each asset using principal component analysis. The sum of the asset weights for each household was used to categorize households as belonging to the poorest quintile (the lowest quintile of asset distribution), one of the three middle quintiles, or the richest quintile.
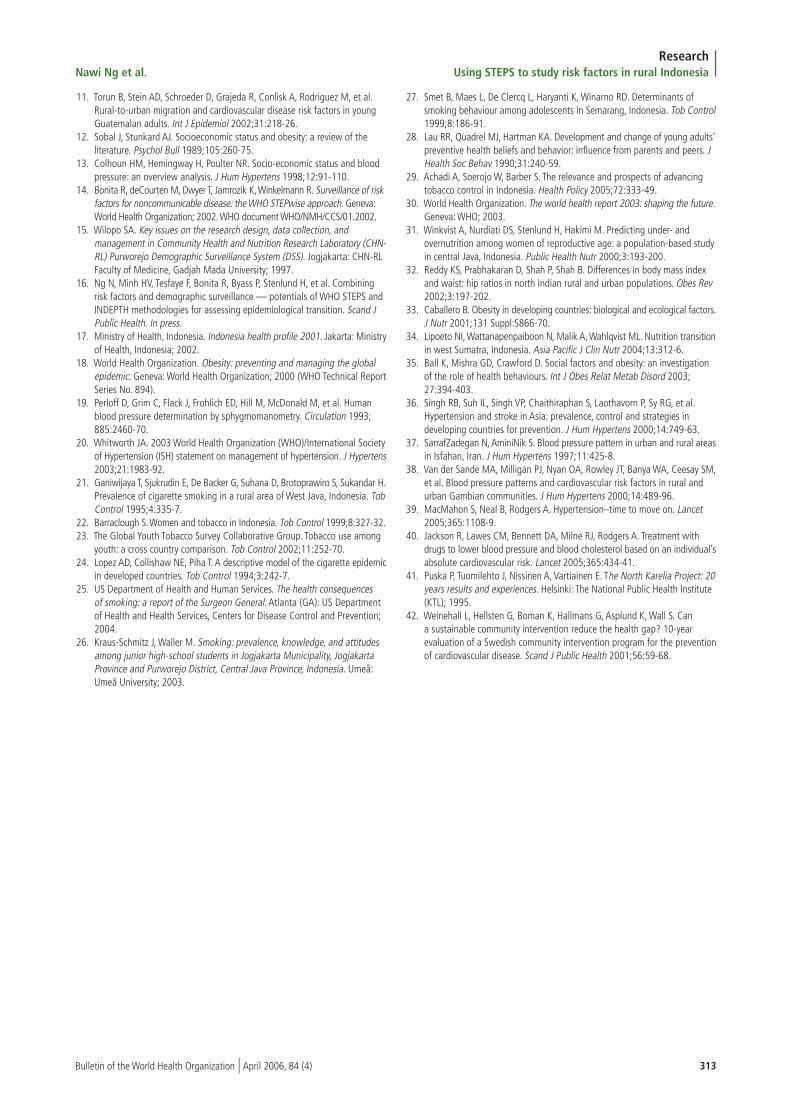
The study protocol is based on the WHO STEPS approach. STEPS uses different levels of risksfactor assessssment, including collecting information using questionnaires (Step 1), taking physical measurements (Step 2), and taking blood samples for biochemical assessment (Step 3). Each step contains core, expanded and optional items that can be added as needed. The conceptual framework of STEPS, which integrates different levels of risk factor assessment and the completeness of the risk factors assessed, is shown in Table 1.14
Table 1. WHO STEPwise approach to Surveillance (STEPS) of risk factors for noncommunicable diseases
Measures Step 1 (Self-report) Step 2 (Physical examination) Step 3 (Biochemical assessment)
Core Socioeconomic and demographic Measured weight, height, waist Measurement of fasting blood variables including years of education, circumference, blood pressure glucose, total cholesterol tobacco and alcohol use, physical inactivity, intake of fruit and vegetables
Expanded Ethnicity, educational attainment, Hip circumference, pulse rate Fasting high-density lipoprotein core occupation, income, use of smokeless cholesterol and triglycerides tobacco, fat consumption, types of physical activity, history of high blood pressure, history of diabetes, treatment for diabetes, treatment for high blood pressure
Optional Other health-related behaviours, mental Objective measurement of physical Oral glucose tolerance test, urine (examples) health status, disability, injury activity (e.g., timed walk, use of examination pedometer), measurement of skinfold thickness
Source: Ref.14.
A total of 3250 participants were randomly selected from the surveillance database from each cluster selected durssing the first stage of sampling; the final sample represented a 95% response, or 3079 participants (Fig. 1). The aim was to include approximately 250 individussals in each sex and age group (among 15–74 year olds stratified into 10syear intervals) in the final sample to allow estimation of key variables with high precision. Participants between the ages of 15 years and 24 years were included because smoking is now being taken up at a younger age. Adults aged 65–74 years were included because cardiovassscular disease has emerged as the leading cause of death in Indonesia, particularly among elderly people.17 An additional 5% of participants were added to the selected sample in each group to ensure an adequate sample size; among the group of oldest participants, however, an additional 30% of participants were included due to a lower response ocsscurring among this group. Exclusion criteria included severe chronic illness requiring bed rest, physical disability, mental disability and the presence of communication barriers.
This study was approved by the ethical review boards of the Faculty of Medicine of Gadjah Mada University, Indonesia, and Umeå University Hospital, Sweden.
Due to limits on the resources available for the collection of blood samples, only Step 1 and Step 2 were conducted; we did include both core and expanded items for these steps. Questionnaires on core behaviours were

307Bulletin of the World Health Organization | April 2006, 84 (4)
ResearchNawi Ng et al. Using STEPS to study risk factors in rural Indonesia
translated into Indonesian and then backstranslated into English. Participants were classified as current daily smokers if they smoked > 1 cigarette per day. Instruments for anthropometry and blood pressure measurements were standardized and routinely calibrated. Trained field staff measured each participant’s weight and height while participants were barefoot and wearing in lightweight clothing. Weight was measured to the nearest 10 grams using an electronic scale (Seca GmbH, Hamburg, Germany). Height was measured to the nearest 0.1 cm using a portable stadiometer. Body mass index (BMI) was calculated as weight in kilossgrams divided by height in meters squared. Participants were classified as overweight or obese if they had a BMI > 25.18
Blood pressure was measured twice with the right arm at heart level while the participant was seated; a standardssized protocol was used.14,19 In 2001, only manual blood pressure equipment was available for use. In a followsup study in 2002 among the same participants, blood pressure was measured using ausstomated devices (Omron M4sI, Omron Healthcare Europe BV, Hoofddorp, Netherlands); these measurements were used as proxies for blood pressure in 2001. For participants for whom there were no digital measurements in 2002, we estimated blood pressure by calculatssing the regression between the 2001 and 2002 values and predicting the digital measurement. The prediction was based on a regression equation that included a random component to reflect variasstion in blood pressure at specific levels, and was done separately for the different sex and age groups. Participants were defined as having raised blood pressure if the systolic pressure was > 140 mmHg and/or diastolic pressure was > 90 mmHg or if they were taking antihypertensive medication.20
Data cleaning and data entry were performed in the Purworejo field office. Data were analysed using Stata softssware, version 8 (StataCorp, College Station, TX).
Data analysisIn total 3079 people participated in the study, but data on only 2963 individussals (1502 men and 1461 women) were included in the analysis. Among those excluded were 4 participants with invalid blood pressure readings, 6 participants with invalid BMI calculations, 21 pregssnant women for whom BMI was not obtained and 85 participants for whom
Fig. 1. Sampling and flow of participants through the study
WHO 06.17
700 enumeration areas/clustersin Purworejo Demographic Surveillance System
Stage I cluster sampling:128 clusters randomly chosen
Stage II cluster sampling:(current study):
25 individuals randomlyselected in each cluster;
stratified by sex and age group
3250 individuals selected from database3079 participated
171 did not participate(10 refused, 7 were ill, and 154 were absent after three visits)
Data from 2963 participants analysed (1502 men and 1461 women)Data from 116 not analysed
(4 invalid blood pressure readings, 6 invalid BMIa calculations, 21 pregnant women,85 had no information on household socioeconomic status)
aBMI = Body mass index.
information on household socioecossnomic status was unavailable.
Multinomial logistic regression with three levels of the dependent variable (no risk factors, single risk factor and multissple risk factors) was used to estimate the odds ratio for each socioeconomic class adjusted for age and sex. We estimated the relative risk of having risk factors for each socioeconomic group.
FindingsA total of 363 participants were classissfied as living in an urban area (186 men, 177 women) and 2600 were classified as living in a rural area (1316 men, 1284 women). Results were weighted using the data on age and sex distribusstion from the Purworejo surveillance conducted in 2000. Table 2 displays the sociodemographic distribution of study participants. Due to the small sample size, participants living in urban areas were treated as a single group.
In general, participants aged < 45 years had higher educational attainment when compared with participants aged > 45 years. About 90% of urban particisspants and 70% of the rural participants
classified as being from the richest quintile were not farmers, and 70% of participants from the poorest quintile living in rural areas were farmers (data not shown).
The agesadjusted and sexsadjusted prevalences of smoking, raised blood pressure, and overweight and obesity are shown in Table 3. The prevalence of smoking was high among men at all ages, and there was almost no tobacco use among women (53.9% of men used tobacco versus 1.7% of women). The prevalence of raised blood pressure was similar among men and women (prevalence among men = 22.4%, 95% confidence interval (CI) = 20.3–24.7% versus 21.9% among women, 95% CI = 19.9–24.0%). Even though the prevalence decreased by half when a higher cutsoff point of 160/95 was used, a significantly higher prevalence of raised blood pressure was observed among women compared with men (12.2%, 10.9–13.7% versus 9.8%, 8.5–11.3%) (data not shown). Men in all age groups, except those aged 65–74 years, had higher mean systolic and diastolic blood pressure compared with women. Women in all age groups had higher mean BMIs and thus a higher

308 Bulletin of the World Health Organization | April 2006, 84 (4)
ResearchUsing STEPS to study risk factors in rural Indonesia Nawi Ng et al.
Table 2. Sociodemographic information on participants in study of noncommunicable diseases, Purworejo district, Indonesia, 2001
Sociodemographic Age (years) Total no. of Proportion variables
15–24 25–34 35–44 45–54 55–64 65–74 participants
Sex No. (%) men 241/468a 239/474 247/483 241/484 243/495 291/559 1502 49.9 (±0.5)b (51.5) (50.4) (51.1) (49.8) (49.1) (52.1)
No. (%) women 227/468 235/474 236/483 243/484 252/495 268/559 1461 50.1 (±0.5) (48.5) (49.6) (48.9) (50.2) (50.9) (47.9)
Total 468 474 483 484 495 559 2963
Socioeconomic status No. (%) urban dwellers 63/468 67/474 51/483 61/484 67/495 54/559 363 12.4 (±3.0) (13.5) (14.1) (10.6) (12.6) (13.5) (9.7)
No. (%) in richest 60/468 47/474 71/483 68/484 56/495 72/559 374 12.7 (±1.4) quintile in rural area (12.8) (9.9) (14.7) (14.0) (11.3) (12.9)
No. (%) in 3 middle 284/468 298/474 279/483 281/484 297/495 353/559 1792 60.4 (±2.6) quintiles in rural area (60.7) (62.9) (57.8) (58.1) (60.0) (63.1)
No. (%) in poorest 61/468 62/474 82/483 74/484 75/495 80/559 434 14.5 (±1.8) quintile in rural area (13.0) (13.1) (17.0) (15.3) (15.2) (14.3)
a Values are numerators/denominators (weighted percentages). Please see text for information on weighting.b Values in parentheses are the standard errors.
prevalence of being overweight or obese compared with men.
Smoking was most common among participants living in rural areas in the poorest quintile (Table 4). Conversely, the prevalences of both raised blood pressure and being overweight were more comssmon among those living in urban areas and those classified as being in the richest quintile in rural areas. When the higher blood pressure cutsoff point was used, we observed a similar gradient of risksfactor clustering across the different socioecossnomic groups. Treatment of high blood pressure cannot explain the difference in prevalence observed between the rural and urban populations since we observed no difference in the proportion of those receiving treatment between these two groups (data not shown).
Risk factors tended to cluster among urban participants (16.6% of those in the urban area had two or more risk factors compared with 7.3% of those classified as being in the poorest quintile in the rural areas). We observed a trend of risk increasing across socioeconomic groups in rural areas (Table 4). The risk of a clussstering of risk factors was highest among the richest quintile in rural areas when compared with the poorest quintile in rural areas, and the risk was only 23–35% lower among the rural population than the urban population.
Table 5 shows that there is a gradient of risk for raised blood pressure even in rural areas. The risk was 1.5sfold higher (95% CI = 1.2–1.9) for the richest rural quintile when compared with the poorssest rural quintile. This pattern persisted even when we used the higher blood pressure cutsoff point of 160/95: there was a 1.4sfold increase in risk for men and a 1.8sfold increase for women (data not shown).
Similar patterns were observed for both sexes for the risk of being overssweight or obese. The risk of being overssweight or obese among women classified as being in the richest rural quintile was 8.5 times higher (95% CI = 4.1–17.9) than that for women classified as being in the poorest rural quintile. Among men, being overweight or obese increased the risk of raised blood pressure by 1.7 (95% CI = 1.30–2.22) and among women by 1.6 (95% CI = 1.28–1.98). The risk was even greater when the higher blood pressure cutsoff point was used.
DiscussionThis study supports findings from other studies showing that rural populations are not spared from the emerging burssden of risk factors for chronic noncomssmunicable diseases. Once regarded as diseases of the affluent, noncommunisscable diseases now burden populations
in developing countries that have not yet finished tackling povertysrelated diseases.1,12,13
SmokingThe high prevalence of smoking among men supports the findings of several surveys in Indonesia.21–23 The higher prevalence of smoking among men in lower socioeconomic groups suggests that Indonesia is currently in the secssond stage of the smoking epidemic.24 A causesspecific mortality study conducted in Purworejo in 2000 found that the majority of deaths occurring among men were due to noncommunicable diseases, especially heart disease, stroke and chronic pulmonary diseases (N. Ng, unpublished data, 2000). Those data sugssgest that if the smoking epidemic model applies, a further increase in smokingsrelated morbidity and mortality is to be expected in the coming decades.24,25
The high prevalence of smoking among men should raise concerns about environmental tobacco exposure and the potential influence of paternal smoking on youths. A study of young adolescents in Purworejo district and Yogyakarta clearly showed that smoking was more prevalent among young rural adolescents than among urban adolescents.26 This may be explained by their low sociosseconomic status, limited exposure to

309Bulletin of the World Health Organization | April 2006, 84 (4)
ResearchNawi Ng et al. Using STEPS to study risk factors in rural Indonesia
Table 3. Prevalence and mean levels of risk factors for noncommunicable diseases stratified by sex and age group of participants from Purworejo district, Indonesia, 2001
Risk factor
Age Daily smokera Systolic blood Diastolic blood Raised blood Body mass Overweight or (years) pressureb pressureb pressurec indexd obesee
Men 53.9 (51.1–56.7) 126.6 (125.6–127.6) 76.3 (75.7–77.0) 22.4 (20.3–24.7) 20.2 (20.1–20.4) 4.8 (3.8–6.1) 15–24 31.2 119.2 72.3 7.7 19.4 0.8 25–34 54.9 121.3 74.5 12.2 20.7 9.3 35–44 62.6 125.6 78.5 21.3 21.0 5.1 45–54 66.4 129.8 78.7 29.9 21.1 8.6 55–64 71.6 137.2 80.6 41.2 20.2 6.4 65–74 67.4 140.0 79.0 49.3 19.4 3.0
Women 1.7 (1.1–2.6) 123.4 (122.3–124.5) 75.5 (74.9–76.2) 21.9 (19.9–24.0) 20.9 (20.7–21.1) 12.0 (10.3–14.0) 15–24 0.0 111.4 70.3 2.6 19.9 3.0 25–34 0.4 113.3 73.0 7.1 21.6 12.9 35–44 0.8 119.9 75.9 16.3 22.1 18.7 45–54 1.6 126.8 78.7 29.0 22.1 19.4 55–64 5.0 136.5 79.6 39.1 20.4 14.0 65–74 4.3 146.3 80.9 60.3 19.6 10.1
Total 27.6 (26.1–29.2) 124.9 (124.2–125.7) 75.9 (75.4–76.4) 22.1 (20.7–23.6) 20.6 (20.4–20.7) 8.5 (7.3–9.8)
a Values are percentages (95% confidence intervals).b Values are given in mmHg; values in parentheses are 95% confidence intervals.c Raised blood pressure was defined as blood pressure > 140/90 mmHg or the use of an antihypertensive drug. Values are percentages (95% confidence intervals).d Body mass index was calculated as the participant’s weight in kilograms divided by height in meters squared. e Participants with a body mass index > 25 were classified as being overweight or obese. Values are percentages (95% confidence intervals).
Table 4. Clustering of risk factors for noncommunicable diseases by socioeconomic group in Purworejo district, Indonesia, 2001
Urban (all socioeconomic Richest quintile Middle 3 quintiles Poorest quintile quintiles)a in rural area in rural area in rural area
MenNo. of men 186 179 917 220% daily smokers 52.0 (42.9–61.0) 48.2 (40.3–56.2) 54.2 (50.8–57.5) 59.7 (51.8–67.2)% with raised blood pressureb 28.9 (22.5–36.4) 26.6 (20.9–33.3) 21.7 (19.2–24.4) 16.5 (12.5–21.7)% overweight or obesec 13.3 (9.6–18.1) 10.1 (6.2–16.1) 3.1 (2.2–4.3) 0.7 (0.2–2.9)Clustering of risk factors % with no risk factor 32.4 36.7 36.5 35.0 % with 1 risk factor 44.7 44.0 48.5 53.0 % with > 2 risk factors 23.0 19.2 15.0 12.0Odds ratio for > 2 risk factors 1.00 0.77 (0.45–1.31) 0.55 (0.36–0.84) 0.40 (0.24–0.67) vs no risk factora
WomenNo. of women 177 195 875 214% daily smokers 2.1 (1.0–4.3) 0.3 (0–2.4) 1.7 (1.0–2.7) 3.1 (1.4–6.7)% with raised blood pressureb 22.2 (17.8–27.2) 27.4 (22.0–33.6) 21.3 (18.6–24.3) 18.3 (14.2–23.2)% overweight or obesec 23.7 (19.6–28.4) 19.6 (14.5–26.1) 10.2 (8.3–12.5) 2.6 (1.2–5.8)Clustering of risk factors % with no risk factor 62.5 59.7 70.9 78.4 % with 1 risk factor 27.3 33.3 25.0 19.2 % with > 2 risk factors 10.2 7.0 4.0 2.4Odds ratio for > 2 risk factors 1.00 0.65 (0.32–1.36) 0.26 (0.15–0.47) 0.12 (0.05–0.31) versus no risk factora
a Values in parentheses are 95% confidence intervals.b Raised blood pressure was defined as having blood pressure >140/90 mmHg or taking an antihypertensive drug.c Participants with a body mass index > 25 were classified as being overweight or obese.

310 Bulletin of the World Health Organization | April 2006, 84 (4)
ResearchUsing STEPS to study risk factors in rural Indonesia Nawi Ng et al.
tobaccosrelated information at school and the high proportion of paternal smoking.26–28
Tobacco is an important and influssential industry in Indonesia; government efforts to control tobacco use have been ineffective in their implementation.29 Indonesia is one of the WHO Member States that has not signed the WHO Framework Convention on Tobacco Control. Without sustained political will, the public health approach to preventssing smoking and encouraging cessation might be ineffective.30
Overweight or obesityThe prevalence of being overweight or obese among women is consistent with a previous study on reproductivesage women in Purworejo31 that found a prevalence of 11.6% in 1996 and 14.3% in 1997.
Urbanization,11,32 improvement in socioeconomic status, better food availssability,12 the adoption of eating habits similar to those in developed countries (e.g., an increasing proportion of nutrisstion is obtained through the consumpsstion of fats and proteins) and moves towards a more sedentary lifestyle have led to the increased prevalence of obesity in developing countries.33 Similarly, our study found an increased risk of being overweight or obese occurring among those in the richest quintile compared with those in the poorest quintile; this may reflect changing dietary habits in Indonesia. The ratio of energy contrissbution from carbohydrate, protein and fat in Indonesia has changed over the past 16 years; there has been an increase in the consumption of fat and protein (the ratio of carbohydrate:protein:fat in 1983 was 81:8:11 and in 1999 it was 59:19:23).34
Gendersspecific social factors act differently in moderating the relationssship between BMI and behavioural factors.35 However, it is not possible to interpret sociodemographic and healthsbehaviour factors separately using our data on overweight or obesity. Further studies are needed to capture social facsstors more systematically to provide such an analysis.
Raised blood pressureOur study suggests that raised blood pressure has become a major public health problem for all age groups, espesscially elderly people living in rural areas.
The agesadjusted prevalence of hypersstension was less than that in more develssoped countries (such as Australia, Japan and New Zealand), but it was similar to findings from other developing counsstries such as China, India, the Islamic Republic of Iran and the Gambia.36–38
Although the prevalence of hypersstension was higher among the urban population, the richest quintile in the rural area also had a higher risk of hysspertension compared with the poorest rural quintile. The inclusion of blood pressure medication in the definition of raised blood pressure did not change the prevalence. Being overweight or obese increases the risk of being hypertensive by 60–70% in our setting. Colhoun et al.13 found that a higher prevalence of obesity and higher salt and alcohol intake among wealthier socioeconomic groups might explain the direct associasstion between socioeconomic status and high blood pressure. However, alcohol might not be the explanation in our setting because of the low prevalence of
daily alcohol use (data not shown).The blood pressure of a populass
tion does not shift over short periods; therefore we do not think that bias was introduced by our use of estimated blood pressure for participants in the subsample measured manually. Even though the groups with and without automatic measssurements had similar distributions of sex, BMI and socioeconomic status, they differed in terms of occupation (a surssrogate for physical activity that is likely to be an important correlate of blood pressure). The subsample measured manually had lower blood pressure when compared with the group with automatic measurement. This further justifies our decision to interpolate the missing values because it was necessary to include both groups in the analysis to maintain the representativeness of the sample.
Because the most common causes of death in the study population are vascular diseases, the management of the three major cardiovascular risk factors (smoking, hypertension, choss
Table 5. Multivariate analysis of background factors with different dependent risk factors in study of noncommunicable diseases, Purworejo district, Indonesia, 2001
Risk factora
Daily Being overweight Raised blood smoking or obese pressure
MenAge 1.01 (1.01–1.02) 1.02 (1.01–1.03) 1.04 (1.03–1.04)Socioeconomic statusb Richest quintile in rural area 0.90 (0.72–1.12) 0.74 (0.42 –1.30) 0.90 (0.67–1.20) Middle 3 quintiles in rural area 1.02 (0.86–1.20) 0.23 (0.14–0.39) 0.78 (0.61–1.00) Poorest quintile in rural area 1.11 (0.92–1.34) 0.06 (0.01–0.23) 0.61 (0.43–0.86)Overweight/obesec Yes 0.87 (0.68–1.11) NAd 1.70 (1.30–2.22)Smokere Yes NA 0.76 (0.48–1.20) 1.00 (0.83–1.20)
WomenAge NA 1.02 (1.01–1.02) 1.05 (1.05–1.06) Socioeconomic statusb Richest quintile in rural area NA 0.80 (0.55–1.17) 1.21 (0.88–1.66) Middle 3 quintiles in rural area NA 0.41 (0.30–0.57) 0.98 (0.75–1.28) Poorest quintile in rural area NA 0.11 (0.05–0.24) 0.83 (0.58–1.19)Overweight/obesec Yes NA NA 1.60 (1.28–1.98)Smokere Yes f NA NA NA
a Values are relative risk (95% confidence interval).b The urban population is the reference category.c Not overweight/obese is the reference category.d NA = not applicable.e Being a non-smoker is the reference category.f Because the prevalence of smoking among women was so low, smoking was not included in the analysis
for women.

311Bulletin of the World Health Organization | April 2006, 84 (4)
ResearchNawi Ng et al. Using STEPS to study risk factors in rural Indonesia
lesterol levels) should be initiated at the primaryscare level.30 Secondary prevention strategies should include interventions tailored to increase people’s awareness of raised blood pressure and to ensure that medicines are taken correctly. However, it is unlikely that a strategy aimed solely at increasing levels of awareness will bring about a measurable improvement.39,40 A broader communitysoriented prevention strategy, for example to try to encourage a reduction in salt consumption, should also be a priority in interventions to reduce blood pressure among the population.30
Clustering of risk factorsThis study suggests that obesity and hypertension tend to cluster among the urban population in general and among those in the richest quintile in rural areas when compared with those in the poorest rural quintile. The risk of cardiovascular disease increases signifisscantly as risk factors cluster.5–7 Health interventions that aim to control risk factors at the population level should be planned and implemented in order to slow the progress of the coming
epidemic in noncommunicable dissseases.41,42 The integrated management of risk factors at the level of the public health centre, as well as the promotion of healthy lifestyles — for example by encouraging people to stop smoking, eat well and engage in physical activity — are among the intervention strategies directed at controlling risk factors at the individual level and the population level.30 By providing information about the level of key risk factors for noncomssmunicable diseases, the WHO STEPS approach enables the appropriate taissloring of populationslevel interventions and those aimed at highsrisk groups. The continual nature of data collection using the STEPS approach allows for further monitoring of trends to evaluate the impact of interventions.14,30
ConclusionOur study reveals that the epidemiologisscal transition is occurring in Purworejo district, Indonesia. The rural populasstion already has a high burden of risk factors for noncommunicable diseases, especially smoking. The study shows
that the rural population is facing an increasing burden from hypertension, being overweight and being obese. The transition of risksfactor clustering from richer populations to poorer populasstions within a country should concern health authorities. It was feasible to use the WHO STEPS approach in our demographic surveillance setting, and it will allow for a better understanding of trends in risk factors over a longer pessriod. In future, the use of this approach will aid in developing a programme of integrated management of risk factors, which takes into consideration the unssequal distribution of risks occurring in different socioeconomic groups. O
Funding: The study was supported by a research grant from SIDA/SAREC Sweden (SWEs2000s303).
Competing interests: Ruth Bonita was among the group who initiated the work on the WHO STEPS approach. Nawi Ng participated in three STEPS meetings and has contributed to the development of STEPS.
Résumé
Facteurs de risque évitables de maladies transmissibles dans une zone rurale d’Indonésie : étude de prévalence par la méthode STEPS de l’OMSObjectif Afin de mieux comprendre la transition sanitaire en Indonésie, nous avons cherché à dresser un tableau de la prévalence et de la distribution des facteurs de risque de maladies non transmissibles et à évaluer le poids de ces facteurs dans une population rurale et une population urbaine.Méthodes En suivant le protocole de la méthode de surveillance STEPS de l’OMS, on a déterminé en 2001 les facteurs de risque de maladies non transmissibles chez 1502 hommes et 1461 femmes âgés de 15 à 74 ans sur le site de surveillance démographique du district de Purworejo.Résultats La prévalence du tabagisme était forte chez les hommes (913/1539; pourcentage pondéré = 53,9 %) dans la population rurale comme dans la population urbaine ; elle était quasiment nulle chez les femmes. Chez une proportion plus importante de la population urbaine, ainsi que dans le quintile le plus riche de la population rurale, on a relevé une tension artérielle élevée et ces sujets ont été classés comme présentant une surcharge pondérale ou une obésité comparativement à ceux
du quintile le plus pauvre de la population rurale. Les habitants de la zone rurale appartenant au quintile le plus riche avaient 1,5 fois plus de chances de présenter une HTA et 8 fois plus de présenter une surcharge pondérale que les ruraux du quintile le plus pauvre. L’accumulation des facteurs de risque était plus importante chez les sujets classés dans le quintile le plus riche de la population rurale que chez ceux qui appartenaient au quintile le plus pauvre de cette population et le risque d’une telle accumulation n’était que de 20 à 30 % inférieur à celui que l’on observait dans la population urbaine.Conclusion Les facteurs de risque de maladies non transmissibles pèsent d’un poids inégal dans les populations urbaines et rurales du district de Purworejo. Chez les ruraux les plus aisés, le poids de ces facteurs est déjà comparable à celui qu’on observe en milieu urbain. Grâce à l’application de la méthode STEPS de l’OMS, on a pu dresser un tableau complet de ces facteurs de risque, ce qui permettra de prendre les mesures sanitaires appropriées pour corriger les inégalités dans ce domaine.
312 Bulletin of the World Health Organization | April 2006, 84 (4)
ResearchUsing STEPS to study risk factors in rural Indonesia Nawi Ng et al.
Resumen
Factores de riesgo prevenibles de enfermedades no transmisibles en la Indonesia rural: estudio de prevalencia basado en el método progresivo PASOS de la OMSObjetivo A fin de comprender mejor la transición sanitaria en Indonesia, decidimos describir la prevalencia y distribución de los factores de riesgo de enfermedades no transmisibles y determinar la carga de factores de riesgo en una población rural y en una población urbana.Métodos Utilizando el protocolo del método progresivo de la OMS para la vigilancia (PASOS), en 2001 se determinaron los factores de riesgo de enfermedades no transmisibles en una muestra de 1502 hombres y 1461 mujeres de 15 a 74 años en el Centro de Vigilancia Demográfica de Purworejo.Resultados La prevalencia de tabaquismo era elevada entre los hombres (913/1539; porcentaje ponderado = 53,9,%) en las dos poblaciones, rural y urbana, mientras que era casi nula entre las mujeres. Entre la población urbana y el quintil más rico de la población rural, había una proporción mayor que presentaban hipertensión y sobrepeso u obesidad en comparación con el quintil más pobre de la población rural. Las personas clasificadas en el
quintil superior que vivían en la zona rural tenían 1,5 veces más probabilidades de sufrir hipertensión y 8 veces más probabilidades de tener sobrepeso que las del quintil más pobre de la zona rural. La acumulación de factores de riesgo fue mayor entre las personas clasificadas en el quintil más rico de la zona rural, en comparación con los clasificados en el quintil más pobre; y el riesgo de acumulación fue sólo un 20% - 30% inferior en comparación con la población urbana.Conclusión Las poblaciones rural y urbana de Purworejo padecen ambas una carga desigualmente distribuida de factores de riesgo de enfermedades no transmisibles. La carga en el grupo más acomodado de la zona rural ha alcanzado ya un nivel semejante al observado en la zona urbana. La aplicación del método PASOS de la OMS resultó viable, y permite obtener una imagen detallada de la carga de factores de riesgo, e implementar así intervenciones sanitarias apropiadas para corregir las desigualdades en materia de salud.
References 1. Murray CJL, Lopez AD. The global burden of disease: a comprehensive
assessment of mortality and disability from diseases, injuries, and risk factors in 1990 and projected to 2020. Cambridge (MA): Harvard University Press; 1996.
2. Gwatkin DR, Guillot M. The burden of disease among the global poor: current situation, future trends and implications for strategy. Washington (DC): International Bank for Reconstruction and Development, World Bank; 2000.
3. Grundy SM, Bazzarre T, Cleeman J, D’Agostino RB Sr, Hill M, Houston-Miller N, et al. Prevention conference V: beyond secondary prevention: identifying the high-risk patient for primary prevention: medical office assessment: Writing Group I. Circulation [serial on the Internet] 2000;101:e3. Available from: http://circ.ahajournals.org/cgi/content/full/101/1/e3
4. Schuit AJ, van Loon AJ, Tijhuis M, Ocke M. Clustering of lifestyle risk factors in a general adult population. Prev Med 2002;35:219-24.
5. Jousilahti P, Toumilehto J, Vartiainen E, Korhonen HJ, Pitkaniemi J, Nissinen A, et al. Importance of risk factor clustering in coronary heart disease mortality and incidence in eastern Finland. J Cardiovasc Risk 1995;2:63-70.
6. Yusuf HR, Giles WH, Croft JB, Anda RF, Casper ML. Impact of multiple risk factor profiles on determining cardiovascular disease risk. Prev Med 1998; 27:1-9.
7. Jonsson S, Hedblad B, Engstrom G, Nilsson P, Berglund G, Janzon L. Influence of obesity on cardiovascular risk: twenty-three-year follow-up of 22,025 men from an urban Swedish population. Int J Obes Relat Metab Disord 2002; 26:1046-53.
8. Chang M, Hahn RA, Teutsch SM, Hutwagner LC. Multiple risk factors and population attributable risk for ischemic heart disease mortality in the United States, 1971-1992. J Clin Epidemiol 2001;54:634-44.
9. Bartley M, Sacker A, Firth D, Fitzpatrick R. Understanding social variation in cardiovascular risk factors in women and men: the advantage of theoretically based measures. Soc Sci Med 1999;49:831-45.
10. Diez-Roux AV, Link BG, Northridge ME. A multilevel analysis of income inequality and cardiovascular disease risk factors. Soc Sci Med 2000; 50:673-87.
313Bulletin of the World Health Organization | April 2006, 84 (4)
ResearchNawi Ng et al. Using STEPS to study risk factors in rural Indonesia
11. Torun B, Stein AD, Schroeder D, Grajeda R, Conlisk A, Rodriguez M, et al. Rural-to-urban migration and cardiovascular disease risk factors in young Guatemalan adults. Int J Epidemiol 2002;31:218-26.
12. Sobal J, Stunkard AJ. Socioeconomic status and obesity: a review of the literature. Psychol Bull 1989;105:260-75.
13. Colhoun HM, Hemingway H, Poulter NR. Socio-economic status and blood pressure: an overview analysis. J Hum Hypertens 1998;12:91-110.
14. Bonita R, deCourten M, Dwyer T, Jamrozik K, Winkelmann R. Surveillance of risk factors for noncommunicable disease: the WHO STEPwise approach. Geneva: World Health Organization; 2002. WHO document WHO/NMH/CCS/01.2002.
15. Wilopo SA. Key issues on the research design, data collection, and management in Community Health and Nutrition Research Laboratory (CHN-RL) Purworejo Demographic Surveillance System (DSS). Jogjakarta: CHN-RL Faculty of Medicine, Gadjah Mada University; 1997.
16. Ng N, Minh HV, Tesfaye F, Bonita R, Byass P, Stenlund H, et al. Combining risk factors and demographic surveillance — potentials of WHO STEPS and INDEPTH methodologies for assessing epidemiological transition. Scand J Public Health. In press.
17. Ministry of Health, Indonesia. Indonesia health profile 2001. Jakarta: Ministry of Health, Indonesia; 2002.
18. World Health Organization. Obesity: preventing and managing the global epidemic. Geneva: World Health Organization; 2000 (WHO Technical Report Series No. 894).
19. Perloff D, Grim C, Flack J, Frohlich ED, Hill M, McDonald M, et al. Human blood pressure determination by sphygmomanometry. Circulation 1993; 885:2460-70.
20. Whitworth JA. 2003 World Health Organization (WHO)/International Society of Hypertension (ISH) statement on management of hypertension. J Hypertens 2003;21:1983-92.
21. Ganiwijaya T, Sjukrudin E, De Backer G, Suhana D, Brotoprawiro S, Sukandar H. Prevalence of cigarette smoking in a rural area of West Java, Indonesia. Tob Control 1995;4:335-7.
22. Barraclough S. Women and tobacco in Indonesia. Tob Control 1999;8:327-32. 23. The Global Youth Tobacco Survey Collaborative Group. Tobacco use among
youth: a cross country comparison. Tob Control 2002;11:252-70. 24. Lopez AD, Collishaw NE, Piha T. A descriptive model of the cigarette epidemic
in developed countries. Tob Control 1994;3:242-7. 25. US Department of Health and Human Services. The health consequences
of smoking: a report of the Surgeon General. Atlanta (GA): US Department of Health and Health Services, Centers for Disease Control and Prevention; 2004.
26. Kraus-Schmitz J, Waller M. Smoking: prevalence, knowledge, and attitudes among junior high-school students in Jogjakarta Municipality, Jogjakarta Province and Purworejo District, Central Java Province, Indonesia. Umeå: Umeå University; 2003.
27. Smet B, Maes L, De Clercq L, Haryanti K, Winarno RD. Determinants of smoking behaviour among adolescents in Semarang, Indonesia. Tob Control 1999;8:186-91.
28. Lau RR, Quadrel MJ, Hartman KA. Development and change of young adults’ preventive health beliefs and behavior: influence from parents and peers. J Health Soc Behav 1990;31:240-59.
29. Achadi A, Soerojo W, Barber S. The relevance and prospects of advancing tobacco control in Indonesia. Health Policy 2005;72:333-49.
30. World Health Organization. The world health report 2003: shaping the future. Geneva: WHO; 2003.
31. Winkvist A, Nurdiati DS, Stenlund H, Hakimi M. Predicting under- and overnutrition among women of reproductive age: a population-based study in central Java, Indonesia. Public Health Nutr 2000;3:193-200.
32. Reddy KS, Prabhakaran D, Shah P, Shah B. Differences in body mass index and waist: hip ratios in north Indian rural and urban populations. Obes Rev 2002;3:197-202.
33. Caballero B. Obesity in developing countries: biological and ecological factors. J Nutr 2001;131 Suppl:S866-70.
34. Lipoeto NI, Wattanapenpaiboon N, Malik A, Wahlqvist ML. Nutrition transition in west Sumatra, Indonesia. Asia Pacific J Clin Nutr 2004;13:312-6.
35. Ball K, Mishra GD, Crawford D. Social factors and obesity: an investigation of the role of health behaviours. Int J Obes Relat Metab Disord 2003; 27:394-403.
36. Singh RB, Suh IL, Singh VP, Chaithiraphan S, Laothavorn P, Sy RG, et al. Hypertension and stroke in Asia: prevalence, control and strategies in developing countries for prevention. J Hum Hypertens 2000;14:749-63.
37. SarrafZadegan N, AminiNik S. Blood pressure pattern in urban and rural areas in Isfahan, Iran. J Hum Hypertens 1997;11:425-8.
38. Van der Sande MA, Milligan PJ, Nyan OA, Rowley JT, Banya WA, Ceesay SM, et al. Blood pressure patterns and cardiovascular risk factors in rural and urban Gambian communities. J Hum Hypertens 2000;14:489-96.
39. MacMahon S, Neal B, Rodgers A. Hypertension–time to move on. Lancet 2005;365:1108-9.
40. Jackson R, Lawes CM, Bennett DA, Milne RJ, Rodgers A. Treatment with drugs to lower blood pressure and blood cholesterol based on an individual’s absolute cardiovascular risk. Lancet 2005;365:434-41.
41. Puska P, Tuomilehto J, Nissinen A, Vartiainen E. The North Karelia Project: 20 years results and experiences. Helsinki: The National Public Health Institute (KTL); 1995.
42. Weinehall L, Hellsten G, Boman K, Hallmans G, Asplund K, Wall S. Can a sustainable community intervention reduce the health gap? 10-year evaluation of a Swedish community intervention program for the prevention of cardiovascular disease. Scand J Public Health 2001;56:59-68.
Related Documents