High b-value diffusion imaging of dementia: Application to vascular dementia and alzheimer disease Orna Mayzel-Oreg a , Yaniv Assaf b , Ariela Gigi b , Dafna Ben-Bashat b , Ruth Verchovsky c , M. Mordohovitch c , M. Graif b , Talma Hendler b , Amos Korczyn c,d , Yoram Cohen a, ⁎ a School of Chemistry, The Sackler Faulty of Exact Sciences, Tel Aviv University, Ramat Aviv, Tel Aviv 69978, Israel b Wohl Institute for Advanced Imaging, Tel Aviv Sourasky Medical Center, Tel Aviv, 64239, Israel c Department of Neurology, Tel Aviv Sourasky Medical Center, Tel Aviv, 64239, Israel d Sackler Faculty of Medicine, Tel Aviv University, Tel Aviv, 69978, Israel Available online 23 March 2007 Abstract Alzheimer's disease (AD) and Vascular Dementia (VaD) are the most common types of dementia and are progressive diseases affecting millions of people. Despite the high sensitivity of MRI to neurological disorders it has not thus far been found to be specific for the detection of either of these pathologies. In the present study high b-value q-space diffusion-weighted MRI (DWI) was applied to VaD and AD. Controls (N =4), VaD patients (N = 8) and AD patients (N = 6) were scanned with high b-value DWI, which emphasizes the water component which exhibits restricted diffusion. VaD patients were found to present major WM loss while, in AD, the major pathology found was GM changes, as expected. Also, WM changes in VaD and AD were of a different pattern, more specific to frontal and temporal areas in AD and more widespread in VaD. This pattern of WM changes may be utilized as a diagnosis criterion. Conventional diffusion tensor imaging did not show significant changes between either of the groups and controls. These results demonstrate the potential of high b-value DWI in the diagnosis of dementia. © 2007 Elsevier B.V. All rights reserved. Keywords: MRI; Alzheimer's disease; Vascular dementia; Dementia; DTI; Diffusion MRI; DWI; q-Space; high-b 1. Introduction Alzheimer's disease (AD) and vascular dementia (VaD) are considered the two leading forms of dementia. AD is assumed to be a diffuse cortical dementia that preferentially involves the temporal and parietal brain regions [1]. AD affects nearly 50% of demented patients and is a severe social problem in developed countries, affecting nearly half of the people of 85 years of age [1]. VaD is a group of dementing disorders arising from various vascular etiologies [2]. VaD is a progressive disease with either repeated strokes or gradual involvement of small vessels causing lacunar infarctions in the basal ganglia and diffuse changes in the white matter [1]. AD and VaD together are considered responsible for about 80% of all dementia cases [3]. Despite the high sensitivity of magnetic resonance imaging (MRI) to neurological disorders, it is not specific for the detection of dementia. Also, poor correlation was found between conventional MRI (T 1 ,T 2 ) and the cognitive decline associated with dementia [4,5]. Temporal and parietal brain atrophy is usually found in AD, with signal abnormal- ities in the periventricular WM, but these abnormalities do not usually exceed what is seen in a population of the same age [1]. Many VaD patients show multiple ischemic lesions, cortical and subcortical. However, not all such lesions are symptomatic. In VaD, as in other pathologies, many patients present periventricular hyperintensities (Leukoariosis), but these are not specific to any specific pathology, especially in younger age groups [6]. In addition, a postmortem study [7] Journal of the Neurological Sciences 257 (2007) 105 – 113 www.elsevier.com/locate/jns ⁎ Corresponding author. Tel.: +972 3 6407232; fax: +972 3 6409293. E-mail address: [email protected] (Y. Cohen). 0022-510X/$ - see front matter © 2007 Elsevier B.V. All rights reserved. doi:10.1016/j.jns.2007.01.048

Welcome message from author
This document is posted to help you gain knowledge. Please leave a comment to let me know what you think about it! Share it to your friends and learn new things together.
Transcript
nces 257 (2007) 105–113www.elsevier.com/locate/jns
Journal of the Neurological Scie
High b-value diffusion imaging of dementia: Application to vasculardementia and alzheimer disease
Orna Mayzel-Oreg a, Yaniv Assaf b, Ariela Gigi b, Dafna Ben-Bashat b, Ruth Verchovsky c,M. Mordohovitch c, M. Graif b, Talma Hendler b, Amos Korczyn c,d, Yoram Cohen a,⁎
a School of Chemistry, The Sackler Faulty of Exact Sciences, Tel Aviv University, Ramat Aviv, Tel Aviv 69978, Israelb Wohl Institute for Advanced Imaging, Tel Aviv Sourasky Medical Center, Tel Aviv, 64239, Israel
c Department of Neurology, Tel Aviv Sourasky Medical Center, Tel Aviv, 64239, Israeld Sackler Faculty of Medicine, Tel Aviv University, Tel Aviv, 69978, Israel
Available online 23 March 2007
Abstract
Alzheimer's disease (AD) and Vascular Dementia (VaD) are the most common types of dementia and are progressive diseases affectingmillions of people. Despite the high sensitivity of MRI to neurological disorders it has not thus far been found to be specific for the detectionof either of these pathologies. In the present study high b-value q-space diffusion-weighted MRI (DWI) was applied to VaD and AD.Controls (N=4), VaD patients (N=8) and AD patients (N=6) were scanned with high b-value DWI, which emphasizes the water componentwhich exhibits restricted diffusion. VaD patients were found to present major WM loss while, in AD, the major pathology found was GMchanges, as expected. Also, WM changes in VaD and AD were of a different pattern, more specific to frontal and temporal areas in AD andmore widespread in VaD. This pattern of WM changes may be utilized as a diagnosis criterion. Conventional diffusion tensor imaging did notshow significant changes between either of the groups and controls. These results demonstrate the potential of high b-value DWI in thediagnosis of dementia.© 2007 Elsevier B.V. All rights reserved.
Keywords: MRI; Alzheimer's disease; Vascular dementia; Dementia; DTI; Diffusion MRI; DWI; q-Space; high-b
1. Introduction
Alzheimer's disease (AD) and vascular dementia (VaD)are considered the two leading forms of dementia. AD isassumed to be a diffuse cortical dementia that preferentiallyinvolves the temporal and parietal brain regions [1]. ADaffects nearly 50% of demented patients and is a severesocial problem in developed countries, affecting nearly halfof the people of 85 years of age [1]. VaD is a group ofdementing disorders arising from various vascular etiologies[2]. VaD is a progressive disease with either repeated strokesor gradual involvement of small vessels causing lacunar
⁎ Corresponding author. Tel.: +972 3 6407232; fax: +972 3 6409293.E-mail address: [email protected] (Y. Cohen).
0022-510X/$ - see front matter © 2007 Elsevier B.V. All rights reserved.doi:10.1016/j.jns.2007.01.048
infarctions in the basal ganglia and diffuse changes in thewhite matter [1]. AD and VaD together are consideredresponsible for about 80% of all dementia cases [3].
Despite the high sensitivity of magnetic resonanceimaging (MRI) to neurological disorders, it is not specificfor the detection of dementia. Also, poor correlation wasfound between conventional MRI (T1, T2) and the cognitivedecline associated with dementia [4,5]. Temporal and parietalbrain atrophy is usually found in AD, with signal abnormal-ities in the periventricular WM, but these abnormalities donot usually exceed what is seen in a population of the sameage [1]. Many VaD patients show multiple ischemic lesions,cortical and subcortical. However, not all such lesions aresymptomatic. In VaD, as in other pathologies, many patientspresent periventricular hyperintensities (Leukoariosis), butthese are not specific to any specific pathology, especially inyounger age groups [6]. In addition, a postmortem study [7]

106 O. Mayzel-Oreg et al. / Journal of the Neurological Sciences 257 (2007) 105–113
found no association between the extent of periventricularWM hyperintensities and AD or stroke.
Diffusion-weighted MRI (DWI) is a valuable tool forobtaining contrast, studying structures, and characterizingpathologies in the central nervous system [8,9]. DWI anddiffusion tensor imaging (DTI) have been used to studywhite matter (WM) changes in many neurological disorders,including dementia [10,11]. In VaD, those studies showed anADC increase and low diffusion anisotropy, indicative ofcellular disintegration [12] in areas of leukariosis, but thesefindings did not correlate with the clinical condition of thesubjects [2,13]. In AD, some loss of WM tract integrity inassociation fibers was found using DTI [14], presumed to besecondary to Wallerian degeneration of fiber tracts in corticalassociation areas [15]. There has been some controversyregarding changes of diffusion anisotropy in AD patients.Some found that AD patients demonstrated reducedanisotropy in the posterior WM [16], and reduced anisotropyin the temporal lobe, anterior and posterior cingulate bundlesand posterior portion of the corpus collosum [17] but theirfindings did not correlate with dementia severity. Yoshiuraand coworkers, for example, found a significant correlationbetween the Mini-Mental State Evaluation (MMSE) scoreand mean diffusivity and also the three eigen values but notFA [18], and Bozzali et al. found a good correlation betweenthe MMSE and diffusivity as well as FA [15]. ConventionalDWI and DTI (b≤1500 s/mm2) are generally considered tobe sensitive to all water components in the studied tissue. So,if the pathologies we expect to encounter involve only onecompartment, the effect is averaged and not alwaysdetectible, although some pathologies, such as stroke[19,20] are reliably detected by DWI for example.
High b-value DWI is highly sensitive to WM changes.The signal decay at high b-values (bN3000 s/mm2) DWIdeviates from mono exponential behavior [21,22,23]. Theapparent slow diffusing component, observed in neuronaltissues, seems to originate, at least partially, from watermolecules exhibiting restricted diffusion. This restrictedpopulation is thought to mainly represent water in the intra-axonal compartment. This tentative assignment is based onthe facts that this water component appears restricted to acompartment size of a few microns and is found to be moreabundant in WM than in GM [24]. In addition, thedisplacement of this component was found to barely changewhen the diffusion time is increased [24,25]. Due to the non-mono-exponential nature of the water signal decay at highb-values, different approaches to it's analysis were developed[21,23,26,27], including the q-space approach [28], origi-nally developed by Cory and Callaghan [29,30]. Indeed, highb-value q-space DWI was used to study WMmaturation [31],degeneration [32], and spinal cord trauma [33]. For example,diffusion images, when analyzed using the q-space approach,show areas of abnormal WM in multiple sclerosis (MS) notdetected by other MRI methods like T2-, T1-weightedimaging, FLAIR, and DTI [34,28]. In addition, high b-valueq-space DWI was shown to have an improved detectability in
experimental allergic encephalomyelitis (EAE) as comparedwith conventional MRI [35]. In this work we sought to applyhigh b-value q-space analyzed DWI to VaD and AD. In VaD,mainly WM deterioration was presumed to occur, while inAD the main pathology was presumed to be in the GM, with avariable amount of the WM pathology. The signal decay athigh b-values reveals a slow decaying component that washypothesized to allow differentiation between WM and GMeffects.
2. Methods and materials
2.1. Subjects
MRI scans were acquired from six patients diagnosedwith probable AD and eight patients diagnosed withprobable VaD. The patients were diagnosed and evaluatedby two neurologists. Four normal healthy subjects served ascontrols. The average age of the AD group was 74±10, ofthe VaD group 69±8, and of the controls was 61±4. Thecontrol subjects had no history of neuronal disease. The localInstitutional Review Board (IRB) committee approved theMRI protocol, and informed consent was obtained from eachsubject (AD, VaD patients and controls).
2.2. MRI methods
Imaging was performed on a 1.5T GE Signa horizon echospeed LX MRI scanner (GE, Milwaukee, WI, USA). Thepatient's head was fixed with foam pads to reduce motionduring the imaging process. The MRI protocol included thefollowing clinical imaging procedures: fluid attenuatedinversion recovery (FLAIR) images (TR/TE/TI=8000/120/2000 ms), fast spin-echo T2-weighted images (TR/TE=5300/102 ms) and inversion recovery T1-weighted images(TR/TE/TI=1500/9/700 ms). The protocol also included theacquisition of a set of 16 diffusion-weighted spin-echo EPIimages in which the diffusion gradient was incrementedlinearly from 0 to 2.2 G/cm to reach a maximum b-value of14,000 s/mm2. This set of diffusion images was acquired forsix gradient directions (xy, xz, yz,− xy,− xz, y − z). Five axialslices were selected— one at the level of the mid body of thecorpus callosum (identified from a mid-saggital view), twobelow it, and two above it with a slice thickness of 5 mm(with 1-mm gap between slices) and a matrix dimension of128×128 (interpolated to 256×256 with final resolution of0.9×0.9 mm2). Other parameters of these experiments wereas follows: TR/TE=2000/178 ms, Δ/δ=71/65 ms and thenumber of averages was 4. The duration of the entire MRIprotocol was approximately 50 min. The high b-value proto-col itself lasted ∼20 min.
A DTI data set was also acquired using a spin-echo DW–EPI sequence with the following parameters: TR/TE=6000/90 ms, Δ/δ=31/25 ms, gmax of 2.2 G/cm (where gmax is themaximal value of the diffusion gradient pulse),a matrixdimension of 128×128 (interpolated to 256×256), with 4

Table 1Histogram analysis of the WM peak in displacement maps of controls, VaDpatients and AD patients
Control VaD AD
Area 8.54±2.40 3.03±2.11 4.39±2.29( pb0.005) ( pb0.05)
Peak center (μm) 4.06±0.35 5.26±0.19 4.70±0.62( pb0.001) (NS)
Width at half height 2.08±0.32 2.29±0.68 2.33±0.56(NS) (NS)
Height 3.26±0.80 0.93±0.53 1.55±0.80( pb0.0001) ( pb0.01)
NS stands for non-significant. All results presented as average±standarddeviation. Tests were marked significant for pb0.05 in comparison with thecontrol group.
Table 2Histogram analysis of the GM peak in displacement maps of controls, VaDpatients and AD patients
Control VaD AD
Area 14.45±0.78 12.00±2.59 (NS) 12.23±2.36 (NS)Peak center (μm) 8.04±0.47 8.26±0.42 (NS) 7.94±0.75 (NS)Width at half height 3.64±0.86 2.86±0.65 (NS) 3.22±0.76 (NS)Height 3.26±0.50 3.40±0.64 (NS) 3.09±0.63 (NS)
NS stands for non-significant. All results presented as average±standarddeviation. Tests were marked significant for pb0.05 in comparison with thecontrol group.
Table 3Histogram analysis of the CSF peak in displacement maps of controls, VaDpatients and AD patients
Control VaD AD
Area 2.65±0.69 8.72±2.76( pb0.005)
5.80±1.30( pb0.005)
Peak center (μm) 13.40±0.56 11.66±0.77( pb0.005)
12.65±0.61(NS)
Width at half height 3.67±0.80 6.22±1.13( pb0.005)
5.14±2.22(NS)
Height 0.58±0.06 1.11±0.27( pb0.005)
0.85±0.18( pb0.05)
NS stands for non-significant. All results presented as average±standarddeviation. Tests were marked significant for pb0.05 in comparison with thecontrol group.
107O. Mayzel-Oreg et al. / Journal of the Neurological Sciences 257 (2007) 105–113
averages and 24 slices (5 of them being aligned in the sameposition as the q-space imaging slices). The diffusion imageswere acquired along the aforementioned diffusion gradientdirections with a maximal b-value of 1000 s/mm2. The DTIdata set consisted of seven images (six diffusion images andone with no applied diffusion gradients). The totalacquisition time for the DTI data set was 3 min.
2.3. Image processing
Fractional anisotropy (FA) images were produced fromthe diffusion tensor imaging data set as described previously[36]. q-space analysis of the high b-value diffusion data waspreformed on a pixel-by-pixel basis as described previously[31,34,28]. For each image pixel, the diffusion signal decaywas transformed into displacement distribution profiles(using Fourier transformation), to produce the displace-ment–distribution profile for each pixel in the images (formore details see Fig. 13 in Ref. [28]). Two images werecalculated from the imaging data: an apparent displacementimage (subsequently referred to as the displacement image)and an apparent probability for zero displacement image(subsequently referred to as the probability image). Theapparent displacement images were calculated from the full-width at half height (FWHH) of the displacement distribu-tion profile and the probability images were calculated fromthe peak height of the displacement distribution profile foreach pixel. As the short gradient pulse (SGP) approximationcannot be met using a clinical imaging system, only apparentmean displacement and probability for zero displacementcan be determined. It should be noted that our data was notcorrected for head movement of cardiac pulsation.
2.4. Data analysis
Histogram analysis of the displacement maps resulted inthree peaks for the control data sets, as did the probabilitymaps. In the displacement maps one peak was centeredaround 12 μm and most probably represents the CSF, secondpeak centered around 8 μm was assigned to the gray matterand the third peak, centered around 4 μm was assigned to the
white matter (see control values in Tables 1–3). Usingspectral analysis (which fits the histogram to pre-determinedGaussian shaped peaks, provided by Origin ©), data of peakcenter, width at half height, and area were calculated for thedisplacement and probability data. In order to compare highb-values with conventional FA maps extracted from DTIwe created anisotropy maps based on the anisotropy from theq-space images. We used the 6 displacement images asinput for a tensor-like analysis from which we calculated theq-space displacement anisotropy index. DTI histogramswere not analyzed using spectral analysis as no separation ofWM and GM was achieved. All results are presented as themean±standard deviation. A paired t-test was used to com-pare the parametric variables, with a value of pb0.05considered significant. In addition, correlation analysis wasperformed between the histograms of the different pa-tients groups (AD, VaD and control) for each parameter(FA, probability and displacement) in order to test forsimilarity between the indices.
2.5. Psychiatric evaluation
Evaluation of all AD and VaD patients was performedusing the MMSE, which is the most widely used standard-ized cognitive screening test for assessing dementia [37].Although, it was never meant to be used for the diagnosis ofdementia, the MMSE has been extensively used in the fieldof dementia [38]. The benefits of the MMSE include its
Fig. 1. A representative healthy volunteers (female age 59) data set, including (A) FLAIR image, (B) ADC map, (C) DTI FA image, (D) q-space displacementimage, (E) q-space probability image and (F) displacement anisotropy map, all for one representative slice. (For interpretation of the references to colour in thisfigure legend, the reader is referred to the web version of this article.)
108 O. Mayzel-Oreg et al. / Journal of the Neurological Sciences 257 (2007) 105–113
brevity (10–15 min to administer), and the fact that it is aglobal assessment of many cognitive and mental domainsincluding: orientation to time and place perception, memory,attention, and language. The standardized MMSE has been
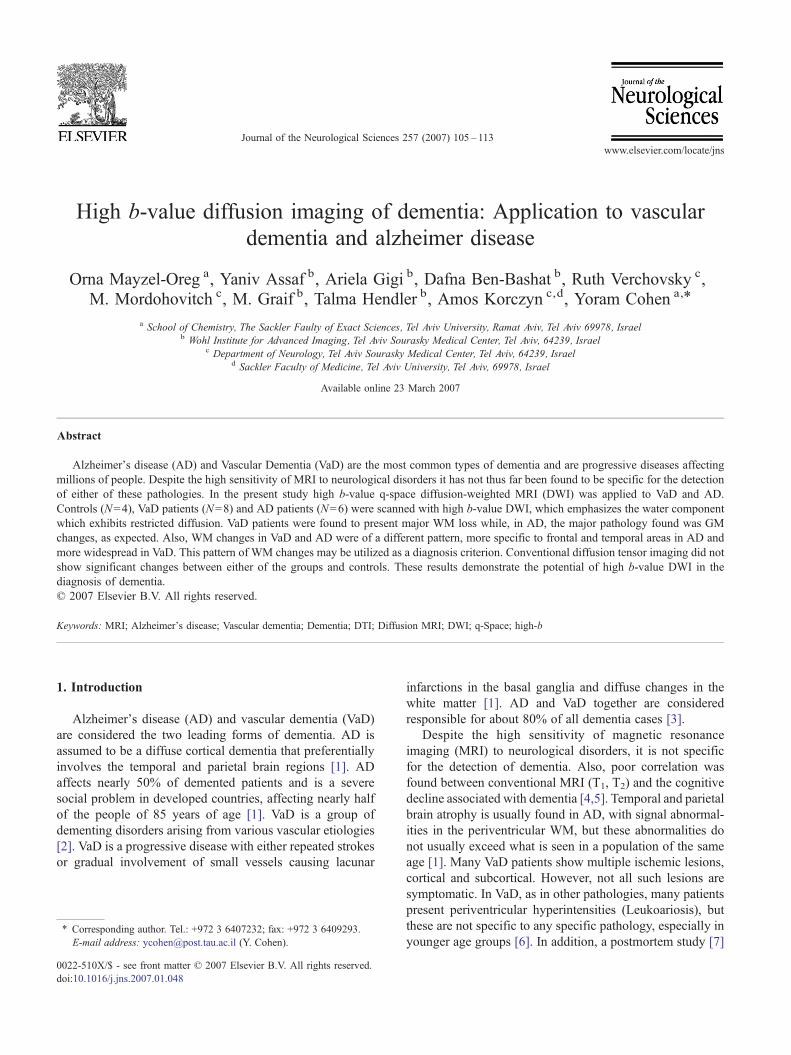
Fig. 2. A data set for a VaD patient (male, age 76 MMSE 20), including (A) FLAIR(E) q-space probability image and (F) displacement anisotropy map, all for one replegend, the reader is referred to the web version of this article.)
used to look at disease progression as well as relating it toareas of functional impairment. In AD, it is quite establishedto use scores ranging from 25–30 for controls, 21–24 formild AD, 14–20 for moderate AD, and less than 13 in severe
image, (B) ADC map, (C) DTI FA image, (D) q-space displacement image,resentative slice. (For interpretation of the references to colour in this figure

109O. Mayzel-Oreg et al. / Journal of the Neurological Sciences 257 (2007) 105–113
AD. It is a useful tool in the initial assessment as well as theongoing follow-up of patients with AD [39].
3. Results
Fig. 1 shows a representative healthy volunteer's data set,including a FLAIR image (Fig. 1A), an ADC map (Fig. 1B),a DTI FA image (Fig. 1C), q-space displacement (Fig. 1D)and probability images (Fig. 1E), and a displacementanisotropy map (Fig. 1F), all for one representative slice(female, age 59). The FLAIR image (Fig. 1A) shows theanatomy, with no significant neuroradiological abnormali-ties. Neither does the ADC map (Fig. 1B), which doesn'tgive good WM/GM contrast. The FA map howeverhighlights areas of WM, which appear as white, as expectedfor a healthy subject, with no abnormalities apparent(Fig. 1C). The probability image (Fig. 1E) shows healthyWM with control values similar to our database, as does thedisplacement image (Fig. 1D, Table 1). The displacementand probability images (Fig. 1D and E, respectively) alsoshow the expected values for healthy GM (Table 2), andTable 3 shows displacement and probabilities values forcontrol CSF. The displacement anisotropy map (Fig. 1F) alsohighlights the areas of WM, as does the FA map, whilegiving better contrast to GM areas than the FA map.
In Fig. 2, a matching data set is shown for a VaD patient(male, age 76 MMSE 20). The ADC map (Fig. 2B) showsthe WM ADC to be slightly elevated. Some areas ofperiventricular hyperintensity can be observed in the FLAIRimages (Fig. 2A). These areas appear in the FA and q-spacedisplacement maps as areas of reduced diffusion anisotropy(Fig. 2C and D, respectively). However, in the displacementimage (Fig. 2D), not only do those areas of FLAIRhyperintensities appear as areas of increased displacement(WM areas appear bluish in Fig. 2D instead of the orange-redof control healthy WM areas in Fig. 1D, for example), butsome WM areas that appear normal in the FLAIR and FAmaps also show increased displacement, although to a lesserdegree (exhibited in the shift to dark blue from orange-redcolor, see Fig. 2D). The same trends appear in the probabilityimage of the patient with the FLAIR hyperintensity. Areas in
Fig. 3. (A) Average displacement histogram for controls and VaD patients. The hisgreen in all graphs. (B) Average probability histogram for controls and VaD patientsb-value conventional DTI. (For interpretation of the references to colour in this fig
the probability image show decreased probability (colorchanging to orange-red (Fig. 2E) from blue in the healthycontrol (Fig. 1E)), and some normal appearing WM(NAWM) areas also show, though to a lesser degree,decreased probability. The displacement anisotropy map(Fig. 2F) shows the same trends as the FA map, showingreduced anisotropy in areas of leukariosis, with bettercontrast for GM and WM areas with reduced anisotropy.
Fig. 3A–C shows the average displacement, probability,and FA histograms for all controls and VaD patients studied,respectively. The q-space displacement histogram of thecontrols (Fig. 3A, black squares) shows three peaksrepresenting: WM (centered at 4.06±0.35 μm), GM(centered at 8.04±0.47 μm), and CSF (centered at 13.40±0.56 μm). When we look at the average displacementhistogram for the VaD patients (Fig. 3A, green circles, we seethat the WM peak has declined significantly (see Table 1,from a peak height of 3.26±0.80 for controls to 0.93±0.53for VaD patients) and the average displacement has shiftedsignificantly to 5.26±0.19 μm (see also Table 1) while theGM peak appears increased, although not significantly(Table 2). There is also a significant increase at the CSFpeak height, from 0.58±0.06 for controls to 1.11±0.27 forVaD patients, and a shift in it's center from 13.40±0.56 forcontrols to 11.66±0.77 in VaD. Generally, the displacementof VaD patients differs from that of control subjects in theWM peak area. Indeed, a dramatic decrease appears in theWM peak area (from 8.54±2.40 to 3.03±2.11, pb0.005, seeTable 1). The other tissue type showing significant change inthe area of the displacement is the CSF (in the range from10 μm to 16 μm). The changes in the q-space probabilityhistogram of the VaD patients vs. controls (Fig. 3B) followthe same trends as the displacement histogram changes. Theaverage probability histograms show changes in theWM areaand CSF areas, like in the displacement histograms. Fig. 3C,in contrast, shows that the FA histograms of the VaD patients,obtained from conventional DTI, overlapmuchmore with theFA histogram of the controls.
Fig. 4 shows a similar data set for an AD patient (female,age 55). Some areas of periventricular hyperintensity can beobserved in the FLAIR image (Fig. 4A). These areas appear
togram of the controls appears in black while the VaD histogram appears in. (C) Average FA histogram for controls and VaD patients obtained from lowure legend, the reader is referred to the web version of this article.)
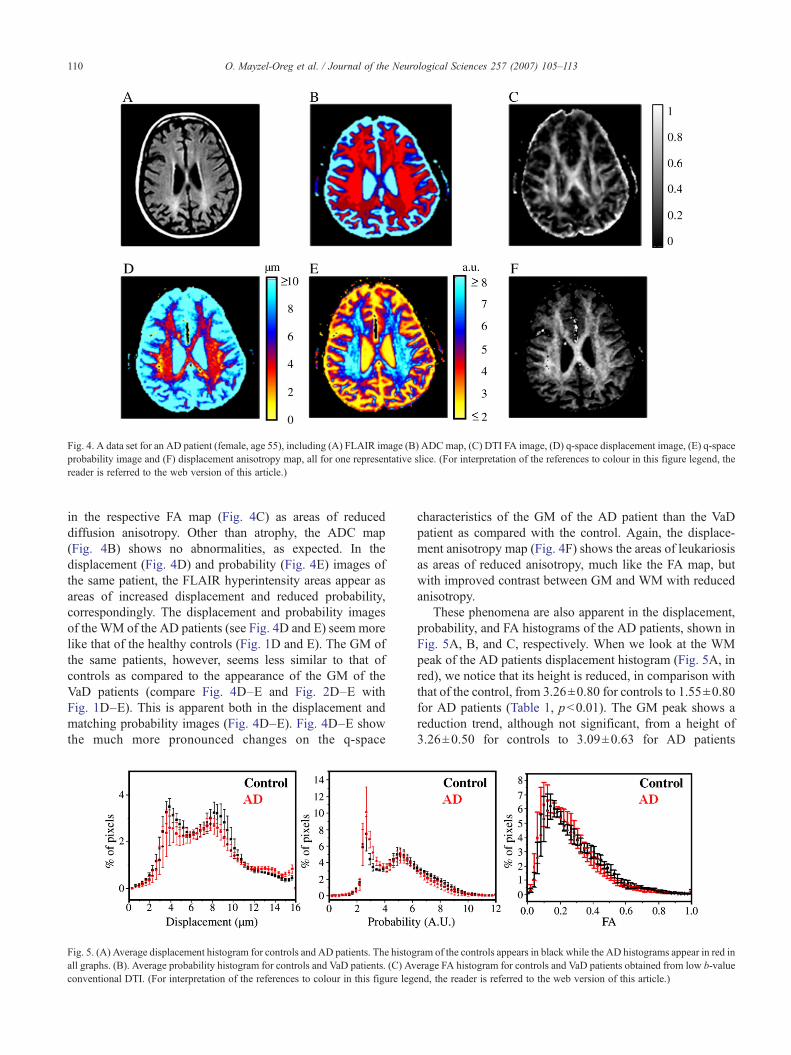
Fig. 4. A data set for an AD patient (female, age 55), including (A) FLAIR image (B) ADCmap, (C) DTI FA image, (D) q-space displacement image, (E) q-spaceprobability image and (F) displacement anisotropy map, all for one representative slice. (For interpretation of the references to colour in this figure legend, thereader is referred to the web version of this article.)
110 O. Mayzel-Oreg et al. / Journal of the Neurological Sciences 257 (2007) 105–113
in the respective FA map (Fig. 4C) as areas of reduceddiffusion anisotropy. Other than atrophy, the ADC map(Fig. 4B) shows no abnormalities, as expected. In thedisplacement (Fig. 4D) and probability (Fig. 4E) images ofthe same patient, the FLAIR hyperintensity areas appear asareas of increased displacement and reduced probability,correspondingly. The displacement and probability imagesof the WM of the AD patients (see Fig. 4D and E) seem morelike that of the healthy controls (Fig. 1D and E). The GM ofthe same patients, however, seems less similar to that ofcontrols as compared to the appearance of the GM of theVaD patients (compare Fig. 4D–E and Fig. 2D–E withFig. 1D–E). This is apparent both in the displacement andmatching probability images (Fig. 4D–E). Fig. 4D–E showthe much more pronounced changes on the q-space
Fig. 5. (A) Average displacement histogram for controls and AD patients. The histogall graphs. (B). Average probability histogram for controls and VaD patients. (C) Avconventional DTI. (For interpretation of the references to colour in this figure leg
characteristics of the GM of the AD patient than the VaDpatient as compared with the control. Again, the displace-ment anisotropy map (Fig. 4F) shows the areas of leukariosisas areas of reduced anisotropy, much like the FA map, butwith improved contrast between GM and WM with reducedanisotropy.
These phenomena are also apparent in the displacement,probability, and FA histograms of the AD patients, shown inFig. 5A, B, and C, respectively. When we look at the WMpeak of the AD patients displacement histogram (Fig. 5A, inred), we notice that its height is reduced, in comparison withthat of the control, from 3.26±0.80 for controls to 1.55±0.80for AD patients (Table 1, pb0.01). The GM peak shows areduction trend, although not significant, from a height of3.26±0.50 for controls to 3.09±0.63 for AD patients
ram of the controls appears in black while the AD histograms appear in red inerage FA histogram for controls and VaD patients obtained from low b-valueend, the reader is referred to the web version of this article.)

111O. Mayzel-Oreg et al. / Journal of the Neurological Sciences 257 (2007) 105–113
(Table 2). There is an increase in the amount of pixelsnow assigned as CSF with very high displacement, i.e.12–14 μm, from a peak area of 2.65±0.69 for controls to5.80±1.30 for AD patients (Table 3, pb0.005). This is aresult of the increase in the mean displacement of theGM and the infiltration of CSF and brain atrophy. Fig. 5Bthat presents the probability histograms of the control andthe AD groups show the same trend. The FA histogramsof these two groups, however, appear very similar (Fig. 5C).
The histogram analysis of the displacement maps ofcontrols, VaD patients, and AD patients is detailed in Tables1–3. Probability data was analyzed but is not shown due toredundancy in the results. In the displacement histograms,the area of the WM peak (Table 1) in VaD patients decreasesfrom 8.54±2.40 for controls to 3.03±2.11 ( pb0.005) forVaD patients. In some VaD patients, the WM peak almostcompletely disappears. For AD patients there is a smallerdecrease in WM peak area to 4.39±2.29 ( pb0.05), but nopatient displays complete loss of WM peak. The center of theWM peak in controls appears at 4.06±0.35 μm, while forVaD patients it is shifted to 5.26±0.19 μm ( pb0.001). InAD patients the effect is smaller, with the peak shiftinginsignificantly to 4.70±0.62 μm.
The GM peak in the displacement histograms (Table 2)doesn't present significant changes in either VaD or AD, inany of the parameters. The CSF peak (Table 3) shows anincrease in its area in dementia patients increasing from 2.65±0.69 in controls to 8.72±2.76 ( pb0.005) and 5.80±1.30( pb0.005) in AD and VaD patients, respectively. The centerof the CSF peak is also shifted significantly in VaD, from13.40±0.56 for controls to 11.66±0.77 for VaD patients( pb0.005) but not for AD patients where the CSF peak ispositioned at 12.65±0.61.
Correlation analysis of the DTI of the different groups(Table 4) showed that the DTI values for both the VaD groupand the AD group were well correlated with control values(R=0.993 and R=0.997 respectively). The values for thedisplacement analysis were poorly correlated, with acorrelation of R=0.850 between the AD group and thecontrol group and a worse correlation between the VaDgroup and controls (R=0.622). The probability values werealso not well correlated between the AD group and controls,and the VaD group and controls, with the later groupshowing poorer correlation, as was the case for thedisplacement values. The data for the displacement analysiswere least correlated, explaining it's better utility as ascreening method for the data.
Table 4Correlation analysis of the DTI, displacement, and probability graphs of thecontrols, VaD patients and AD patients
Displacement Probability DTI
AD R=0.8500 R=0.951 R=0.997pb0.001 pb0.001 pb0.001
VaD R=0.622 R=0.890 R=0.993pb0.001 pb0.001 pb0.001
4. Discussion
High b-value q-space DWI seems to be very sensitive toboth WM and GM changes in dementia. The increasedsensitivity of high b-value DWI to WM in general [18] andhigh b-value q-space DWI in particular has been docu-mented [34,40,28,41]. The present high b-value q-spacediffusion results show that the loss of white matter integrityis the major change observed in VaD patients. This effect isapparent both in displacement images and probabilityimages of the patients, where it is manifested as a decreasein probability values and an increase in displacement valuesof WM. This agrees with findings by Jones et al. thatshowed that VaD patients exhibit increased ADC anddecreased diffusion anisotropy in areas of leukariosis [12].This effect is accompanied by a smaller decrease inprobability values and a smaller increase in displacementvalues of WM that appears normal in FLAIR and FA maps.These changes in NAWM are more apparent in theprobability/displacement images than in the matching DTImaps and are also supported by findings by O'Sullivan et al.that showed changes in VaD patients extending to WMtracts beyond areas of T2 abnormalities [42]. Thedisplacement and probability histograms of patients studiedin this work corroborate the results of O'Sullivan et al. butalso extend them to a more general form. The current worklooks at all the pixels within the MRI slice, not only in aROI as in O'Sullivans work, and analyzes the changes inthe brain tissue as a whole, WM, GM, and CSF together andas distinct populations. The ROI approach can show thatthere are changes in the displacement and probability valuesof specific NAWM pixels, but the q-space approach allowsus the discern such changes in more extended regions ofWM in VaD patients (up to all brain regions in 3T MRIs).Indeed, such wider spread changes are suggested bypostmortem studies of WM pathology, in which acombination of infarcts and diffuse perifocal rarefactionwere observed for VaD.
In AD, the main effect apparent is GM shrinkage, and theWM effects are less profound. This effect is apparent both indisplacement and probability images of the patients, wherethe GM pixel values turn to CSF values, as well as in thedisplacement histogram where the AD patients show a trendfor a decrease in the GM peak, and an increase in the peaksize of the CSF. In AD patients, WM hyperintense areasshow a decrease in probability values and an increase indisplacement values which are smaller than those found forVaD patients. For example, a reduced anisotropy in theposterior WM was found [16], which agrees with the smallchanges observed in the current work. These changes weremostly found in areas of WM hyperintensities, similar to theway these hyperintensities are presented in VaD.
Another advantage of q-space analysis of high b-valuediffusion imaging is the improved discrimination betweendifferent types of tissue, i.e. WM, GM, and CSF. This iseasily illustrated by looking at the displacement histogram of

112 O. Mayzel-Oreg et al. / Journal of the Neurological Sciences 257 (2007) 105–113
the healthy volunteers that presents three distinct peaks, forWM, GM, and CSF. Using the displacement histograms thechanges affecting the different tissue types are morenoticeable. In the matching displacement histogram, theWM peak in VaD patients is significantly decreased fromcontrols, both in area and height, while the GM peak isn't.The center of the WM peak is also shifted from controlvalues. The FA histograms of the VaD group vs. controls arenot significantly different. When we compare the displace-ment histograms for AD patients the WM peak is alsosignificantly reduced from controls, both in height and area,but to a lesser degree than VaD patients. However, in contrastto the case of VaD, the center of the WM peak of AD patientsis not shifted from the value found for normal controls,indicating the maintenence of some normal tissue character-istics for remaining WM tissue in AD, consistent with thescenario of axonal loss, in contrast to VaD, where the declinein the WM peak is accompanied with its shift, implying adegenerative process in the form of demeylination. This isaccompanied by a complementary increase in the area of theCSF peak, in both pathologies. In VaD, the increase in CSFpeak area and height, consistent with brain atrophy, isaccompanied with a significant change in the CSF peakcenter while in AD, the significant increase in the CSF peakarea and height isn't accompanied by such a shift in the peakcenter from control values. Again, the FA histograms of ADpatients were not significantly different from controls.
Widespread atrophy and degeneration of GM, as expectedin AD, is impressively highlighted in this study. Indeed, theatrophy apparent in the FLAIR images is further enhanced inthe probability and displacement images, where the dramaticshrinkage of the GM is even more impressive, as the thinlayer of GM, surrounding the relatively intact WM, isemphasized. This is in good agreement with finding bySandson et al., showing increased ADCav in the hippocam-pus and posterior GM of AD patients and with findings byYoshihura et al., that show increased diffusivity in ROI's inthe temporal lobes of AD patients (relative to occipital lobediffusivity of the same patients), although their results are notspecific to GM. Interestingly, Yoshihura et al., also foundincreased contrast between AD and controls with increasingb-value. A comparison between MRI and histopathology ofin-vitro AD-affected brains was documented in an interest-ing paper by Bronge and coworkers [43], where the authorsfound that WM changes were more extensive on a myelinstained neuropathology exam than on postmortem MRimages. While their findings imply an increase in tissuewater content, even before myelin loss or axon loss occur, aphenomenon to which they expect MRI to be sensitive, theydidn't observe such changes by MRI as they didn't employdiffusion-weighted MRI techniques that are sensitive towater content and movement changes. A study thatemployed low b-value DWI in AD linked MRI WMhyperintensities with loss of myelinated axons and gliosisin the deep WM [44]. This study suggested that independentof periventricular changes, WM degeneration of the second-
ary Wallerian type, which has been identified to correlatewith pathologic cortical conditions in AD, may coexist inAD patients.
The increased sensitivity of high b-value q-space ana-lyzed diffusion imaging, as compared with low b-valueimaging, allows us to track changes in brain tissue even onthe single patient level. When we consider a typical VaDpatient, as illustrated in Fig. 2, and compare displacement(Fig. 2D), probability (Fig. 2E), and displacement anisot-ropy (Fig. 2F) maps to controls, we are immediately awareof the major observed change in VaD, i.e. WM degenerationand loss. Correspondingly, when we consider the matchingimages for a typical AD patient (Fig. 4D–F), we areimmediately struck by the extensive GM loss and thecomparative retention (in comparison with VaD) of WMintegrity. These striking observations are very important,especially in the light of the great heterogeneity of bothdiscussed pathologies, VaD and AD. Not only do thosepathologies affect different brain regions in differentpatients, but these regions also change during the courseof the disease. This variability in pathology location, andthe extensive variability in the changes occurring in thecourse of the disease, only serves to highlight the need forwidespread analysis of the brain tissue of the patient. ROIanalysis, while allowing us to track specific areas of tissuefor analysis, often fails to address the whole range ofchanges affecting all the brain tissue during the develop-ment of such pathologies. A global view of these changes isdesirable, especially if there is to be an attempt todistinguish between pathologies on a patient-by-patientbasis. While the present study did not provide a full analysisof all brain tissue, an extensive part of the brain was covered(five 5-mm slices with 1-mm inter-slices distance), probinga wide range of functional and anatomical structures,impractical using the ROI technique.
5. Conclusion
In conclusion, high b-value q-space analyzed DWI hasbeen shown to be more sensitive to changes in WM and GMin these types of dementia that are not apparent usingconventional imaging, low b-value DWI, and DTI. Thisincreased sensitivity seems to provide a more completeestimation of the disease load and, more importantly, enableone to distinguish radiologically between AD and VaDpatients on a single basis patient level. Clearly, the presentdiffusion study demonstrates the much significant changes inthe WM in the cases of VaD as compared to larger changes inthe GM for cases of AD.
Acknowledgement
Support of this project by the German Federal Ministry ofEducation and Research within the framework of theGerman–Israeli Projects Cooperation (DIP) (to Y.C.) isgratefully acknowledged.

113O. Mayzel-Oreg et al. / Journal of the Neurological Sciences 257 (2007) 105–113
References
[1] SavoiardoM,GrisoliM. Imaging dementias. Eur Radiol 2001;11:484–92.[2] Choi SH, Na DL, Chung CS, Lee KH, Na DG, Adair JC. Diffusion-
weighted MRI in vascular dementia. Neurology 2000;54:83–9.[3] Meyer JS, Xu G, Thornby JT, Chowdhury MH, Quach M. Is mild
cognitive impairment prodromal for vascular dementia like Alzheimer'sdisease? Stroke 2002;33:1981–5.
[4] Bowen BC, Barker BW, Loewenstein DA, Sheldon J, Duara R. MRSignal abnormalities in memory disorder and dementia. Am JNeuroradiol 1990;11:283–90.
[5] Bronge,Wahlund LO. Prognostic significance of white matter changes inmemory clinic population. Psychiat Res-Neuroim 2003;122:199–206.
[6] Varma AR, AdamsW, Lloyd JJ, Carson KJ, Snowden JS, Testa HJ, et al.Diagnostic patterns of regional atrophy on MRI and regional cerebralblood flow change on SPECT in young onset patients with Alzheimer'sdisease, frontotemporal dementia and vascular dementia. Acta NeurolScand 2002;105:261–9.
[7] Smith CD, Snowdon DA, Wang H, Markesbery WR. White mattervolumes and periventricular white matter hyperintensities in aging anddementia. Neurology 2000;54:838–42.
[8] Stark DD, Bradley WG. Magnetic Resonance Imaging. 3rd ed. New York:Mosbey Company; 1999. Chap 55, pp 1255–1276, Chap 68, pp1515–1539.
[9] LeBihan D. Molecular diffusion nuclear magnetic resonance imaging.Magn Reson Q 1991;7:1–30.
[10] LeBihan D, van Zijl P. From the diffusion coefficient to the diffusiontensor. NMR Biomed 2002;15:431–4.
[11] HorsfieldMA, JonesDK.Application of diffusion-weighted and diffusiontensor MRI to white matter diseases— a review. NMRBiomed 2002;15:570–7.
[12] Jones DK, Lythgoe D, Horsfield MA, Simmons A, Williams SCR,Markus HS. Characterization of white matter damage in ischemicleukoaraiosis with diffusion tensor MRI. Stroke 1999;30:393–7.
[13] O'Sullivan M, Morris RG, Huckstep B, Jones DK, Williams SC,Markus HS. Diffusion tensor MRI correlates with executive dysfunc-tion in patients with ischaemic leukoraraiosis. JNNP 2004;75:441–7.
[14] Rose SE, Chen F, Chalk JB, Zelaya FO, Strugnel WE, Benson M, et al.Loss of connectivity in Alzheimer's disease: an evaluation of whitematter tract integrity with colour coded MR diffusion tensor imaging.J Neurol Neurosurg Psychiatry 2000;69:528–30.
[15] BozzaliM, Falini A, FranceschiM, CerciganiM, ZuffiM, Scotti G, et al.White matter damage in Alzheimer's disease assessed in vivo usingdiffusion tensor magnetic resonance imaging. J Neurol NeurosurgPsychiatry 2002;72:742–6.
[16] Sandson TA, Felician O, Edelman RR, Warach S. Diffusion-weightedmagnetic resonance imaging in Alzheimer's disease. Dement GeriatrCogn Disord 1999;10:166–71.
[17] Takahashi S, Yonezawa H, Takahashi J, Kudo M, Inoue T, Tohgi H.Selective reduction of diffusion anisotropy in white matter of Alzheimerdisease brains measured by 3.0 Tesla magnetic resonance imaging.Neurosci lett 2002;332:45–8.
[18] Yoshihura T, Mihara F, Tanaka A, et al. High b-value diffusion-weighted imaging is more sensitive to white matter degeneration inAlzheimer's disease. NeuroImage 2003;20:413–9.
[19] Moseley ME, Cohen Y, Mintorovitch J, Chileuitt L, Shimizu H,Kucharczyk J, et al. Early detection of regional cerebral ischemia incats: comparison of diffusion-weighted and T2-weighted MRI andspectroscopy. Magn Reson Med 1990;14:330–46.
[20] Hoehn-Berlage M. Diffusion-weighted NMR imaging: application toexperimental focal cerebral ischemia. NMR Biomed 1995;8:345–58.
[21] Niendorf T, Dijkhuizen RM, Norris DG, van Lookeren Campagne M,Nicolay K. Biexponential diffusion attenuation in various stats of braintissue: implication for diffusion-weighted imaging. Magn Reson Med1996;36:847–57.
[22] Assaf Y, Cohen Y. Detection of different water populations in braintissue using 2H single-and double-quantum-filtered diffusion NMRspectroscopy. J Magn Reson Ser B 1996;112:151–9.
[23] Assaf Y, Cohen Y. Non-mono-exponential atteunuation of water andN-acetyl aspartate signals due to diffusion in brain tissue. J MagnReson 1998;131:69–85.
[24] Assaf Y, Cohen Y. Assignment of the water slow-diffusing componentin the central nervous system using q-space diffusion MRS: implica-tion for fiber tract imaging. Magn Reson Med 2000;43:191–9.
[25] Assaf Y, Cohen Y. The sources of diffusion components in neuronaltissue: application to white matter disorders. Proc Int Soc Magn ResMed 1999;7:555.
[26] Mulkern RV, Gudbjartsson H, Westin CF, Zengingonul HP, Gartner W,Guttmann CRG, et al. Multi-component apparent diffusion coefficients inhuman brain. NMR Biomed 1999;12:51–62.
[27] Tuch DS, Reese TG, Wiegell MR, Makris N, Belliveau JW, WedeenVJ. High angular resolution diffusion imaging reveals intravoxel whitematter fiber heterogeneity. Magn Reson Med 2002;48:577–82.
[28] Cohen Y, Assaf Y. High b-value q-space analyzed diffusion-weightedMRS andMRI in neuronal tissues— a technical review. NMRBiomed2002;15:516–42.
[29] Cory DG, Garroway AN. Measurement of translational displacementprobabilities by NMR: an indicator of compartmentation. Magn ResonMed 1990;14:435–44.
[30] Callaghan PT. Principles of Nuclear Magnetic Resonance Microscopy.Oxford University Press; 1991.
[31] Assaf Y, Mayk A, Cohen Y. Displacement imaging of spinal cord usingq-space diffusion-weighted MRI. Magn Reson Med 2000;44:713–22.
[32] AssafY,MaykA, EliashS, Speiser Z,CohenY.Hypertension and neuronaldegeneration in excised rat spinal cord studied by high-b-value q-spacediffusion magnetic resonance imaging. Exp Neurol 2003;184:726–36.
[33] Nossin-Manor R, Duvdevani R, Cohen Y. q-Space high b-valuediffusion MRI of hemi-crush in rat spinal cord: evidence forspontaneous regeneration. Magn Reson Imaging 2002;20:231–41.
[34] Assaf Y, Ben-Bashat D, Chapman J, Peled S, Biton IE, Kafri M, et al.High b-value q-space analyzed diffusion-weighted MRI: aplication tomultiple sclerosis. Magn Reson Med 2002;47:115–26.
[35] Biton IE, Mayk A, Kidron D, Assaf Y, Cohen Y. Improved detectibilityof experimental allergic encephalomyelitis in excised swine spinal cordby high b-value q-space DWI. Exp Neurol 2005;195:437–46.
[36] Basser PJ, Pierpaoli C. A simplified method to measure diffusiontensor from seven MR images. Magn Reson Med 1998;39:928–34.
[37] Folstein MF, Folstein SE, McHugh PR. “Mini-Mental /state”: apractical method for grading the cognitive state of patients for theclinician. J Psych Res 1975;12:189–98.
[38] McDowell I, Kristjansson B, Hill GB, Hebert R. Community screeningfor dementia: the Mini-Mental State Exam (MMSE) andModified Mini-Mental State Exam (3MS) compared. J Clin Epidemiol 1977;50:377–83.
[39] Simard M. The Mini-Mental State Examination: strengths andweaknesses of a clinical instrument. The Canadian Alzheimer DiseaseReview; Dec 12 1998.
[40] Assaf Y, Mayzel-Oreg O, Gigi A, Ben-Bashat D, Mordohovitch,Verchovsky R, et al. High b-value q space-analyzed diffusion MRI invascular dementia. J Neurol Sci 2002;203–204:235–9.
[41] Assaf Y, Chapman J, Ben-Bashat D, Hendeler T, SegevY, KorczynAD,et al. White matter changes in multiple sclerosis: correlation of q-spacediffusion MRI and 1H MRS. Magn Reson Imaging 2005;23:703–10.
[42] O'Sullivan M, Summers PE, Jones DK, Jarosz JM, Williams SCR,Markus HS. Normal-appearing white matter in ischemic leukoaraiosis:a diffusion tensor MRI study. Neurology 2001;57:2307–10.
[43] Bronge L, Bogdanovic N, Wahlund LO. Postmortem MRI andhistopathology of white matter changes in Alzheimer brains. DementGeriatr Cogn Disord 2002;13:205–12.
[44] Kantarci K, Xu Y, Shiung MM, O'Brien PC, Cha RH, Smith GE, et al.Comparative diagnostic utility of different MR modalities in mildcognitive impairment and Alzheimer's disease. Dement Geriatr CognDisord 2002;14:198–207.
Related Documents