1189 Mol. Biol. Evol. 18(7):1189–1203. 2001 q 2001 by the Society for Molecular Biology and Evolution. ISSN: 0737-4038 Hierarchical Patterns of Global Human Y-Chromosome Diversity Michael F. Hammer,*² Tatiana M. Karafet,* Alan J. Redd,* Hamdi Jarjanazi,* Silvana Santachiara-Benerecetti,‡ Himla Soodyall,§ and Stephen L. Zegura² *Laboratory of Molecular Systematics and Evolution and ²Department of Anthropology, University of Arizona; ‡Department of Genetics, Universita degli Studi di Pavia, Pavia, Italy; and §SAMIR, University of Witwatersrand, Johannesburg, South Africa We examined 43 biallelic polymorphisms on the nonrecombining portion of the Y chromosome (NRY) in 50 human populations encompassing a total of 2,858 males to study the geographic structure of Y-chromosome variation. Patterns of NRY diversity varied according to geographic region and method/level of comparison. For example, populations from Central Asia had the highest levels of heterozygosity, while African populations exhibited a higher level of mean pairwise differences among haplotypes. At the global level, 36% of the total variance of NRY haplotypes was attributable to differences among populations (i.e., F ST 5 0.36). When a series of AMOVA analyses was performed on different groupings of the 50 populations, high levels of among-groups variance (F CT ) were found between Africans, Native Americans, and a single group containing all 36 remaining populations. The same three population groupings formed distinct clusters in multidimensional scaling plots. A nested cladistic analysis (NCA) demonstrated that both population structure processes (recurrent gene flow restricted by isolation by distance and long-distance dispersals) and population history events (contiguous range expansions and long-distance colo- nizations) were instrumental in explaining this tripartite division of global NRY diversity. As in our previous analyses of smaller NRY data sets, the NCA detected a global contiguous range expansion out of Africa at the level of the total cladogram. Our new results support a general scenario in which, after an early out-of-Africa range expansion, global-scale patterns of NRY variation were mainly influenced by migrations out of Asia. Two other notable findings of the NCA were (1) Europe as a ‘‘receiver’’ of intercontinental signals primarily from Asia, and (2) the large number of intracontinental signals within Africa. Our AMOVA analyses also supported the hypothesis that patrilocality effects are evident at local and regional scales, rather than at intercontinental and global levels. Finally, our results underscore the importance of subdivision of the human paternal gene pool and imply that caution should be exercised when using models and experimental strategies based on the assumption of panmixia. Introduction Knowledge of just how genetic variation is parti- tioned among human populations has important impli- cations for studies of human origins, DNA forensics, and the etiology of human disease. Compared with other species, humans have relatively low levels of genetic diversity. Also, the proportion of that diversity that ex- ists between all levels of human population is corre- spondingly low (Nei 1987). For example, studies of blood groups and protein polymorphisms have shown that approximately 85% of all human genetic diversity can be found within a single population, while only 5%– 10% of the total diversity is partitioned among major geographic regions (Lewontin 1972; Nei and Roychoud- hury 1974; Latter 1980). A similar apportionment of genetic diversity has been revealed at the DNA level by genomewide analyses of a variety of different markers (Bowcock and Cavalli-Sforza 1991; Batzer et al. 1994; Deka et al. 1995; Barbujani et al. 1997; Jorde et al. 2000). Concordant results have also been obtained from other human traits, such as cranial morphology (Releth- ford and Harpending 1994). Overall, these studies have generally underscored the lack of discontinuity among human groups (Lewontin 1972; Barbujani et al. 1997) and the relative homogeneity of the human species. This observation, in turn, may reflect a relatively recent ori- Key words: subdivision, patrilocality, gene flow, male migrations. Address for correspondence and reprints: Michael F. Hammer, Laboratory of Molecular Systematics and Evolution, Biosciences West room 239, University of Arizona, Tucson, Arizona 85721. E-mail: [email protected]. gin for human between-groups differentiation, relatively high rates of migration among different human groups, or both (Relethford 1995). Assuming a 1:1 sex-ratio, autosomal and X-linked regions of the genome have four- and threefold higher effective sizes, respectively, than the nonrecombining portion of the Y chromosome (NRY) and the mitochon- drial DNA molecule. Consequently, increased levels of population subdivision due to genetic drift are expected for these uniparentally inherited haploid regions of the genome. Until recently, the small number of known NRY polymorphisms has hindered a comprehensive as- sessment of the global structure of Y-chromosome di- versity. Earlier studies indicated that Y-chromosome polymorphisms were geographically restricted and that F ST values for the NRY were higher than those for mtDNA (Jobling and Tyler-Smith 1995; Cavalli-Sforza and Minch 1997; Underhill et al. 1997; Hammer et al. 1998; Perez-Lezaun et al. 1999). Indeed, the higher ob- served F ST for the NRY compared with that for mtDNA led Seielstad, Minch, and Cavalli-Sforza (1998) to pro- pose that females have had an eightfold higher migration rate than males. It is unclear, however, whether the sug- gested underlying cause of this higher mobility (i.e., lo- cal-scale patrilocality, defined anthropologically as the tendency for a wife to move into her husband’s natal domicile) would lead to a higher global F ST for the Y chromosome (Stoneking 1998). On the other hand, con- trasting signals in nested cladistic analyses of NRY and mtDNA data sets led Hammer et al. (1998) to hypoth- esize that male migration rates may have been higher than those for females at the intercontinental level. De-

Welcome message from author
This document is posted to help you gain knowledge. Please leave a comment to let me know what you think about it! Share it to your friends and learn new things together.
Transcript
1189
Mol. Biol. Evol. 18(7):1189–1203. 2001q 2001 by the Society for Molecular Biology and Evolution. ISSN: 0737-4038
Hierarchical Patterns of Global Human Y-Chromosome Diversity
Michael F. Hammer,*† Tatiana M. Karafet,* Alan J. Redd,* Hamdi Jarjanazi,*Silvana Santachiara-Benerecetti,‡ Himla Soodyall,§ and Stephen L. Zegura†*Laboratory of Molecular Systematics and Evolution and †Department of Anthropology, University of Arizona; ‡Departmentof Genetics, Universita degli Studi di Pavia, Pavia, Italy; and §SAMIR, University of Witwatersrand, Johannesburg,South Africa
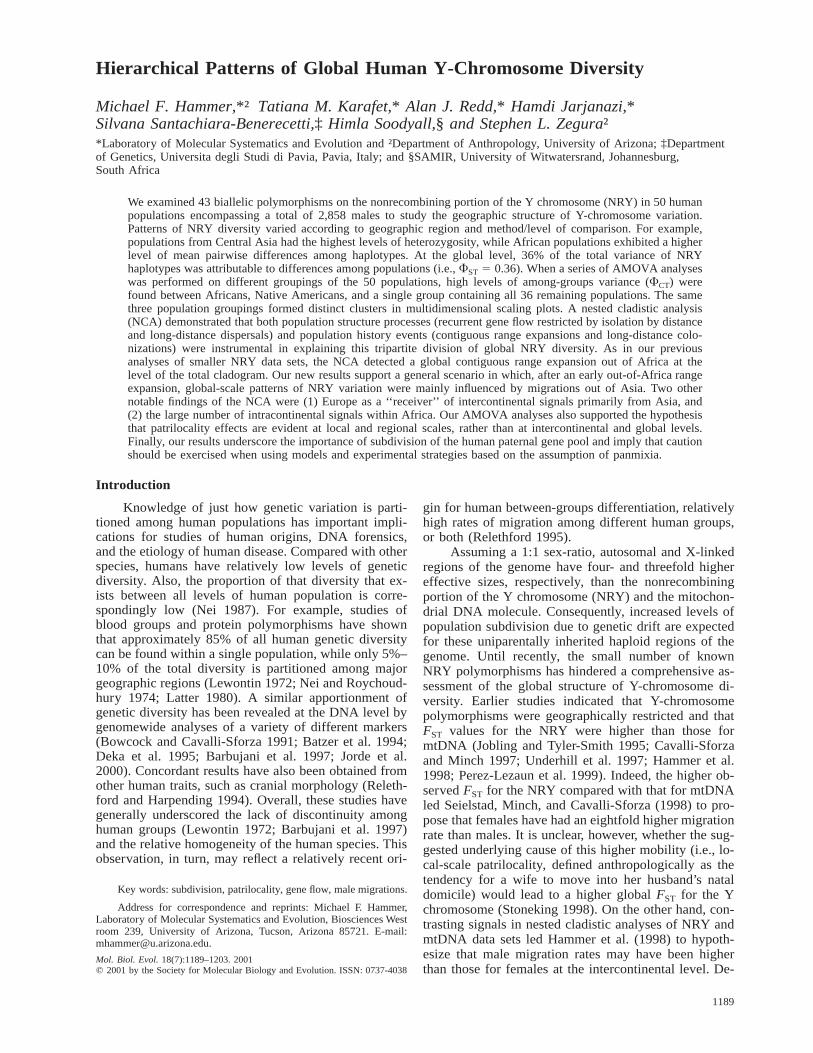
We examined 43 biallelic polymorphisms on the nonrecombining portion of the Y chromosome (NRY) in 50 humanpopulations encompassing a total of 2,858 males to study the geographic structure of Y-chromosome variation.Patterns of NRY diversity varied according to geographic region and method/level of comparison. For example,populations from Central Asia had the highest levels of heterozygosity, while African populations exhibited a higherlevel of mean pairwise differences among haplotypes. At the global level, 36% of the total variance of NRYhaplotypes was attributable to differences among populations (i.e., FST 5 0.36). When a series of AMOVA analyseswas performed on different groupings of the 50 populations, high levels of among-groups variance (FCT) werefound between Africans, Native Americans, and a single group containing all 36 remaining populations. The samethree population groupings formed distinct clusters in multidimensional scaling plots. A nested cladistic analysis(NCA) demonstrated that both population structure processes (recurrent gene flow restricted by isolation by distanceand long-distance dispersals) and population history events (contiguous range expansions and long-distance colo-nizations) were instrumental in explaining this tripartite division of global NRY diversity. As in our previousanalyses of smaller NRY data sets, the NCA detected a global contiguous range expansion out of Africa at thelevel of the total cladogram. Our new results support a general scenario in which, after an early out-of-Africa rangeexpansion, global-scale patterns of NRY variation were mainly influenced by migrations out of Asia. Two othernotable findings of the NCA were (1) Europe as a ‘‘receiver’’ of intercontinental signals primarily from Asia, and(2) the large number of intracontinental signals within Africa. Our AMOVA analyses also supported the hypothesisthat patrilocality effects are evident at local and regional scales, rather than at intercontinental and global levels.Finally, our results underscore the importance of subdivision of the human paternal gene pool and imply that cautionshould be exercised when using models and experimental strategies based on the assumption of panmixia.
Introduction
Knowledge of just how genetic variation is parti-tioned among human populations has important impli-cations for studies of human origins, DNA forensics,and the etiology of human disease. Compared with otherspecies, humans have relatively low levels of geneticdiversity. Also, the proportion of that diversity that ex-ists between all levels of human population is corre-spondingly low (Nei 1987). For example, studies ofblood groups and protein polymorphisms have shownthat approximately 85% of all human genetic diversitycan be found within a single population, while only 5%–10% of the total diversity is partitioned among majorgeographic regions (Lewontin 1972; Nei and Roychoud-hury 1974; Latter 1980). A similar apportionment ofgenetic diversity has been revealed at the DNA level bygenomewide analyses of a variety of different markers(Bowcock and Cavalli-Sforza 1991; Batzer et al. 1994;Deka et al. 1995; Barbujani et al. 1997; Jorde et al.2000). Concordant results have also been obtained fromother human traits, such as cranial morphology (Releth-ford and Harpending 1994). Overall, these studies havegenerally underscored the lack of discontinuity amonghuman groups (Lewontin 1972; Barbujani et al. 1997)and the relative homogeneity of the human species. Thisobservation, in turn, may reflect a relatively recent ori-
Key words: subdivision, patrilocality, gene flow, male migrations.
Address for correspondence and reprints: Michael F. Hammer,Laboratory of Molecular Systematics and Evolution, Biosciences Westroom 239, University of Arizona, Tucson, Arizona 85721. E-mail:[email protected].
gin for human between-groups differentiation, relativelyhigh rates of migration among different human groups,or both (Relethford 1995).
Assuming a 1:1 sex-ratio, autosomal and X-linkedregions of the genome have four- and threefold highereffective sizes, respectively, than the nonrecombiningportion of the Y chromosome (NRY) and the mitochon-drial DNA molecule. Consequently, increased levels ofpopulation subdivision due to genetic drift are expectedfor these uniparentally inherited haploid regions of thegenome. Until recently, the small number of knownNRY polymorphisms has hindered a comprehensive as-sessment of the global structure of Y-chromosome di-versity. Earlier studies indicated that Y-chromosomepolymorphisms were geographically restricted and thatFST values for the NRY were higher than those formtDNA (Jobling and Tyler-Smith 1995; Cavalli-Sforzaand Minch 1997; Underhill et al. 1997; Hammer et al.1998; Perez-Lezaun et al. 1999). Indeed, the higher ob-served FST for the NRY compared with that for mtDNAled Seielstad, Minch, and Cavalli-Sforza (1998) to pro-pose that females have had an eightfold higher migrationrate than males. It is unclear, however, whether the sug-gested underlying cause of this higher mobility (i.e., lo-cal-scale patrilocality, defined anthropologically as thetendency for a wife to move into her husband’s nataldomicile) would lead to a higher global FST for the Ychromosome (Stoneking 1998). On the other hand, con-trasting signals in nested cladistic analyses of NRY andmtDNA data sets led Hammer et al. (1998) to hypoth-esize that male migration rates may have been higherthan those for females at the intercontinental level. De-
1190 Hammer et al.
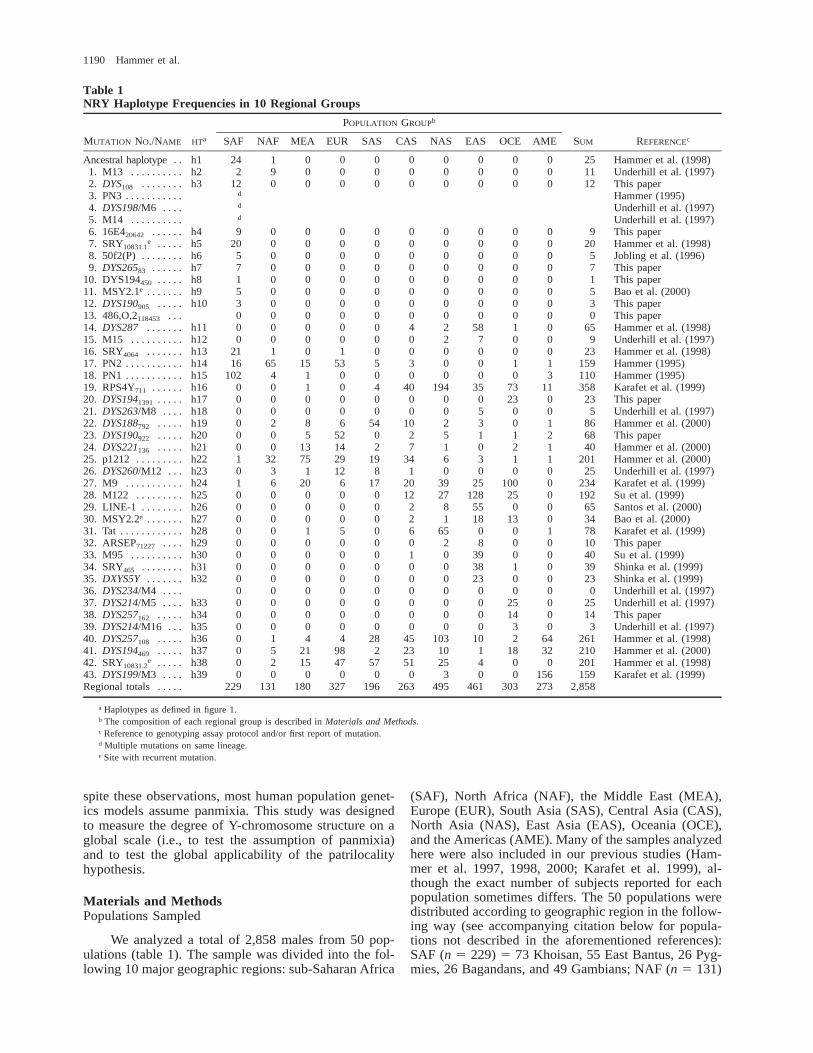
Table 1NRY Haplotype Frequencies in 10 Regional Groups
MUTATION NO./NAME HTa
POPULATION GROUPb
SAF NAF MEA EUR SAS CAS NAS EAS OCE AME SUM REFERENCEc
Ancestral haplotype . . h1 24 1 0 0 0 0 0 0 0 0 25 Hammer et al. (1998)1. M13 . . . . . . . . . . h2 2 9 0 0 0 0 0 0 0 0 11 Underhill et al. (1997)2. DYS108 . . . . . . . . h3 12 0 0 0 0 0 0 0 0 0 12 This paper3. PN3 . . . . . . . . . . .4. DYS198/M6 . . . .5. M14 . . . . . . . . . .
d
d
d
Hammer (1995)Underhill et al. (1997)Underhill et al. (1997)
6. 16E420642 . . . . . . h4 9 0 0 0 0 0 0 0 0 0 9 This paper7. SRY10831.1
e . . . . . h5 20 0 0 0 0 0 0 0 0 0 20 Hammer et al. (1998)8. 50f2(P) . . . . . . . . h6 5 0 0 0 0 0 0 0 0 0 5 Jobling et al. (1996)9. DYS26583 . . . . . . h7 7 0 0 0 0 0 0 0 0 0 7 This paper
10. DYS194450 . . . . . h8 1 0 0 0 0 0 0 0 0 0 1 This paper11. MSY2.1e . . . . . . . h9 5 0 0 0 0 0 0 0 0 0 5 Bao et al. (2000)12. DYS190905 . . . . . h10 3 0 0 0 0 0 0 0 0 0 3 This paper13. 486,O,2118453 . . . 0 0 0 0 0 0 0 0 0 0 0 This paper14. DYS287 . . . . . . . h11 0 0 0 0 0 4 2 58 1 0 65 Hammer et al. (1998)15. M15 . . . . . . . . . . h12 0 0 0 0 0 0 2 7 0 0 9 Underhill et al. (1997)16. SRY4064 . . . . . . . h13 21 1 0 1 0 0 0 0 0 0 23 Hammer et al. (1998)17. PN2 . . . . . . . . . . . h14 16 65 15 53 5 3 0 0 1 1 159 Hammer (1995)18. PN1 . . . . . . . . . . . h15 102 4 1 0 0 0 0 0 0 3 110 Hammer (1995)19. RPS4Y711 . . . . . . h16 0 0 1 0 4 40 194 35 73 11 358 Karafet et al. (1999)20. DYS1941391 . . . . . h17 0 0 0 0 0 0 0 0 23 0 23 This paper21. DYS263/M8 . . . . h18 0 0 0 0 0 0 0 5 0 0 5 Underhill et al. (1997)22. DYS188792 . . . . . h19 0 2 8 6 54 10 2 3 0 1 86 Hammer et al. (2000)23. DYS190922 . . . . . h20 0 0 5 52 0 2 5 1 1 2 68 This paper24. DYS221136 . . . . . h21 0 0 13 14 2 7 1 0 2 1 40 Hammer et al. (2000)25. p1212 . . . . . . . . . h22 1 32 75 29 19 34 6 3 1 1 201 Hammer et al. (2000)26. DYS260/M12 . . . h23 0 3 1 12 8 1 0 0 0 0 25 Underhill et al. (1997)27. M9 . . . . . . . . . . . h24 1 6 20 6 17 20 39 25 100 0 234 Karafet et al. (1999)28. M122 . . . . . . . . . h25 0 0 0 0 0 12 27 128 25 0 192 Su et al. (1999)29. LINE-1 . . . . . . . . h26 0 0 0 0 0 2 8 55 0 0 65 Santos et al. (2000)30. MSY2.2e . . . . . . . h27 0 0 0 0 0 2 1 18 13 0 34 Bao et al. (2000)31. Tat . . . . . . . . . . . . h28 0 0 1 5 0 6 65 0 0 1 78 Karafet et al. (1999)32. ARSEP71227 . . . . h29 0 0 0 0 0 0 2 8 0 0 10 This paper33. M95 . . . . . . . . . . h30 0 0 0 0 0 1 0 39 0 0 40 Su et al. (1999)34. SRY465 . . . . . . . . h31 0 0 0 0 0 0 0 38 1 0 39 Shinka et al. (1999)35. DXYS5Y . . . . . . . h32 0 0 0 0 0 0 0 23 0 0 23 Shinka et al. (1999)36. DYS234/M4 . . . . 0 0 0 0 0 0 0 0 0 0 0 Underhill et al. (1997)37. DYS214/M5 . . . . h33 0 0 0 0 0 0 0 0 25 0 25 Underhill et al. (1997)38. DYS257162 . . . . . h34 0 0 0 0 0 0 0 0 14 0 14 This paper39. DYS214/M16 . . . h35 0 0 0 0 0 0 0 0 3 0 3 Underhill et al. (1997)40. DYS257108 . . . . . h36 0 1 4 4 28 45 103 10 2 64 261 Hammer et al. (1998)41. DYS194469 . . . . . h37 0 5 21 98 2 23 10 1 18 32 210 Hammer et al. (2000)42. SRY10831.2
e . . . . . h38 0 2 15 47 57 51 25 4 0 0 201 Hammer et al. (1998)43. DYS199/M3 . . . . h39 0 0 0 0 0 0 3 0 0 156 159 Karafet et al. (1999)Regional totals . . . . . 229 131 180 327 196 263 495 461 303 273 2,858
a Haplotypes as defined in figure 1.b The composition of each regional group is described in Materials and Methods.c Reference to genotyping assay protocol and/or first report of mutation.d Multiple mutations on same lineage.e Site with recurrent mutation.
spite these observations, most human population genet-ics models assume panmixia. This study was designedto measure the degree of Y-chromosome structure on aglobal scale (i.e., to test the assumption of panmixia)and to test the global applicability of the patrilocalityhypothesis.
Materials and MethodsPopulations Sampled
We analyzed a total of 2,858 males from 50 pop-ulations (table 1). The sample was divided into the fol-lowing 10 major geographic regions: sub-Saharan Africa
(SAF), North Africa (NAF), the Middle East (MEA),Europe (EUR), South Asia (SAS), Central Asia (CAS),North Asia (NAS), East Asia (EAS), Oceania (OCE),and the Americas (AME). Many of the samples analyzedhere were also included in our previous studies (Ham-mer et al. 1997, 1998, 2000; Karafet et al. 1999), al-though the exact number of subjects reported for eachpopulation sometimes differs. The 50 populations weredistributed according to geographic region in the follow-ing way (see accompanying citation below for popula-tions not described in the aforementioned references):SAF (n 5 229) 5 73 Khoisan, 55 East Bantus, 26 Pyg-mies, 26 Bagandans, and 49 Gambians; NAF (n 5 131)
Global Human Y-Chromosome Diversity 1191
5 51 Ethiopians, 50 Egyptians, and 30 Tunisians; MEA(n 5 180) 5 20 Saudi Arabians, 88 Syrians, and 72Turks; EUR (n 5 327) 5 86 Greeks, 62 Italians, 58Romanians (this study), 34 Germans, 44 Russians, and43 British; SAS (n 5 196) 5 75 Sri Lankans, 59 Indi-ans, and 62 Pakistanis (Qamar et al. 1999); CAS (n 5263) 5 45 Turkmen (this study), 14 Tadjiks (this study),77 Uzbeks (this study), 30 Kazakhs, 29 Altai, and 68Uygurs (this study); NAS (n 5 495) 5 148 Mongolians,81 Buryats, 122 Selkups, 27 Forest Nentsi, 95 Evenks,and 22 Siberian Eskimos; EAS (n 5 461) 5 70 Viet-namese, 58 Miao (this study), 84 Chinese Han, 52 Man-chu (this study), 76 Koreans, and 121 Japanese; OCE(n 5 303) 5 60 East Indonesians, 47 Papua New Gui-neans, 50 Melanesians, 78 Australian Aboriginal people,18 Micronesians, and 50 Polynesians (this study); andAME (n 5 273) 5 80 Navajos, 45 Cheyenne, 24 Pima,72 Mayans (this study), 28 Mixtecs, and 24 Wayus. Allsampling protocols were approved by the Human Sub-jects Committee at the University of Arizona.
Mutation Detection
Mutation detection analysis was performed usingsingle-stranded conformation polymorphism (SSCP)(Sheffield et al. 1993) and denaturing high-performanceliquid chromatography (DHPLC) (Underhill et al. 1997).Two panels of DNA samples were employed to ascertainpolymorphisms using the above methods. For SSCP, n5 20 (9 sub-Saharan Africans, 3 Asians, 3 Native Amer-icans, 3 Europeans, and 2 Oceanians), and for DHPLC,n 5 57 (17 sub-Saharan Africans, 15 Asians, 11 Euro-peans, 7 Native Americans, and 7 Oceanians).
The SSCP method was used to screen a set of 20sequence-tagged sites (STSs). The DHPLC method wasused to screen for mutations in the following set of threeclones that were previously used as probes to detect re-striction fragment length polymorphism (RFLP) varia-tion on the NRYs of humans and great apes (Allen andOstrer 1994): clone 4-1 (DYS188), clone 3-11 (DYS190),and clone 3-8 (DYS194). Mutational variation withinfour STSs (DYS221, DYS257, DYS199, and DYS211)and two clones (3-8 and 4-1) was previously reported(Karafet et al. 1997; Hammer et al. 1998, 2000). Ad-ditional variation was found at sites within three STSs(DYS7, DYS265, and DYS257b) and two clones (3-8 and3-11). Finally, Ya5 Alu elements within the 16E4 and486,O,2 clones (GenBank accession numbersAC003094 and AC002531, respectively; http://www.ncbi.nlm.nih.gov/Genbank/index.html), as well asa 683-bp region of an arylsulfatase pseudogene (ARSEP,GenBank accession number AC002992) were screenedfor polymorphisms using DHPLC.
The DYS7 (GenBank accession number G12023),DYS265 (GenBank accession number G12016), andDYS257 (GenBank accession number G38358) STSswere amplified using the conditions and primers report-ed by Vollrath et al. (1992). The Y-specific clones 3-8(DYS194) and 3-11 (DYS190) (Allen and Ostrer 1994)were sequenced by primer walking (GenBank accessionnumbers AF257064 and AF337053, respectively), and
the sequence information was used to design primers toamplify shorter fragments for DHPLC analysis. DNAsequencing was performed by standard procedures toidentify mutations which altered mobility on SSCP gelsor DHPLC chromatograms.
As in previous mutation detection surveys (Under-hill et al. 1997, 2000; Hammer et al. 1998; Karafet etal. 1999), we sequenced homologous DNA regions en-compassing all sites found to be polymorphic on thehuman NRY in great ape species (e.g., one commonchimpanzee, one bonobo, and one gorilla) to determineancestral states, as well as the position of the root of thehuman NRY haplotype tree.
Allele-Specific Genotyping Assays
A total of 23 segregating sites were discovered us-ing the two mutation detection methods. Of these 23, 15were chosen for genotyping in the entire sample (10 newand 5 previously published polymorphisms). The other8 polymorphisms were found to be so rare in a subsetof the 2,858 chromosomes that they were excluded fromsubsequent analyses. After determining the location ofa sample with respect to its position on the haplotypetree, no further genotyping was undertaken for that sam-ple. This hierarchical genotyping protocol means thatnot every individual was typed for every marker, andhence it is possible that some recurrent mutations re-mained undetected using this strategy (Underhill et al.2000). Nevertheless, because the homoplasy rate for sin-gle-nucleotide polymorphisms (SNPs) on the NRY is solow (Underhill et al. 2000), it is unlikely that undetectedmultiple ‘‘hits’’ would seriously affect either our phy-logenetic or our diversity analyses. The remaining 20previously published polymorphisms (from the entirebattery of 43 polymorphisms) were also genotyped forall 2,858 chromosomes, with the aforementionedcaveats.
Variation at all previously unpublished polymor-phic sites (table 1: mutations 2, 6, 9, 10, 12, 13, 20, 23,32, and 38) was genotyped using allele-specific PCR(Sommer, Groszbach, and Bottema 1992). The PCRconditions and primer sequences employed in these al-lele-specific genotyping assays were deposited in theNational Center for Biotechnology Information (NCBI)dbSNP database (http://www.ncbi.nlm.nih.gov/SNP).Mutations numbered 3, 7, 14, 16–20, 22, 24, 25, and40–43 in table 1 were genotyped according to methodsreported by Hammer and Horai (1995), Hammer et al.(1998, 2000), and Karafet et al. (1999). Other previouslypublished mutations included mutation 8 (Jobling et al.1996); mutations 1, 4, 5, 15, 21, 26, 27, 36, 37, and 39(Underhill et al. 1997); mutation 31 (Zerjal et al. 1997);mutations 34 and 35 (Shinka et al. 1999); mutations 28and 33 (Su et al. 1999); mutations 11 and 30 (Bao etal. 2000); and mutation 29 (Santos et al. 2000).
Statistical Analyses
Parsimony analysis of NRY haplotypes was aidedby the use of PAUP, version 4.0b4 (Swofford 2000),with outgroup rooting. Measures of haplotype diversity,
1192 Hammer et al.
including the number of haplotypes (k), Nei’s (1987)heterozygosity (h), and the mean number of pairwisedifferences among haplotypes (p), were calculated usingthe software package ARLEQUIN (Schneider et al.1998). We also used ARLEQUIN to perform analysis ofmolecular variance (AMOVA). AMOVA produces es-timates of variance components and F statistics (F sta-tistic analogs) reflecting the correlation of haplotypic di-versity at different levels of hierarchical subdivision(Excoffier, Smouse, and Quattro 1992). Because the as-sumptions of random sampling, ‘‘pure’’ genetic drift,and no migration are likely to be violated in all humanpopulations, caution is needed when interpreting F sta-tistics. Nevertheless, according to Excoffier, Smouse,and Quattro (1992), the resulting variance componentscan be viewed as convenient summaries of the parti-tioning of genetic variation within and among popula-tions. We performed multidimensional scaling (MDS)(Kruskal 1964) on the FST distances generated in AR-LEQUIN using the software package NTSYS (Rohlf1998). Nested cladistic analyses (NCAs) were carriedout using GeoDis, version 2.0 (Posada, Crandall, andTempleton 2000). This novel method attempts to explainstatistically significant associations between haplotypesand geography in terms of population history and/orpopulation structure considerations. Population structureprocesses operate over short time intervals and tend toestablish migration-drift equilibria, whereas populationhistory events are considered to be nonrecurrent phe-nomena that disrupt equilibria. Three conditions under-lie the general applicability of NCA and its ability todiscriminate among the various population structure pro-cesses (i.e., recurrent gene flow restricted by isolationby distance vs. long-distance dispersal) and/or popula-tion history events (i.e., contiguous range expansion,long-distance colonization, or fragmentation). Theseconsiderations include (1) adequate sampling across thegeographic range of the species, (2) temporal polarity ofthe haplotype network, and (3) mutational resolution inthe haplotype tree. Because our cladogram was rootedby outgroup comparisons, we were able to infer the geo-graphical polarity of several of the signals detected bythe NCA analysis by considering the distribution of in-terior and tip clades (e.g., directionality was assumed togo from interior to tip), especially in cases where therewas a clear geographic pattern of separation betweenancestral and derived haplotypes. For a more extensiveexplanation of the NCA method, consult Templeton,Routman, and Phillips (1995), Hammer et al. (1998),and Posada, Crandall, and Templeton (2000).
Results
During the course of this research, the following10 previously unpublished Y-specific polymorphismswere discovered: a C→T transition at position 20642 of16E4; a G→A transition at position 905 of DYS190; aT→G transversion at position 922 of DYS190; a T→Ctransition at position 450 of DYS194; a T→C transitionat position 1391 of DYS194; a C→A transversion at po-sition 118453 of 486,O,2; a T→C transition and a T
deletion at positions 71227 and 71228, respectively, ofARSEP; a C→T transition at position 108 of DYS7; aG→C transversion at position 83 of DYS265; and aG→A transition at position 162 of DYS257. Compari-sons with the homologous sequences from one commonchimpanzee, one bonobo, and one gorilla allowed us toinfer the ancestral states at all of these sites except16E420642 and 486,O,2118453, which only occurred in hu-man-specific Alu elements.
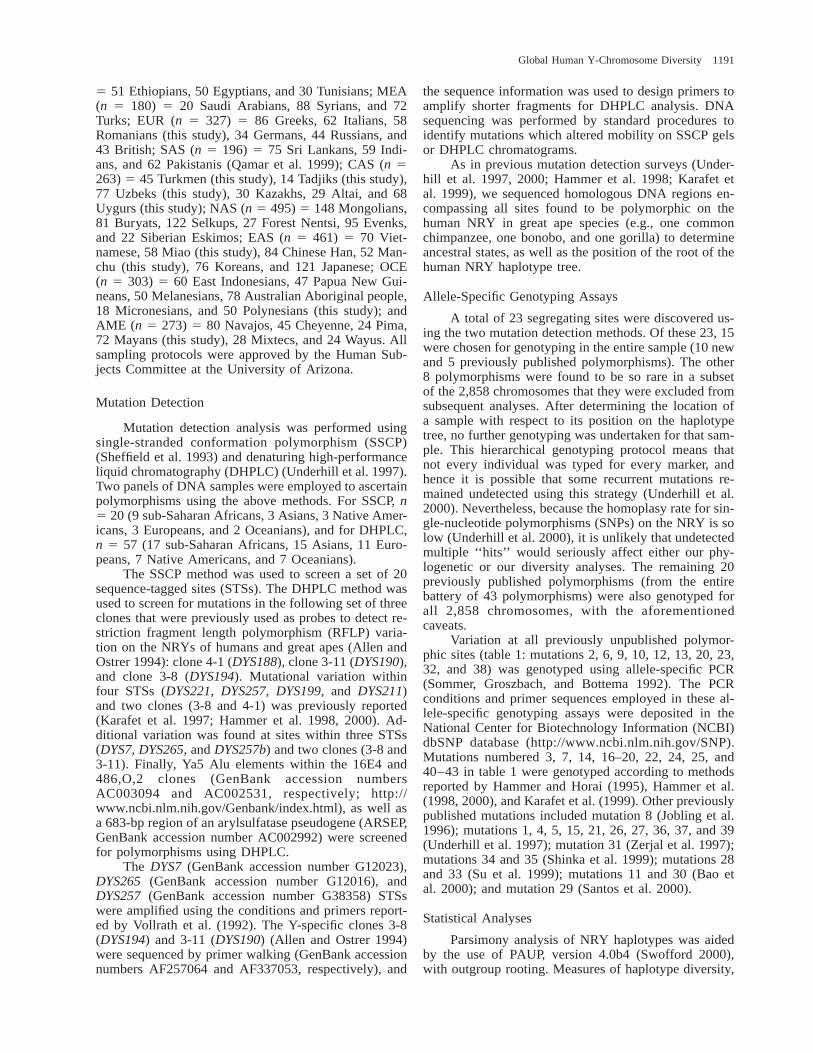
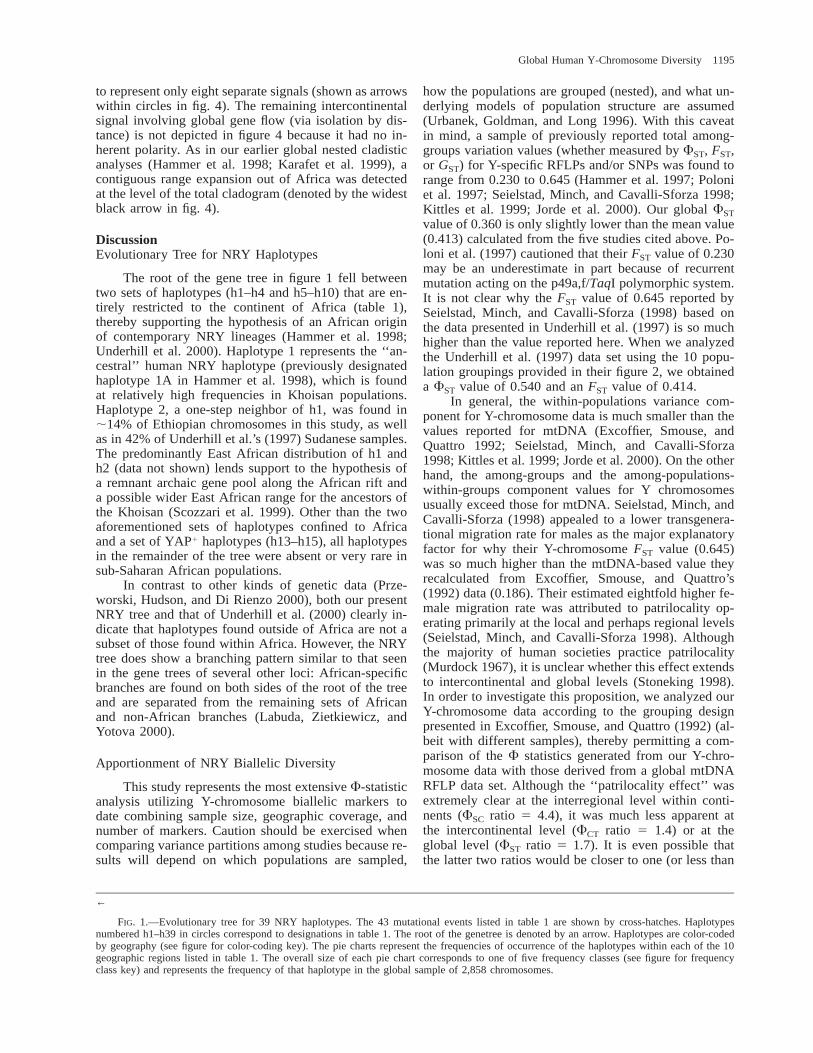
In addition to these 10 new markers, we surveyed33 previously published polymorphisms (table 1). Mu-tational events at two sites were recurrent (SRY10831 andMSY2). The character states at all 41 mutational sitesgive rise to 44 possible NRY haplotypes, of which 39were present in this survey. The frequencies of these 39haplotypes (h1–h39) in each regional group are reportedin table 1. Figure 1 displays a maximum-parsimony treeshowing the evolutionary relationships of all 39 haplo-types. Haplotypes in figure 1 are color-coded by geog-raphy. The pie charts represent the frequencies of oc-currence of the haplotypes within each of the 10 geo-graphic regions listed in table 1, and the overall size ofeach circle represents a global haplotype frequency.
The position of the root in figure 1 was determinedby outgroup comparisons. In order to confirm the po-sition of the root, a subset of chromosomes was geno-typed at four sites (M91, M42, M94, and M139) thatmark the two most basal lineages on the maximum-par-simony tree presented by Underhill et al. (2000). Over-all, the tree in figure 1 exhibits a high degree of under-lying similarity with Underhill et al.’s (2000) maximum-parsimony tree (even though our analysis was based on;fourfold fewer markers, with only 15 common to bothstudies). In fact, our figure 1 and the Y-chromosome treein Underhill et al. (2000) offer remarkably strong mutualconfirmation. For instance, Underhill et al.’s (2000) hap-logroup I is represented by our haplotypes 1–4. The restof the correspondences are as follows, again with theUnderhill et al. (2000) haplogroup designation first, fol-lowed by our matching haplotype number(s): haplo-group II—haplotypes 5–10; haplogroup III—haplotypes13–15; haplogroup IV—haplotypes 11 and 12; haplo-group V—haplotypes 16–18; haplogroup VI—haplo-types 19–23; haplogroup VII—haplotypes 25–27 and29–32; haplogroup VIII—haplotypes 24, 28, and 33–35;haplogroup IX—haplotypes 36–38; and haplogroup X—haplotype 39.
Haplotype Diversity
Diversity statistics for the 10 regional and 5 con-tinental groups are presented in table 2. The number ofregional haplotypes (k) ranged from 10 in South Asiansto 18 in East Asians. Regional haplotype diversity val-ues (h) ranged from 0.605 in Native Americans to 0.878in Central Asians, while the mean number of pairwisedifferences (p) ranged from 1.31 in Native Americansto 3.93 in sub-Saharan Africans. Four distinct patternsappear when two diversity statistic values for the 10regional groups in table 2 are compared: (1) low p/lowh, (2) high p/high h, (3) high p/low h, and (4) moderate
Global Human Y-Chromosome Diversity 1193
p/high h. The Americas represent the only region thatexhibits the first pattern of concordantly low p and lowh values. The low p value occurs here because 90% ofNative American Y-chromosome lineages are one-stepneighbors restricted to haplotypes 36–39 (magenta infig. 1), while the low h value is due to the fact that 57%of the Native Americans in our study have haplotype 39(table 1). The second pattern, where a high p value isaccompanied by a concordantly high h value, is seenonly in Europeans. This pattern reflects intermediate fre-quencies of relatively divergent haplotypes found in dif-ferent parts of the tree (i.e., blue in fig. 1). The thirdpattern, where a high p value is discordantly combinedwith a low h value, characterizes both African regionalgroups. In sub-Saharan Africa, the extremely high p val-ue is influenced by the marked divergence among thedark green haplotypes in figure 1. The contrasting rel-atively low h value may occur because 45% of sub-Saharan African Y chromosomes exhibit a single hap-lotype (h15). Likewise, 50% of the North Africans havea single (but different) haplotype (h14), resulting in alow h value, while the rather high North African p valueis associated with the occurrence of a diverse set of lin-eages (light green in fig. 1). Finally, Asian and Oceanianpopulations exhibit the fourth pattern, moderate p andhigh h values. Although their p values are moderate, theCentral and East Asians have the highest h valuesamong the 10 regions. These high h values are probablydue to the lack of any predominant Central or East Asianhaplotype (red and orange, respectively in fig. 1).
Analysis of Molecular Variance
According to Excoffier, Smouse, and Quattro(1992, p. 482), FST can be viewed as the correlation ofrandom haplotypes within populations relative to that ofrandom pairs of haplotypes drawn from the whole spe-cies, while FCT is the correlation of random haplotypeswithin a group of populations relative to that of randompairs of haplotypes drawn from the whole species, andFSC is the correlation of the molecular diversity of ran-dom haplotypes within populations relative to that ofrandom haplotypes drawn from the region. Table 3 pre-sents variance components and F statistics at five dif-ferent grouping levels, which summarize the geographicpartitioning of NRY diversity. When all 50 populationswere combined into a global analysis, 64% of the var-iance was within populations, and thus FST 5 0.36. TheF statistics at the 10 regional and 5 continental levelswere very similar. However, when the world was parti-tioned into three groups (Africa/Americas/‘‘rest of theworld’’), all three F statistics increased noticeably invalue. When each continental grouping was contrastedwith the remainder of the world (table 3, analyses 5–9),the African/non-African comparison exhibited the high-est FST and FCT values, but the lowest FSC value. Inthe American/non-American comparison, the FST andFCT values were second highest, while the FSC valuewas second lowest. In contrast, the three F statistics forthe European/non-European, Asian/non-Asian, andOceanian/non-Oceanian comparisons were nearly iden-
tical. Their FST values corresponded closely to the glob-al and 10 regional FST values. However, their FCT val-ues dropped ;10-fold compared with the 10-, 5-, and3-group partitionings, while their FSC values were thehighest of any the comparisons. The combined resultssuggest that while African and Native American popu-lations were the most differentiated from the othergroups, European, Asian, and Oceanian populationswere practically indistinguishable from each other on thebasis of all three F-statistic patterns.
Multiple-Dimensional Scaling
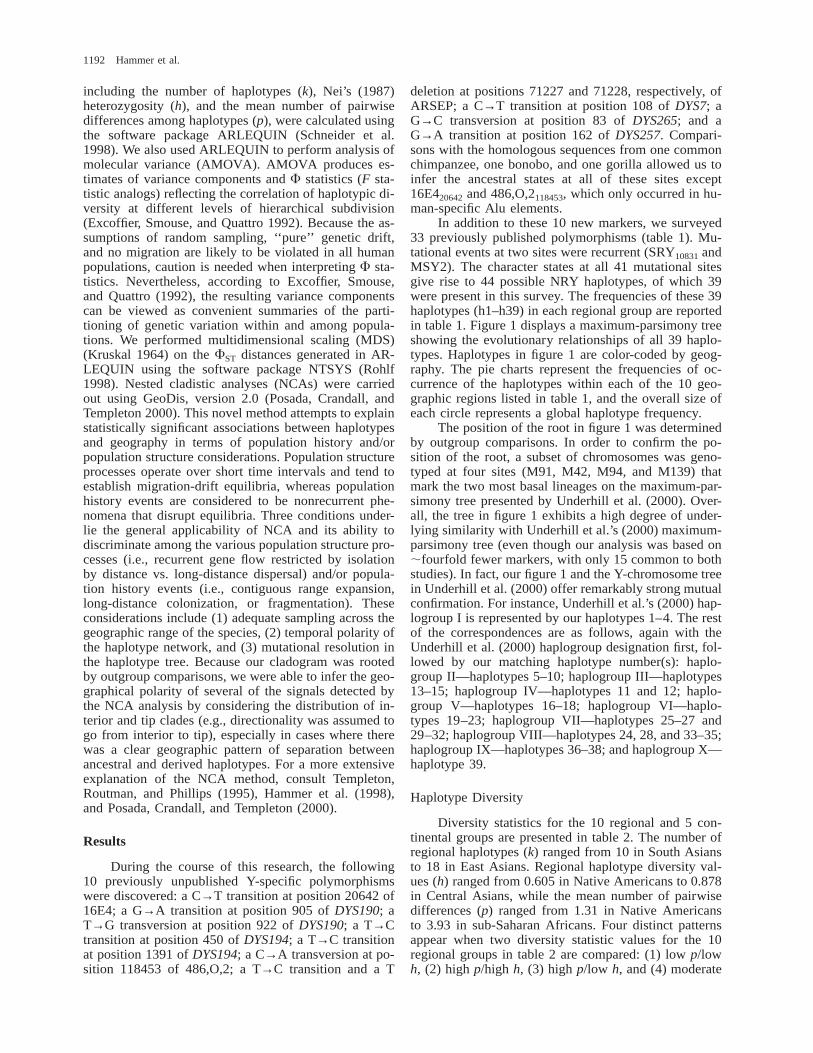
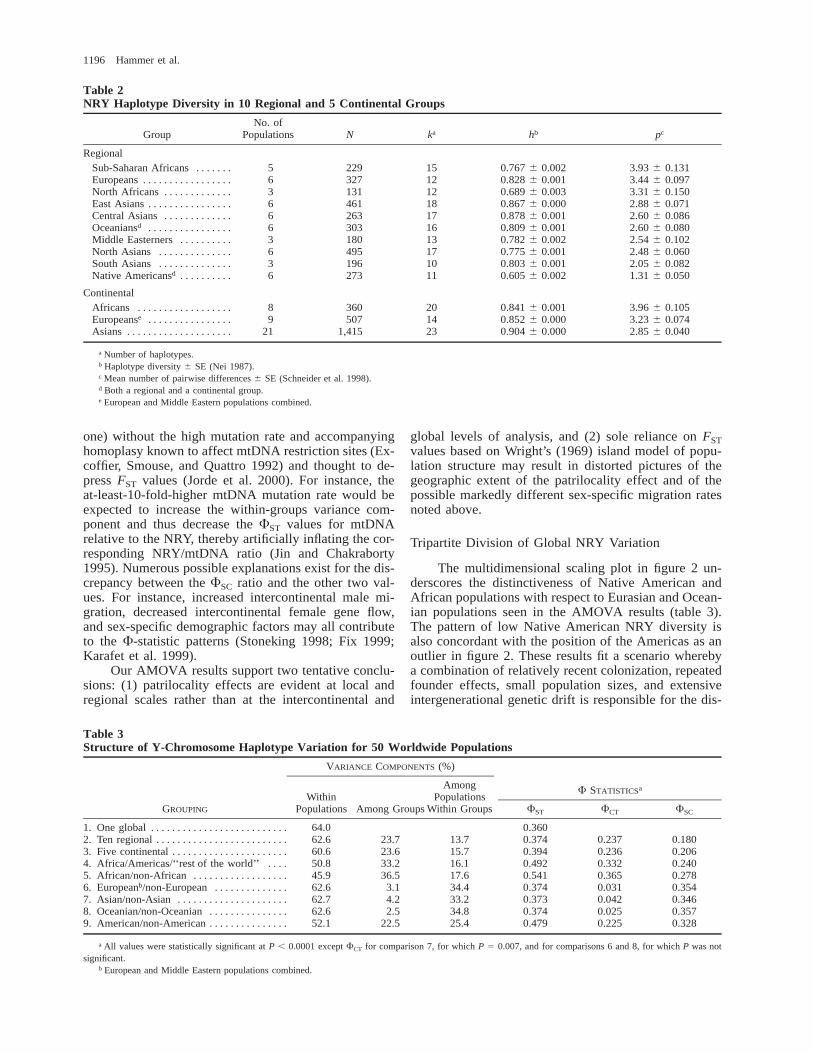
Figure 2 shows the results of multidimensionalscaling based on FST genetic distances, as well as FCTvalues for the three intercluster comparisons. The cor-relation between the original FST molecular distancematrix and a Euclidean distance matrix derived from thetwo-dimensional plot was extremely high (r 5 0.983).Africa, the Americas, and the 36 remaining populationsformed three distinct clusters, paralleling the results ofAMOVA.
Nested Cladistic Analysis
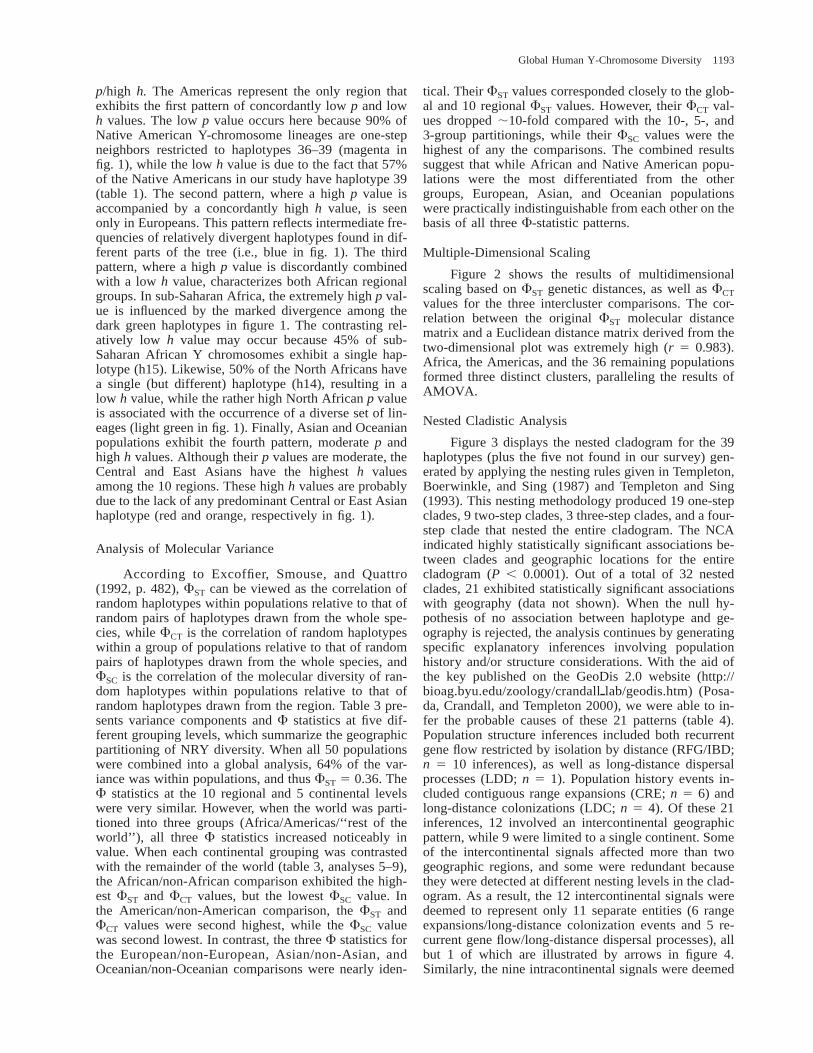
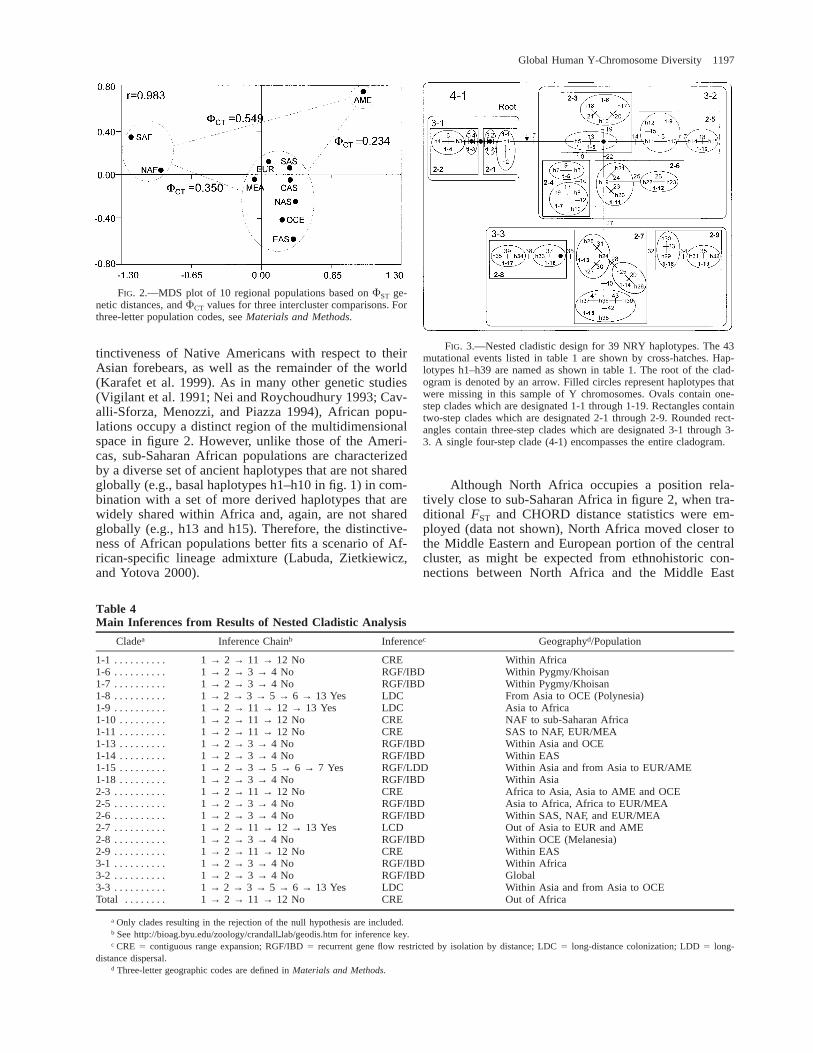
Figure 3 displays the nested cladogram for the 39haplotypes (plus the five not found in our survey) gen-erated by applying the nesting rules given in Templeton,Boerwinkle, and Sing (1987) and Templeton and Sing(1993). This nesting methodology produced 19 one-stepclades, 9 two-step clades, 3 three-step clades, and a four-step clade that nested the entire cladogram. The NCAindicated highly statistically significant associations be-tween clades and geographic locations for the entirecladogram (P , 0.0001). Out of a total of 32 nestedclades, 21 exhibited statistically significant associationswith geography (data not shown). When the null hy-pothesis of no association between haplotype and ge-ography is rejected, the analysis continues by generatingspecific explanatory inferences involving populationhistory and/or structure considerations. With the aid ofthe key published on the GeoDis 2.0 website (http://bioag.byu.edu/zoology/crandallplab/geodis.htm) (Posa-da, Crandall, and Templeton 2000), we were able to in-fer the probable causes of these 21 patterns (table 4).Population structure inferences included both recurrentgene flow restricted by isolation by distance (RFG/IBD;n 5 10 inferences), as well as long-distance dispersalprocesses (LDD; n 5 1). Population history events in-cluded contiguous range expansions (CRE; n 5 6) andlong-distance colonizations (LDC; n 5 4). Of these 21inferences, 12 involved an intercontinental geographicpattern, while 9 were limited to a single continent. Someof the intercontinental signals affected more than twogeographic regions, and some were redundant becausethey were detected at different nesting levels in the clad-ogram. As a result, the 12 intercontinental signals weredeemed to represent only 11 separate entities (6 rangeexpansions/long-distance colonization events and 5 re-current gene flow/long-distance dispersal processes), allbut 1 of which are illustrated by arrows in figure 4.Similarly, the nine intracontinental signals were deemed
1194 Hammer et al.
Global Human Y-Chromosome Diversity 1195
←
FIG. 1.—Evolutionary tree for 39 NRY haplotypes. The 43 mutational events listed in table 1 are shown by cross-hatches. Haplotypesnumbered h1–h39 in circles correspond to designations in table 1. The root of the genetree is denoted by an arrow. Haplotypes are color-codedby geography (see figure for color-coding key). The pie charts represent the frequencies of occurrence of the haplotypes within each of the 10geographic regions listed in table 1. The overall size of each pie chart corresponds to one of five frequency classes (see figure for frequencyclass key) and represents the frequency of that haplotype in the global sample of 2,858 chromosomes.
to represent only eight separate signals (shown as arrowswithin circles in fig. 4). The remaining intercontinentalsignal involving global gene flow (via isolation by dis-tance) is not depicted in figure 4 because it had no in-herent polarity. As in our earlier global nested cladisticanalyses (Hammer et al. 1998; Karafet et al. 1999), acontiguous range expansion out of Africa was detectedat the level of the total cladogram (denoted by the widestblack arrow in fig. 4).
DiscussionEvolutionary Tree for NRY Haplotypes
The root of the gene tree in figure 1 fell betweentwo sets of haplotypes (h1–h4 and h5–h10) that are en-tirely restricted to the continent of Africa (table 1),thereby supporting the hypothesis of an African originof contemporary NRY lineages (Hammer et al. 1998;Underhill et al. 2000). Haplotype 1 represents the ‘‘an-cestral’’ human NRY haplotype (previously designatedhaplotype 1A in Hammer et al. 1998), which is foundat relatively high frequencies in Khoisan populations.Haplotype 2, a one-step neighbor of h1, was found in;14% of Ethiopian chromosomes in this study, as wellas in 42% of Underhill et al.’s (1997) Sudanese samples.The predominantly East African distribution of h1 andh2 (data not shown) lends support to the hypothesis ofa remnant archaic gene pool along the African rift anda possible wider East African range for the ancestors ofthe Khoisan (Scozzari et al. 1999). Other than the twoaforementioned sets of haplotypes confined to Africaand a set of YAP1 haplotypes (h13–h15), all haplotypesin the remainder of the tree were absent or very rare insub-Saharan African populations.
In contrast to other kinds of genetic data (Prze-worski, Hudson, and Di Rienzo 2000), both our presentNRY tree and that of Underhill et al. (2000) clearly in-dicate that haplotypes found outside of Africa are not asubset of those found within Africa. However, the NRYtree does show a branching pattern similar to that seenin the gene trees of several other loci: African-specificbranches are found on both sides of the root of the treeand are separated from the remaining sets of Africanand non-African branches (Labuda, Zietkiewicz, andYotova 2000).
Apportionment of NRY Biallelic Diversity
This study represents the most extensive F-statisticanalysis utilizing Y-chromosome biallelic markers todate combining sample size, geographic coverage, andnumber of markers. Caution should be exercised whencomparing variance partitions among studies because re-sults will depend on which populations are sampled,
how the populations are grouped (nested), and what un-derlying models of population structure are assumed(Urbanek, Goldman, and Long 1996). With this caveatin mind, a sample of previously reported total among-groups variation values (whether measured by FST, FST,or GST) for Y-specific RFLPs and/or SNPs was found torange from 0.230 to 0.645 (Hammer et al. 1997; Poloniet al. 1997; Seielstad, Minch, and Cavalli-Sforza 1998;Kittles et al. 1999; Jorde et al. 2000). Our global FST
value of 0.360 is only slightly lower than the mean value(0.413) calculated from the five studies cited above. Po-loni et al. (1997) cautioned that their FST value of 0.230may be an underestimate in part because of recurrentmutation acting on the p49a,f/TaqI polymorphic system.It is not clear why the FST value of 0.645 reported bySeielstad, Minch, and Cavalli-Sforza (1998) based onthe data presented in Underhill et al. (1997) is so muchhigher than the value reported here. When we analyzedthe Underhill et al. (1997) data set using the 10 popu-lation groupings provided in their figure 2, we obtaineda FST value of 0.540 and an FST value of 0.414.
In general, the within-populations variance com-ponent for Y-chromosome data is much smaller than thevalues reported for mtDNA (Excoffier, Smouse, andQuattro 1992; Seielstad, Minch, and Cavalli-Sforza1998; Kittles et al. 1999; Jorde et al. 2000). On the otherhand, the among-groups and the among-populations-within-groups component values for Y chromosomesusually exceed those for mtDNA. Seielstad, Minch, andCavalli-Sforza (1998) appealed to a lower transgenera-tional migration rate for males as the major explanatoryfactor for why their Y-chromosome FST value (0.645)was so much higher than the mtDNA-based value theyrecalculated from Excoffier, Smouse, and Quattro’s(1992) data (0.186). Their estimated eightfold higher fe-male migration rate was attributed to patrilocality op-erating primarily at the local and perhaps regional levels(Seielstad, Minch, and Cavalli-Sforza 1998). Althoughthe majority of human societies practice patrilocality(Murdock 1967), it is unclear whether this effect extendsto intercontinental and global levels (Stoneking 1998).In order to investigate this proposition, we analyzed ourY-chromosome data according to the grouping designpresented in Excoffier, Smouse, and Quattro (1992) (al-beit with different samples), thereby permitting a com-parison of the F statistics generated from our Y-chro-mosome data with those derived from a global mtDNARFLP data set. Although the ‘‘patrilocality effect’’ wasextremely clear at the interregional level within conti-nents (FSC ratio 5 4.4), it was much less apparent atthe intercontinental level (FCT ratio 5 1.4) or at theglobal level (FST ratio 5 1.7). It is even possible thatthe latter two ratios would be closer to one (or less than
1196 Hammer et al.
Table 2NRY Haplotype Diversity in 10 Regional and 5 Continental Groups
GroupNo. of
Populations N ka hb pc
RegionalSub-Saharan Africans . . . . . . .Europeans . . . . . . . . . . . . . . . . .North Africans . . . . . . . . . . . . .East Asians . . . . . . . . . . . . . . . .Central Asians . . . . . . . . . . . . .Oceaniansd . . . . . . . . . . . . . . . .Middle Easterners . . . . . . . . . .North Asians . . . . . . . . . . . . . .South Asians . . . . . . . . . . . . . .Native Americansd . . . . . . . . . .
5636663636
229327131461263303180495196273
15121218171613171011
0.767 6 0.0020.828 6 0.0010.689 6 0.0030.867 6 0.0000.878 6 0.0010.809 6 0.0010.782 6 0.0020.775 6 0.0010.803 6 0.0010.605 6 0.002
3.93 6 0.1313.44 6 0.0973.31 6 0.1502.88 6 0.0712.60 6 0.0862.60 6 0.0802.54 6 0.1022.48 6 0.0602.05 6 0.0821.31 6 0.050
ContinentalAfricans . . . . . . . . . . . . . . . . . .Europeanse . . . . . . . . . . . . . . . .Asians . . . . . . . . . . . . . . . . . . . .
89
21
360507
1,415
201423
0.841 6 0.0010.852 6 0.0000.904 6 0.000
3.96 6 0.1053.23 6 0.0742.85 6 0.040
a Number of haplotypes.b Haplotype diversity 6 SE (Nei 1987).c Mean number of pairwise differences 6 SE (Schneider et al. 1998).d Both a regional and a continental group.e European and Middle Eastern populations combined.
Table 3Structure of Y-Chromosome Haplotype Variation for 50 Worldwide Populations
GROUPING
VARIANCE COMPONENTS (%)
WithinPopulations Among Groups
AmongPopulations
Within Groups
F STATISTICSa
FST FCT FSC
1. One global . . . . . . . . . . . . . . . . . . . . . . . . . .2. Ten regional . . . . . . . . . . . . . . . . . . . . . . . . .3. Five continental . . . . . . . . . . . . . . . . . . . . . .4. Africa/Americas/‘‘rest of the world’’ . . . .5. African/non-African . . . . . . . . . . . . . . . . . .6. Europeanb/non-European . . . . . . . . . . . . . .7. Asian/non-Asian . . . . . . . . . . . . . . . . . . . . .8. Oceanian/non-Oceanian . . . . . . . . . . . . . . .9. American/non-American . . . . . . . . . . . . . . .
64.062.660.650.845.962.662.762.652.1
23.723.633.236.5
3.14.22.5
22.5
13.715.716.117.634.433.234.825.4
0.3600.3740.3940.4920.5410.3740.3730.3740.479
0.2370.2360.3320.3650.0310.0420.0250.225
0.1800.2060.2400.2780.3540.3460.3570.328
a All values were statistically significant at P , 0.0001 except FCT for comparison 7, for which P 5 0.007, and for comparisons 6 and 8, for which P was notsignificant.
b European and Middle Eastern populations combined.
one) without the high mutation rate and accompanyinghomoplasy known to affect mtDNA restriction sites (Ex-coffier, Smouse, and Quattro 1992) and thought to de-press FST values (Jorde et al. 2000). For instance, theat-least-10-fold-higher mtDNA mutation rate would beexpected to increase the within-groups variance com-ponent and thus decrease the FST values for mtDNArelative to the NRY, thereby artificially inflating the cor-responding NRY/mtDNA ratio (Jin and Chakraborty1995). Numerous possible explanations exist for the dis-crepancy between the FSC ratio and the other two val-ues. For instance, increased intercontinental male mi-gration, decreased intercontinental female gene flow,and sex-specific demographic factors may all contributeto the F-statistic patterns (Stoneking 1998; Fix 1999;Karafet et al. 1999).
Our AMOVA results support two tentative conclu-sions: (1) patrilocality effects are evident at local andregional scales rather than at the intercontinental and
global levels of analysis, and (2) sole reliance on FSTvalues based on Wright’s (1969) island model of popu-lation structure may result in distorted pictures of thegeographic extent of the patrilocality effect and of thepossible markedly different sex-specific migration ratesnoted above.
Tripartite Division of Global NRY Variation
The multidimensional scaling plot in figure 2 un-derscores the distinctiveness of Native American andAfrican populations with respect to Eurasian and Ocean-ian populations seen in the AMOVA results (table 3).The pattern of low Native American NRY diversity isalso concordant with the position of the Americas as anoutlier in figure 2. These results fit a scenario wherebya combination of relatively recent colonization, repeatedfounder effects, small population sizes, and extensiveintergenerational genetic drift is responsible for the dis-
Global Human Y-Chromosome Diversity 1197
FIG. 2.—MDS plot of 10 regional populations based on FST ge-netic distances, and FCT values for three intercluster comparisons. Forthree-letter population codes, see Materials and Methods.
FIG. 3.—Nested cladistic design for 39 NRY haplotypes. The 43mutational events listed in table 1 are shown by cross-hatches. Hap-lotypes h1–h39 are named as shown in table 1. The root of the clad-ogram is denoted by an arrow. Filled circles represent haplotypes thatwere missing in this sample of Y chromosomes. Ovals contain one-step clades which are designated 1-1 through 1-19. Rectangles containtwo-step clades which are designated 2-1 through 2-9. Rounded rect-angles contain three-step clades which are designated 3-1 through 3-3. A single four-step clade (4-1) encompasses the entire cladogram.
Table 4Main Inferences from Results of Nested Cladistic Analysis
Cladea Inference Chainb Inferencec Geographyd/Population
1-1 . . . . . . . . . .1-6 . . . . . . . . . .1-7 . . . . . . . . . .1-8 . . . . . . . . . .1-9 . . . . . . . . . .1-10 . . . . . . . . .1-11 . . . . . . . . .1-13 . . . . . . . . .1-14 . . . . . . . . .1-15 . . . . . . . . .1-18 . . . . . . . . .2-3 . . . . . . . . . .2-5 . . . . . . . . . .2-6 . . . . . . . . . .2-7 . . . . . . . . . .2-8 . . . . . . . . . .2-9 . . . . . . . . . .3-1 . . . . . . . . . .3-2 . . . . . . . . . .
1 → 2 → 11 → 12 No1 → 2 → 3 → 4 No1 → 2 → 3 → 4 No1 → 2 → 3 → 5 → 6 → 13 Yes1 → 2 → 11 → 12 → 13 Yes1 → 2 → 11 → 12 No1 → 2 → 11 → 12 No1 → 2 → 3 → 4 No1 → 2 → 3 → 4 No1 → 2 → 3 → 5 → 6 → 7 Yes1 → 2 → 3 → 4 No1 → 2 → 11 → 12 No1 → 2 → 3 → 4 No1 → 2 → 3 → 4 No1 → 2 → 11 → 12 → 13 Yes1 → 2 → 3 → 4 No1 → 2 → 11 → 12 No1 → 2 → 3 → 4 No1 → 2 → 3 → 4 No
CRERGF/IBDRGF/IBDLDCLDCCRECRERGF/IBDRGF/IBDRGF/LDDRGF/IBDCRERGF/IBDRGF/IBDLCDRGF/IBDCRERGF/IBDRGF/IBD
Within AfricaWithin Pygmy/KhoisanWithin Pygmy/KhoisanFrom Asia to OCE (Polynesia)Asia to AfricaNAF to sub-Saharan AfricaSAS to NAF, EUR/MEAWithin Asia and OCEWithin EASWithin Asia and from Asia to EUR/AMEWithin AsiaAfrica to Asia, Asia to AME and OCEAsia to Africa, Africa to EUR/MEAWithin SAS, NAF, and EUR/MEAOut of Asia to EUR and AMEWithin OCE (Melanesia)Within EASWithin AfricaGlobal
3-3 . . . . . . . . . .Total . . . . . . . .
1 → 2 → 3 → 5 → 6 → 13 Yes1 → 2 → 11 → 12 No
LDCCRE
Within Asia and from Asia to OCEOut of Africa
a Only clades resulting in the rejection of the null hypothesis are included.b See http://bioag.byu.edu/zoology/crandallplab/geodis.htm for inference key.c CRE 5 contiguous range expansion; RGF/IBD 5 recurrent gene flow restricted by isolation by distance; LDC 5 long-distance colonization; LDD 5 long-
distance dispersal.d Three-letter geographic codes are defined in Materials and Methods.
tinctiveness of Native Americans with respect to theirAsian forebears, as well as the remainder of the world(Karafet et al. 1999). As in many other genetic studies(Vigilant et al. 1991; Nei and Roychoudhury 1993; Cav-alli-Sforza, Menozzi, and Piazza 1994), African popu-lations occupy a distinct region of the multidimensionalspace in figure 2. However, unlike those of the Ameri-cas, sub-Saharan African populations are characterizedby a diverse set of ancient haplotypes that are not sharedglobally (e.g., basal haplotypes h1–h10 in fig. 1) in com-bination with a set of more derived haplotypes that arewidely shared within Africa and, again, are not sharedglobally (e.g., h13 and h15). Therefore, the distinctive-ness of African populations better fits a scenario of Af-rican-specific lineage admixture (Labuda, Zietkiewicz,and Yotova 2000).
Although North Africa occupies a position rela-tively close to sub-Saharan Africa in figure 2, when tra-ditional FST and CHORD distance statistics were em-ployed (data not shown), North Africa moved closer tothe Middle Eastern and European portion of the centralcluster, as might be expected from ethnohistoric con-nections between North Africa and the Middle East
1198 Hammer et al.
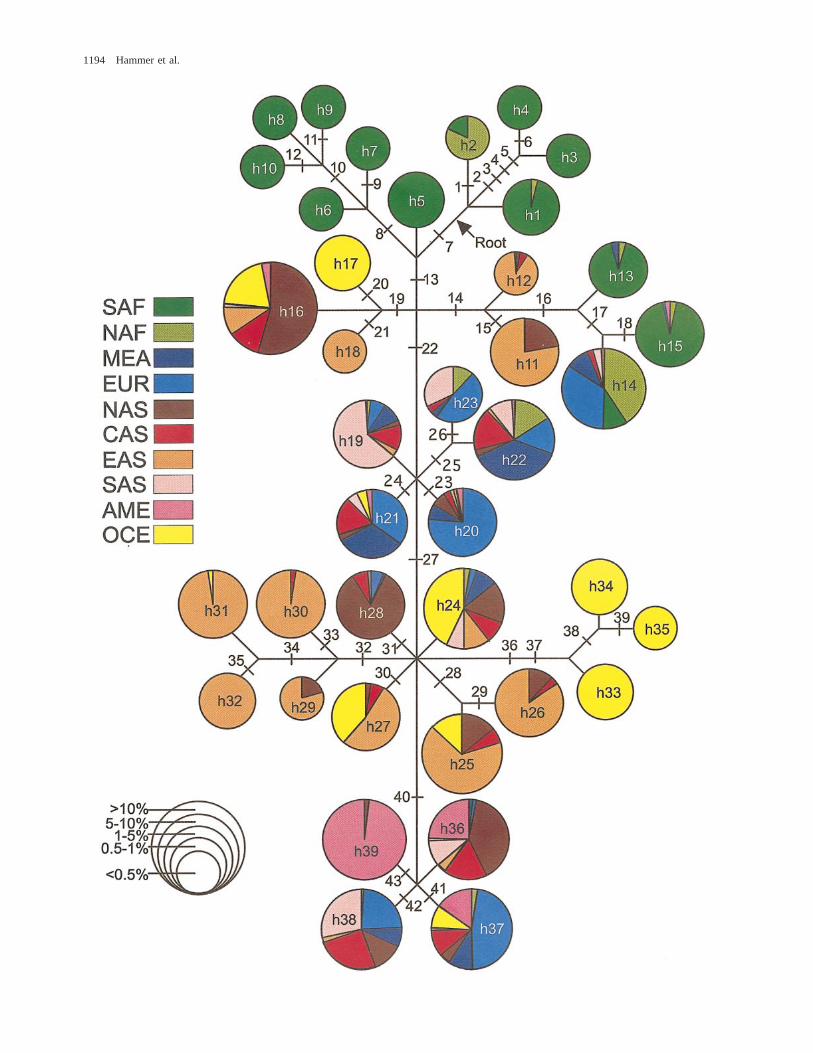
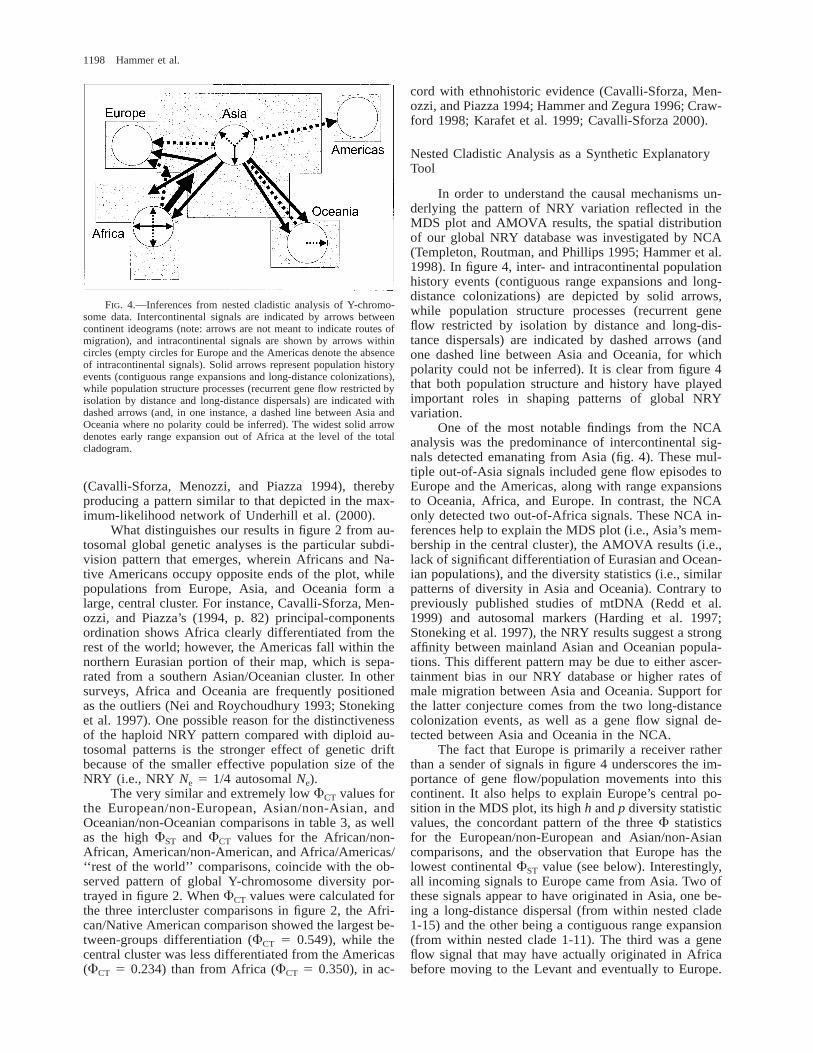
FIG. 4.—Inferences from nested cladistic analysis of Y-chromo-some data. Intercontinental signals are indicated by arrows betweencontinent ideograms (note: arrows are not meant to indicate routes ofmigration), and intracontinental signals are shown by arrows withincircles (empty circles for Europe and the Americas denote the absenceof intracontinental signals). Solid arrows represent population historyevents (contiguous range expansions and long-distance colonizations),while population structure processes (recurrent gene flow restricted byisolation by distance and long-distance dispersals) are indicated withdashed arrows (and, in one instance, a dashed line between Asia andOceania where no polarity could be inferred). The widest solid arrowdenotes early range expansion out of Africa at the level of the totalcladogram.
(Cavalli-Sforza, Menozzi, and Piazza 1994), therebyproducing a pattern similar to that depicted in the max-imum-likelihood network of Underhill et al. (2000).
What distinguishes our results in figure 2 from au-tosomal global genetic analyses is the particular subdi-vision pattern that emerges, wherein Africans and Na-tive Americans occupy opposite ends of the plot, whilepopulations from Europe, Asia, and Oceania form alarge, central cluster. For instance, Cavalli-Sforza, Men-ozzi, and Piazza’s (1994, p. 82) principal-componentsordination shows Africa clearly differentiated from therest of the world; however, the Americas fall within thenorthern Eurasian portion of their map, which is sepa-rated from a southern Asian/Oceanian cluster. In othersurveys, Africa and Oceania are frequently positionedas the outliers (Nei and Roychoudhury 1993; Stonekinget al. 1997). One possible reason for the distinctivenessof the haploid NRY pattern compared with diploid au-tosomal patterns is the stronger effect of genetic driftbecause of the smaller effective population size of theNRY (i.e., NRY Ne 5 1/4 autosomal Ne).
The very similar and extremely low FCT values forthe European/non-European, Asian/non-Asian, andOceanian/non-Oceanian comparisons in table 3, as wellas the high FST and FCT values for the African/non-African, American/non-American, and Africa/Americas/‘‘rest of the world’’ comparisons, coincide with the ob-served pattern of global Y-chromosome diversity por-trayed in figure 2. When FCT values were calculated forthe three intercluster comparisons in figure 2, the Afri-can/Native American comparison showed the largest be-tween-groups differentiation (FCT 5 0.549), while thecentral cluster was less differentiated from the Americas(FCT 5 0.234) than from Africa (FCT 5 0.350), in ac-
cord with ethnohistoric evidence (Cavalli-Sforza, Men-ozzi, and Piazza 1994; Hammer and Zegura 1996; Craw-ford 1998; Karafet et al. 1999; Cavalli-Sforza 2000).
Nested Cladistic Analysis as a Synthetic ExplanatoryTool
In order to understand the causal mechanisms un-derlying the pattern of NRY variation reflected in theMDS plot and AMOVA results, the spatial distributionof our global NRY database was investigated by NCA(Templeton, Routman, and Phillips 1995; Hammer et al.1998). In figure 4, inter- and intracontinental populationhistory events (contiguous range expansions and long-distance colonizations) are depicted by solid arrows,while population structure processes (recurrent geneflow restricted by isolation by distance and long-dis-tance dispersals) are indicated by dashed arrows (andone dashed line between Asia and Oceania, for whichpolarity could not be inferred). It is clear from figure 4that both population structure and history have playedimportant roles in shaping patterns of global NRYvariation.
One of the most notable findings from the NCAanalysis was the predominance of intercontinental sig-nals detected emanating from Asia (fig. 4). These mul-tiple out-of-Asia signals included gene flow episodes toEurope and the Americas, along with range expansionsto Oceania, Africa, and Europe. In contrast, the NCAonly detected two out-of-Africa signals. These NCA in-ferences help to explain the MDS plot (i.e., Asia’s mem-bership in the central cluster), the AMOVA results (i.e.,lack of significant differentiation of Eurasian and Ocean-ian populations), and the diversity statistics (i.e., similarpatterns of diversity in Asia and Oceania). Contrary topreviously published studies of mtDNA (Redd et al.1999) and autosomal markers (Harding et al. 1997;Stoneking et al. 1997), the NRY results suggest a strongaffinity between mainland Asian and Oceanian popula-tions. This different pattern may be due to either ascer-tainment bias in our NRY database or higher rates ofmale migration between Asia and Oceania. Support forthe latter conjecture comes from the two long-distancecolonization events, as well as a gene flow signal de-tected between Asia and Oceania in the NCA.
The fact that Europe is primarily a receiver ratherthan a sender of signals in figure 4 underscores the im-portance of gene flow/population movements into thiscontinent. It also helps to explain Europe’s central po-sition in the MDS plot, its high h and p diversity statisticvalues, the concordant pattern of the three F statisticsfor the European/non-European and Asian/non-Asiancomparisons, and the observation that Europe has thelowest continental FST value (see below). Interestingly,all incoming signals to Europe came from Asia. Two ofthese signals appear to have originated in Asia, one be-ing a long-distance dispersal (from within nested clade1-15) and the other being a contiguous range expansion(from within nested clade 1-11). The third was a geneflow signal that may have actually originated in Africabefore moving to the Levant and eventually to Europe.
Global Human Y-Chromosome Diversity 1199
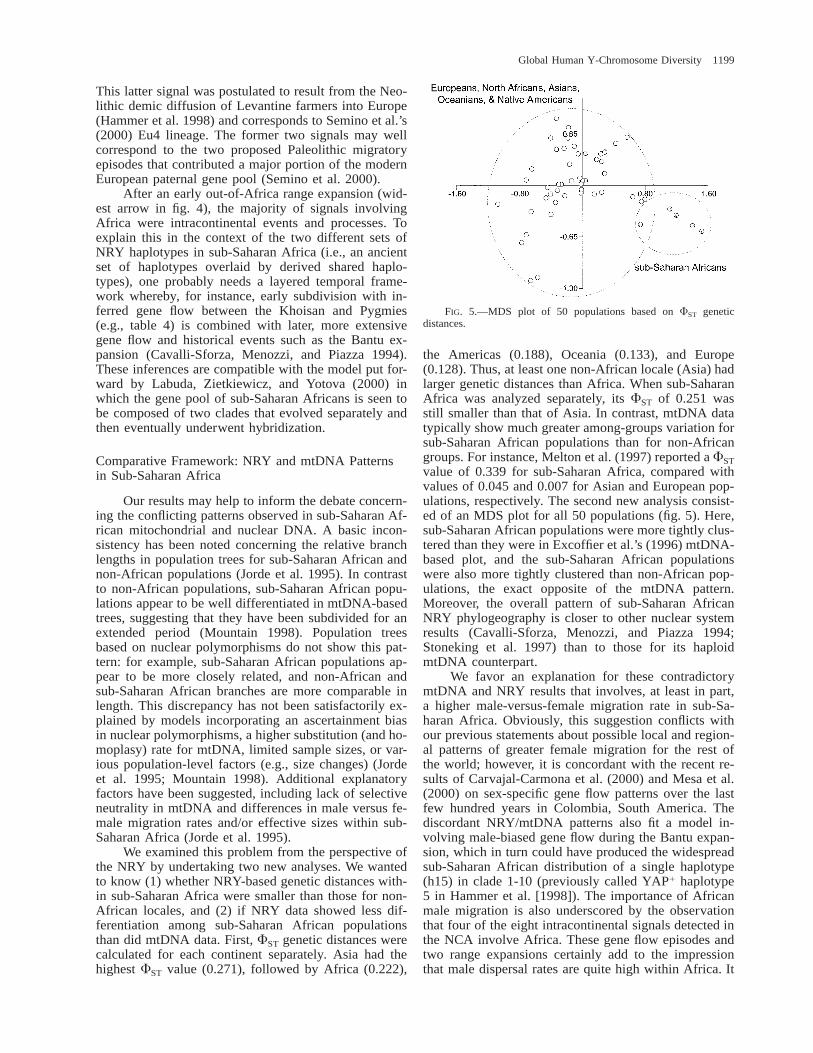
FIG. 5.—MDS plot of 50 populations based on FST geneticdistances.
This latter signal was postulated to result from the Neo-lithic demic diffusion of Levantine farmers into Europe(Hammer et al. 1998) and corresponds to Semino et al.’s(2000) Eu4 lineage. The former two signals may wellcorrespond to the two proposed Paleolithic migratoryepisodes that contributed a major portion of the modernEuropean paternal gene pool (Semino et al. 2000).
After an early out-of-Africa range expansion (wid-est arrow in fig. 4), the majority of signals involvingAfrica were intracontinental events and processes. Toexplain this in the context of the two different sets ofNRY haplotypes in sub-Saharan Africa (i.e., an ancientset of haplotypes overlaid by derived shared haplo-types), one probably needs a layered temporal frame-work whereby, for instance, early subdivision with in-ferred gene flow between the Khoisan and Pygmies(e.g., table 4) is combined with later, more extensivegene flow and historical events such as the Bantu ex-pansion (Cavalli-Sforza, Menozzi, and Piazza 1994).These inferences are compatible with the model put for-ward by Labuda, Zietkiewicz, and Yotova (2000) inwhich the gene pool of sub-Saharan Africans is seen tobe composed of two clades that evolved separately andthen eventually underwent hybridization.
Comparative Framework: NRY and mtDNA Patternsin Sub-Saharan Africa
Our results may help to inform the debate concern-ing the conflicting patterns observed in sub-Saharan Af-rican mitochondrial and nuclear DNA. A basic incon-sistency has been noted concerning the relative branchlengths in population trees for sub-Saharan African andnon-African populations (Jorde et al. 1995). In contrastto non-African populations, sub-Saharan African popu-lations appear to be well differentiated in mtDNA-basedtrees, suggesting that they have been subdivided for anextended period (Mountain 1998). Population treesbased on nuclear polymorphisms do not show this pat-tern: for example, sub-Saharan African populations ap-pear to be more closely related, and non-African andsub-Saharan African branches are more comparable inlength. This discrepancy has not been satisfactorily ex-plained by models incorporating an ascertainment biasin nuclear polymorphisms, a higher substitution (and ho-moplasy) rate for mtDNA, limited sample sizes, or var-ious population-level factors (e.g., size changes) (Jordeet al. 1995; Mountain 1998). Additional explanatoryfactors have been suggested, including lack of selectiveneutrality in mtDNA and differences in male versus fe-male migration rates and/or effective sizes within sub-Saharan Africa (Jorde et al. 1995).
We examined this problem from the perspective ofthe NRY by undertaking two new analyses. We wantedto know (1) whether NRY-based genetic distances with-in sub-Saharan Africa were smaller than those for non-African locales, and (2) if NRY data showed less dif-ferentiation among sub-Saharan African populationsthan did mtDNA data. First, FST genetic distances werecalculated for each continent separately. Asia had thehighest FST value (0.271), followed by Africa (0.222),
the Americas (0.188), Oceania (0.133), and Europe(0.128). Thus, at least one non-African locale (Asia) hadlarger genetic distances than Africa. When sub-SaharanAfrica was analyzed separately, its FST of 0.251 wasstill smaller than that of Asia. In contrast, mtDNA datatypically show much greater among-groups variation forsub-Saharan African populations than for non-Africangroups. For instance, Melton et al. (1997) reported a FSTvalue of 0.339 for sub-Saharan Africa, compared withvalues of 0.045 and 0.007 for Asian and European pop-ulations, respectively. The second new analysis consist-ed of an MDS plot for all 50 populations (fig. 5). Here,sub-Saharan African populations were more tightly clus-tered than they were in Excoffier et al.’s (1996) mtDNA-based plot, and the sub-Saharan African populationswere also more tightly clustered than non-African pop-ulations, the exact opposite of the mtDNA pattern.Moreover, the overall pattern of sub-Saharan AfricanNRY phylogeography is closer to other nuclear systemresults (Cavalli-Sforza, Menozzi, and Piazza 1994;Stoneking et al. 1997) than to those for its haploidmtDNA counterpart.
We favor an explanation for these contradictorymtDNA and NRY results that involves, at least in part,a higher male-versus-female migration rate in sub-Sa-haran Africa. Obviously, this suggestion conflicts withour previous statements about possible local and region-al patterns of greater female migration for the rest ofthe world; however, it is concordant with the recent re-sults of Carvajal-Carmona et al. (2000) and Mesa et al.(2000) on sex-specific gene flow patterns over the lastfew hundred years in Colombia, South America. Thediscordant NRY/mtDNA patterns also fit a model in-volving male-biased gene flow during the Bantu expan-sion, which in turn could have produced the widespreadsub-Saharan African distribution of a single haplotype(h15) in clade 1-10 (previously called YAP1 haplotype5 in Hammer et al. [1998]). The importance of Africanmale migration is also underscored by the observationthat four of the eight intracontinental signals detected inthe NCA involve Africa. These gene flow episodes andtwo range expansions certainly add to the impressionthat male dispersal rates are quite high within Africa. It
1200 Hammer et al.
is also possible that other factors (such as selection; seenext section) are responsible for producing the discor-dant picture of mtDNA and NRY results (Hey 1997).
Conclusions, Caveats, and Future Directions
Previous global nested cladistic analyses of humanNRY variation (Hammer et al. 1998; Karafet et al. 1999)have demonstrated patterns of diversity unlike thoseprovided by mtDNA (Templeton 1993, 1997, 1999) orautosomal systems (Harding et al. 1997). For instance,Templeton’s (1993, 1997, 1999) nested cladistic analy-ses of human mtDNA data are all highlighted at thedeepest level by pervasive gene flow restricted by iso-lation by distance throughout Africa and southern Eur-asia for the entire time to the most recent common an-cestor (TMRCA) of mtDNA. A similar extensive world-wide Late Pleistocene gene flow signal was detected atthe b-globin locus (Harding et al. 1997; Templeton1999), the only global autosomal data set analyzed byTempleton, Routman, and Phillips’ (1995) nested cla-distic procedures. In contrast, all three of our nested cla-distic analyses detected a global contiguous range ex-pansion out of Africa at the level of the entire clado-gram. In the present NCA, the two deepest gene flowsignals were only at the three-step level: one occurredglobally, while the other was restricted to the continentof Africa. Our new results support a general scenario inwhich, after an early out-of-Africa range expansion,global-scale patterns of NRY variation were mainly in-fluenced by migrations out of Asia. Moreover, the great-er degree of contact detected by the NCA among Asia,Europe, and Oceania (via both population structure pro-cesses and population history events) helps to explainthe observed pattern of global NRY diversity.
A major conclusion of the present work is thatglobal human NRY variation is structured, with a sig-nificant amount of intergroup variation partitionedamong African, Native American, and Eurasian/Ocean-ian populations. There was also a significant degree ofamong-populations variation at the intracontinental lev-el; the degree of structure at lower levels of populationsubdivision remains to be determined.
It should be noted that the pattern of subdivisiondetected here could also be explained by models thatinvolve natural selection or a combination of microevo-lutionary forces including selection, migration, geneticdrift, and mutation. Additionally, various human socialprocesses, such as polygyny and kin-structured migra-tion, may affect variation on the NRY (Fix 1999). Sup-port for a model involving selection comes from recentfindings demonstrating an excess of rare alleles at siteson the NRY (Underhill et al. 1997; Pritchard et al. 1999;Shen et al. 2000; Thomson et al. 2000). Indeed, ourmutation screening at the DYS188, DYS190, andDYS194 sites on a panel of 58 Y chromosomes fromworldwide samples also yielded a significant excess ofsingleton polymorphisms. This excess of singletons(.twofold more than expected under the hypothesis ofconstant population size) resulted in a significantly neg-ative Fu and Li’s (1997) F* statistic of 22.67 (P ,
0.05). These findings are consistent with models basedon positive directional selection, expansion from a smallpopulation size, and/or ascertainment bias resulting frompoor sampling of a subdivided population system. Ob-viously, more research needs to be focused on distin-guishing the possible causes and implications of popu-lation subdivision in the human paternal gene pool.
It is important to note the limitations of the differ-ent methods employed in this study, as well as theircomplementary nature for inferring the underlying forc-es shaping NRY variation in human populations. TheNCA is stronger at making inferences toward the inte-rior of a cladogram and weaker at inferring processes/events at the tips. Therefore, as more polymorphismsare discovered (see, e.g., Underhill et al. 2000) and theNRY tree becomes more resolved, more inferences con-cerning regional variation will emerge. It is also possiblethat some of the inferences made here will change asmore data are collected. Consequently, we have mainlyfocused on general patterns and have not tried to explainall of the specific signals detected by the NCA. Finally,these methods do not distinguish selection from demo-graphic forces in shaping patterns of diversity.
Standard approaches for the description of popu-lation structure based on Wright’s (1969) island modeland/or F statistics (e.g., AMOVA) do not attempt to dis-entangle past events from contemporary processes andthus can be considered nonhistorical (Turner et al.2000). The combination of nested cladistic and coales-cence analyses can theoretically provide the temporalframework for making these crucial distinctions (Schaaland Olsen 2000). For instance, coalescence analysiscould provide the missing dates needed to clarify therelative chronology of the many signals in figure 4. Ourtwo previous coalescence analyses of Y-chromosomedata (Hammer et al. 1998; Karafet et al. 1999) wereperformed without population growth or subdivision pa-rameters in the model. Growth has been shown to de-crease TMRCA estimates (Pritchard et al. 1999; Thom-son et al. 2000). We are presently collaborating with R.C. Griffiths who is developing coalescence analyses in-corporating both population growth and subdivision.Population growth should decrease our previously pub-lished mutational ages and TMRCA estimates (Hammeret al. 1998; Karafet et al. 1999), while population sub-division should have the opposite effect.
Acknowledgments
We gratefully acknowledge the excellent laboratoryassistance of Roxane Bonner, Matthew Kaplan, AgnishChakravarti, Christine Ponder, Ji Park, Abdel-Halim Sa-lem, Hwayong Park, and Ammon Corl. We thank Eliz-abeth Wood, Tasha Altheide, Christopher Tillquist, Rob-ert Griffiths, Alan Templeton, and Michael Nachman forhelpful discussions and comments on earlier versions ofthe manuscript. We also thank our generous collabora-tors who provided DNA samples. This publication wasmade possible by grant GM-53566 from the NationalInstitute of General Medical Sciences and grant OPP-9806759 from the National Science Foundation (to
Global Human Y-Chromosome Diversity 1201
M.F.H.). Its contents are solely the responsibility of theauthors and do not necessarily represent the officialviews of the NIH or the NSF.
LITERATURE CITED
ALLEN, B. S., and H. OSTRER. 1994. Conservation of humanY chromosome sequences among male great apes: impli-cations for the evolution of Y chromosomes. J. Mol. Evol.39:13–21.
BAO, W., S. ZHU, A. PANDYA, T. ZERJAL, J. XU, Q. SHU, R.DU, H. YANG, and C. TYLER-SMITH. 2000. MSY2: a slowlyevolving minisatellite on the human Y chromosome whichprovides a useful polymorphic marker in Chinese popula-tions. Gene 244:29–33.
BARBUJANI, G., A. MAGAGNI, E. MINCH, and L. L. CAVALLI-SFORZA. 1997. An apportionment of human DNA diversity.Proc. Natl. Acad. Sci. USA 94:4516–4519.
BATZER, M. A., M. STONEKING, M. ALEGRIA-HARTMAN et al.(11 co-authors). 1994. African origin of human-specificpolymorphic Alu insertions. Proc. Natl. Acad. Sci. USA 91:12288–12292.
BOWCOCK, A., and L. L. CAVALLI-SFORZA. 1991. The study ofvariation in the human genome. Genomics 11:491–498.
CARVAJAL-CARMONA, L. G., I. D. SOTO, N. PINEDA et al. (11co-authors). 2000. Strong Amerind/White sex bias and apossible Sephardic contribution among the founders of apopulation in northwest Colombia. Am. J. Hum. Genet. 67:1287–1295.
CAVALLI-SFORZA, L. L. 2000. Genes, peoples, and languages.North Point Press, New York.
CAVALLI-SFORZA, L. L., P. MENOZZI, and A. PIAZZA. 1994. Thehistory and geography of human genes. Princeton Univer-sity Press, Princeton, N.J.
CAVALLI-SFORZA, L. L., and E. MINCH. 1997. Paleolithic andNeolithic lineages in the European mitochondrial gene pool.Am. J. Hum. Genet. 61:247–254.
CRAWFORD, M. H. 1998. The origins of Native Americans:evidence from anthropological genetics. Cambridge Uni-versity Press, Cambridge, England.
DEKA, R., M. D. SHRIVER, L. M. YU, R. E. FERRELL, and R.CHAKRABORTY. 1995. Intra- and inter-population diversityat short tandem repeat loci in diverse populations of theworld. Electrophoresis 16:1659–1664.
EXCOFFIER, L., E. S. POLONI, S. SANTACHIARA-BENERECETTI,O. SEMINO, and A. LANGANEY. 1996. The molecular diver-sity of the Niokholo Mandenkalu from Eastern Senegal: aninsight into West Africa genetic history. Pp. 141–155 in A.J. BOYCE and C. G. N. MASCIE-TAYLORS, eds. Molecularbiology and human diversity. Cambridge University Press,Cambridge, England.
EXCOFFIER, L., P. E. SMOUSE, and J. M. QUATTRO. 1992. Anal-ysis of molecular variance inferred from metric distancesamong DNA haplotypes: application to human mitochon-drial DNA restriction data. Genetics 131:479–491.
FIX, A. 1999. Migration and colonization in human microevo-lution. Cambridge University Press, New York.
FU, Y., and W.-H. LI. 1997. Statistical tests of neutrality ofmutations against population growth, hitchhiking and back-ground selection. Genetics 147:915–925.
HAMMER, M. F. 1995. A recent common ancestry for humanY-chromosomes. Nature 378:376–378.
HAMMER, M. F., and S. HORAI. 1995. Y chromosomal DNAvariation and the peopling of Japan. Am. J. Hum. Genet.56:951–962.
HAMMER, M. F., T. KARAFET, A. RASANAYAGAM, E. T. WOOD,T. K. ALTHEIDE, T. JENKINS, R. C. GRIFFITHS, A. R. TEM-
PLETON, and S. L. ZEGURA. 1998. Out of Africa and backagain: nested cladistic analysis of human Y chromosomevariation. Mol. Biol. Evol. 15:427–441.
HAMMER, M. F., A. J. REDD, E. T. WOOD et al. (12 co-authors).2000. Jewish and middle eastern non-Jewish populationsshare a common pool of Y-chromosome biallelic haplo-types. Proc. Natl. Acad. Sci. USA 97:6769–6774.
HAMMER, M. F., A. B. SPURDLE, T. KARAFET et al. (11 co-authors). 1997. The geographic distribution of human Ychromosome variation. Genetics 145:787–805.
HAMMER, M. F., and S. L. ZEGURA. 1996. The role of the Ychromosome in human evolutionary studies. Evol. Anthro-pol. 5:116–134.
HARDING, R. M., S. M. FULLERTON, R. C. GRIFFITHS, J. BOND,M. J. COX, J. A. SCHNEIDER, D. S. MOULIN, and J. B.CLEGG. 1997. Archaic African and Asian lineages in thegenetic ancestry of modern humans. Am. J. Hum. Genet.60:772–789.
HEY, J. 1997. Mitochondrial and nuclear genes present con-flicting portraits of human origins. Mol. Biol. Evol. 14:166–172.
JIN, L., and R. CHAKRABORTY. 1995. Population structure,stepwise mutations, heterozygote deficiency and their im-plications in DNA forensics. Heredity 74:274–285.
JOBLING, M. A., V. SAMARA, A. PANDYA et al. (16 co-authors).1996. Recurrent duplication and deletion polymorphisms onthe long arm of the Y chromosome in normal males. Hum.Mol. Genet. 5:1767–1775.
JOBLING, M. A., and C. TYLER-SMITH. 1995. Fathers and sons:the Y chromosome and human evolution. Trends Genet. 11:449–456.
JORDE, L. B., M. J. BAMSHAD, W. S. WATKINS, R. ZENGER, A.E. FRALEY, P. A. KRAKOWIAK, K. D. CARPENTER, H. SOOD-YALL, T. JENKINS, and A. R. ROGERS. 1995. Origins andaffinities of modern humans: a comparison of mitochondrialand nuclear genetic data. Am. J. Hum. Genet. 57:523–538.
JORDE, L. B., W. S. WATKINS, M. J. BAMSHAD, M. E. DIXON,C. E. RICKER, M. T. SEIELSTAD, and M. A. BATZER. 2000.The distribution of human genetic diversity: a comparisonof mitochondrial, autosomal, and Y-chromosome data. Am.J. Hum. Genet. 66:979–988.
KARAFET, T. M., S. L. ZEGURA, O. POSUKH et al. (14 co-au-thors). 1999. Ancestral Asian source(s) of New World Y-chromosome founder haplotypes. Am. J. Hum. Genet. 64:817–831.
KARAFET, T., S. L. ZEGURA, J. VUTURO-BRADY et al. (14 co-authors). 1997. Y chromosome markers and trans-BeringStrait dispersals. Am. J. Phys. Anthropol. 102:301–314.
KITTLES, R. A., A. W. BERGEN, M. URBANEK, M. VIRKKUNEN,M. LINNOILA, D. GOLDMAN, and J. C. LONG. 1999. Auto-somal, mitochondrial, and Y chromosome DNA variationin Finland: evidence for a male-specific bottleneck. Am. J.Phys. Anthropol. 108:381–399.
KRUSKAL, J. B. 1964. Multidimensional scaling by optimizinggoodness of fit to a nonmetric hypothesis. Pyschometrika29:1–27.
LABUDA, D., E. ZIETKIEWICZ, and V. YOTOVA. 2000. Archaiclineages in the history of modern humans. Genetics 156:799–808.
LATTER, B. D. H. 1980. Genetic differences within and be-tween populations of the major human subgroups. Am. Nat.116:220–237.
LEWONTIN, R. C. 1972. The apportionment of human diversity.Evol. Biol. 6:381–398.
MELTON, T., C. GINTHER, G. SENSABAUGH, H. SOODYALL, andM. STONEKING. 1997. Extent of heterogeneity in mitochon-
1202 Hammer et al.
drial DNA of sub-Saharan African populations. J. ForensicSci. 42:582–592.
MESA, N. R., M. C. MONDRAGON, I. D. SOTO et al. (13 co-authors). 2000. Autosomal, mtDNA, and Y-chromosome di-versity in Amerinds: pre- and post-Columbian patterns ofgene flow in South America. Am. J. Hum. Genet. 67:1277–1286.
MOUNTAIN, J. L. 1998. Molecular evolution and modern hu-man origins. Evol. Anthropol. 7:21–37.
MURDOCK, G. P. 1967. Ethnographic atlas. University of Pitts-burgh Press, Pittsburgh, Pa.
NEI, M. 1987. Molecular evolutionary genetics. Columbia Uni-versity Press, New York.
NEI, M., and A. K. ROYCHOUDHURY. 1974. Genic variationwithin and between the three major races of man, Cauca-soids, Negroids, and Mongoloids. Am. J. Hum. Genet. 26:421–443.
———. 1993. Evolutionary relationships of human popula-tions on a global scale. Mol. Biol. Evol. 10:927–943.
PEREZ-LEZAUN, A., F. CALAFELL, D. COMAS et al. (12 co-au-thors). 1999. Sex-specific migration patterns in CentralAsian populations, revealed by analysis of Y-chromosomeshort tandem repeats and mtDNA. Am. J. Hum. Genet. 65:208–219.
POLONI, E. S., O. SEMINO, G. PASSARINO, A. S. SANTACHIARA-BENERECETTI, I. DUPANLOUP, A. LANGANEY, and L. EX-COFFIER. 1997. Human genetic affinities for Y-chromosomeP49a,f/TaqI haplotypes show strong correspondence withlinguistics. Am. J. Hum. Genet. 61:1015–1035.
POSADA, D., K. A. CRANDALL, and A. R. TEMPLETON. 2000.GeoDis: a program for the cladistic nested analysis of thegeographical distribution of genetic haplotypes. Mol. Ecol.9:487–488.
PRITCHARD, J. K., M. T. SEIELSTAD, A. PEREZ-LEZAUN, and M.W. FELDMAN. 1999. Population growth of human Y chro-mosomes: a study of Y chromosome microsatellites. Mol.Biol. Evol. 16:1791–1798.
PRZEWORSKI, M., R. R. HUDSON, and A. DI RIENZO. 2000.Adjusting the focus on human variation. Trends Genet. 16:296–302.
QAMAR, R., Q. AYUB, S. KHALIQ, A. MANSOOR, T. KARAFET,S. Q. MEHDI, and M. F. HAMMER. 1999. African and Lev-antine origins of Pakistani YAP1 Y chromosomes. Hum.Biol. 71:745–755.
REDD, A. J., and M. STONEKING. 1999. Peopling of Sahul:mtDNA variation in aboriginal Australian and Papua NewGuinean populations. Am. J. Hum. Genet. 65:808–828.
RELETHFORD, J. H. 1995. Genetics and modern human origins.Evol. Anthropol. 4:53–63.
RELETHFORD, J. H., and H. C. HARPENDING. 1994. Craniomet-ric variation, genetic theory, and modern human origins.Am. J. Phys. Anthropol. 95:249–270.
ROHLF, F. J. 1998. NTSYS-pc: numerical taxonomy and mul-tivariate analysis system. Release 2.02H. Exeter Software,Setauket, N.Y.
SANTOS, F. R., A. PANDYA, M. KAYSER et al. (13 co-authors).2000. A polymorphic L1 retroposon insertion in the centro-mere of the human Y chromosome. Hum. Mol. Genet. 9:421–430.
SCHAAL, B. A., and K. M. OLSEN. 2000. Gene genealogies andpopulation variation in plants. Proc. Natl. Acad. Sci. USA97:7024–7029.
SCHNEIDER, S., J.-M. KUEFFER, D. ROESSLI, and L. EXCOFFIER.1998. Arlequin: a software for population genetic analysis.Release 1.1. Genetics and Biometry Laboratory, Universityof Geneva, Geneva, Switzerland.
SCOZZARI, R., F. CRUCIANI, P. SANTOLAMAZZA et al. (17 co-authors). 1999. Combined use of biallelic and microsatelliteY-chromosome polymorphisms to infer affinities among Af-rican populations. Am. J. Hum. Genet. 65:829–846.
SEIELSTAD, M. T., E. MINCH, and L. L. CAVALLI-SFORZA. 1998.Genetic evidence for a higher female migration rate in hu-mans. Nat. Genet. 20:278–280.
SEMINO, O., G. PASSARINO, P. J. OEFNER et al. (17 co-authors).2000. The genetic legacy of Paleolithic Homo sapiens sa-piens in extant Europeans: a Y chromosome perspective.Science 290:1155–1159.
SHEFFIELD, V. C., J. S. BECK, A. E. KWITEK, D. W. SAND-STROM, and E. M. STONE. 1993. The sensitivity of single-strand conformation polymorphism analysis for the detec-tion of single base changes. Genomics 16:325–332.
SHEN, P., F. WANG, P. A. UNDERHILL et al. (13 co-authors).2000. Population genetic implications from sequence vari-ation in four Y chromosome genes. Proc. Natl. Acad. Sci.USA 97:7354–7359.
SHINKA, T., K. TOMITA, T. TODA, S. E. KOTLIAROVA, J. LEE,Y. KUROKI, D. K. JIN, K. TOKUNAGA, H. NAKAMURA, andY. NAKAHORI. 1999. Genetic variations on the Y chromo-some in the Japanese population and implications for mod-ern human Y chromosome lineage. J. Hum. Genet. 44:240–245.
SOMMER, S. S., A. R. GROSZBACH, and C. D. BOTTEMA. 1992.PCR amplification of specific alleles (PASA) is a generalmethod for rapidly detecting known single-base changes.Biotechniques 12:82–87.
STONEKING, M. 1998. Women on the move. Nat. Genet. 20:219–220.
STONEKING, M., J. J. FONTIUS, S. L. CLIFFORD, H. SOODYALL,S. S. ARCOT, N. SAHA, T. JENKINS, M. A. TAHIR, P. L.DEININGER, and M. A. BATZER. 1997. Alu insertion poly-morphisms and human evolution: evidence for a larger pop-ulation size in Africa. Genome Res. 7:1061–1071.
SU, B., J. XIAO, P. UNDERHILL et al. (21 co-authors). 1999. Y-Chromosome evidence for a northward migration of modernhumans into Eastern Asia during the last Ice Age. Am. J.Hum. Genet. 65:1718–1724.
SWOFFORD, D. 2000. PAUP: phylogenetic analysis using par-simony. Release 4.0b4. Sinauer, Sunderland, Mass.
TEMPLETON, A. R. 1993. The ‘‘Eve’’ hypothesis: a genetic cri-tique and reanalysis. Am. Anthropol. 95:51–72.
———. 1997. Testing the out-of-Africa replacement hypoth-esis with mitochondrial DNA data. Pp. 329–360 in G. A.CLARK and C. WILLERMET, eds. Conceptual issues in mod-ern human origins research. Aldine de Gruyter, Amsterdam.
———. 1999. Human races: a genetic and evolutionary per-spective. Am. Anthropol. 100:632–650.
TEMPLETON, A. R., E. BOERWINKLE, and C. F. SING. 1987. Acladistic analysis of phenotypic associations with haplo-types inferred from restriction endonuclease mapping. I. Ba-sic theory and an analysis of alcohol dehydrogenase activityin Drosophila. Genetics 117:343–351.
TEMPLETON, A. R., E. ROUTMAN, and C. A. PHILLIPS. 1995.Separating population structure from population history: acladistic analysis of the geographical distribution of mito-chondrial DNA haplotypes in the tiger salamander, Ambys-toma tigrinum. Genetics 140:767–782.
TEMPLETON, A. R., and C. F. SING. 1993. A cladistic analysisof phenotypic associations with haplotypes inferred fromrestriction endonuclease mapping. IV. Nested analyses withcladogram uncertainty and recombination. Genetics 134:659–669.
THOMSON, R., J. K. PRITCHARD, P. SHEN, P. J. OEFNER, and M.W. FELDMAN. 2000. Recent common ancestry of human Y
Global Human Y-Chromosome Diversity 1203
chromosomes: evidence from DNA sequence data. Proc.Natl. Acad. Sci. USA 97:7360–7365.
TURNER, T. F., J. C. TREXLER, J. L. HARRIS, and J. L. HAYNES.2000. Nested cladistic analysis indicates population frag-mentation shapes genetic diversity in a freshwater mussel.Genetics 154:777–785.
UNDERHILL, P. A., L. JIN, A. A. LIN, S. Q. MEHDI, T. JENKINS,D. VOLLRATH, R. W. DAVIS, L. L. CAVALLI-SFORZA, and P.J. OEFNER. 1997. Detection of numerous Y chromosomebiallelic polymorphisms by denaturing high-performanceliquid chromatography. Genome Res. 7:996–1005.
UNDERHILL, P. A., P. SHEN, A. A. LIN et al. (21 co-authors).2000. Y chromosome sequence variation and the history ofhuman populations. Nat. Genet. 26:358–361.
URBANEK, M., D. GOLDMAN, and J. C. LONG. 1996. The ap-portionment of dinucleotide repeat diversity in NativeAmericans and Europeans: a new approach to measuringgene identity reveals asymmetric patterns of divergence.Mol. Biol. Evol. 13:943–953.
VIGILANT, L., M. STONEKING, H. HARPENDING, K. HAWKES,and A. C. WILSON. 1991. African populations and the evo-lution of human mitochondrial DNA. Science 253:1503–1507.
VOLLRATH, D., S. FOOTE, A. HILTON, L. G. BROWN, P. BEER-ROMERO, J. S. BOGAN, and D. C. PAGE. 1992. The humanY chromosome: a 43-interval map based on naturally oc-curring deletions. Science 258:52–59.
WRIGHT, S. 1969. Evolution and the genetics of populations 2.the theory of gene frequencies. University of Chicago Press,Chicago.
ZERJAL, T., B. DASHNYAM, A. PANDYA et al. (18 co-authors).1997. Genetic relationships of Asians and northern Euro-peans, revealed by Y-chromosome DNA analysis. Am. J.Hum. Genet. 60:1174–1183.
KEITH CRANDALL, reviewing editor
Accepted March 2, 2001
Related Documents