1 Hierarchical Data Visualization 1 Hierarchical Data Hierarchical data emphasize the subordinate or membership relations between data items. Organizational Chart Classifications / Taxonomies (Species and subspecies) Information storage (file structure) Logical inference: decision tree Etc. 2

Welcome message from author
This document is posted to help you gain knowledge. Please leave a comment to let me know what you think about it! Share it to your friends and learn new things together.
Transcript

1
Hierarchical Data Visualization
1
Hierarchical Data
Hierarchical data emphasize the subordinate or membership relations between data items. Organizational Chart
Classifications / Taxonomies (Species and subspecies)
Information storage (file structure)
Logical inference: decision tree
Etc.
2

2
Organizational Chart
3
Family trees, tournament, etc.
4

3
Hierarchical Data Representation
Special type of graph (tree): G={V,E}– Acyclic (no loop or cycle)
– Rooted
– Each sub-graph is also a tree
Challenging for large dataset– Visual display and spatial layout of edges and
nodes.
– Interactivity for data exploration
5
6

4
Hierarchical Data Visualization Techniques
Node-Link Diagrams– Orthogonal layout
– Traditional Layout
– Radial Layout
Space-Filling– Treemap
– Voronoi Treemap
Hybrid Techniques
Which technique to use
Reading: People read faster by scanning in lines (not arcs!)
Convention: Does the application domain have established conventions?
Designs with multiple visual components
– How much screen real-estate do you give the tree?
8

5
Node-Link Diagrams Orthogonal layout
– Indented Layout– Dentrogram– Icicle
Traditional Layout– 2D– 3D : ConeTrees
Radial layout– Radial diagram– Sunburst diagram– Hyperbolic trees 9
Orthogonal Layout
Nodes are horizontally or vertically aligned
Easy to implement
Visually more intuitive
For large dataset, the layout can be imbalanced.
10

6
Indented Layout
Child nodes placed below parent and indented
Height expands and shrinksCompact width
Breadth and depth fight for space resource
Often used to navigate file systemsDifficult to see all nodes of a specific level:
losing context11
Easy to implement
Good for Searching, Bad for Structure
Can use text file (or html)
12

7
File Systems
13
Dendrogram
A branching diagram representing a hierarchy of categories based on degree of similarity.
All leaves at bottom of diagram
Edges usually drawn with sharp corners
Often used to illustrate the arrangement of the clusters by hierarchical clustering.
14

8
Dendrogram: Gene Clustering
15
16

9
Heatmap and Dendrogram
17
Icicle Tree
Edges implied by adjacency and spatial relationships.
18

10
Icicle Trees
19
Traditional Node-Link Layout
Allocate Space proportional to # of Children at Different Levels

11
Exponential Growth of Nodes
Levels
Base Width = BL - 1
Branching = 3
Manage exponential growth of nodes
Use 3D to “linearize” problem – width fixed
Use “Slow IN / OUT” animation of object or point of interest to create “Object Constancy”
Time
Location
linear
Slow IN / OUT

12
3D ConeTree
Combining 3D display and 2D projection.
Extending available viewing space to 3D.
3D Animation to reduce perception cost.
Difficult for large trees
Need 3D interaction
24

13
25
Cone Tree : file system example

14
Radial Layout
Root at the center
Nodes of different levels are placed on circles of different radii.
More effective use of space: more nodes at deeper levels (hence more space)
27
Radial Layout examples
28

15
American Heritage Dictionary
SunBurst: Radial Version of Icicle Tree
16
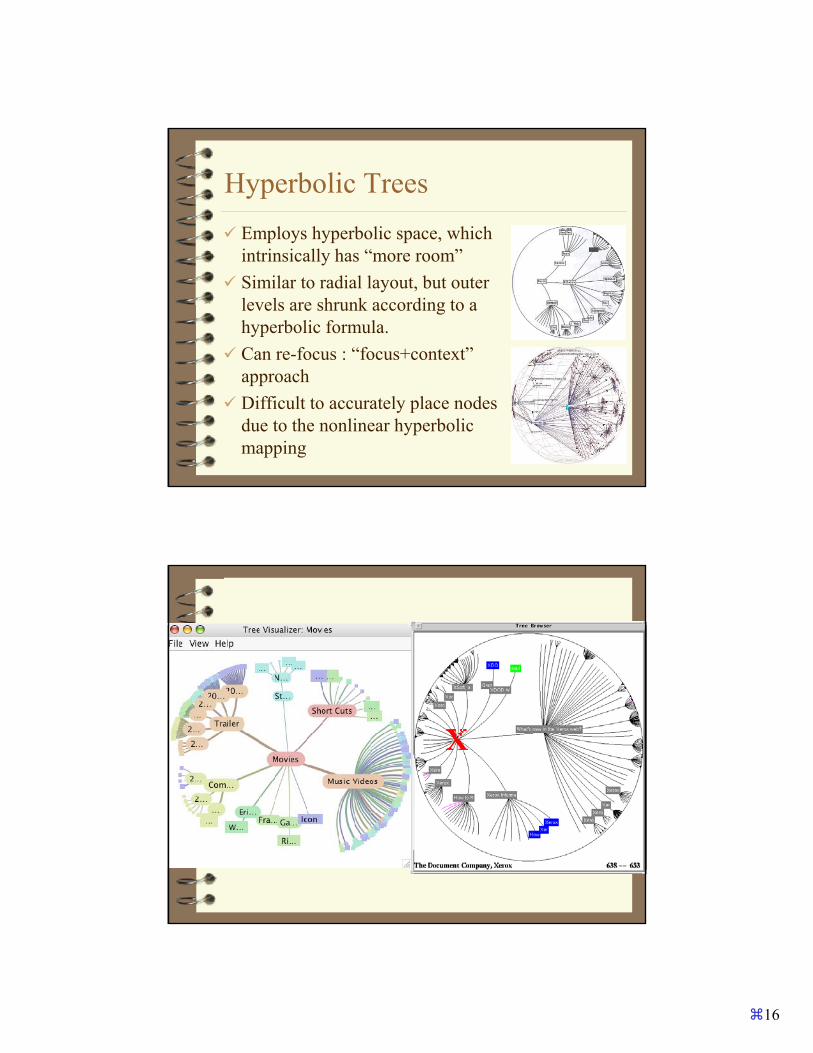
Hyperbolic Trees
Employs hyperbolic space, which intrinsically has “more room”
Similar to radial layout, but outer levels are shrunk according to a hyperbolic formula.
Can re-focus : “focus+context” approach
Difficult to accurately place nodes due to the nonlinear hyperbolic mapping 31

17
3D Hyperbolic Browser: Walrus

18
35
Space Filling Techniques
Containment relationship
Treemaps, Voronoi Treemaps
36

19
37
Treemaps: “Slice & Dice”
Partition screen space hierarchically.
Alternate x- and y-partitions, with important attribute used first.
“Content” is represented using Area Color may correspond to an additional attribute Suitable to get an overview over large amounts of
hierarchical data (e.g., file system) and for data with multiple ordinal attributes (e.g., census data)
Treemap
38

20
Treemap Algorithm
Calculate sizes:• Recurse to children
• My size = sum children sizes
Draw Treemap (node, space, direction)• Draw node rectangle in space
• Alternate direction
• For each child:– Calculate child space as % of node space using size and
direction
– Draw Treemap (child, child space, direction)

21
Treemaps – Nested vs. Non-nested
Non-nested Tree-Map Nested Tree-Map
42

22
43
Treemap : file system
Squarified layout
44
23
45
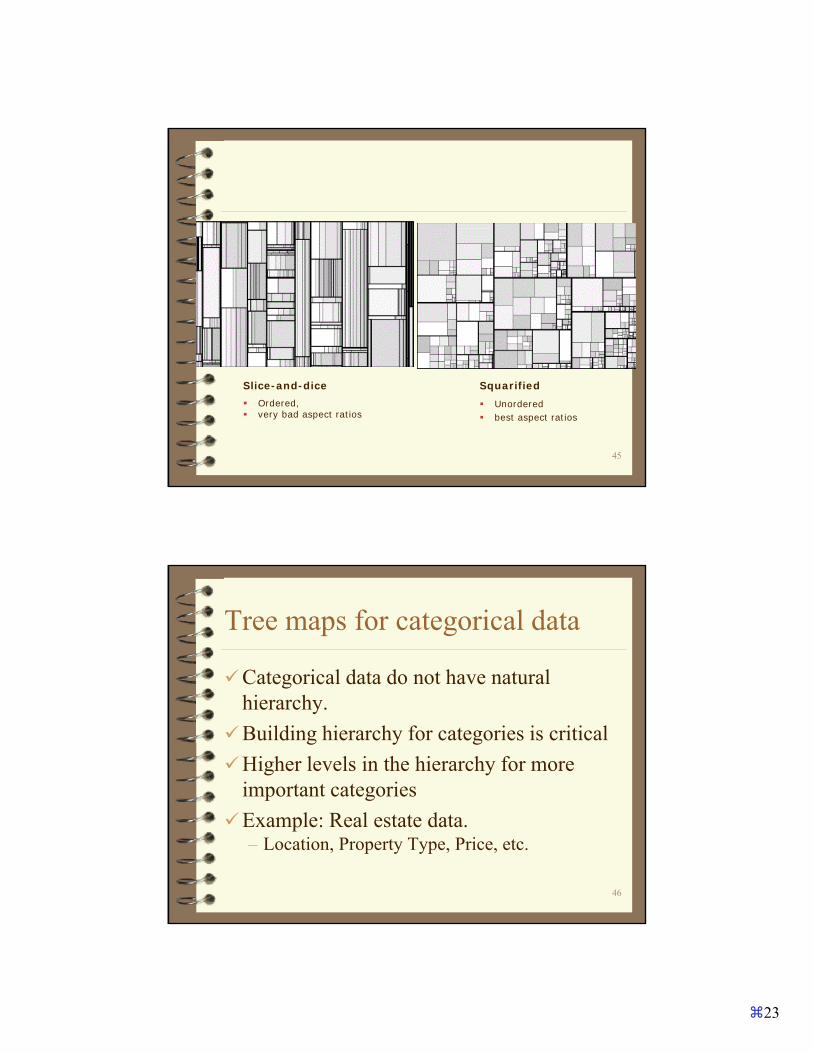
Slice-and-dice Ordered, very bad aspect ratios
Squarified Unordered best aspect ratios
Tree maps for categorical data
Categorical data do not have natural hierarchy.
Building hierarchy for categories is critical
Higher levels in the hierarchy for more important categories
Example: Real estate data.– Location, Property Type, Price, etc.
46

24
London Real Estate Transaction
47
Treemaps – Shading

25
Treemaps – 1,000,000 items
50

26
Voronoi Treemaps
Dividing space using arbitrary polygons
Based on Voronoi tessellations
51
Voronoi vs. Slice-and-Dice vs. Squarified
52

27
US Consumer Expenditures
53
Hybrid Techniques: Elastic Hierarchy
Combining Node-link diagrams and treemaps
54

28
55
56
InfoCube : file system example

29
Botanical Visualization of Huge Hierarchies

30
Focus+Context Interaction
Nonlinear Magnification– http://www.cs.indiana.edu/~tkeahey/research/nlm/nlm.html
– Fisheye Views– Focus+Context

31
Treemap Interaction
Related Documents