Hierarchical Clustering Identifies Hub Nodes in a Model of Resting-State Brain Activity Mark Wildie and Murray Shanahan Department of Computing Imperial College London, England Email: {mark.wild05,m.shanahan}@imperial.ac.uk Abstract—A novel clustering algorithm is presented for ana- lyzing the temporal dynamics of synchronization in networks of coupled oscillators and applied to a model of resting-state brain activity. Connectivity in the model is based on a human-brain structural connectivity matrix derived from diffusion tensor imaging tractography. We find a strong correspondence between areas of high synchronization and highly connected “hub” nodes, anatomical regions forming the structural core of the network linking all areas of the brain. Such models have the potential to increase our understanding of the constraints placed on brain function by underlying anatomical structure. I. I NTRODUCTION The application of graph theory to the analysis of neural structure has led to a greater understanding of the organization of the human brain [1]. Continued advances in non-invasive structural imaging and tractography allow the connectivity of the brain to mapped in ever greater detail. By viewing the resulting set of white matter tracts between anatomical regions as a network of nodes in a connected graph, the human brain has been shown [2] to exhibit the small-world property [3] prevalent in natural systems. Dense local connectivity coupled with a small number of long-range connections results in an energy and informationally efficient architecture combining local functional specialization and global integration. Applying graph theoretic measures of degree and cen- trality further identifies some nodes within this small-world architecture as highly connected “hub” nodes. These form an integrated core network linking all other major neural areas [4]. The spatial and topological centrality of anatomical regions forming the core network is indicative of a role in maintaining efficient global communication throughout the brain [5]. Similar analysis has been performed on functional con- nectivity matrices, derived from time-series data recorded through modes of functional imaging such fMRI, MEG or EEG. Connections between brain regions are typically based on measures of correlation, coherence or mutual information. Small-world properties have been observed in the topology of both spontaneous resting-state [6] and task-related networks [7]. Modular structure and central hub regions have also been identified in resting-state functional networks [8], [9]. Several recent studies have examined the relationship be- tween structural and functional connectivity [10]. It is com- monly assumed that functional activity reflects underlying anatomical structure, that brain regions connected by a large rENT rPARH rTP rFP rFUS rTT rLOCC rSP rIT rIP rSMAR rBSTS rMT rST rPSTC rPREC rCMF rPOPE rPTRI rRMF rPORB rLOF rCAC rRAC rSF rMOF rLING rPCAL rCUN rPARC rISTC rPCUN rPC lPC lPCUN lISTC lPARC lCUN lPCAL lLING lMOF lSF lRAC lCAC lLOF lPORB lRMF lPTRI lPOPE lCMF lPREC lPSTC lST lMT lBSTS lSMAR lIP lIT lSP lLOCC lTT lFUS lFP lTP lPARH lENT Fig. 1: Spatial representation of a 66-region human brain structural connectivity matrix [4] with relative density of con- nections between regions indicated by line thickness. Regions forming the structural core of the network are shown in bold. number of cortical projections are likely to be functionally related. At a higher level it is suggested that the slow-changing anatomical structure of the brain provides a framework that constrains the state space of fast-changing functional activity [11]. The relationship between the two is complex however, and the extent to which the dynamical properties of the brain are constrained by structure remains an open question [12]. A general positive correlation has been found between the degree of structural connectivity and resting-state functional activity [13], [14]. Several studies have also demonstrated functional relationships between brain regions with few or no direct cortical connections [10]. This paper presents a method of analyzing the temporal dynamics of synchronization within networks of coupled oscillators. We aim to both identify nodes in the network forming synchronous clusters of activity and track changes in cluster membership over time. There is significant evidence U.S. Government work not protected by U.S. copyright WCCI 2012 IEEE World Congress on Computational Intelligence June, 10-15, 2012 - Brisbane, Australia IJCNN 222

Welcome message from author
This document is posted to help you gain knowledge. Please leave a comment to let me know what you think about it! Share it to your friends and learn new things together.
Transcript

Hierarchical Clustering Identifies Hub Nodes in a
Model of Resting-State Brain Activity
Mark Wildie and Murray Shanahan
Department of Computing
Imperial College London, England
Email: {mark.wild05,m.shanahan}@imperial.ac.uk
Abstract—A novel clustering algorithm is presented for ana-lyzing the temporal dynamics of synchronization in networks ofcoupled oscillators and applied to a model of resting-state brainactivity. Connectivity in the model is based on a human-brainstructural connectivity matrix derived from diffusion tensorimaging tractography. We find a strong correspondence betweenareas of high synchronization and highly connected “hub” nodes,anatomical regions forming the structural core of the networklinking all areas of the brain. Such models have the potential toincrease our understanding of the constraints placed on brainfunction by underlying anatomical structure.
I. INTRODUCTION
The application of graph theory to the analysis of neural
structure has led to a greater understanding of the organization
of the human brain [1]. Continued advances in non-invasive
structural imaging and tractography allow the connectivity of
the brain to mapped in ever greater detail. By viewing the
resulting set of white matter tracts between anatomical regions
as a network of nodes in a connected graph, the human brain
has been shown [2] to exhibit the small-world property [3]
prevalent in natural systems. Dense local connectivity coupled
with a small number of long-range connections results in an
energy and informationally efficient architecture combining
local functional specialization and global integration.
Applying graph theoretic measures of degree and cen-
trality further identifies some nodes within this small-world
architecture as highly connected “hub” nodes. These form
an integrated core network linking all other major neural
areas [4]. The spatial and topological centrality of anatomical
regions forming the core network is indicative of a role in
maintaining efficient global communication throughout the
brain [5].
Similar analysis has been performed on functional con-
nectivity matrices, derived from time-series data recorded
through modes of functional imaging such fMRI, MEG or
EEG. Connections between brain regions are typically based
on measures of correlation, coherence or mutual information.
Small-world properties have been observed in the topology of
both spontaneous resting-state [6] and task-related networks
[7]. Modular structure and central hub regions have also been
identified in resting-state functional networks [8], [9].
Several recent studies have examined the relationship be-
tween structural and functional connectivity [10]. It is com-
monly assumed that functional activity reflects underlying
anatomical structure, that brain regions connected by a large
rENT
rPARH
rTP
rFP
rFUS
rTT
rLOCC
rSP
rIT
rIP
rSMAR
rBSTS
rMT
rST
rPSTC
rPREC
rCMFrPOPE
rPTRI
rRMF
rPORB
rLOF
rCAC
rRAC
rSF
rMOF
rLING
rPCAL
rCUN
rPARC
rISTC
rPCUN
rPC lPC
lPCUN
lISTC
lPARC
lCUN
lPCAL
lLING
lMOF
lSF
lRAC
lCAC
lLOF
lPORB
lRMF
lPTRI
lPOPE lCMF
lPREC
lPSTC
lST
lMT
lBSTS
lSMAR
lIP
lIT
lSP
lLOCC
lTT
lFUS
lFP
lTP
lPARH
lENT
Fig. 1: Spatial representation of a 66-region human brain
structural connectivity matrix [4] with relative density of con-
nections between regions indicated by line thickness. Regions
forming the structural core of the network are shown in bold.
number of cortical projections are likely to be functionally
related. At a higher level it is suggested that the slow-changing
anatomical structure of the brain provides a framework that
constrains the state space of fast-changing functional activity
[11]. The relationship between the two is complex however,
and the extent to which the dynamical properties of the brain
are constrained by structure remains an open question [12].
A general positive correlation has been found between the
degree of structural connectivity and resting-state functional
activity [13], [14]. Several studies have also demonstrated
functional relationships between brain regions with few or no
direct cortical connections [10].
This paper presents a method of analyzing the temporal
dynamics of synchronization within networks of coupled
oscillators. We aim to both identify nodes in the network
forming synchronous clusters of activity and track changes
in cluster membership over time. There is significant evidence
U.S. Government work not protected by U.S. copyright
WCCI 2012 IEEE World Congress on Computational Intelligence June, 10-15, 2012 - Brisbane, Australia IJCNN
222

rE
NT
rPA
RH
rT
P rF
P rFU
S r
TT
rLO
CC
rSP
rIT
rIP
rSMAR
rBSTS
rMT
rST
rPSTC
rPREC
rCMFrPOPErPTRI
rRMFrPORB rLOF rCAC rRAC rSF rM
OF
rLING
rPC
AL
rCU
N
rPA
RC
rIST
C
rPC
UN
rPC
lPC
lPC
UN
lIST
ClP
AR
C lC
UN
lPC
AL
lLING
lMO
F
lSF
lRAC
lCAC
lLOF
lPORB
lRMF
lPTRI
lPOPE
lCMFlPREClPSTC
lST
lMT lBSTS lS
MAR l
IP lIT l
SP lLO
CC
lT
T
lFU
S
lF
P
lT
P
lPA
RH
lE
NT
(a)
0 125 250 375 5000
0.5
1
Time (ms)
φ
(b)
Fig. 2: a) Non-spatial representation of anatomical connectiv-
ity [4] ordered by hemisphere. Each labeled node corresponds
to a single anatomical region, and each line to a connection
between regions. b) Synchronization dynamics of a model of
brain activity [15] based on the same connectivity matrix. Each
anatomical region has been replaced by a single Kuramoto
oscillator, and each structural connection by a weighted and
delayed connection between oscillators. Each line represents
the internal synchronization of a single cluster of oscillators
(cluster membership identified by nodes of the same color).
Global synchronization of the network is shown by a black
line. The model displays metastable dynamics, where each
cluster displays transient periods of synchronized and desyn-
chronized activity.
for the functional importance of synchronous oscillation over
multiple frequency bands in the human brain [16]. Changes
in synchronization are proposed to underlie dynamic routing
of information between neural areas [17]. As such, a method
of identifying regions of synchronization within time-series
neural data is a valuable tool for examining the occurrence of
this type of potentially significant interaction. The described
method is equally applicable to models of brain activity
and data recorded from modes of functional imaging where
oscillation is observed, such as EEG and fMRI. In this paper
we apply the algorithm to a model of synchronization between
connected brain regions, and show a close correspondence
between synchronous dynamics and regions of modular struc-
tural connectivity within the model.
The rest of this paper is organized as follows. Section II
provides an overview of the proposed algorithm and model
of human brain activity. In Section III we present an analysis
of activity within the model and comparison with structural
properties of the network. Section IV concludes the paper and
discusses future work.
Algorithm 1
Input:
• The matrix Φ, where for N nodes and t time steps Φ(i, j)is the phase θi of node i at time step j.
• The window length wl.
• The window step size ws.
• The synchrony threshold t.
Output:
• A set of clusters Ck each for window wk of starting
position k × ws and end position (k × ws) + wl, where
each cluster c ∈ Ck is a maximal non-overlapping subset
of N with total synchrony > t.
Method:
Stage 1:
Partition Φ into (sl − wl) /ws windows of length wl. We
denote each window wk , where wk(i) is the phase of node
i from steps k × ws to (k × ws) + wl for i ∈ N .
Stage 2:
for each wk do
Stage 1:
Calculate the matrix D, where each entry D(i, j) is theaverage pairwise synchrony φc between nodes i and jover wk for i, j ∈ N and i 6= j. Given D(i, j) = D(j, i)we require (n− 1)! entries.
Stage 2:
while any two clusters remain where D(i, j) > t do
1) Merge the two clusters with highest
value D(i, j).
2) Recalculate average φc over wk for all
remaining clusters and the newly merged
cluster.
3) Update D.
end
end
223

II. METHODS
A. Clustering Algorithm
A large number of clustering algorithms have been devel-
oped [18] and variations continue to be proposed. Our interest
is in identifying subgroups of interacting nodes within larger
networks that exhibit interesting dynamical properties. We
aim to examine how those subgroups change over time for
varying time scales. In the current model we consider changes
in synchronization within a network of coupled oscillators,
using the Kuramoto oscillator model [19] with time-delayed
coupling. The phase θi of each oscillator is given by the
equation
dθidt
= ω + k∑
Ki,j sin (θj(t− τ) − θi(t)) (1)
where ω is the natural frequency of the oscillator, θi (t) is thephase of oscillator i at time t, τ is a fixed time delay, k is
a scaling factor and Ki,j is the connection strength between
oscillators i and j.The instantaneous synchronization between any set of os-
cillators c at time t is given by
φc (t) =
∣
∣
∣
∣
⟨
eiθk(t)⟩
k∈c
∣
∣
∣
∣
(2)
where θk (t) denotes the phase of oscillator k at time t and
〈f〉k∈c denotes the average of f over all k in c. The value
ranges from [0, 1], with 0 indicating complete desynchroniza-
tion and 1 complete synchronization.
We take as input to the algorithm the combined time-series
Φ, consisting of the phase of N oscillators at each of sl time
steps of resolution r. From Φ we generate windows of length
wl and step size ws, where the kth window contains the phase
of all oscillators from starting position k × ws to position
(k × ws) + wl. Clustering is then performed individually for
each of the (sl − wl) /ws windows. We take a hierarchical
agglomerative approach to partitioning the network (Algorithm
1), where the closest two clusters are merged at every step
of the algorithm until a synchronization threshold t. The dis-
tance between any two clusters is calculated as the combined
instantaneous synchronization φc of all oscillators within both
clusters averaged over the current window k. The algorithm
completes when the combined average synchronization of any
two clusters is below the threshold value.
B. Model
We use the model of human brain activity described in [15]
for the generation of all results. A brief description of the
connectivity matrix underlying the model follows, full details
are given in [4]. The connectivity matrix covers 66 anatomical
regions partitioned according to standard cortical anatomical
landmarks. Connectivity between regions was obtained via
rE
NT
rPA
RH
rT
P rF
P rFU
S r
TT
rLO
CC
rSP
rIT
rIP
rSMAR
rBSTS
rMT
rST
rPSTC
rPREC
rCMFrPOPErPTRI
rRMFrPORB rLOF rCAC rRAC rSF rM
OF
rLING
rPC
AL
rCU
N
rPA
RC
rIST
C
rPC
UN
rPC
lPC
lPC
UN
lIST
ClP
AR
C lC
UN
lPC
AL
lLING
lMO
F
lSF
lRAC
lCAC
lLOF
lPORB
lRMF
lPTRI
lPOPE
lCMFlPREClPSTC
lST
lMT lBSTS lS
MAR l
IP lIT l
SP lLO
CC
lT
T
lFU
S
lF
P
lT
P
lPA
RH
lE
NT
1.
2.3.
(a)
0 125 250 375 5000
0.5
1
Time (ms)
φ
(b)
0 125 250 375 5000
0.5
1
Time (ms)
φ
(c)
Fig. 3: Applying the algorithm over a long time window (wl =4000) identifies three clusters that maintain a constant high
level of synchrony (φc > 0.95). We label these 1, 2, and 3 and
use the same labels to indicate these clusters in all following
tables and figures. a) The anatomical connectivity within and
between each cluster. b) The instantaneous synchronization
over time of each cluster (cluster membership identified by
nodes of the same color). c) The instantaneous synchronization
of each combination of the three clusters (blue line = [1,2],
red = [1,3], green = [2,3] and black = [1,2,3]).
224

rE
NT
rPA
RH
rT
P rF
P rFU
S r
TT
rLO
CC
rSP
rIT
rIP
rSMAR
rBSTS
rMT
rST
rPSTC
rPREC
rCMFrPOPErPTRI
rRMFrPORB rLOF rCAC rRAC rSF rM
OF
rLING
rPC
AL
rCU
N
rPA
RC
rIST
C
rPC
UN
rPC
lPC
lPC
UN
lIST
ClP
AR
C lC
UN
lPC
AL
lLING
lMO
F
lSF
lRAC
lCAC
lLOF
lPORB
lRMF
lPTRI
lPOPE
lCMFlPREClPSTC
lST
lMT lBSTS lS
MAR l
IP lIT l
SP lLO
CC
lT
T
lFU
S
lF
P
lT
P
lPA
RH
lE
NT
4.5.
(a)
0 125 250 375 5000
0.5
1
Time (ms)
φ
(b)
0 125 250 375 5000
0.5
1
Time (ms)
φ
(c)
Fig. 4: Applying the algorithm over a short time window (wl =200) identifies two clusters that exhibit transient periods of
high (φc > 0.95) and low synchrony. We label these 4 and 5
are use the same labels in all following tables and figures. a)
The anatomical connectivity within and between each cluster.
b) The instantaneous synchronization over time of each cluster
(cluster membership identified by nodes of the same color). c)
The instantaneous synchronization of the combination of both
clusters.
T1-weighted and diffusion spectrum MRI. The density and
length of fiber tracts were downsampled from an initial high-
resolution scan covering 998 regions-of-interest (ROIs) and
averaged over five subjects. The resulting network exhibits
a densely connected and topologically and spatially central
structural core, with a high degree of coupling between hemi-
spheres (Figures 1 and 2a).
In [15] the same connectivity matrix is used to model
BOLD fMRI resting-state activity. Each of the 66 anatomical
regions in the matrix is replaced by a single Kuramoto
oscillator, with connections between oscillators (weight matrix
K and delay τ in Equation 1) derived from the average
fiber density and length values produced in [4]. Within a
given parameter regime the authors find that the model closely
reproduces empirical observations of resting-state activity. In
particular, the parameter space producing the closest match
to empirical data results in dynamically complex behavior.
Oscillators exhibit low global synchronization combined with
the continuous and transient formation of highly synchronous
subnetworks within model activity (Figure 2b). This is well-
described by the dynamics of metastable chimera states seen
in community-structured oscillator networks [20]. In Section
III we present the results of applying hierarchical clustering on
model output, using parameters from within the same region
producing metastable behavior.
III. RESULTS
The results of applying the clustering algorithm described in
Section II-A to the output of the model of fMRI BOLD activity
described in Section II-B are shown in Figures 3 and 4. The
phase of each of the 66 oscillators in the model was recorded
at each step of a simulation of 5 seconds of activity, with
resolution r of 1.25 ms per time step. The natural frequency
ω of each oscillator was set to 40Hz and the initial phase of
each oscillator assigned randomly. The first 200 time steps of
the simulation were discarded to allow for any initial network
transient.
TABLE I: Correspondence between anatomical regions in the
structural core [4] and highly-synchronous clusters (Figure 3).
Regions in the structural core are listed by name and cluster
membership indicated by the preceding number.
left hemisphere right hemisphere
posterior cingulate cortex (1) lPC (1) rPCprecuneus (1) lPCUN (1) rPCUNcuneus (1) lCUN (1) rCUNparacentral lobule lPARC (1) rPARCisthmus of the cingulate (1) lISTC (1) rISTCbanks of the superior temporal sulcus (2) lBSTS (3) rBSTSinferior parietal cortex (2) lIP (3) rIPsuperior parietal cortex (2) lSP (3) rSP
We consider first the case of oscillators that remain highly
synchronous (φc > 0.95) over the entire simulation (wl =4000). We find three clusters within the model (Figure 3a)
located in posterior and medial cortical regions that maintain
a constant high level of internal synchronization (Figure 3b).
Synchronous activity within posterior and right medial clusters
225
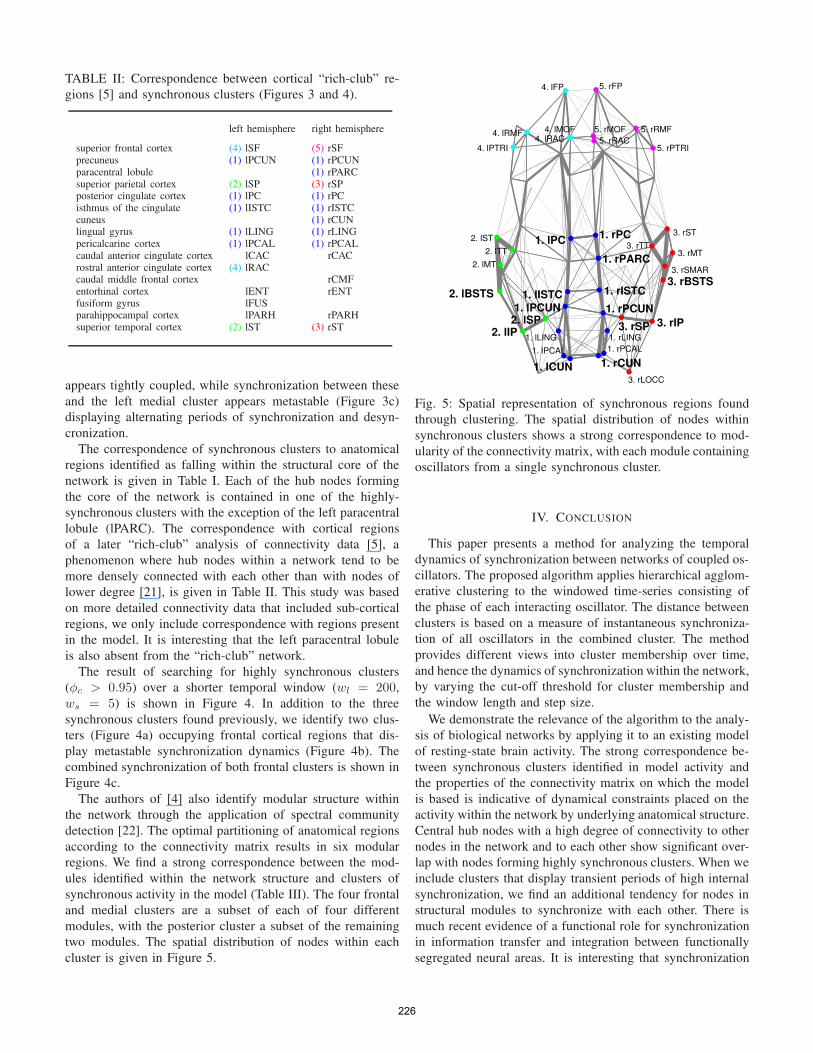
TABLE II: Correspondence between cortical “rich-club” re-
gions [5] and synchronous clusters (Figures 3 and 4).
left hemisphere right hemisphere
superior frontal cortex (4) lSF (5) rSFprecuneus (1) lPCUN (1) rPCUNparacentral lobule (1) rPARCsuperior parietal cortex (2) lSP (3) rSPposterior cingulate cortex (1) lPC (1) rPCisthmus of the cingulate (1) lISTC (1) rISTCcuneus (1) rCUNlingual gyrus (1) lLING (1) rLINGpericalcarine cortex (1) lPCAL (1) rPCALcaudal anterior cingulate cortex lCAC rCACrostral anterior cingulate cortex (4) lRACcaudal middle frontal cortex rCMFentorhinal cortex lENT rENTfusiform gyrus lFUSparahippocampal cortex lPARH rPARHsuperior temporal cortex (2) lST (3) rST
appears tightly coupled, while synchronization between these
and the left medial cluster appears metastable (Figure 3c)
displaying alternating periods of synchronization and desyn-
cronization.
The correspondence of synchronous clusters to anatomical
regions identified as falling within the structural core of the
network is given in Table I. Each of the hub nodes forming
the core of the network is contained in one of the highly-
synchronous clusters with the exception of the left paracentral
lobule (lPARC). The correspondence with cortical regions
of a later “rich-club” analysis of connectivity data [5], a
phenomenon where hub nodes within a network tend to be
more densely connected with each other than with nodes of
lower degree [21], is given in Table II. This study was based
on more detailed connectivity data that included sub-cortical
regions, we only include correspondence with regions present
in the model. It is interesting that the left paracentral lobule
is also absent from the “rich-club” network.
The result of searching for highly synchronous clusters
(φc > 0.95) over a shorter temporal window (wl = 200,ws = 5) is shown in Figure 4. In addition to the three
synchronous clusters found previously, we identify two clus-
ters (Figure 4a) occupying frontal cortical regions that dis-
play metastable synchronization dynamics (Figure 4b). The
combined synchronization of both frontal clusters is shown in
Figure 4c.
The authors of [4] also identify modular structure within
the network through the application of spectral community
detection [22]. The optimal partitioning of anatomical regions
according to the connectivity matrix results in six modular
regions. We find a strong correspondence between the mod-
ules identified within the network structure and clusters of
synchronous activity in the model (Table III). The four frontal
and medial clusters are a subset of each of four different
modules, with the posterior cluster a subset of the remaining
two modules. The spatial distribution of nodes within each
cluster is given in Figure 5.
5. rFP
3. rTT
3. rLOCC
3. rSP 3. rIP
3. rSMAR
3. rBSTS
3. rMT
3. rST
5. rPTRI
5. rRMF
5. rRAC
5. rMOF
1. rLING
1. rPCAL
1. rCUN
1. rPARC
1. rISTC
1. rPCUN
1. rPC1. lPC
1. lPCUN
1. lISTC
1. lCUN
1. lPCAL
1. lLING
4. lMOF4. lRAC
4. lRMF
4. lPTRI
2. lST
2. lMT
2. lBSTS
2. lIP
2. lSP
2. lTT
4. lFP
Fig. 5: Spatial representation of synchronous regions found
through clustering. The spatial distribution of nodes within
synchronous clusters shows a strong correspondence to mod-
ularity of the connectivity matrix, with each module containing
oscillators from a single synchronous cluster.
IV. CONCLUSION
This paper presents a method for analyzing the temporal
dynamics of synchronization between networks of coupled os-
cillators. The proposed algorithm applies hierarchical agglom-
erative clustering to the windowed time-series consisting of
the phase of each interacting oscillator. The distance between
clusters is based on a measure of instantaneous synchroniza-
tion of all oscillators in the combined cluster. The method
provides different views into cluster membership over time,
and hence the dynamics of synchronization within the network,
by varying the cut-off threshold for cluster membership and
the window length and step size.
We demonstrate the relevance of the algorithm to the analy-
sis of biological networks by applying it to an existing model
of resting-state brain activity. The strong correspondence be-
tween synchronous clusters identified in model activity and
the properties of the connectivity matrix on which the model
is based is indicative of dynamical constraints placed on the
activity within the network by underlying anatomical structure.
Central hub nodes with a high degree of connectivity to other
nodes in the network and to each other show significant over-
lap with nodes forming highly synchronous clusters. When we
include clusters that display transient periods of high internal
synchronization, we find an additional tendency for nodes in
structural modules to synchronize with each other. There is
much recent evidence of a functional role for synchronization
in information transfer and integration between functionally
segregated neural areas. It is interesting that synchronization
226

TABLE III: Correspondence between modular [4] and syn-
chronous (Figures 3 and 4) clusters.
left hemisphere right hemisphere
Module 1 (1) lCUN (1) rCUN(1) lLING (1) rLING
lPARH(1) lPCAL (1) rPCAL(1) lPCUN
Module 2 lCAC rCAC(1) lISTC (1) rISTC
lPARC (1) rPARC(1) lPC (1) rPC
(1) rPCUN
Module 3 (2) lBSTS Module 4 (3) rBSTSlENT rENTlFUS rFUS
(2) lIP (3) rIPlIT rITlLOCC (3) rLOCC
(2) lMT (3) rMTlPSTC rPSTC
(2) lSP (3) rSP(2) lST (3) rST
lSMAR (3) rSMARlTP rTP
(2) lTT (3) rTTrPARH
Module 5 lCMF Module 6 rCMF(4) lFP (5) rFP
lLOF rLOF(4) lMOF (5) rMOF
lPOPE rPOPElPORB rPORB
(4) lTRI (5) rTRIlPREC rPREC
(4) lRAC (5) rRAC(4) lRMF (5) rRMF(4) lSF (5) rSF
of activity in the model appears related to both the degree
and centrality of nodes and the distribution of spatially and
topographically modular regions in network structure.
There are several avenues for further work. The method
described in this paper would extend easily to other dynamical
measures beyond the instantaneous synchronization of coupled
oscillators. Considering the relative phase of synchroniza-
tion between clusters may also produce interesting results
for neural data, as would extending the method to include
information theoretic measures such as transfer entropy [23]
or causal density [24]. It would also be interesting to consider
the response of the model to input simulating an external
stimulus, and to apply the method to time-series data produced
by modes of functional imaging such as EEG or fMRI.
Finally, further investigation is required in the current model
into the relationship between connectivity within and between
structural modules and synchronization between nodes.
ACKNOWLEDGMENT
The authors acknowledge the support of Joana Cabral for
providing and discussing the model of resting-state activity
used in this paper.
REFERENCES
[1] E. Bullmore and O. Sporns, “Complex brain networks: graph theoreticalanalysis of structural and functional systems,” Nature Reviews Neuro-
science, vol. 10, no. 3, pp. 186–198, 2009.[2] D. S. Bassett and E. Bullmore, “Small-World brain networks,” Neuro-
scientist, vol. 12, no. 6, pp. 512–523, 2006.[3] D. J. Watts and S. H. Strogatz, “Collective dynamics of ’small-world’
networks,” Nature, vol. 393, no. 6684, pp. 440–442, 1998.[4] P. Hagmann, L. Cammoun, X. Gigandet, R. Meuli, C. J. Honey, V. J.
Wedeen, and O. Sporns, “Mapping the structural core of human cerebralcortex,” PLoS Biology, vol. 6, no. 7, p. e159, 2008.
[5] M. P. van den Heuvel and O. Sporns, “Rich-Club organization of thehuman connectome,” The Journal of Neuroscience, vol. 31, no. 44, pp.15 775–15 786, 2011.
[6] R. Salvador, J. Suckling, M. R. Coleman, J. D. Pickard, D. Menon, andE. Bullmore, “Neurophysiological architecture of functional magneticresonance images of human brain,” Cerebral Cortex, vol. 15, no. 9, pp.1332–1342, 2005.
[7] D. S. Bassett, A. Meyer-Lindenberg, S. Achard, T. Duke, and E. Bull-more, “Adaptive reconfiguration of fractal small-world human brainfunctional networks,” Proceedings of the National Academy of Sciences,vol. 103, pp. 19 518–19 523, 2006.
[8] M. van den Heuvel, C. Stam, M. Boersma, and H. Hulshoff Pol, “Small-world and scale-free organization of voxel-based resting-state functionalconnectivity in the human brain,” NeuroImage, vol. 43, no. 3, pp. 528–539, 2008.
[9] W. Liao, J. Ding, D. Marinazzo, Q. Xu, Z. Wang, C. Yuan, Z. Zhang,G. Lu, and H. Chen, “Small-world directed networks in the humanbrain: Multivariate granger causality analysis of resting-state fMRI,”NeuroImage, vol. 54, no. 4, pp. 2683–2694, 2011.
[10] J. S. Damoiseaux and M. D. Greicius, “Greater than the sum of its parts:a review of studies combining structural connectivity and resting-statefunctional connectivity,” Brain Structure & Function, vol. 213, no. 6,pp. 525–533, 2009.
[11] O. Sporns, “The human connectome: a complex network,” Annals of theNew York Academy of Sciences, vol. 1224, no. 1, pp. 109–125, 2011.
[12] C. J. Honey, J. Thivierge, and O. Sporns, “Can structure predict functionin the human brain?” NeuroImage, vol. 52, no. 3, pp. 766–776, 2010.
[13] C. J. Honey, O. Sporns, L. Cammoun, X. Gigandet, J. P. Thiran,R. Meuli, and P. Hagmann, “Predicting human resting-state functionalconnectivity from structural connectivity,” Proceedings of the National
Academy of Sciences, vol. 106, no. 6, pp. 2035–2040, 2009.[14] M. P. van den Heuvel, R. C. Mandl, R. S. Kahn, and H. E. H.
Pol, “Functionally linked resting-state networks reflect the underlyingstructural connectivity architecture of the human brain,” Human Brain
Mapping, vol. 30, no. 10, pp. 3127–3141, 2009.[15] J. Cabral, E. Hugues, O. Sporns, and G. Deco, “Role of local network os-
cillations in resting-state functional connectivity,” NeuroImage, vol. 57,no. 1, pp. 130–139, 2011.
[16] G. Buzsaki and A. Draguhn, “Neuronal oscillations in cortical networks,”Science, vol. 304, no. 5679, pp. 1926–1929, 2004.
[17] P. Fries, “Neuronal Gamma-Band synchronization as a fundamental pro-cess in cortical computation,” Annual Review of Neuroscience, vol. 32,no. 1, pp. 209–224, 2009.
[18] R. Xu and D. Wunsch II, “Survey of clustering algorithms,” IEEE
Transactions on Neural Networks, vol. 16, no. 3, pp. 645–678, 2005.[19] Y. Kuramoto, Chemical oscillations, waves, and turbulence. Springer,
New York, 1984.[20] M. Shanahan, “Metastable chimera states in community-structured os-
cillator networks,” Chaos, vol. 20, no. 1, p. 013108, 2010.[21] V. Colizza, A. Flammini, M. A. Serrano, and A. Vespignani, “Detecting
rich-club ordering in complex networks,” Nature Physics, vol. 2, no. 2,pp. 110–115, 2006.
[22] M. E. J. Newman, “Modularity and community structure in networks,”Proceedings of the National Academy of Sciences, vol. 103, no. 23, pp.8577–8582, 2006.
[23] T. Schreiber, “Measuring information transfer,” Physical Review Letters,vol. 85, no. 2, pp. 461–464, 2000.
[24] A. K. Seth, A. B. Barrett, and L. Barnett, “Causal density and integratedinformation as measures of conscious level,” Philosophical Transactionsof the Royal Society A, vol. 369, no. 1952, pp. 3748–3767, 2011.
227
Related Documents