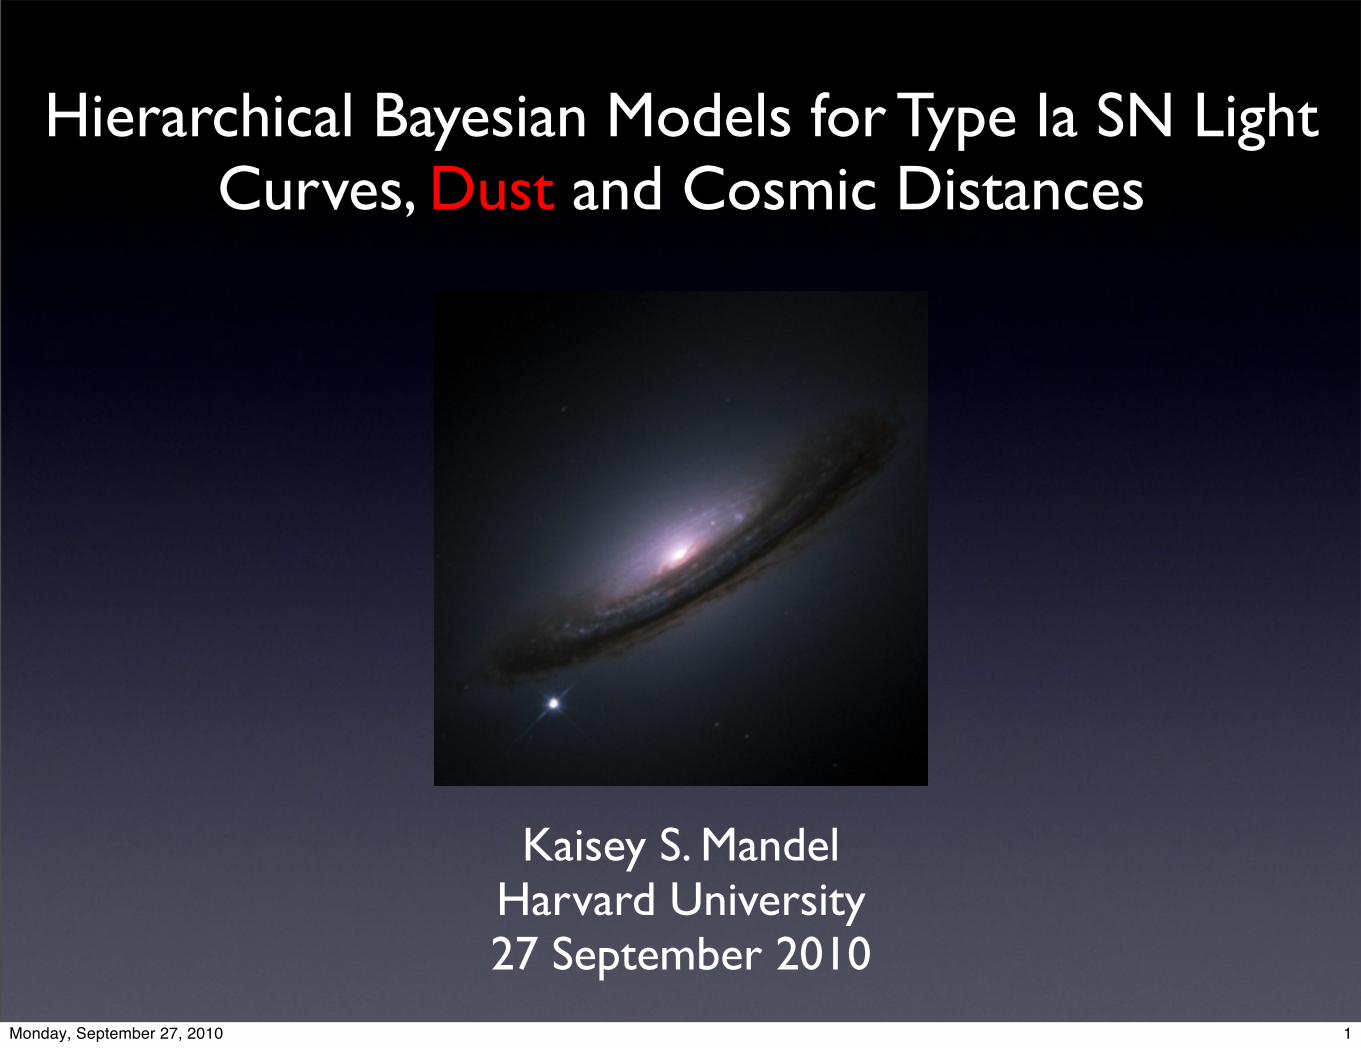
Kaisey S. Mandel Harvard University 27 September 2010 Hierarchical Bayesian Models for Type Ia SN Light Curves, Dust and Cosmic Distances 1 Monday, September 27, 2010

Welcome message from author
This document is posted to help you gain knowledge. Please leave a comment to let me know what you think about it! Share it to your friends and learn new things together.
Transcript
Kaisey S. MandelHarvard University27 September 2010
Hierarchical Bayesian Models for Type Ia SN Light Curves, Dust and Cosmic Distances
1Monday, September 27, 2010

Hierarchical
Brings deep knowledge from data
Distant star glows, fades.
-Bob Kirshner
2Monday, September 27, 2010
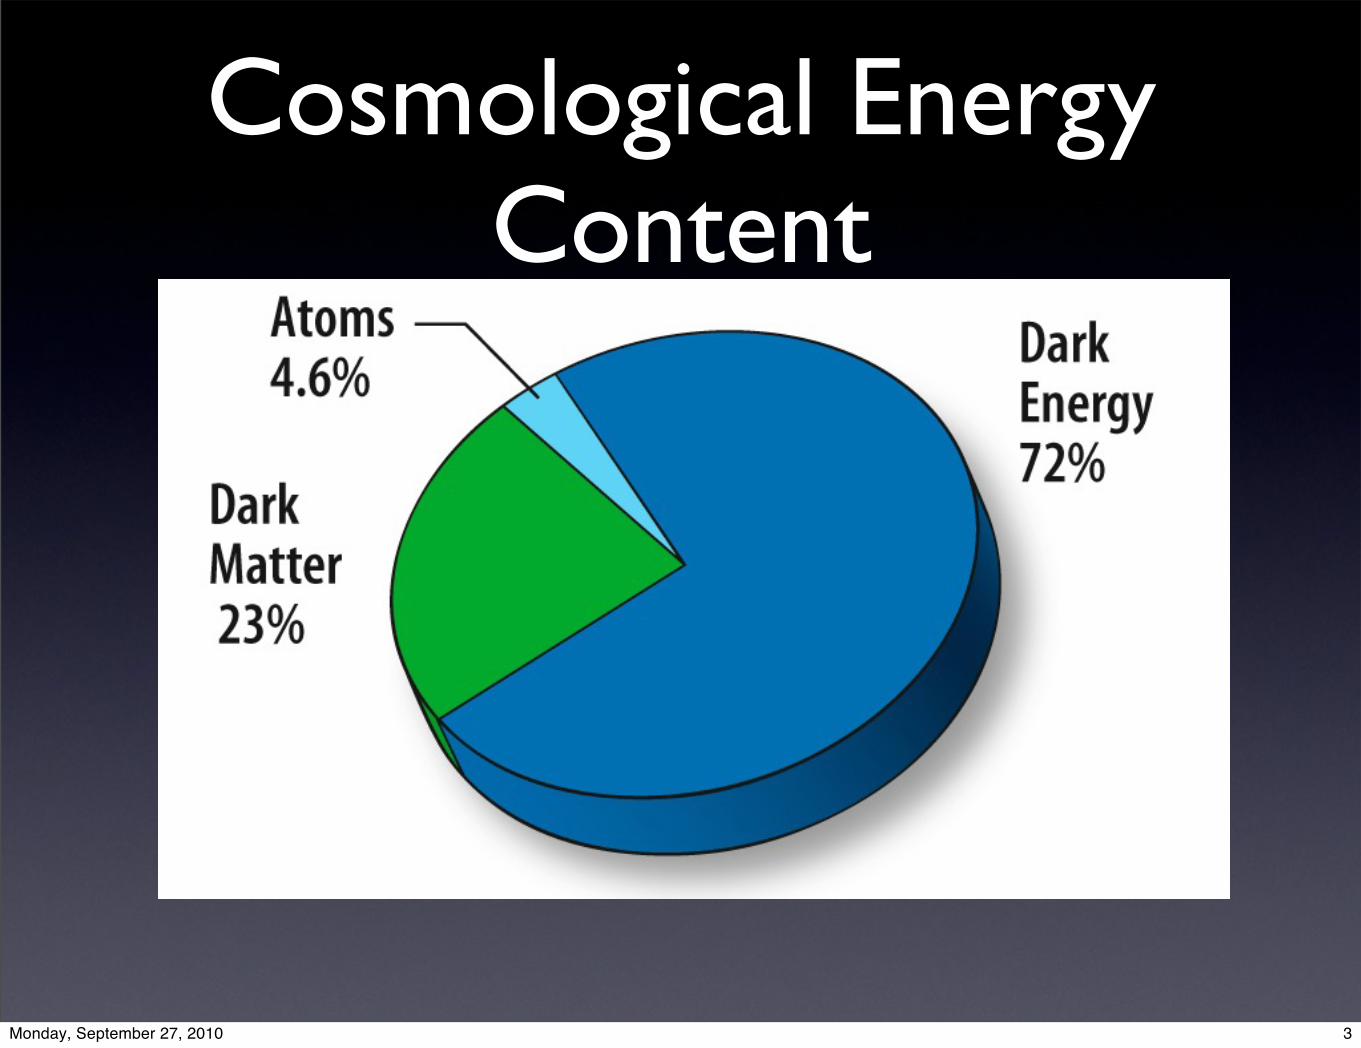
Cosmological Energy Content
3Monday, September 27, 2010

Supernova Cosmology:Constraining Cosmological Parameters
using Distance vs. Velocity
AAS 215
!"##$%&'%()*"+$(
! !!""!#!$%&!#!$%&!!
'!(%()'!(%()
*(%(+*(%(+
! !"#$%&'(#)*+,%!"#$%&'(#)*+,%('(-!.%*"#$%/01#%('(-!.%*"#$%/01#%12)/+%,+$,0)()(312)/+%,+$,0)()(3
! 45'/"$)'(%'6%45'/"$)'(%'6%77%%%%1)$2%,+*#2)6$81)$2%,+*#2)6$8
AAS 215
!"##$%&! !""#$%&#'()(#&*'+,*'#!""#$%&#'()(#&*'+,*'#! -*)&(././0#1234#5.)6#-*)&(././0#1234#5.)6#
"(&0*#"7589#:*)#)7#;*))*&#"(&0*#"7589#:*)#)7#;*))*&#:*<(&()*#,7"7&#(/'#'+:)#:*<(&()*#,7"7&#(/'#'+:)#(/'#&*'+,*#:%:)*=().,:(/'#&*'+,*#:%:)*=().,:
! >?(=././0#@#;(/'#>?(=././0#@#;(/'#(/7=("%(/7=("%
! A&7<(0()*#<&7;(;.".)%#A&7<(0()*#<&7;(;.".)%#:+&B(,*#B7&#*(,6#4C#)7#:+&B(,*#B7&#*(,6#4C#)7#,7:=7"70%#D#;*))*&#,7:=7"70%#D#;*))*&#*:).=()*:#7B#:%:)*=().,#*:).=()*:#7B#:%:)*=().,#
! !"#$%&%'(")##,7/:)&(./):#,7/:)&(./):#7/#,7/:)(/)#57/#,7/:)(/)#5
*+,+-./01+*+,+-./01+EE+./.2+345657++./.2+345657+EE+./89+34:47+./89+34:474Monday, September 27, 2010

Standard Candle Principle
1. Know or Estimate Luminosity L of a Class of Astronomical Objects
2. Measure the apparent brightness or flux F
3. Derive the distance D to Object using Inverse Square Law: F = L / (4π D)
5Monday, September 27, 2010
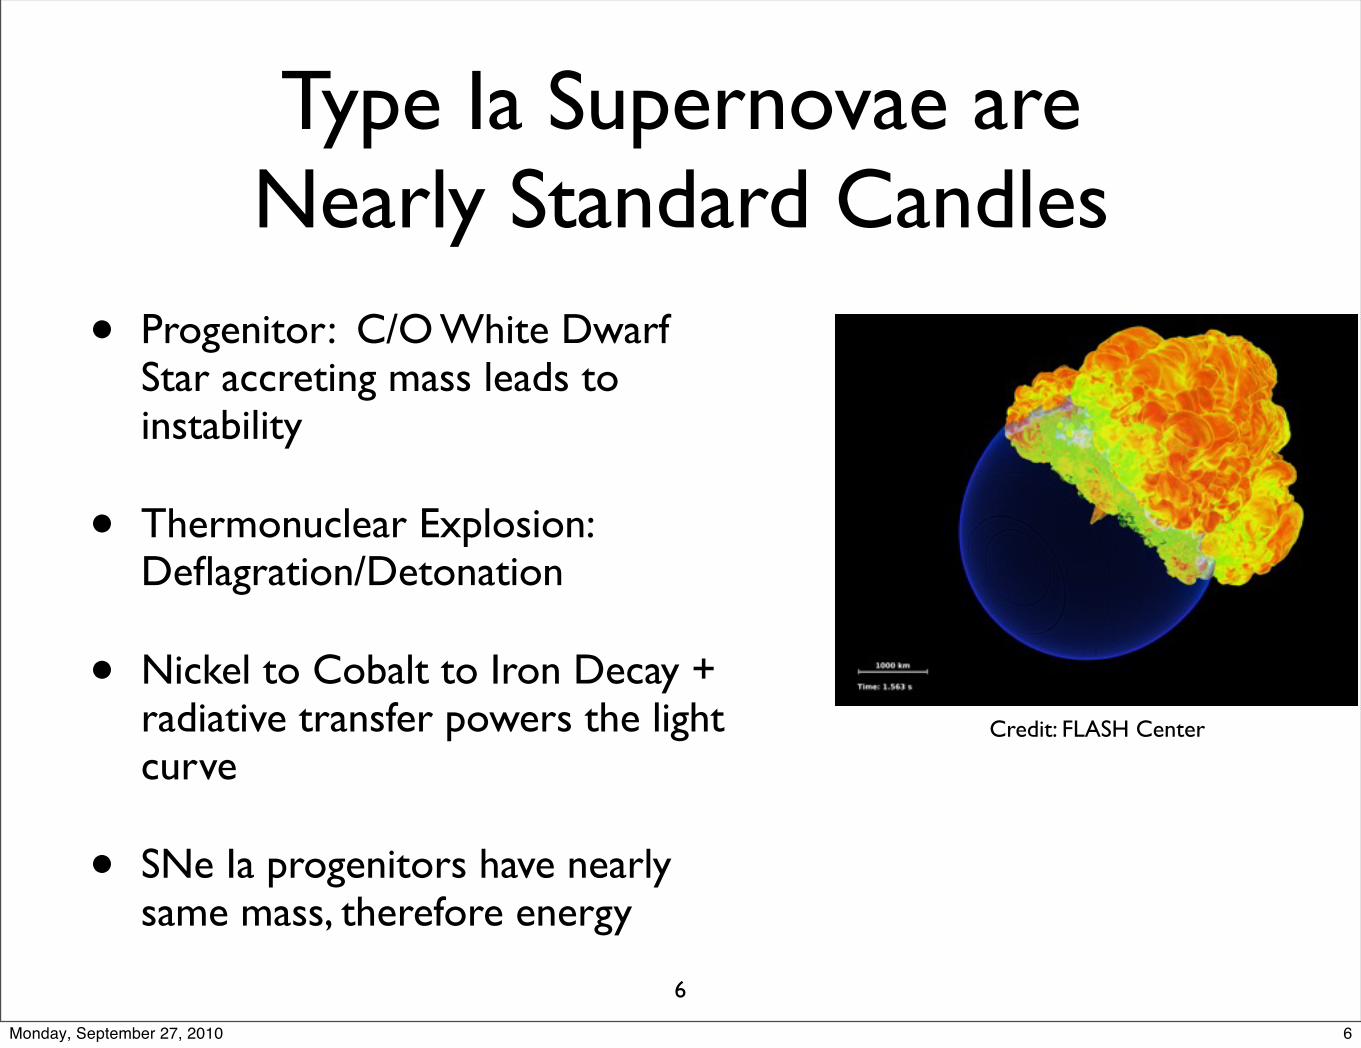
Type Ia Supernovae areNearly Standard Candles
• Progenitor: C/O White Dwarf Star accreting mass leads to instability
• Thermonuclear Explosion: Deflagration/Detonation
• Nickel to Cobalt to Iron Decay + radiative transfer powers the light curve
• SNe Ia progenitors have nearly same mass, therefore energy
Credit: FLASH Center
6
6Monday, September 27, 2010

Type Ia Supernova ApparentLight Curve
!10 0 10 20 30 40 50 60
6
8
10
12
14
16
18
20
22B + 2SN2005eq (CfA3+PTEL)
V
R ! 2
I ! 4
J ! 7
H ! 9
Obs. Days Since Bmax
Ob
s.
Ma
g. !
kc !
mw
x
7Monday, September 27, 2010
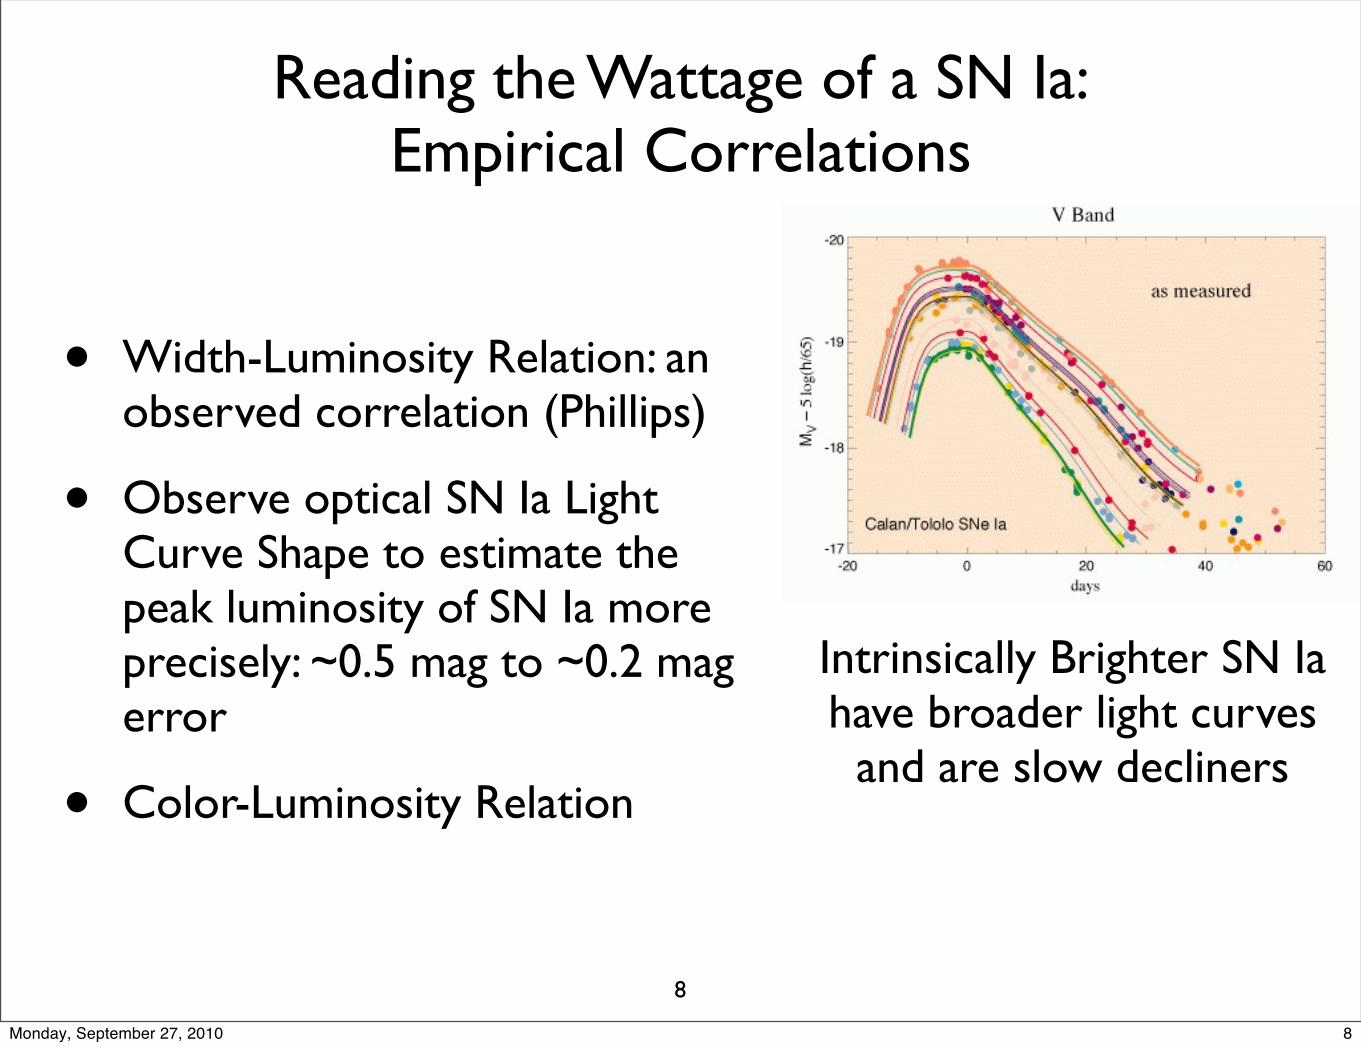
Reading the Wattage of a SN Ia:Empirical Correlations
• Width-Luminosity Relation: an observed correlation (Phillips)
• Observe optical SN Ia Light Curve Shape to estimate the peak luminosity of SN Ia more precisely: ~0.5 mag to ~0.2 mag error
• Color-Luminosity Relation
Intrinsically Brighter SN Ia have broader light curves
and are slow decliners
8
8Monday, September 27, 2010
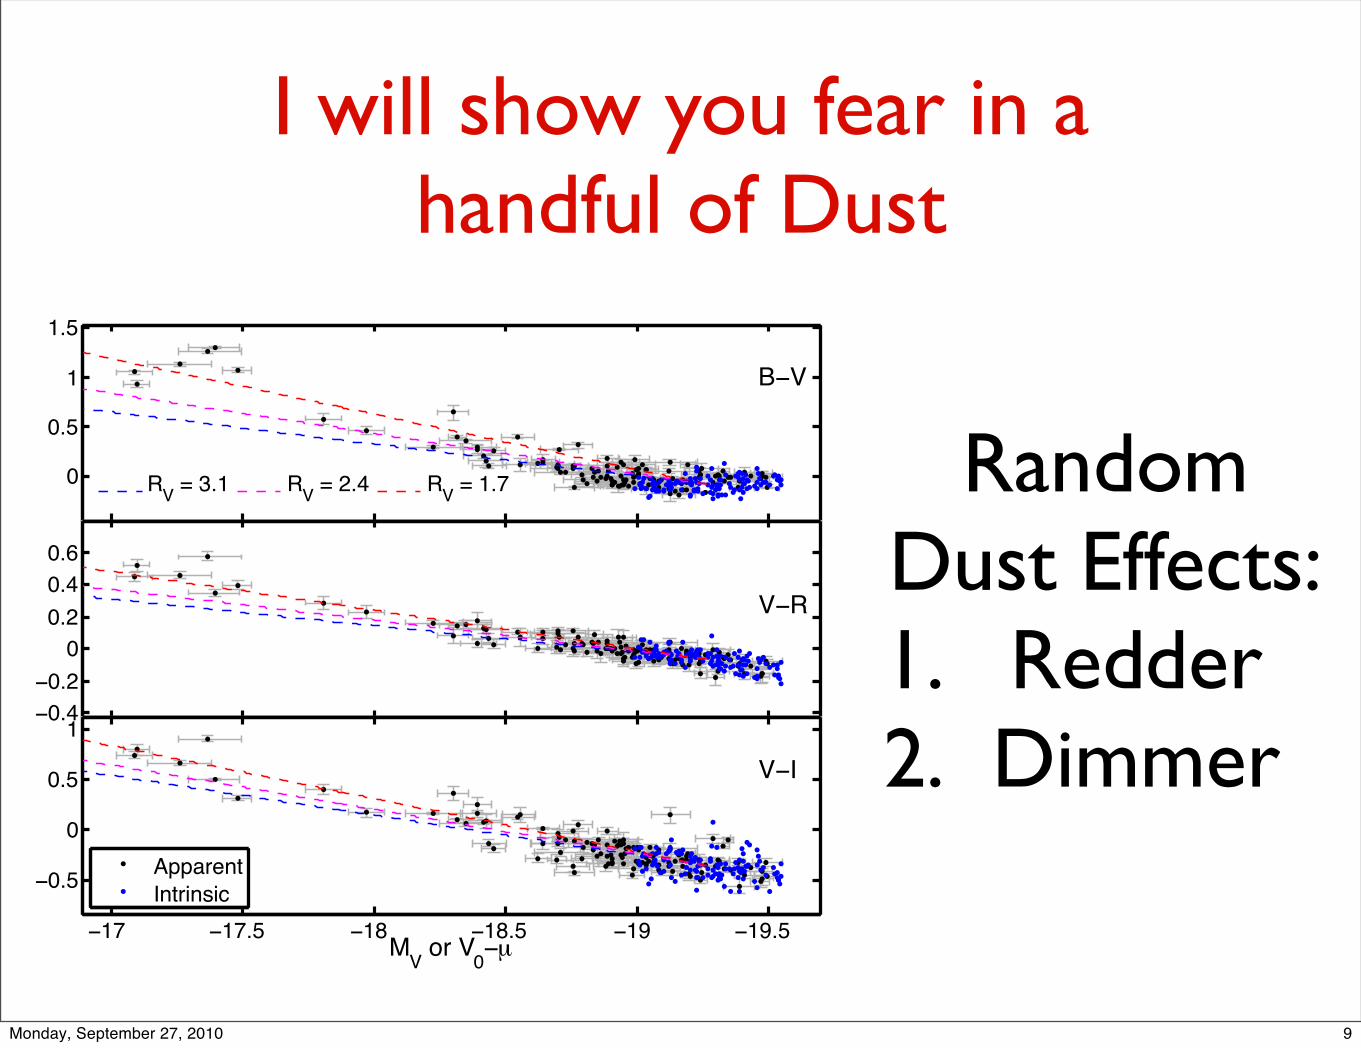
I will show you fear in a handful of Dust
0
0.5
1
1.5
B!V
!0.4
!0.2
0
0.2
0.4
0.6
V!R
!19.5!19!18.5!18!17.5!17
!0.5
0
0.5
1
V!I
MV or V
0!µ
RV = 3.1 R
V = 2.4 R
V = 1.7
Apparent
Intrinsic
Random Dust Effects:1. Redder 2. Dimmer
9Monday, September 27, 2010
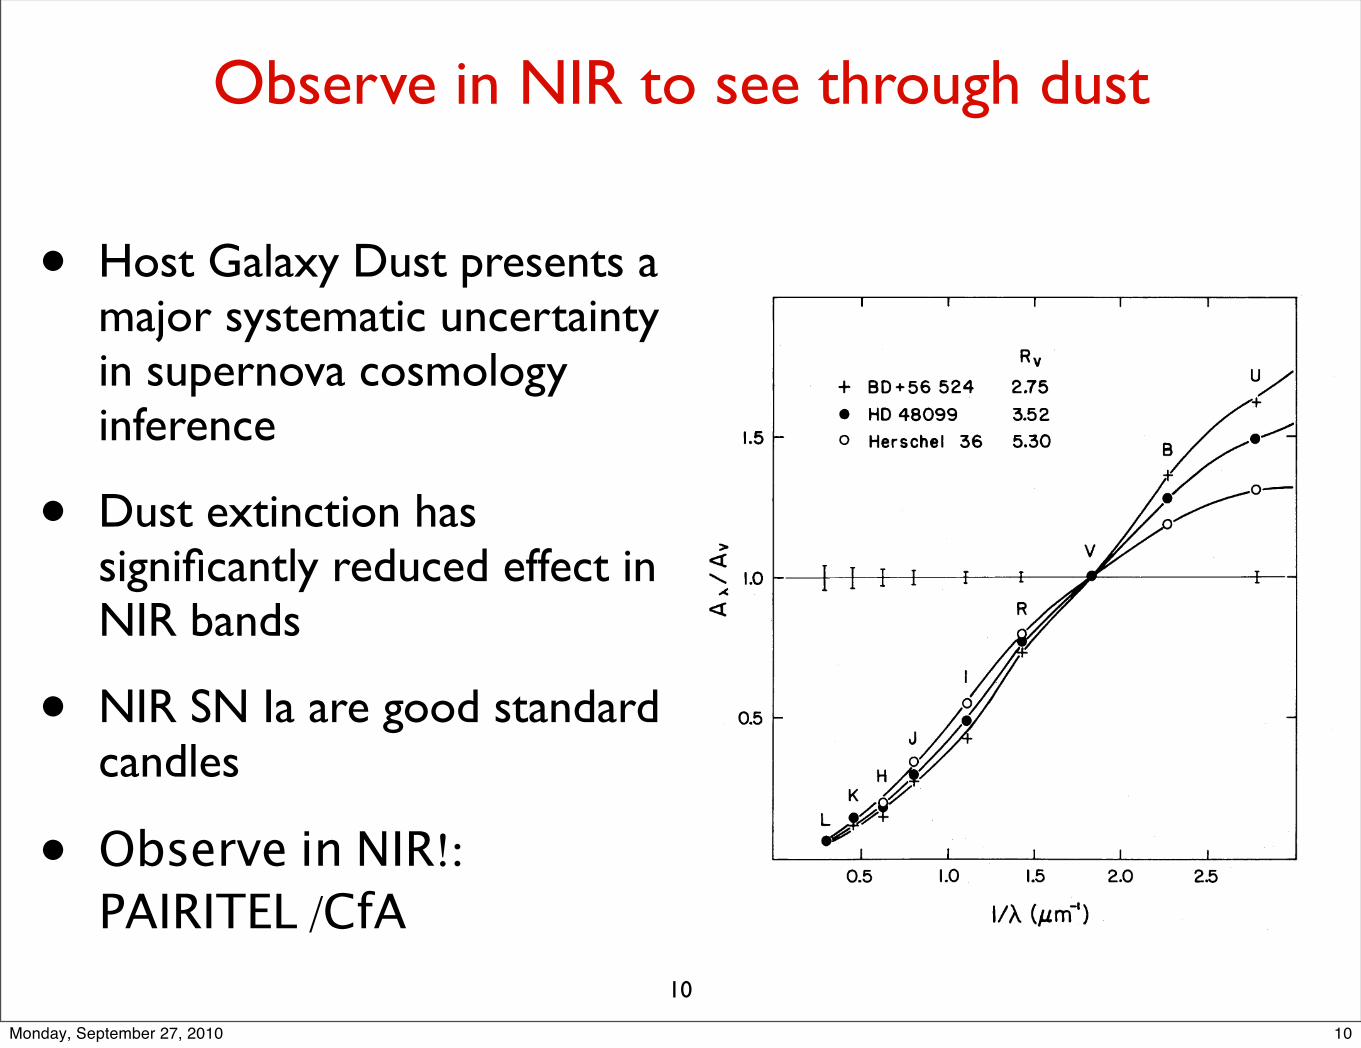
Observe in NIR to see through dust
• Host Galaxy Dust presents a major systematic uncertainty in supernova cosmology inference
• Dust extinction has significantly reduced effect in NIR bands
• NIR SN Ia are good standard candles
• Observe in NIR!: PAIRITEL /CfA
10
1989ApJ...345..245C
10Monday, September 27, 2010

Statistical inference with SN Ia
• SN Ia cosmology inference based on empirical relations
• Statistical models for SN Ia are learned from the data
• Several Sources of Randomness & Uncertainty
1. Photometric errors
2. Intrinsic Variation and Correlations between L, Light Curve Shape, Color = Population Distribution of SN Ia
3. Random Peculiar Velocities in Nearby Hubble Flow
4. Host Galaxy Dust: extinction and reddening.
• How to incorporate this all into a coherent statistical model? Hierarchical Bayesian Model!
11
11Monday, September 27, 2010
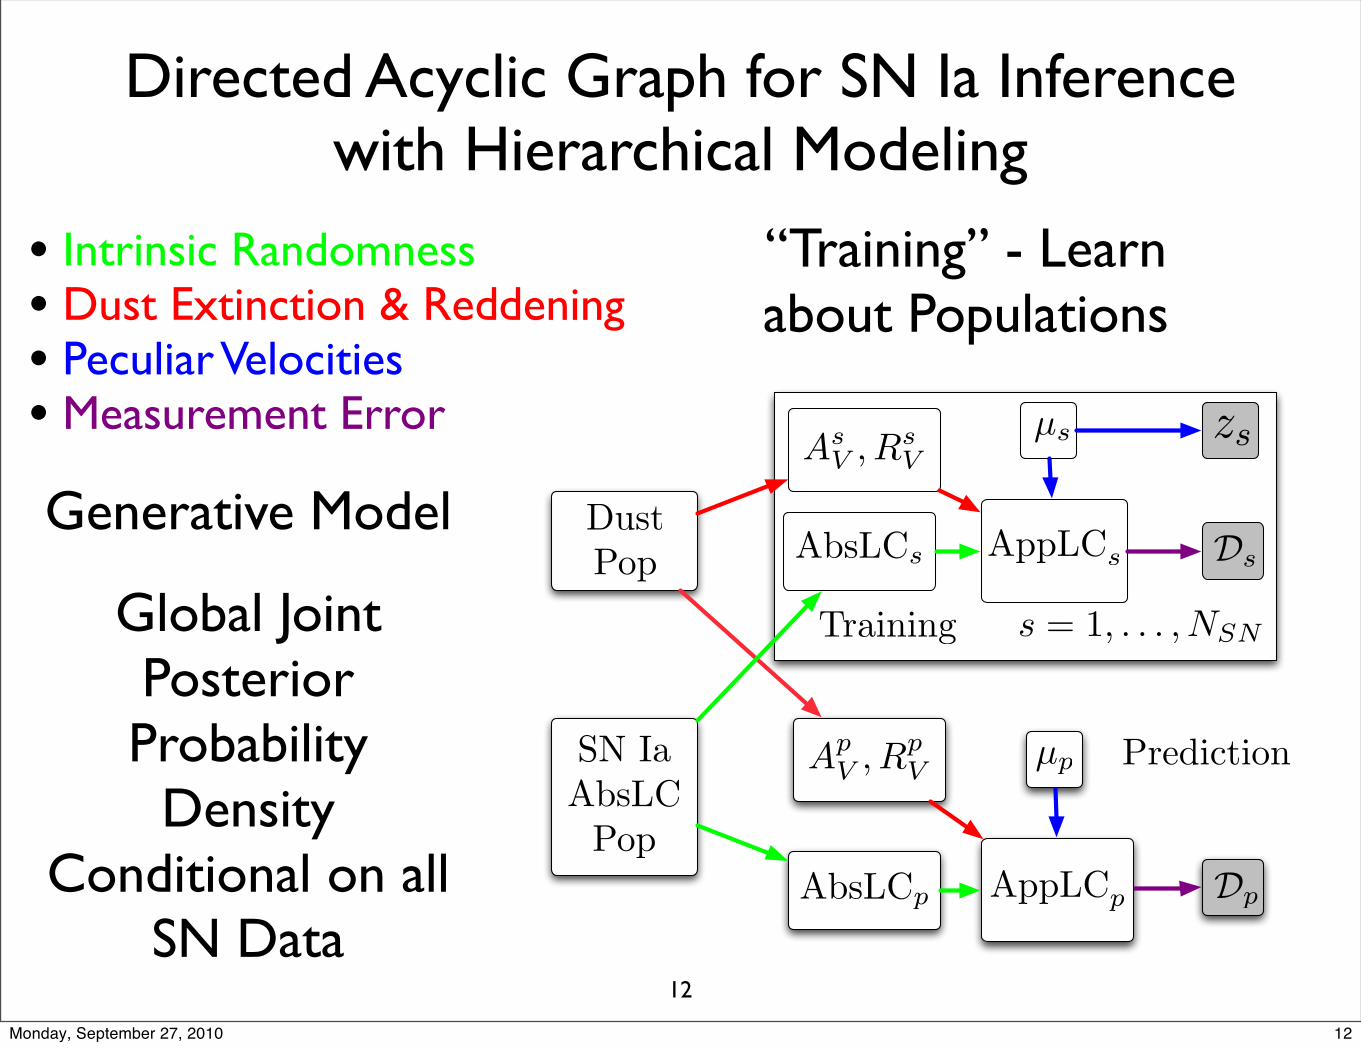
Directed Acyclic Graph for SN Ia Inferencewith Hierarchical Modeling
• Intrinsic Randomness• Dust Extinction & Reddening• Peculiar Velocities • Measurement Error
“Training” - Learn about Populations
12
Generative Model
Global Joint Posterior Probability
Density Conditional on all
SN Data
zs
Ds
µs
AppLCs
s = 1, . . . , NSN
AsV , Rs
V
AbsLCs
Training
PredictionApV , Rp
Vµp
DpAppLCpAbsLCp
DustPop
SN IaAbsLC
Pop
12Monday, September 27, 2010
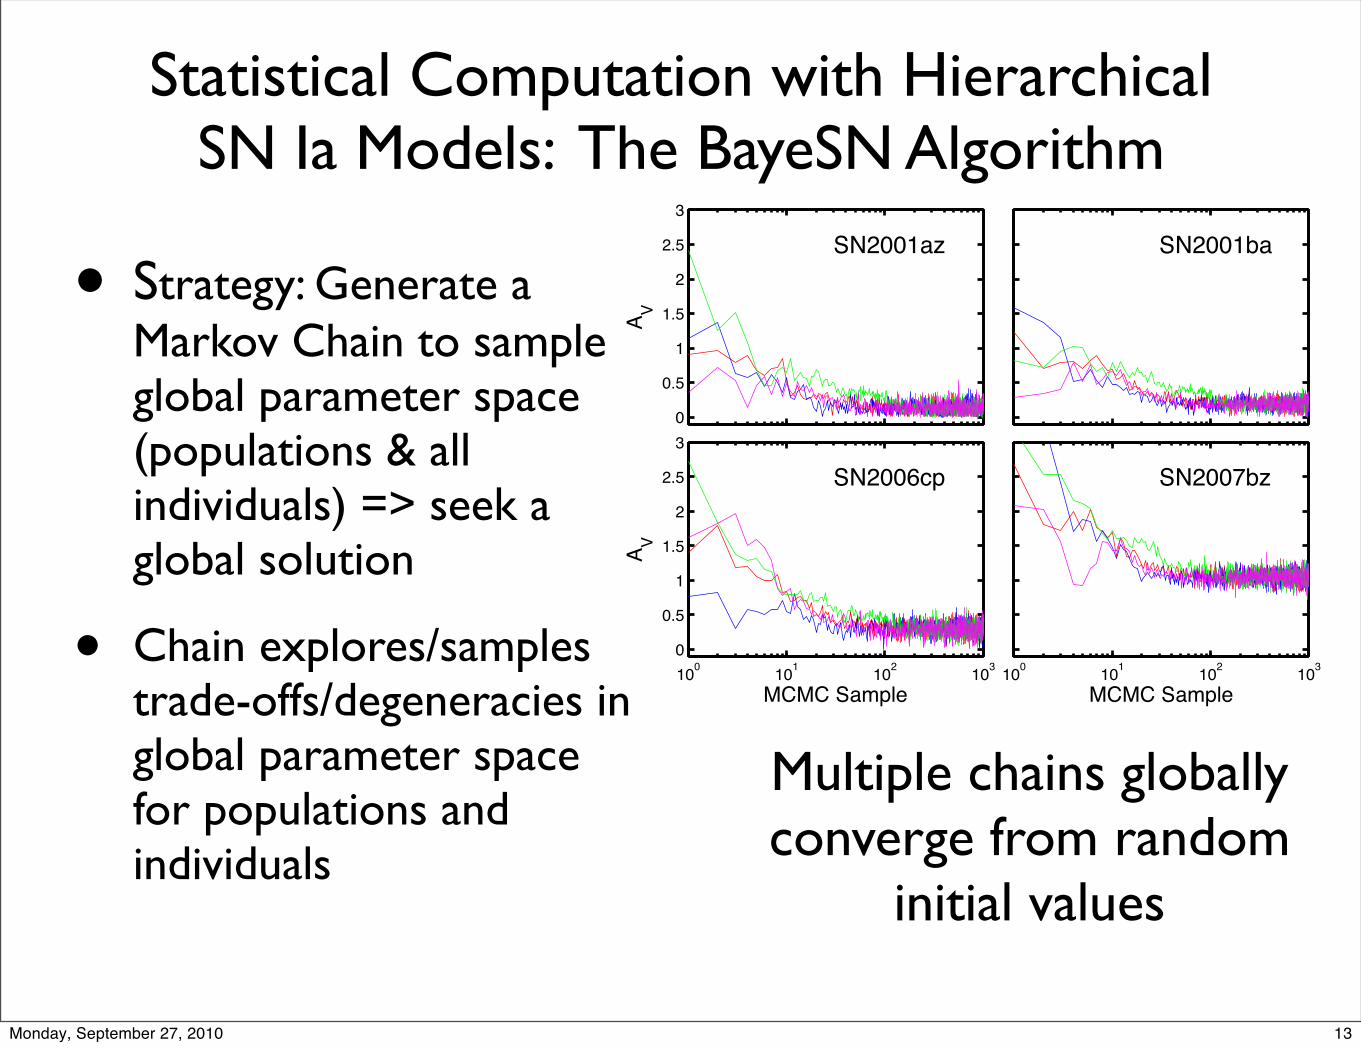
Statistical Computation with Hierarchical SN Ia Models: The BayeSN Algorithm
• Strategy: Generate a Markov Chain to sample global parameter space (populations & all individuals) => seek a global solution
• Chain explores/samples trade-offs/degeneracies in global parameter space for populations and individuals
Multiple chains globally converge from random
initial values
0
0.5
1
1.5
2
2.5
3
AV
SN2001az
SN2001ba
100
101
102
103
0
0.5
1
1.5
2
2.5
3
MCMC Sample
AV
SN2006cp
BayeSN MCMC Convergence
100
101
102
103
MCMC Sample
SN2007bz
13Monday, September 27, 2010

BayeSN MCMC strategy
• Gibbs Sampling
• Metropolis-Hastings
• Parameter Expansion
• Generalized Conditional Sampling
• Parallel chains to diagnose convergence
zs
Ds
µs
AppLCs
s = 1, . . . , NSN
AsV , Rs
V
AbsLCs
Training
PredictionApV , Rp
Vµp
DpAppLCpAbsLCp
DustPop
SN IaAbsLC
Pop
14Monday, September 27, 2010
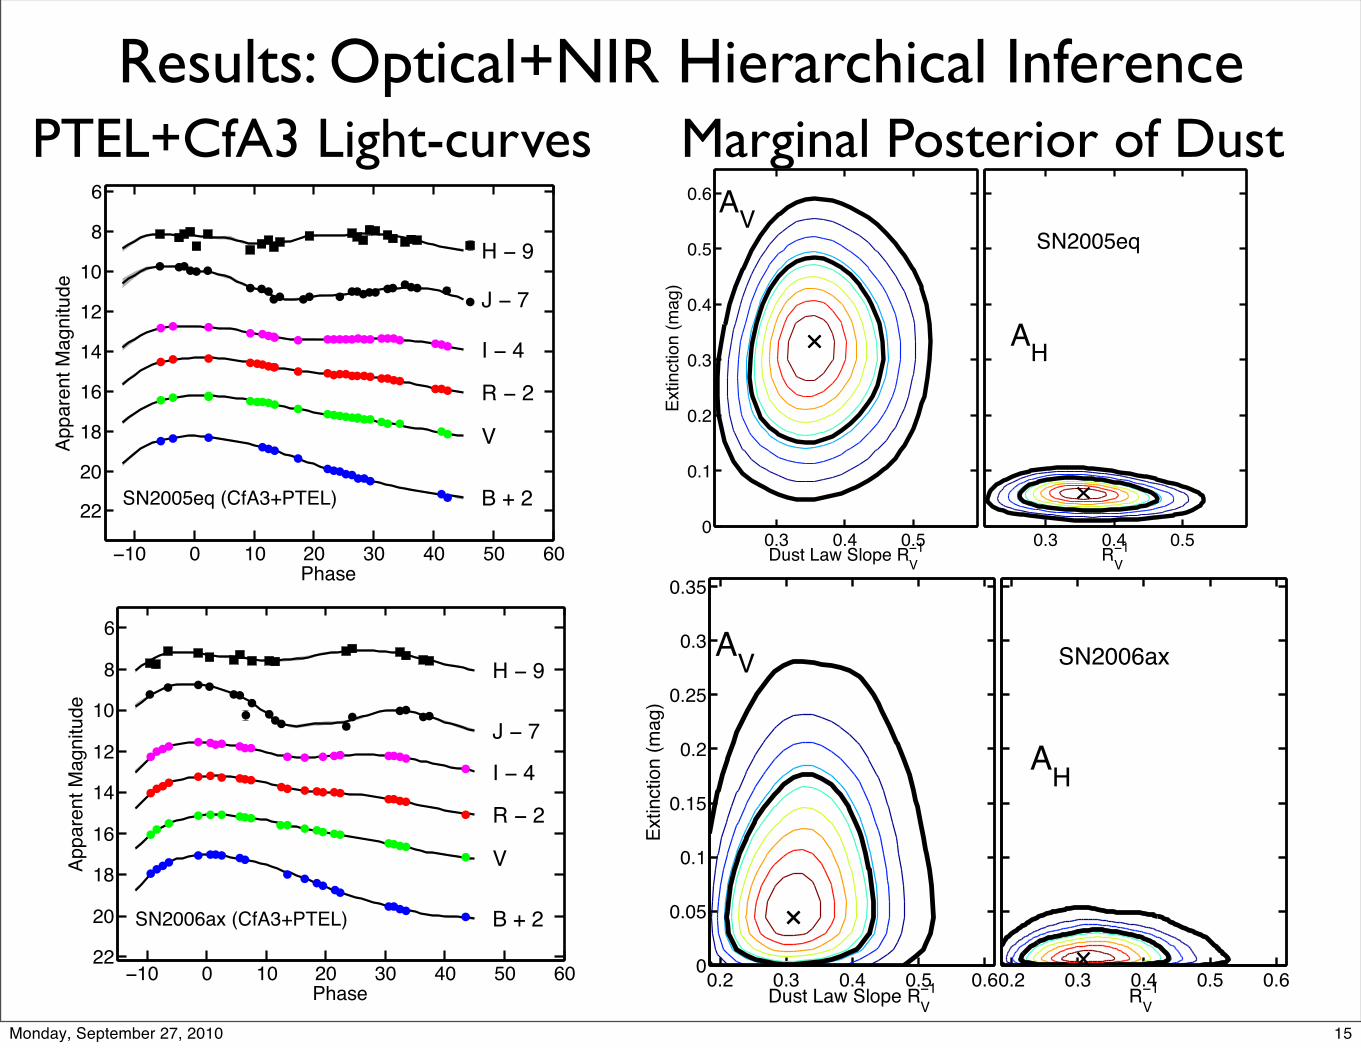
Results: Optical+NIR Hierarchical InferencePTEL+CfA3 Light-curves Marginal Posterior of Dust
!10 0 10 20 30 40 50 60
6
8
10
12
14
16
18
20
22B + 2SN2005eq (CfA3+PTEL)
V
R ! 2
I ! 4
J ! 7
H ! 9
Phase
Ap
pa
ren
t M
ag
nitu
de
!10 0 10 20 30 40 50 60
6
8
10
12
14
16
18
20
22
B + 2SN2006ax (CfA3+PTEL)
V
R ! 2
I ! 4
J ! 7
H ! 9
Phase
Ap
pa
ren
t M
ag
nitu
de
0.2 0.3 0.4 0.5 0.60
0.05
0.1
0.15
0.2
0.25
0.3
0.35
Dust Law Slope RV
!1
Extinction (
mag)
AV
0.2 0.3 0.4 0.5 0.6R
V
!1
SN2006ax
AH
0.3 0.4 0.50
0.1
0.2
0.3
0.4
0.5
0.6
Dust Law Slope RV
!1
Extin
ctio
n (
ma
g)
AV
0.3 0.4 0.5R
V
!1
SN2005eq
AH
15Monday, September 27, 2010
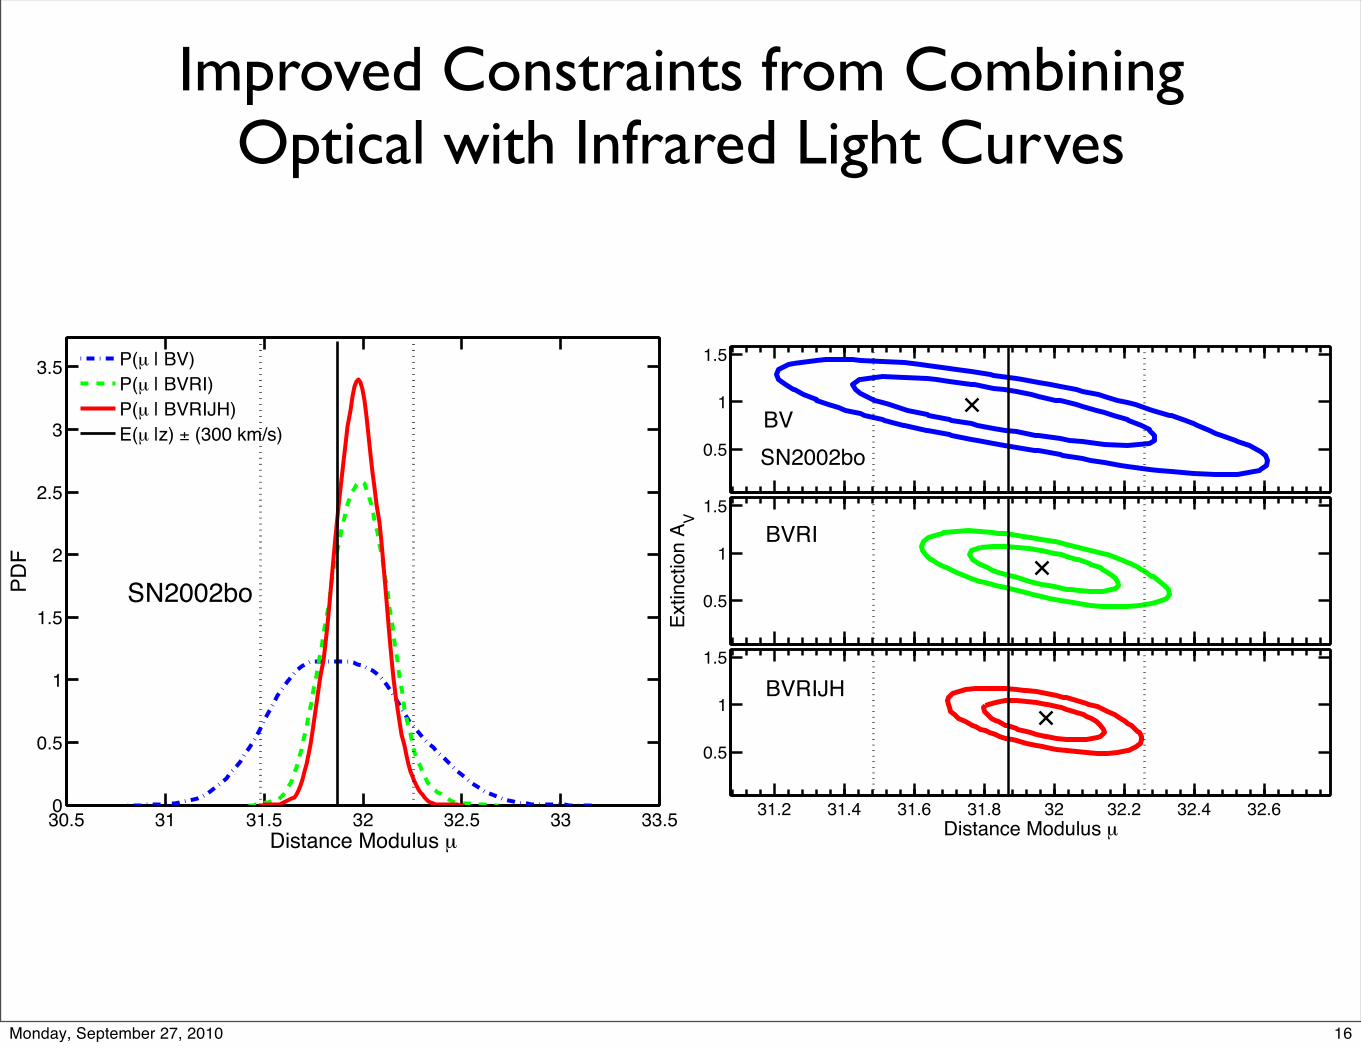
Improved Constraints from Combining Optical with Infrared Light Curves
0.5
1
1.5
BV
SN2002bo
0.5
1
1.5
Extinction A
V
BVRI
31.2 31.4 31.6 31.8 32 32.2 32.4 32.6
0.5
1
1.5
Distance Modulus µ
BVRIJH
30.5 31 31.5 32 32.5 33 33.50
0.5
1
1.5
2
2.5
3
3.5
SN2002bo
Distance Modulus µ
PD
F
P(µ | BV)
P(µ | BVRI)
P(µ | BVRIJH)
E(µ |z) ± (300 km/s)
16Monday, September 27, 2010

Improved Constraints from Combining Optical with Infrared Light Curves
33.6 33.8 34 34.2 34.4 34.6 34.8 35 35.2 35.40
0.5
1
1.5
2
2.5
3
3.5
4
SN2005ki:CSP
Distance Modulus µ
PD
F
P(µ | BV)
P(µ | BVRI)
P(µ | BVRIJH)
E(µ |z) ± (300 km/s)
0.2
0.4
0.6 BVSN2005ki:CSP
0.2
0.4
0.6
Extinction A
V
BVRI
34 34.1 34.2 34.3 34.4 34.5 34.6 34.7 34.8 34.9
0.2
0.4
0.6
Distance Modulus µ
BVRIJH
17Monday, September 27, 2010
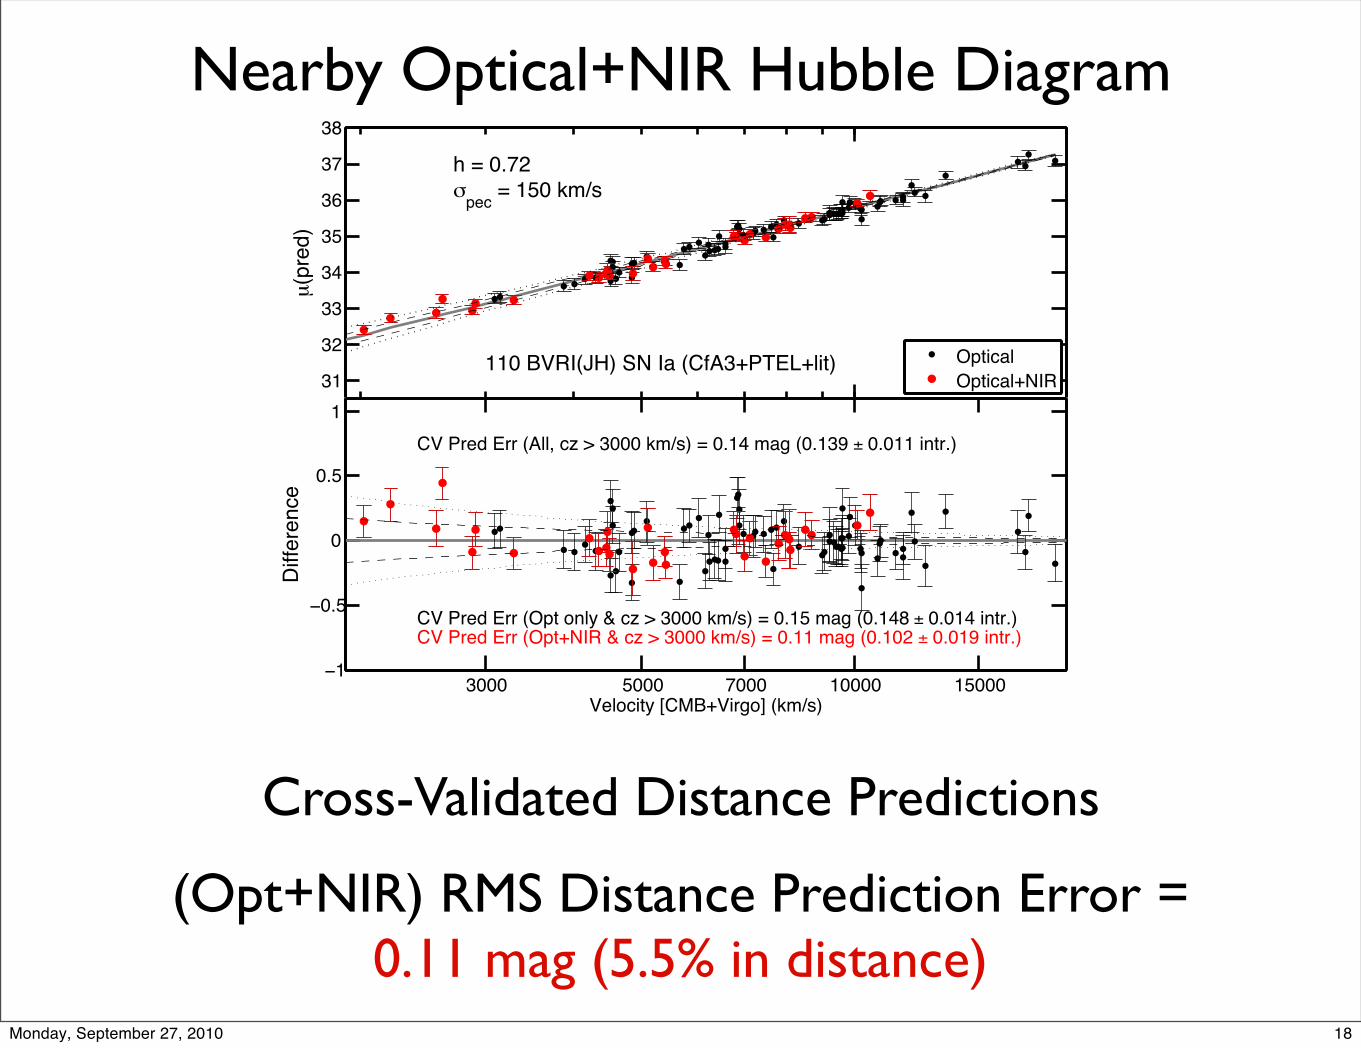
Nearby Optical+NIR Hubble Diagram
Cross-Validated Distance Predictions
(Opt+NIR) RMS Distance Prediction Error = 0.11 mag (5.5% in distance)
104
31
32
33
34
35
36
37
38
µ(p
red)
h = 0.72
!pec
= 150 km/s
110 BVRI(JH) SN Ia (CfA3+PTEL+lit)
3000 5000 7000 10000 15000!1
!0.5
0
0.5
1
Velocity [CMB+Virgo] (km/s)
Diffe
rence
CV Pred Err (All, cz > 3000 km/s) = 0.14 mag (0.139 ± 0.011 intr.)
CV Pred Err (Opt+NIR & cz > 3000 km/s) = 0.11 mag (0.102 ± 0.019 intr.)CV Pred Err (Opt only & cz > 3000 km/s) = 0.15 mag (0.148 ± 0.014 intr.)
Optical
Optical+NIR
18Monday, September 27, 2010
Summary• Hierarchical models for SN Ia Light Curves, Dust,Distance
• BayeSN: MCMC for fitting hierarchical models for SN Ia
• SN Ia Optical+NIR: Constrain dust, predict distances better
19
ReferencesMandel, K. , W.M. Wood-Vasey, A.S. Friedman, & R.P. Kirshner. Type Ia Supernova Light Curve Inference: Hierarchical Bayesian
Analysis in the Near Infrared. 2009, ApJ, 704:629-651
Mandel, K., G. Narayan, & R.P. Kirshner. Type Ia Supernova Light Curve Inference: Hierarchical Modeling in the Optical and Near
Infrared. 2010, in prep.
19Monday, September 27, 2010
Related Documents

![Hobas GRP pipe systems PN 1 - Amiblu · 2020. 6. 10. · Jacking Pipe PN 1 de [mm] SN SN SN SN SN SN SN SN SN SN SN SN Coupling Type 32000 40000 50000 64000 80000 100000 128000 160000](https://static.cupdf.com/doc/110x72/61236c822e9bd427c4013216/hobas-grp-pipe-systems-pn-1-amiblu-2020-6-10-jacking-pipe-pn-1-de-mm-sn.jpg)