Hydrology Training Course: Geographic Information System (1) Topographic Analysis (2) Hydrologic (Stream Order) Analysis (3) Precipitation Analysis What are we going to learn? We will work with geographic data to create topographic maps, to study stream system and precipitation distributioin in Kasumugaura Watershed with a software called 'ArcGI S'. This is a standard GIS software by ESRI probably most widely used in the world. To get an general idea on what the GIS is, what you can do with it, etc., please refer to this site (among otherts). Overview • Topographi c Analysis o Contour Map

Welcome message from author
This document is posted to help you gain knowledge. Please leave a comment to let me know what you think about it! Share it to your friends and learn new things together.
Transcript
8/7/2019 Hidrology Training
http://slidepdf.com/reader/full/hidrology-training 1/24
Hydrology Training Course:Geographic Information System(1) Topographic Analysis(2) Hydrologic (Stream Order) Analysis(3) Precipitation Analysis
What are we going to learn?
We will work with geographic data to create topographic maps, tostudy stream system and precipitation distributioin in KasumugauraWatershed with a software called 'ArcGIS'. This is a standard GIS
software by ESRI probably most widely used in the world.To get an general idea on what the GIS is, what you can do with it, etc.,please refer to this site (among otherts).
Overview• Topographic Analysis
o Contour Map
8/7/2019 Hidrology Training
http://slidepdf.com/reader/full/hidrology-training 2/24
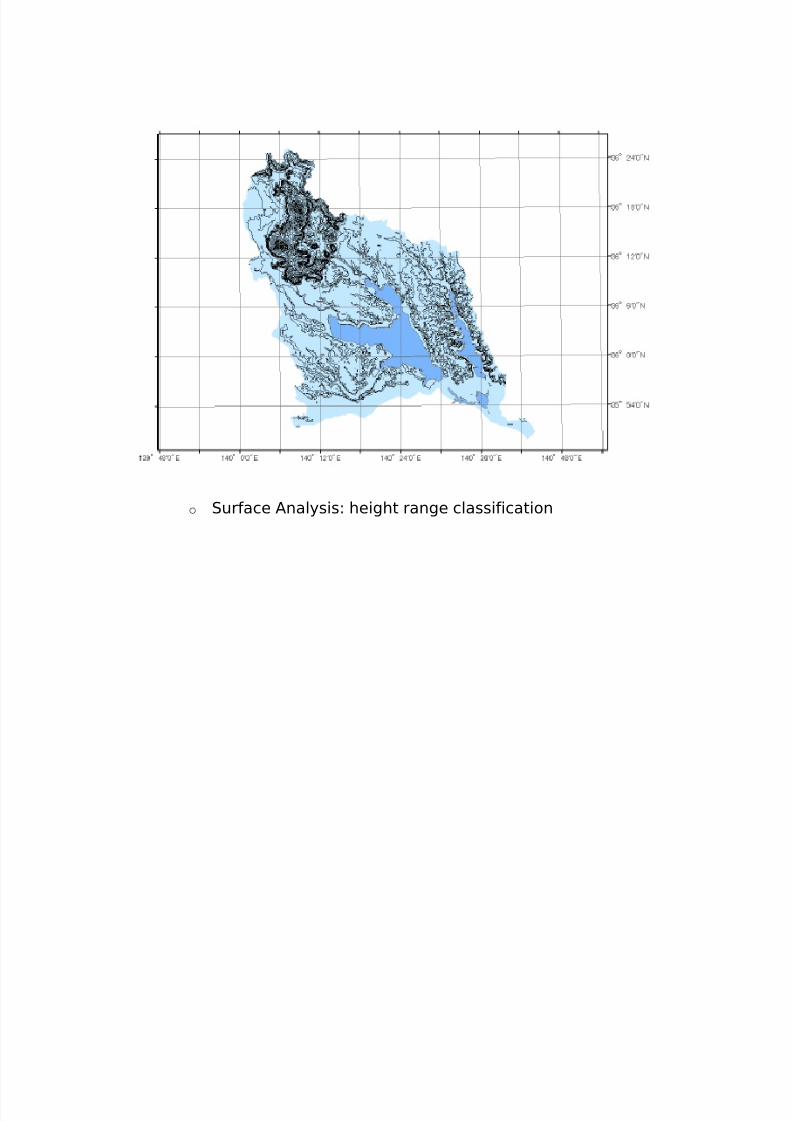
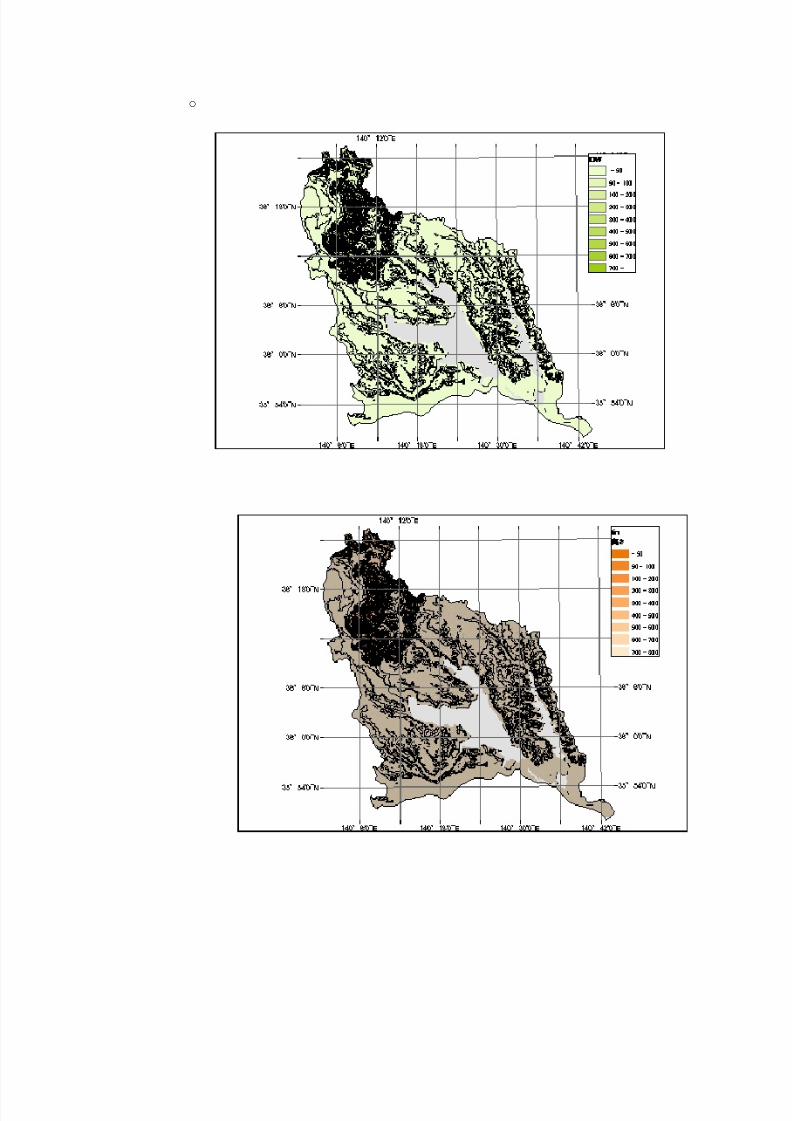
o Surface Analysis: height range classification
8/7/2019 Hidrology Training
http://slidepdf.com/reader/full/hidrology-training 3/24
o

8/7/2019 Hidrology Training
http://slidepdf.com/reader/full/hidrology-training 4/24
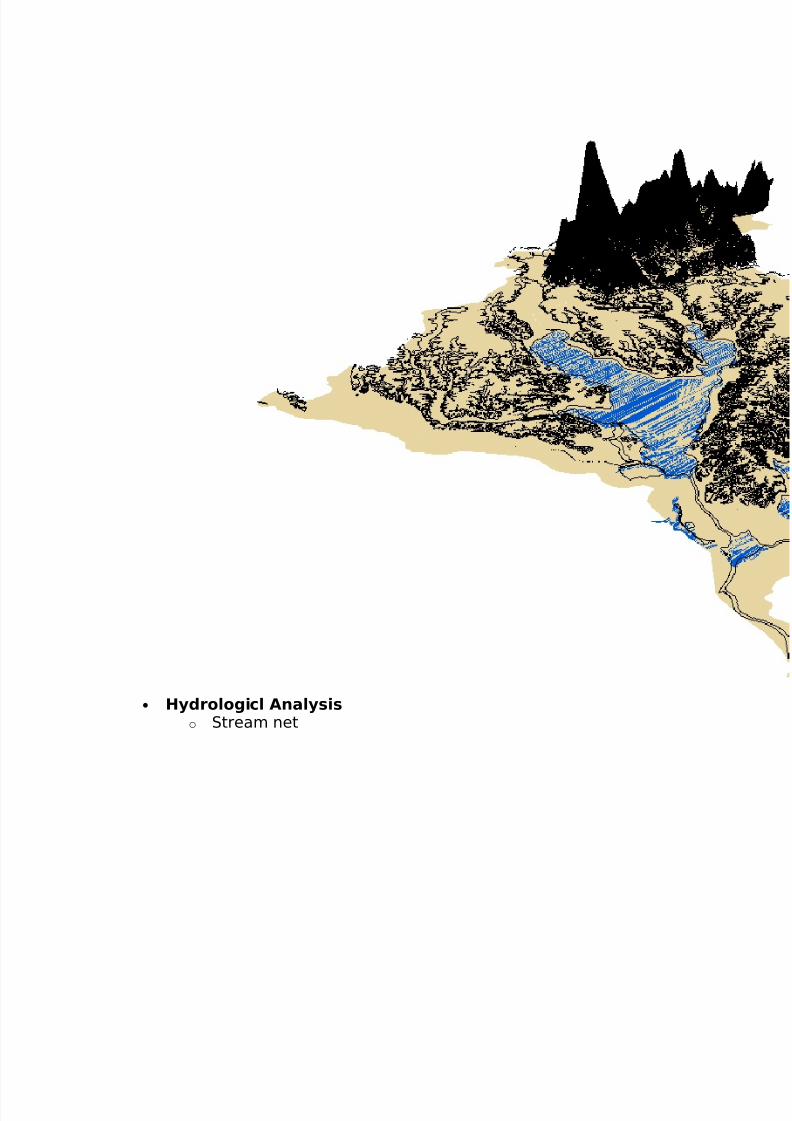
o 3D View
8/7/2019 Hidrology Training
http://slidepdf.com/reader/full/hidrology-training 5/24

8/7/2019 Hidrology Training
http://slidepdf.com/reader/full/hidrology-training 6/24
o Stream Order Analysis
8/7/2019 Hidrology Training
http://slidepdf.com/reader/full/hidrology-training 7/24
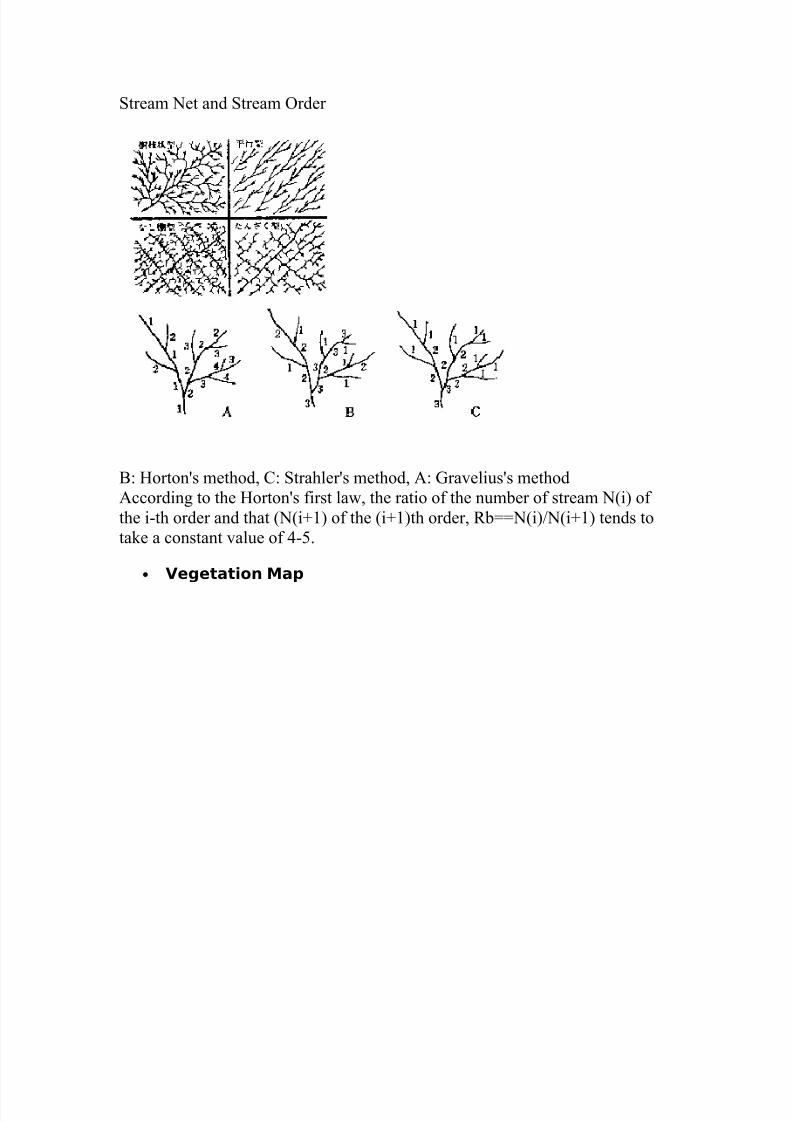
Stream Net and Stream Order
B: Horton's method, C: Strahler's method, A: Gravelius's method
According to the Horton's first law, the ratio of the number of stream N(i) of
the i-th order and that (N(i+1) of the (i+1)th order, Rb==N(i)/N(i+1) tends to
take a constant value of 4-5.
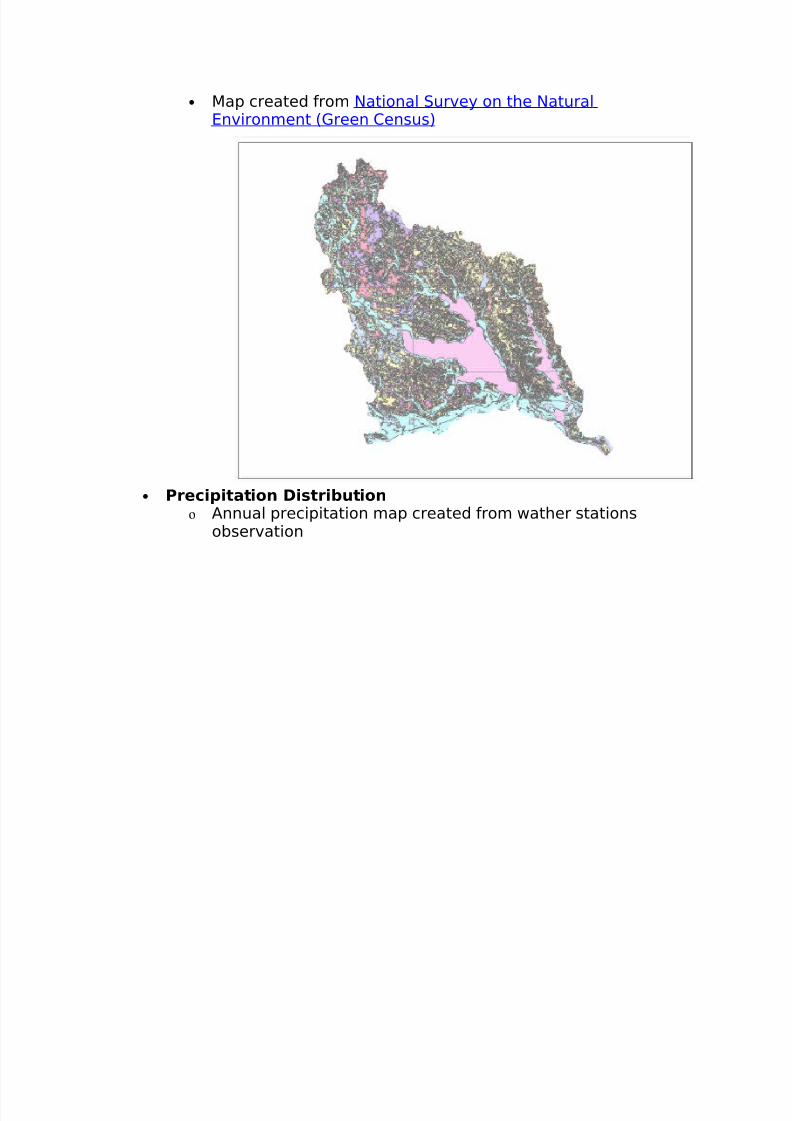
• Vegetation Map
8/7/2019 Hidrology Training
http://slidepdf.com/reader/full/hidrology-training 8/24
• Map created from National Survey on the NaturalEnvironment (Green Census)
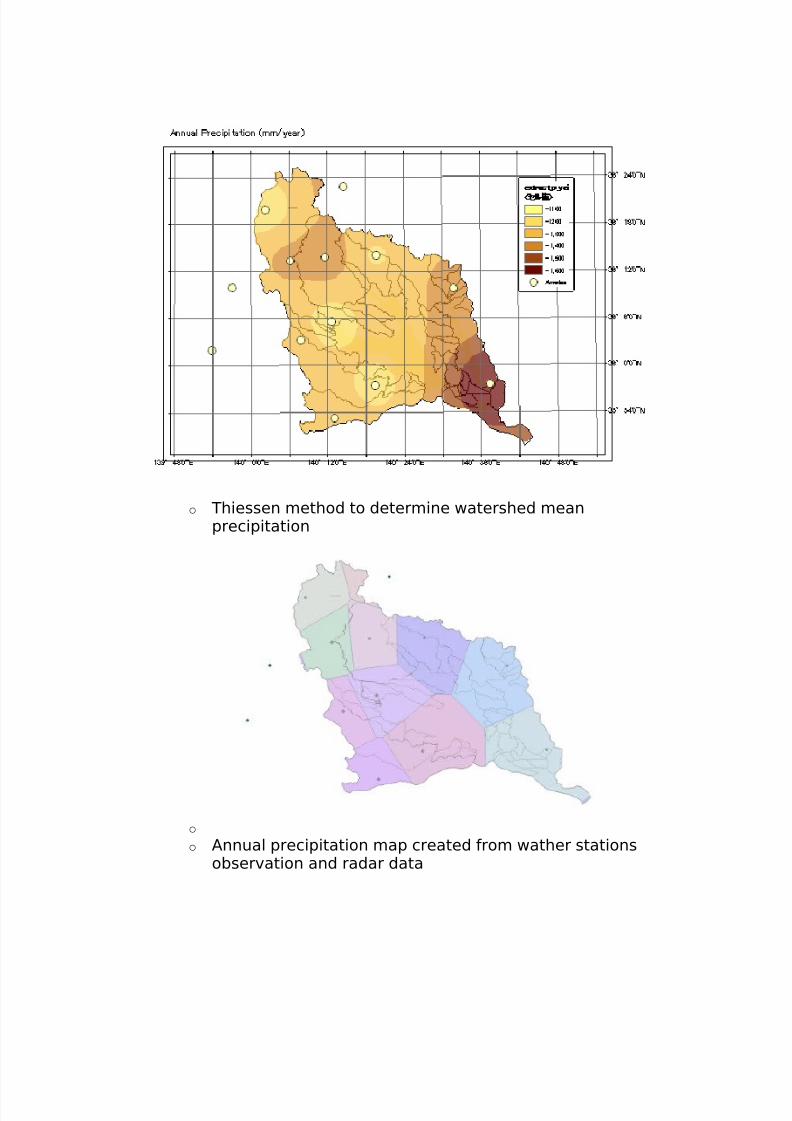
• Precipitation Distributionο Annual precipitation map created from wather stations
observation
8/7/2019 Hidrology Training
http://slidepdf.com/reader/full/hidrology-training 9/24
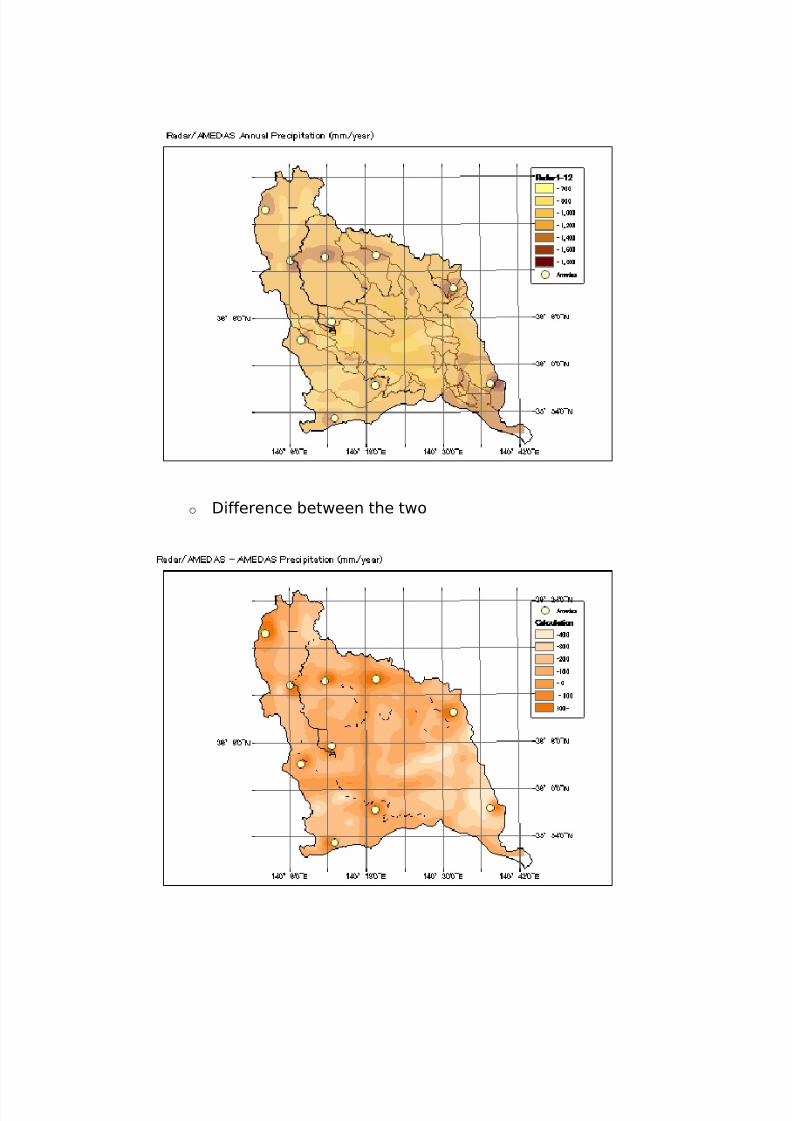
o Thiessen method to determine watershed meanprecipitation
o
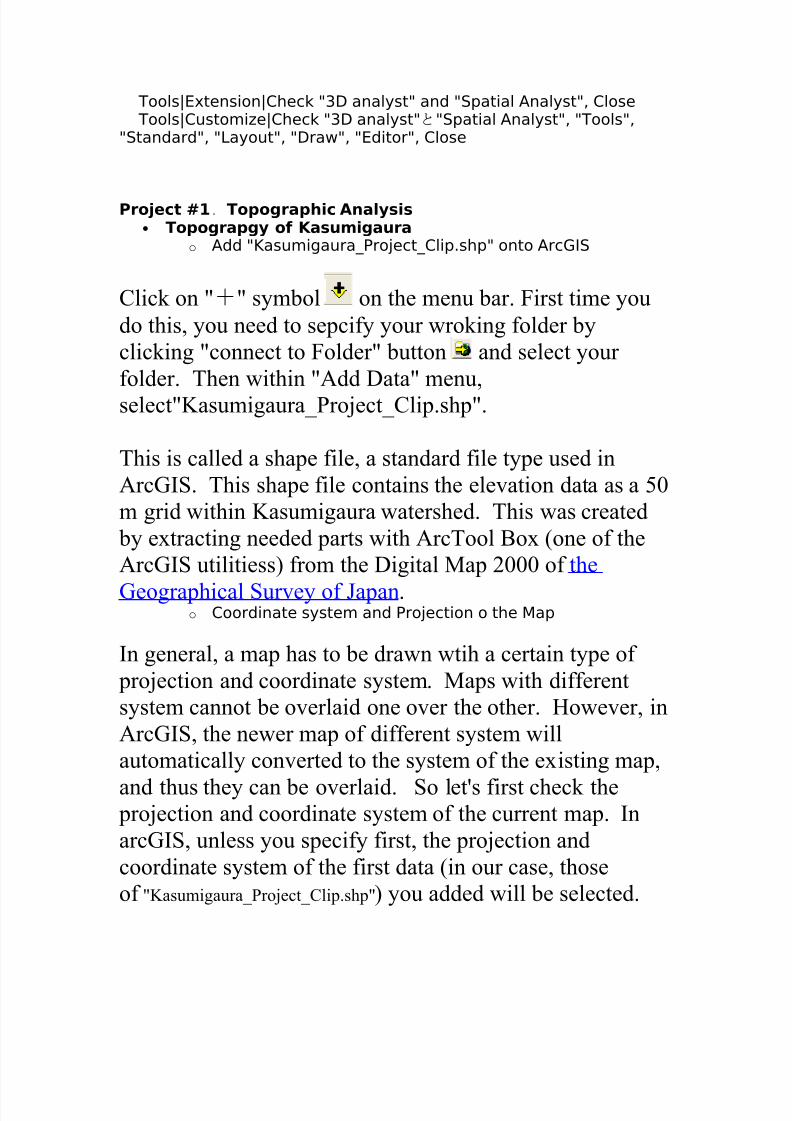
o Annual precipitation map created from wather stationsobservation and radar data
8/7/2019 Hidrology Training
http://slidepdf.com/reader/full/hidrology-training 10/24
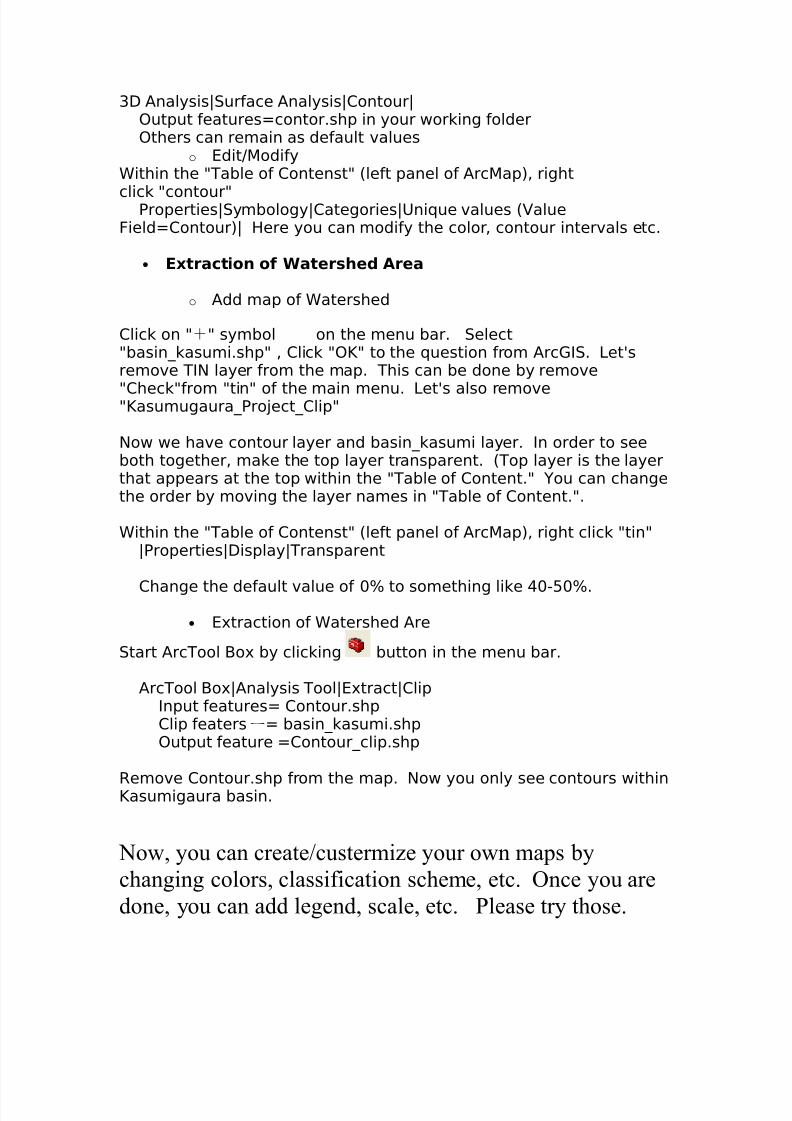
o Difference between the two

8/7/2019 Hidrology Training
http://slidepdf.com/reader/full/hidrology-training 11/24
「地理情報科学の教授法の確立」ホー ムページ へ.
Let's Work!
Preparation• Installation of ArcGIS
The University of Tsukuba has a site licence of ArcGIS;thus you can download the software, install it to your own
PC and use it on campus free of cahrge. For installation,
the instruction manual is available here. Then for actual
downloading, please go visit the site at 「地理情報科学の教授法の確立」ホー ムページ . First, you need to
supply your affiliation (Graduate School of Life and
Environmental Sciences), name and e-mail address. Then
choose ArcGIS9.1 (the latest version). (If you have
ArcGIS9.0 already installed on your PC, first you have to
uninstall 9.0 and then start installation of ArcGIS 9.1).• Data Download
Create a working directory on your PC. Then download all the filesonto this directoryfrom http://www.envr.tsukuba.ac.jp/~sugita/gis/files. Keep everything(file names and directroy structure) of the file server. This server isaccessible only from within the campus.
• Preparation of ArcGIS
The details of the ArcGIS use can be found in Users
Guide you downloaded from the above site.
o ExtensionStar|ArcGIS|ArcMap, Select "A new empty map".
8/7/2019 Hidrology Training
http://slidepdf.com/reader/full/hidrology-training 12/24
Tools|Extension|Check "3D analyst" and "Spatial Analyst", CloseTools|Customize|Check "3D analyst"と"Spatial Analyst", "Tools",
"Standard", "Layout", "Draw", "Editor", Close
Project #1.Topographic Analysis• Topograpgy of Kasumigaura
o Add "Kasumigaura_Project_Clip.shp" onto ArcGIS
Click on "+" symbol on the menu bar. First time you
do this, you need to sepcify your wroking folder by
clicking "connect to Folder" button and select your
folder. Then within "Add Data" menu,
select"Kasumigaura_Project_Clip.shp".
This is called a shape file, a standard file type used in
ArcGIS. This shape file contains the elevation data as a 50
m grid within Kasumigaura watershed. This was created
by extracting needed parts with ArcTool Box (one of the
ArcGIS utilitiess) from the Digital Map 2000 of the
Geographical Survey of Japan. o Coordinate system and Projection o the Map
In general, a map has to be drawn wtih a certain type of
projection and coordinate system. Maps with different
system cannot be overlaid one over the other. However, in
ArcGIS, the newer map of different system will
automatically converted to the system of the existing map,
and thus they can be overlaid. So let's first check theprojection and coordinate system of the current map. In
arcGIS, unless you specify first, the projection and
coordinate system of the first data (in our case, those
of "Kasumigaura_Project_Clip.shp") you added will be selected.

8/7/2019 Hidrology Training
http://slidepdf.com/reader/full/hidrology-training 13/24
Within the "Table of Contenst" (left panel of ArcMap), right click "layers"
choose "Propoerties|Coordinate System, and verify that it is
"JGD_2000_Japan_Zone_9" You can change this to different system by e.g.,
selcting "Predefined" system. • Get a rough image of topography with TIN
TIN is the Triangulated Irregular Network, one of the features of ArcGIS,to allow topography very easily by interporating data within thetriangles made from the data.
o Initial settingsSpatial Analyst|Option|
General|Analysis Coorinate System|".... same coordinate system asthe input...."
Extent|Same as Layer "Kasumigaura Project Clip"Cell Size=Minimum of Inputs
o Create TIN3D analyst|Create/Modify TIN|Create TIN from features|
Check Kasumigaura_Project_clipHeight source =ELEVOthers:keep default settings
o Edit/ModifyWithin the "Table of Contenst" (left panel of ArcMap), right click "tin"
|Properties|Symbology|Here you can change many things. For changing the number of
classes, Choose number in "Classes" of "Classification" in the right toppanel. To change the interval within each class, you can select
"Classify button , and cahnge the "Break Values" as youlike. To hide the triangles outside the watershed, you can do thefollowings: In Table of content, first add basin_kasumi.shp. Then rightclick "Layer" and select Property|Data Frame. Then you can check"Enable" on "Clip to Shape" and then Clic on Specify shape button, andchoose basin_kasumi as outline features. This will hide everything(i.e., not only tin but also other layers if there are some) outside the"basin_lasumi".
• Contour Mapo Initial Settings
Spatial Analyst|Option|General|Analysis Coorinate System|".... same coordinate system as
the input...."Extent|Same as Layer "Kasumigaura Project Clip"
o Create Contours
8/7/2019 Hidrology Training
http://slidepdf.com/reader/full/hidrology-training 14/24
3D Analysis|Surface Analysis|Contour|Output features=contor.shp in your working folderOthers can remain as default values
o Edit/ModifyWithin the "Table of Contenst" (left panel of ArcMap), right
click "contour"Properties|Symbology|Categories|Unique values (ValueField=Contour)| Here you can modify the color, contour intervals etc.
• Extraction of Watershed Area
o Add map of Watershed
Click on "+" symbol on the menu bar. Select"basin_kasumi.shp" , Click "OK" to the question from ArcGIS. Let'sremove TIN layer from the map. This can be done by remove
"Check"from "tin" of the main menu. Let's also remove"Kasumugaura_Project_Clip" Now we have contour layer and basin_kasumi layer. In order to seeboth together, make the top layer transparent. (Top layer is the layerthat appears at the top within the "Table of Content." You can changethe order by moving the layer names in "Table of Content.".
Within the "Table of Contenst" (left panel of ArcMap), right click "tin"|Properties|Display|Transparent
Change the default value of 0% to something like 40-50%.
• Extraction of Watershed Are
Start ArcTool Box by clicking button in the menu bar.
ArcTool Box|Analysis Tool|Extract|ClipInput features= Contour.shpClip featersー= basin_kasumi.shpOutput feature =Contour_clip.shp
Remove Contour.shp from the map. Now you only see contours withinKasumigaura basin.
Now, you can create/custermize your own maps by
changing colors, classification scheme, etc. Once you are
done, you can add legend, scale, etc. Please try those.
8/7/2019 Hidrology Training
http://slidepdf.com/reader/full/hidrology-training 15/24
This should be done, first choose View|Layout View fro
mthe main menu bar. This is the view you can make a print
out. The selec Insert|Legend, North arrow, Scale bar, etc.
Lat/Lon lines can be added from "Table of Contenst" , rightclick "Layers" |Properties|Grids|New Grid.
• Other Maps.
When you finish the above works, please try the
following with the same data set.
o Topographic Analysis
3D Analyst|Surface Analysis|
Slope (the rate of maximum change in z-value from each
cell, a value between 0 and 90)
Aspect (the downslope direction of the maximum rate of
change in value from each cell to its neighbors; slope
direction, positive degrees from 0 to 359.9)
Hillshade (The Hillshade tool creates a shaded relief raster from a raster. The illumination source is considered at
infinity)
Area and Volume (calculate area and volume of certain
category. For example, you can calcurate area with altitude
<2 m, where there is a danger of flood. You can determine
the area of Mt Tsukuba withaltitude <100 m where you
could obtan material easily for construction etc,) Create
your own problem and apply this option to calculate area
and/or volume.
o 3D visualization
3D Analyst ArcScene (Click this button within 3D analyst
menu bar)
8/7/2019 Hidrology Training
http://slidepdf.com/reader/full/hidrology-training 16/24
Within the new ArcScene Window, Click on "+"
symbol on the menu bar. Select "contour_Clip.shp"
Within the "Table of Contenst" (left panel of ArcMap),
right click "contour_clip"
|Properties|Base Heights|Click open file button and
select "idw"
Change value in "Z Unit Conversion" from 1 to 10. When
this value is increase, the 3D topograpgy is magnified in z
direction. You can try different values later on.
You can also add "basin_kasumi.shp" to show the area
of watershed in this 3D map.
Similarly, you may want to add
"kitaura.shp", "Nishiura.shp", "sotona_sakura.shp", 3 major lakes of Kasumigaura.
You can change the way 3D looks like by click ing
navigation button in the menu bar and use mouse to
change the looks. This is fun!
Project #2.Hydrologic Analysis
Let's create a map of drainage net.. This is a map in which all riversystem (both main and tributary) is expressed as lines. In practice,this is determined by analysing the curveture of a contour map. Whenthere are a concave contour lines that would allows stream flow, thecurved portion of the contour can be connected with a line as part of drainage net. Note that not all nets have river flow at all times; somehave water flow only during a peak runoff period.
• Drainage net
Start ArcMap, with "A new empty map"option. First, definemap projection. Within the "Table of Contenst", right click"layers" choose "Propoerties|Coordinate System, andselect Predefined|日本周辺座標系|平面直角座標系|19 system|Jgd2000|JGD 2000 第 9系. Verify that wihtin the "Currentcoorinate syetm" window, JGD_Japan_Zone_9 is selected."Note that if you cannot find these, it is because your ArcGIS
8/7/2019 Hidrology Training
http://slidepdf.com/reader/full/hidrology-training 17/24
program is original English versioin. These files are usuallyadded to the disk when you install Japanese version; Pleasecome to see an instructor to obtain needed files.
o Conversion from a mesh altitude data to a raster
altitude file
Click on "+" symbol on the menu bar.
First time you do this, you need to sepcify
your wroking folder by clicking "connect to
Folder" button and select your folder.
Then within "Add Data" menu,
select"Kasumigaura_Project_Clip.shp". Initial settings
Spatial Analyst|Option|
General|Analysis Coorinate System|".... same
coordinate system as the input...."
Extent|Same as Layer "Kasumigaura Project Clip"
Cell Size=Minimum of Inputs On 3D analyst, Select Interporate to Raster|Inverse
Distance Weighted.Select "Kasumigaura_Project_Clip.shp" as Inputpoints. Output raster name should be changed to"idw" in your working directory. Other options canremain as default values. Select "OK". This willcreated raster file containing altitude by interpolatingmesh data. Note that this will take some 10-15minutes.
Extraction of the Kasumigaura watershed
parts. Open ArcTool Box Window by clicking .Select Spatial Analyst Tools|Extraction|Extract byMask. Input: idw, feature mask data:basin_kasumi.shp, Output: Extract_idw1.
Let's remove "idw" and "kasumigaura_Project_clip"from "Table of content"
o Drainage net from IDW
Remove "hollows"within the watershed. This is necessary
so that all water goes out of watershed.
8/7/2019 Hidrology Training
http://slidepdf.com/reader/full/hidrology-training 18/24
Within ArcTool Box Menu
Spatial Analyst Tools|Hydrology|Fill
input=extract_idw1, output=Fill_extract1
• Calculate direction of flow
Spatial Analyst Tools|Hydrology|Direction
input=fill_extract1, output=FlowDir_fill1
• Evaluate whether or not there is an incoming flow flom neighbor cell.
Spatial Analyst Tools|Hydrology|Flow Accumulation
input=flowdir_fill1, output=FlowAcc_flow1
• Let's define river when the flow amount is more than 5. Flow amount is
a number of cells from which there is an incoming flow to a particukar
cell . The resulting file has1 when there is a flow, and 0 otherwise
Spatial Analyst Tools|Conditional |Con
input=flowacc_flow1, Input true raster or constant value=1, Expressiobn Value
>= 5(Note that there is a space on both side of >=), Output=con_flowacc_1
• Drainage net
Spatial Analyst Tools|Hydrology||Stream to Feature
Input stream raster=con_flowacc_1 input flow direction=FlowDir_fill1,
output=StreamT_con_flo1.shp
• Stream order
Spatial Analyst Tools|Hydrology||Stream Order
Input stream raster=con_flowacc_1, input flow direction=FlowDir_fill1,
output=streamo_con_1
Now you ca edit the map to make it look nice. This can be done by changing
colors, adding other files such as Lasumigaura lakes, etc. Save a map.
Please also try other options in Spatial Analyst Tools|Hydrology. They include
"Basin" to create a raster delineating all drainage basins, and "Watershed" to
determine the watershed area. They are usually used to create a watershed

8/7/2019 Hidrology Training
http://slidepdf.com/reader/full/hidrology-training 19/24
boundary from flow direction/flow accumulation files created above.
Note however, it is more convenient to use "Hydrological Modeling extension"
provided by ESRI as a samle extension. This can be done as follows.
• In your PC, try to locate a folder C:\Program
Files\ArcGIS\DeveloperKit\samples\SpatialAnalyst. There are severalsamples in it. You should unzip a file called
Hydrologic_ModelingVisual_Basic.zip; the resulting folders
"Hydrologic_ModelingVisual_Basic" can be moved to "C:\Program
Files\ArcGIS\".
• Within ArcGIS, Tools|Extension|Customize| , Click on "Add from file"
button. Select "esrihydrology_v2.dll"
within "Hydrologic_ModelingVisual_Basic\Visual_Basic" folder. Then
check "Hydrology Modeling" , Close. View|Tool bar| check "Hydrology
Modeling"
• To create a watershed boundary above a certain point (Pour point), click
on Hydrolgy Menu. Choose "Interactive Properties". Specify your flow
direction and flow accumulation files. Then click on . Select your
poring point by clicking a mouse.
• To create sub-basins within the specified flow direction and flow
accumulation files, choose "watershed" in Hydrology menu. The
Minimum number of cells for a basin is the flow accumulation value
above which the watershed boundary is to be created.
• The description of this sample extension can be found in C:\Program
Files\ArcGIS\Hydrologic_ModelingVisual_Basic\Visual_Basic\Hydrolo
gyAnalysis.doc.
Project #3.Vegetaion Map
Let's create a map of vegetation in Kasumigaura region from NationalSurvey on the Natural Environment (Green Census) . Data (shape file)in Ibaraki prefecture can be downloadedfrom http://www.envr.tsukuba.ac.jp/~sugita/gis/vegetation/ You canuse these files only for this lecture. You may not distribute these filesto other people (you need to obtain permission). Files by the name of vg3*.* are from 3rd survey in 1983-1986; vg4*.* are from 4th survey in1989-1992; vg5*.* are from 5th survey in 1995-1999. In vg3*.*, all

8/7/2019 Hidrology Training
http://slidepdf.com/reader/full/hidrology-training 20/24
data are included, while in vg4*.* and vg5*.*, only data that werefound different from previous survey are included. In the filevegetationb_type.csv, you can find a list of "major (属性1)" used inthe shape file and name of vegetaion. Sorry, the information is givenin japanese only. Please use these files to create a vegetation map of
Kasumigaura watershed, based on what you have learned from Project#1 and Project #2.
Hint: This data set gives very detailed vegetation all over Japan. Thisis sometimes very useful. But for hydrological purposes, often we donot need this detailed information. All we need may be the differenceof forest, grassland, houses, water and so on. To create this kind of map from the detailed information, you can assign the same color forthe similar vegetation category. The result will look like this map. Thecategory numbers in this map correspond to the number in the "H"column(植生自然度 vegetation_class 1) of vegetation_class_all sheet in
"vegetaion_class1.xls". The English names can be found invegetation_class1 sheet.
This can be accomplished by useing additional file which list not onlythe detailed classification, but also classification of less detailedinformation. Add this file onto the map. The table can be joined to thevegetation shape file of vg3*.*, vg4*.*, and vg5*.* as follows
o Right click on the vegetation shape file (vg3, 4, or 5).
o Join and Relates| Join |
o Select as follows: "Join attributes from a table", "Major1",
"VG_a.csv" and "Major1". This will create a table that combineboth files.
o Then doble click Vg* shape file and select Symbo | Categories |
植生自然度 | Add all values.
o You can assign appropriate colors to each category.
Project #4.Precipitation analysis
• A map of annual precipitation over Kasumigaura lakebasin
Start ArcMap, with "A new empty map"option. First, define map projection.
Within the "Table of Contenst", right click "layers" choose "Propoerties|
Coordinate System, and select Predefined|日本周辺座標系|平面直角座標系|
19 system|Jgd2000|JGD 2000第 9系. Verify that wihtin the "Current
coorinate syetm" window, JGD_Japan_Zone_9 is selected." Note that if you
cannot find these, it is because your ArcGIS program is original English
8/7/2019 Hidrology Training
http://slidepdf.com/reader/full/hidrology-training 21/24
versioin. These files are usually added to the disk when you install Japanese
version; Please come to see an instructor to obtain needed files.
Click on "+" symbol on the menu bar. First time you
do this, you need to sepcify your wroking folder by
clicking "connect to Folder" button and select your
folder. Then within "Add Data" menu,
select "basin_kasumi.shp.
o Data Preparation
Let's add "Amedas_precip_monthly2001.csv" which contain monthly and
annual precipitation (ID, Lat, Lon, Jan...Dec,year) data.Tools||Add xy data|File=Amedas_precip_monthly2001.csv|x Field=Lon,
y Field=Lat
oatial reference|Edit|Select|Japan|Geographic Coordinate System|JGD 2000.prj
• Isohyet (Contour lines of precipitation)
(1)Interporation
Spatial Analyst|option|GeneralAnalysis Coordinate System=Analysi output will be....as the active data frame
Extent=Same as layer "basin_Kasumi"
Cell size=Minimum of inputs
Spatial Analyst|Interpolate to raster|Inverse Distance weighted
Input points=Amedas_precip_monthly2001.csv
z value field=Annual
Output raster=C:\Products\doc\GIS\P_year_inter
• Isohyet (Contour lines of precipitation)(2)Spline method
Spatial Analyst|option| General
Analysis Coordinate System=Analysi output will be....as the active data frame
Extent=Same as layer "basin_Kasumi"

8/7/2019 Hidrology Training
http://slidepdf.com/reader/full/hidrology-training 22/24
Cell size=Minimum of inputsAnalysis Coordinate System=Analysi output will
be....as the active data frame
Spatial Analyst || Interpolate to raster| Spline
Input points=Amedas_precip_monthly2001.csv
z value field=AnnualOutput raster=C:\Products\doc\GIS\P_year_spline
o Extraction of basin region
Spatial Analyst Tools|Extraction|Extract by Mask
Input=P_year_inter
feature mask data=basin_kasumi.shp
Output raster=Extract_p_yeI
• Thiessen Method to Determine Watershed Mean
Precipitation
In this approach, we will use one of the script
(program, macro) file constructed for this purpose.
o Script installation
download the file by accessing http://arcscripts.esri.com/.
Search for "thiessen"; choose "Create Thiessen Polygons
3.0", download this file, and install this onto your ArcGIS
by following instruction in "Create
ThiessenPoly_readme.txt" file.
o Right crick "Amedas_precip_monthly2001.csv Events" and select
Data| Export data. Export=All features, Use the same coorinate
system as the data frame, and output file "Export_Output_2".
o Right crick "Export_Output_2"; choose properties. In Layer
Properties Menu, select "Annual" as "Value Field", and click on
"Add All Values" in the Symbology menu. Also choose "Annual"in Primary Display Field in "Field" menu.
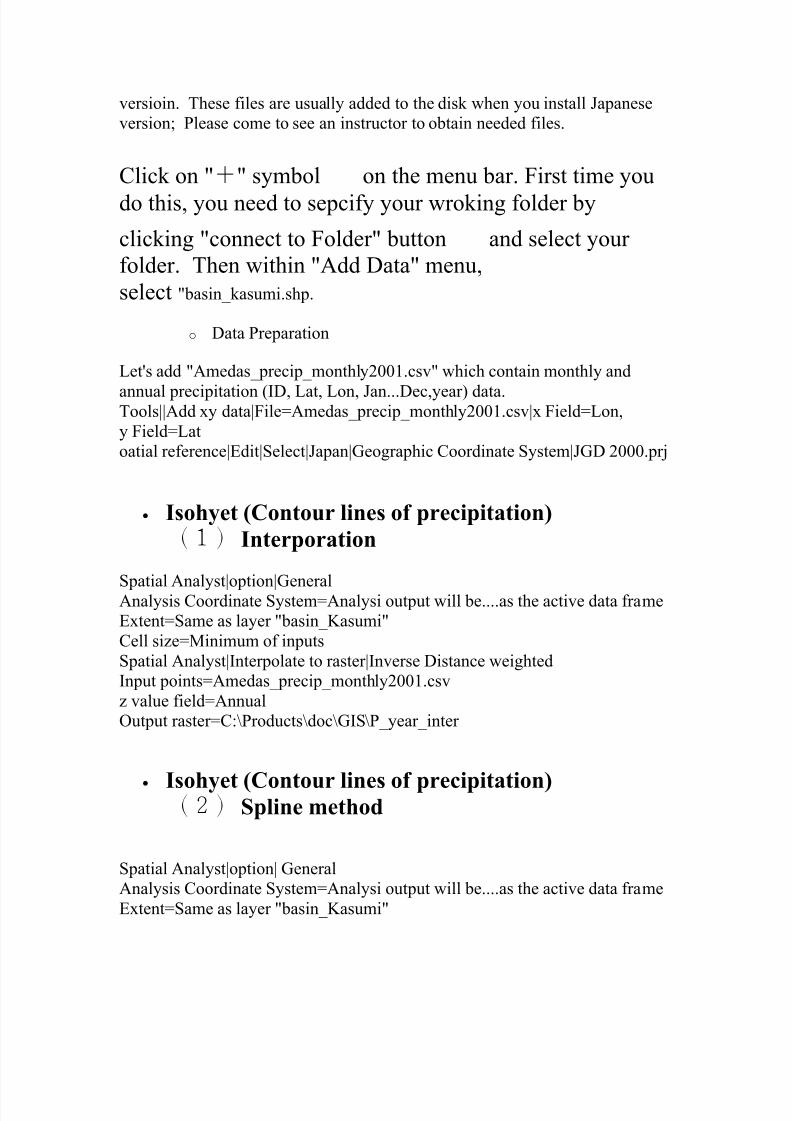
o Click on the Create Thiessen Polygons 3.0 icon . A Menu
should appear, and insert appropriate values. See below as an
8/7/2019 Hidrology Training
http://slidepdf.com/reader/full/hidrology-training 23/24
example.
o Start, and you wil see the polygons.
o Extraction of basin region
Spatial Analysis Tools|Extractt| Clip
Input=Thiessen.shp
Clip feature=basin_kasumi.shp
Output raster=thiessen_clip.shp
Determine the annual average precipitation of the Kasumigaura
watershed based on the above three methods.
• RADAR/AMeDas data

8/7/2019 Hidrology Training
http://slidepdf.com/reader/full/hidrology-training 24/24
• Add "p_year_spline"
o Tool| add xy data | File=radarP1-3A.csv (Total of Jan-
March),raderP4-12A.csv (total of April-Dec)
x field=Lon, y filed=LatCoorinate sytemJGD 2000.prj
Spatial Analyst|Analysis Coordinate System=Analysi output will be....as the
active data frame
Extent=same as layer p_year_spline
Cell size=Smallest of input data
Spatial Analyst| Interporate to raster | Spline
Input =raderP1-3A.csv event , raderP4-12A.csv
z field=P
Output raster=output:radarP4-12b,radarP1-3b
Raster Calculater to Derive total precipitation for Jan-Dec
Spatial Analyst| Raster calc| In layers, Click on Radar1-3b,+,radar4-12b in this
order.
Make sure that the resulting expressions is "[radar1-3b] + [radar4-12b]"
Click on "Evaluate"
Related Documents