China HR: the journey to Great! Nov 2014 Joe Chu 2014 Total Remuneration Survey Insights Sharing

HG Total Rem Post Survey Presentation - EN- Handout Version A
Aug 17, 2015
Welcome message from author
This document is posted to help you gain knowledge. Please leave a comment to let me know what you think about it! Share it to your friends and learn new things together.
Transcript

China HR: the journey to Great!
Nov 2014 Joe Chu
2014 Total Remuneration Survey Insights Sharing

3© 2014 Hay Group. All rights reserved
DAVE ULRICH: HR roles in building a competitive organization
Management of Strategic
Human Resources
Management of Transformation &
Change
Management of Firm Infrastructure
Management
Of Employee Contribution
FUTURE/STRATEGIC FOCUS
DAY-TO-DAY/
OPERATIONAL FOCUS
PROCESS PEOPLE
Sources: HR Champion
4© 2014 Hay Group. All rights reserved
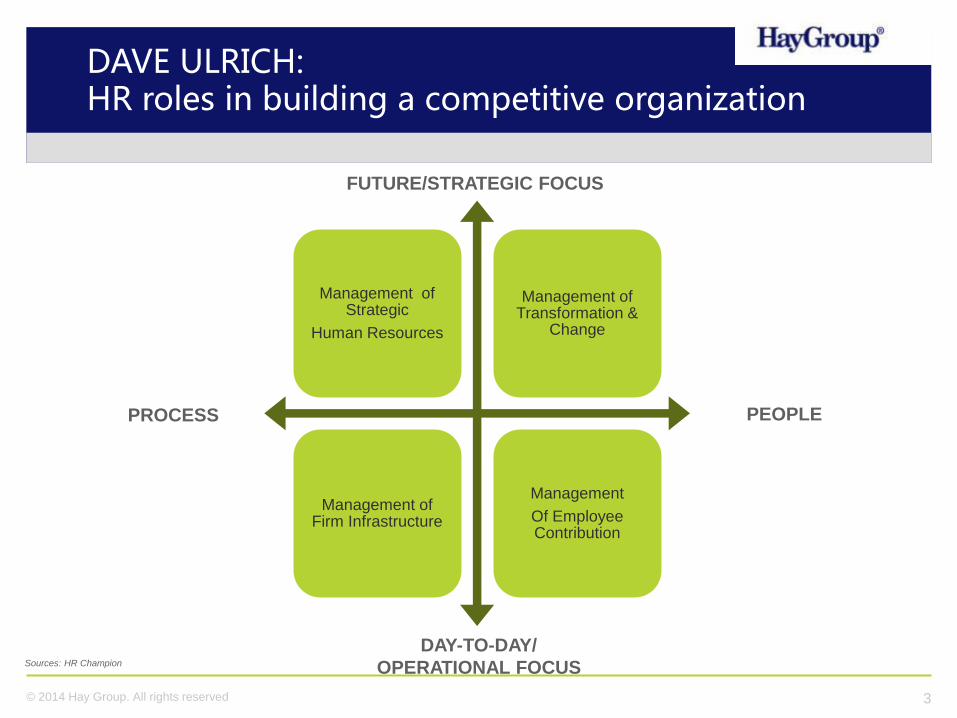
The future HR could be …
Activities to Outcome
Split
Human Resources Dept
Data driven
People Operations
Activities
to Outcome

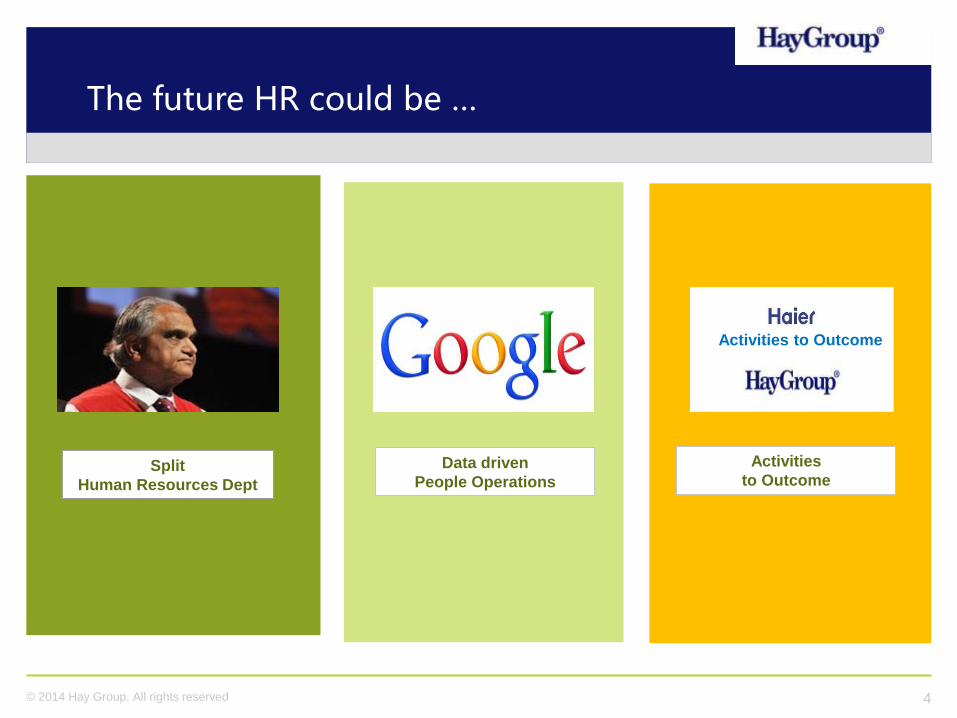
CHANGING Economy & Industries
CHANGING Talent Landscape in China
CHANGING Tech Reshapes HR
CHANGING Career Opportunities

China HR:
The journey to Great
In this Fast Changing World

Macro trends

9© 2014 Hay Group. All rights reserved
Sources: The Economist
2.3 2.5
7.7 7.3
2.2 2.2
-4.0
0.0
4.0
8.0
12.0
16.0
2007 2008 2009 2010 2011 2012 2013 2014 2015 2016 2017
Economic Growth
Average CHINA UNITED STATES
Global GDP growth comparison in advanced & emerging markets
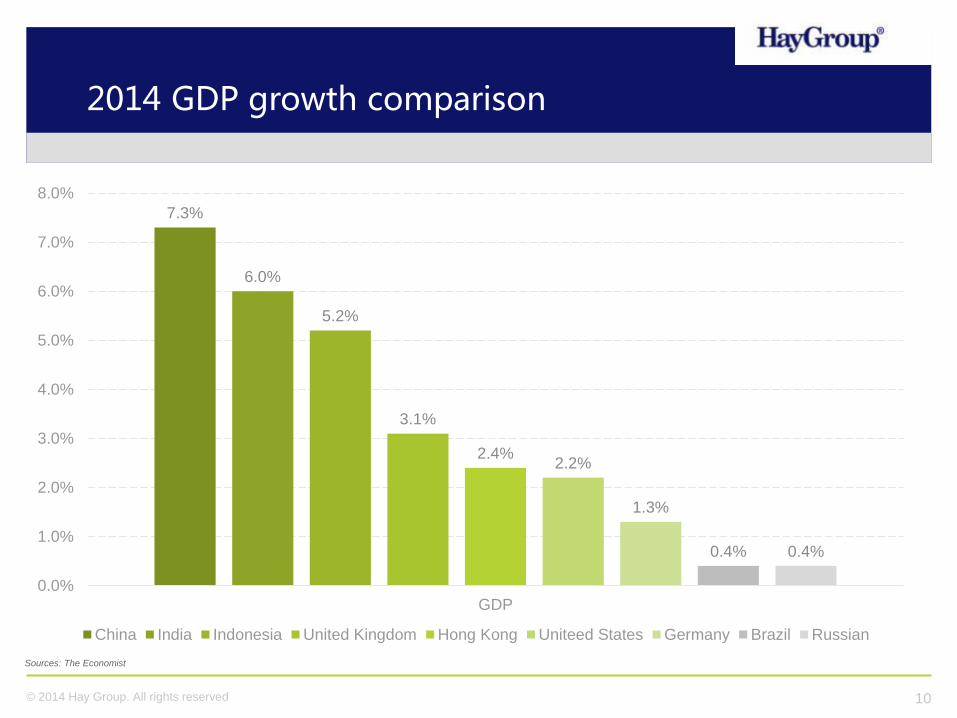
10© 2014 Hay Group. All rights reserved
Sources: The Economist
7.3%
6.0%
5.2%
3.1%
2.4%2.2%
1.3%
0.4% 0.4%
0.0%
1.0%
2.0%
3.0%
4.0%
5.0%
6.0%
7.0%
8.0%
GDP
China India Indonesia United Kingdom Hong Kong Uniteed States Germany Brazil Russian
2014 GDP growth comparison

11© 2014 Hay Group. All rights reserved
Culture drive transformation
Traditional Company Culture New Player Culture
Business = Battlefield Business = Ecosystem
Corporation = Machine Corporation = Community
Management = Control Management = Services
Employee = Child Employee = Peers & Partners
Change = Pain Change = Growth
Work = Toil Work = Play
12© 2014 Hay Group. All rights reserved
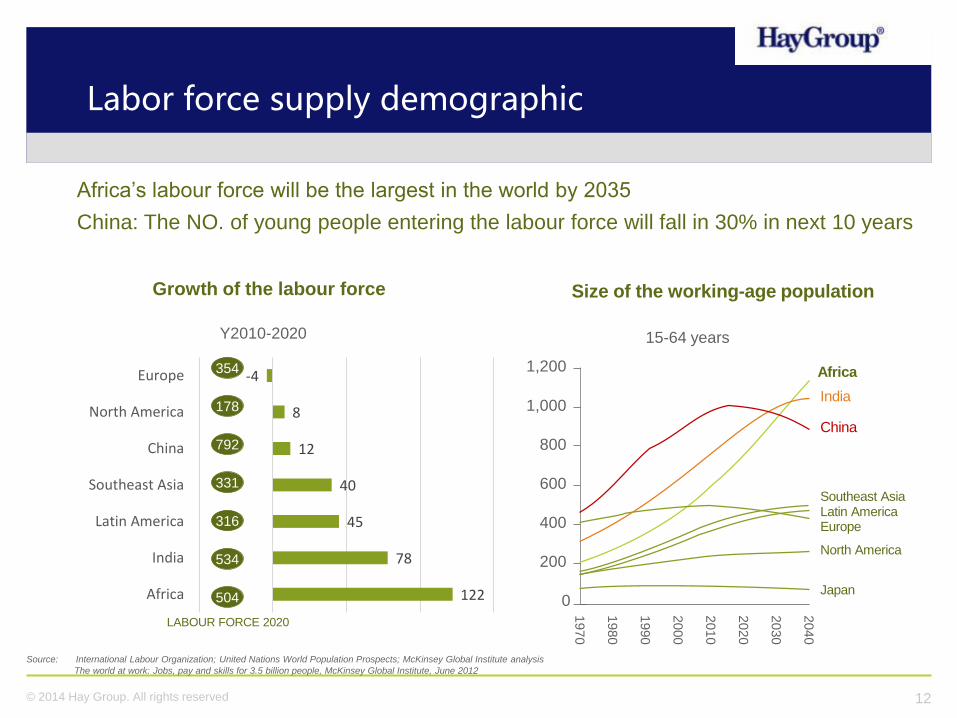
Africa’s labour force will be the largest in the world by 2035
China: The NO. of young people entering the labour force will fall in 30% in next 10 years
122
78
45
40
12
8
-4
Africa
India
Latin America
Southeast Asia
China
North America
Europe
Source: International Labour Organization; United Nations World Population Prospects; McKinsey Global Institute analysis
The world at work: Jobs, pay and skills for 3.5 billion people, McKinsey Global Institute, June 2012
Growth of the labour force
354
504
534
316
331
792
178
LABOUR FORCE 2020
Size of the working-age population
1970
1,000
800
600
400
200
0
2040
2000
2010
2020
2030
1980
1990
1,200
Southeast AsiaLatin AmericaEurope
North America
Japan
China
India
Africa
Y2010-2020 15-64 years
Labor force supply demographic
13© 2014 Hay Group. All rights reserved
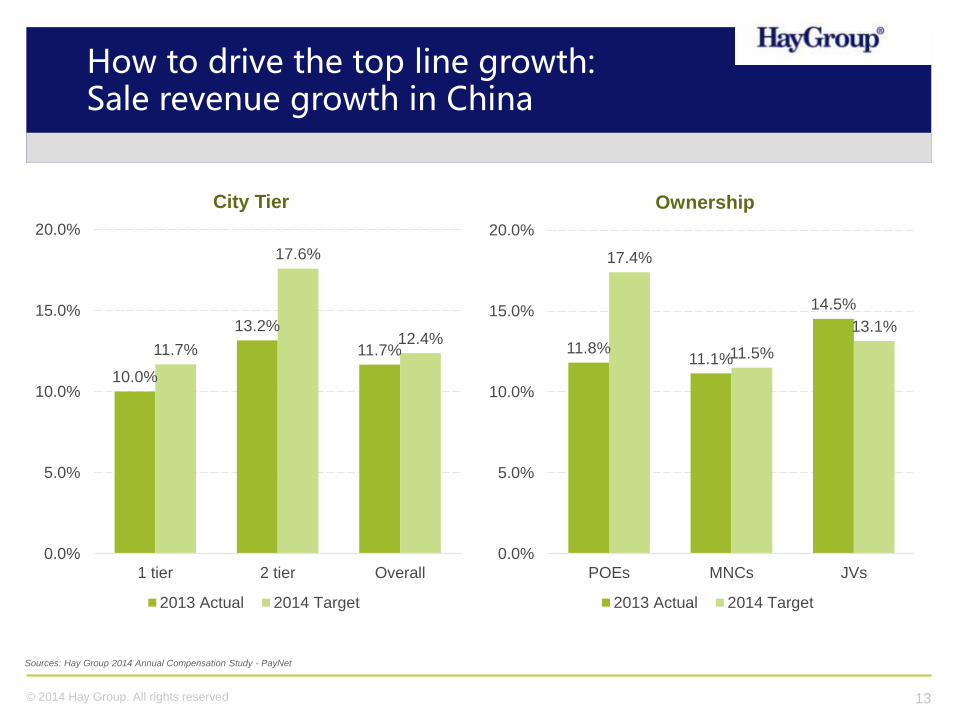
10.0%
13.2%
11.7%11.7%
17.6%
12.4%
0.0%
5.0%
10.0%
15.0%
20.0%
1 tier 2 tier Overall
City Tier
2013 Actual 2014 Target
11.8%11.1%
14.5%
17.4%
11.5%
13.1%
0.0%
5.0%
10.0%
15.0%
20.0%
POEs MNCs JVs
Ownership
2013 Actual 2014 Target
Sources: Hay Group 2014 Annual Compensation Study - PayNet
How to drive the top line growth:Sale revenue growth in China

Source Materials-> Source Market-> Source Talent
China will be not only a source of significant revenue growth for companies but also a source of talent, true innovation and ground-breaking approaches to business, which they will leverage on a global scale
15© 2014 Hay Group. All rights reserved
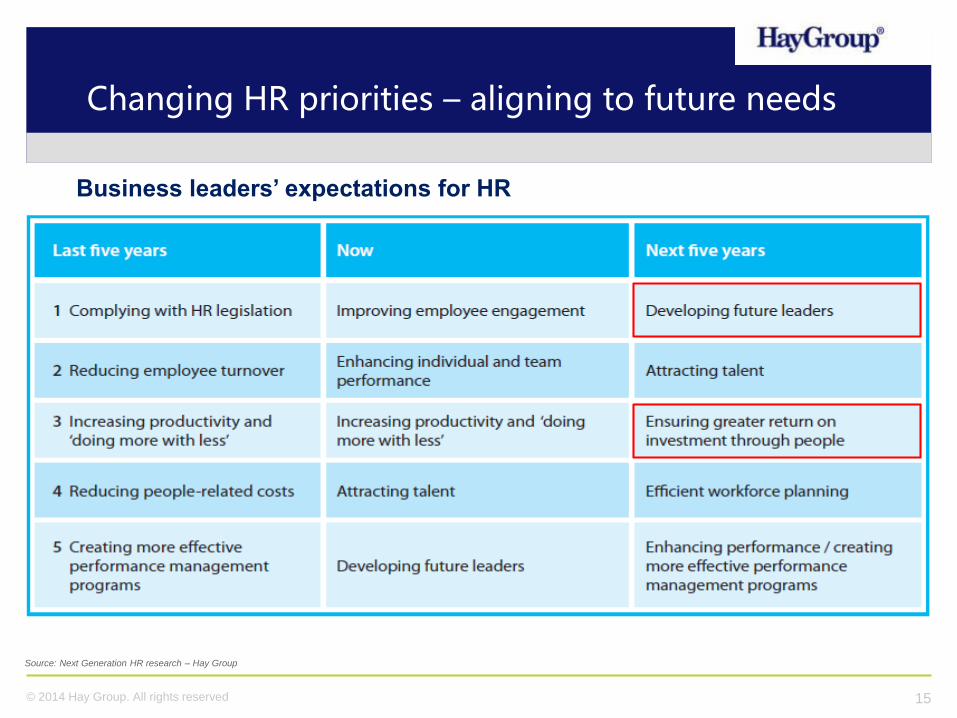
Business leaders’ expectations for HR
Source: Next Generation HR research – Hay Group
Changing HR priorities – aligning to future needs

Salary movementsand forecasts

17© 2014 Hay Group. All rights reserved
2014 pay forecasts painted a
picture of a two speed world:
High-speed
Fast growing or emerging
economies are set to receive
the highest pay rises, although
in most cases pay rises will be
lower than last year.
Low-speed
Mature markets are more likely
to experience minimal to
modest pay rises.
Global pay trends
Sources: Hay Group 2014 Annual Compensation Study - PayNet
18© 2014 Hay Group. All rights reserved
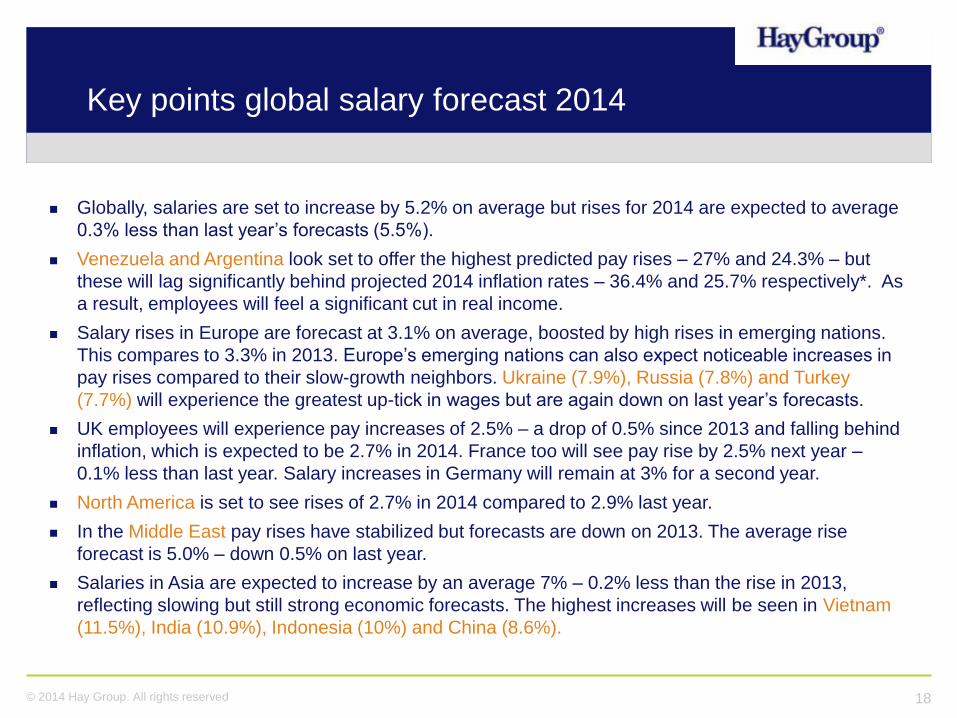
Globally, salaries are set to increase by 5.2% on average but rises for 2014 are expected to average
0.3% less than last year’s forecasts (5.5%).
Venezuela and Argentina look set to offer the highest predicted pay rises – 27% and 24.3% – but
these will lag significantly behind projected 2014 inflation rates – 36.4% and 25.7% respectively*. As
a result, employees will feel a significant cut in real income.
Salary rises in Europe are forecast at 3.1% on average, boosted by high rises in emerging nations.
This compares to 3.3% in 2013. Europe’s emerging nations can also expect noticeable increases in
pay rises compared to their slow-growth neighbors. Ukraine (7.9%), Russia (7.8%) and Turkey
(7.7%) will experience the greatest up-tick in wages but are again down on last year’s forecasts.
UK employees will experience pay increases of 2.5% – a drop of 0.5% since 2013 and falling behind
inflation, which is expected to be 2.7% in 2014. France too will see pay rise by 2.5% next year –
0.1% less than last year. Salary increases in Germany will remain at 3% for a second year.
North America is set to see rises of 2.7% in 2014 compared to 2.9% last year.
In the Middle East pay rises have stabilized but forecasts are down on 2013. The average rise
forecast is 5.0% – down 0.5% on last year.
Salaries in Asia are expected to increase by an average 7% – 0.2% less than the rise in 2013,
reflecting slowing but still strong economic forecasts. The highest increases will be seen in Vietnam
(11.5%), India (10.9%), Indonesia (10%) and China (8.6%).
Key points global salary forecast 2014

19© 2014 Hay Group. All rights reserved
Sources: Hay Group 2014 Annual Compensation Study - PayNet
7.0%
6.6%
8.1%9.0% 8.9% 9.2%
5.3%
6.9%
9.3% 9.4%8.4%
7.3% 7.1%
1.0%
3.9%
1.9% 1.8%
3.0% 2.8%
-0.7%
3.0%
5.3%
3.2%2.6% 2.3%
3.1%
6.0%
2.7%
6.2%7.2%
5.9%6.4% 6.0%
3.9% 4.0%
6.2% 5.8%5.0%
4.0%
-2.0%
0.0%
2.0%
4.0%
6.0%
8.0%
10.0%
2003 2004 2005 2006 2007 2008 2009 2010 2011 2012 2013 2014 2015
Salary Increase Trends
Average Base Salary Movement CPI* Real Wage Inflation
China: Salary increase trends in past 12 years
20© 2014 Hay Group. All rights reserved
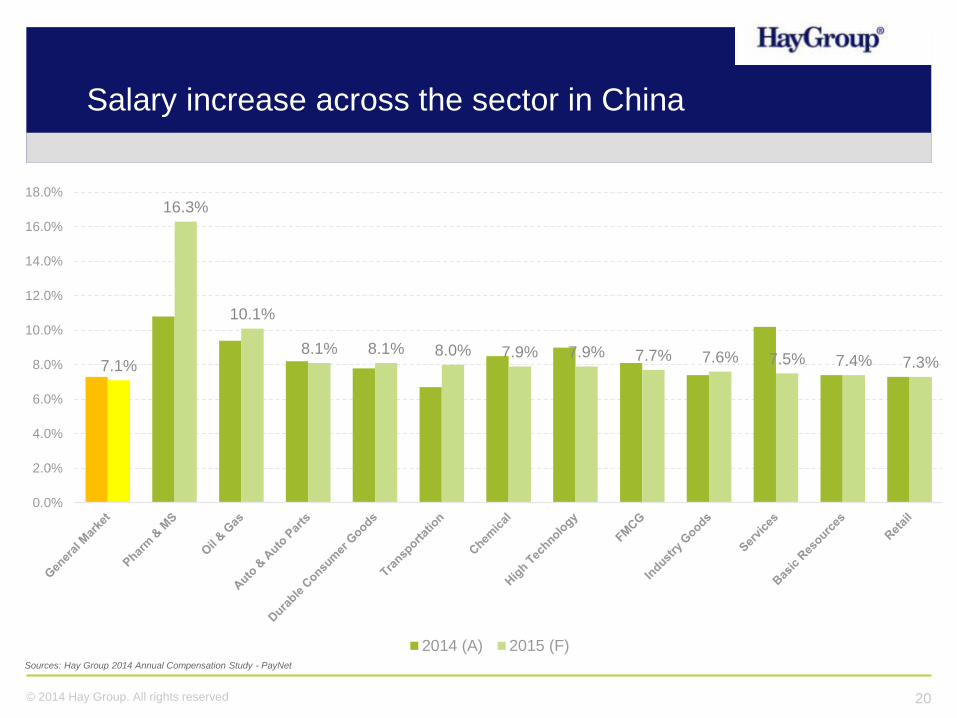
7.1%
16.3%
10.1%
8.1% 8.1% 8.0% 7.9% 7.9% 7.7% 7.6% 7.5% 7.4% 7.3%
0.0%
2.0%
4.0%
6.0%
8.0%
10.0%
12.0%
14.0%
16.0%
18.0%
2014 (A) 2015 (F)Sources: Hay Group 2014 Annual Compensation Study - PayNet
Salary increase across the sector in China

21© 2014 Hay Group. All rights reserved
1,820
1,480 1,470 1,480 1,480 1,470 1,560
1,680
1,250 1,300
1,808
1,550 26%
12% 12% 12%
8%
12%
24%
28%
19%18%
21%
5%
0%
5%
10%
15%
20%
25%
30%
0
200
400
600
800
1,000
1,200
1,400
1,600
1,800
2,000
Shanghai Nanjing Ningbo Wuxi Suzhou Hangzhou Beijing Tianjin Chongqing Wuhan Shenzhen Guangzhou
2012 2013 2014 Increase Rate 2014/ 2012
Sources: Social Security Bureau
Minimum wage increase in China major cities
22© 2014 Hay Group. All rights reserved
Sources: Hay Group 2014 Annual Compensation Study - PayNet
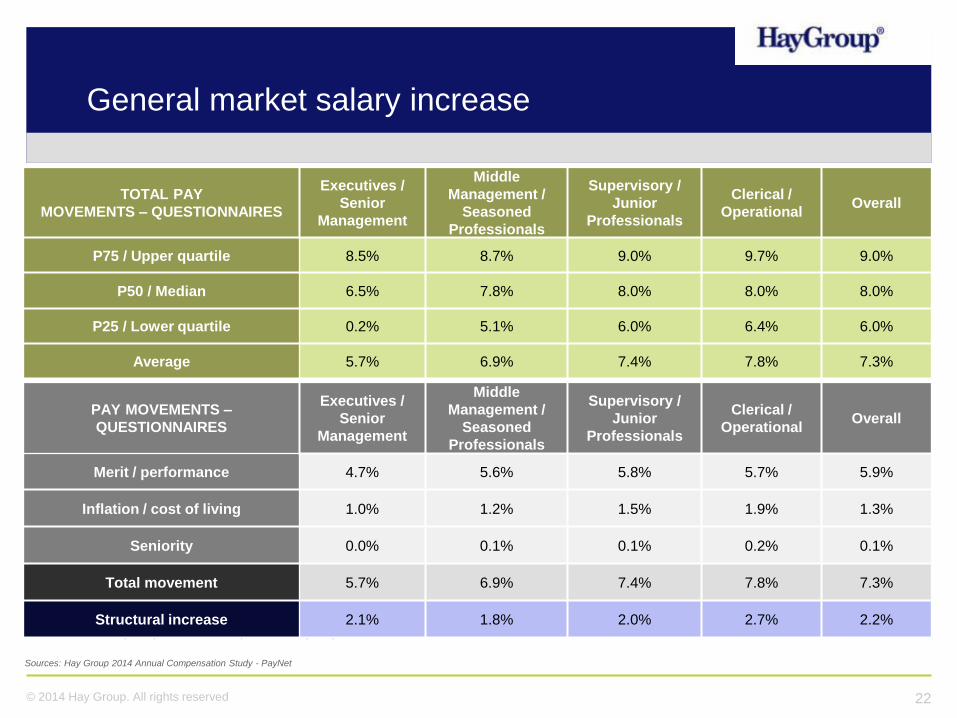
TOTAL PAY
MOVEMENTS – QUESTIONNAIRES
Executives /
Senior
Management
Middle
Management /
Seasoned
Professionals
Supervisory /
Junior
Professionals
Clerical /
OperationalOverall
P75 / Upper quartile 8.5% 8.7% 9.0% 9.7% 9.0%
P50 / Median 6.5% 7.8% 8.0% 8.0% 8.0%
P25 / Lower quartile 0.2% 5.1% 6.0% 6.4% 6.0%
Average 5.7% 6.9% 7.4% 7.8% 7.3%
PAY MOVEMENTS –
QUESTIONNAIRES
Executives /
Senior
Management
Middle
Management /
Seasoned
Professionals
Supervisory /
Junior
Professionals
Clerical /
OperationalOverall
Merit / performance 4.7% 5.6% 5.8% 5.7% 5.9%
Inflation / cost of living 1.0% 1.2% 1.5% 1.9% 1.3%
Seniority 0.0% 0.1% 0.1% 0.2% 0.1%
Total movement 5.7% 6.9% 7.4% 7.8% 7.3%
Structural increase 2.1% 1.8% 2.0% 2.7% 2.2%
Sources: Hay Group 2014 Annual Compensation Study - PayNet
General market salary increase
Salary differentials
Base salary inequity rate was calculated as
base salary level 20 (managerial) base salary level 10 (operations)
25© 2014 Hay Group. All rights reserved
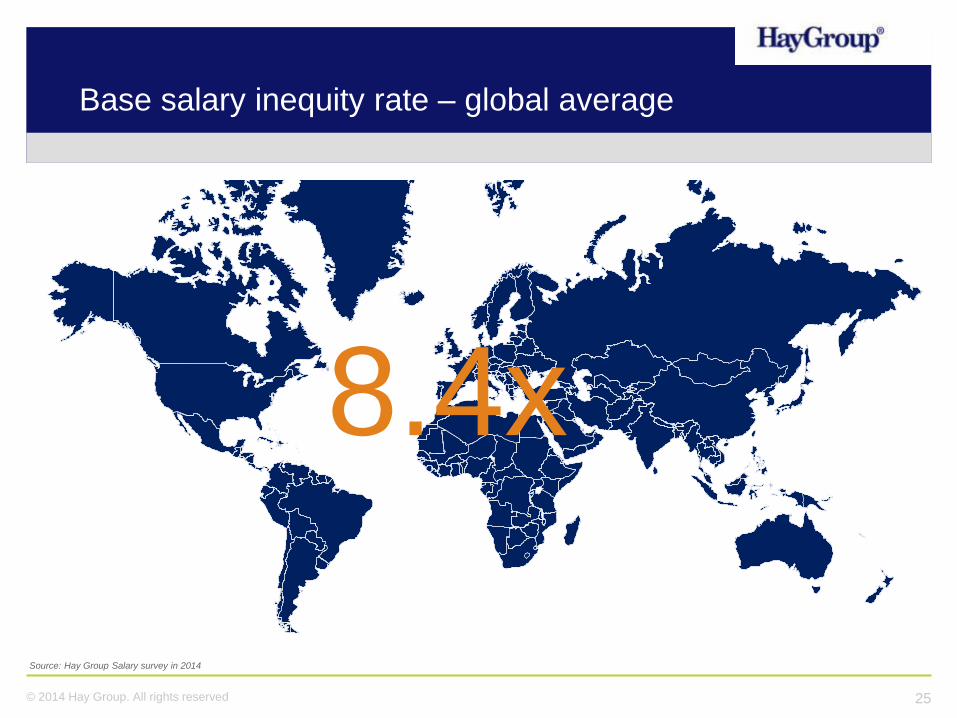
Base salary inequity rate – global average
8.4x
Source: Hay Group Salary survey in 2014
26© 2014 Hay Group. All rights reserved
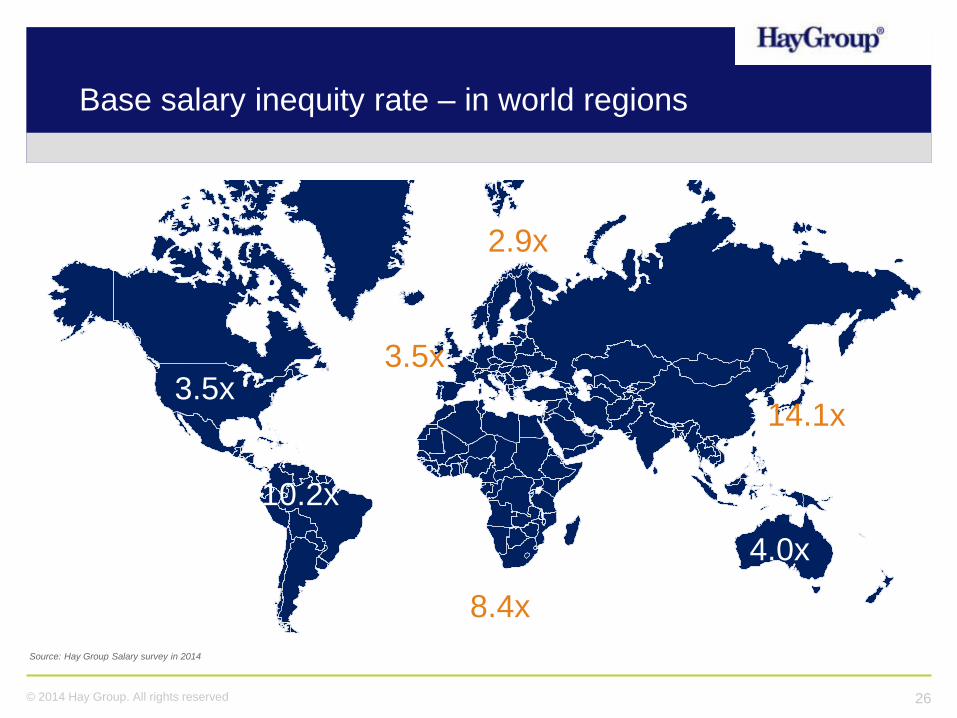
Base salary inequity rate – in world regions
2.9x
3.5x
14.1x
4.0x
8.4x
10.2x
3.5x
Source: Hay Group Salary survey in 2014
27© 2014 Hay Group. All rights reserved
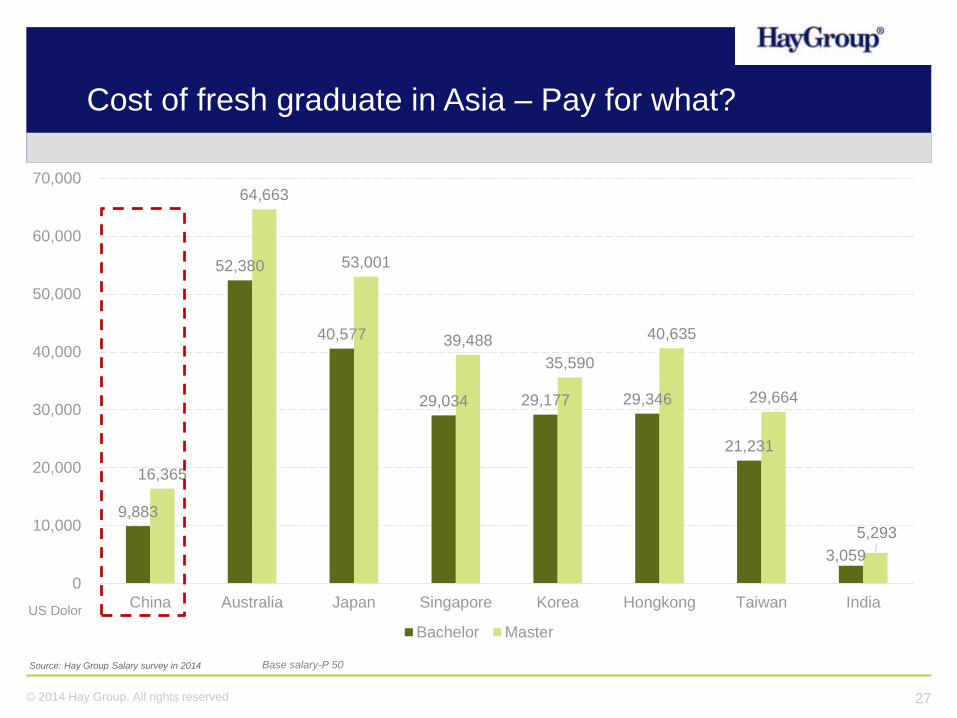
Source: Hay Group Salary survey in 2014
9,883
52,380
40,577
29,034 29,177 29,346
21,231
3,059
16,365
64,663
53,001
39,488
35,590
40,635
29,664
5,293
0
10,000
20,000
30,000
40,000
50,000
60,000
70,000
China Australia Japan Singapore Korea Hongkong Taiwan India
Bachelor Master
Base salary-P 50
Cost of fresh graduate in Asia – Pay for what?
US Dolor
28© 2014 Hay Group. All rights reserved
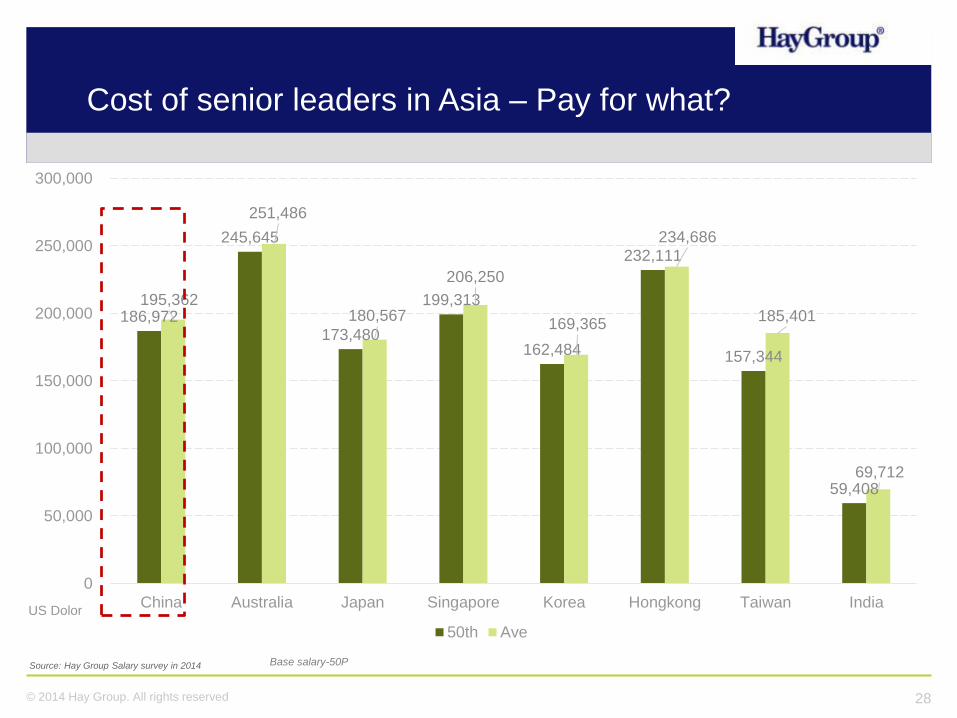
186,972
245,645
173,480
199,313
162,484
232,111
157,344
59,408
195,362
251,486
180,567
206,250
169,365
234,686
185,401
69,712
0
50,000
100,000
150,000
200,000
250,000
300,000
China Australia Japan Singapore Korea Hongkong Taiwan India
50th Ave
Source: Hay Group Salary survey in 2014 Base salary-50P
Cost of senior leaders in Asia – Pay for what?
US Dolor
29© 2014 Hay Group. All rights reserved
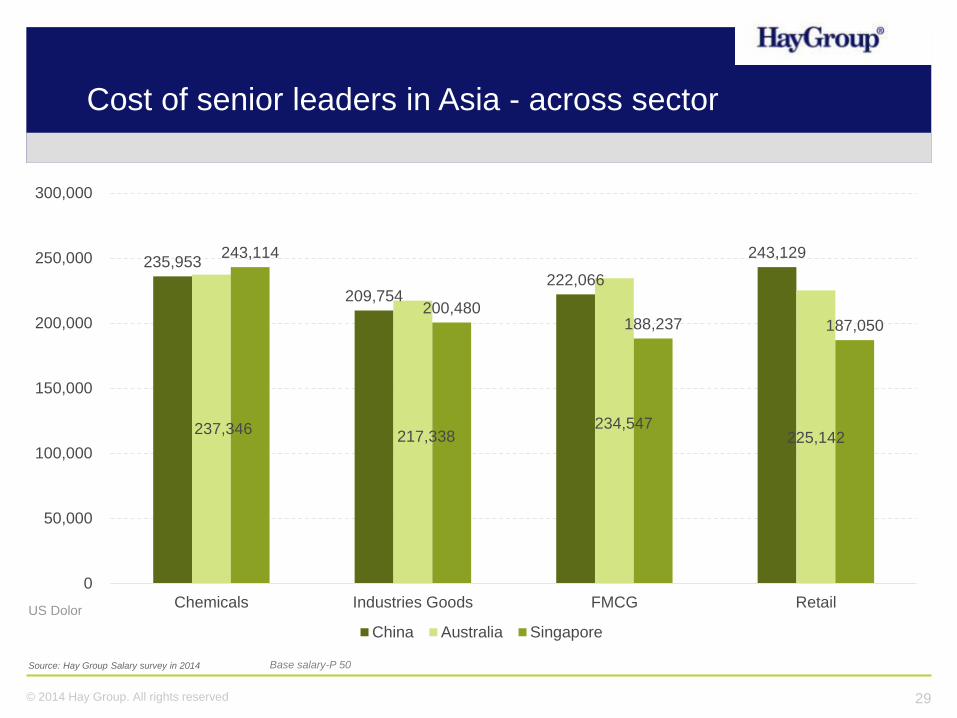
Source: Hay Group Salary survey in 2014 Base salary-P 50
235,953
209,754 222,066
243,129
237,346 217,338
234,547 225,142
243,114
200,480 188,237 187,050
0
50,000
100,000
150,000
200,000
250,000
300,000
Chemicals Industries Goods FMCG Retail
China Australia Singapore
Cost of senior leaders in Asia - across sector
US Dolor

30© 2014 Hay Group. All rights reserved
Sources: Hay Group 2014 Annual Compensation Study - PayNet
Country Executive Entry Level
Germany 1.09 5.23
Australia 1.31 4.86
Japan 0.93 3.94
United Kingdom 0.95 3.77
Italy 1.01 3.68
United States of America 1 3.45
Hong Kong 1.24 2.77
Singapore 1.07 2.76
Korea 0.87 2.72
China 1 1
Indonesia 0.41 0.45
India 0.32 0.32
Comparison Between different countries by ENTERY LEVEL and EXECUTIVE

31© 2014 Hay Group. All rights reserved
Country HRL11 HRL24 Gap
Japan 294,267 1,666,231 6
Korea 161,102 1,434,017 9
Australia 342,367 3,547,302 10
Singapore 193,654 2,367,842 12
Hongkong 200,370 4,907,575 24
China- Tier 1 60,275 1,507,053 25
India 35,389 1,380,900 39
Source: Hay Group Salary survey in 2014
Pay difference: senior level vs entry level
32© 2014 Hay Group. All rights reserved
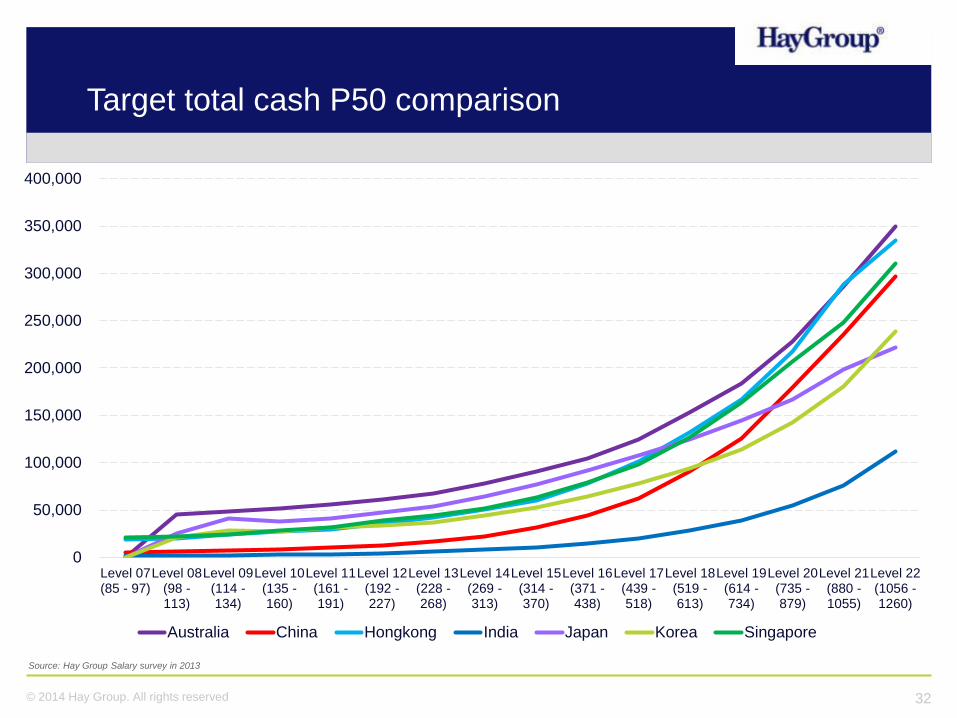
Source: Hay Group Salary survey in 2013
0
50,000
100,000
150,000
200,000
250,000
300,000
350,000
400,000
Level 07(85 - 97)
Level 08(98 -113)
Level 09(114 -134)
Level 10(135 -160)
Level 11(161 -191)
Level 12(192 -227)
Level 13(228 -268)
Level 14(269 -313)
Level 15(314 -370)
Level 16(371 -438)
Level 17(439 -518)
Level 18(519 -613)
Level 19(614 -734)
Level 20(735 -879)
Level 21(880 -1055)
Level 22(1056 -1260)
Australia China Hongkong India Japan Korea Singapore
Target total cash P50 comparison

33© 2014 Hay Group. All rights reserved
Sources: Hay Group 2014 Annual Compensation Study - PayNet
Province City Pay Aggregates Clerical Jr. Prof. Mid. Mgmt. Sr. Mgmt. Overall
Shanghai ShanghaiActual
Base Salary 100% 100% 100% 100% 100%
Total Cash 100% 100% 100% 100% 100%
Policy Total Cash at Target 100% 100% 100% 100% 100%
Beijing BeijingActual
Base Salary 100% 103% 96% 85% 96%
Total Cash 102% 104% 97% 81% 96%
Policy Total Cash at Target 100% 100% 100% 100% 100%
Chongqing ChongqingActual
Base Salary 68% 66% 74% 73% 70%
Total Cash 77% 73% 77% 89% 79%
Policy Total Cash at Target 82% 81% 83% 85% 83%
Jiangsu
NanjingActual
Base Salary 74% 67% 71% 62% 68%
Total Cash 81% 74% 73% 65% 73%
Policy Total Cash at Target 87% 86% 88% 89% 88%
SuzhouActual
Base Salary 70% 68% 77% 53% 67%
Total Cash 76% 73% 77% 56% 70%
Policy Total Cash at Target 85% 85% 86% 87% 86%
WuxiActual
Base Salary 65% 62% 65% - 64%
Total Cash 75% 68% 67% - 70%
Policy Total Cash at Target 80% 80% 81% 82% 81%
China city index
34© 2014 Hay Group. All rights reserved
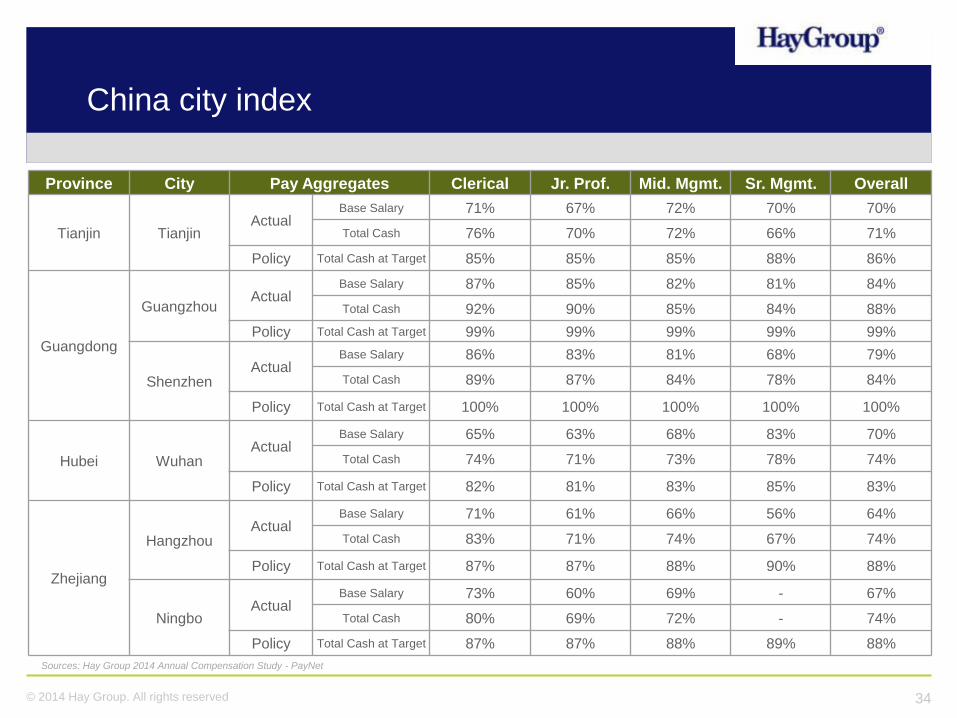
Sources: Hay Group 2014 Annual Compensation Study - PayNet
Province City Pay Aggregates Clerical Jr. Prof. Mid. Mgmt. Sr. Mgmt. Overall
Tianjin TianjinActual
Base Salary 71% 67% 72% 70% 70%
Total Cash 76% 70% 72% 66% 71%
Policy Total Cash at Target 85% 85% 85% 88% 86%
Guangdong
GuangzhouActual
Base Salary 87% 85% 82% 81% 84%
Total Cash 92% 90% 85% 84% 88%
Policy Total Cash at Target 99% 99% 99% 99% 99%
ShenzhenActual
Base Salary 86% 83% 81% 68% 79%
Total Cash 89% 87% 84% 78% 84%
Policy Total Cash at Target 100% 100% 100% 100% 100%
Hubei WuhanActual
Base Salary 65% 63% 68% 83% 70%
Total Cash 74% 71% 73% 78% 74%
Policy Total Cash at Target 82% 81% 83% 85% 83%
Zhejiang
HangzhouActual
Base Salary 71% 61% 66% 56% 64%
Total Cash 83% 71% 74% 67% 74%
Policy Total Cash at Target 87% 87% 88% 90% 88%
NingboActual
Base Salary 73% 60% 69% - 67%
Total Cash 80% 69% 72% - 74%
Policy Total Cash at Target 87% 87% 88% 89% 88%
China city index

35© 2014 Hay Group. All rights reserved
Why is pay so different around the world?
Supply and demand
An economy is either a buyer’s or a seller’s market. In developed markets, economic conditions, such as low inflation
and unemployment, make it a buyer’s (employer’s) market, with little pressure or opportunity to raise salaries. In fast-
growing economies, talent shortages and inflation make it a seller’s market, in which employees can negotiate – or
simply expect – larger increases.
Globalization
Our research shows that when it comes to setting executive pay, an increasingly global labor market has helped close
the gap between fast-growing and mature markets. In China, for example, management pay was 32 percent of the US
level in 2001; by 2011, this figure had risen to 80 percent. At lower levels, though, pay is still decided by the cost of
living and other economic conditions in that country – explaining the huge differences around the globe.
The Financial Crisis
The speed at which economies have recovered from recession depends on their starting point in 2008. For the
economies enjoying substantial growth, a slowdown wasn’t an automatic disaster. But for mature economies, losing 3
percent from GDP growth was enough to tip many into recession, and some of those countries are still feeling the
effects in terms of high unemployment, which is affecting pay increases.
Demographic and structural changes
Underlying all these factors are some basic facts about the way in which we live around the world. Developed
economies tend to have ageing populations, lower birth rates and strained welfare states, while fast-growing
economies are benefiting from an injection of young, rural labor into the workforce – and still have room to grow.
(Though not all of those new workers have the skills to operate in a global market, creating talent shortages.) Even
without factors 1 to 3, these differences alone would keep fast-growing economies ahead of the game.
36© 2014 Hay Group. All rights reserved
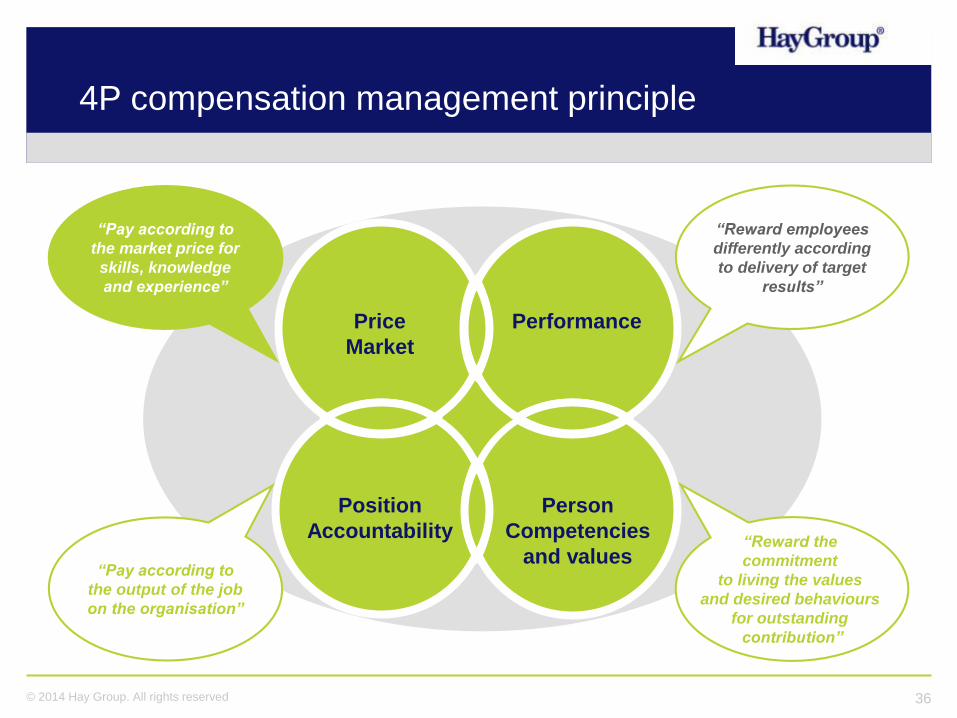
4P compensation management principle
Position
Accountability
Price
Market
Person
Competencies
and values
Performance
“Reward employees
differently according
to delivery of target
results”
“Reward the
commitment
to living the values
and desired behaviours
for outstanding
contribution”
“Pay according to
the output of the job
on the organisation”
“Pay according to
the market price for
skills, knowledge
and experience”
37© 2014 Hay Group. All rights reserved
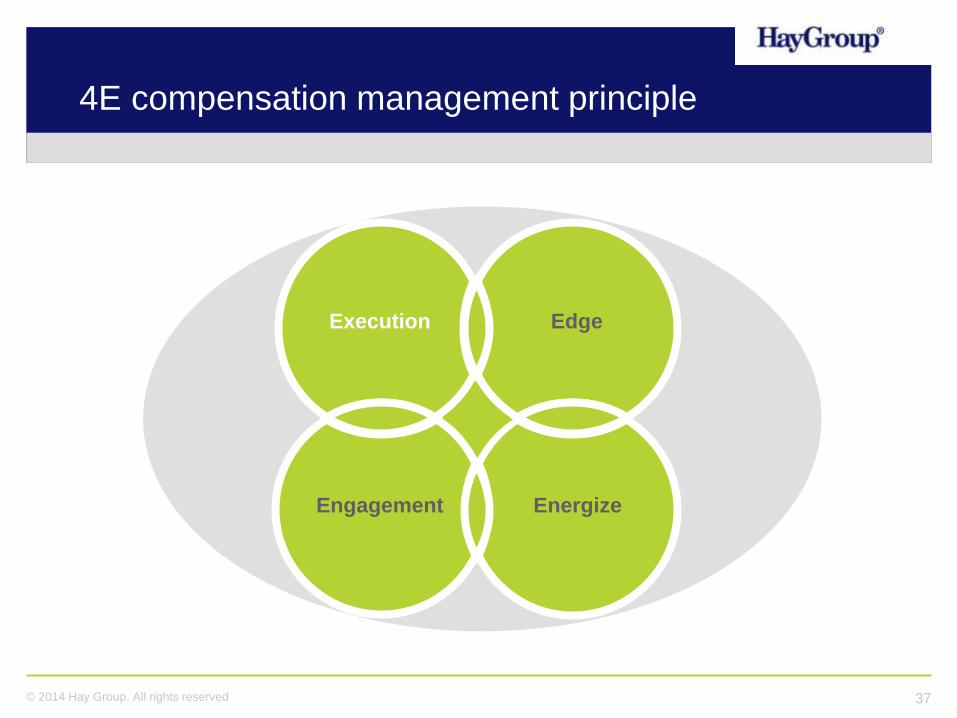
4E compensation management principle
Engagement
Execution
Energize
Edge
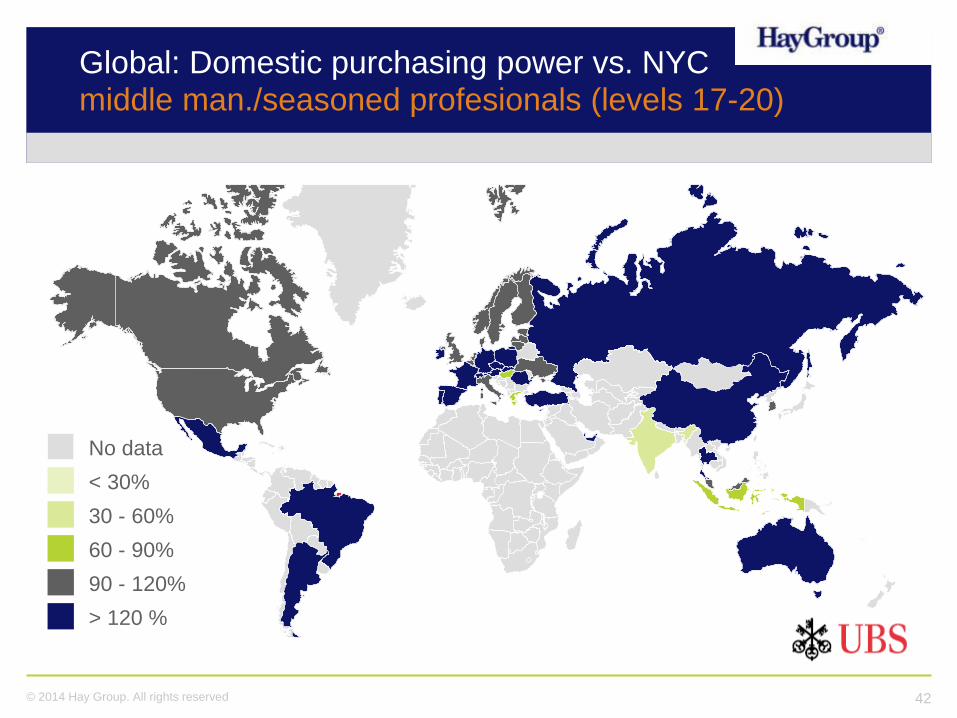
International comparison
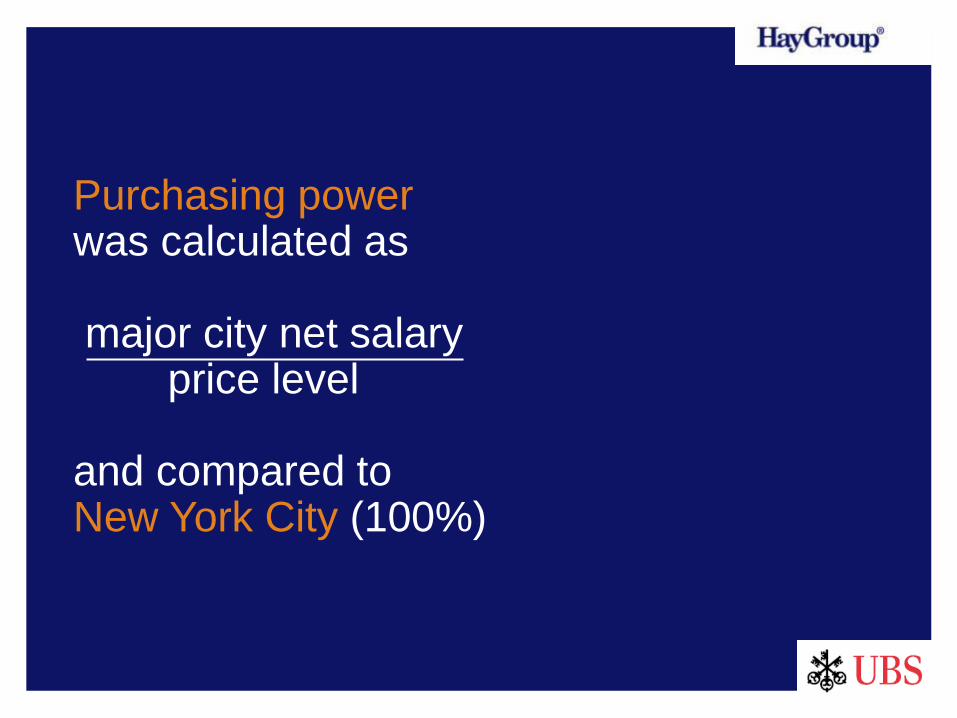
Purchasing power was calculated as
major city net salary price level
and compared to New York City (100%)

40© 2014 Hay Group. All rights reserved
Global: Domestic purchasing power vs. NYCclerical/operations (reference levels 4-11)
< 30%
30 - 60%
60 - 90%
90 - 120%
> 120 %
No data

41© 2014 Hay Group. All rights reserved
Global: Domestic purchasing power vs. NYC supervisory/junior professional (levels 12-16)
< 30%
30 - 60%
60 - 90%
90 - 120%
> 120 %
No data
42© 2014 Hay Group. All rights reserved
Global: Domestic purchasing power vs. NYC middle man./seasoned profesionals (levels 17-20)
< 30%
30 - 60%
60 - 90%
90 - 120%
> 120 %
No data

43© 2014 Hay Group. All rights reserved
Global: Domestic purchasing power vs. NYC senior man./executives (levels 21 and above)
< 30%
30 - 60%
60 - 90%
90 - 120%
> 120 %
No data

44© 2014 Hay Group. All rights reserved
Unit: Dollar
ABC’s VP is in Level 25; SVP in Level 26
Hay
Reference
Level
Base PayTarget Total Cash
=base pay + annual bonus
Target Direct Compensation
=base pay + annual bonus + stock incentive
P50 P90 P50 P90 P50 P90
31 700,215 1,190,366 1,906,931 3,241,782 6,569,390 11,167,962
30 622,278 1,057,873 1,513,909 2,573,645 4,916,126 8,357,415
29 553,016 940,128 1,201,890 2,043,212 3,678,926 6,254,175
28 491,464 835,488 954,178 1,622,103 2,753,082 4,680,239
27 436,762 742,495 757,520 1,287,784 2,060,237 3,502,403
26 388,148 659,852 601,394 1,022,370 1,541,754 2,620,982
25 344,946 586,408 477,446 811,658 1,153,754 1,961,382
24 306,552 521,139 379,043 644,373 863,398 1,467,777
• China 2014 Executive Salary Increase Rate: 7.1%
• China 2015 Executive Salary Increase Rate ( budget): 7.0%
A China Internet Companies’ Executive Compensation - CXO or VP Benchmark
45© 2014 Hay Group. All rights reserved
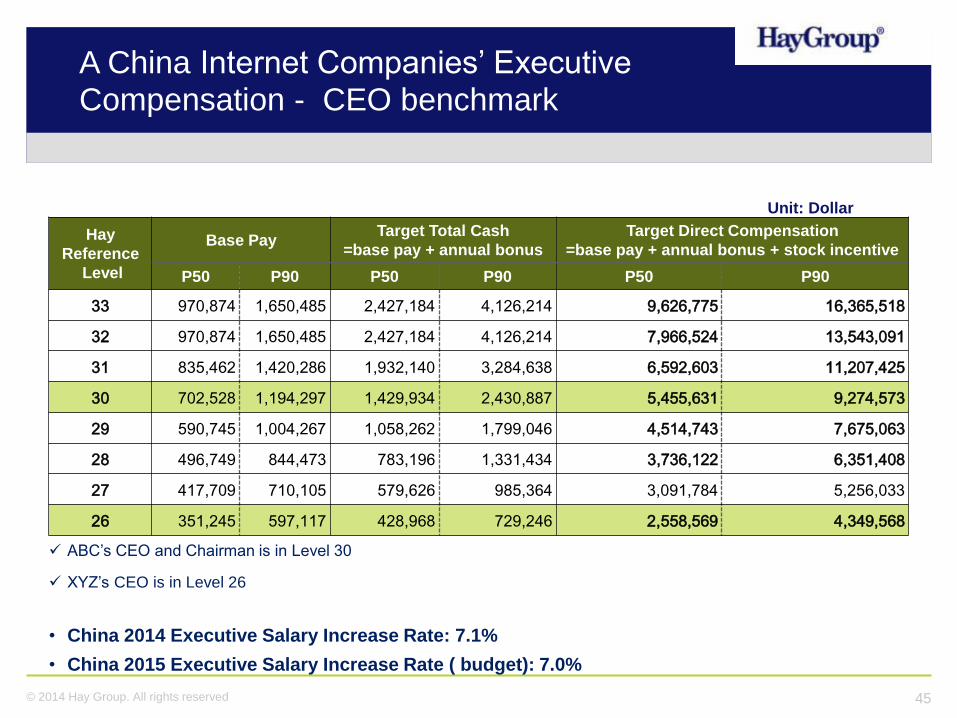
A China Internet Companies’ Executive Compensation - CEO benchmark
Hay
Reference
Level
Base PayTarget Total Cash
=base pay + annual bonus
Target Direct Compensation
=base pay + annual bonus + stock incentive
P50 P90 P50 P90 P50 P90
33 970,874 1,650,485 2,427,184 4,126,214 9,626,775 16,365,518
32 970,874 1,650,485 2,427,184 4,126,214 7,966,524 13,543,091
31 835,462 1,420,286 1,932,140 3,284,638 6,592,603 11,207,425
30 702,528 1,194,297 1,429,934 2,430,887 5,455,631 9,274,573
29 590,745 1,004,267 1,058,262 1,799,046 4,514,743 7,675,063
28 496,749 844,473 783,196 1,331,434 3,736,122 6,351,408
27 417,709 710,105 579,626 985,364 3,091,784 5,256,033
26 351,245 597,117 428,968 729,246 2,558,569 4,349,568
• China 2014 Executive Salary Increase Rate: 7.1%
• China 2015 Executive Salary Increase Rate ( budget): 7.0%
ABC’s CEO and Chairman is in Level 30
XYZ’s CEO is in Level 26
Unit: Dollar

46© 2014 Hay Group. All rights reserved
Sources: Hay Group 2014 Annual Compensation Study - PayNet
1-Jul-14 Employee Level
IndustryClerical / Supervisor / Mid Management / Senior Management /
Operations Jr. Professional Seasoned Professional Executive
Chemicals 116.0% 113.0% 116.0% 128.0%
Retail 100.0% 101.0% 126.0% 122.0%
Natural Resources 102.0% 88.0% 105.0% 117.0%
Industrial Goods 98.0% 98.0% 97.0% 110.0%
Fast Moving Consumer
Goods87.0% 86.0% 102.0% 103.0%
General 100.0% 100.0% 100.0% 100.0%
High Technology 96.0% 96.0% 83.0% 86.0%
Construction & Materials 95.0% 86.0% 80.0% 83.0%
Insurances 96.0% 96.0% 79.0% 61.0%
Oil & Gas 74.0% 99.0% 114.0% n/a
Services 107.0% 114.0% 109.0% n/a
Transportation 109.0% 95.0% 89.0% n/a
China: Salary cost index by industry
47© 2014 Hay Group. All rights reserved
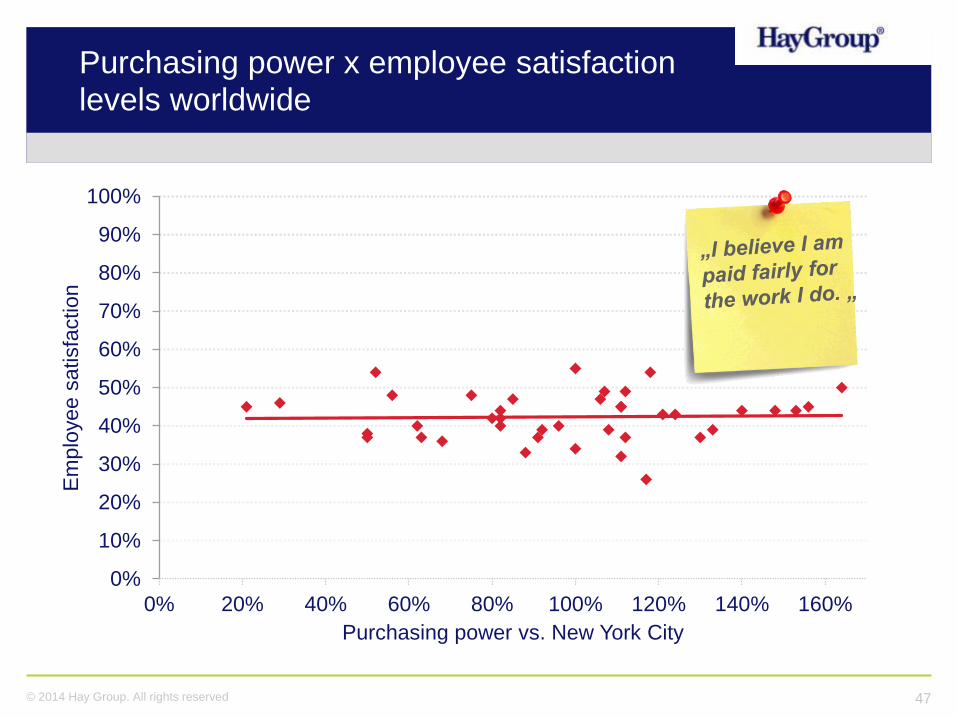
Purchasing power x employee satisfaction levels worldwide
0%
10%
20%
30%
40%
50%
60%
70%
80%
90%
100%
0% 20% 40% 60% 80% 100% 120% 140% 160%
Em
plo
yee s
atisfa
ction
Purchasing power vs. New York City
48© 2014 Hay Group. All rights reserved
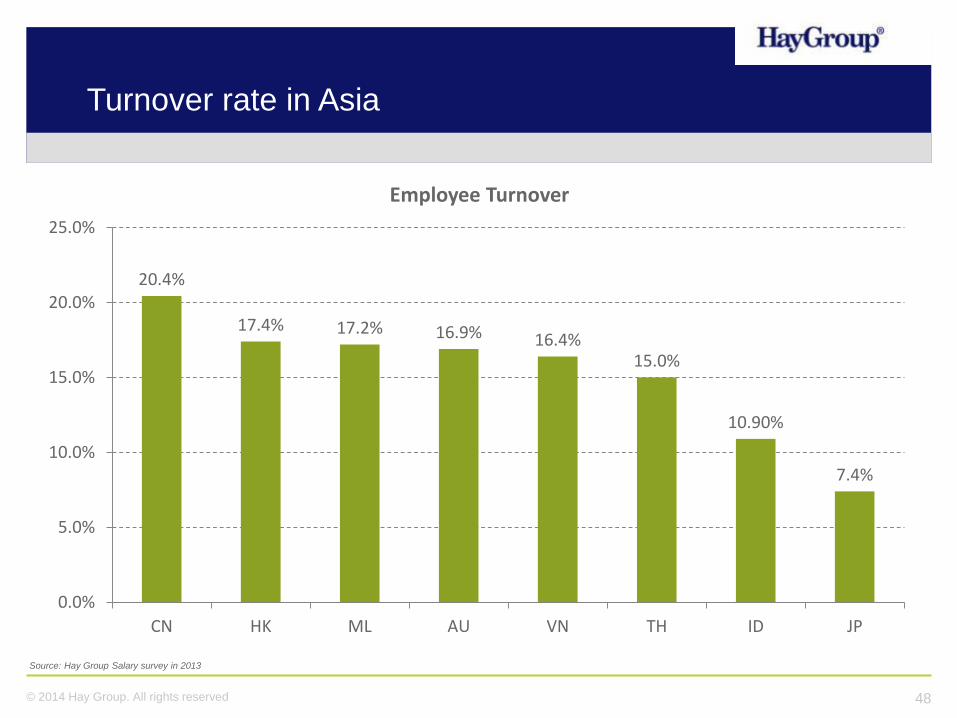
20.4%
17.4% 17.2% 16.9% 16.4%15.0%
10.90%
7.4%
0.0%
5.0%
10.0%
15.0%
20.0%
25.0%
CN HK ML AU VN TH ID JP
Employee Turnover
Source: Hay Group Salary survey in 2013
Turnover rate in Asia
49© 2014 Hay Group. All rights reserved
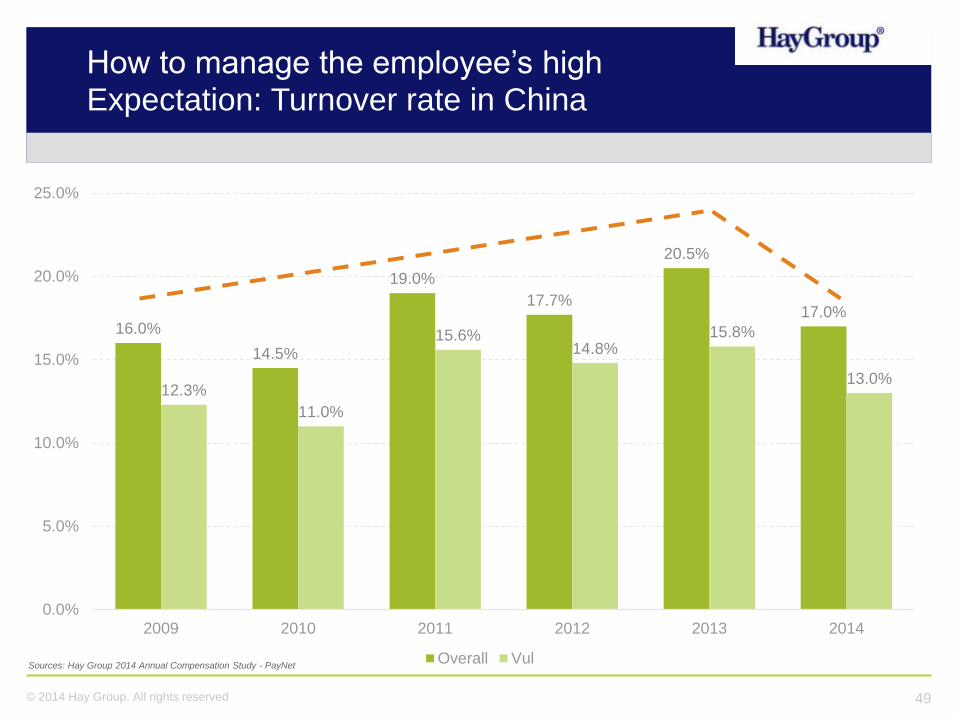
16.0%
14.5%
19.0%
17.7%
20.5%
17.0%
12.3%
11.0%
15.6%14.8%
15.8%
13.0%
0.0%
5.0%
10.0%
15.0%
20.0%
25.0%
2009 2010 2011 2012 2013 2014
Overall VulSources: Hay Group 2014 Annual Compensation Study - PayNet
How to manage the employee’s high Expectation: Turnover rate in China
50© 2014 Hay Group. All rights reserved
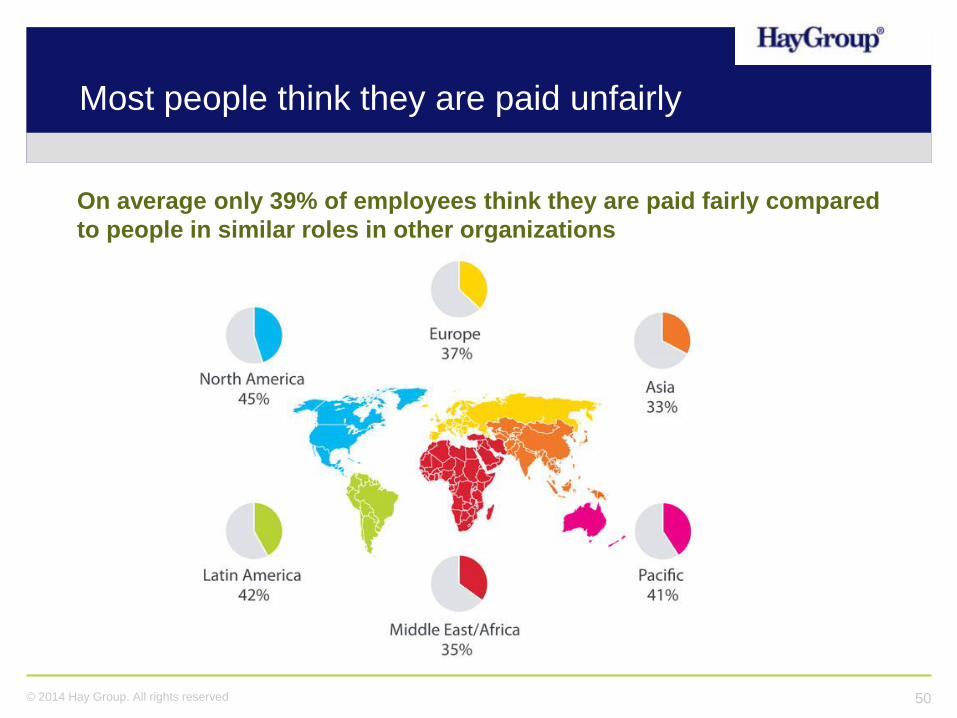
Most people think they are paid unfairly
On average only 39% of employees think they are paid fairly compared
to people in similar roles in other organizations
51© 2014 Hay Group. All rights reserved
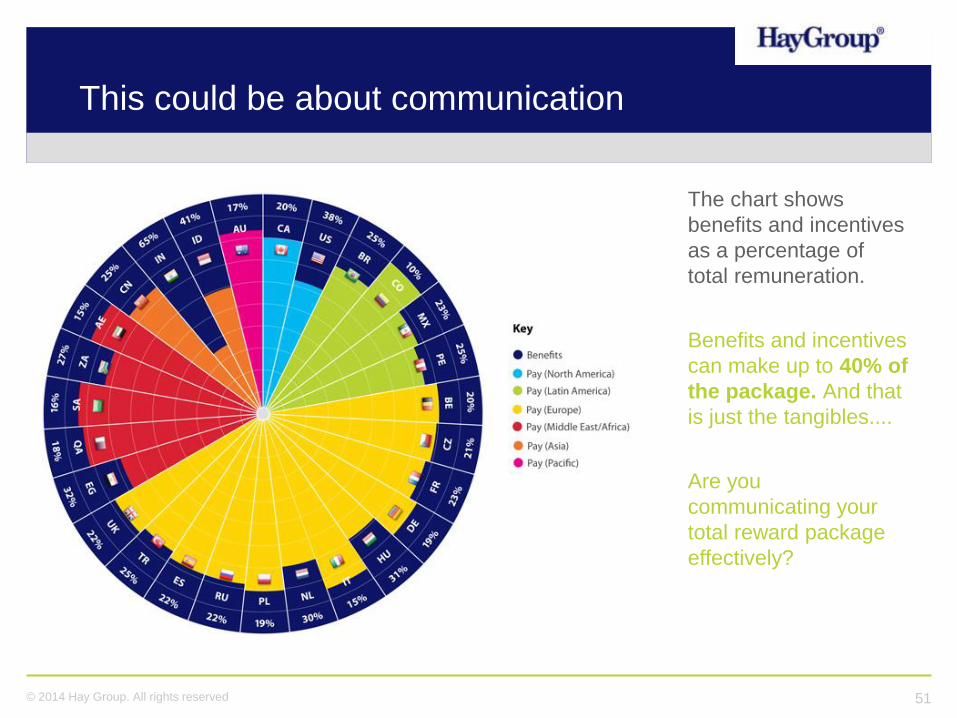
This could be about communication
The chart shows
benefits and incentives
as a percentage of
total remuneration.
Benefits and incentives
can make up to 40% of
the package. And that
is just the tangibles....
Are you
communicating your
total reward package
effectively?

Managing reward international
53© 2014 Hay Group. All rights reserved
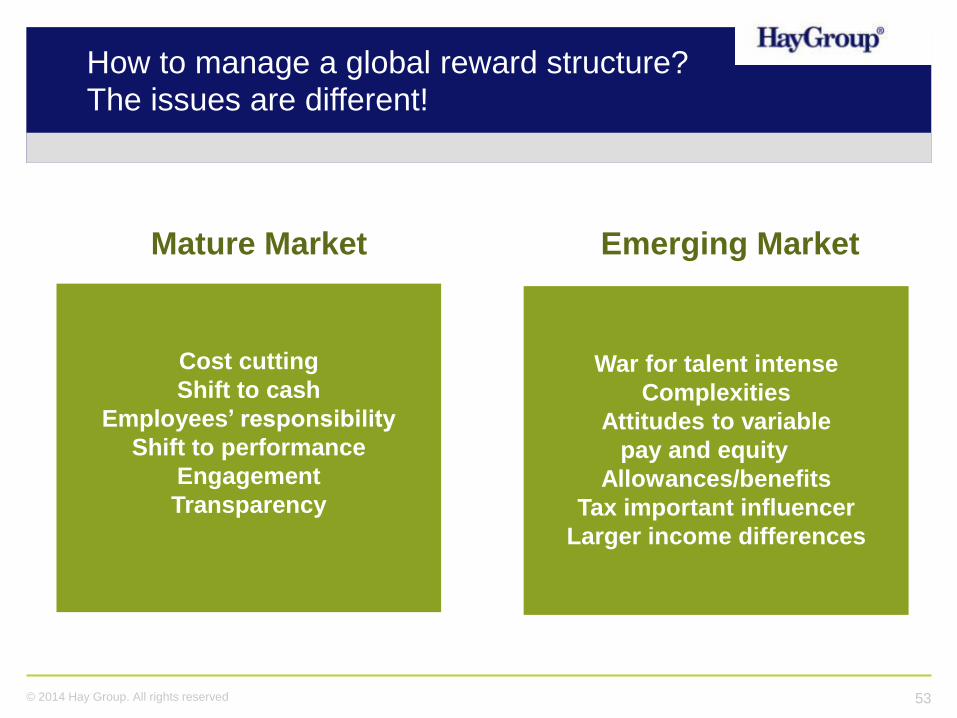
Mature Market Emerging Market
Cost cutting
Shift to cash
Employees’ responsibility
Shift to performance
Engagement
Transparency
War for talent intense
Complexities
Attitudes to variable
pay and equity
Allowances/benefits
Tax important influencer
Larger income differences
How to manage a global reward structure?The issues are different!
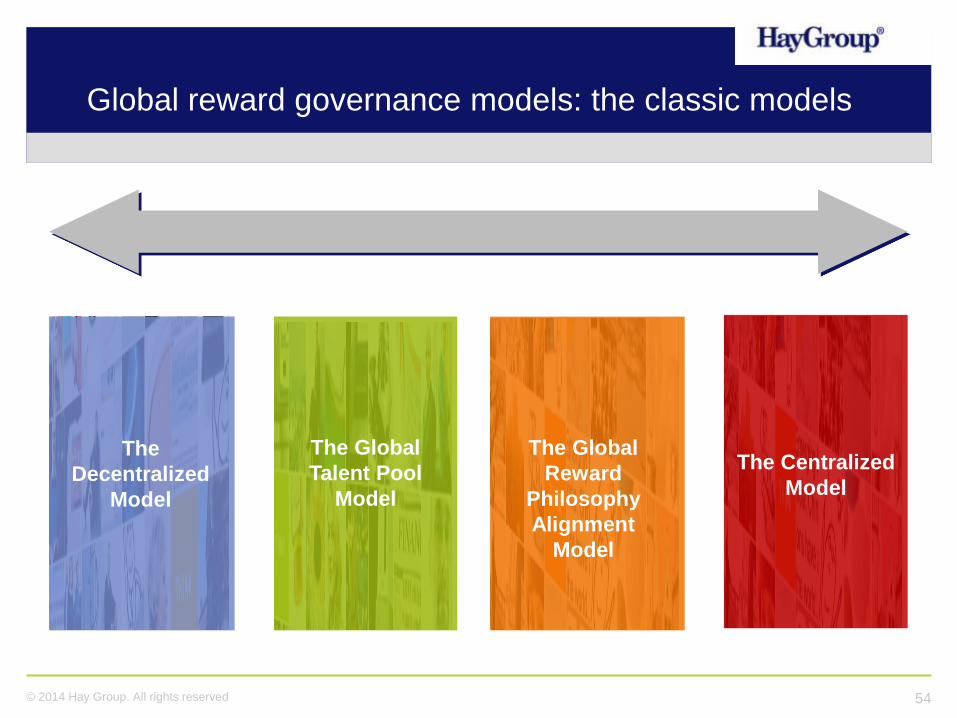
54© 2014 Hay Group. All rights reserved
The
Decentralized
Model
The Global
Talent Pool
Model
The Global
Reward
Philosophy
Alignment
Model
The Centralized
Model
Global reward governance models: the classic models
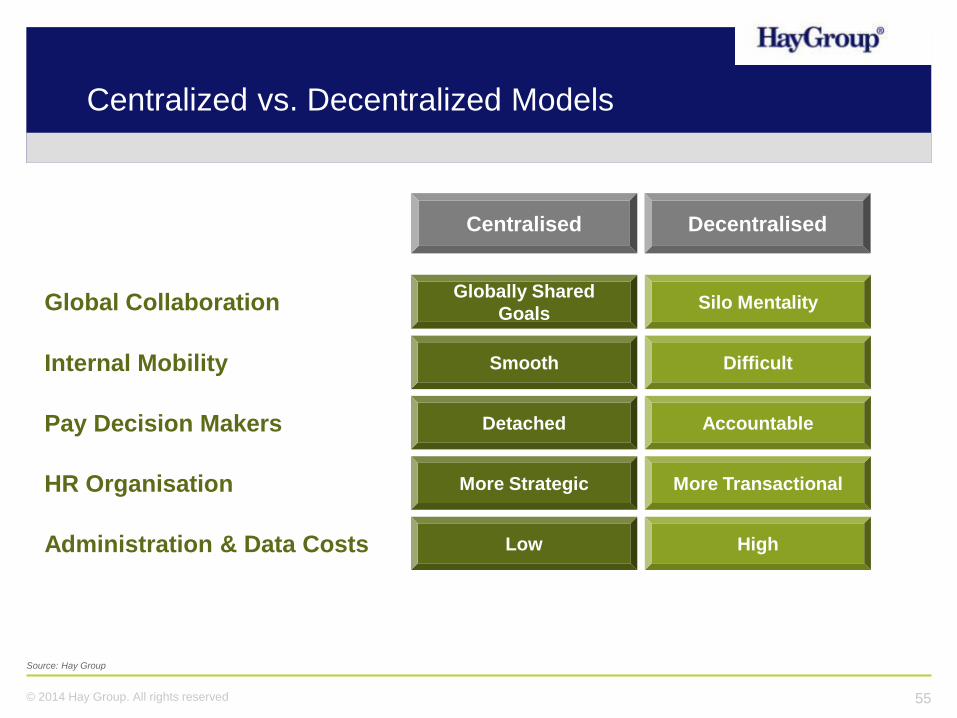
55© 2014 Hay Group. All rights reserved
Centralised Decentralised
Global CollaborationGlobally Shared
GoalsSilo Mentality
Internal Mobility Smooth Difficult
Pay Decision Makers Detached Accountable
HR Organisation More Strategic More Transactional
Administration & Data Costs Low High
Source: Hay Group
Centralized vs. Decentralized Models

56© 2014 Hay Group. All rights reserved
Sources: Hay Group 2014 Annual Compensation Study - PayNet
Policies / Process Top Mgt Senior Mgt Professional/ Admin Blue
(G = Global; R = Regional; L = Local) Middle Management Collar
Organisation charts G G G L L
Job descriptions G G G L L
Job grading G G G L L
Reward strategy and policies G G G G G
Base salary structures G G G L L
Salary reviews process G R L L L
Benchmarking G R L L L
STI – perf measures G G R L L
LTI - measures G G G - -
Pensions G / L L L L L
Insurable benefits G / L L L L L
Car policies G / L L L - -
Performance management G G G L L
Employee satisfaction/preferences studies G G G G G
Policy options – global v local
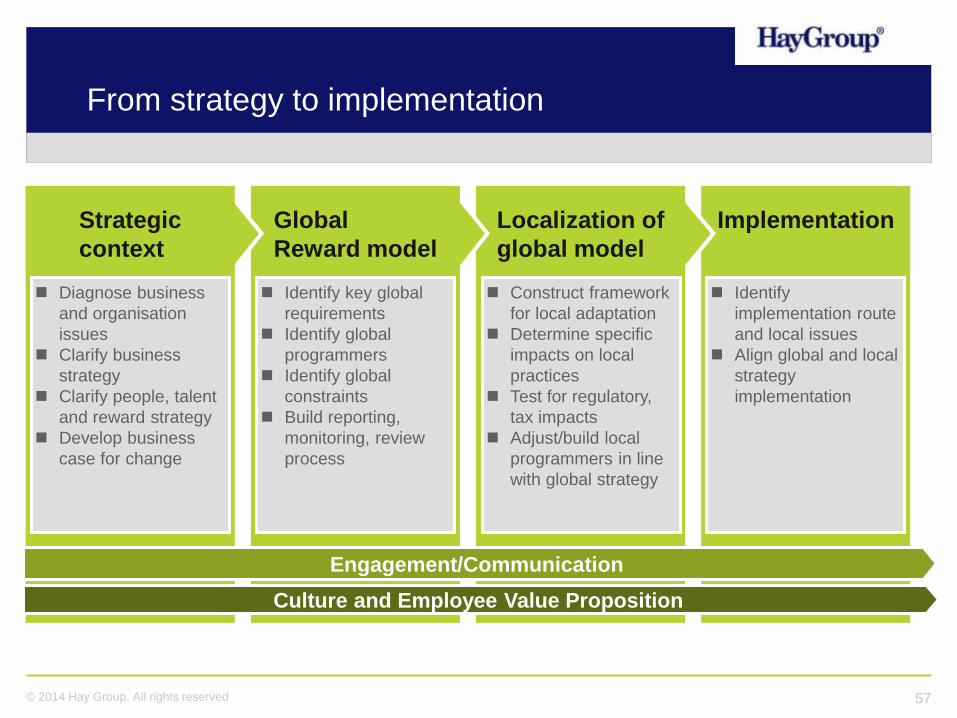
57© 2014 Hay Group. All rights reserved
Implementation
Identify
implementation route
and local issues
Align global and local
strategy
implementation
Localization of
global model
Construct framework
for local adaptation
Determine specific
impacts on local
practices
Test for regulatory,
tax impacts
Adjust/build local
programmers in line
with global strategy
Global
Reward model
Identify key global
requirements
Identify global
programmers
Identify global
constraints
Build reporting,
monitoring, review
process
Strategic
context
Diagnose business
and organisation
issues
Clarify business
strategy
Clarify people, talent
and reward strategy
Develop business
case for change
From strategy to implementation
Engagement/Communication
Culture and Employee Value Proposition

China HR journey to Great

59© 2014 Hay Group. All rights reserved
Average years of tenure
Ref level Employee group China GCC USA* UK* Japan
-11 Entry level/junior 2 5 5 5 5.8
12-16 Supervisory 3 6 7 10 13.7
17-20 Middle management 6 8 10 14 20.6
20+ Senior executive 10 11 15 19 23.5
* Actual data not available. Based on informed opinion
Average years of tenure: China vs Selected Markets

60© 2014 Hay Group. All rights reserved
29
30 30
33
34
36
38
39
40
35
34
3635
37
40
4243
45
3636
3637
3839
41
43 43
38
36
38 38
3940
41
42
44
39
40
39
41 41
42
44 44
46
26
31
36
41
46
12 13 14 15 16 17 18 19 20
Av
era
ge a
ge o
f em
plo
yees w
ork
ing
in
MN
C
China Malaysia Singapore Hong Kong Germany
Junior management Middle management Senior management
Age analysis by country
Sources: Hay Group 2014 Annual Compensation Study - PayNet
Average age of employees working for MNCs : China vs Other Markets (All function)

61© 2014 Hay Group. All rights reserved
Sources: Hay Group 2014 Annual Compensation Study - PayNet
Average age of employees working for MNCs In China : HR vs All Function
27
29
30
31
33
35
37
39
41 41
44
42
30 30
31
33
35
37
38
40
42
43
44
45
26
28
30
32
34
36
38
40
42
44
46
HRL11 HRL12 HRL13 HRL14 HRL15 HRL16 HRL17 HRL18 HRL19 HRL20 HRL21 HRL22
HR General
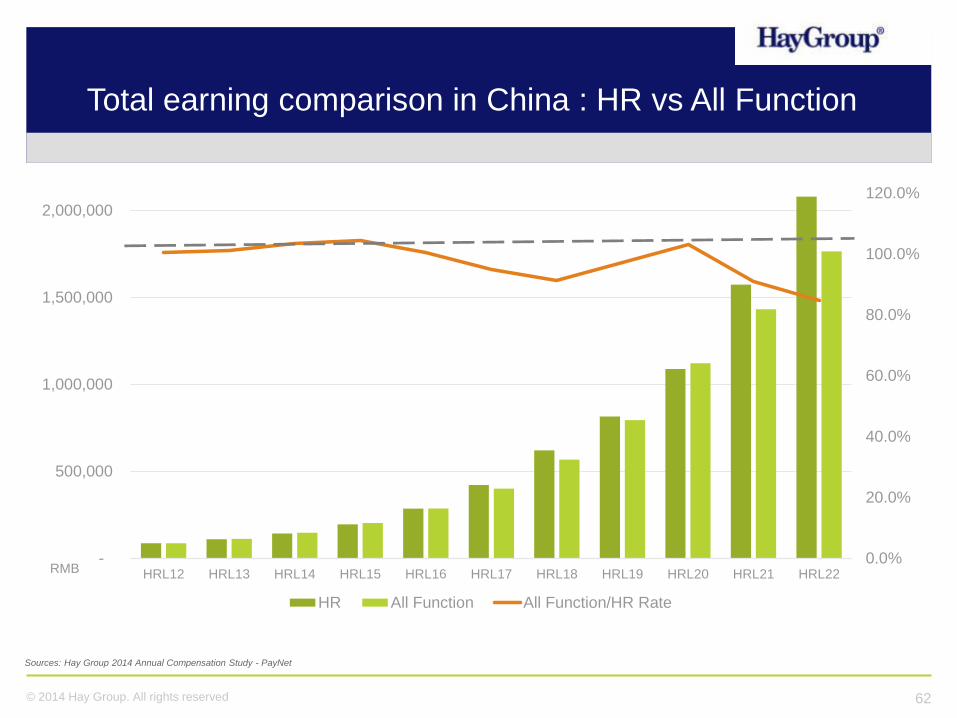
62© 2014 Hay Group. All rights reserved
0.0%
20.0%
40.0%
60.0%
80.0%
100.0%
120.0%
-
500,000
1,000,000
1,500,000
2,000,000
HRL12 HRL13 HRL14 HRL15 HRL16 HRL17 HRL18 HRL19 HRL20 HRL21 HRL22
HR All Function All Function/HR Rate
Total earning comparison in China : HR vs All Function
Sources: Hay Group 2014 Annual Compensation Study - PayNet
RMB


Back to Basic:
How to Adding Value
and Delivering Results?

Manage global reward
66© 2014 Hay Group. All rights reserved
Question number 1
Where can you find Hay Group economy reports?
A. PayNet Landscape B. www.haygroup.com
C. www.wikileaks.com D. www.megaupload.com
67© 2014 Hay Group. All rights reserved
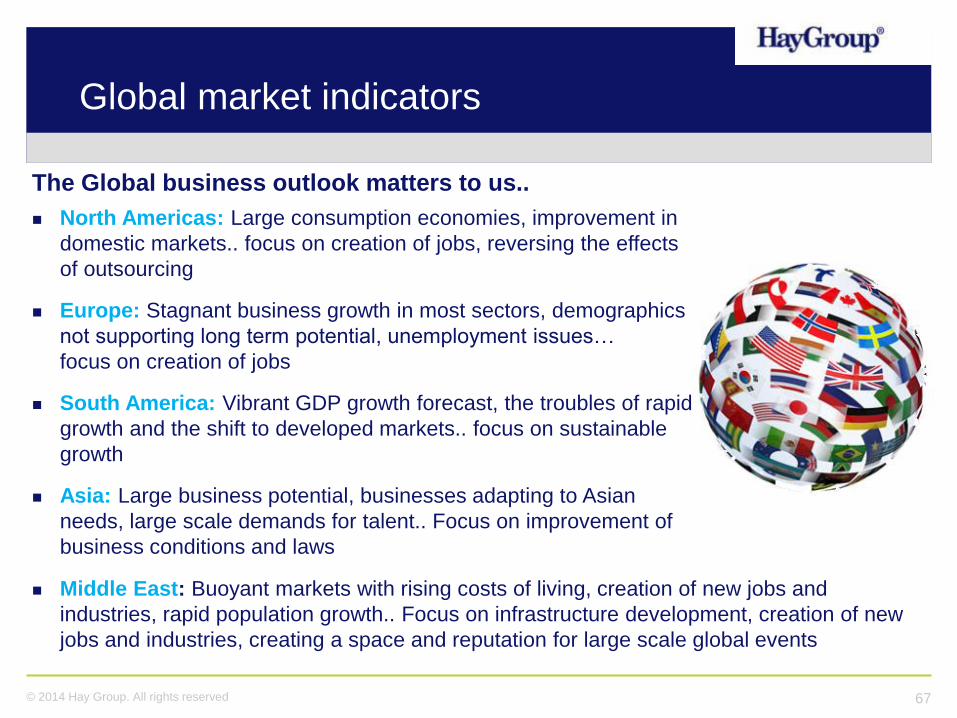
Global market indicators
The Global business outlook matters to us..
North Americas: Large consumption economies, improvement in
domestic markets.. focus on creation of jobs, reversing the effects
of outsourcing
Europe: Stagnant business growth in most sectors, demographics
not supporting long term potential, unemployment issues…
focus on creation of jobs
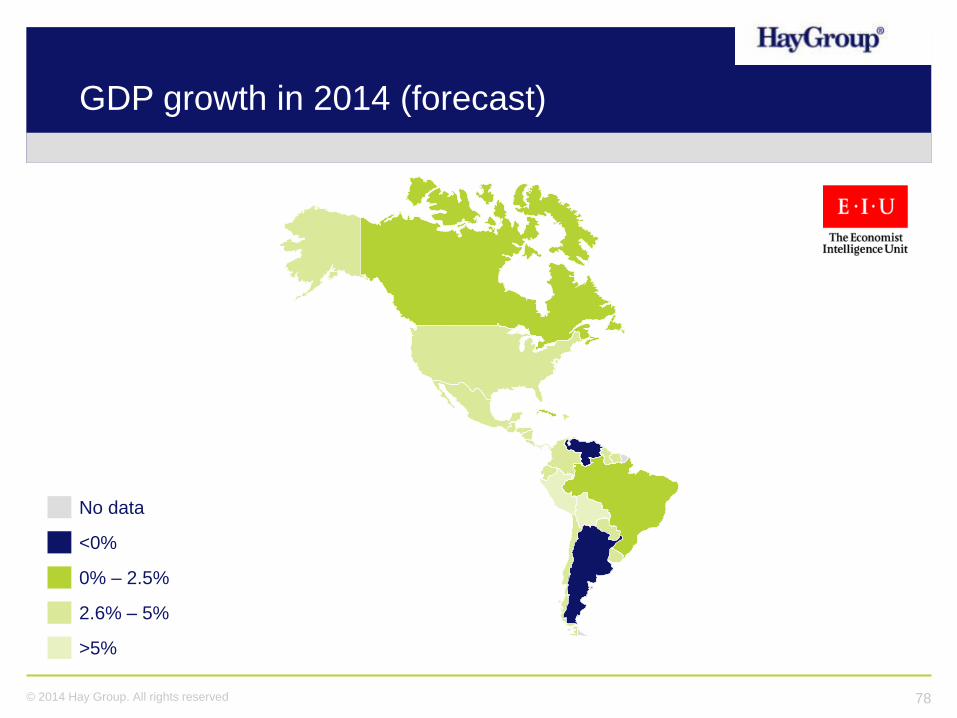
South America: Vibrant GDP growth forecast, the troubles of rapid
growth and the shift to developed markets.. focus on sustainable
growth
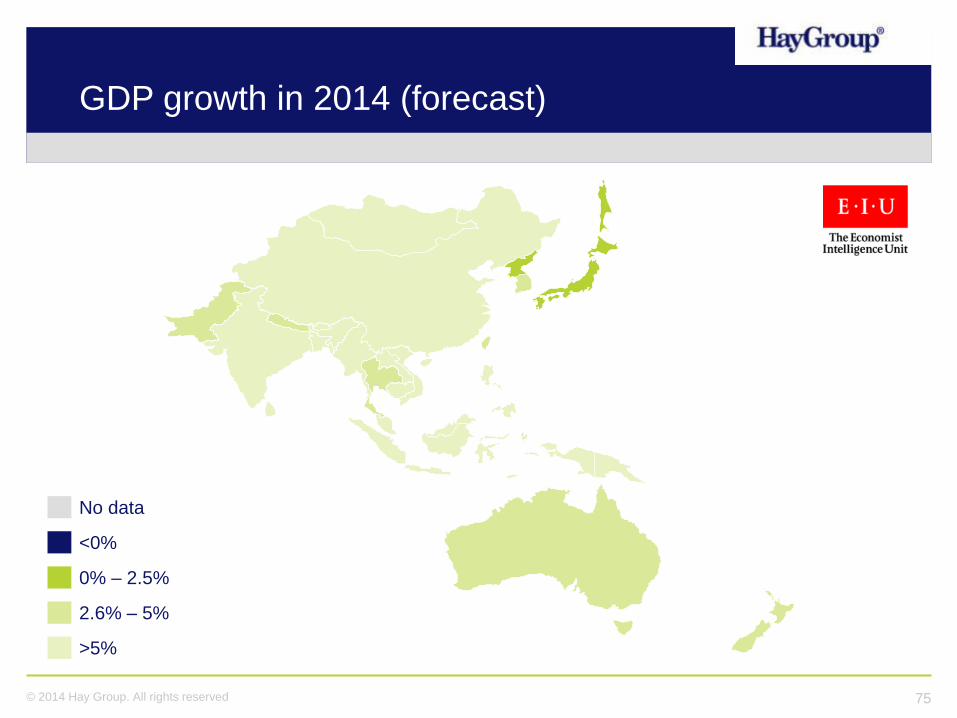
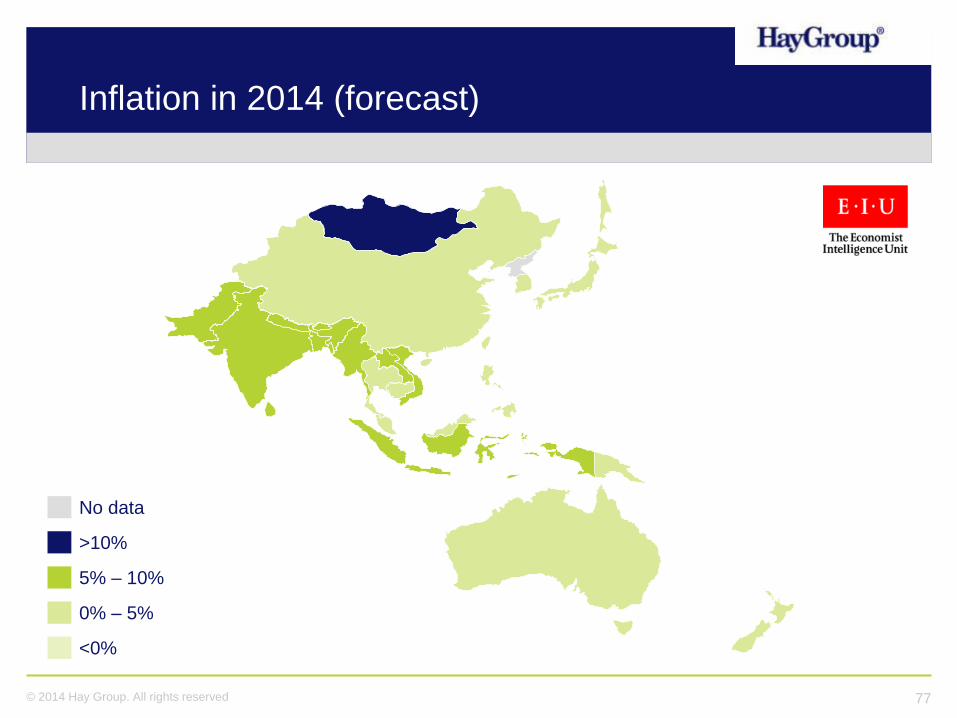
Asia: Large business potential, businesses adapting to Asian
needs, large scale demands for talent.. Focus on improvement of
business conditions and laws
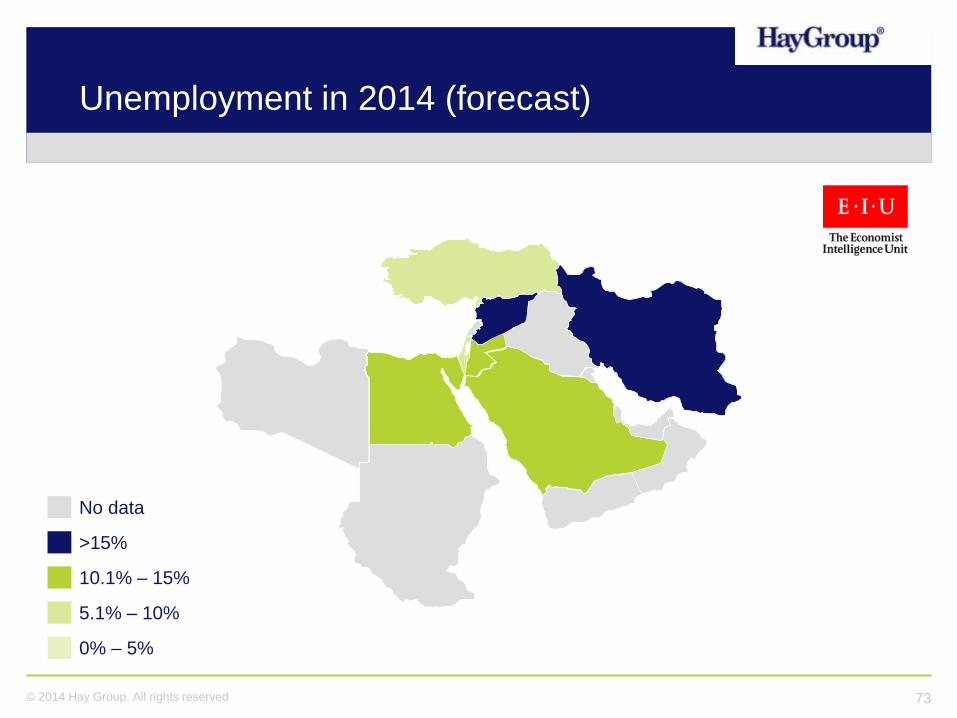
Middle East: Buoyant markets with rising costs of living, creation of new jobs and
industries, rapid population growth.. Focus on infrastructure development, creation of new
jobs and industries, creating a space and reputation for large scale global events

Landscape is a reward market environment report for countries across the globe. It includes country economic and political factors, reward issues and salary movements and forecasts.
69© 2014 Hay Group. All rights reserved
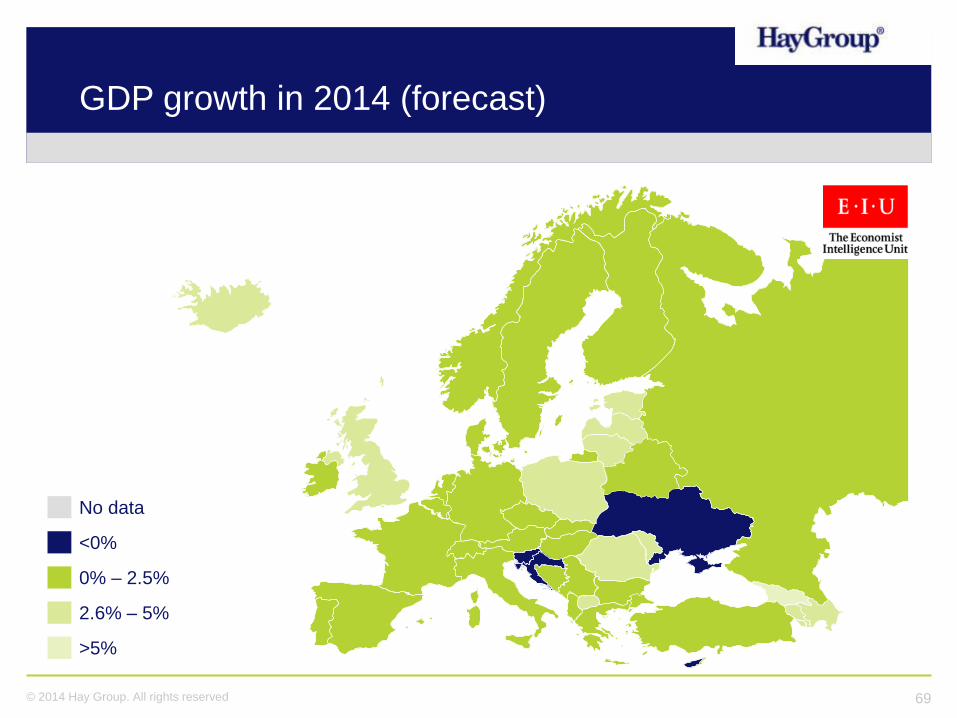
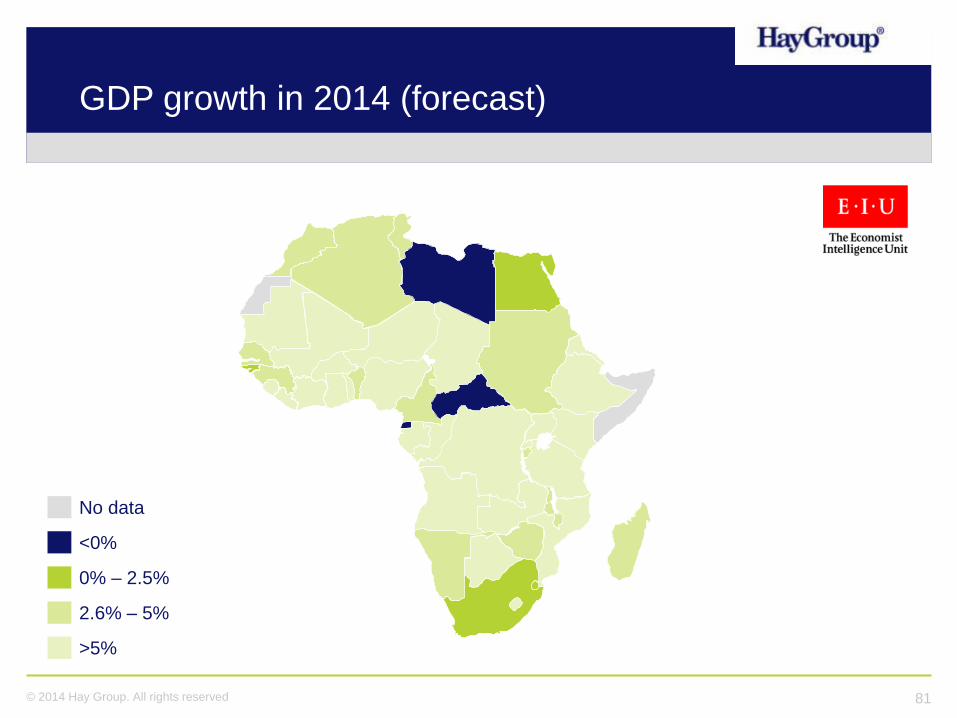
GDP growth in 2014 (forecast)
No data
<0%
0% – 2.5%
2.6% – 5%
>5%

70© 2014 Hay Group. All rights reserved
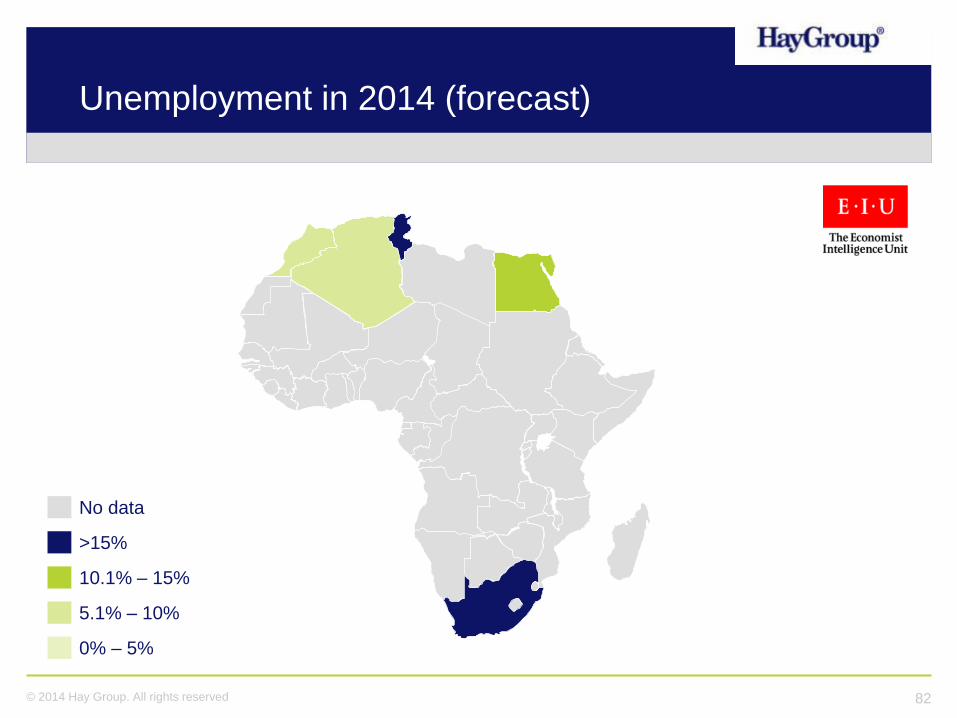
Unemployment in 2014 (forecast)
No data
>15%
10.1% – 15%
5.1% – 10%
0% – 5%
71© 2014 Hay Group. All rights reserved
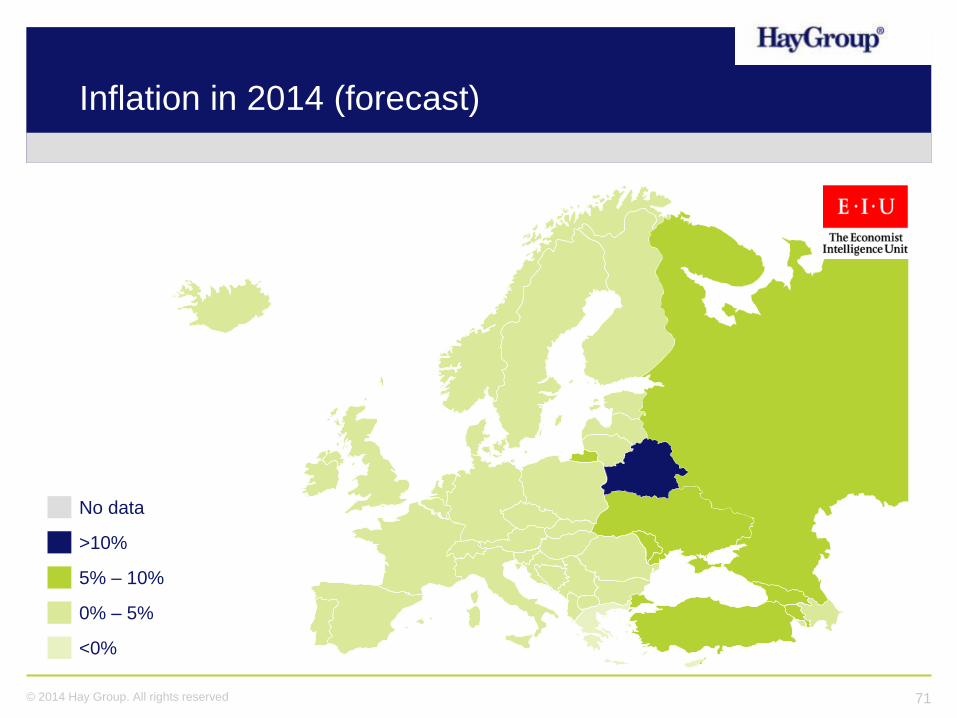
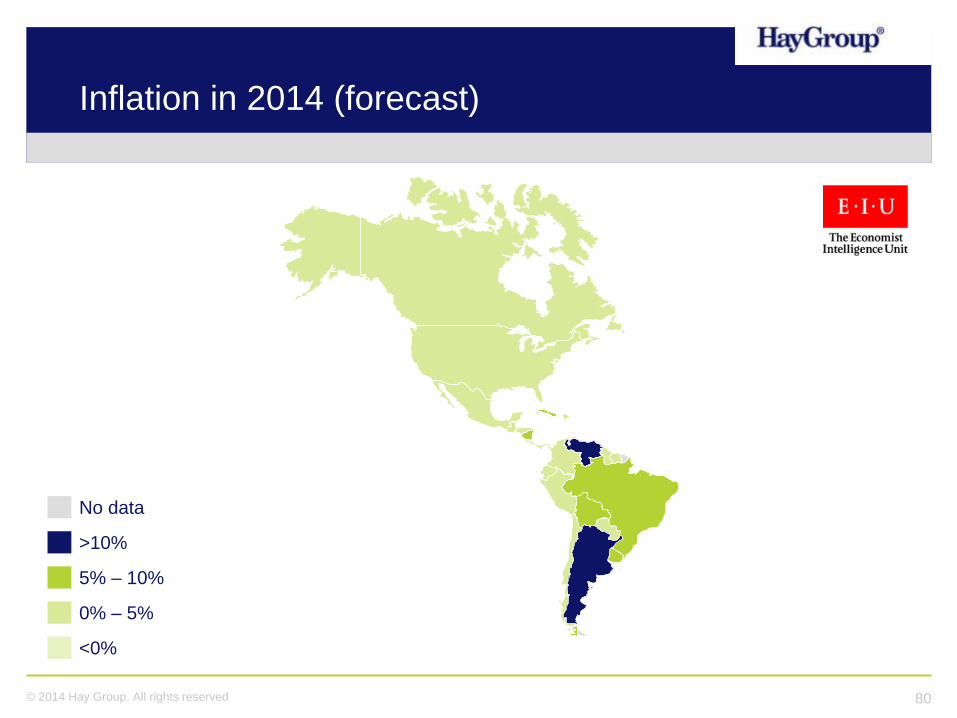
Inflation in 2014 (forecast)
No data
>10%
5% – 10%
0% – 5%
<0%

72© 2014 Hay Group. All rights reserved
GDP growth in 2014 (forecast)
No data
<0%
0% – 2.5%
2.6% – 5%
>5%
73© 2014 Hay Group. All rights reserved
Unemployment in 2014 (forecast)
No data
>15%
10.1% – 15%
5.1% – 10%
0% – 5%

74© 2014 Hay Group. All rights reserved
Inflation in 2014 (forecast)
No data
>10%
5% – 10%
0% – 5%
<0%
75© 2014 Hay Group. All rights reserved
GDP growth in 2014 (forecast)
No data
<0%
0% – 2.5%
2.6% – 5%
>5%

76© 2014 Hay Group. All rights reserved
Unemployment in 2014 (forecast)
No data
>15%
10.1% – 15%
5.1% – 10%
0% – 5%
77© 2014 Hay Group. All rights reserved
Inflation in 2014 (forecast)
No data
>10%
5% – 10%
0% – 5%
<0%
78© 2014 Hay Group. All rights reserved
GDP growth in 2014 (forecast)
No data
<0%
0% – 2.5%
2.6% – 5%
>5%

79© 2014 Hay Group. All rights reserved
Unemployment in 2014 (forecast)
No data
>15%
10.1% – 15%
5.1% – 10%
0% – 5%
80© 2014 Hay Group. All rights reserved
Inflation in 2014 (forecast)
No data
>10%
5% – 10%
0% – 5%
<0%
81© 2014 Hay Group. All rights reserved
GDP growth in 2014 (forecast)
No data
<0%
0% – 2.5%
2.6% – 5%
>5%
82© 2014 Hay Group. All rights reserved
Unemployment in 2014 (forecast)
No data
>15%
10.1% – 15%
5.1% – 10%
0% – 5%

83© 2014 Hay Group. All rights reserved
Inflation in 2014 (forecast)
No data
>10%
5% – 10%
0% – 5%
<0%

84© 2014 Hay Group. All rights reserved
Where can you find out more?
85© 2014 Hay Group. All rights reserved
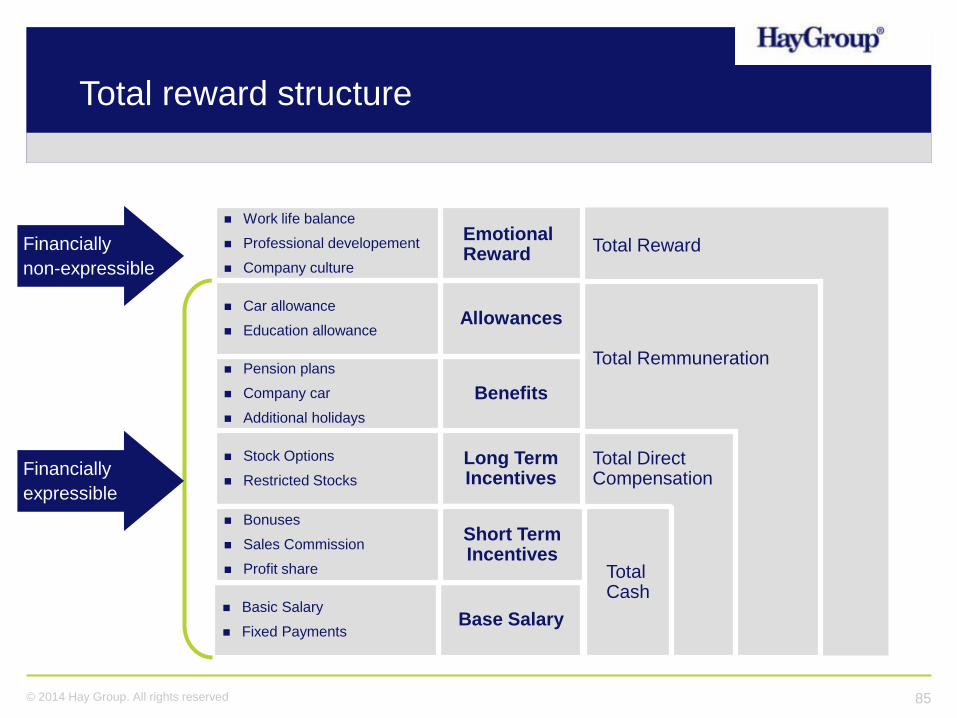
Total RewardEmotional Reward
Work life balance
Professional developement
Company culture
Total Remmuneration
Benefits
Allowances
Pension plans
Company car
Additional holidays
Car allowance
Education allowance
Total Direct Compensation
Long Term Incentives
Stock Options
Restricted Stocks
Total Cash
Base Salary Basic Salary
Fixed Payments
Short Term Incentives
Bonuses
Sales Commission
Profit share
Total reward structure
Financially
non-expressible
Financially
expressible
Work life balance
Professional developement
Company culture
Pension plans
Company car
Additional holidays
Car allowance
Education allowance
Stock Options
Restricted Stocks
Short Term Incentives
Bonuses
Sales Commission
Profit share

Hay Group

87© 2014 Hay Group. All rights reserved
Question
Hay Group Productized Services can help you with:
A. Reward B. Talent management
C. Organisational effectiveness D. All options are correct

Hay Group has taken its 70 years of research and experience and channelled it into a new suite of powerful off-the-shelf tools that will help you find, reward and develop the talent within your organisation –and maximise your return on investment in your people.
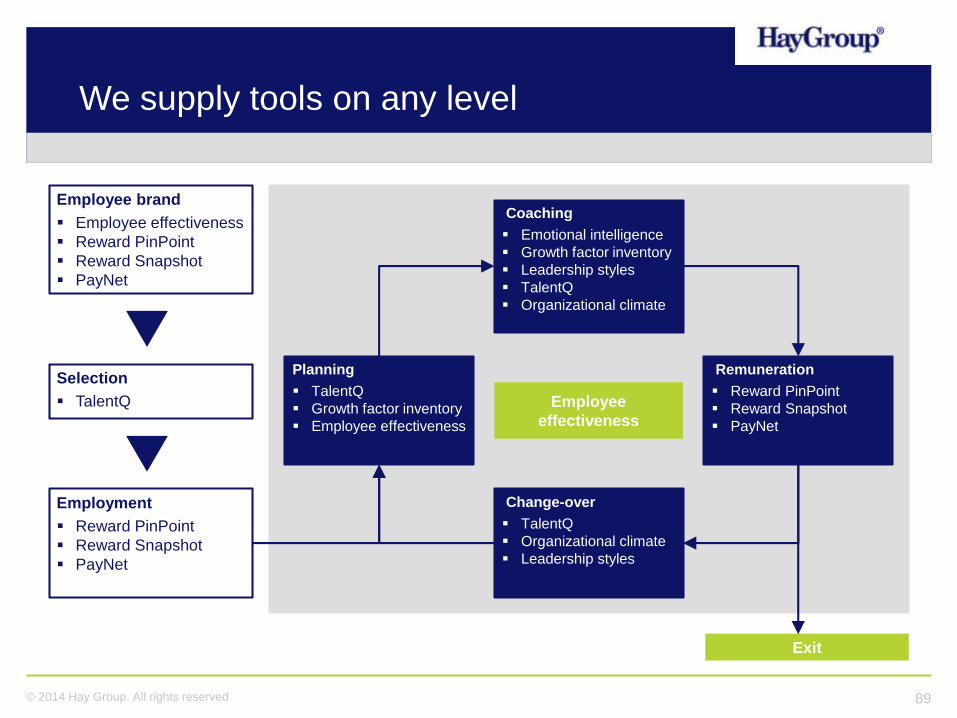
89© 2014 Hay Group. All rights reserved
We supply tools on any level
Employee
effectiveness
Coaching
Emotional intelligence
Growth factor inventory
Leadership styles
TalentQ
Organizational climate
Change-over
TalentQ
Organizational climate
Leadership styles
Planning
TalentQ
Growth factor inventory
Employee effectiveness
Remuneration
Reward PinPoint
Reward Snapshot
PayNet
Exit
Employment
Reward PinPoint
Reward Snapshot
PayNet
Selection
TalentQ
Employee brand
Employee effectiveness
Reward PinPoint
Reward Snapshot
PayNet
90© 2014 Hay Group. All rights reserved
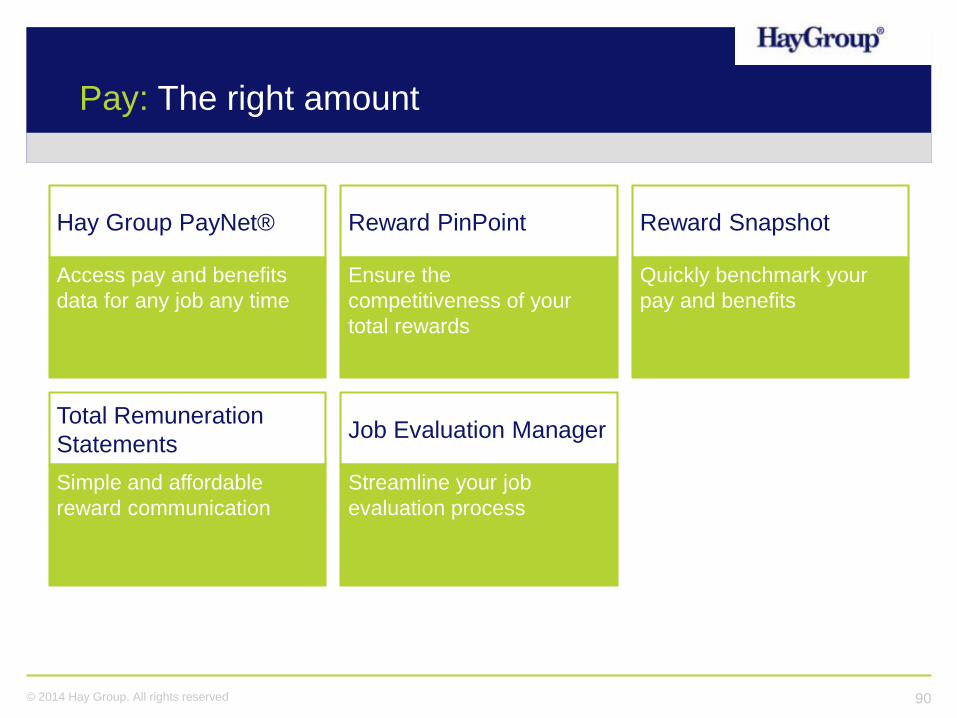
Pay: The right amount
Hay Group PayNet® Reward PinPoint Reward Snapshot
Access pay and benefits
data for any job any time
Ensure the
competitiveness of your
total rewards
Quickly benchmark your
pay and benefits
Total Remuneration
StatementsJob Evaluation Manager
Simple and affordable
reward communication
Streamline your job
evaluation process

91© 2014 Hay Group. All rights reserved
Emotional Intelligence
Develop emotionally intelligent employees
Growth Factors
Identify your future stars
TalentQ
Select the right people for the right role
Leadership Styles and Climate
Develop effective leaders
Talent: Select and develop your employees

92© 2014 Hay Group. All rights reserved
Effectiveness: Engage and enable your people
Employee Effectiveness
Engage and enable your employees

93© 2014 Hay Group. All rights reserved
Question
Hay Group provides access to data in:
A. over 50 countries B. over 70 countries
C. over 100 countries D. over 300 countries
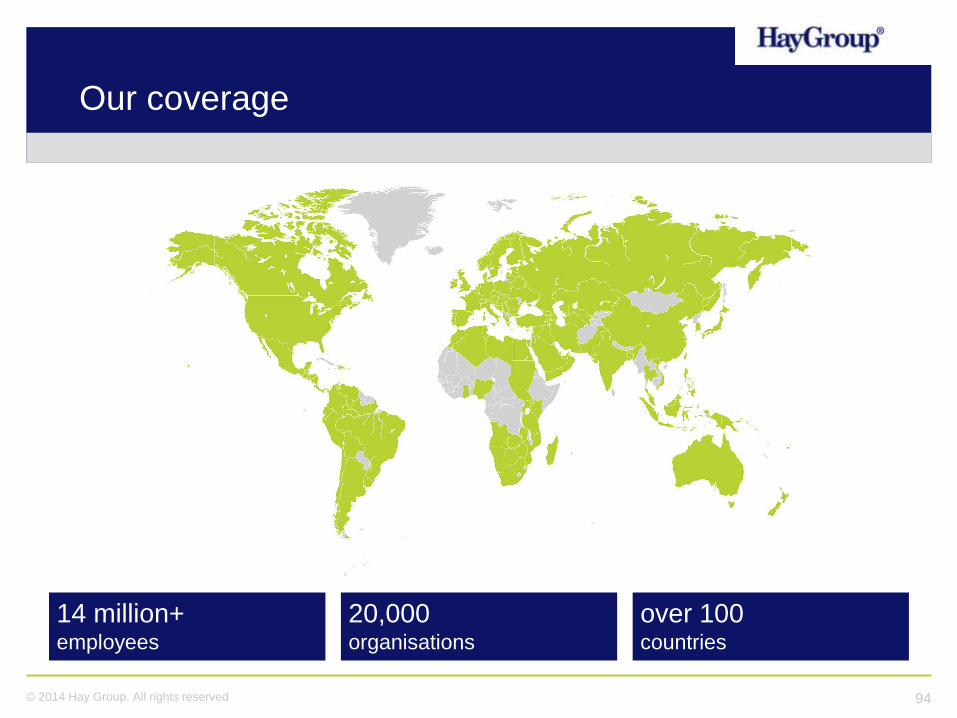
94© 2014 Hay Group. All rights reserved
Our coverage
14 million+employees
20,000organisations
over 100countries
Related Documents