Hewlett-Packard Co. Equity and Valuation Analysis Valued at November 1, 2006 Jessica Myhre: [email protected] Chad Stephenson: [email protected] Lindsey Yantis: [email protected] Greg Zang: [email protected]

Welcome message from author
This document is posted to help you gain knowledge. Please leave a comment to let me know what you think about it! Share it to your friends and learn new things together.
Transcript
Hewlett-Packard Co. Equity and Valuation Analysis
Valued at November 1, 2006
Jessica Myhre: [email protected] Chad Stephenson: [email protected]
Lindsey Yantis: [email protected] Greg Zang: [email protected]
Table of Contents
Executive Summary 3 Business/Industry Analysis 5 Accounting Analysis 16 Company Comparisons 24 Financial Analysis 28 Forecasted Financials 51 Valuation Analysis 56 Method of Comparables 56 Cost of Capital 59 Intrinsic Valuations 61 Conclusion 68 Appendices Forecasting (A-D) 69
CAPM/Cost of Capital (E) 76 Cost of Debt (F) 77
Intrinsic Valuations (G-K) 78 References 83
3
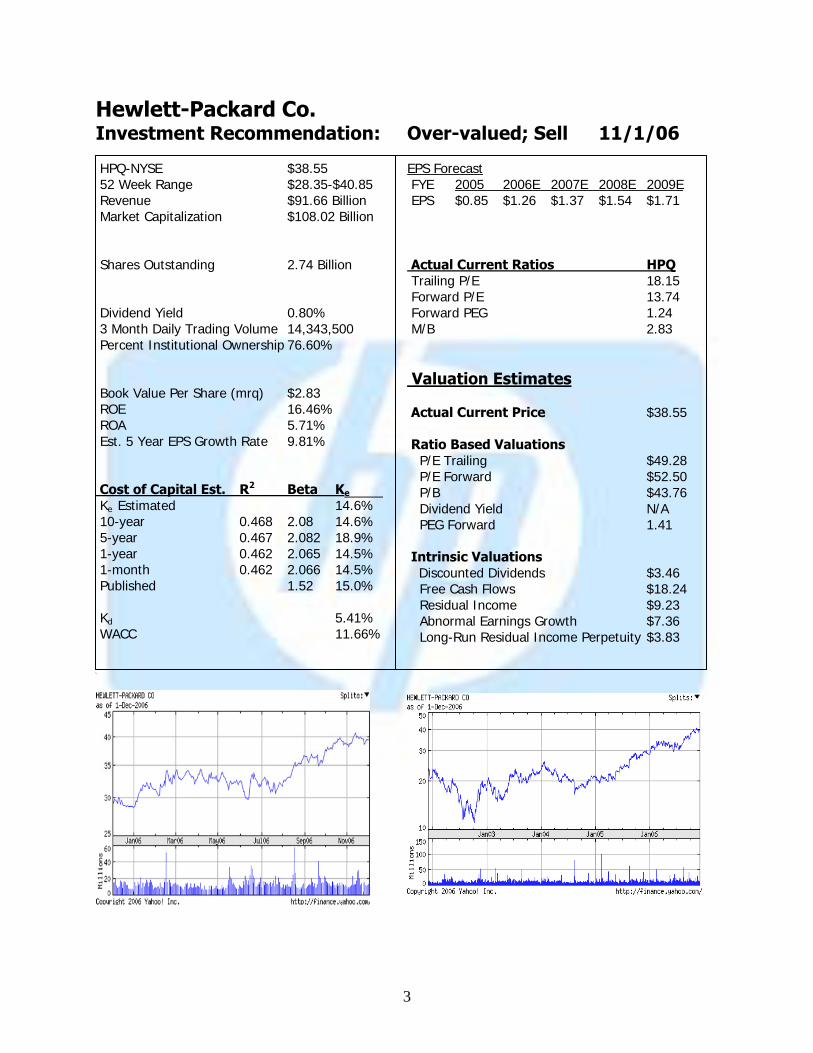
Hewlett-Packard Co. Investment Recommendation: HPQ-NYSE $38.55 52 Week Range $28.35-$40.85 Revenue $91.66 Billion Market Capitalization $108.02 Billion Shares Outstanding 2.74 Billion Dividend Yield 0.80% 3 Month Daily Trading Volume 14,343,500 Percent Institutional Ownership 76.60% Book Value Per Share (mrq) $2.83 ROE 16.46% ROA 5.71% Est. 5 Year EPS Growth Rate 9.81% Cost of Capital Est. R2 Beta Ke Ke Estimated 14.6% 10-year 0.468 2.08 14.6% 5-year 0.467 2.082 18.9% 1-year 0.462 2.065 14.5% 1-month 0.462 2.066 14.5% Published 1.52 15.0% Kd 5.41% WACC 11.66%
Over-valued; Sell 11/1/06 EPS Forecast FYE 2005 2006E 2007E 2008E 2009E EPS $0.85 $1.26 $1.37 $1.54 $1.71 Actual Current Ratios HPQ Trailing P/E 18.15 Forward P/E 13.74 Forward PEG 1.24 M/B 2.83 Valuation Estimates Actual Current Price $38.55 Ratio Based Valuations P/E Trailing $49.28 P/E Forward $52.50 P/B $43.76 Dividend Yield N/A PEG Forward 1.41 Intrinsic Valuations Discounted Dividends $3.46 Free Cash Flows $18.24 Residual Income $9.23 Abnormal Earnings Growth $7.36 Long-Run Residual Income Perpetuity $3.83
4
Executive Summary
Hewlett-Packard is one of the world’s leaders in providing solutions and services
to individual consumers and businesses through information technology. They are
classified in the Diversified Computer Systems Industry. Hewlett Packard has made a
place in the industry by continuing to deliver quality products with cutting edge
technology, or differentiation. Their products have been set as the industry standard.
They have many different competitors including, Apple, Dell, IBM, Cannon, and
Gateway. The threat of new competitors in their market is low due to the many
barriers of entry. When looking at the possibility of having substitute products in the
market, there is little threat due to the inability to substitute computers and other
technology devices. Because of this, buyers have little bargaining power but suppliers
have high bargaining power. This can be attributed to the demand for technology.
Hewlett-Packard seems to be an honest company when it comes to their
financials. They remain to have conservative accounting policies amidst the SEC probe
and upper management leak. Though their reputation may have been tarnished
through this leak, Hewlett-Packard’s accounting practices seem to be stable with no
signs of manipulation. In Hewlett- Packard’s annual 10-K report, they disclose almost
all possible information, negative and positive. This lowers any concern for possibility
of manipulation.
Next in the analysis was studying Hewlett-Packard’s annual report with
computing their core financial ratios. By computing financial ratios, it is easier to
analyze the firm’s financial performance in relation to the industry. Hewlett Packard’s
overall liquidity is in the lower end of the spectrum, as well as their profitability. This
can be contributed to the high amount of research and development costs Hewlett-
Packard incurs each year to remain the industry leader in technology. In terms of
capital structure, HP also has unfavorable ratios. This is a result of stockholder’s high
confidence that Hewlett-Packard will remain a profitable company and not go bankrupt.
To have a better understanding of where Hewlett Packard will be in the years to
come, it is necessary to forecast the company’s financial statements over the next ten
5
years. With the assumption that there will be no unforeseen abnormalities, it is
believed that Hewlett Packard will grow at a steady, constant rate. These forecasts
must be as accurate as possible to help determine the value of the company.
After forecasting financial statements as accurately as possible, it was then
necessary to run different valuation methods for Hewlett-Packard. These included
discount dividends, abnormal earnings growth, residual income, and discounted cash
flows.
With this thorough evaluation, we strongly believe Hewlett Packard’s stock to be
overvalued by the market. All of our valuation models supported this showing nearly
75% of the actual stock price of $38.55. Based on our in-depth valuations of Hewlett-
Packard, we find their stock HPQ to be overvalued and recommend selling.
Company Profile
Hewlett-Packard was originated in 1939 by William R. Hewlett and David
Packard. Currently, the company is headquartered in Palo Alto, California.2 Hewlett-
Packard presently operates out of six business segments: Enterprise Storage and
Servers, HP Services Software, Personal Systems Group, Imagine and Printing Group,
HP Financial Services, and Corporate Investments. Technology Solutions Group is a
non-operating segment that incorporates Enterprise Storage and Serves and HP
Services into a single division. Underneath these different divisions, Hewlett Packard
provides a wide variety of computer and peripheral products. This diverse product line
includes: personal computers, handheld computer devices, home and business imaging
and printing devices, publishing systems, storage and servers, a wide selection of
information technology services and software solutions.4
In 1939, Hewlett-Packard was originated as a privately owned and operated
company. On November 6, 1957, Hewlett-Packard made the transition into a publicly
traded company at $16.00 per share. Today, Hewlett-Packard is publicly traded on the
New York Stock Exchange.
6
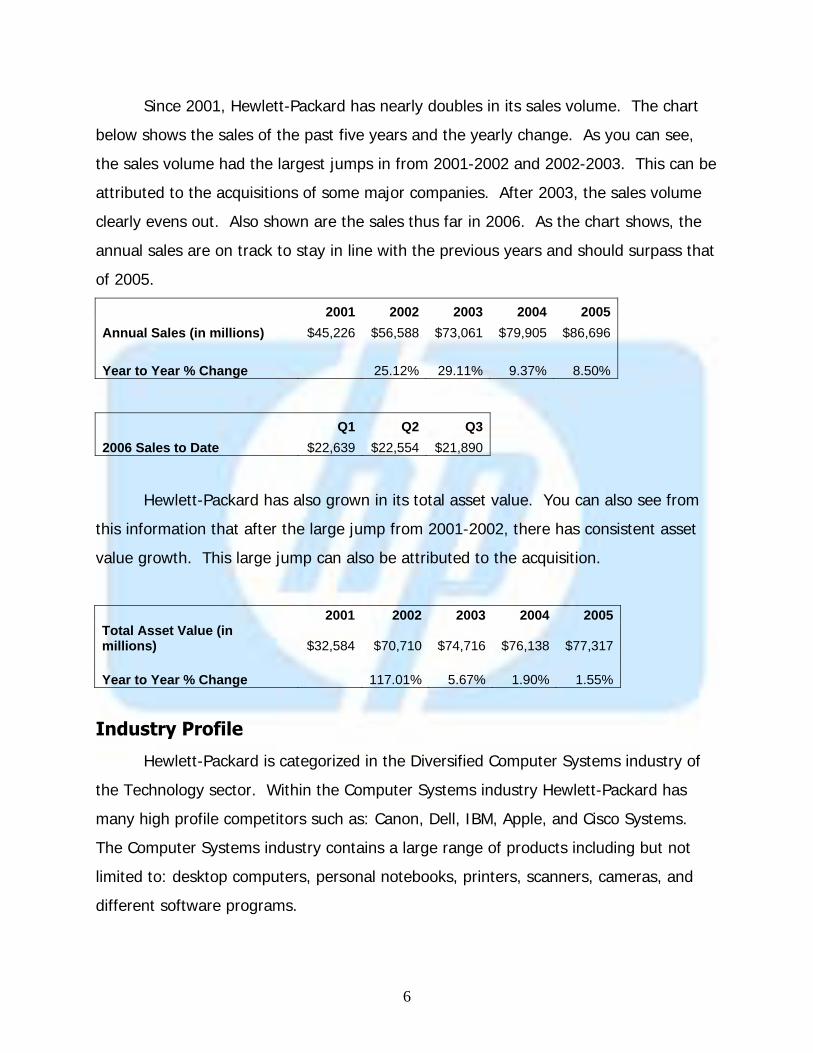
Since 2001, Hewlett-Packard has nearly doubles in its sales volume. The chart
below shows the sales of the past five years and the yearly change. As you can see,
the sales volume had the largest jumps in from 2001-2002 and 2002-2003. This can be
attributed to the acquisitions of some major companies. After 2003, the sales volume
clearly evens out. Also shown are the sales thus far in 2006. As the chart shows, the
annual sales are on track to stay in line with the previous years and should surpass that
of 2005.
2001 2002 2003 2004 2005 Annual Sales (in millions) $45,226 $56,588 $73,061 $79,905 $86,696 Year to Year % Change 25.12% 29.11% 9.37% 8.50%
Q1 Q2 Q32006 Sales to Date $22,639 $22,554 $21,890
Hewlett-Packard has also grown in its total asset value. You can also see from
this information that after the large jump from 2001-2002, there has consistent asset
value growth. This large jump can also be attributed to the acquisition.
2001 2002 2003 2004 2005 Total Asset Value (in millions) $32,584 $70,710 $74,716 $76,138 $77,317 Year to Year % Change 117.01% 5.67% 1.90% 1.55%
Industry Profile
Hewlett-Packard is categorized in the Diversified Computer Systems industry of
the Technology sector. Within the Computer Systems industry Hewlett-Packard has
many high profile competitors such as: Canon, Dell, IBM, Apple, and Cisco Systems.
The Computer Systems industry contains a large range of products including but not
limited to: desktop computers, personal notebooks, printers, scanners, cameras, and
different software programs.
7
Most companies, such as Dell, Apple or Gateway, tend to be limited to a small
product range. Compared to other industry competitors, Hewlett-Packard has a wide
variety of consumer products. This gives HP a competitive advantage in the consumer
market due to their brand name coverage in the technology industry. Hewlett-Packard
offers desktops, notebooks, handhelds (pocket PC’s), monitors, home networking,
televisions, digital photography, printers and printing supplies. Hewlett-Packard does
not specialize in just one product line. With new technology innovations, some of their
previously lesser known lines have grown to be some of their largest. In the past five
years, Hewlett-Packard’s imaging and printing division has grown substantially due to
the popular home photography printing.
Vyomesh Joshi, executive vice president of Hewlett-Packard Co.’s imaging and
printing division, said Tuesday that the most-profitable of HP’s operations should
be able to continue to grow sales by 4% to 6% a year. Joshi said HP sees
tremendous opportunity in the inkjet-printing market, as well as its typically
strong laser-printer business.1
Five Forces Model:
Competitive Force 1: Rivalry among Existing Firms
Competition among existing firms is one of the biggest threats for Technology
Industry companies. There are many large companies with a strong foothold in the
technology industry, making each competitor’s revolutionary idea a factor in the
consumer’s decisions. In the past ten years, the technology industry has grown
exponentially. The size, quality, functions and appearance of all technological devices
and software are continually improving. A good example of the technological revolution
is the ever changing photography world. In the past decade, the camera has changed
from a 35 mm camera, with removable exposures, to the now modernized, sleek digital
camera which stores your images digitally until you are ready to print your pictures.
With what seems like daily changes, companies have to stay on top of their research
and development to keep their product up to date. The same updates are needed with
8
computers, which are always become outdated faster than expected. All of these
factors increase the competition among existing firms.
There is a high degree of concentration in this industry within the largest
companies including: Apple, Dell, HP, IBM, and Sony. At one point, IBM was the
industry leader, setting the bar for price and quality, but over time, other major
competitors have stepped up to the plate with new technology and price cutting
initiatives.3 In today’s market there is not one particular company which dictates the
overall computer pricing, as these leaders work together to avoid harsh price
competition. Along with these larger companies there are also smaller competitors
including: Gateway, Compaq, eMachines, and Velocity Micro. Many of these companies
overlap in competition, with products ranging from desktops to cameras to mp3
players. In each of these markets, there are different industry leaders.
In the computer technology industry, there are incentives to hold a strong
market share by setting lower prices or having new innovative ideas. Dell came into
the market aggressively with a ground-breaking business strategy. They cut out the
middle man, selling their products without a retail store, and were able to offer an
industry leading low price. The other large competitors, such as HP, could not match
this low price incentive, given their higher fixed costs involved in their sales. Hewlett-
Packard’s only way to compete with industry leaders is to keep a low variable cost. To
even begin competing in this industry, one must not only have the technology needed
but also the economy of scale.
In this modern world, a company in this area need not worry about excess
capacity, due to the high level of demand for such sophisticated products. This also
covers the problem of exit barriers, since at this time technology is only rising.
There is obviously a high degree of rivalry among existing firms in the
technology industry. With new ideas and cost cutting initiatives being thought of
everyday, those competing in this industry must keep up with these changes. This
involves creating brand loyalty, diversifying your company, being able to create new
ideas and being able to match your competitor’s advances. Implementing these ideas
allows a chance to keep up with the technology industry leaders.
9
Competitive Force 2: Threat of New Entrants
Having new entrants into the technology industry may seem impossible, but
when you think about the different areas they could enter into, it is not as hard as it
seems. Yes, it may be difficult for a new technology company to come about, but there
is also the angle of existing companies to creating new technological products. With
this idea comes the threat of new entrants.
In order for a company to enter this industry it would require large economies of
scale. To compete in this industry, a large amount of capital is required. New
companies trying to make a foothold in the technology industry will suffer from
economies of scale in research and development, brand advertising, and possibly
physical plant and equipment.3 It takes a lot of research and development before a
product can initially be launched, which is a large problem for new companies without
sound financial backing. In order to keep up with competitors, most companies need to
begin to generate revenue in the early stages of the company’s life, rather than having
to spend excess amounts of money. The companies which are currently competing in
the industry have already established themselves among the consumers as reputable
producers of technological products. Not only have they put in capital, but also the
time to gain their brand recognition. A new company cannot automatically buy brand
recognition; it involves being set in the marketplace to gain consumer confidence.
If a company was attempting to enter into the industry it would be beneficial for
them to have a new innovative product. This would allow them to gain a first mover
advantage over the existing competition. For example, Apple has gained an advantage
over the rest of the technology industry with their addition of iPod and iTunes in 2004.
Since it was the first, iPod is now the benchmark mp3 player, making it difficult to rival
their ever-changing technology. This is where the idea of already existing companies
bringing in new products comes into play. For example, recently there has been the
development of a portable USB port. This allows a PC user to insert a device (the USB)
into their computer and save their work in the USB. They can then insert the USB into
10
any other computer and have their work uploaded, quickly and simply. This has
become a large industry, and many companies have begun producing these products.
Another barrier to entry is the already established distribution channels and
relationships among suppliers. It is common in an industry which uses many different
suppliers, for exclusive relationships to be developed. In cases such as this, many
times it becomes difficult for new competition to gain such advantages. In the
technology industry many of the components are produced overseas. These foreign
barriers also create another problem for new entrants.
Seeing that the computer systems industry is so research-intensive, there are
many patents and copyrights already in existence. This creates legal barriers for the
companies trying to gain a new market share.
With such high barriers of entry into the technology industry, it is apparent why
we haven’t seen a new company come into the market. Although, it is unlikely for a
new company to gain market share in this industry, you still have to be aware of the
possibility of new products entering the industry. This is the main threat of new
entrants.
Competitive Force 3: Threat of Substitute Products
In this modern technology era that we live in today, technology companies
service the everyday and practical needs of the consumer. In most businesses and
homes today, people use some form of computers, software, printers, networks,
cameras and televisions. There is currently no substitution for these sophisticated
devices unless you resort to the old technology. The problem is that we rely upon the
technologies of these new devices in our everyday day lives.
Before the invention of the computer, the most commonly used mechanical
device in the business world was the typewriter. Many people do not use this
substitution to the computer in this day and age. The computer took over the
typewriter long ago and will continue to be the most popular tool for consumers in the
future. The invention of the digital camera has paved the way for a whole new line of
home accessories for home photography. Digital cameras have replaced the old 35 mm
11
cameras that were used by every family just ten year ago. There is currently no
substitution for the quality and the convenience of the cameras produced today.
Overall, you could say there are limited threats of substitute products currently in
this industry. While new products are invented regularly, it is hard to think of
something that has the possibility of replacing the computer all together. It also seems
that a digital camera is a technologically advanced as it is going to get for a good
amount of time. For this reason, there is a limited threat of substitute products.
Competitive Force 4: Bargaining Power of Buyers
Factors that affect the bargaining power of buyers are price sensitivity and
relative bargaining power. The computer industry is comprised of several other
companies such as Apple, Dell, Hewlett Packard, and Gateway. Some of these
companies specialize only in producing computers; while others produce computers
along with other electronic products such as printers, cameras, and other hardware.
Each company needs to be aware of their buyers through their price sensitivity and the
bargaining power of buyers.
Price sensitivity determines the extent buyers choose to bargain on price.
Buyers are typically less-price sensitive because of the amount of differentiated
products. The buyers’ price sensitivity also depends on the importance of the product
to the buyer. For example, computers are used every day in people’s lives. This makes
the computer industry very valuable to customers. In return the buyers are going to be
sensitive to the price of the product due to the importance of the product in their lives.
This causes the buyer to shop around more for a similar product at a better price. The
shows that buyers are price sensitive, which encourages other companies to compete
for a lower price and better quality. Some computer companies such as Hewlett
Packard already compete on quality. The importance of the product quality to the
buyers determines whether or not price becomes an important determinant in the
buying decision.
Buyers have a relatively strong bargaining power in the computer industry. A
buyers’ relative bargaining power depends on volume of purchases bought by a single
12
buyer, number of alternative product available to the buyer, and buyer’s cost of
switching from one product to another. First, there are several major electronic stores,
such as Best Buy and Circuit City, which carry a large quantity and variety of
computers. This makes stores product cost of computers cheaper because they can
purchase a large inventory at one time. Buyers also have strong bargaining power
because there are several computer companies in the industry, all with a similar product
that performs similar functions. This allows the buyer to “shop around” for the best
deal on a computer. The switching cost is relatively low because most software
programs can run on any computer. Also, other electronic items such as cameras and
printers are compatible to be set up on any brand of computer.
Buyers relative bargaining power depends on volume of purchases buy a single
buyer, number of alternative product available to the buyer, and buyer’s cost of
switching from one product to another. Buyer’s bargaining power also increases due to
the number of alternative products available. Local electronic stores have high
competition from products that offer the same hardware but at a cheaper price. Buyers
benefit from the number of alternative products available and the competitiveness of
the companies. Overall in the computer industry buyers have a relatively strong
bargaining power.
Competitive Force 5: Bargaining Power of Suppliers
Suppliers are powerful when there are few substitutes, the product is critical for
buyer’s business, and when they pose a credible threat of forward integration.
Suppliers are most powerful when there are only a few companies and few substitutes
available to their customers. The computer industry has several companies that all
produce similar products that are needed by the customers for their daily business.
Suppliers are powerful when there are only a few companies and few substitutes
available to their customers. In this industry, suppliers show a low bargaining power
due to the amount of substitutes available. Several companies such as Apple, Dell,
Hewlett Packard, and Gateway all produce computers that compete with each other.
Each computer company is very powerful over their suppliers of hardware for the
13
computer. There are several companies and several substitutes available to the
customers which make the supplier’s bargaining power low.
Suppliers also have power over buyers when the suppliers’ product or services is
critical to buyers’ business. Suppliers realize that technology is leading the world today.
From calculators to personal computers, the human population is relying more on
technology for everyday use. This lets suppliers control the industry price. Even
though there is intense competition in the computer industry, suppliers realize how
important computers are to everyday business and can maintain a sustainable price to
meet the demand.
There is very little threat from the suppliers to forward integrate. The threat is
minimal because Intel, AMD, and Microsoft can not sell directly to customers because
they do not make personal computers, imaging devices, or servers. For the competitors
to advance in this area it would cost too much and there are too many disadvantages
due to barriers of entry.
Suppliers have high bargaining power when there are few substitutes, the
product is critical for buyer’s business, and when they pose a credible threat of forward
integration. Suppliers have a low bargaining power when it comes to substitutes
products, but are able to maintain an overall high bargaining power because computers
are critical to everyday business. Although suppliers possess little integrations and high
competition, they still maintain a high bargaining power through the high demand for
technology.
Value Chain Strategies
Firms within an industry need to be able to identify their competitive advantage
through either cost leadership or product differentiation. In order to attract a premium
price to customers, there needs to be adequate company differentiation or cost
leadership within the industry. The computer industry focuses mainly on differentiating
their products.
14
Differentiation plays a vital role in adding value to the industry. There is a large
demand, by customers, in the computer industry. Every year new products enter into
the market that customers either want or think they have to have. The high demand
for technology has led to many firms being present in this industry. Several firms make
the same product which is why it is so important for the industry to be able to
differentiate their products. These companies aggressively compete on price
competition, quality, and customer service, which allows for differentiation.
Some drivers of industry are product quality, product variety, and delivery
timing. Hewlett-Packard is a good example of product quality and variety. They
specialize in making a variety of high quality products. Dell, on the other hand, does
not sell their products in a store; they have chosen to focus on their sales through the
internet and phone orders. Because of this Dell has to offer fast delivery and timing.
These drivers all help to set the firms apart in the industry.
The computer industry needs unique firms in order to differentiate their
computers. In order for the computer industry to differentiate their products firms
must identify the attributes, meet the needs of customers, and differentiate at a lower
price than the customer is willing to pay. Computers typically meet the needs of
customers because they can perform more functions faster and easier than a person
can do. Most computers can perform the same tasks, but they all have different
functions and specializations. Apple is an example of a firm that specializes their own
software. Apple is the only firm with their own operating system; the other firms
operate using Microsoft Windows. One of the most important factors of differentiation
is being able to differentiate at a price lower than the customer is willing to pay. Firms
that compete on differentiation still need to focus on costs so that the differentiation
can be achieved at an acceptable cost.
In order for a firm to have industry power, they need to maintain their
competitive advantage. Once this advantage is created, firms need to maintain
creativity and innovation to continue with their advantage.
Creating a Competitive Advantage
15
Each segment in the five factor model is characterized by vigorous competition,
long established companies, and a large number of rapidly growing firms. Hewlett-
Packard strives to compete primarily on what they consider their core competencies of
technology, performance, price, quality, and reliability. With these strengths the
company has been able to be an industry leader in each of their principal business
segments. In this industry, product lives are short, and to remain competitive Hewlett-
Packard must develop new products and services, as well as continually enhance their
existing products and services.4
Product differentiation plays a large role in creating value within Hewlett-
Packard. HP has a product line that ranges from desktop computers to servers to
digital entertainment. Hewlett-Packard has successfully spanned their range of
products and product categories. This allows customers to enjoy a broad range of
digital entertainment experiences, while enjoying the same brand recognition. They
have also been able to target their businesses to individual customer segments, while
also targeting small and medium businesses to large enterprises.4
Hewlett-Packard is a company of high quality specialized products. In an
industry with so many competitors, they have chosen a differentiation strategy.
Hewlett-Packard chose to differentiation their products by focusing on performance,
quality, reliability, and price. They can offer a high quality durable product at a price a
everyone can afford. Hewlett-Packard does not have cost leadership because they do
not have the lowest cost, but they do have a low cost for the quality and functions of
their product.
Hewlett-Packard’s competitive advantage in the compute industry comes from
their product differentiation. Hewlett-Packard has successfully created a product line
that has been able to reach a wide variety of customers in the consumer and
commercial customer groups. HP has continued to strengthen its company while
focusing on differentiating its product’s technology, performance, quality and reliability.
A strong quality that Hewlett-Packard possesses has been its ability to bring its product
line together. All of Hewlett-Packard’s products in one way or another are
complimentary to each other. Most competitors in this industry have found themselves
16
focusing on one strong product; such as, Dell with their computers or Canon with their
digital imaging equipment. Hewlett-Packard has been able to have success in all of
their product segments, including their commercial and consumer computers,
workstations, handheld computing, and digital entertainment.
Using differentiation as a competitive advantage has allowed Hewlett-Packard to
set itself apart from the industry as a whole. While HP does not have the lowest cost in
the industry, they continue to strive to cut costs wherever possible. Combining this
effort with their product differentiation strategy has allowed Hewlett-Packard to become
a recognizable brand, and ultimately made them an industry leader.
Accounting Analysis
The purpose of accounting analysis is to evaluate the degree to which a firm’s
accounting captures the underlying business reality.3 Hewlett-Packard is in the
Diversified Computer Systems industry making it important to focus on strategic
necessities within the individual product categories and then manage across the entire
portfolio to drive growth while optimizing cost structure.4 Hewlett-Packard prepares its
Financial Statements under the Generally Accepted Accounting Principles standards,
which states that management must make estimates, judgments and assumptions
which would affect the disclosure of their assets and liabilities. Hewlett-Packard
management has a thorough process of making these estimates, which are vital to the
overall outcome of the company. These estimates are based on past experiences,
along with other assumptions that they must make due to the ambiguous parts of
accounting that are not readily available from other sources. After this step, the Audit
Committee and senior management of Hewlett-Packard discuss the estimates at hand,
and how to disclose this information.
Key Accounting Policies
Hewlett-Packard makes many significant estimates and assumptions in different
areas for the overall preparation of their Financial Statements. They then choose the
information to be publicized, with the necessary revisions added. Being that Hewlett-
17
Packard is reliant upon having such a differentiated product line, it is important for
them to disclose their accounting information to reflect this strategy. Differentiation is a
main competitive strategy for Hewlett-Packard, making the key accounting policies:
research and development, goodwill, warranty provisions and inventory management.
Hewlett-Packard falls into an industry that is highly reliant upon research and
development. In order to keep up with the ever changing technology, Hewlett-Packard
spends a large amount of time and money on research and development, making it one
of the most important success factors. Spending time on R&D allows Hewlett-Packard
to deliver the most modern technology to the consumer’s changing needs. Hewlett-
Packard spends more time in research and development than their competitors to
follow their business model, which promotes innovation and high quality.4 HP Labs, a
part of the Corporate Investments Segment, is in charge of the research and
development for the company. Research and development is expensed as incurred.
Even though this research and development generates future sales, Hewlett-Packard
decides to write it off as an expense rather than record it as an asset. In fiscal year
2005, HP expensed $3.5 billion in research and development.
Goodwill is another part of Hewlett-Packard’s key financial reporting policies.
According to SFAS No, 142, “Goodwill and Other Intangible Assets”, goodwill is valued
with an indefinite life with annual impairments. In Hewlett-Packard’s case, the
impairment of goodwill is a two step process beginning with comparing the fair value of
each reporting unit with its carrying value. The fair value is determined by weighting
the income and market approaches. If the carrying value of net assets exceeds the fair
value, then the second step must be performed. The amount it exceeds is then
recorded as an impairment loss. The fair values, which are used in these comparisons,
are estimated using an income approach. Estimating the revenue growth rates and
operating margins, risk adjusted discount rates, assumed royalty rates, future economic
and market conditions and determining the appropriate market comparables is
necessary in finding the fair and carrying values. These estimates are based upon
assumptions.
18
Being a retail company, it is important to have a strong inventory management.
Hewlett-Packard succeeds in this area, having a large amount of control of how the
inventory is reported. This is very apparent in their decision to use the first-in-first-out
method when keeping track of their inventory. The first-in-first-out method assumes
that the first unit entered into inventory will also be the first to be sold. This keeps the
company’s inventory costs down in times of high costs. Another advantage to using
FIFO is that this method keeps the cost of goods sold lower, allowing the company’s net
income to increase. Using this method can also decrease the amount of income tax the
company will be held accountable for at year end. Since technology is such a major
influence in this industry, and is rapidly changing, Hewlett-Packard benefits from using
the first-in-first-out accounting method. This benefit arises from the ability to get the
latest and most up to date product out in the market, before it becomes obsolete. This
is noticeably seen in the financial statements of Hewlett-Packard.
These key accounting policies, which Hewlett-Packard uses, parallel with the
company’s competitive strategy of differentiation. The accounting policies allow
Hewlett-Packard to attempt to make the most accurate estimates and financial reports.
Assess Accounting Flexibility
Under the GAAP guidelines, firms are subject to different degrees of accounting
flexibility. The amount and detail to which a firm discloses their financials to investors,
is left to the management’s discretion. This management team must work together and
approve their decisions with the Audit Committee of Hewlett-Packard’s Board of
Directors.
Research and development is an important aspect of Hewlett-Packard’s
accounting policies, however there is no management discretion in how this is reported.
Research and development must be expensed as it is incurred. Since there is no
flexibility in how this is reported, there cannot be any chance for the management to
manipulate these numbers in order to benefit the standing of the company.
19
With research and development comes the opportunity for acquisitions. Hewlett-
Packard has had some major acquisitions such as Triaton GmbH, Triaton France SAS
and Triaton N.A., Inc. These additions to Hewlett-Packard would obviously affect the
accounting records of the following years. A good example of this effect is in 2001,
when Hewlett-Packard acquired Compaq. The next year the company’s asset’s doubled
and the net revenue increased by 25%. This means that HP began incorporating
Compaq’s sales into their net revenues and not as a separate entity. Without the
previous knowledge of the acquisition of Compaq the substantial increase in sales would
be a red flag to investors.
Inventory management is an area which is highly flexible at the company’s
discretion. While Hewlett-Packard practices the method of first-in-first-out, there are
other ways to record inventory. These ways include last-in-first-out and average cost.
In the technology industry, using first-in-first-out is the most relevant method. If the
company used last-in-first-out, they would be distributing the oldest inventory held,
while the newest technology would be gathering in inventory. Although Hewlett-
Packard has chosen a method which ultimately helps their company, there is still that
option to choose how you want to account for inventory.
“Goodwill and Other Intangible Assets” is outlined by the Statement of Financial
Accounting Standards, No. 142. This properly defines the methods in which goodwill
and intangible assets should be accounted for. This allows no flexibility within the
company, because the standards are laid out for you. The problem with Statement No.
142, is that all of these values are based solely on estimates. There is great room for
error when using this standard accounting process.
The key accounting policies for Hewlett-Packard vary in flexibility. Some remain
very flexible, while the majority do not allow for flexibility. Flexibility allows company’s
to gain an advantage when reporting. Although this is true, accounting requires strict
standards and consistency in order for financial reporting to be valuable.
Evaluate Accounting Strategy
20
Hewlett-Packard gives a very thorough disclosure of their accounting policies and
financial information to the public. A very conservative approach is taken when
reporting annual numbers. This type of approach gives a realistic view of the
company’s financials, without attempting to distort their company’s financial standing.
You can see this through comparisons with competitors’ reports, historical data and
auditor’s analysis.
Hewlett-Packard’s conservative approach to accounting can be seen through
their compliance with Generally Accepted Accounting Principles (GAAP). When GAAP
does not provide standards, Hewlett-Packard tends to follow the industry norm. This
can be seen through the similarities between the discussed computer industry
competitors.
Hewlett-Packard’s main competitors, in the computer section of their multi-
product industry, are Dell and Apple. Mainly, the accounting policies of these three
firms are consistent with each other. Hewlett-Packard, along with Apple and Dell, use
the first in first out method when accounting for inventory. These three companies also
recognize revenues when the items are delivered and there is a final acceptance of the
good. Another similarity between these companies is the use of SFAS No. 142 when
dealing with their Goodwill and Other Intangible Assets. The only difference we found
between Hewlett-Packard’s competitors is that they use straight-line depreciation based
on a thirty year time frame for buildings, and two-five year time frame for equipment.
Hewlett-Packard, on the other hand, uses a time frame of five to forty years, based on
the asset being depreciated.
Management has the opportunity to manipulate accounting strategies and
choose what they disclose. If management has the incentive to distort accounting
policies, it adds another area which must be thoroughly assessed. Management,
including the CEO, CFO and other chief executives receive stock options on a yearly
basis. This gives management some incentive to imply that their company may be
doing better than they are. The Compensation Committee established a performance
metrics for the first and second halves of the fiscal 2005, respectively, which were
weighted 40% based on revenue, 40% based on net profit and 20% based on total
21
customer experience for the executive officers.4 Since 20% of this compensation is
based on consumer experience, it leads to the belief that Hewlett-Packard’s
management would not distort their accounting strategies, in order to keep their
customer satisfaction.
Hewlett-Packard has had many policy changes within their company in the past
few years. In 2003, Hewlett-Packard encountered a large restructuring charge of $752
million. With this came new plans to better implement cost structure and business
operations. The 2004 financials demonstrate the effects of these changes. Another
management improvement plan involved the termination of about 1,450 employees,
which was finalized as of October 31, 2005.4 With this reorganization came a charge of
$109 million in severance and other related costs. $87 million of this amount has been
paid as of October 31, 2005, and the difference is expected to be paid off by the end of
fiscal 2006. Also at the end of 2005, the Board of Directors approved another
restructuring plan to reduce costs. Under this plan, roughly 15,300 employees will be
terminated through the first quarter of fiscal 2007.4 This plan is estimated to cost
Hewlett-Packard $1.6 billion. The last change of strategy for Hewlett-Packard, was the
reduction of retirement programs, effective January 1, 2006. With this came a
curtailment gain of $199 million in the fourth quarter of fiscal 2005.
One of the most recent acquisitions under Hewlett-Packard has been that of
Compaq computers. This acquisition led to many changes in the financial reports
between 2001 and 2002. This is obviously shown in the total assets, and explained in
the footnotes of the 10-K. Other than this, Hewlett-Packard does not have any other
related entities that have affected their accounting position.
Hewlett-Packard’s accounting strategy is very unique along with sharing some
characteristics with their competition. These techniques allow for HP to do a very
thorough accounting disclosure.
Qualitative Disclosure
22
It is the discretion of the management to choose how easy or difficult it is to find
information in the company’s financial reports. Many people access these reports on a
daily basis whether it is an auditor, another analyst or even stockholder. When the
information is clear and easy to identify, it makes a huge difference.
Hewlett Packard is a company interested in putting their stockholders at ease by
having unsurpassed quality of disclosure. In their annual 10K, they explain in great
detail the reasoning for their accounting choices in recording revenues and expenses.
Also contained in the 10K is a candid and very frank report of their risk management
strategies, which include managing foreign currency exchange rate risk, interest rate
risk, and equity price risk. Their strategy is to use derivative financial instruments to
“manage existing underlying exposures of HP”, not on speculative purposes.4 In
addition to this, their 10K has a long listing of footnotes that outlines and explains their
choices in accounting and revenue allocation. For example, in the footnote titled
Reclassifications and Segment Reorganization, they go into great detail outlining their
information technology infrastructure. Hewlett-Packard reclassified the division’s cost of
services and administrative expenses to costs of products, services, and research and
development expenses to better reflect the cost of their active areas to better reflect
the cost allocation in each of these underlining areas. This results in an increase in cost
of sales and an equal decrease in operating expenses.
Their business strategy has always been very diverse due to their vast portfolio.
Hewlett-Packard operates under seven business segments: Enterprise Storage and
Servers, HP Services Software, Personal Systems Group, Imaging and Printing Group,
HP Financial Services, and Corporate Investment. Outlined in their 10K is a detailed
description of revenues and growth for each of the business segments. Hewlett-
Packard is a global technology company, and they are always studying trends in the
market place to maintain their competitive edge and increase profits. In the firm’s
Management Discussion and Analysis section of their 10K, they even go on to talk about
workforce restructuring and reinvesting half of the cost savings from the downsizing
back into the firm. In addition to this, HP is also very forthright in the disclosing of bad
news. In the segment titled Losses on Investments, the firm speaks openly about
23
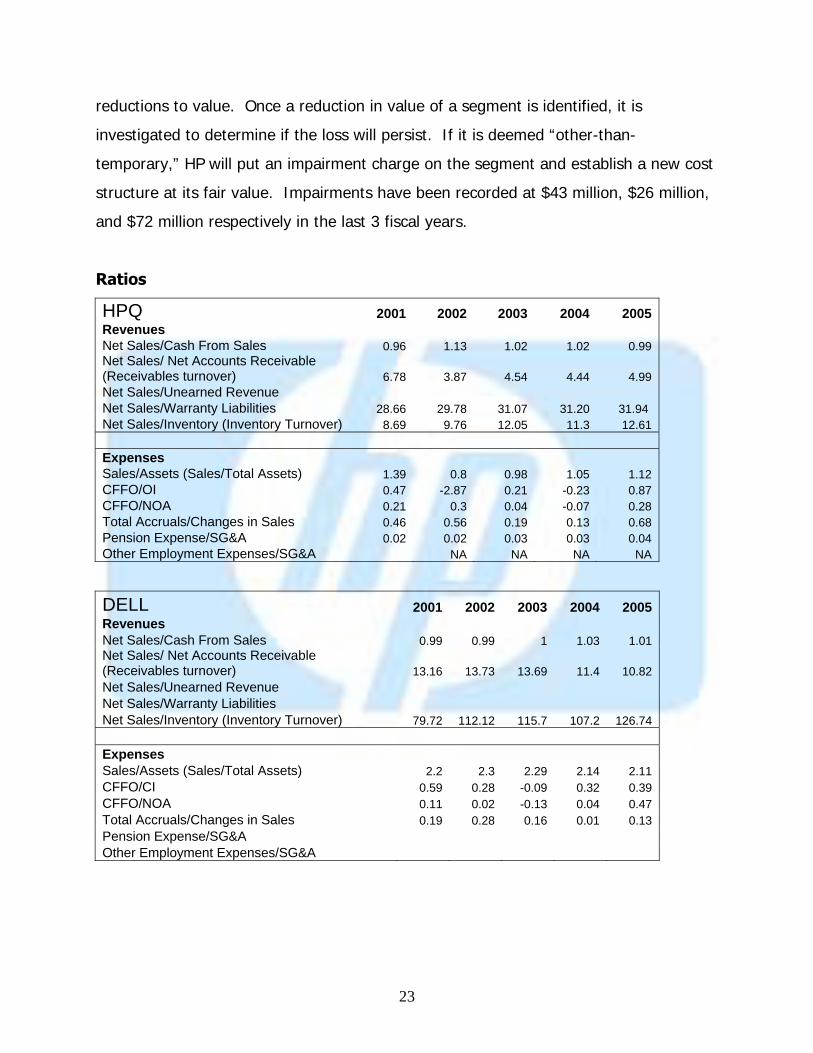
reductions to value. Once a reduction in value of a segment is identified, it is
investigated to determine if the loss will persist. If it is deemed “other-than-
temporary,” HP will put an impairment charge on the segment and establish a new cost
structure at its fair value. Impairments have been recorded at $43 million, $26 million,
and $72 million respectively in the last 3 fiscal years.
Ratios
HPQ 2001 2002 2003 2004 2005 Revenues Net Sales/Cash From Sales 0.96 1.13 1.02 1.02 0.99 Net Sales/ Net Accounts Receivable (Receivables turnover) 6.78 3.87 4.54 4.44 4.99 Net Sales/Unearned Revenue Net Sales/Warranty Liabilities 28.66 29.78 31.07 31.20 31.94 Net Sales/Inventory (Inventory Turnover) 8.69 9.76 12.05 11.3 12.61 Expenses Sales/Assets (Sales/Total Assets) 1.39 0.8 0.98 1.05 1.12 CFFO/OI 0.47 -2.87 0.21 -0.23 0.87 CFFO/NOA 0.21 0.3 0.04 -0.07 0.28 Total Accruals/Changes in Sales 0.46 0.56 0.19 0.13 0.68 Pension Expense/SG&A 0.02 0.02 0.03 0.03 0.04 Other Employment Expenses/SG&A NA NA NA NA
DELL 2001 2002 2003 2004 2005 Revenues Net Sales/Cash From Sales 0.99 0.99 1 1.03 1.01 Net Sales/ Net Accounts Receivable (Receivables turnover) 13.16 13.73 13.69 11.4 10.82 Net Sales/Unearned Revenue Net Sales/Warranty Liabilities Net Sales/Inventory (Inventory Turnover) 79.72 112.12 115.7 107.2 126.74 Expenses Sales/Assets (Sales/Total Assets) 2.2 2.3 2.29 2.14 2.11 CFFO/CI 0.59 0.28 -0.09 0.32 0.39 CFFO/NOA 0.11 0.02 -0.13 0.04 0.47 Total Accruals/Changes in Sales 0.19 0.28 0.16 0.01 0.13 Pension Expense/SG&A Other Employment Expenses/SG&A
24
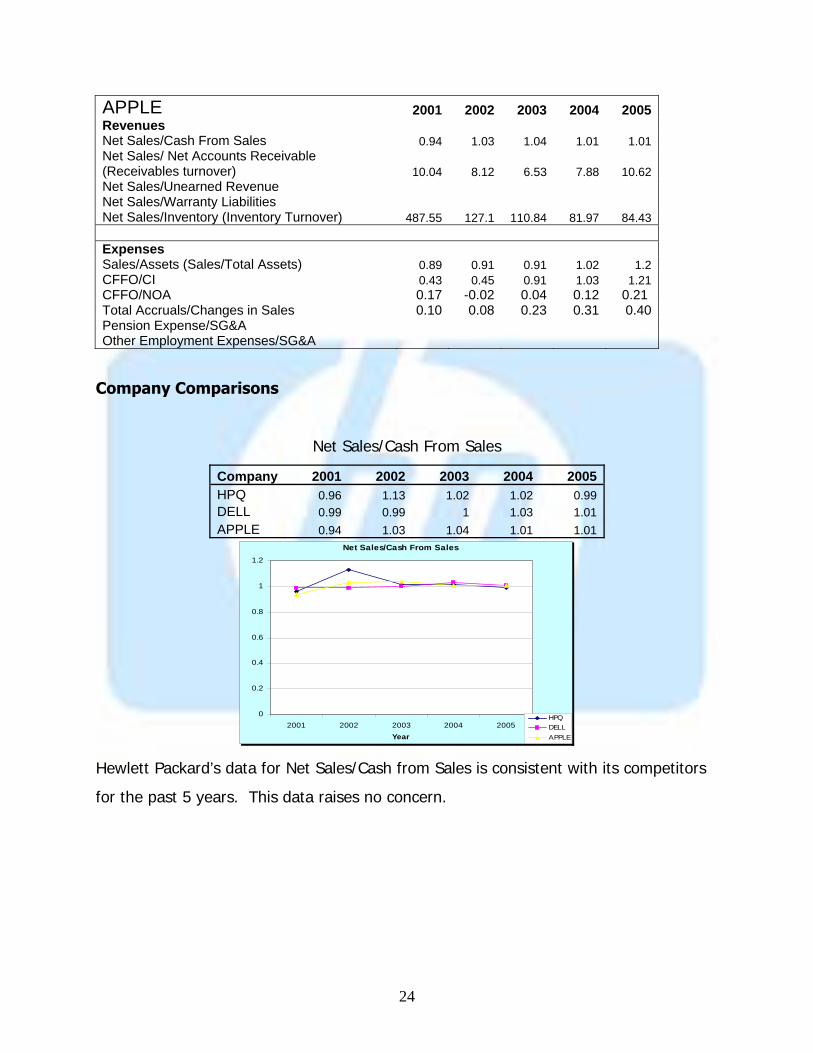
APPLE 2001 2002 2003 2004 2005 Revenues Net Sales/Cash From Sales 0.94 1.03 1.04 1.01 1.01 Net Sales/ Net Accounts Receivable (Receivables turnover) 10.04 8.12 6.53 7.88 10.62 Net Sales/Unearned Revenue Net Sales/Warranty Liabilities Net Sales/Inventory (Inventory Turnover) 487.55 127.1 110.84 81.97 84.43 Expenses Sales/Assets (Sales/Total Assets) 0.89 0.91 0.91 1.02 1.2 CFFO/CI 0.43 0.45 0.91 1.03 1.21 CFFO/NOA 0.17 -0.02 0.04 0.12 0.21 Total Accruals/Changes in Sales 0.10 0.08 0.23 0.31 0.40 Pension Expense/SG&A Other Employment Expenses/SG&A
Company Comparisons
Net Sales/Cash From Sales
Company 2001 2002 2003 2004 2005 HPQ 0.96 1.13 1.02 1.02 0.99 DELL 0.99 0.99 1 1.03 1.01 APPLE 0.94 1.03 1.04 1.01 1.01
Net Sales/Cash From Sales
0
0.2
0.4
0.6
0.8
1
1.2
2001 2002 2003 2004 2005Year
HPQDELLAPPLE
Hewlett Packard’s data for Net Sales/Cash from Sales is consistent with its competitors
for the past 5 years. This data raises no concern.

25
Net Sales/Net Accounts Receivable
Company 2001 2002 2003 2004 2005 HPQ 6.78 3.87 4.54 4.44 4.99 DELL 13.16 13.73 13.69 11.4 10.82 APPLE 10.04 8.12 6.53 7.88 10.62
Net Sales/Net Accounts Recievables
0
2
4
6
8
10
12
14
16
2001 2002 2003 2004 2005
Year
HP
DELL
APPLE
Hewlett Packard’s data for Net Sales/Net Accounts Receivables remains at a low rate.
The data stays within a small range and shows good numbers for a company of its size.
The competitors ratio is a little higher, however raises no concern due to being smaller
corporations.
Net Sales/Inventory
Company 2001 2002 2003 2004 2005 HPQ 8.69 9.76 12.05 11.3 12.61 DELL 79.72 112.12 115.7 107.2 126.74 APPLE 487.55 127.1 110.84 81.97 84.43
Net Sales/Inventory
0
100
200
300
400
500
600
2001 2002 2003 2004 2005
HP
DELL
APPLE
26
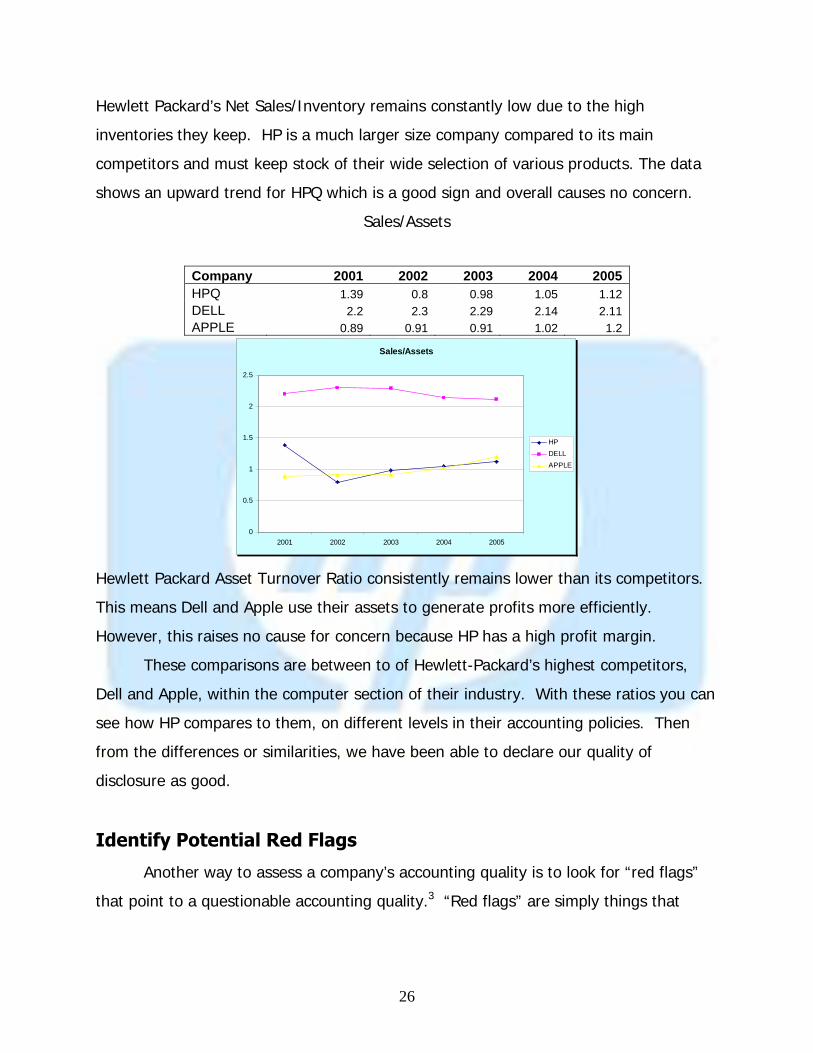
Hewlett Packard’s Net Sales/Inventory remains constantly low due to the high
inventories they keep. HP is a much larger size company compared to its main
competitors and must keep stock of their wide selection of various products. The data
shows an upward trend for HPQ which is a good sign and overall causes no concern.
Sales/Assets
Sales/Assets
0
0.5
1
1.5
2
2.5
2001 2002 2003 2004 2005
HPDELLAPPLE
Hewlett Packard Asset Turnover Ratio consistently remains lower than its competitors.
This means Dell and Apple use their assets to generate profits more efficiently.
However, this raises no cause for concern because HP has a high profit margin.
These comparisons are between to of Hewlett-Packard’s highest competitors,
Dell and Apple, within the computer section of their industry. With these ratios you can
see how HP compares to them, on different levels in their accounting policies. Then
from the differences or similarities, we have been able to declare our quality of
disclosure as good.
Identify Potential Red Flags
Another way to assess a company’s accounting quality is to look for “red flags”
that point to a questionable accounting quality.3 “Red flags” are simply things that
Company 2001 2002 2003 2004 2005 HPQ 1.39 0.8 0.98 1.05 1.12 DELL 2.2 2.3 2.29 2.14 2.11 APPLE 0.89 0.91 0.91 1.02 1.2
27
stand out to analysts, good or bad. These items will then be looked at closer to find
out why that particular event occurred.
Hewlett-Packard steered clear of red flags by properly disclosing their financial
data and using notes to support misaligned data. In 2002, 2003, and 2004 there was
substantial increase of costs that might raise red flags. The increase in amortization
expense in the fiscal years 2002 to 2004 are primarily due to amortization of intangible
assets. HP acquired Triaton GmbH, Triaton France SAS and Triaton N.A., Inc. (USA) in
2004 and Compaq in 2002.10 This increase might raise potential red flags due to the
offset by elimination of goodwill amortization, and the write-off of purchased intangible
assets related to the Compaq acquisition.
Expenses incurred during the fiscal period 2002 to 2004, contained substantial
costs due to the Compaq acquisition. Acquisition related charges in fiscal year 2004
consisted primarily of the amortization of deferred compensation, merger-related
inventory adjustments, and professional fees. Costs in fiscal year 2003 and 2002 were
attributed primarily to costs incurred for employee retention bonuses, professional fees
and consulting services. Other charges in fiscal year 2002 also included costs incurred
for proxy solicitation and advertising for the Compaq acquirement.10 Hewlett-Packard
recorded approximately $1.2 billion of restructuring liability as part of the acquisition of
Compaq. It was allocated as a liability of the original purchase price in fiscal year 2002.
Approximately $960 million of this amount related to pre-merger expenses and $259
million was related to pre-existing Compaq restructuring liabilities.10 These Compaq
related restructuring plans have been recorded as decreases to Compaq-related
goodwill and increases have been recorded as restructuring expense.10 After the
purchase of Compaq, Hewlett-Packard implemented strategic restructuring programs to
align Compaq and Hewlett Packard.
The restructuring program lasted for a three year period ending on October 31,
2004. When net restructuring charges ended, they totaled approximately $2.7 billion
during fiscal years 2002 to 2004. The majority of restructuring charges in fiscal 2004
represent charges from fiscal year 2003 because the expenses did not meet the
recognition criteria for accrual during 2003. These charges were primarily related to
28
asset impairments for buildings vacated after the purchase of Compaq. Hewlett-
Packard leases the majority of their buildings. During the acquisition, Hewlett-Packard
had to convert into Compaq’s space, sell the property, or cancel/finish lease
agreements. On October 31, 2004, the restructuring program ended and the financial
statements returned to normal in the fiscal year2005. Hewlett-Packard’s biggest
impairment of vacated buildings finally balanced out in 2005. In 2005, Hewlett-Packard
owned 39% of building space and leased the remaining 61% of space.10 The goal of
the restructuring programs put in play after the acquisition of Compaq, has been to
reduce costs by removing duplication and leverage the benefits for Hewlett-Packard.
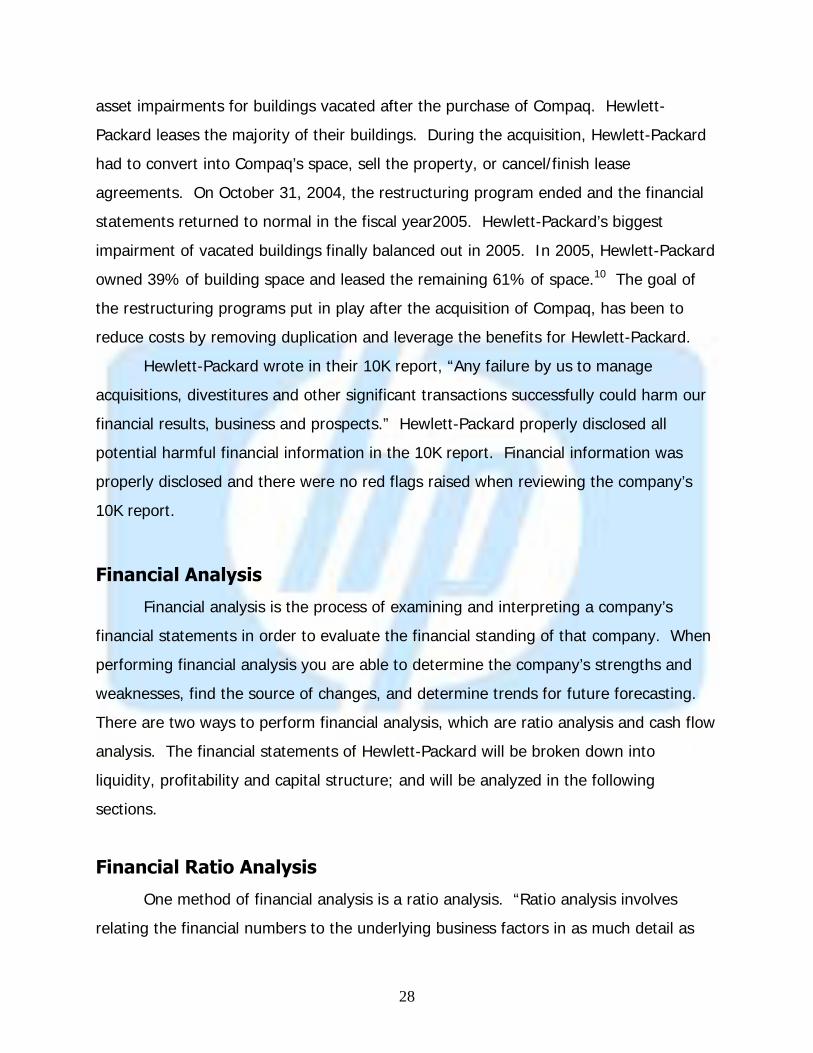
Hewlett-Packard wrote in their 10K report, “Any failure by us to manage
acquisitions, divestitures and other significant transactions successfully could harm our
financial results, business and prospects.” Hewlett-Packard properly disclosed all
potential harmful financial information in the 10K report. Financial information was
properly disclosed and there were no red flags raised when reviewing the company’s
10K report.
Financial Analysis
Financial analysis is the process of examining and interpreting a company’s
financial statements in order to evaluate the financial standing of that company. When
performing financial analysis you are able to determine the company’s strengths and
weaknesses, find the source of changes, and determine trends for future forecasting.
There are two ways to perform financial analysis, which are ratio analysis and cash flow
analysis. The financial statements of Hewlett-Packard will be broken down into
liquidity, profitability and capital structure; and will be analyzed in the following
sections.
Financial Ratio Analysis
One method of financial analysis is a ratio analysis. “Ratio analysis involves
relating the financial numbers to the underlying business factors in as much detail as
29
possible.”3 After the first assessment of ratio analysis, which involves comparing a
companies financials from previous years, it is possible to go further into the process
comparing those numbers to the industry as well.
Trend Analysis
Liquidity
The liquidity of a company is a very important measure when assessing the
company’s overall financial position. Liquidity is the firm’s ability to convert assets into
cash or cash equivalents quickly. Hewlett-Packard’s liquidity will be assessed through a
series of ratios which are ultimately evaluated as a whole.
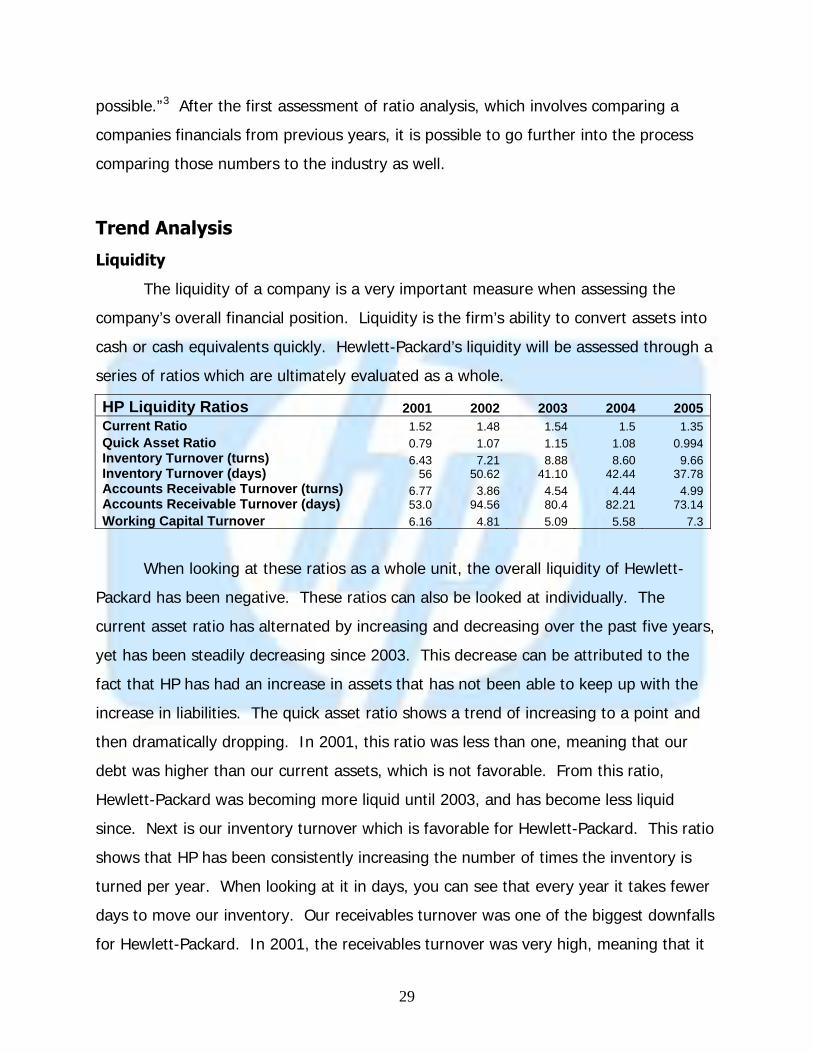
HP Liquidity Ratios 2001 2002 2003 2004 2005Current Ratio 1.52 1.48 1.54 1.5 1.35 Quick Asset Ratio 0.79 1.07 1.15 1.08 0.994 Inventory Turnover (turns) Inventory Turnover (days)
6.43 56
7.21 50.62
8.88 41.10
8.60 42.44
9.66 37.78
Accounts Receivable Turnover (turns) Accounts Receivable Turnover (days)
6.77 53.0
3.86 94.56
4.54 80.4
4.44 82.21
4.99 73.14
Working Capital Turnover 6.16 4.81 5.09 5.58 7.3
When looking at these ratios as a whole unit, the overall liquidity of Hewlett-
Packard has been negative. These ratios can also be looked at individually. The
current asset ratio has alternated by increasing and decreasing over the past five years,
yet has been steadily decreasing since 2003. This decrease can be attributed to the
fact that HP has had an increase in assets that has not been able to keep up with the
increase in liabilities. The quick asset ratio shows a trend of increasing to a point and
then dramatically dropping. In 2001, this ratio was less than one, meaning that our
debt was higher than our current assets, which is not favorable. From this ratio,
Hewlett-Packard was becoming more liquid until 2003, and has become less liquid
since. Next is our inventory turnover which is favorable for Hewlett-Packard. This ratio
shows that HP has been consistently increasing the number of times the inventory is
turned per year. When looking at it in days, you can see that every year it takes fewer
days to move our inventory. Our receivables turnover was one of the biggest downfalls
for Hewlett-Packard. In 2001, the receivables turnover was very high, meaning that it
30
took fewer days for HP to collect their receivables. From 2001-2002, HP more than
doubled it receivables due to the acquisition of a major company, making that years
receivables turnover very low, meaning it took more days to collect this money. Since
2002, it has been improving, but is still at a very high number of days to collect on the
receivables. The last ratio, working capital turnover, was a positive change for HP.
After the decrease in this ratio, due to the major acquisition, HP’s working capital
turnover is steadily increasing. This ratio has a positive impact on the liquidity of
Hewlett-Packard.
The current overall liquidity of Hewlett-Packard is unfavorable. They have a high
receivables turnover in days compared to the industry, the current ratio is declining and
a slow inventory turnover. The only positive ratio in overall liquidity is the working
capital ratio. This shows the overall analysis of HP’s liquidity is negative.
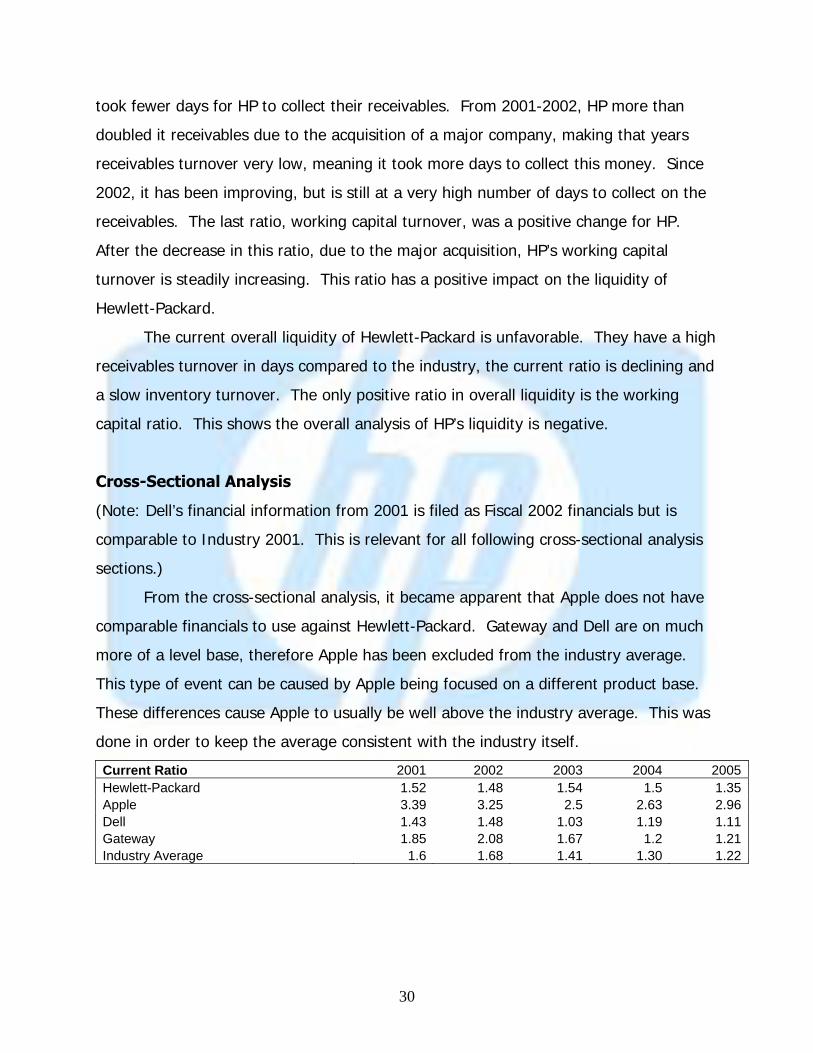
Cross-Sectional Analysis
(Note: Dell’s financial information from 2001 is filed as Fiscal 2002 financials but is
comparable to Industry 2001. This is relevant for all following cross-sectional analysis
sections.)
From the cross-sectional analysis, it became apparent that Apple does not have
comparable financials to use against Hewlett-Packard. Gateway and Dell are on much
more of a level base, therefore Apple has been excluded from the industry average.
This type of event can be caused by Apple being focused on a different product base.
These differences cause Apple to usually be well above the industry average. This was
done in order to keep the average consistent with the industry itself.
Current Ratio 2001 2002 2003 2004 2005Hewlett-Packard 1.52 1.48 1.54 1.5 1.35Apple 3.39 3.25 2.5 2.63 2.96Dell 1.43 1.48 1.03 1.19 1.11Gateway 1.85 2.08 1.67 1.2 1.21Industry Average 1.6 1.68 1.41 1.30 1.22

31
Current Ratio
0
0.5
1
1.5
2
2.5
3
3.5
4
2001 2002 2003 2004 2005
Hewlett-PackardAppleDell GatewayIndustry Average
Current Ratio= Current Assets/Current Liabilities
The current ratio is a way of showing the firm’s short term liquidity. Analysts say
that a current ratio above one shows favorability. When the current ratio is above one
it shows that a firm can cover its current liabilities with their current cash assets. As
shown above, Hewlett-Packard is right at the industry average. They have an average
current ratio of approximately 1.5, which is just above the industrial average. While
analysts believe one is good current ratio, he preferred current ratio by many bankers is
2. This is because too high of a number indicates an excess of unutilized assets, while
too low of a number can imply that there is not enough cash on hand to cover their
liabilities.
Quick Asset Ratio 2001 2002 2003 2004 2005Hewlett-Packard 0.79 1.07 1.15 1.08 0.994Apple 2.91 2.33 2.26 2.96 3.16Dell 1.38 1.4 0.95 1.04 0.94Gateway 1.22 1.34 1.67 1.2 1.21Industry Average 1.13 1.27 1.26 1.11 1.05
32
Quick Asset Ratio
0
0.5
1
1.5
2
2.5
3
3.5
2001 2002 2003 2004 2005
Hewlett-PackardAppleDell GatewayIndustry Average
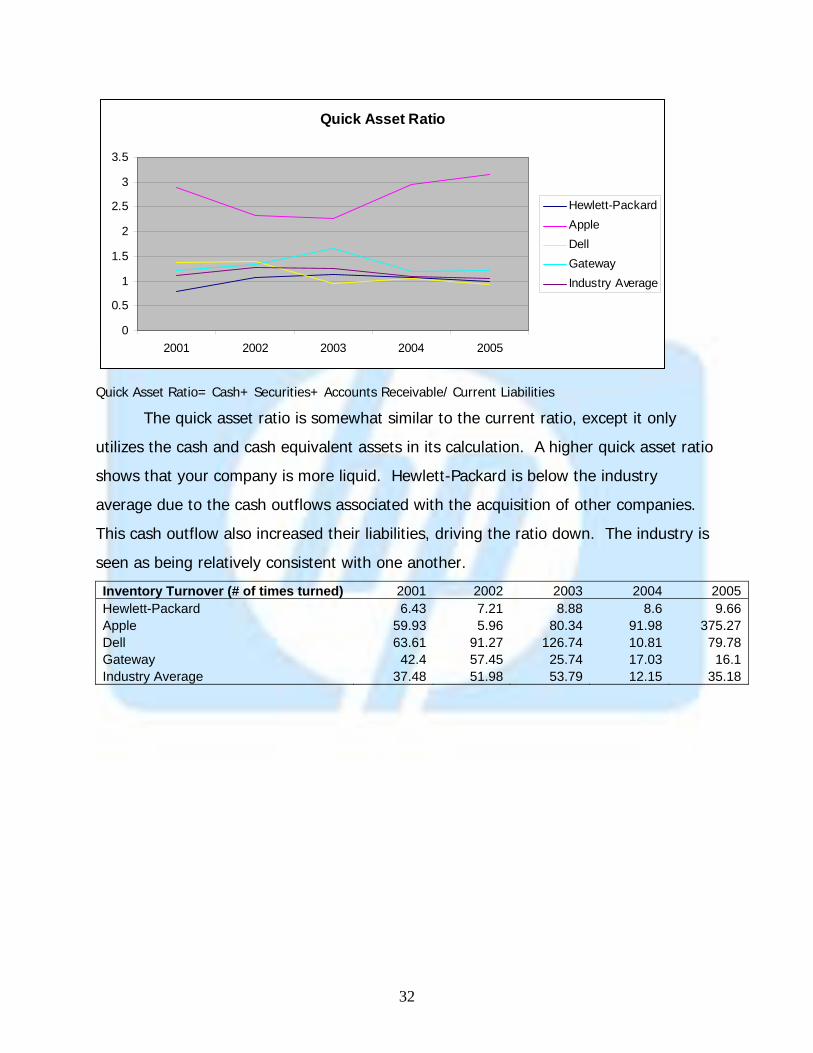
Quick Asset Ratio= Cash+ Securities+ Accounts Receivable/ Current Liabilities
The quick asset ratio is somewhat similar to the current ratio, except it only
utilizes the cash and cash equivalent assets in its calculation. A higher quick asset ratio
shows that your company is more liquid. Hewlett-Packard is below the industry
average due to the cash outflows associated with the acquisition of other companies.
This cash outflow also increased their liabilities, driving the ratio down. The industry is
seen as being relatively consistent with one another.
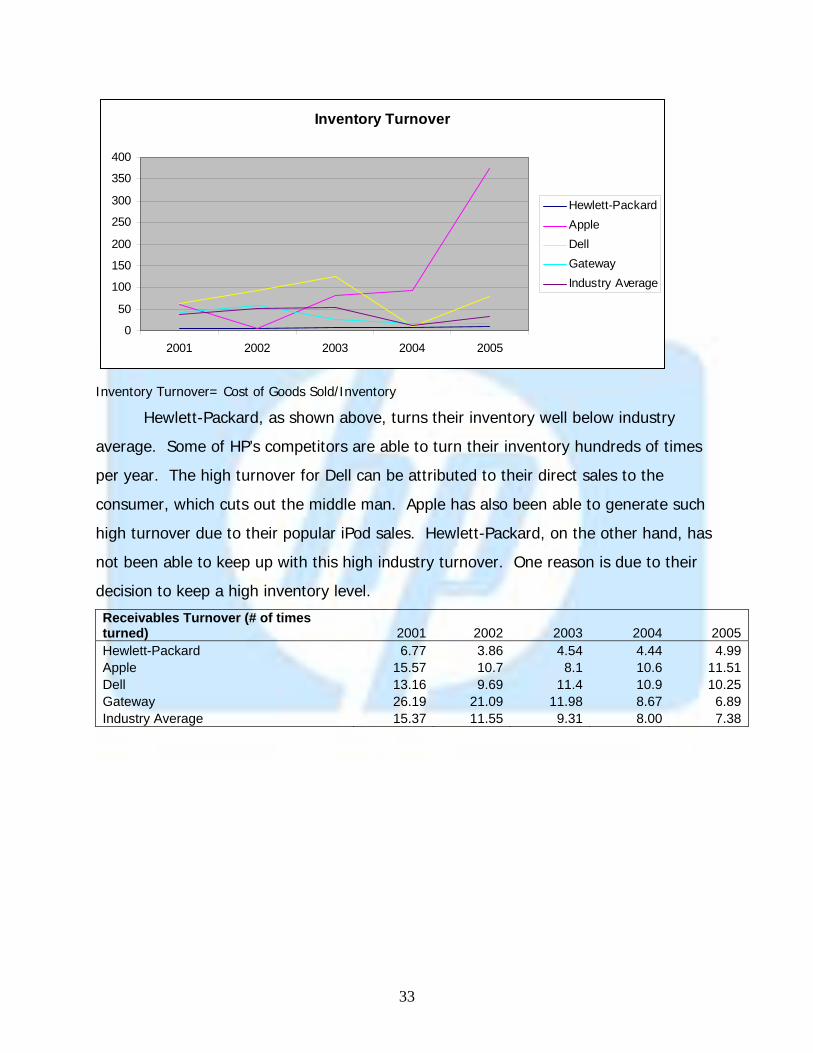
Inventory Turnover (# of times turned) 2001 2002 2003 2004 2005Hewlett-Packard 6.43 7.21 8.88 8.6 9.66Apple 59.93 5.96 80.34 91.98 375.27Dell 63.61 91.27 126.74 10.81 79.78Gateway 42.4 57.45 25.74 17.03 16.1Industry Average 37.48 51.98 53.79 12.15 35.18
33
Inventory Turnover
0
50
100
150
200
250
300
350
400
2001 2002 2003 2004 2005
Hewlett-PackardAppleDell GatewayIndustry Average
Inventory Turnover= Cost of Goods Sold/Inventory
Hewlett-Packard, as shown above, turns their inventory well below industry
average. Some of HP’s competitors are able to turn their inventory hundreds of times
per year. The high turnover for Dell can be attributed to their direct sales to the
consumer, which cuts out the middle man. Apple has also been able to generate such
high turnover due to their popular iPod sales. Hewlett-Packard, on the other hand, has
not been able to keep up with this high industry turnover. One reason is due to their
decision to keep a high inventory level.
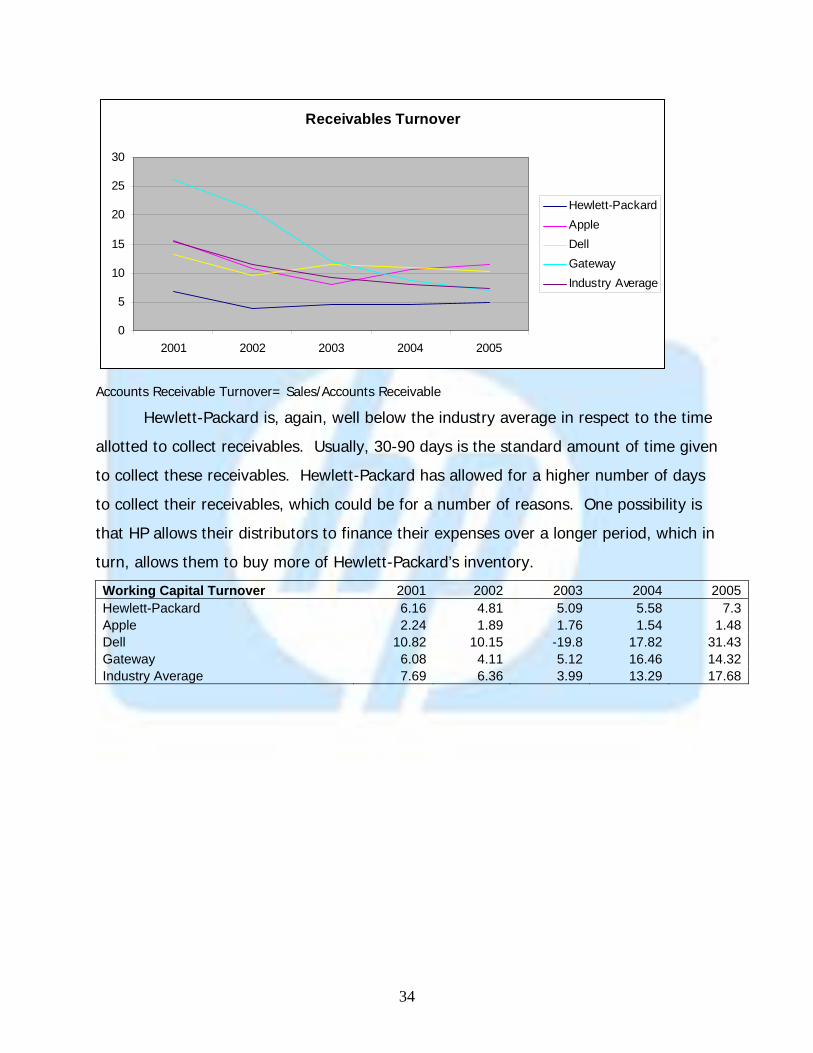
Receivables Turnover (# of times turned) 2001 2002 2003 2004 2005Hewlett-Packard 6.77 3.86 4.54 4.44 4.99Apple 15.57 10.7 8.1 10.6 11.51Dell 13.16 9.69 11.4 10.9 10.25Gateway 26.19 21.09 11.98 8.67 6.89Industry Average 15.37 11.55 9.31 8.00 7.38
34
Receivables Turnover
0
5
10
15
20
25
30
2001 2002 2003 2004 2005
Hewlett-PackardAppleDellGatewayIndustry Average
Accounts Receivable Turnover= Sales/Accounts Receivable
Hewlett-Packard is, again, well below the industry average in respect to the time
allotted to collect receivables. Usually, 30-90 days is the standard amount of time given
to collect these receivables. Hewlett-Packard has allowed for a higher number of days
to collect their receivables, which could be for a number of reasons. One possibility is
that HP allows their distributors to finance their expenses over a longer period, which in
turn, allows them to buy more of Hewlett-Packard’s inventory.
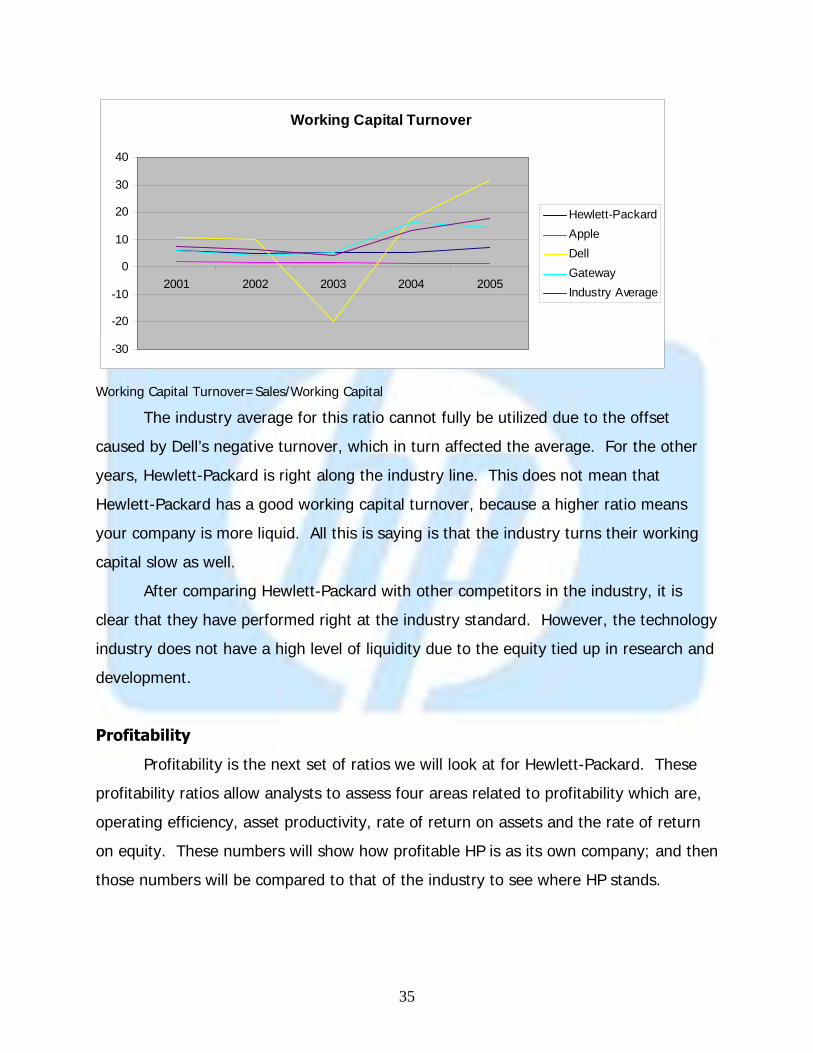
Working Capital Turnover 2001 2002 2003 2004 2005Hewlett-Packard 6.16 4.81 5.09 5.58 7.3Apple 2.24 1.89 1.76 1.54 1.48Dell 10.82 10.15 -19.8 17.82 31.43Gateway 6.08 4.11 5.12 16.46 14.32Industry Average 7.69 6.36 3.99 13.29 17.68
35
Working Capital Turnover
-30
-20
-10
0
10
20
30
40
2001 2002 2003 2004 2005
Hewlett-PackardAppleDellGatewayIndustry Average
Working Capital Turnover=Sales/Working Capital
The industry average for this ratio cannot fully be utilized due to the offset
caused by Dell’s negative turnover, which in turn affected the average. For the other
years, Hewlett-Packard is right along the industry line. This does not mean that
Hewlett-Packard has a good working capital turnover, because a higher ratio means
your company is more liquid. All this is saying is that the industry turns their working
capital slow as well.
After comparing Hewlett-Packard with other competitors in the industry, it is
clear that they have performed right at the industry standard. However, the technology
industry does not have a high level of liquidity due to the equity tied up in research and
development.
Profitability
Profitability is the next set of ratios we will look at for Hewlett-Packard. These
profitability ratios allow analysts to assess four areas related to profitability which are,
operating efficiency, asset productivity, rate of return on assets and the rate of return
on equity. These numbers will show how profitable HP is as its own company; and then
those numbers will be compared to that of the industry to see where HP stands.
36
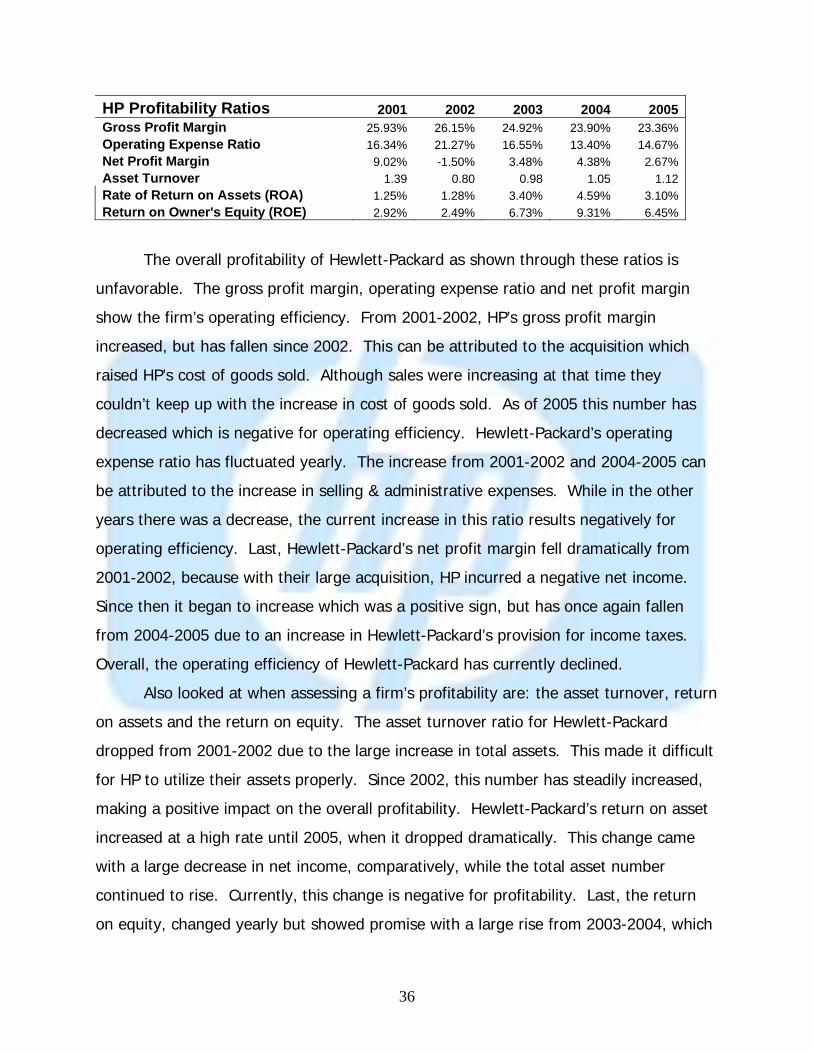
HP Profitability Ratios 2001 2002 2003 2004 2005Gross Profit Margin 25.93% 26.15% 24.92% 23.90% 23.36% Operating Expense Ratio 16.34% 21.27% 16.55% 13.40% 14.67% Net Profit Margin 9.02% -1.50% 3.48% 4.38% 2.67% Asset Turnover 1.39 0.80 0.98 1.05 1.12 Rate of Return on Assets (ROA) 1.25% 1.28% 3.40% 4.59% 3.10% Return on Owner's Equity (ROE) 2.92% 2.49% 6.73% 9.31% 6.45%
The overall profitability of Hewlett-Packard as shown through these ratios is
unfavorable. The gross profit margin, operating expense ratio and net profit margin
show the firm’s operating efficiency. From 2001-2002, HP’s gross profit margin
increased, but has fallen since 2002. This can be attributed to the acquisition which
raised HP’s cost of goods sold. Although sales were increasing at that time they
couldn’t keep up with the increase in cost of goods sold. As of 2005 this number has
decreased which is negative for operating efficiency. Hewlett-Packard’s operating
expense ratio has fluctuated yearly. The increase from 2001-2002 and 2004-2005 can
be attributed to the increase in selling & administrative expenses. While in the other
years there was a decrease, the current increase in this ratio results negatively for
operating efficiency. Last, Hewlett-Packard’s net profit margin fell dramatically from
2001-2002, because with their large acquisition, HP incurred a negative net income.
Since then it began to increase which was a positive sign, but has once again fallen
from 2004-2005 due to an increase in Hewlett-Packard’s provision for income taxes.
Overall, the operating efficiency of Hewlett-Packard has currently declined.
Also looked at when assessing a firm’s profitability are: the asset turnover, return
on assets and the return on equity. The asset turnover ratio for Hewlett-Packard
dropped from 2001-2002 due to the large increase in total assets. This made it difficult
for HP to utilize their assets properly. Since 2002, this number has steadily increased,
making a positive impact on the overall profitability. Hewlett-Packard’s return on asset
increased at a high rate until 2005, when it dropped dramatically. This change came
with a large decrease in net income, comparatively, while the total asset number
continued to rise. Currently, this change is negative for profitability. Last, the return
on equity, changed yearly but showed promise with a large rise from 2003-2004, which
37
was followed by a drastic drop again in 2005. This negative factor can be attributed to
the lower amount of owner’s equity from 2004-2005, due to a lower common stock
from share buybacks.
These ratios collectively show an unfavorable profitability standing for Hewlett-
Packard. This could be attributed to the high research and development needed to stay
competitive in the technology industry.
Cross-Sectional Analysis
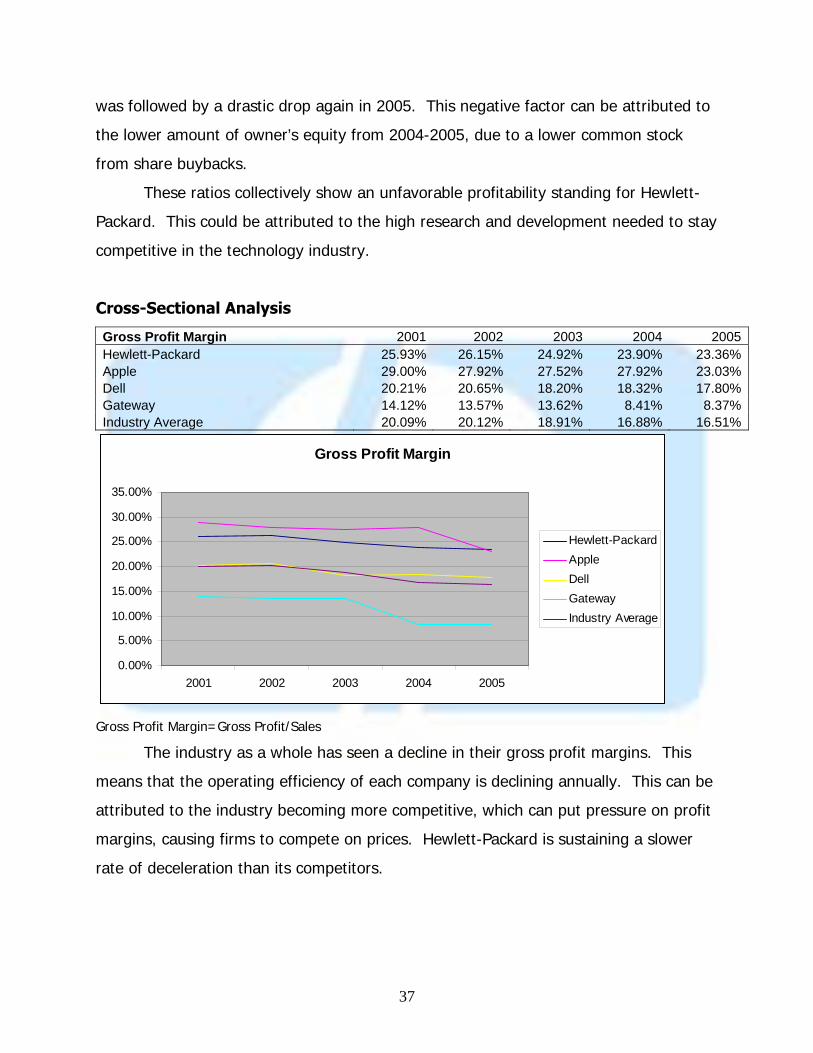
Gross Profit Margin 2001 2002 2003 2004 2005Hewlett-Packard 25.93% 26.15% 24.92% 23.90% 23.36%Apple 29.00% 27.92% 27.52% 27.92% 23.03%Dell 20.21% 20.65% 18.20% 18.32% 17.80%Gateway 14.12% 13.57% 13.62% 8.41% 8.37%Industry Average 20.09% 20.12% 18.91% 16.88% 16.51%
Gross Profit Margin
0.00%
5.00%
10.00%
15.00%
20.00%
25.00%
30.00%
35.00%
2001 2002 2003 2004 2005
Hewlett-PackardAppleDellGatewayIndustry Average
Gross Profit Margin=Gross Profit/Sales
The industry as a whole has seen a decline in their gross profit margins. This
means that the operating efficiency of each company is declining annually. This can be
attributed to the industry becoming more competitive, which can put pressure on profit
margins, causing firms to compete on prices. Hewlett-Packard is sustaining a slower
rate of deceleration than its competitors.
38
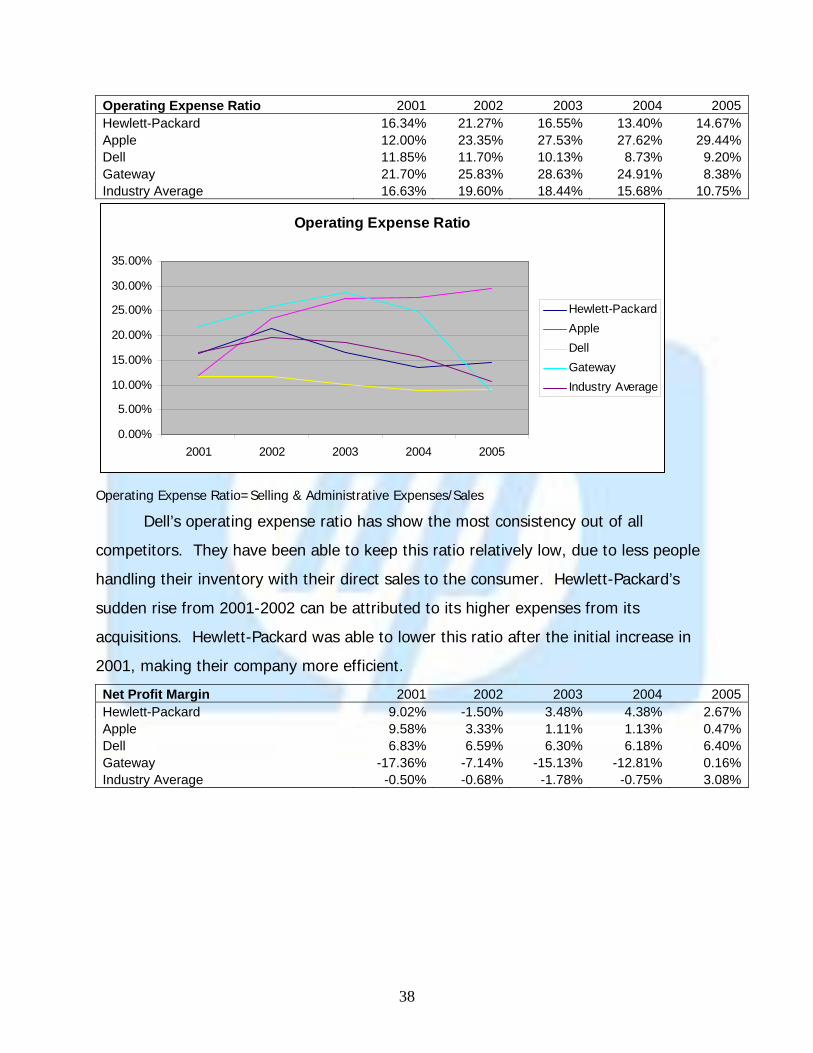
Operating Expense Ratio 2001 2002 2003 2004 2005Hewlett-Packard 16.34% 21.27% 16.55% 13.40% 14.67%Apple 12.00% 23.35% 27.53% 27.62% 29.44%Dell 11.85% 11.70% 10.13% 8.73% 9.20%Gateway 21.70% 25.83% 28.63% 24.91% 8.38%Industry Average 16.63% 19.60% 18.44% 15.68% 10.75%
Operating Expense Ratio
0.00%
5.00%
10.00%
15.00%
20.00%
25.00%
30.00%
35.00%
2001 2002 2003 2004 2005
Hewlett-PackardAppleDellGatewayIndustry Average
Operating Expense Ratio=Selling & Administrative Expenses/Sales
Dell’s operating expense ratio has show the most consistency out of all
competitors. They have been able to keep this ratio relatively low, due to less people
handling their inventory with their direct sales to the consumer. Hewlett-Packard’s
sudden rise from 2001-2002 can be attributed to its higher expenses from its
acquisitions. Hewlett-Packard was able to lower this ratio after the initial increase in
2001, making their company more efficient.
Net Profit Margin 2001 2002 2003 2004 2005Hewlett-Packard 9.02% -1.50% 3.48% 4.38% 2.67%Apple 9.58% 3.33% 1.11% 1.13% 0.47%Dell 6.83% 6.59% 6.30% 6.18% 6.40%Gateway -17.36% -7.14% -15.13% -12.81% 0.16%Industry Average -0.50% -0.68% -1.78% -0.75% 3.08%
39
Net Profit Margin
-20.00%
-15.00%
-10.00%
-5.00%
0.00%
5.00%
10.00%
15.00%
2001 2002 2003 2004 2005
Hewlett-PackardAppleDellGatewayIndustry Average
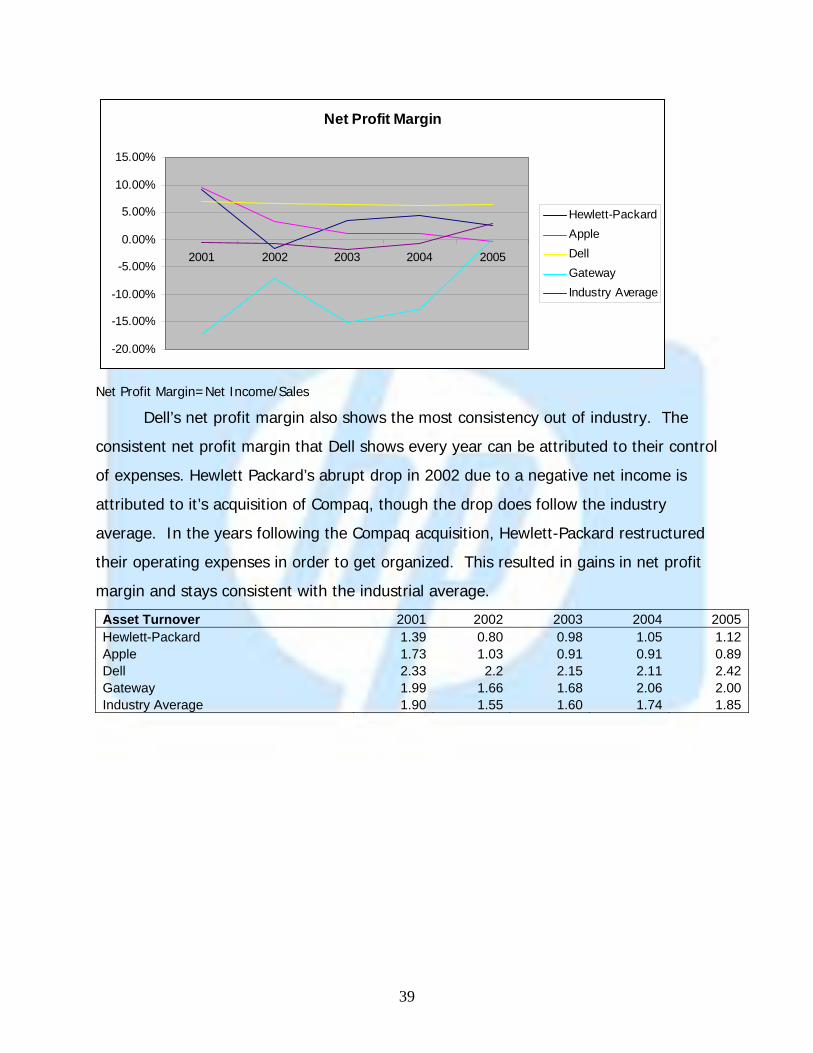
Net Profit Margin=Net Income/Sales
Dell’s net profit margin also shows the most consistency out of industry. The
consistent net profit margin that Dell shows every year can be attributed to their control
of expenses. Hewlett Packard’s abrupt drop in 2002 due to a negative net income is
attributed to it’s acquisition of Compaq, though the drop does follow the industry
average. In the years following the Compaq acquisition, Hewlett-Packard restructured
their operating expenses in order to get organized. This resulted in gains in net profit
margin and stays consistent with the industrial average.
Asset Turnover 2001 2002 2003 2004 2005Hewlett-Packard 1.39 0.80 0.98 1.05 1.12Apple 1.73 1.03 0.91 0.91 0.89Dell 2.33 2.2 2.15 2.11 2.42Gateway 1.99 1.66 1.68 2.06 2.00Industry Average 1.90 1.55 1.60 1.74 1.85
40
Asset Turnover
0.00
0.50
1.00
1.50
2.00
2.50
3.00
2001 2002 2003 2004 2005
Hewlett-PackardAppleDellGatewayIndustry Average
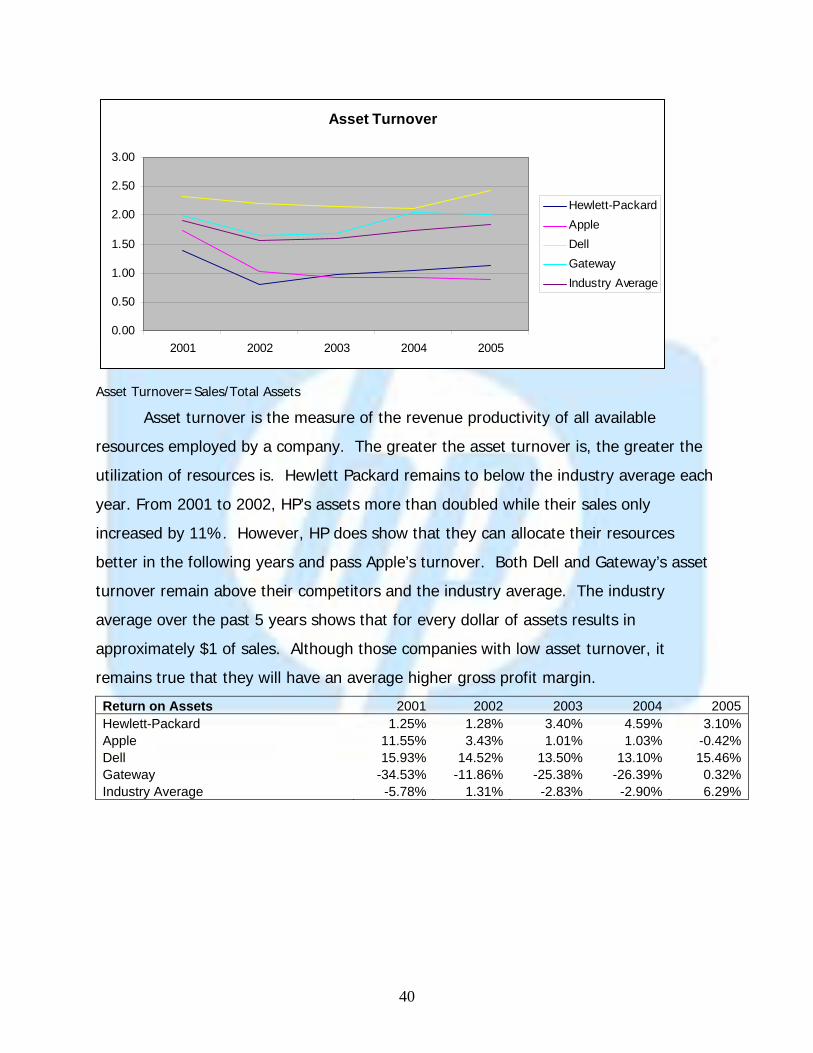
Asset Turnover=Sales/Total Assets
Asset turnover is the measure of the revenue productivity of all available
resources employed by a company. The greater the asset turnover is, the greater the
utilization of resources is. Hewlett Packard remains to below the industry average each
year. From 2001 to 2002, HP’s assets more than doubled while their sales only
increased by 11%. However, HP does show that they can allocate their resources
better in the following years and pass Apple’s turnover. Both Dell and Gateway’s asset
turnover remain above their competitors and the industry average. The industry
average over the past 5 years shows that for every dollar of assets results in
approximately $1 of sales. Although those companies with low asset turnover, it
remains true that they will have an average higher gross profit margin.
Return on Assets 2001 2002 2003 2004 2005Hewlett-Packard 1.25% 1.28% 3.40% 4.59% 3.10%Apple 11.55% 3.43% 1.01% 1.03% -0.42%Dell 15.93% 14.52% 13.50% 13.10% 15.46%Gateway -34.53% -11.86% -25.38% -26.39% 0.32%Industry Average -5.78% 1.31% -2.83% -2.90% 6.29%
41
Return on Assets
-40.00%
-30.00%
-20.00%
-10.00%
0.00%
10.00%
20.00%
2001 2002 2003 2004 2005
Hewlett-PackardAppleDellGatewayIndustry Average
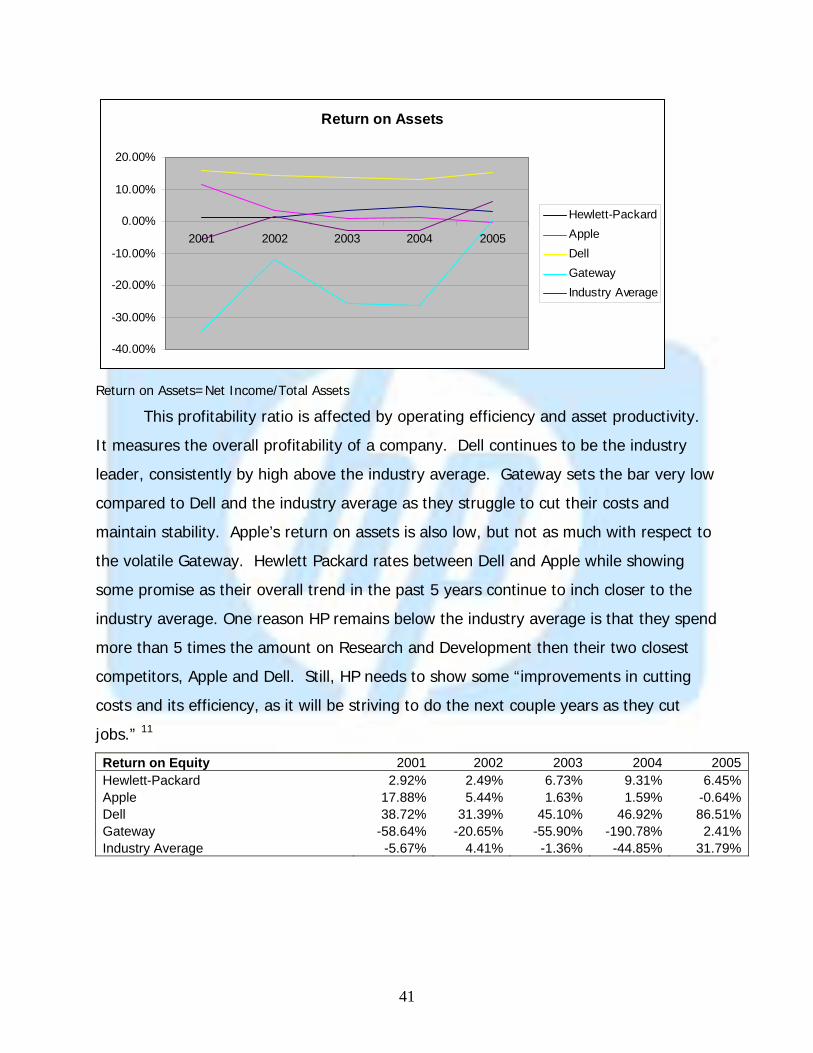
Return on Assets=Net Income/Total Assets
This profitability ratio is affected by operating efficiency and asset productivity.
It measures the overall profitability of a company. Dell continues to be the industry
leader, consistently by high above the industry average. Gateway sets the bar very low
compared to Dell and the industry average as they struggle to cut their costs and
maintain stability. Apple’s return on assets is also low, but not as much with respect to
the volatile Gateway. Hewlett Packard rates between Dell and Apple while showing
some promise as their overall trend in the past 5 years continue to inch closer to the
industry average. One reason HP remains below the industry average is that they spend
more than 5 times the amount on Research and Development then their two closest
competitors, Apple and Dell. Still, HP needs to show some “improvements in cutting
costs and its efficiency, as it will be striving to do the next couple years as they cut
jobs.” 11
Return on Equity 2001 2002 2003 2004 2005Hewlett-Packard 2.92% 2.49% 6.73% 9.31% 6.45%Apple 17.88% 5.44% 1.63% 1.59% -0.64%Dell 38.72% 31.39% 45.10% 46.92% 86.51%Gateway -58.64% -20.65% -55.90% -190.78% 2.41%Industry Average -5.67% 4.41% -1.36% -44.85% 31.79%
42
Return on Equity
-250.00%
-200.00%
-150.00%
-100.00%
-50.00%
0.00%
50.00%
100.00%
150.00%
2001 2002 2003 2004 2005
Hewlett-PackardAppleDellGatewayIndustry Average
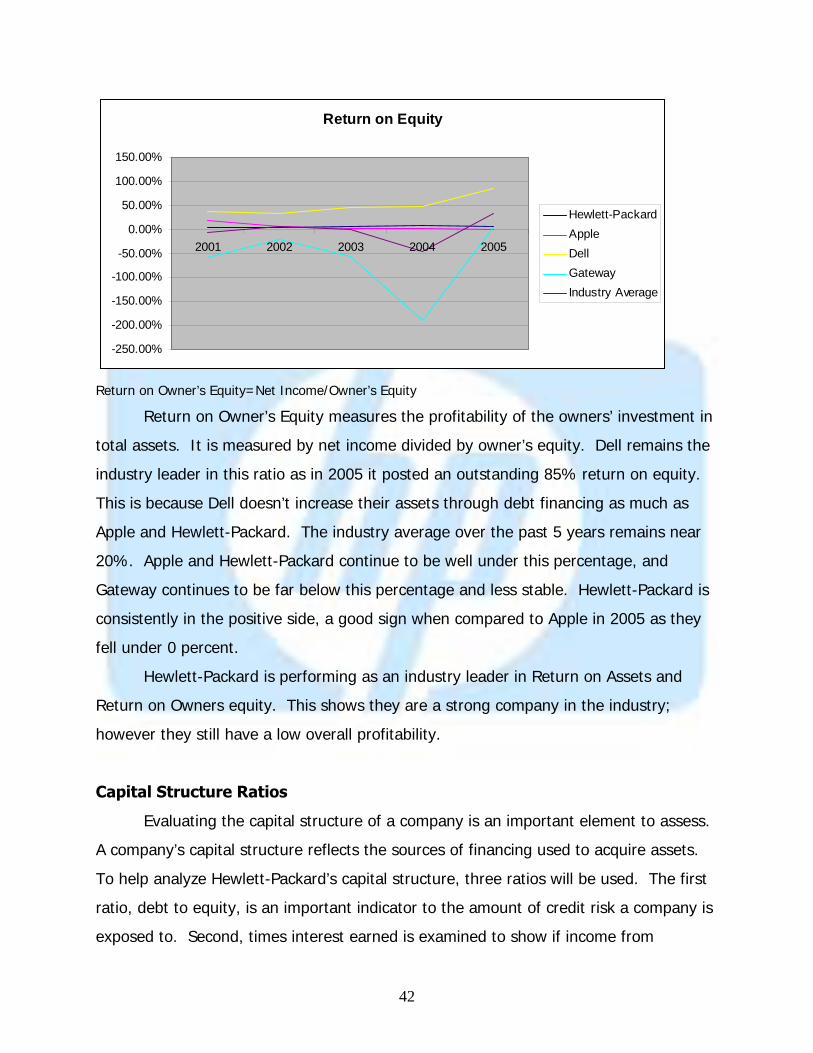
Return on Owner’s Equity=Net Income/Owner’s Equity
Return on Owner’s Equity measures the profitability of the owners’ investment in
total assets. It is measured by net income divided by owner’s equity. Dell remains the
industry leader in this ratio as in 2005 it posted an outstanding 85% return on equity.
This is because Dell doesn’t increase their assets through debt financing as much as
Apple and Hewlett-Packard. The industry average over the past 5 years remains near
20%. Apple and Hewlett-Packard continue to be well under this percentage, and
Gateway continues to be far below this percentage and less stable. Hewlett-Packard is
consistently in the positive side, a good sign when compared to Apple in 2005 as they
fell under 0 percent.
Hewlett-Packard is performing as an industry leader in Return on Assets and
Return on Owners equity. This shows they are a strong company in the industry;
however they still have a low overall profitability.
Capital Structure Ratios
Evaluating the capital structure of a company is an important element to assess.
A company’s capital structure reflects the sources of financing used to acquire assets.
To help analyze Hewlett-Packard’s capital structure, three ratios will be used. The first
ratio, debt to equity, is an important indicator to the amount of credit risk a company is
exposed to. Second, times interest earned is examined to show if income from
43
operations is able to cover the company’s interest expense. Last, debt service margin is
used to measure the sufficiency of cash provided by operations to cover any payments
on liabilities.
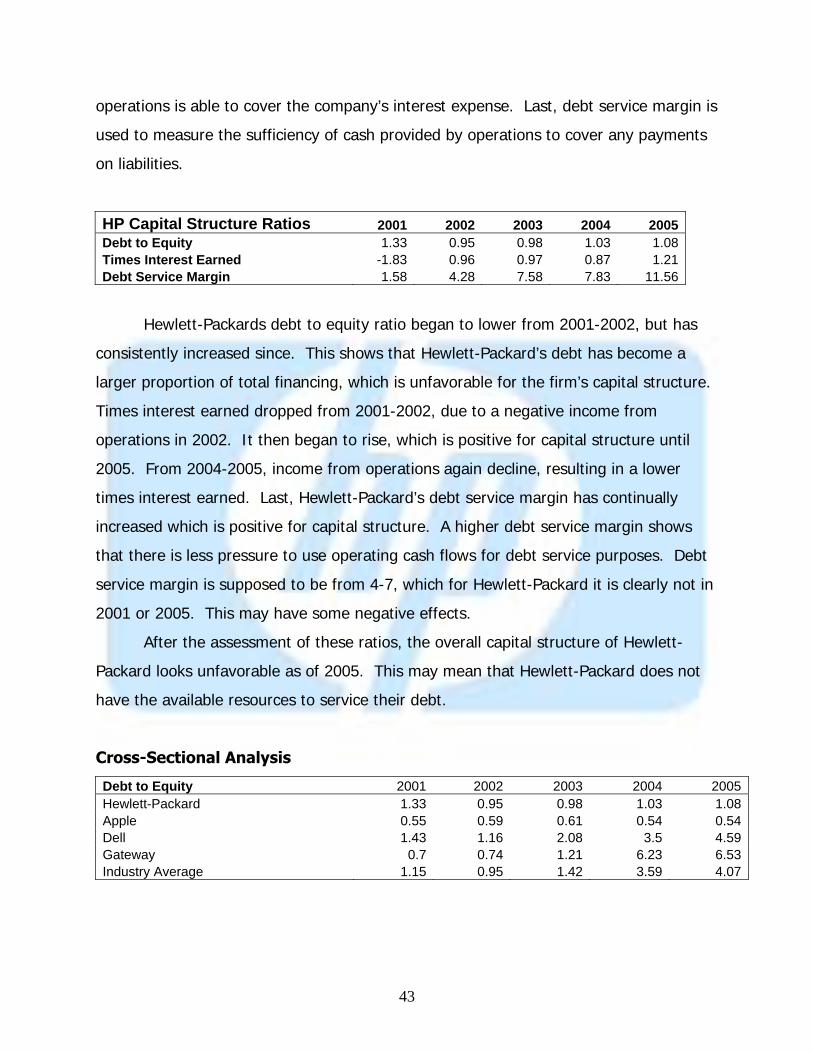
HP Capital Structure Ratios 2001 2002 2003 2004 2005Debt to Equity 1.33 0.95 0.98 1.03 1.08Times Interest Earned -1.83 0.96 0.97 0.87 1.21Debt Service Margin 1.58 4.28 7.58 7.83 11.56
Hewlett-Packards debt to equity ratio began to lower from 2001-2002, but has
consistently increased since. This shows that Hewlett-Packard’s debt has become a
larger proportion of total financing, which is unfavorable for the firm’s capital structure.
Times interest earned dropped from 2001-2002, due to a negative income from
operations in 2002. It then began to rise, which is positive for capital structure until
2005. From 2004-2005, income from operations again decline, resulting in a lower
times interest earned. Last, Hewlett-Packard’s debt service margin has continually
increased which is positive for capital structure. A higher debt service margin shows
that there is less pressure to use operating cash flows for debt service purposes. Debt
service margin is supposed to be from 4-7, which for Hewlett-Packard it is clearly not in
2001 or 2005. This may have some negative effects.
After the assessment of these ratios, the overall capital structure of Hewlett-
Packard looks unfavorable as of 2005. This may mean that Hewlett-Packard does not
have the available resources to service their debt.
Cross-Sectional Analysis
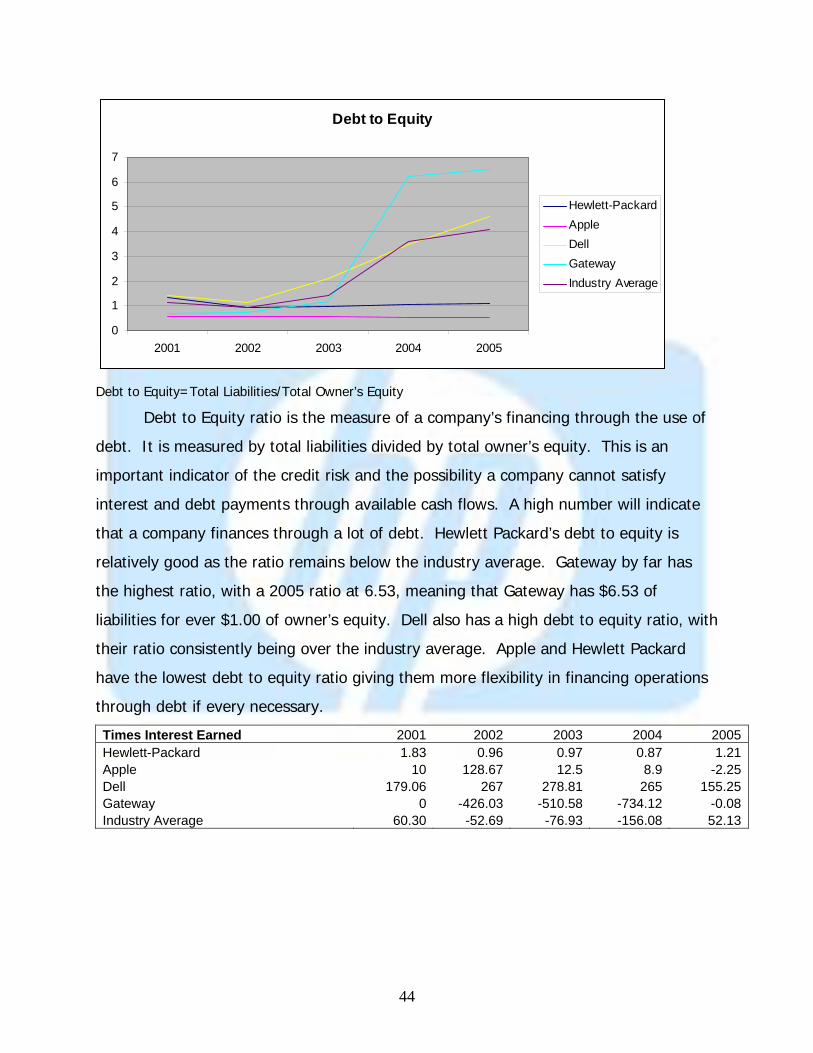
Debt to Equity 2001 2002 2003 2004 2005Hewlett-Packard 1.33 0.95 0.98 1.03 1.08Apple 0.55 0.59 0.61 0.54 0.54Dell 1.43 1.16 2.08 3.5 4.59Gateway 0.7 0.74 1.21 6.23 6.53Industry Average 1.15 0.95 1.42 3.59 4.07
44
Debt to Equity
0
1
2
3
4
5
6
7
2001 2002 2003 2004 2005
Hewlett-PackardAppleDellGatewayIndustry Average
Debt to Equity=Total Liabilities/Total Owner’s Equity
Debt to Equity ratio is the measure of a company’s financing through the use of
debt. It is measured by total liabilities divided by total owner’s equity. This is an
important indicator of the credit risk and the possibility a company cannot satisfy
interest and debt payments through available cash flows. A high number will indicate
that a company finances through a lot of debt. Hewlett Packard’s debt to equity is
relatively good as the ratio remains below the industry average. Gateway by far has
the highest ratio, with a 2005 ratio at 6.53, meaning that Gateway has $6.53 of
liabilities for ever $1.00 of owner’s equity. Dell also has a high debt to equity ratio, with
their ratio consistently being over the industry average. Apple and Hewlett Packard
have the lowest debt to equity ratio giving them more flexibility in financing operations
through debt if every necessary.
Times Interest Earned 2001 2002 2003 2004 2005Hewlett-Packard 1.83 0.96 0.97 0.87 1.21Apple 10 128.67 12.5 8.9 -2.25Dell 179.06 267 278.81 265 155.25Gateway 0 -426.03 -510.58 -734.12 -0.08Industry Average 60.30 -52.69 -76.93 -156.08 52.13
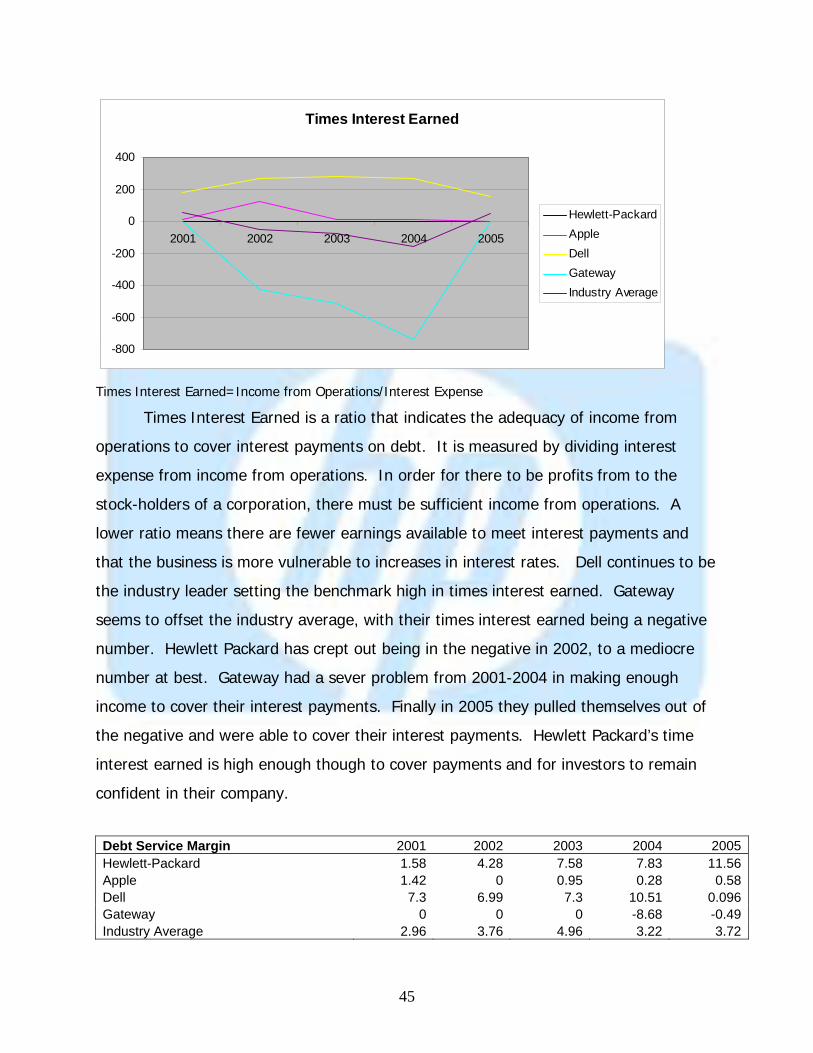
45
Times Interest Earned
-800
-600
-400
-200
0
200
400
2001 2002 2003 2004 2005
Hewlett-PackardAppleDellGatewayIndustry Average
Times Interest Earned=Income from Operations/Interest Expense
Times Interest Earned is a ratio that indicates the adequacy of income from
operations to cover interest payments on debt. It is measured by dividing interest
expense from income from operations. In order for there to be profits from to the
stock-holders of a corporation, there must be sufficient income from operations. A
lower ratio means there are fewer earnings available to meet interest payments and
that the business is more vulnerable to increases in interest rates. Dell continues to be
the industry leader setting the benchmark high in times interest earned. Gateway
seems to offset the industry average, with their times interest earned being a negative
number. Hewlett Packard has crept out being in the negative in 2002, to a mediocre
number at best. Gateway had a sever problem from 2001-2004 in making enough
income to cover their interest payments. Finally in 2005 they pulled themselves out of
the negative and were able to cover their interest payments. Hewlett Packard’s time
interest earned is high enough though to cover payments and for investors to remain
confident in their company.
Debt Service Margin 2001 2002 2003 2004 2005Hewlett-Packard 1.58 4.28 7.58 7.83 11.56Apple 1.42 0 0.95 0.28 0.58Dell 7.3 6.99 7.3 10.51 0.096Gateway 0 0 0 -8.68 -0.49Industry Average 2.96 3.76 4.96 3.22 3.72
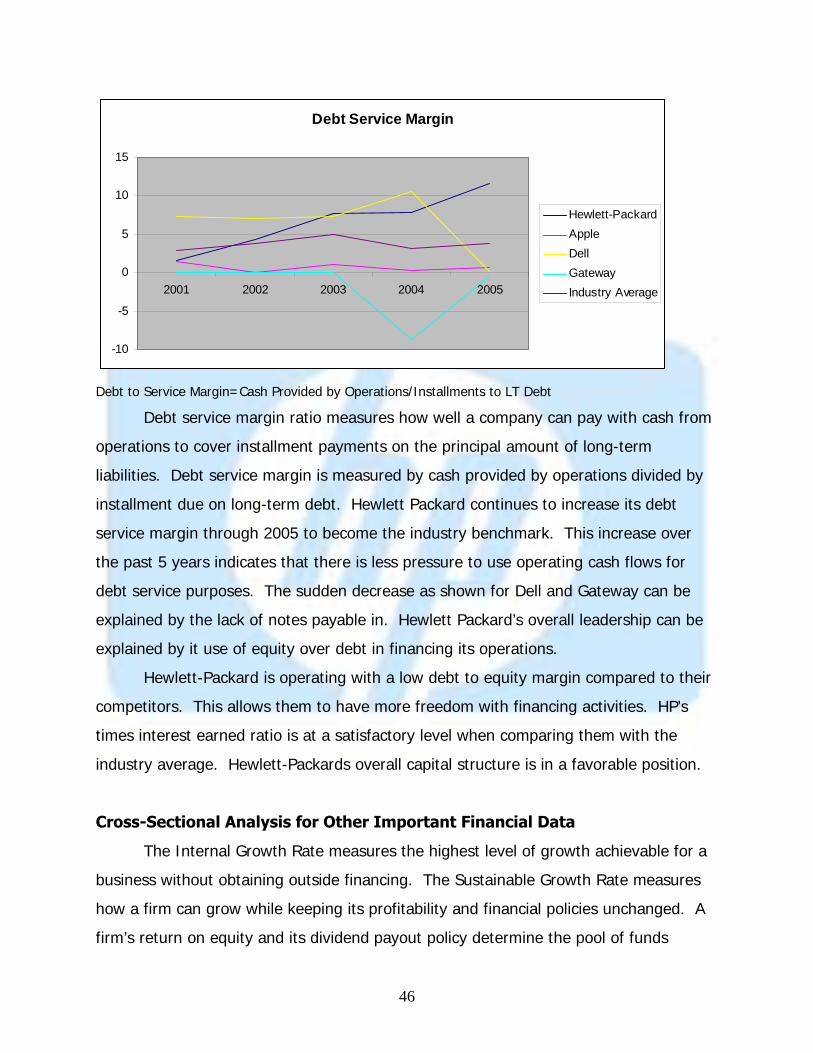
46
Debt Service Margin
-10
-5
0
5
10
15
2001 2002 2003 2004 2005
Hewlett-PackardAppleDellGatewayIndustry Average
Debt to Service Margin=Cash Provided by Operations/Installments to LT Debt
Debt service margin ratio measures how well a company can pay with cash from
operations to cover installment payments on the principal amount of long-term
liabilities. Debt service margin is measured by cash provided by operations divided by
installment due on long-term debt. Hewlett Packard continues to increase its debt
service margin through 2005 to become the industry benchmark. This increase over
the past 5 years indicates that there is less pressure to use operating cash flows for
debt service purposes. The sudden decrease as shown for Dell and Gateway can be
explained by the lack of notes payable in. Hewlett Packard’s overall leadership can be
explained by it use of equity over debt in financing its operations.
Hewlett-Packard is operating with a low debt to equity margin compared to their
competitors. This allows them to have more freedom with financing activities. HP’s
times interest earned ratio is at a satisfactory level when comparing them with the
industry average. Hewlett-Packards overall capital structure is in a favorable position.
Cross-Sectional Analysis for Other Important Financial Data
The Internal Growth Rate measures the highest level of growth achievable for a
business without obtaining outside financing. The Sustainable Growth Rate measures
how a firm can grow while keeping its profitability and financial policies unchanged. A
firm’s return on equity and its dividend payout policy determine the pool of funds
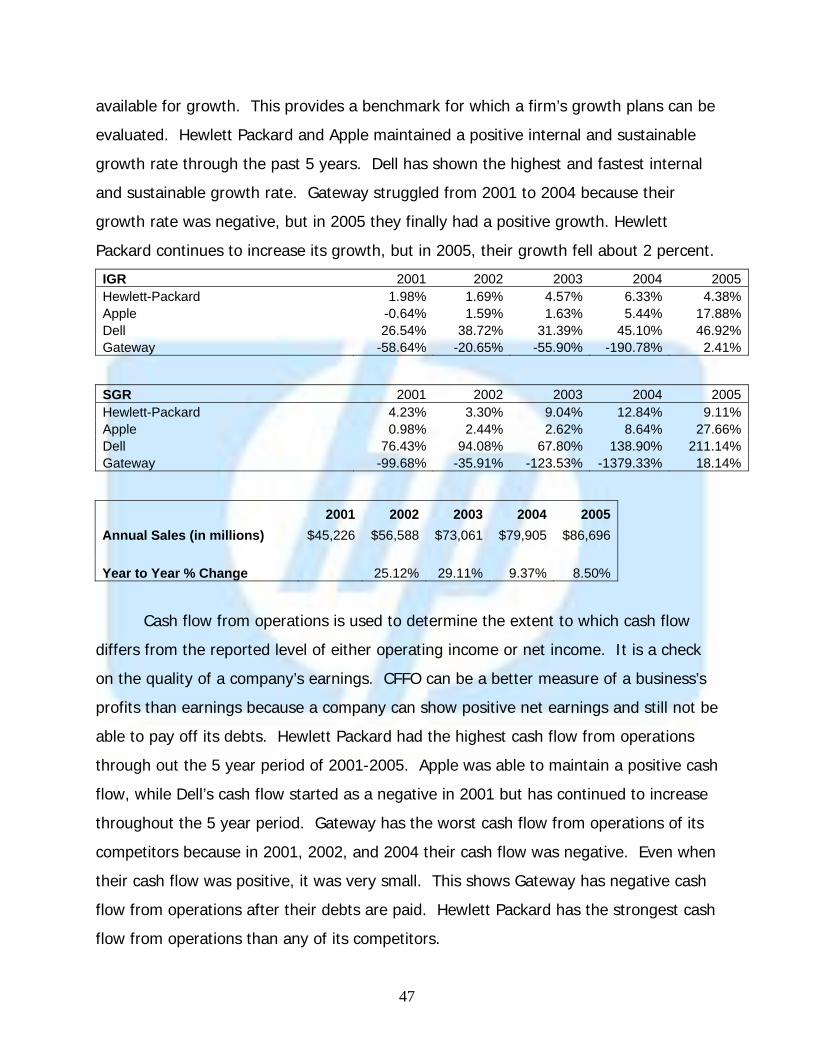
47
available for growth. This provides a benchmark for which a firm’s growth plans can be
evaluated. Hewlett Packard and Apple maintained a positive internal and sustainable
growth rate through the past 5 years. Dell has shown the highest and fastest internal
and sustainable growth rate. Gateway struggled from 2001 to 2004 because their
growth rate was negative, but in 2005 they finally had a positive growth. Hewlett
Packard continues to increase its growth, but in 2005, their growth fell about 2 percent.
IGR 2001 2002 2003 2004 2005Hewlett-Packard 1.98% 1.69% 4.57% 6.33% 4.38%Apple -0.64% 1.59% 1.63% 5.44% 17.88%Dell 26.54% 38.72% 31.39% 45.10% 46.92%Gateway -58.64% -20.65% -55.90% -190.78% 2.41%
SGR 2001 2002 2003 2004 2005Hewlett-Packard 4.23% 3.30% 9.04% 12.84% 9.11%Apple 0.98% 2.44% 2.62% 8.64% 27.66%Dell 76.43% 94.08% 67.80% 138.90% 211.14%Gateway -99.68% -35.91% -123.53% -1379.33% 18.14%
2001 2002 2003 2004 2005 Annual Sales (in millions) $45,226 $56,588 $73,061 $79,905 $86,696 Year to Year % Change 25.12% 29.11% 9.37% 8.50%
Cash flow from operations is used to determine the extent to which cash flow
differs from the reported level of either operating income or net income. It is a check
on the quality of a company’s earnings. CFFO can be a better measure of a business’s
profits than earnings because a company can show positive net earnings and still not be
able to pay off its debts. Hewlett Packard had the highest cash flow from operations
through out the 5 year period of 2001-2005. Apple was able to maintain a positive cash
flow, while Dell’s cash flow started as a negative in 2001 but has continued to increase
throughout the 5 year period. Gateway has the worst cash flow from operations of its
competitors because in 2001, 2002, and 2004 their cash flow was negative. Even when
their cash flow was positive, it was very small. This shows Gateway has negative cash
flow from operations after their debts are paid. Hewlett Packard has the strongest cash
flow from operations than any of its competitors.
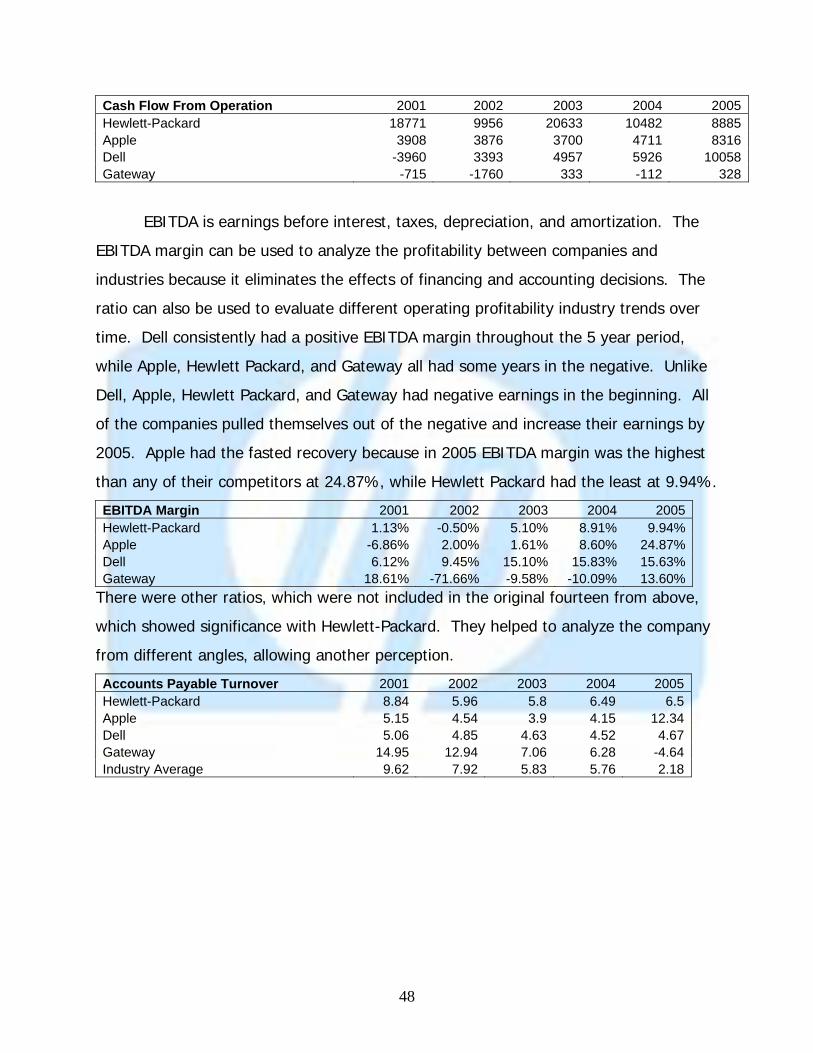
48
Cash Flow From Operation 2001 2002 2003 2004 2005Hewlett-Packard 18771 9956 20633 10482 8885Apple 3908 3876 3700 4711 8316Dell -3960 3393 4957 5926 10058Gateway -715 -1760 333 -112 328
EBITDA is earnings before interest, taxes, depreciation, and amortization. The
EBITDA margin can be used to analyze the profitability between companies and
industries because it eliminates the effects of financing and accounting decisions. The
ratio can also be used to evaluate different operating profitability industry trends over
time. Dell consistently had a positive EBITDA margin throughout the 5 year period,
while Apple, Hewlett Packard, and Gateway all had some years in the negative. Unlike
Dell, Apple, Hewlett Packard, and Gateway had negative earnings in the beginning. All
of the companies pulled themselves out of the negative and increase their earnings by
2005. Apple had the fasted recovery because in 2005 EBITDA margin was the highest
than any of their competitors at 24.87%, while Hewlett Packard had the least at 9.94%.
EBITDA Margin 2001 2002 2003 2004 2005Hewlett-Packard 1.13% -0.50% 5.10% 8.91% 9.94%Apple -6.86% 2.00% 1.61% 8.60% 24.87%Dell 6.12% 9.45% 15.10% 15.83% 15.63%Gateway 18.61% -71.66% -9.58% -10.09% 13.60%
There were other ratios, which were not included in the original fourteen from above,
which showed significance with Hewlett-Packard. They helped to analyze the company
from different angles, allowing another perception.
Accounts Payable Turnover 2001 2002 2003 2004 2005Hewlett-Packard 8.84 5.96 5.8 6.49 6.5Apple 5.15 4.54 3.9 4.15 12.34Dell 5.06 4.85 4.63 4.52 4.67Gateway 14.95 12.94 7.06 6.28 -4.64Industry Average 9.62 7.92 5.83 5.76 2.18

49
Accounts Payable Turnover
-10
-5
0
5
10
15
20
2001 2002 2003 2004 2005
Hewlett-PackardAppleDellGatewayIndustry Average
Accounts Payable Turnover=Cost of Goods Sold/Accounts Payable
Accounts payable turnover is another ratio which allows analysts to evaluate the
firm’s liquidity. The firm’s accounts payable is simply the source of funds for the firm’s
working capital. It is desirable to have a high ratio, while keeping the cost of goods at
a constant level and decreasing the accounts payable. This ratio was considered
important to show another angle at the firm’s liquidity. The industry as a whole
remained consistent with one another, although Gateway has had a problem stabilizing.
Gateway’s accounts payable turnover was higher than the average in 2001, then
steadied their accounts to the industry average in 2003, then significantly decreased
away from the average in 2004 and 2005. Hewlett-Packard showed a decreasing
turnover in the 2001-2003, due to their acquisitions, followed by a steady increase.
Apple, Dell also followed the same trend.
Property, Plant & Equipment 2001 2002 2003 2004 2005Hewlett-Packard 10.29 8.17 11.27 12.02 13.44Apple 9.57 9.25 9.28 11.71 17.05Dell 37.73 38.78 27.32 29.1 27.88Gateway 5.66 4.04 3.68 7.39 7.95Industry Average 17.89 17.00 14.09 16.17 16.42
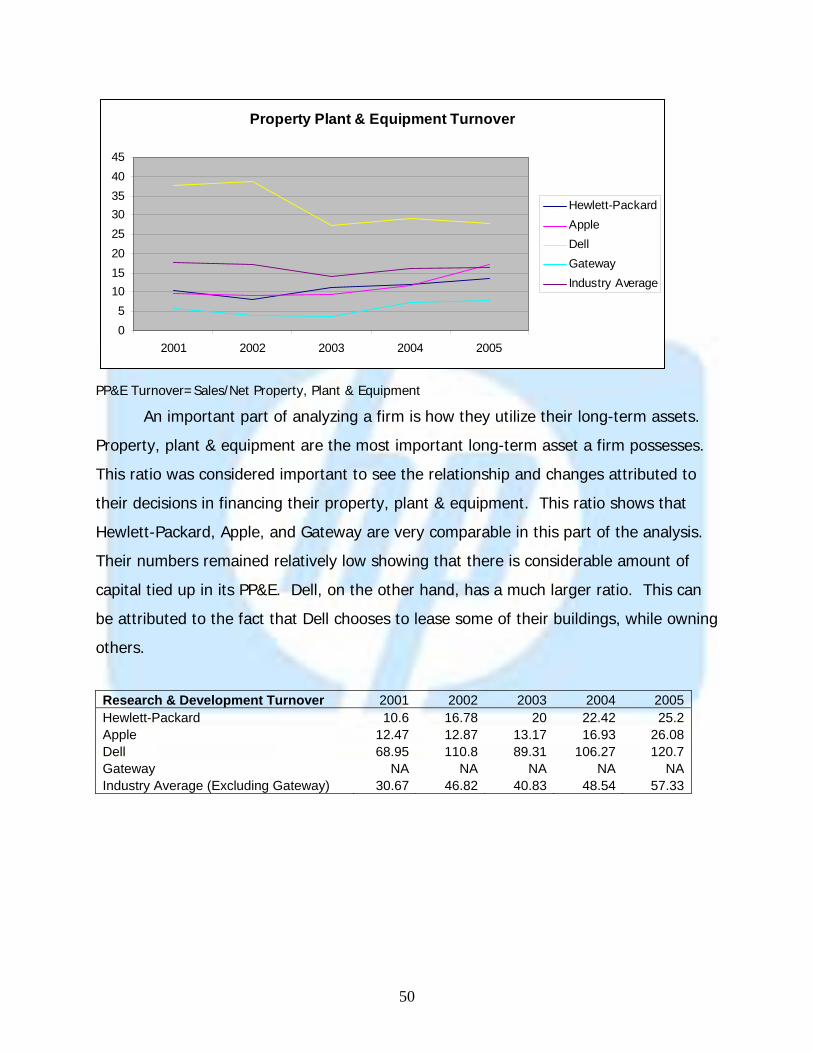
50
Property Plant & Equipment Turnover
05
1015202530354045
2001 2002 2003 2004 2005
Hewlett-PackardAppleDellGatewayIndustry Average
PP&E Turnover=Sales/Net Property, Plant & Equipment
An important part of analyzing a firm is how they utilize their long-term assets.
Property, plant & equipment are the most important long-term asset a firm possesses.
This ratio was considered important to see the relationship and changes attributed to
their decisions in financing their property, plant & equipment. This ratio shows that
Hewlett-Packard, Apple, and Gateway are very comparable in this part of the analysis.
Their numbers remained relatively low showing that there is considerable amount of
capital tied up in its PP&E. Dell, on the other hand, has a much larger ratio. This can
be attributed to the fact that Dell chooses to lease some of their buildings, while owning
others.
Research & Development Turnover 2001 2002 2003 2004 2005Hewlett-Packard 10.6 16.78 20 22.42 25.2Apple 12.47 12.87 13.17 16.93 26.08Dell 68.95 110.8 89.31 106.27 120.7Gateway NA NA NA NA NAIndustry Average (Excluding Gateway) 30.67 46.82 40.83 48.54 57.33
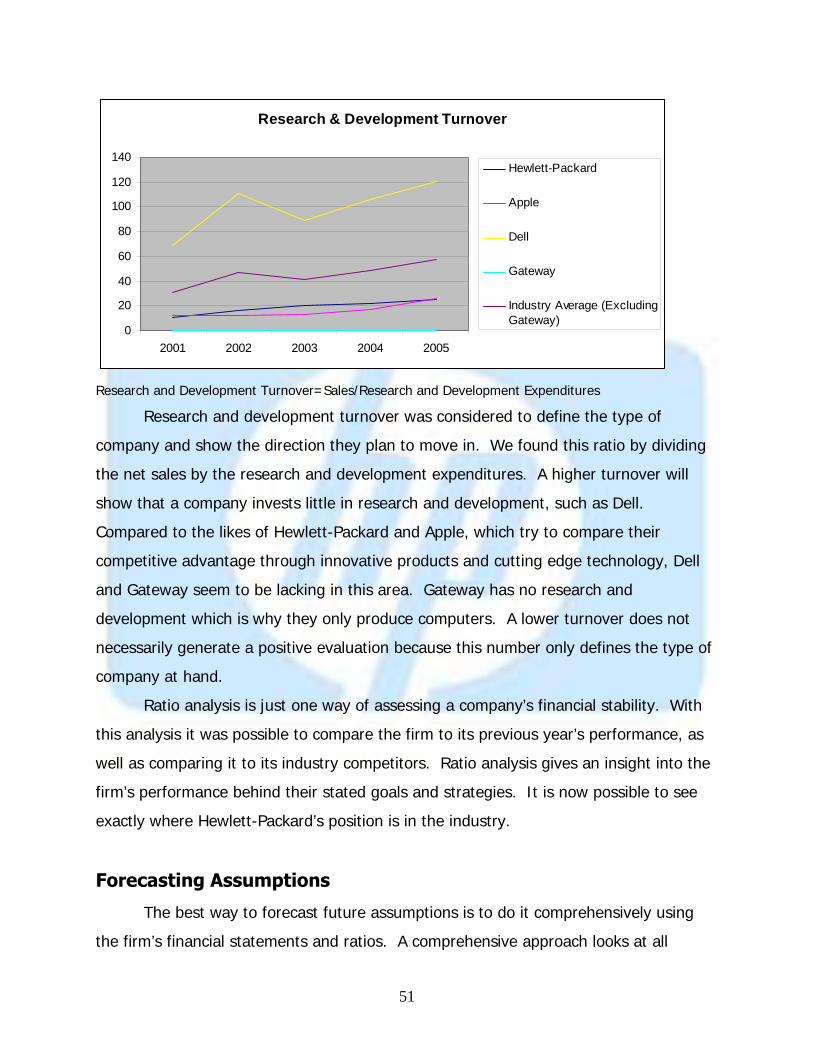
51
Research & Development Turnover
0
20
40
60
80
100
120
140
2001 2002 2003 2004 2005
Hewlett-Packard
Apple
Dell
Gateway
Industry Average (ExcludingGateway)
Research and Development Turnover=Sales/Research and Development Expenditures
Research and development turnover was considered to define the type of
company and show the direction they plan to move in. We found this ratio by dividing
the net sales by the research and development expenditures. A higher turnover will
show that a company invests little in research and development, such as Dell.
Compared to the likes of Hewlett-Packard and Apple, which try to compare their
competitive advantage through innovative products and cutting edge technology, Dell
and Gateway seem to be lacking in this area. Gateway has no research and
development which is why they only produce computers. A lower turnover does not
necessarily generate a positive evaluation because this number only defines the type of
company at hand.
Ratio analysis is just one way of assessing a company’s financial stability. With
this analysis it was possible to compare the firm to its previous year’s performance, as
well as comparing it to its industry competitors. Ratio analysis gives an insight into the
firm’s performance behind their stated goals and strategies. It is now possible to see
exactly where Hewlett-Packard’s position is in the industry.
Forecasting Assumptions
The best way to forecast future assumptions is to do it comprehensively using
the firm’s financial statements and ratios. A comprehensive approach looks at all
52
financial statements from quarterly to annual reports. This approach involves few key
“drivers,” such as sales turnover, profit margin, and asset turnover. The condensed
financial statements are needed for analysis and decision making for future forecasts.
From there numbers and ratios can be compared to the industry average to project
future forecasts.
Income Statement (Appendix A)
The first step in forecasting the income statement was evaluating the first three
quarters of Hewlett-Packard’s fiscal year 2006. Net sales was the first item examined.
It was shown that Hewlett-Packard was increasing steadily in each quarter. For this
reason, we decided to take the average growth rate, quarter-over-quarter, to calculate
the years total sales. This average growth rate of 5.4% was used for the next two
years, until 2008. This year, Hewlett-Packard acquired Mercury Interactive Corporation.
HP has projected that this will increase the net sales by 10-15% by 2008.3 This is one
of the few apparent projections given by Hewlett-Packard’s analysts. We decided to
take the conservative approach and only increase the sales by 10%. The next few
years they steadily declined the growth rate, in order to bring it back to the companies
average growth rate. This assumption can compare with the asset turnover ratio; when
there is a high growth rate change from year to year, there is a low asset turnover.
This will affect the forecast when the sales growth in the future will return the industry
average. When the sales growth decreases from 10% to the average, the asset
turnover will increase. In the forecast, the asset turnover will indirectly reflect the sales
growth.
Next, we moved down the income statement, to the cost of goods sold. Cost of
goods sold and the depreciation and amortization were forecasted the same. These
were found by, once again, getting the average growth rate of the past five years, and
applying that to year 2006. We decided that it was adequate to use the average
growth rate due to the steady increase in net sales, which usually leads to an increase
in cost of goods sold, year-over-year.
53
Research and Development expense needed to be calculated in a different
manor. When we tried to use the average growth rate from the past five years, this
expense increased to a number which we did not find reasonable. So, we decided to
take the research and development turnover ratio average from the past five years,
which can be found with net sales divided by research and development expenditure.
This equation over sales gives you the R&D turnover. We then used this formula to find
the research and development expenditure.
Non-operating expense and interest expense were found by getting the average
of the past five years and applying it to the forecast. We felt this was the best method
because both of these numbers were very volatile year-to-year, and we felt this was the
best way to forecast accurately.
There could be some problems in the way in which we forecasted this
information. First, we decided not to forecast the provisions for income taxes, due to
the severe changes the past five years undertook. Income taxes depend on what
bracket your company falls into, and there are so many different factors which play into
the company’s financial position for that current year. For this reason we felt we could
not accurately forecast. There is also the possibility that our net sales could be off due
to the use of the expected increased growth rate in 2008. If this does not occur, the
financials for those years, and the proceeding years, will be grossly overstated. There
is also the possibility of technological changes which we are not able to predict. These
uncertainties could dramatically influence the financials in the future. Last, in light of
the recent allegations against Hewlett-Packard, involving insider leaking, there is a
possibility of a negative outcome for the company in the near future. With a
unfavorable verdict, Hewlett-Packard has the possibility of losing great customer loyalty
and respect within the business community. This could result in not only a loss of sales
but also a loss of investors.
Balance Sheet (Appendix B)
Sales growth and net sales for each year become one of the most important
aspects for forecasting the balance sheet of Hewlett Packard. The accuracy of the
54
forecasted years for net sales directly relates to most forecasted numbers in the
balance sheet. When forecasting the Income statement, net sales is the first forecasted
number. Therefore, using the available quarterly data in 2006 and studying the overall
trends, it is assumed that net sales of 2006 are the most accurate and precise of all
forecasted numbers. With this in mind, finding the average asset turnover, or net sales
divided by total assets, for the years 2002 to 2006, will give a ratio to be used to find
each year’s total assets. The years 2002 to 2006 were used due to Hewlett Packard
acquiring Compaq and the forecasted data of 2006 being reasonably accurate. The
average, of about 1.08 was then multiplied by net sales for each forecasted year
through 2016 to find the total assets.
Once total assets were forecasted through the use of the average asset turnover,
the majority of the forecasting is done through the use of forecasting the common size
balance sheet by use of averages. For example, cash over the previous four years had
an average of 16.46% in relation to total assets. This average was then used in 2006
in relation to the already projected total assets. Then, the year 2007 found the average
of years 2002, 2003, 2004, 2005, and the already forecasted 2006. The use of
forecasting a year’s data by the average of the previous four years was used
consistently for the common sized balance sheet. Once these percentages were
forecasted, each was multiplied by that year’s total assets to find the number.
The exception to this was forecasting equity. Common stock was found by using
the previous four years common stock, and finding the average. The average was then
consistently used as each forecasted years’ data. Retained earnings was forecasted by
using the previous years retained earnings, and adding the forecasted net income as
well as an assumed dividend payout of 926. Capital Surplus was then found by
subtracting retained earnings and common stock from total shareholder equity.
The main assumption using this method is that everything is derived and based
on asset turnover. This can be a strength as long as HP stays near the average asset
turnover of 1.08 each year. Due to volatility of HP and technology industry, this can be
assumed the overall most accurate way to forecast the statements. However, if there is
a huge increase or decrease in operating efficiency that results in more or less sales for
55
a certain amount of assets, it will throw off the forecasted balance sheet. Also, in 2008
there is a change in which HP will change its capital structure; this too will skew some
of the forecasted financial numbers. Another assumption made is that stockholder
equity and total liabilities will always be close to a 50% divide by the two. If HP
decides to finance one way over another, the forecasted information will be off.
However, if HP continues this trend of almost down the middle, the information will be
relatively accurate. Finally, the basis of this forecasting comes from net sales and its
projected growth. If there were ever to be a year in which growth went down, it too
would skew all forecasted number.
Statement of Cash Flows (Appendix C)
The Statement of Cash Flows was a more difficult financial statement to forecast.
The first step was to forecast the cash flows from operations for the fiscal year 2006.
There was a large drop in these cash flows from 2003-2004, and then a large gain from
2004-2005. These negative numbers were not relative to use in the forecasting. The
best way to forecast was to take the average growth rate for the remaining three years,
and projected the future financials from that average. This average growth rate was
predicted to stay at a steady growth in the upcoming years, which coincides with our
net sales increase. After performing this type of assessment in forecasting the cash
flows from operations, it was seen that the numbers were skewed. It was found that
the current 2006 cash flows from operations is higher than what we had predicted. In
order to satisfy this within our forecasting, the multiplier had to be changed in the given
equation to 38.98. This allowed for more reasonable estimates with the cash flows
from operations.
The next financial was the cash flows from investing activities. These numbers
began as very low negative numbers. After the initial negative, the numbers increased
and decreased greatly, which showed extreme volatility. For this reason we decided to
the best way forecast was to use the long term assets in some way. We found the
percent change from year to year for long term assets, and then used that percent
change to forecast the next ten years of investment financing.
56
The last item to forecast was the cash flows from financing activities. Once
again we thought we would take an average of the previous years, leaving outliers out
of the average, but didn’t think this number was sufficient. After, we took the approach
of finding percentage of sales to cash flow from financing. With those numbers from
the previous five years, we got the average. We then took that number and multiplied
it by the net sales forecasted for the corresponding years.
There could also be many problems associated with these forecasts. For one,
the net change in cash and cash equivalents almost become irrelevant due to the fact
that we could not forecast for the cash flows from investing. This offset the net change
and ultimately took that number into the negatives.
Valuations
Valuation is the process of converting a forecast into an estimate of the value of
the firm or some component of the firm. Valuing a firm is involved in nearly every
business decision. There are many different methods of finding a firm’s intrinsic value,
some of which are very relevant and others that show no significance. Valuations help
in showing the overall stance of a company by assisting in estimations of a firm’s equity
and ultimately showing whether a firm is fairly valued.
Method of Comparables
The first form of valuation is the method of comparables. In this type of
valuation, Hewlett-Packard is compared to other firms in their industry, which are direct
competitors. An average is taken from different ratios derived from their price per
share, dividends per share, book value per share and earnings per share. Once an
average is obtained, Hewlett-Packard is then priced by this number.
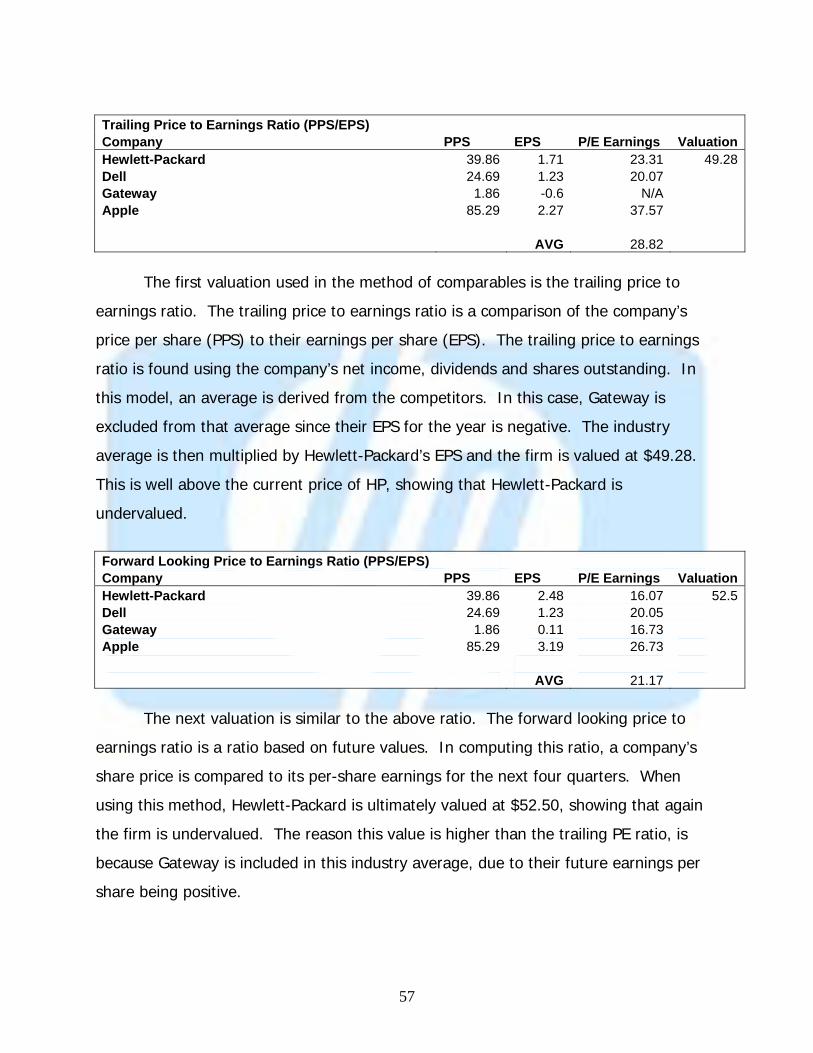
57
Trailing Price to Earnings Ratio (PPS/EPS) Company PPS EPS P/E Earnings ValuationHewlett-Packard 39.86 1.71 23.31 49.28Dell 24.69 1.23 20.07 Gateway 1.86 -0.6 N/A Apple 85.29 2.27 37.57 AVG 28.82
The first valuation used in the method of comparables is the trailing price to
earnings ratio. The trailing price to earnings ratio is a comparison of the company’s
price per share (PPS) to their earnings per share (EPS). The trailing price to earnings
ratio is found using the company’s net income, dividends and shares outstanding. In
this model, an average is derived from the competitors. In this case, Gateway is
excluded from that average since their EPS for the year is negative. The industry
average is then multiplied by Hewlett-Packard’s EPS and the firm is valued at $49.28.
This is well above the current price of HP, showing that Hewlett-Packard is
undervalued.
Forward Looking Price to Earnings Ratio (PPS/EPS) Company PPS EPS P/E Earnings ValuationHewlett-Packard 39.86 2.48 16.07 52.5Dell 24.69 1.23 20.05 Gateway 1.86 0.11 16.73 Apple 85.29 3.19 26.73 AVG 21.17
The next valuation is similar to the above ratio. The forward looking price to
earnings ratio is a ratio based on future values. In computing this ratio, a company’s
share price is compared to its per-share earnings for the next four quarters. When
using this method, Hewlett-Packard is ultimately valued at $52.50, showing that again
the firm is undervalued. The reason this value is higher than the trailing PE ratio, is
because Gateway is included in this industry average, due to their future earnings per
share being positive.
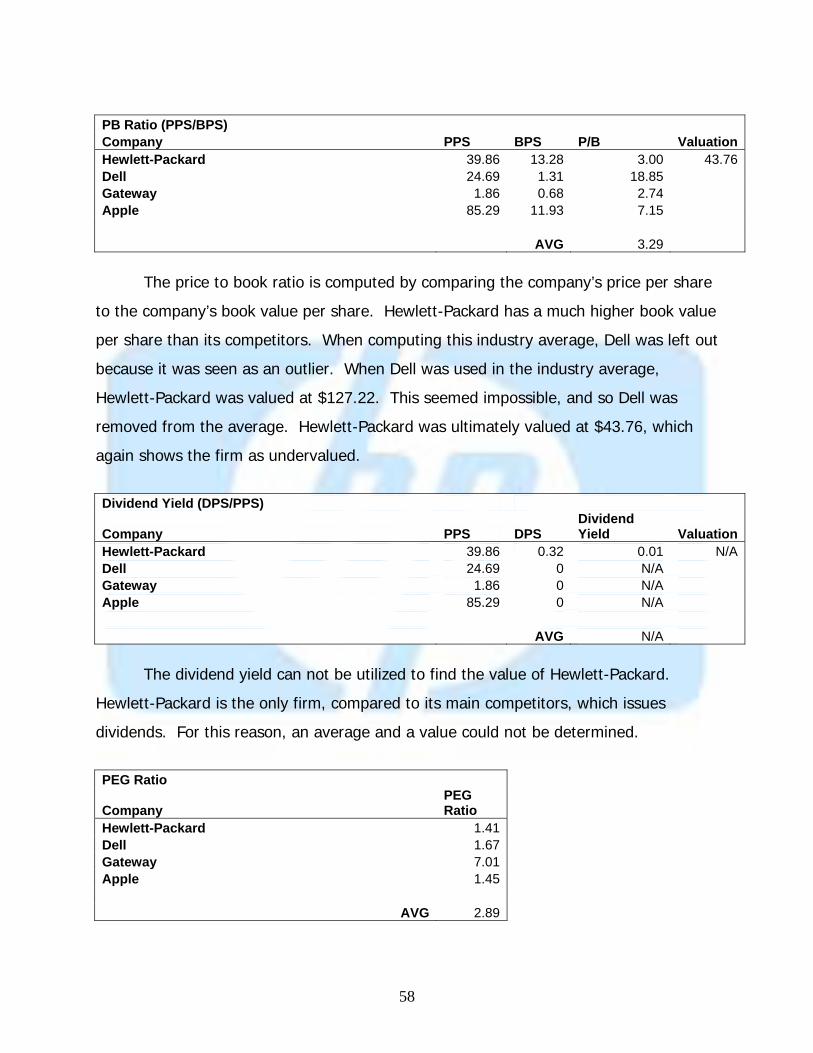
58
PB Ratio (PPS/BPS) Company PPS BPS P/B ValuationHewlett-Packard 39.86 13.28 3.00 43.76Dell 24.69 1.31 18.85 Gateway 1.86 0.68 2.74 Apple 85.29 11.93 7.15 AVG 3.29
The price to book ratio is computed by comparing the company’s price per share
to the company’s book value per share. Hewlett-Packard has a much higher book value
per share than its competitors. When computing this industry average, Dell was left out
because it was seen as an outlier. When Dell was used in the industry average,
Hewlett-Packard was valued at $127.22. This seemed impossible, and so Dell was
removed from the average. Hewlett-Packard was ultimately valued at $43.76, which
again shows the firm as undervalued.
Dividend Yield (DPS/PPS)
Company PPS DPS Dividend Yield Valuation
Hewlett-Packard 39.86 0.32 0.01 N/ADell 24.69 0 N/A Gateway 1.86 0 N/A Apple 85.29 0 N/A AVG N/A
The dividend yield can not be utilized to find the value of Hewlett-Packard.
Hewlett-Packard is the only firm, compared to its main competitors, which issues
dividends. For this reason, an average and a value could not be determined.
PEG Ratio
Company PEG Ratio
Hewlett-Packard 1.41Dell 1.67Gateway 7.01Apple 1.45
AVG 2.89
59
The PEG ratio is a comparison of the company’s price to earnings and their one
year future growth rate. Hewlett-Packard is shown as having the lowest PEG ratio out
of all of its competitors. Although Hewlett-Packard is the lowest of the competitors, it is
in line with the PEG ratios of Dell and Apple, which shows signs of steady industry
growth.
Many find the method of comparables not to be a valid way of valuing a firm,
given that the valuation is based solely on an industry average. Although it is an easy
and quick form of valuation, which many analysts opt to use, it is not necessarily the
most thorough. All of the ratios that were derived can be used to value HP, excluding
the dividend yield. If this form of valuation was used to value Hewlett-Packard, it can
be seen that every form of ratio shows that Hewlett-Packard is an undervalued firm.
Cost of Capital Estimates
When valuing a company, it is important to accurately estimate that cost of debt,
cost of equity, and the weight average cost of capital (WACC). The WACC is derived
once the cost of debt and cost of equity are found with relation to the market value of
debt and equity.
Cost of Debt
The cost of debt is found by giving a weighted average to each debt value in the
10-K in relation to total debt, then multiplying that amount to the interest rate assigned
to that value. All calculated information can be found in appendix D. The interest rates
assigned to each debt value were found by searching through Hewlett-Packard’s 10-K,
especially the special notes section. Once the weighted value of debt and interest rates
were found, the overall estimated cost of debt came to be 5.41%.
Cost of Equity
The most common formula for finding the cost of equity is the Capital Asset
Pricing Model, also called CAPM. The formula for CAPM is as follows:
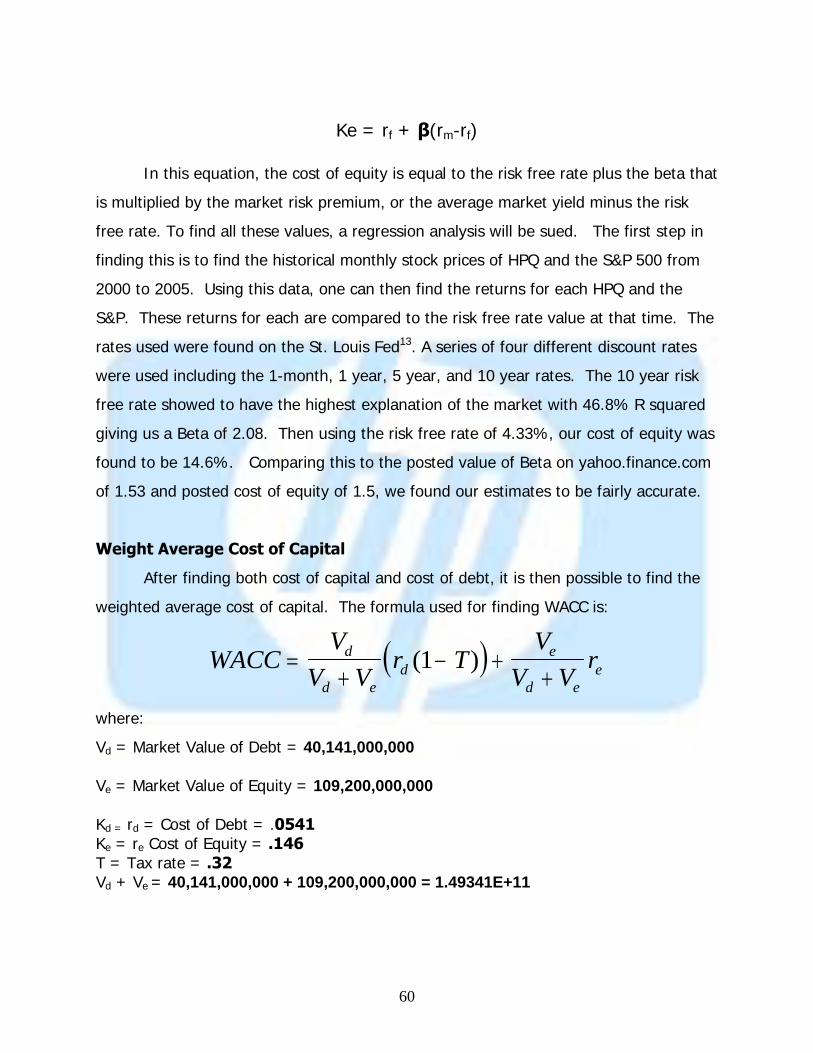
60
Ke = rf + β(rm-rf)
In this equation, the cost of equity is equal to the risk free rate plus the beta that
is multiplied by the market risk premium, or the average market yield minus the risk
free rate. To find all these values, a regression analysis will be sued. The first step in
finding this is to find the historical monthly stock prices of HPQ and the S&P 500 from
2000 to 2005. Using this data, one can then find the returns for each HPQ and the
S&P. These returns for each are compared to the risk free rate value at that time. The
rates used were found on the St. Louis Fed13. A series of four different discount rates
were used including the 1-month, 1 year, 5 year, and 10 year rates. The 10 year risk
free rate showed to have the highest explanation of the market with 46.8% R squared
giving us a Beta of 2.08. Then using the risk free rate of 4.33%, our cost of equity was
found to be 14.6%. Comparing this to the posted value of Beta on yahoo.finance.com
of 1.53 and posted cost of equity of 1.5, we found our estimates to be fairly accurate.
Weight Average Cost of Capital
After finding both cost of capital and cost of debt, it is then possible to find the
weighted average cost of capital. The formula used for finding WACC is:
( )WACCV
V Vr T
VV V
rd
d ed
e
d ee=
+− +
+( )1
where:
Vd = Market Value of Debt = 40,141,000,000 Ve = Market Value of Equity = 109,200,000,000 Kd = rd = Cost of Debt = .0541 Ke = re Cost of Equity = .146 T = Tax rate = .32 Vd + Ve = 40,141,000,000 + 109,200,000,000 = 1.49341E+11
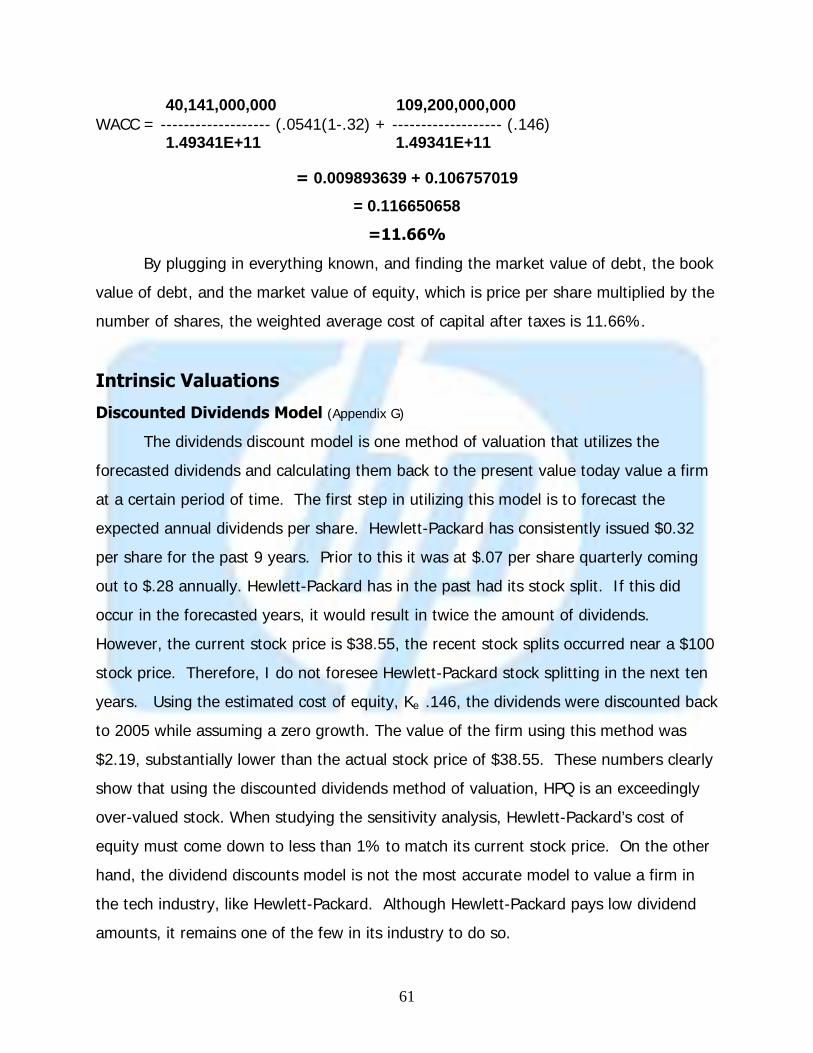
61
40,141,000,000 109,200,000,000 WACC = ------------------- (.0541(1-.32) + ------------------- (.146) 1.49341E+11 1.49341E+11
= 0.009893639 + 0.106757019
= 0.116650658
=11.66%
By plugging in everything known, and finding the market value of debt, the book
value of debt, and the market value of equity, which is price per share multiplied by the
number of shares, the weighted average cost of capital after taxes is 11.66%.
Intrinsic Valuations
Discounted Dividends Model (Appendix G)
The dividends discount model is one method of valuation that utilizes the
forecasted dividends and calculating them back to the present value today value a firm
at a certain period of time. The first step in utilizing this model is to forecast the
expected annual dividends per share. Hewlett-Packard has consistently issued $0.32
per share for the past 9 years. Prior to this it was at $.07 per share quarterly coming
out to $.28 annually. Hewlett-Packard has in the past had its stock split. If this did
occur in the forecasted years, it would result in twice the amount of dividends.
However, the current stock price is $38.55, the recent stock splits occurred near a $100
stock price. Therefore, I do not foresee Hewlett-Packard stock splitting in the next ten
years. Using the estimated cost of equity, Ke .146, the dividends were discounted back
to 2005 while assuming a zero growth. The value of the firm using this method was
$2.19, substantially lower than the actual stock price of $38.55. These numbers clearly
show that using the discounted dividends method of valuation, HPQ is an exceedingly
over-valued stock. When studying the sensitivity analysis, Hewlett-Packard’s cost of
equity must come down to less than 1% to match its current stock price. On the other
hand, the dividend discounts model is not the most accurate model to value a firm in
the tech industry, like Hewlett-Packard. Although Hewlett-Packard pays low dividend
amounts, it remains one of the few in its industry to do so.
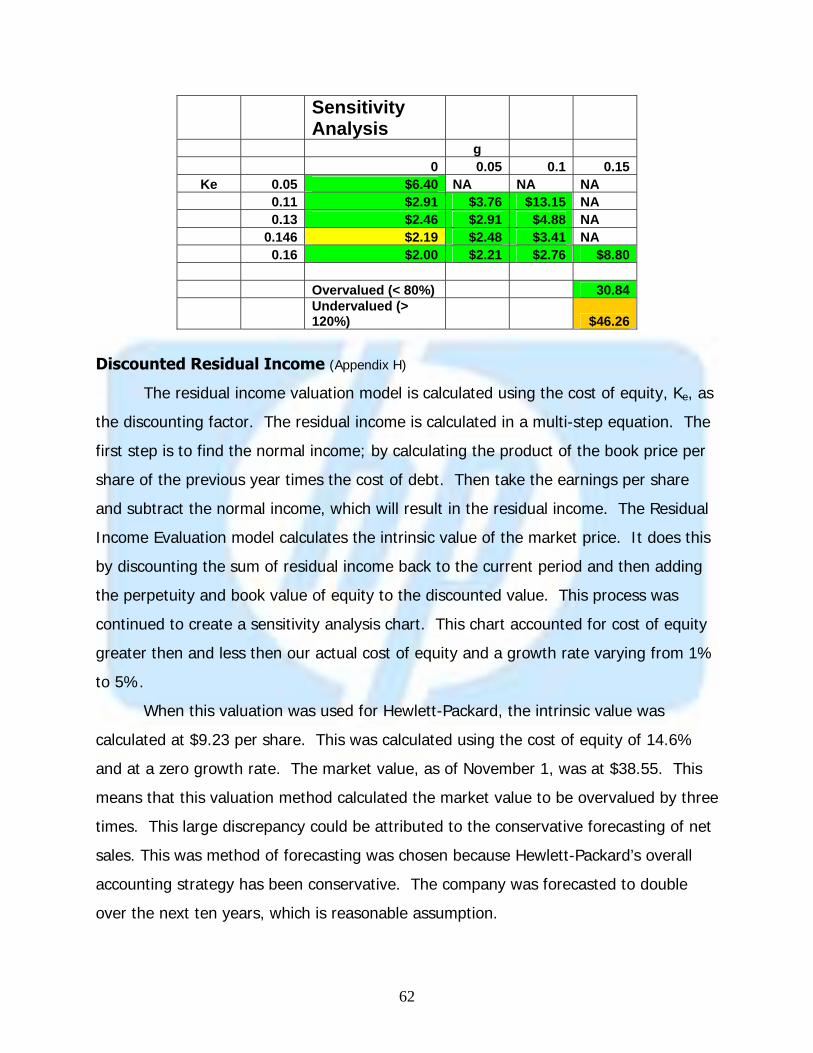
62
Sensitivity Analysis
g 0 0.05 0.1 0.15
Ke 0.05 $6.40 NA NA NA 0.11 $2.91 $3.76 $13.15 NA 0.13 $2.46 $2.91 $4.88 NA 0.146 $2.19 $2.48 $3.41 NA 0.16 $2.00 $2.21 $2.76 $8.80 Overvalued (< 80%) 30.84
Undervalued (> 120%) $46.26
Discounted Residual Income (Appendix H)
The residual income valuation model is calculated using the cost of equity, Ke, as
the discounting factor. The residual income is calculated in a multi-step equation. The
first step is to find the normal income; by calculating the product of the book price per
share of the previous year times the cost of debt. Then take the earnings per share
and subtract the normal income, which will result in the residual income. The Residual
Income Evaluation model calculates the intrinsic value of the market price. It does this
by discounting the sum of residual income back to the current period and then adding
the perpetuity and book value of equity to the discounted value. This process was
continued to create a sensitivity analysis chart. This chart accounted for cost of equity
greater then and less then our actual cost of equity and a growth rate varying from 1%
to 5%.
When this valuation was used for Hewlett-Packard, the intrinsic value was
calculated at $9.23 per share. This was calculated using the cost of equity of 14.6%
and at a zero growth rate. The market value, as of November 1, was at $38.55. This
means that this valuation method calculated the market value to be overvalued by three
times. This large discrepancy could be attributed to the conservative forecasting of net
sales. This was method of forecasting was chosen because Hewlett-Packard’s overall
accounting strategy has been conservative. The company was forecasted to double
over the next ten years, which is reasonable assumption.
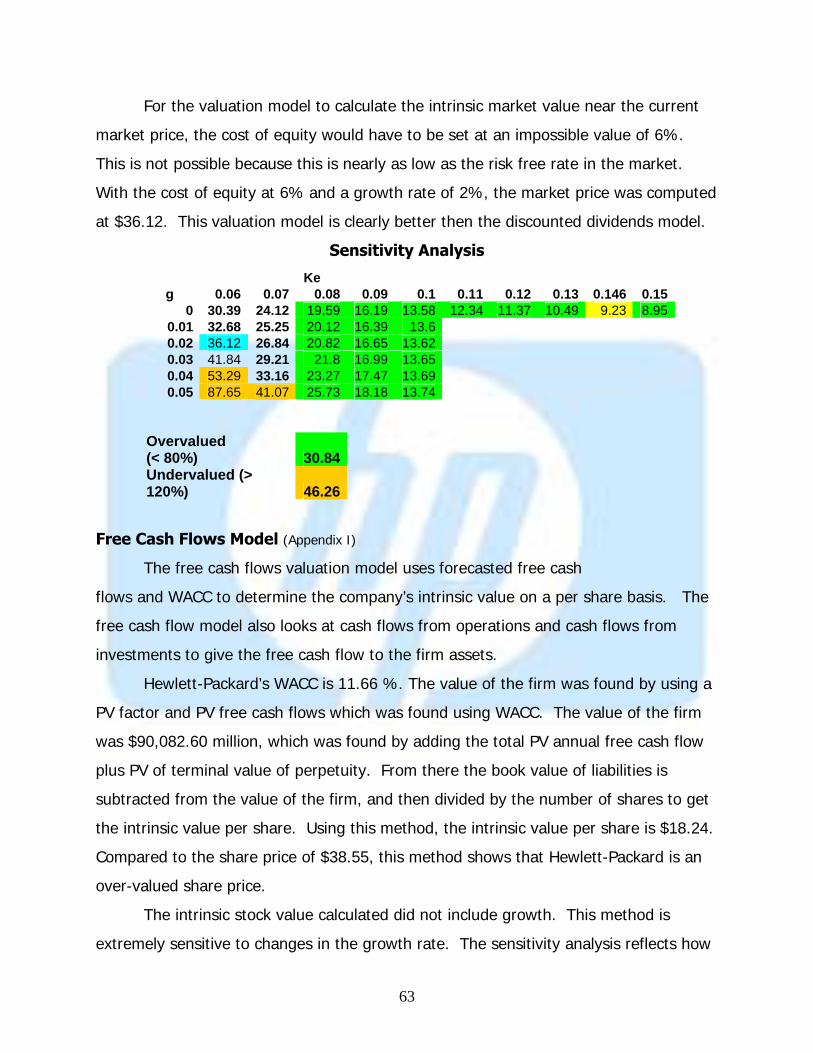
63
For the valuation model to calculate the intrinsic market value near the current
market price, the cost of equity would have to be set at an impossible value of 6%.
This is not possible because this is nearly as low as the risk free rate in the market.
With the cost of equity at 6% and a growth rate of 2%, the market price was computed
at $36.12. This valuation model is clearly better then the discounted dividends model.
Sensitivity Analysis
Ke g 0.06 0.07 0.08 0.09 0.1 0.11 0.12 0.13 0.146 0.15
0 30.39 24.12 19.59 16.19 13.58 12.34 11.37 10.49 9.23 8.950.01 32.68 25.25 20.12 16.39 13.6 0.02 36.12 26.84 20.82 16.65 13.62 0.03 41.84 29.21 21.8 16.99 13.65 0.04 53.29 33.16 23.27 17.47 13.69 0.05 87.65 41.07 25.73 18.18 13.74
Overvalued (< 80%) 30.84 Undervalued (> 120%) 46.26
Free Cash Flows Model (Appendix I)
The free cash flows valuation model uses forecasted free cash
flows and WACC to determine the company’s intrinsic value on a per share basis. The
free cash flow model also looks at cash flows from operations and cash flows from
investments to give the free cash flow to the firm assets.
Hewlett-Packard’s WACC is 11.66 %. The value of the firm was found by using a
PV factor and PV free cash flows which was found using WACC. The value of the firm
was $90,082.60 million, which was found by adding the total PV annual free cash flow
plus PV of terminal value of perpetuity. From there the book value of liabilities is
subtracted from the value of the firm, and then divided by the number of shares to get
the intrinsic value per share. Using this method, the intrinsic value per share is $18.24.
Compared to the share price of $38.55, this method shows that Hewlett-Packard is an
over-valued share price. The intrinsic stock value calculated did not include growth. This method is
extremely sensitive to changes in the growth rate. The sensitivity analysis reflects how
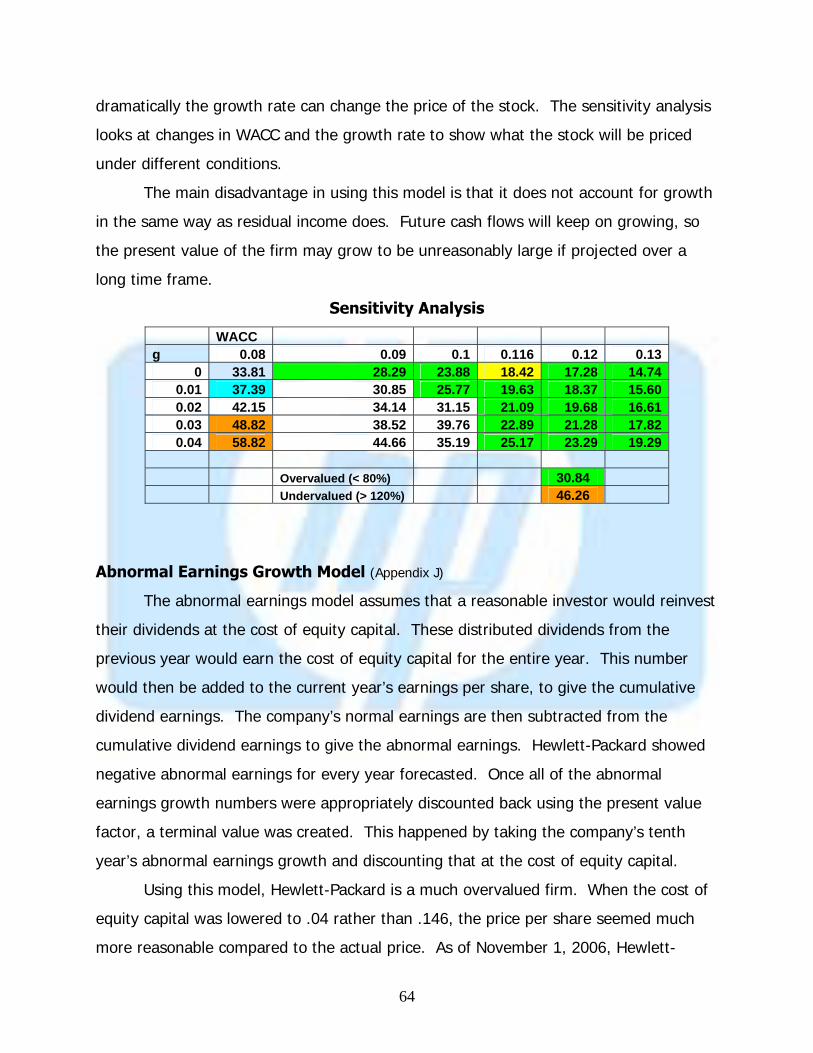
64
dramatically the growth rate can change the price of the stock. The sensitivity analysis
looks at changes in WACC and the growth rate to show what the stock will be priced
under different conditions.
The main disadvantage in using this model is that it does not account for growth
in the same way as residual income does. Future cash flows will keep on growing, so
the present value of the firm may grow to be unreasonably large if projected over a
long time frame.
Sensitivity Analysis
WACC g 0.08 0.09 0.1 0.116 0.12 0.13
0 33.81 28.29 23.88 18.42 17.28 14.740.01 37.39 30.85 25.77 19.63 18.37 15.600.02 42.15 34.14 31.15 21.09 19.68 16.610.03 48.82 38.52 39.76 22.89 21.28 17.820.04 58.82 44.66 35.19 25.17 23.29 19.29
Overvalued (< 80%) 30.84 Undervalued (> 120%) 46.26
Abnormal Earnings Growth Model (Appendix J)
The abnormal earnings model assumes that a reasonable investor would reinvest
their dividends at the cost of equity capital. These distributed dividends from the
previous year would earn the cost of equity capital for the entire year. This number
would then be added to the current year’s earnings per share, to give the cumulative
dividend earnings. The company’s normal earnings are then subtracted from the
cumulative dividend earnings to give the abnormal earnings. Hewlett-Packard showed
negative abnormal earnings for every year forecasted. Once all of the abnormal
earnings growth numbers were appropriately discounted back using the present value
factor, a terminal value was created. This happened by taking the company’s tenth
year’s abnormal earnings growth and discounting that at the cost of equity capital.
Using this model, Hewlett-Packard is a much overvalued firm. When the cost of
equity capital was lowered to .04 rather than .146, the price per share seemed much
more reasonable compared to the actual price. As of November 1, 2006, Hewlett-
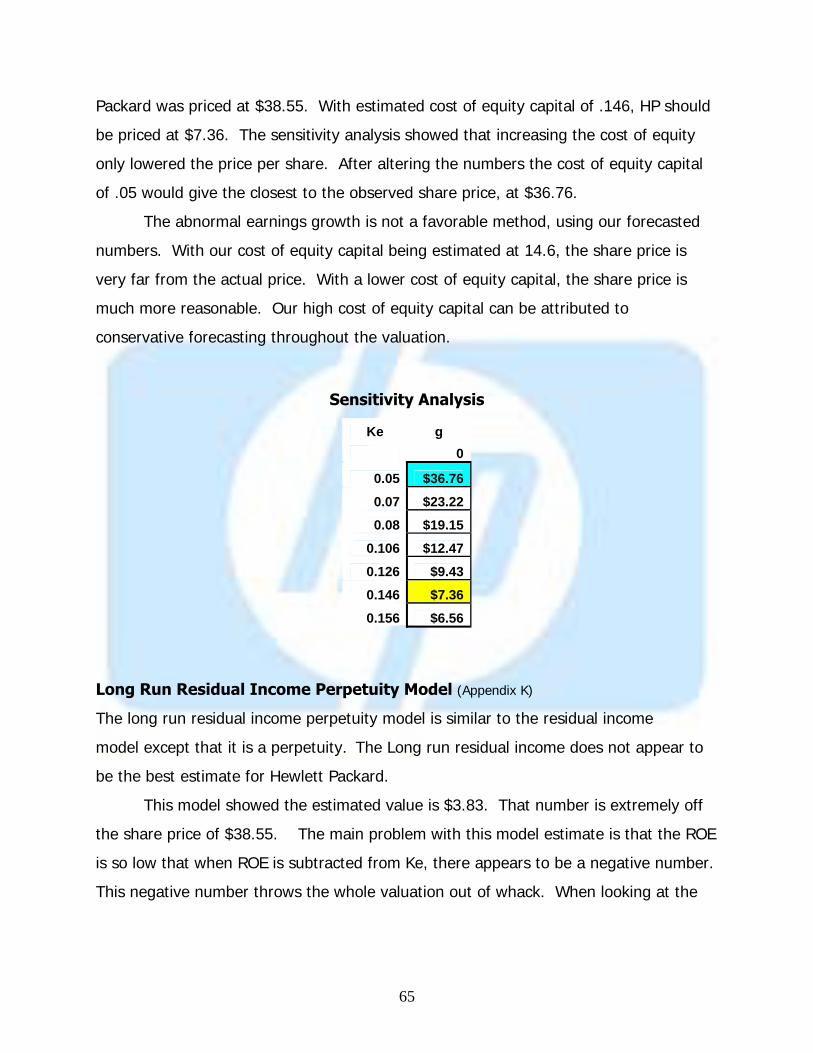
65
Packard was priced at $38.55. With estimated cost of equity capital of .146, HP should
be priced at $7.36. The sensitivity analysis showed that increasing the cost of equity
only lowered the price per share. After altering the numbers the cost of equity capital
of .05 would give the closest to the observed share price, at $36.76.
The abnormal earnings growth is not a favorable method, using our forecasted
numbers. With our cost of equity capital being estimated at 14.6, the share price is
very far from the actual price. With a lower cost of equity capital, the share price is
much more reasonable. Our high cost of equity capital can be attributed to
conservative forecasting throughout the valuation.
Sensitivity Analysis
Ke g 0
0.05 $36.76
0.07 $23.22
0.08 $19.15
0.106 $12.47
0.126 $9.43
0.146 $7.36
0.156 $6.56
Long Run Residual Income Perpetuity Model (Appendix K)
The long run residual income perpetuity model is similar to the residual income
model except that it is a perpetuity. The Long run residual income does not appear to
be the best estimate for Hewlett Packard.
This model showed the estimated value is $3.83. That number is extremely off
the share price of $38.55. The main problem with this model estimate is that the ROE
is so low that when ROE is subtracted from Ke, there appears to be a negative number.
This negative number throws the whole valuation out of whack. When looking at the
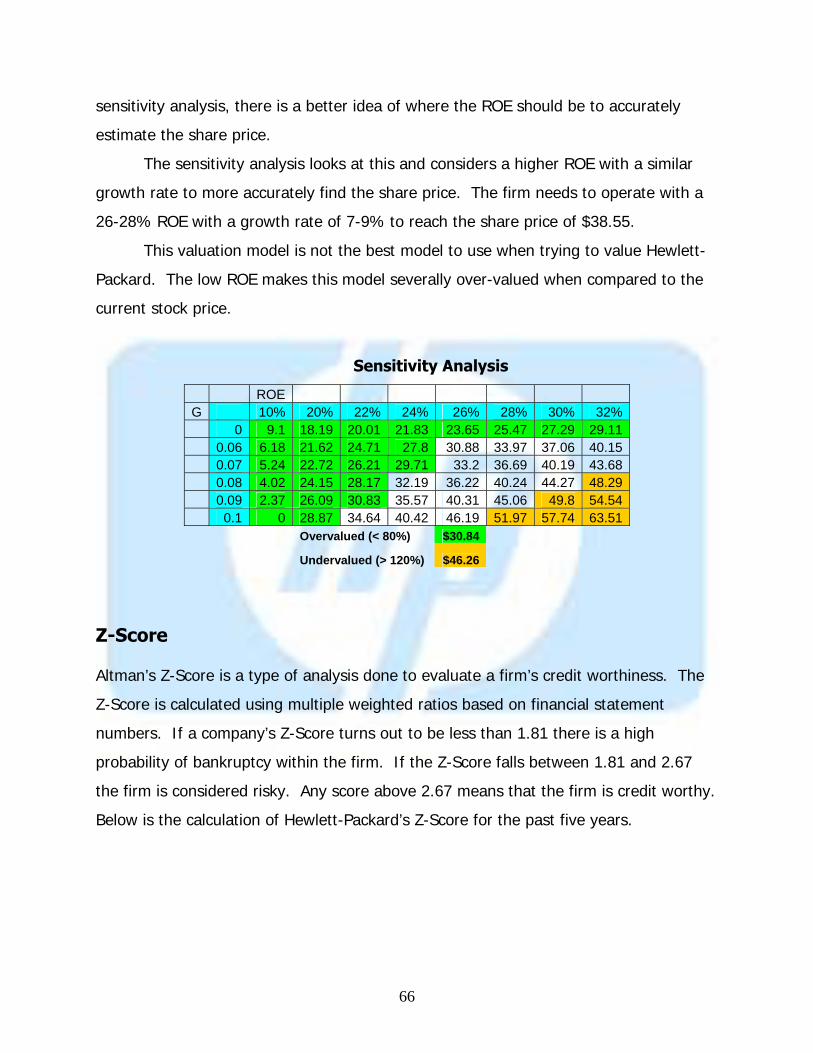
66
sensitivity analysis, there is a better idea of where the ROE should be to accurately
estimate the share price.
The sensitivity analysis looks at this and considers a higher ROE with a similar
growth rate to more accurately find the share price. The firm needs to operate with a
26-28% ROE with a growth rate of 7-9% to reach the share price of $38.55.
This valuation model is not the best model to use when trying to value Hewlett-
Packard. The low ROE makes this model severally over-valued when compared to the
current stock price.
Sensitivity Analysis
ROE G 10% 20% 22% 24% 26% 28% 30% 32% 0 9.1 18.19 20.01 21.83 23.65 25.47 27.29 29.11 0.06 6.18 21.62 24.71 27.8 30.88 33.97 37.06 40.15 0.07 5.24 22.72 26.21 29.71 33.2 36.69 40.19 43.68 0.08 4.02 24.15 28.17 32.19 36.22 40.24 44.27 48.29 0.09 2.37 26.09 30.83 35.57 40.31 45.06 49.8 54.54 0.1 0 28.87 34.64 40.42 46.19 51.97 57.74 63.51 Overvalued (< 80%) $30.84
Undervalued (> 120%) $46.26
Z-Score Altman’s Z-Score is a type of analysis done to evaluate a firm’s credit worthiness. The
Z-Score is calculated using multiple weighted ratios based on financial statement
numbers. If a company’s Z-Score turns out to be less than 1.81 there is a high
probability of bankruptcy within the firm. If the Z-Score falls between 1.81 and 2.67
the firm is considered risky. Any score above 2.67 means that the firm is credit worthy.
Below is the calculation of Hewlett-Packard’s Z-Score for the past five years.
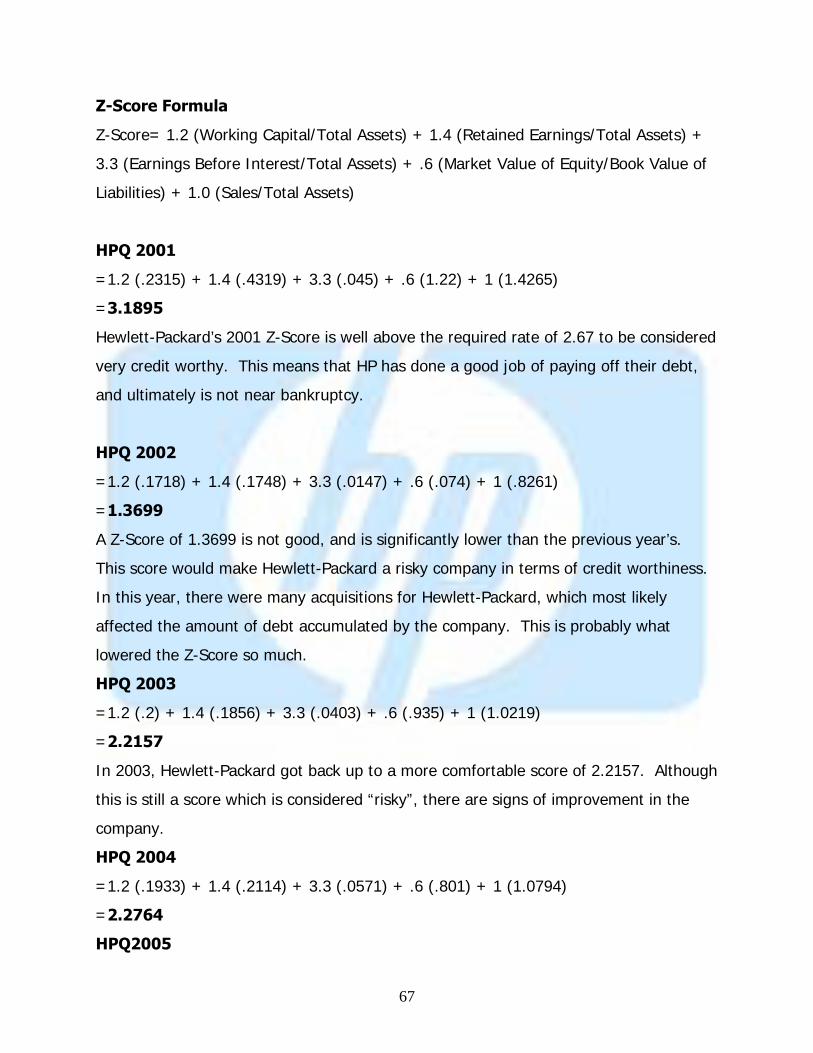
67
Z-Score Formula
Z-Score= 1.2 (Working Capital/Total Assets) + 1.4 (Retained Earnings/Total Assets) +
3.3 (Earnings Before Interest/Total Assets) + .6 (Market Value of Equity/Book Value of
Liabilities) + 1.0 (Sales/Total Assets)
HPQ 2001
=1.2 (.2315) + 1.4 (.4319) + 3.3 (.045) + .6 (1.22) + 1 (1.4265)
=3.1895
Hewlett-Packard’s 2001 Z-Score is well above the required rate of 2.67 to be considered
very credit worthy. This means that HP has done a good job of paying off their debt,
and ultimately is not near bankruptcy.
HPQ 2002
=1.2 (.1718) + 1.4 (.1748) + 3.3 (.0147) + .6 (.074) + 1 (.8261)
=1.3699
A Z-Score of 1.3699 is not good, and is significantly lower than the previous year’s.
This score would make Hewlett-Packard a risky company in terms of credit worthiness.
In this year, there were many acquisitions for Hewlett-Packard, which most likely
affected the amount of debt accumulated by the company. This is probably what
lowered the Z-Score so much.
HPQ 2003
=1.2 (.2) + 1.4 (.1856) + 3.3 (.0403) + .6 (.935) + 1 (1.0219)
=2.2157
In 2003, Hewlett-Packard got back up to a more comfortable score of 2.2157. Although
this is still a score which is considered “risky”, there are signs of improvement in the
company.
HPQ 2004
=1.2 (.1933) + 1.4 (.2114) + 3.3 (.0571) + .6 (.801) + 1 (1.0794)
=2.2764
HPQ2005
68
=1.2 (.1582) + 1.4 (.2222) + 3.3 (.0462) + .6 (1.05) + 1 (1.1551)
=2.4385
Once again, the 2004 and 2005 Z-Scores increased year to year since 2003. This
shows that the company is on their way back to a good credit score. It seems that the
firm has done a good job of paying off their debt.
Overall, the Z-Score is one way of assessing a company’s credit worthiness and
shows that as of 2005, Hewlett-Packard is considered risky based on Altman’s theory.
This is somewhat consistent with the findings from the intrinsic valuations, which
concluded the firm to be overvalued.
Conclusion
Using the different methods of valuation, Hewlett-Packard is an over-valued firm.
In the method of comparables approach, Hewlett-Packard was shown to be and under-
valued firm. This approach is not favorable due to the use of an industry average, and
therefore that valuation is basically void. Using the intrinsic valuations, Hewlett-Packard
was shown to be highly over-valued.
When using forecasts to value a company, it is possible to have many errors
along the way. The computation of WACC and cost of debt have a high possibility of
being inaccurate, which would affect every intrinsic valuation model. There is also the
possibility of a too conservative forecasting approach. This would affect the earnings
per share, which was also used in all of the intrinsic valuations models.
The Altman’s Z-score computation also shows a negative aspect to Hewlett-
Packard, with its overall Z-Score falling in the range of 1.81 to 2.67, making the
company a risky investment due to the possibility of bankruptcy.
For all of these reasons, it was concluded that Hewlett-Packard is over-valued
and our investment recommendation is Sell.
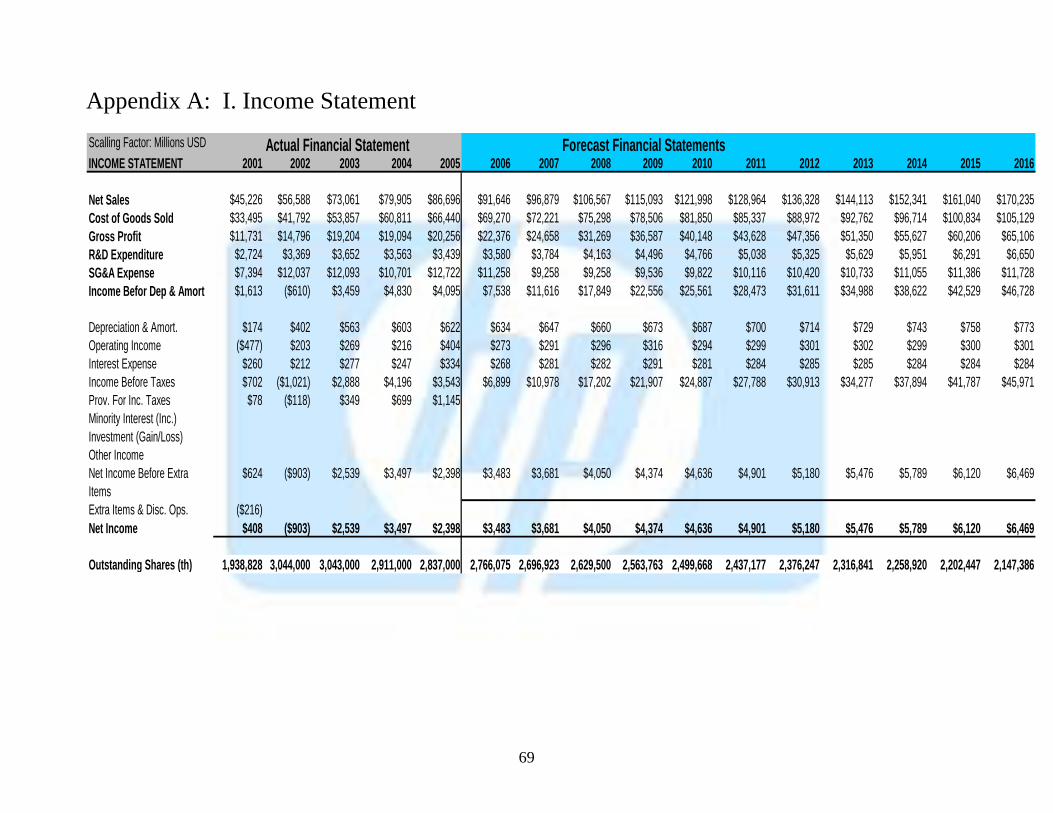
69
Appendix A: I. Income Statement Scalling Factor: Millions USD Actual Financial Statement Forecast Financial StatementsINCOME STATEMENT 2001 2002 2003 2004 2005 2006 2007 2008 2009 2010 2011 2012 2013 2014 2015 2016
Net Sales $45,226 $56,588 $73,061 $79,905 $86,696 $91,646 $96,879 $106,567 $115,093 $121,998 $128,964 $136,328 $144,113 $152,341 $161,040 $170,235 Cost of Goods Sold $33,495 $41,792 $53,857 $60,811 $66,440 $69,270 $72,221 $75,298 $78,506 $81,850 $85,337 $88,972 $92,762 $96,714 $100,834 $105,129 Gross Profit $11,731 $14,796 $19,204 $19,094 $20,256 $22,376 $24,658 $31,269 $36,587 $40,148 $43,628 $47,356 $51,350 $55,627 $60,206 $65,106 R&D Expenditure $2,724 $3,369 $3,652 $3,563 $3,439 $3,580 $3,784 $4,163 $4,496 $4,766 $5,038 $5,325 $5,629 $5,951 $6,291 $6,650 SG&A Expense $7,394 $12,037 $12,093 $10,701 $12,722 $11,258 $9,258 $9,258 $9,536 $9,822 $10,116 $10,420 $10,733 $11,055 $11,386 $11,728 Income Befor Dep & Amort $1,613 ($610) $3,459 $4,830 $4,095 $7,538 $11,616 $17,849 $22,556 $25,561 $28,473 $31,611 $34,988 $38,622 $42,529 $46,728
Depreciation & Amort. $174 $402 $563 $603 $622 $634 $647 $660 $673 $687 $700 $714 $729 $743 $758 $773 Operating Income ($477) $203 $269 $216 $404 $273 $291 $296 $316 $294 $299 $301 $302 $299 $300 $301 Interest Expense $260 $212 $277 $247 $334 $268 $281 $282 $291 $281 $284 $285 $285 $284 $284 $284 Income Before Taxes $702 ($1,021) $2,888 $4,196 $3,543 $6,899 $10,978 $17,202 $21,907 $24,887 $27,788 $30,913 $34,277 $37,894 $41,787 $45,971 Prov. For Inc. Taxes $78 ($118) $349 $699 $1,145 Minority Interest (Inc.)Investment (Gain/Loss)Other IncomeNet Income Before Extra Items
$624 ($903) $2,539 $3,497 $2,398 $3,483 $3,681 $4,050 $4,374 $4,636 $4,901 $5,180 $5,476 $5,789 $6,120 $6,469
Extra Items & Disc. Ops. ($216)Net Income $408 ($903) $2,539 $3,497 $2,398 $3,483 $3,681 $4,050 $4,374 $4,636 $4,901 $5,180 $5,476 $5,789 $6,120 $6,469
Outstanding Shares (th) 1,938,828 3,044,000 3,043,000 2,911,000 2,837,000 2,766,075 2,696,923 2,629,500 2,563,763 2,499,668 2,437,177 2,376,247 2,316,841 2,258,920 2,202,447 2,147,386
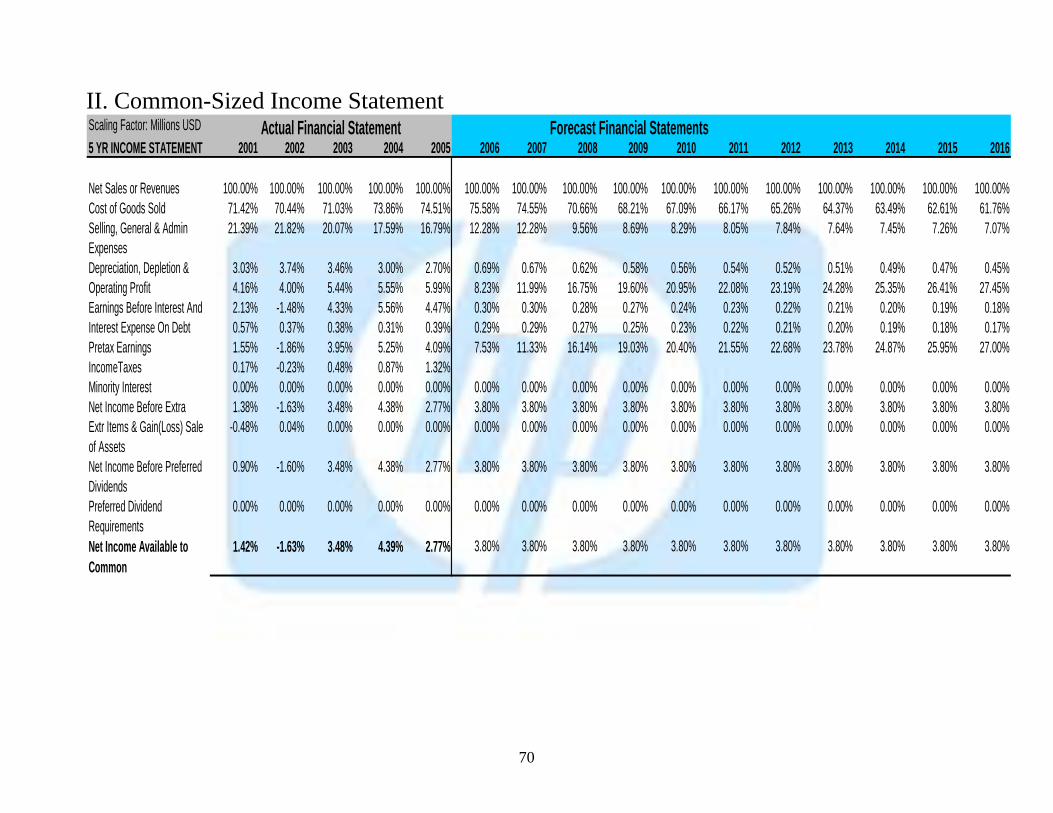
70
II. Common-Sized Income Statement Scaling Factor: Millions USD Actual Financial Statement Forecast Financial Statements
2001 2002 2003 2004 2005 2006 2007 2008 2009 2010 2011 2012 2013 2014 2015 2016
Net Sales or Revenues 100.00% 100.00% 100.00% 100.00% 100.00% 100.00% 100.00% 100.00% 100.00% 100.00% 100.00% 100.00% 100.00% 100.00% 100.00% 100.00%Cost of Goods Sold 71.42% 70.44% 71.03% 73.86% 74.51% 75.58% 74.55% 70.66% 68.21% 67.09% 66.17% 65.26% 64.37% 63.49% 62.61% 61.76%Selling, General & Admin Expenses
21.39% 21.82% 20.07% 17.59% 16.79% 12.28% 12.28% 9.56% 8.69% 8.29% 8.05% 7.84% 7.64% 7.45% 7.26% 7.07%
3.03% 3.74% 3.46% 3.00% 2.70% 0.69% 0.67% 0.62% 0.58% 0.56% 0.54% 0.52% 0.51% 0.49% 0.47% 0.45%Operating Profit 4.16% 4.00% 5.44% 5.55% 5.99% 8.23% 11.99% 16.75% 19.60% 20.95% 22.08% 23.19% 24.28% 25.35% 26.41% 27.45%
2.13% -1.48% 4.33% 5.56% 4.47% 0.30% 0.30% 0.28% 0.27% 0.24% 0.23% 0.22% 0.21% 0.20% 0.19% 0.18%Interest Expense On Debt 0.57% 0.37% 0.38% 0.31% 0.39% 0.29% 0.29% 0.27% 0.25% 0.23% 0.22% 0.21% 0.20% 0.19% 0.18% 0.17%Pretax Earnings 1.55% -1.86% 3.95% 5.25% 4.09% 7.53% 11.33% 16.14% 19.03% 20.40% 21.55% 22.68% 23.78% 24.87% 25.95% 27.00%IncomeTaxes 0.17% -0.23% 0.48% 0.87% 1.32%Minority Interest 0.00% 0.00% 0.00% 0.00% 0.00% 0.00% 0.00% 0.00% 0.00% 0.00% 0.00% 0.00% 0.00% 0.00% 0.00% 0.00%
1.38% -1.63% 3.48% 4.38% 2.77% 3.80% 3.80% 3.80% 3.80% 3.80% 3.80% 3.80% 3.80% 3.80% 3.80% 3.80%Extr Items & Gain(Loss) Sale of Assets
-0.48% 0.04% 0.00% 0.00% 0.00% 0.00% 0.00% 0.00% 0.00% 0.00% 0.00% 0.00% 0.00% 0.00% 0.00% 0.00%
Net Income Before Preferred Dividends
0.90% -1.60% 3.48% 4.38% 2.77% 3.80% 3.80% 3.80% 3.80% 3.80% 3.80% 3.80% 3.80% 3.80% 3.80% 3.80%
Preferred Dividend Requirements
0.00% 0.00% 0.00% 0.00% 0.00% 0.00% 0.00% 0.00% 0.00% 0.00% 0.00% 0.00% 0.00% 0.00% 0.00% 0.00%
Net Income Available to Common
1.42% -1.63% 3.48% 4.39% 2.77% 3.80% 3.80% 3.80% 3.80% 3.80% 3.80% 3.80% 3.80% 3.80% 3.80% 3.80%
5 YR INCOME STATEMENT
Depreciation, Depletion &
Earnings Before Interest And
Net Income Before Extra

71
Appendix B: I. Balance Sheet Scalling Factor: Millions USD Actual Financial Statement Forecast Financial StatementsAsset 2001 2002 2003 2004 2005 2006 2007 2008 2009 2010 2011 2012 2013 2014 2015 2016
Cash 4,197 11,192 14,188 12,663 13,911 13,971.60 15,412.40 17,220.76 18,270.40 19,482.49 20,416.99 21,742.67 22,995.69 24,246.96 25,644.89 27,093.92
Marketable Securities 139 237 403 311 18 294.11 296.55 325.30 306.62 297.73 372.12 384.54 399.57 413.86 439.19 474.03Receivables 6,671 14,646 16,092 18,010 17,364 18,471.57 19,758.53 21,993.66 23,912.90 25,073.14 26,442.25 28,047.06 29,699.90 31,386.79 33,122.89 35,019.68Inventories 5,204 5,797 6,065 7,071 6,877 8,565.40 8,000.09 8,942.21 9,858.82 10,442.26 11,121.99 11,560.18 12,284.22 13,026.14 13,764.98 14,546.95Other Current Assets 5,094 4,203 4,248 4,846 5,164 6,840.78 5,872.93 6,579.23 7,314.77 7,866.45 8,383.65 8,599.63 9,161.56 9,740.58 10,309.12 10,881.97Total Current Assets 21,305 36,075 40,996 42,901 43,334 48,143.46 49,340.49 55,061.16 59,663.51 63,162.06 66,736.99 70,334.08 74,540.94 78,814.33 83,281.07 88,016.53Net Property & Equipment 4,397 6,924 6,482 6,649 6,451 8,322.73 8,136.58 8,807.84 9,565.71 10,194.64 10,939.47 11,400.84 12,041.49 12,756.66 13,505.17 14,286.47Interest & Adv. to Subsidiaries 2,144 1,193 759 480 435 1,777.96 1,074.89 1,085.90 1,190.79 1,372.26 1,606.37 1,508.76 1,594.10 1,711.68 1,838.07 1,948.66Other Non-Current Assets 2,169 2,792 2,698 2,168 2,246 3,389.04 3,104.82 3,319.13 3,531.88 3,849.25 4,189.09 4,305.67 4,538.12 4,807.74 5,110.33 5,408.31Deferred Charges 880 2,210 2,859 2,111 2,263 2,605.57 2,820.69 3,106.51 3,210.40 3,457.23 3,686.56 3,901.29 4,109.68 4,325.04 4,587.99 4,855.12Intangibles 756 19,953 19,250 19,931 20,030 18,395.29 22,918.54 24,683.73 26,498.28 27,791.73 29,067.34 31,399.73 33,012.71 34,820.04 36,754.53 38,867.79Long Term Assets 933 1,563 1,664 1,898 2,558 2,223.69 2,307.09 2,609.13 2,906.71 3,134.15 3,185.59 3,379.42 3,600.48 3,821.31 4,033.99 4,242.52Total Assets 32,584 70,710 74,708 76,138 77,317 84,858 89,703 98,673 106,567 112,961 119,411 126,230 133,438 141,057 149,111 157,625 LIABILITIES & SHAREHOLDERS' EQUITY
Notes Payable 1,618 1,271 799 650 649 1,617 1,160 1,176 1,297 1,456 1,647 1,608 1,695 1,814 1,938 2,052 Accounts Payable 3,791 7,012 9,285 9,377 10,223 10,101 10,726 12,201 13,164 13,962 14,554 15,457 16,416 17,335 18,306 19,325 Curr. Long-Term Debt 104 522 281 1,861 1,182 918 1,107 1,315 1,624 1,514 1,555 1,700 1,827 1,942 2,009 2,125 Accrued Expense 4,766 10,716 11,009 12,033 13,224 13,140 14,045 15,548 17,010 18,066 18,832 19,979 21,166 22,404 23,660 24,971
Income Taxes 1,818 1,529 1,599 1,709 2,367 2,578 2,269 2,568 2,872 3,146 3,260 3,368 3,598 3,830 4,054 4,265 Other Curr. Liabilities 1,867 3,260 3,657 2,958 3,815 4,082 4,151 4,569 4,878 5,327 5,579 5,863 6,203 6,562 6,958 7,340 Total Current Liabilities 13,964 24,310 26,630 28,588 31,460 32,436 33,457 37,378 40,845 43,472 45,427 47,975 50,904 53,886 56,926 60,079 Deferred Charges/Inc. NA NA NA 1,390 1,331 1,505 1,591 1,750 1,890 1,992 2,115 2,236 2,363 2,497 2,638 2,791 Convertable Debt 930 636 656 676 698 1,090 871 972 1,072 1,163 1,260 1,274 1,357 1,444 1,531 1,618 Long-Term Debt 2,799 5,399 5,838 3,947 2,694 5,551 5,501 5,754 5,792 6,196 7,027 7,263 7,576 7,966 8,484 9,033 Other Long-Term Liab. 938 4,103 3,838 3,973 3,958 4,100 4,684 5,038 5,434 5,733 6,050 6,455 6,795 7,179 7,586 8,023 Total Liabilities 18,631 34,448 36,962 38,574 40,141 44,681 46,103 50,892 55,033 58,556 61,880 65,203 68,995 72,971 77,165 81,543
Preferred StockCommon Stock Net 19 30 30 29 28 29 29 29 29 29 29 29 29 29 29 29 Capital Surplus 200 24,660 24,587 22,129 20,490 15,643 17,811 20,721 23,081 24,400 25,782 27,574 29,198 30,931 32,758 34,745 Retained Earnings 13,693 11,973 13,332 15,649 16,679 24,504 25,760 27,032 28,425 29,977 31,720 33,425 35,216 37,125 39,160 41,308 Total Shareholder Equity 13,953 36,262 37,746 37,564 37,176 40,176 43,600 47,782 51,535 54,406 57,532 61,027 64,443 68,086 71,947 76,082
Total Liabilities & Net Worth 32,584 70,710 74,708 76,138 77,317 84,858 89,703 98,673 106,567 112,961 119,411 126,230 133,438 141,057 149,111 157,625 40,176 43,600 47,782 51,535 54,406 57,532 61,027 64,443 68,086 71,947 76,082
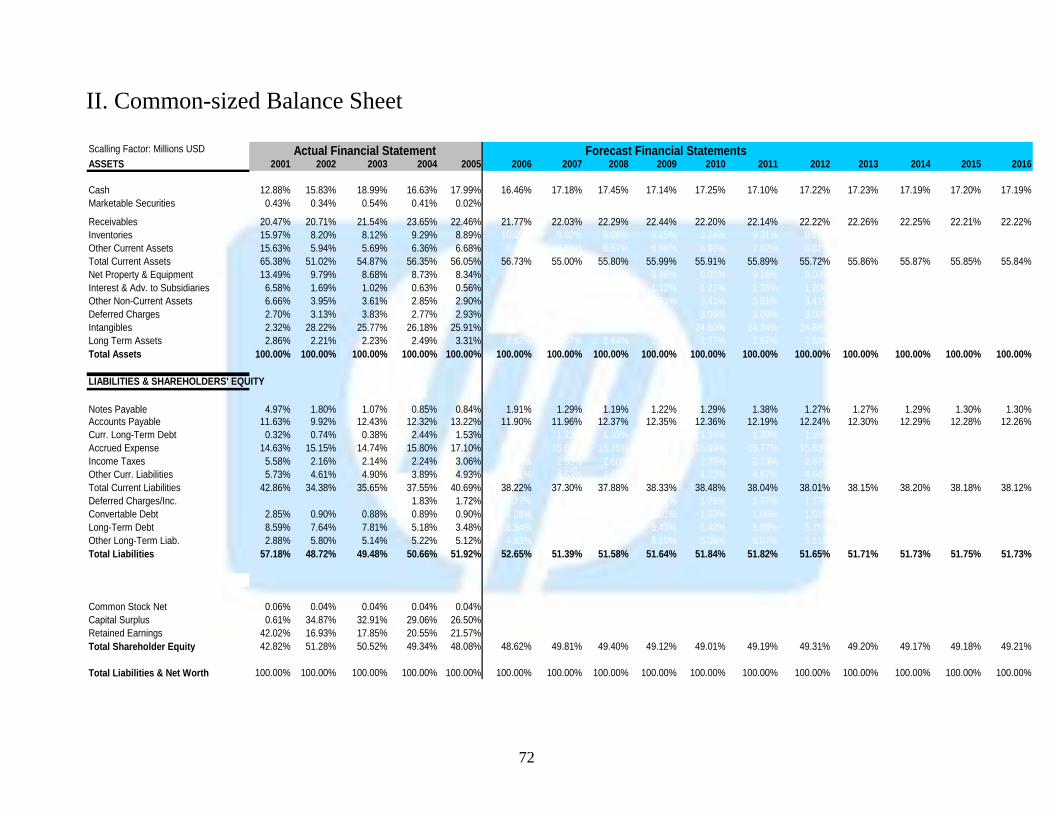
72
II. Common-sized Balance Sheet Scalling Factor: Millions USD Actual Financial Statement Forecast Financial StatementsASSETS 2001 2002 2003 2004 2005 2006 2007 2008 2009 2010 2011 2012 2013 2014 2015 2016
Cash 12.88% 15.83% 18.99% 16.63% 17.99% 16.46% 17.18% 17.45% 17.14% 17.25% 17.10% 17.22% 17.23% 17.19% 17.20% 17.19%Marketable Securities 0.43% 0.34% 0.54% 0.41% 0.02% 0.35% 0.33% 0.33% 0.29% 0.26% 0.31% 0.30% 0.30% 0.29% 0.29% 0.30%
Receivables 20.47% 20.71% 21.54% 23.65% 22.46% 21.77% 22.03% 22.29% 22.44% 22.20% 22.14% 22.22% 22.26% 22.25% 22.21% 22.22%Inventories 15.97% 8.20% 8.12% 9.29% 8.89% 10.09% 8.92% 9.06% 9.25% 9.24% 9.31% 9.16% 9.21% 9.23% 9.23% 9.23%Other Current Assets 15.63% 5.94% 5.69% 6.36% 6.68% 8.06% 6.55% 6.67% 6.86% 6.96% 7.02% 6.81% 6.87% 6.91% 6.91% 6.90%Total Current Assets 65.38% 51.02% 54.87% 56.35% 56.05% 56.73% 55.00% 55.80% 55.99% 55.91% 55.89% 55.72% 55.86% 55.87% 55.85% 55.84%Net Property & Equipment 13.49% 9.79% 8.68% 8.73% 8.34% 9.81% 9.07% 8.93% 8.98% 9.02% 9.16% 9.03% 9.02% 9.04% 9.06% 9.06%Interest & Adv. to Subsidiaries 6.58% 1.69% 1.02% 0.63% 0.56% 2.10% 1.20% 1.10% 1.12% 1.21% 1.35% 1.20% 1.19% 1.21% 1.23% 1.24%Other Non-Current Assets 6.66% 3.95% 3.61% 2.85% 2.90% 3.99% 3.46% 3.36% 3.31% 3.41% 3.51% 3.41% 3.40% 3.41% 3.43% 3.43%Deferred Charges 2.70% 3.13% 3.83% 2.77% 2.93% 3.07% 3.14% 3.15% 3.01% 3.06% 3.09% 3.09% 3.08% 3.07% 3.08% 3.08%Intangibles 2.32% 28.22% 25.77% 26.18% 25.91% 21.68% 25.55% 25.02% 24.87% 24.60% 24.34% 24.88% 24.74% 24.69% 24.65% 24.66%Long Term Assets 2.86% 2.21% 2.23% 2.49% 3.31% 2.62% 2.57% 2.64% 2.73% 2.77% 2.67% 2.68% 2.70% 2.71% 2.71% 2.69%Total Assets 100.00% 100.00% 100.00% 100.00% 100.00% 100.00% 100.00% 100.00% 100.00% 100.00% 100.00% 100.00% 100.00% 100.00% 100.00% 100.00%
LIABILITIES & SHAREHOLDERS' EQUITY
Notes Payable 4.97% 1.80% 1.07% 0.85% 0.84% 1.91% 1.29% 1.19% 1.22% 1.29% 1.38% 1.27% 1.27% 1.29% 1.30% 1.30%Accounts Payable 11.63% 9.92% 12.43% 12.32% 13.22% 11.90% 11.96% 12.37% 12.35% 12.36% 12.19% 12.24% 12.30% 12.29% 12.28% 12.26%Curr. Long-Term Debt 0.32% 0.74% 0.38% 2.44% 1.53% 1.08% 1.23% 1.33% 1.52% 1.34% 1.30% 1.35% 1.37% 1.38% 1.35% 1.35%Accrued Expense 14.63% 15.15% 14.74% 15.80% 17.10% 15.49% 15.66% 15.76% 15.96% 15.99% 15.77% 15.83% 15.86% 15.88% 15.87% 15.84%Income Taxes 5.58% 2.16% 2.14% 2.24% 3.06% 3.04% 2.53% 2.60% 2.70% 2.79% 2.73% 2.67% 2.70% 2.72% 2.72% 2.71%Other Curr. Liabilities 5.73% 4.61% 4.90% 3.89% 4.93% 4.81% 4.63% 4.63% 4.58% 4.72% 4.67% 4.64% 4.65% 4.65% 4.67% 4.66%Total Current Liabilities 42.86% 34.38% 35.65% 37.55% 40.69% 38.22% 37.30% 37.88% 38.33% 38.48% 38.04% 38.01% 38.15% 38.20% 38.18% 38.12%Deferred Charges/Inc. 1.83% 1.72% 1.77% 1.77% 1.77% 1.77% 1.76% 1.77% 1.77% 1.77% 1.77% 1.77% 1.77%Convertable Debt 2.85% 0.90% 0.88% 0.89% 0.90% 1.28% 0.97% 0.98% 1.01% 1.03% 1.06% 1.01% 1.02% 1.02% 1.03% 1.03%Long-Term Debt 8.59% 7.64% 7.81% 5.18% 3.48% 6.54% 6.13% 5.83% 5.43% 5.48% 5.88% 5.75% 5.68% 5.65% 5.69% 5.73%Other Long-Term Liab. 2.88% 5.80% 5.14% 5.22% 5.12% 4.83% 5.22% 5.11% 5.10% 5.08% 5.07% 5.11% 5.09% 5.09% 5.09% 5.09%Total Liabilities 57.18% 48.72% 49.48% 50.66% 51.92% 52.65% 51.39% 51.58% 51.64% 51.84% 51.82% 51.65% 51.71% 51.73% 51.75% 51.73%
Common Stock Net 0.06% 0.04% 0.04% 0.04% 0.04% 0.04% 0.04% 0.04% 0.04% 0.04% 0.04% 0.04% 0.04% 0.04% 0.04% 0.04%Capital Surplus 0.61% 34.87% 32.91% 29.06% 26.50% 24.79% 29.63% 28.58% 27.71% 27.44% 27.63% 28.20% 27.91% 27.78% 27.79% 27.86%Retained Earnings 42.02% 16.93% 17.85% 20.55% 21.57% 23.79% 20.14% 20.78% 21.37% 21.53% 21.52% 21.07% 21.25% 21.35% 21.34% 21.30%Total Shareholder Equity 42.82% 51.28% 50.52% 49.34% 48.08% 48.62% 49.81% 49.40% 49.12% 49.01% 49.19% 49.31% 49.20% 49.17% 49.18% 49.21%
Total Liabilities & Net Worth 100.00% 100.00% 100.00% 100.00% 100.00% 100.00% 100.00% 100.00% 100.00% 100.00% 100.00% 100.00% 100.00% 100.00% 100.00% 100.00%
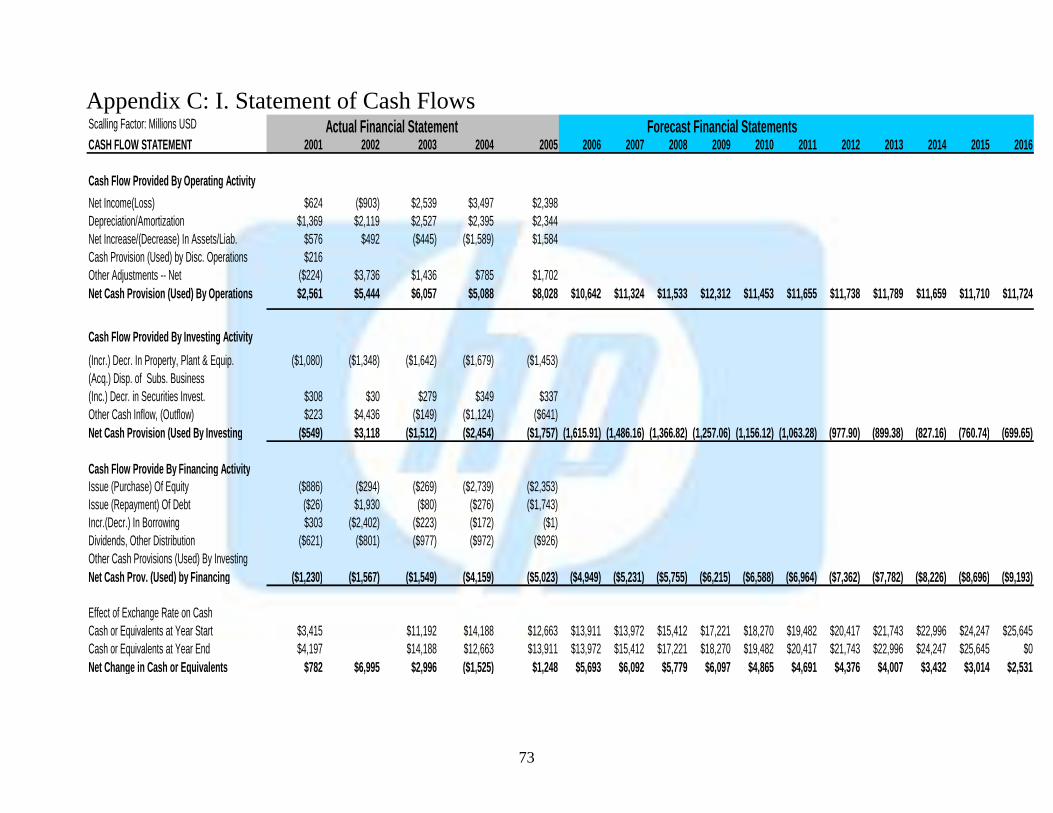
73
Appendix C: I. Statement of Cash Flows Scalling Factor: Millions USD Actual Financial Statement Forecast Financial StatementsCASH FLOW STATEMENT 2001 2002 2003 2004 2005 2006 2007 2008 2009 2010 2011 2012 2013 2014 2015 2016
Cash Flow Provided By Operating ActivityNet Income(Loss) $624 ($903) $2,539 $3,497 $2,398 Depreciation/Amortization $1,369 $2,119 $2,527 $2,395 $2,344 Net Increase/(Decrease) In Assets/Liab. $576 $492 ($445) ($1,589) $1,584 Cash Provision (Used) by Disc. Operations $216 Other Adjustments -- Net ($224) $3,736 $1,436 $785 $1,702 Net Cash Provision (Used) By Operations $2,561 $5,444 $6,057 $5,088 $8,028 $10,642 $11,324 $11,533 $12,312 $11,453 $11,655 $11,738 $11,789 $11,659 $11,710 $11,724
Cash Flow Provided By Investing Activity(Incr.) Decr. In Property, Plant & Equip. ($1,080) ($1,348) ($1,642) ($1,679) ($1,453)(Acq.) Disp. of Subs. Business(Inc.) Decr. in Securities Invest. $308 $30 $279 $349 $337 Other Cash Inflow, (Outflow) $223 $4,436 ($149) ($1,124) ($641)Net Cash Provision (Used By Investing ($549) $3,118 ($1,512) ($2,454) ($1,757) (1,615.91) (1,486.16) (1,366.82) (1,257.06) (1,156.12) (1,063.28) (977.90) (899.38) (827.16) (760.74) (699.65)
Cash Flow Provide By Financing ActivityIssue (Purchase) Of Equity ($886) ($294) ($269) ($2,739) ($2,353)Issue (Repayment) Of Debt ($26) $1,930 ($80) ($276) ($1,743)Incr.(Decr.) In Borrowing $303 ($2,402) ($223) ($172) ($1)Dividends, Other Distribution ($621) ($801) ($977) ($972) ($926)Other Cash Provisions (Used) By InvestingNet Cash Prov. (Used) by Financing ($1,230) ($1,567) ($1,549) ($4,159) ($5,023) ($4,949) ($5,231) ($5,755) ($6,215) ($6,588) ($6,964) ($7,362) ($7,782) ($8,226) ($8,696) ($9,193)
Effect of Exchange Rate on CashCash or Equivalents at Year Start $3,415 $11,192 $14,188 $12,663 $13,911 $13,972 $15,412 $17,221 $18,270 $19,482 $20,417 $21,743 $22,996 $24,247 $25,645 Cash or Equivalents at Year End $4,197 $14,188 $12,663 $13,911 $13,972 $15,412 $17,221 $18,270 $19,482 $20,417 $21,743 $22,996 $24,247 $25,645 $0 Net Change in Cash or Equivalents $782 $6,995 $2,996 ($1,525) $1,248 $5,693 $6,092 $5,779 $6,097 $4,865 $4,691 $4,376 $4,007 $3,432 $3,014 $2,531
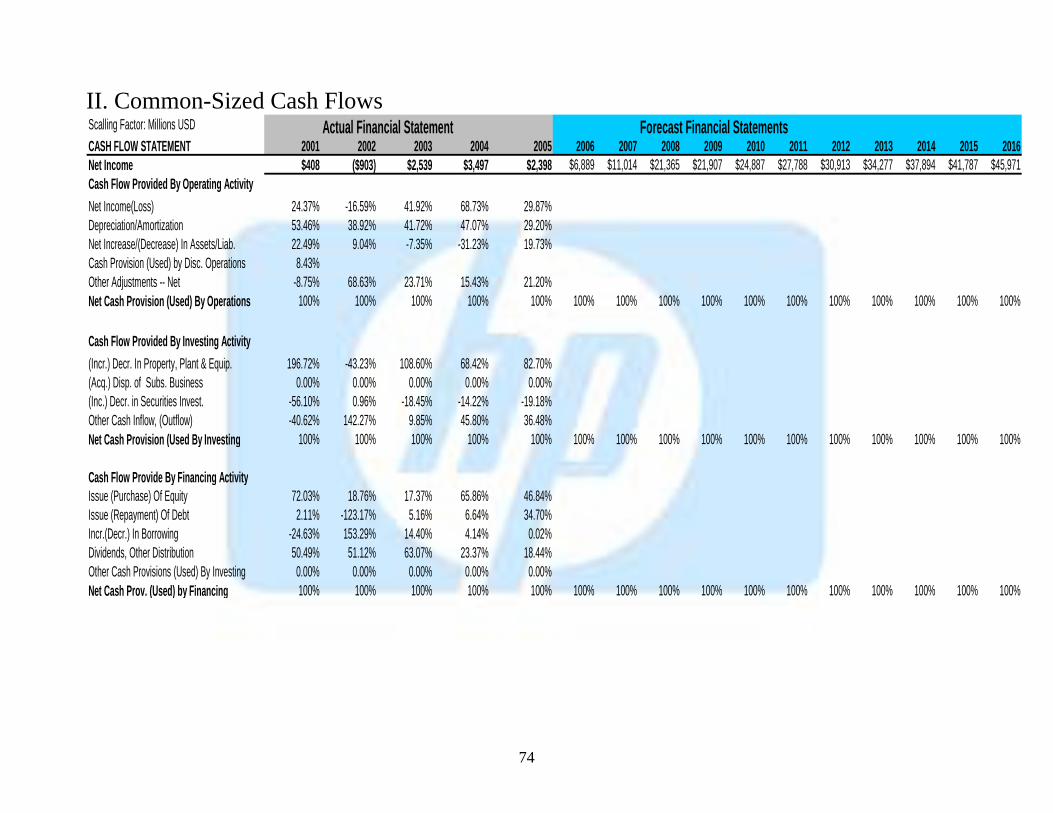
74
II. Common-Sized Cash Flows Scalling Factor: Millions USD Actual Financial Statement Forecast Financial StatementsCASH FLOW STATEMENT 2001 2002 2003 2004 2005 2006 2007 2008 2009 2010 2011 2012 2013 2014 2015 2016Net Income $408 ($903) $2,539 $3,497 $2,398 $6,889 $11,014 $21,365 $21,907 $24,887 $27,788 $30,913 $34,277 $37,894 $41,787 $45,971 Cash Flow Provided By Operating ActivityNet Income(Loss) 24.37% -16.59% 41.92% 68.73% 29.87%Depreciation/Amortization 53.46% 38.92% 41.72% 47.07% 29.20%Net Increase/(Decrease) In Assets/Liab. 22.49% 9.04% -7.35% -31.23% 19.73%Cash Provision (Used) by Disc. Operations 8.43%Other Adjustments -- Net -8.75% 68.63% 23.71% 15.43% 21.20%Net Cash Provision (Used) By Operations 100% 100% 100% 100% 100% 100% 100% 100% 100% 100% 100% 100% 100% 100% 100% 100%
Cash Flow Provided By Investing Activity(Incr.) Decr. In Property, Plant & Equip. 196.72% -43.23% 108.60% 68.42% 82.70%(Acq.) Disp. of Subs. Business 0.00% 0.00% 0.00% 0.00% 0.00%(Inc.) Decr. in Securities Invest. -56.10% 0.96% -18.45% -14.22% -19.18%Other Cash Inflow, (Outflow) -40.62% 142.27% 9.85% 45.80% 36.48%Net Cash Provision (Used By Investing 100% 100% 100% 100% 100% 100% 100% 100% 100% 100% 100% 100% 100% 100% 100% 100%
Cash Flow Provide By Financing ActivityIssue (Purchase) Of Equity 72.03% 18.76% 17.37% 65.86% 46.84%Issue (Repayment) Of Debt 2.11% -123.17% 5.16% 6.64% 34.70%Incr.(Decr.) In Borrowing -24.63% 153.29% 14.40% 4.14% 0.02%Dividends, Other Distribution 50.49% 51.12% 63.07% 23.37% 18.44%Other Cash Provisions (Used) By Investing 0.00% 0.00% 0.00% 0.00% 0.00%Net Cash Prov. (Used) by Financing 100% 100% 100% 100% 100% 100% 100% 100% 100% 100% 100% 100% 100% 100% 100% 100%
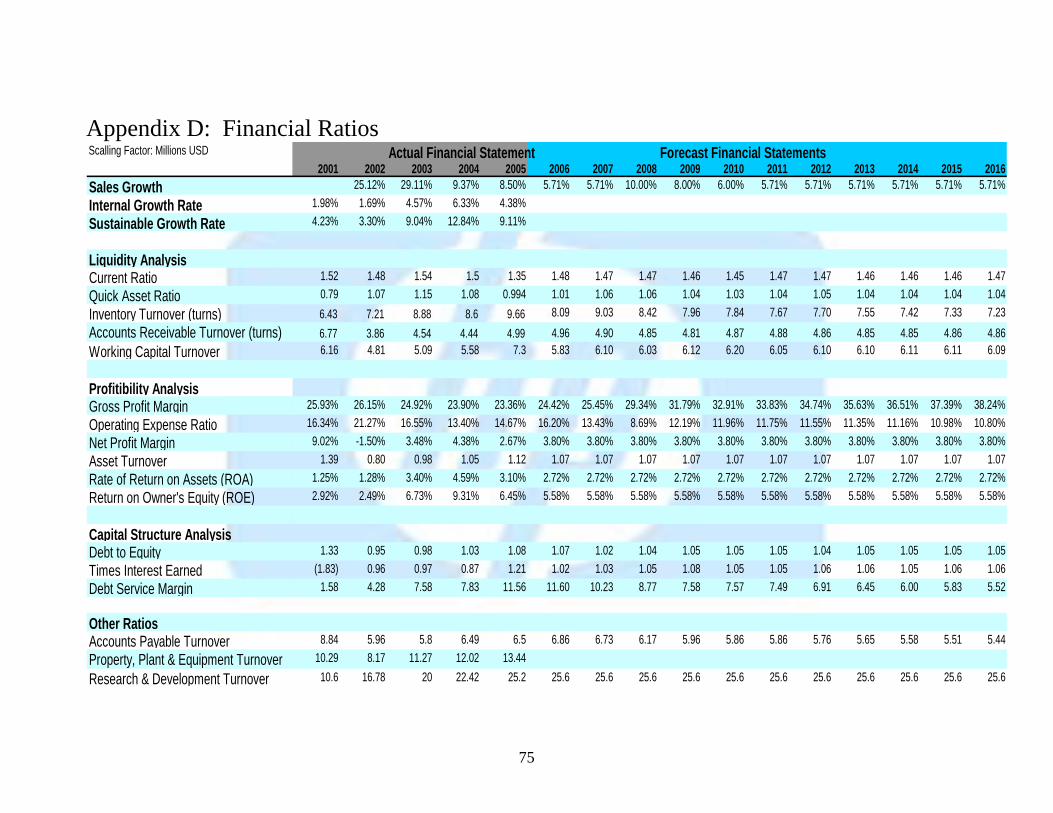
75
Appendix D: Financial Ratios Scalling Factor: Millions USD Actual Financial Statement Forecast Financial Statements
2001 2002 2003 2004 2005 2006 2007 2008 2009 2010 2011 2012 2013 2014 2015 2016Sales Growth 25.12% 29.11% 9.37% 8.50% 5.71% 5.71% 10.00% 8.00% 6.00% 5.71% 5.71% 5.71% 5.71% 5.71% 5.71%
Internal Growth Rate 1.98% 1.69% 4.57% 6.33% 4.38%
Sustainable Growth Rate 4.23% 3.30% 9.04% 12.84% 9.11%
Liquidity AnalysisCurrent Ratio 1.52 1.48 1.54 1.5 1.35 1.48 1.47 1.47 1.46 1.45 1.47 1.47 1.46 1.46 1.46 1.47Quick Asset Ratio 0.79 1.07 1.15 1.08 0.994 1.01 1.06 1.06 1.04 1.03 1.04 1.05 1.04 1.04 1.04 1.04Inventory Turnover (turns) 6.43 7.21 8.88 8.6 9.66 8.09 9.03 8.42 7.96 7.84 7.67 7.70 7.55 7.42 7.33 7.23Accounts Receivable Turnover (turns) 6.77 3.86 4.54 4.44 4.99 4.96 4.90 4.85 4.81 4.87 4.88 4.86 4.85 4.85 4.86 4.86Working Capital Turnover 6.16 4.81 5.09 5.58 7.3 5.83 6.10 6.03 6.12 6.20 6.05 6.10 6.10 6.11 6.11 6.09
Profitibility AnalysisGross Profit Margin 25.93% 26.15% 24.92% 23.90% 23.36% 24.42% 25.45% 29.34% 31.79% 32.91% 33.83% 34.74% 35.63% 36.51% 37.39% 38.24%Operating Expense Ratio 16.34% 21.27% 16.55% 13.40% 14.67% 16.20% 13.43% 8.69% 12.19% 11.96% 11.75% 11.55% 11.35% 11.16% 10.98% 10.80%Net Profit Margin 9.02% -1.50% 3.48% 4.38% 2.67% 3.80% 3.80% 3.80% 3.80% 3.80% 3.80% 3.80% 3.80% 3.80% 3.80% 3.80%Asset Turnover 1.39 0.80 0.98 1.05 1.12 1.07 1.07 1.07 1.07 1.07 1.07 1.07 1.07 1.07 1.07 1.07Rate of Return on Assets (ROA) 1.25% 1.28% 3.40% 4.59% 3.10% 2.72% 2.72% 2.72% 2.72% 2.72% 2.72% 2.72% 2.72% 2.72% 2.72% 2.72%Return on Owner's Equity (ROE) 2.92% 2.49% 6.73% 9.31% 6.45% 5.58% 5.58% 5.58% 5.58% 5.58% 5.58% 5.58% 5.58% 5.58% 5.58% 5.58%
Capital Structure AnalysisDebt to Equity 1.33 0.95 0.98 1.03 1.08 1.07 1.02 1.04 1.05 1.05 1.05 1.04 1.05 1.05 1.05 1.05Times Interest Earned (1.83) 0.96 0.97 0.87 1.21 1.02 1.03 1.05 1.08 1.05 1.05 1.06 1.06 1.05 1.06 1.06 Debt Service Margin 1.58 4.28 7.58 7.83 11.56 11.60 10.23 8.77 7.58 7.57 7.49 6.91 6.45 6.00 5.83 5.52
Other RatiosAccounts Payable Turnover 8.84 5.96 5.8 6.49 6.5 6.86 6.73 6.17 5.96 5.86 5.86 5.76 5.65 5.58 5.51 5.44Property, Plant & Equipment Turnover 10.29 8.17 11.27 12.02 13.44
Research & Development Turnover 10.6 16.78 20 22.42 25.2 25.6 25.6 25.6 25.6 25.6 25.6 25.6 25.6 25.6 25.6 25.6
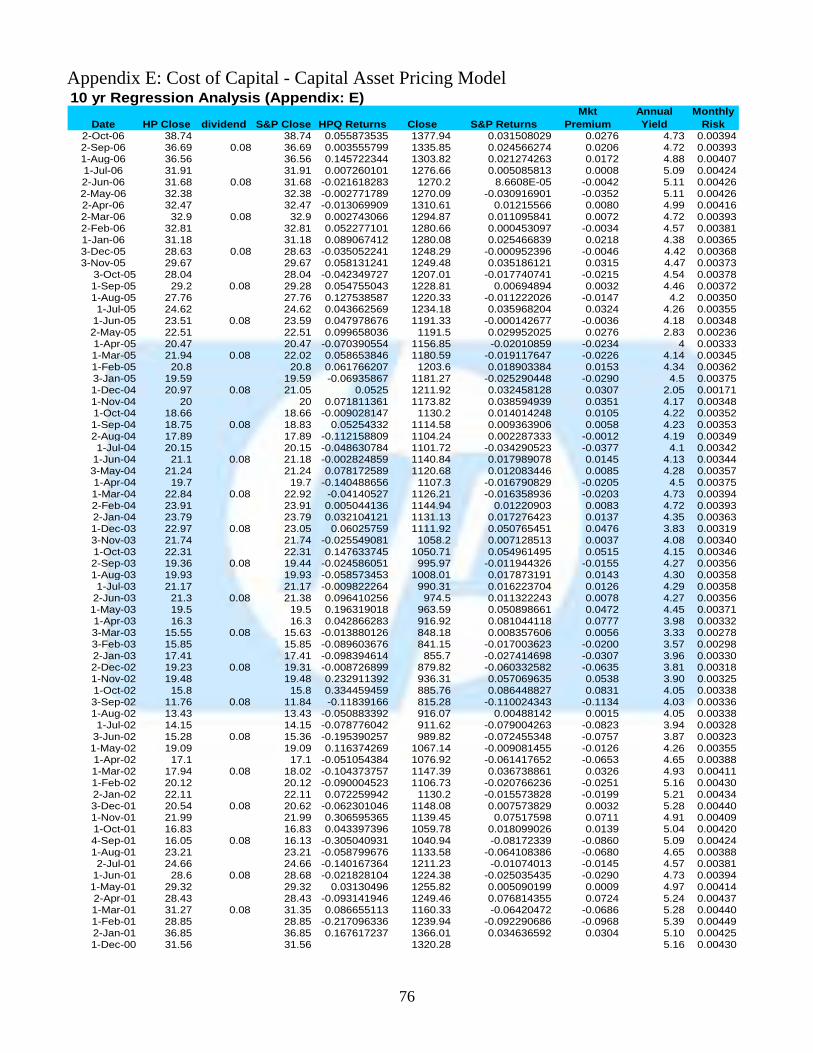
76
Appendix E: Cost of Capital - Capital Asset Pricing Model 10 yr Regression Analysis (Appendix: E)
Date HP Close dividend S&P Close HPQ Returns Close S&P ReturnsMkt
PremiumAnnual Yield
Monthly Risk
2-Oct-06 38.74 38.74 0.055873535 1377.94 0.031508029 0.0276 4.73 0.003942-Sep-06 36.69 0.08 36.69 0.003555799 1335.85 0.024566274 0.0206 4.72 0.003931-Aug-06 36.56 36.56 0.145722344 1303.82 0.021274263 0.0172 4.88 0.004071-Jul-06 31.91 31.91 0.007260101 1276.66 0.005085813 0.0008 5.09 0.004242-Jun-06 31.68 0.08 31.68 -0.021618283 1270.2 8.6608E-05 -0.0042 5.11 0.004262-May-06 32.38 32.38 -0.002771789 1270.09 -0.030916901 -0.0352 5.11 0.004262-Apr-06 32.47 32.47 -0.013069909 1310.61 0.01215566 0.0080 4.99 0.004162-Mar-06 32.9 0.08 32.9 0.002743066 1294.87 0.011095841 0.0072 4.72 0.003932-Feb-06 32.81 32.81 0.052277101 1280.66 0.000453097 -0.0034 4.57 0.003811-Jan-06 31.18 31.18 0.089067412 1280.08 0.025466839 0.0218 4.38 0.003653-Dec-05 28.63 0.08 28.63 -0.035052241 1248.29 -0.000952396 -0.0046 4.42 0.003683-Nov-05 29.67 29.67 0.058131241 1249.48 0.035186121 0.0315 4.47 0.00373
3-Oct-05 28.04 28.04 -0.042349727 1207.01 -0.017740741 -0.0215 4.54 0.003781-Sep-05 29.2 0.08 29.28 0.054755043 1228.81 0.00694894 0.0032 4.46 0.003721-Aug-05 27.76 27.76 0.127538587 1220.33 -0.011222026 -0.0147 4.2 0.003501-Jul-05 24.62 24.62 0.043662569 1234.18 0.035968204 0.0324 4.26 0.00355
1-Jun-05 23.51 0.08 23.59 0.047978676 1191.33 -0.000142677 -0.0036 4.18 0.003482-May-05 22.51 22.51 0.099658036 1191.5 0.029952025 0.0276 2.83 0.002361-Apr-05 20.47 20.47 -0.070390554 1156.85 -0.02010859 -0.0234 4 0.003331-Mar-05 21.94 0.08 22.02 0.058653846 1180.59 -0.019117647 -0.0226 4.14 0.003451-Feb-05 20.8 20.8 0.061766207 1203.6 0.018903384 0.0153 4.34 0.003623-Jan-05 19.59 19.59 -0.06935867 1181.27 -0.025290448 -0.0290 4.5 0.003751-Dec-04 20.97 0.08 21.05 0.0525 1211.92 0.032458128 0.0307 2.05 0.001711-Nov-04 20 20 0.071811361 1173.82 0.038594939 0.0351 4.17 0.003481-Oct-04 18.66 18.66 -0.009028147 1130.2 0.014014248 0.0105 4.22 0.003521-Sep-04 18.75 0.08 18.83 0.05254332 1114.58 0.009363906 0.0058 4.23 0.003532-Aug-04 17.89 17.89 -0.112158809 1104.24 0.002287333 -0.0012 4.19 0.003491-Jul-04 20.15 20.15 -0.048630784 1101.72 -0.034290523 -0.0377 4.1 0.00342
1-Jun-04 21.1 0.08 21.18 -0.002824859 1140.84 0.017989078 0.0145 4.13 0.003443-May-04 21.24 21.24 0.078172589 1120.68 0.012083446 0.0085 4.28 0.003571-Apr-04 19.7 19.7 -0.140488656 1107.3 -0.016790829 -0.0205 4.5 0.003751-Mar-04 22.84 0.08 22.92 -0.04140527 1126.21 -0.016358936 -0.0203 4.73 0.003942-Feb-04 23.91 23.91 0.005044136 1144.94 0.01220903 0.0083 4.72 0.003932-Jan-04 23.79 23.79 0.032104121 1131.13 0.017276423 0.0137 4.35 0.003631-Dec-03 22.97 0.08 23.05 0.06025759 1111.92 0.050765451 0.0476 3.83 0.003193-Nov-03 21.74 21.74 -0.025549081 1058.2 0.007128513 0.0037 4.08 0.003401-Oct-03 22.31 22.31 0.147633745 1050.71 0.054961495 0.0515 4.15 0.003462-Sep-03 19.36 0.08 19.44 -0.024586051 995.97 -0.011944326 -0.0155 4.27 0.003561-Aug-03 19.93 19.93 -0.058573453 1008.01 0.017873191 0.0143 4.30 0.003581-Jul-03 21.17 21.17 -0.009822264 990.31 0.016223704 0.0126 4.29 0.00358
2-Jun-03 21.3 0.08 21.38 0.096410256 974.5 0.011322243 0.0078 4.27 0.003561-May-03 19.5 19.5 0.196319018 963.59 0.050898661 0.0472 4.45 0.003711-Apr-03 16.3 16.3 0.042866283 916.92 0.081044118 0.0777 3.98 0.003323-Mar-03 15.55 0.08 15.63 -0.013880126 848.18 0.008357606 0.0056 3.33 0.002783-Feb-03 15.85 15.85 -0.089603676 841.15 -0.017003623 -0.0200 3.57 0.002982-Jan-03 17.41 17.41 -0.098394614 855.7 -0.027414698 -0.0307 3.96 0.003302-Dec-02 19.23 0.08 19.31 -0.008726899 879.82 -0.060332582 -0.0635 3.81 0.003181-Nov-02 19.48 19.48 0.232911392 936.31 0.057069635 0.0538 3.90 0.003251-Oct-02 15.8 15.8 0.334459459 885.76 0.086448827 0.0831 4.05 0.003383-Sep-02 11.76 0.08 11.84 -0.11839166 815.28 -0.110024343 -0.1134 4.03 0.003361-Aug-02 13.43 13.43 -0.050883392 916.07 0.00488142 0.0015 4.05 0.003381-Jul-02 14.15 14.15 -0.078776042 911.62 -0.079004263 -0.0823 3.94 0.00328
3-Jun-02 15.28 0.08 15.36 -0.195390257 989.82 -0.072455348 -0.0757 3.87 0.003231-May-02 19.09 19.09 0.116374269 1067.14 -0.009081455 -0.0126 4.26 0.003551-Apr-02 17.1 17.1 -0.051054384 1076.92 -0.061417652 -0.0653 4.65 0.003881-Mar-02 17.94 0.08 18.02 -0.104373757 1147.39 0.036738861 0.0326 4.93 0.004111-Feb-02 20.12 20.12 -0.090004523 1106.73 -0.020766236 -0.0251 5.16 0.004302-Jan-02 22.11 22.11 0.072259942 1130.2 -0.015573828 -0.0199 5.21 0.004343-Dec-01 20.54 0.08 20.62 -0.062301046 1148.08 0.007573829 0.0032 5.28 0.004401-Nov-01 21.99 21.99 0.306595365 1139.45 0.07517598 0.0711 4.91 0.004091-Oct-01 16.83 16.83 0.043397396 1059.78 0.018099026 0.0139 5.04 0.004204-Sep-01 16.05 0.08 16.13 -0.305040931 1040.94 -0.08172339 -0.0860 5.09 0.004241-Aug-01 23.21 23.21 -0.058799676 1133.58 -0.064108386 -0.0680 4.65 0.003882-Jul-01 24.66 24.66 -0.140167364 1211.23 -0.01074013 -0.0145 4.57 0.00381
1-Jun-01 28.6 0.08 28.68 -0.021828104 1224.38 -0.025035435 -0.0290 4.73 0.003941-May-01 29.32 29.32 0.03130496 1255.82 0.005090199 0.0009 4.97 0.004142-Apr-01 28.43 28.43 -0.093141946 1249.46 0.076814355 0.0724 5.24 0.004371-Mar-01 31.27 0.08 31.35 0.086655113 1160.33 -0.06420472 -0.0686 5.28 0.004401-Feb-01 28.85 28.85 -0.217096336 1239.94 -0.092290686 -0.0968 5.39 0.004492-Jan-01 36.85 36.85 0.167617237 1366.01 0.034636592 0.0304 5.10 0.004251-Dec-00 31.56 31.56 1320.28 5.16 0.00430
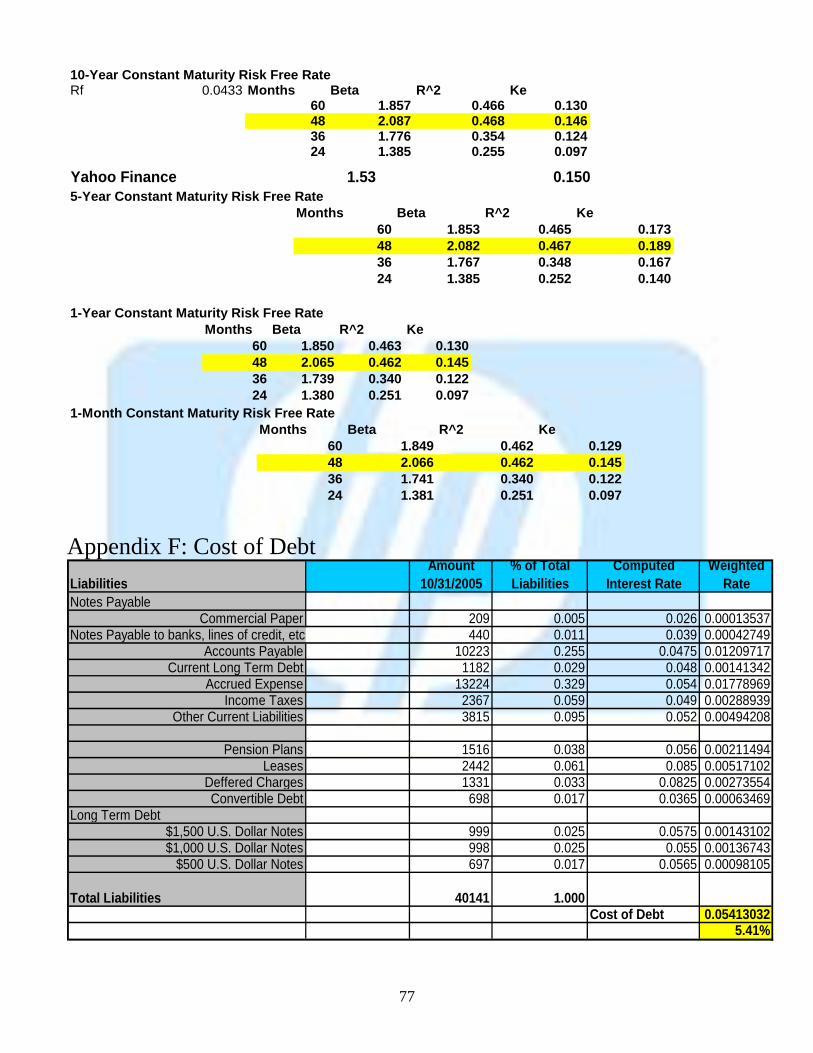
77
10-Year Constant Maturity Risk Free RateRf 0.0433 Months Beta R^2 Ke
60 1.857 0.466 0.13048 2.087 0.468 0.14636 1.776 0.354 0.12424 1.385 0.255 0.097
Yahoo Finance 1.53 0.150 5-Year Constant Maturity Risk Free Rate
Months Beta R^2 Ke60 1.853 0.465 0.17348 2.082 0.467 0.18936 1.767 0.348 0.16724 1.385 0.252 0.140
1-Year Constant Maturity Risk Free RateMonths Beta R^2 Ke
60 1.850 0.463 0.13048 2.065 0.462 0.14536 1.739 0.340 0.12224 1.380 0.251 0.097
1-Month Constant Maturity Risk Free RateMonths Beta R^2 Ke
60 1.849 0.462 0.12948 2.066 0.462 0.14536 1.741 0.340 0.12224 1.381 0.251 0.097
Appendix F: Cost of Debt Liabilities
Amount 10/31/2005
% of Total Liabilities
Computed Interest Rate
Weighted Rate
Notes PayableCommercial Paper 209 0.005 0.026 0.00013537
Notes Payable to banks, lines of credit, etc 440 0.011 0.039 0.00042749Accounts Payable 10223 0.255 0.0475 0.01209717
Current Long Term Debt 1182 0.029 0.048 0.00141342Accrued Expense 13224 0.329 0.054 0.01778969
Income Taxes 2367 0.059 0.049 0.00288939Other Current Liabilities 3815 0.095 0.052 0.00494208
Pension Plans 1516 0.038 0.056 0.00211494Leases 2442 0.061 0.085 0.00517102
Deffered Charges 1331 0.033 0.0825 0.00273554Convertible Debt 698 0.017 0.0365 0.00063469
Long Term Debt $1,500 U.S. Dollar Notes 999 0.025 0.0575 0.00143102 $1,000 U.S. Dollar Notes 998 0.025 0.055 0.00136743
$500 U.S. Dollar Notes 697 0.017 0.0565 0.00098105
Total Liabilities 40141 1.000Cost of Debt 0.05413032
5.41%
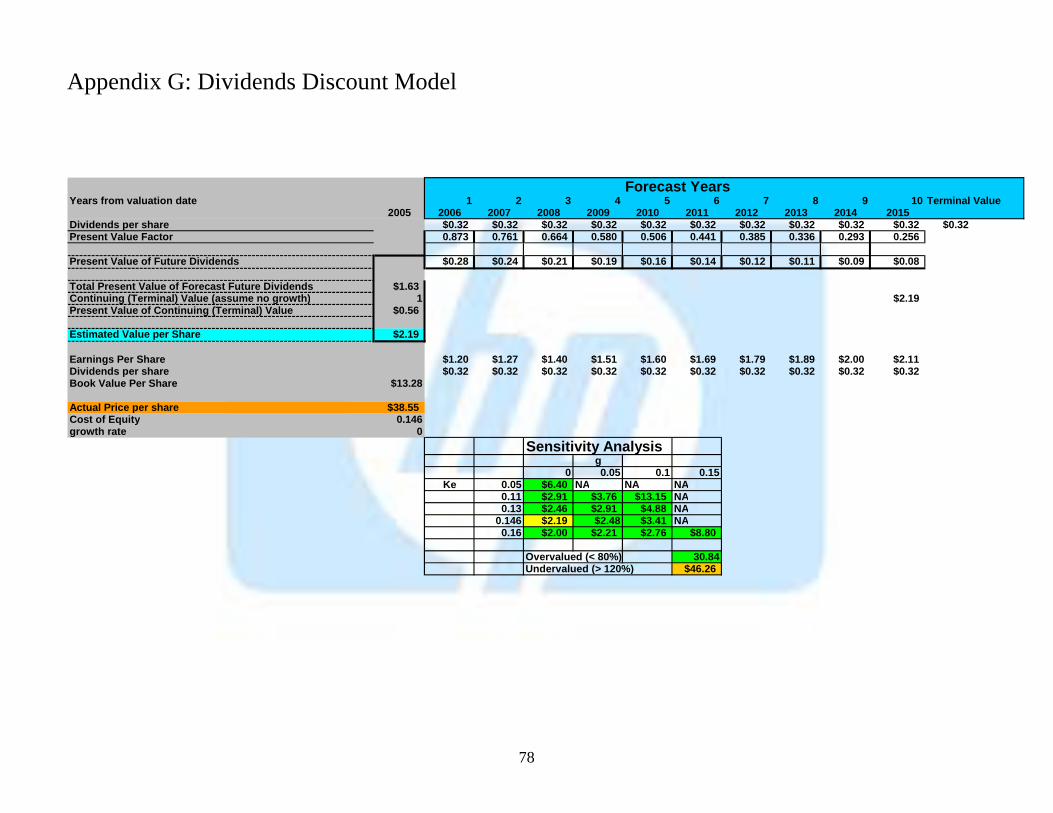
78
Appendix G: Dividends Discount Model
Forecast YearsYears from valuation date 1 2 3 4 5 6 7 8 9 10 Terminal Value
2005 2006 2007 2008 2009 2010 2011 2012 2013 2014 2015Dividends per share $0.32 $0.32 $0.32 $0.32 $0.32 $0.32 $0.32 $0.32 $0.32 $0.32 $0.32Present Value Factor 0.873 0.761 0.664 0.580 0.506 0.441 0.385 0.336 0.293 0.256
Present Value of Future Dividends $0.28 $0.24 $0.21 $0.19 $0.16 $0.14 $0.12 $0.11 $0.09 $0.08
Total Present Value of Forecast Future Dividends $1.63Continuing (Terminal) Value (assume no growth) 1 $2.19Present Value of Continuing (Terminal) Value $0.56
Estimated Value per Share $2.19
Earnings Per Share $1.20 $1.27 $1.40 $1.51 $1.60 $1.69 $1.79 $1.89 $2.00 $2.11Dividends per share $0.32 $0.32 $0.32 $0.32 $0.32 $0.32 $0.32 $0.32 $0.32 $0.32Book Value Per Share $13.28
Actual Price per share $38.55Cost of Equity 0.146growth rate 0
Sensitivity Analysisg
0 0.05 0.1 0.15Ke 0.05 $6.40 NA NA NA
0.11 $2.91 $3.76 $13.15 NA0.13 $2.46 $2.91 $4.88 NA
0.146 $2.19 $2.48 $3.41 NA0.16 $2.00 $2.21 $2.76 $8.80
Overvalued (< 80%) 30.84Undervalued (> 120%) $46.26

79
Appendix H: Residual Income Valuation
Forecast Years0 1 2 3 4 5 6 7 8 9 10
2005 2006 2007 2008 2009 2010 2011 2012 2013 2014 2015EPS (Earnings Per Share) 0.85 1.26 1.37 1.54 1.71 1.85 2.01 2.18 2.36 2.56 2.78 3.01247DPS (Dividends Per Share) 0.32 0.32 0.32 0.32 0.32 0.32 0.32 0.32 0.32 0.32 0.32BPS (Book Value Equity per Share) 13.28 14.22 15.26 16.48 17.87 19.40 21.10 22.96 25.00 27.24 29.70 Annual Book-KeepinCash From Operations 802 1,064 1,132 1,153 1,231 1,145 1,165 1,173 1,178 1,165 1,171Cash Investments -175 -161 -148 -136 -125 -115 -106 -97 -90 -82 -76
PerpetuityEPS (Earnings Per Share) 1.26 1.37 1.54 1.71 1.85 2.01 2.18 2.36 2.56 2.78 3.01247Normal Earnings (Notice "Lag") 1.94 2.08 2.23 2.41 2.61 2.83 3.08 3.35 3.65 3.98 4.34Residual Income -0.68 -0.71 -0.69 -0.70 -0.75 -0.82 -0.90 -0.99 -1.09 -1.20 -1.32PV Factor 0.8726 0.7614 0.6644 0.5798 0.5059 0.4415 0.3852 0.3361 0.2933 0.2559PV of Residual Income -0.593 -0.541 -0.457 -0.406 -0.382 -0.363 -0.347 -0.332 -0.319 -0.307Total PV of Annual Residual Income -4.047Continuing (Terminal) Value Perpetuity 0PV of Terminal Value Perpetuity 0.000BPS (Book Value Equity per Share) 13.28 KeEstimated Price per Share (end of 2005) 9.23 g 0.06 0.07 0.08 0.09 0.1 0.11 0.12 0.13 0.146 0.15
0 30.39 24.12 19.59 16.19 13.58 12.34 11.37 10.49 9.23 8.95Logical Test for Growth in Perpetuity g 0 0.01 32.68 25.25 20.12 16.39 13.6
0.02 36.12 26.84 20.82 16.65 13.62Observed Share Price (end of 2005) 38.55 0.03 41.84 29.21 21.8 16.99 13.65
0.04 53.29 33.16 23.27 17.47 13.69Ke 0.146 0.05 87.65 41.07 25.73 18.18 13.74
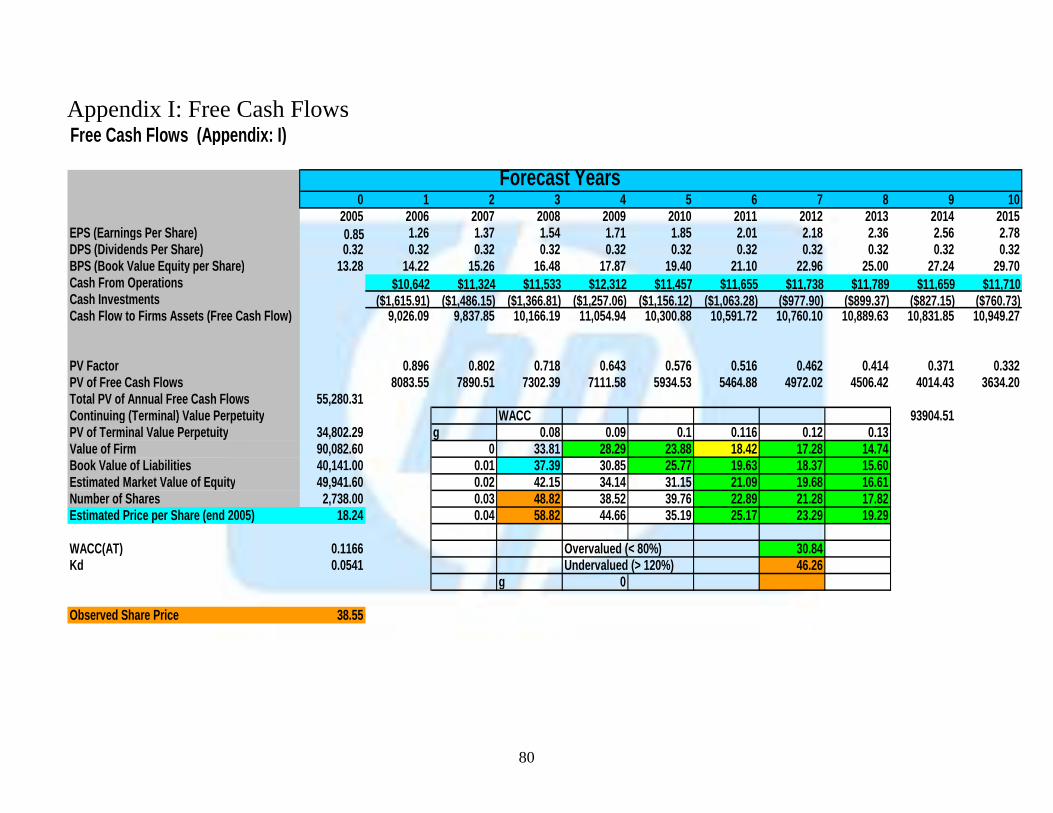
80
Appendix I: Free Cash Flows Free Cash Flows (Appendix: I)
Forecast Years0 1 2 3 4 5 6 7 8 9 10
2005 2006 2007 2008 2009 2010 2011 2012 2013 2014 2015EPS (Earnings Per Share) 0.85 1.26 1.37 1.54 1.71 1.85 2.01 2.18 2.36 2.56 2.78DPS (Dividends Per Share) 0.32 0.32 0.32 0.32 0.32 0.32 0.32 0.32 0.32 0.32 0.32BPS (Book Value Equity per Share) 13.28 14.22 15.26 16.48 17.87 19.40 21.10 22.96 25.00 27.24 29.70Cash From Operations $10,642 $11,324 $11,533 $12,312 $11,457 $11,655 $11,738 $11,789 $11,659 $11,710 Cash Investments ($1,615.91) ($1,486.15) ($1,366.81) ($1,257.06) ($1,156.12) ($1,063.28) ($977.90) ($899.37) ($827.15) ($760.73)Cash Flow to Firms Assets (Free Cash Flow) 9,026.09 9,837.85 10,166.19 11,054.94 10,300.88 10,591.72 10,760.10 10,889.63 10,831.85 10,949.27
PV Factor 0.896 0.802 0.718 0.643 0.576 0.516 0.462 0.414 0.371 0.332PV of Free Cash Flows 8083.55 7890.51 7302.39 7111.58 5934.53 5464.88 4972.02 4506.42 4014.43 3634.20Total PV of Annual Free Cash Flows 55,280.31Continuing (Terminal) Value Perpetuity WACC 93904.51PV of Terminal Value Perpetuity 34,802.29 g 0.08 0.09 0.1 0.116 0.12 0.13Value of Firm 90,082.60 0 33.81 28.29 23.88 18.42 17.28 14.74Book Value of Liabilities 40,141.00 0.01 37.39 30.85 25.77 19.63 18.37 15.60Estimated Market Value of Equity 49,941.60 0.02 42.15 34.14 31.15 21.09 19.68 16.61Number of Shares 2,738.00 0.03 48.82 38.52 39.76 22.89 21.28 17.82Estimated Price per Share (end 2005) 18.24 0.04 58.82 44.66 35.19 25.17 23.29 19.29
WACC(AT) 0.1166 Overvalued (< 80%) 30.84Kd 0.0541 Undervalued (> 120%) 46.26
g 0
Observed Share Price 38.55
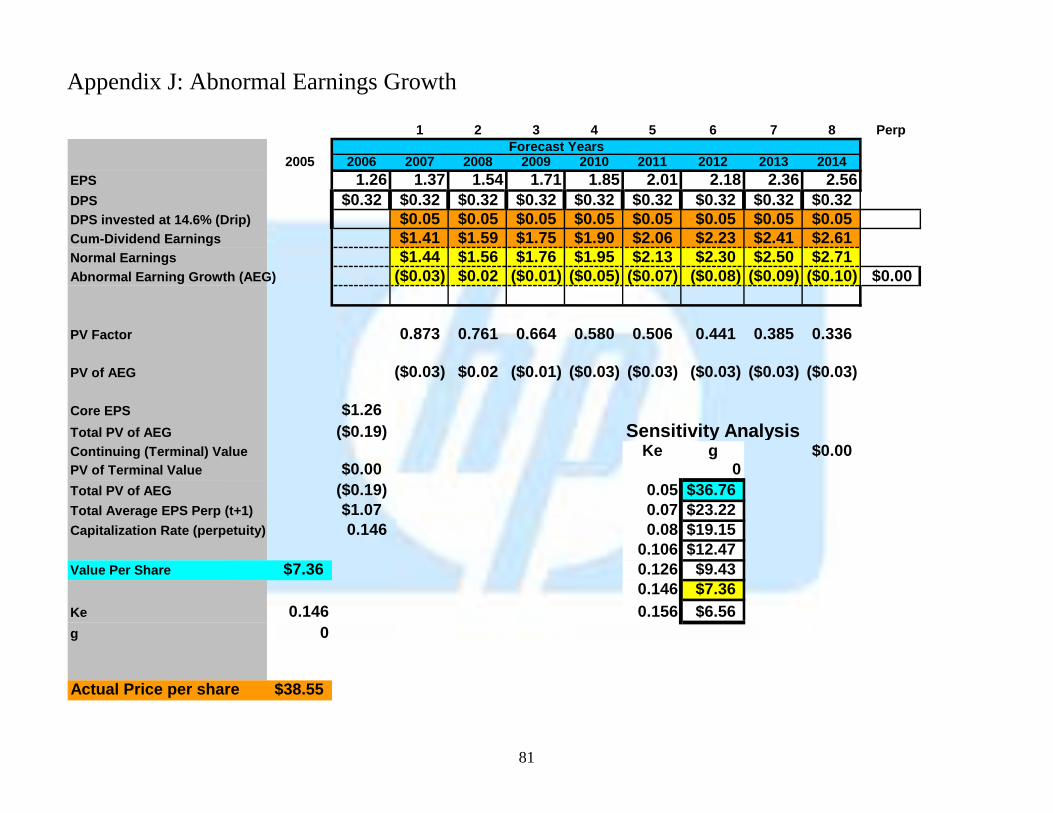
81
Appendix J: Abnormal Earnings Growth
1 2 3 4 5 6 7 8 PerpForecast Years
2005 2006 2007 2008 2009 2010 2011 2012 2013 2014EPS 1.26 1.37 1.54 1.71 1.85 2.01 2.18 2.36 2.56DPS $0.32 $0.32 $0.32 $0.32 $0.32 $0.32 $0.32 $0.32 $0.32DPS invested at 14.6% (Drip) $0.05 $0.05 $0.05 $0.05 $0.05 $0.05 $0.05 $0.05Cum-Dividend Earnings $1.41 $1.59 $1.75 $1.90 $2.06 $2.23 $2.41 $2.61Normal Earnings $1.44 $1.56 $1.76 $1.95 $2.13 $2.30 $2.50 $2.71Abnormal Earning Growth (AEG) ($0.03) $0.02 ($0.01) ($0.05) ($0.07) ($0.08) ($0.09) ($0.10) $0.00
PV Factor 0.873 0.761 0.664 0.580 0.506 0.441 0.385 0.336
PV of AEG ($0.03) $0.02 ($0.01) ($0.03) ($0.03) ($0.03) ($0.03) ($0.03)
Core EPS $1.26Total PV of AEG ($0.19) Sensitivity AnalysisContinuing (Terminal) Value Ke g $0.00PV of Terminal Value $0.00 0Total PV of AEG ($0.19) 0.05 $36.76Total Average EPS Perp (t+1) $1.07 0.07 $23.22Capitalization Rate (perpetuity) 0.146 0.08 $19.15
0.106 $12.47Value Per Share $7.36 0.126 $9.43
0.146 $7.36Ke 0.146 0.156 $6.56g 0
Actual Price per share $38.55
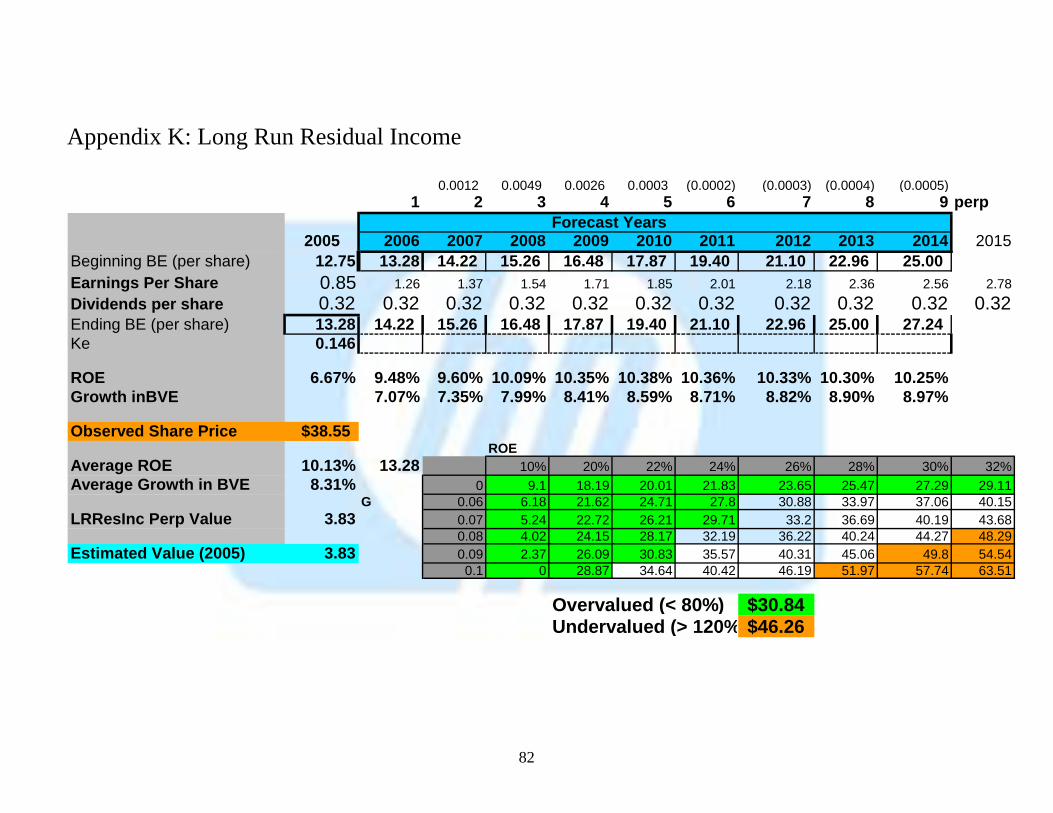
82
Appendix K: Long Run Residual Income
0.0012 0.0049 0.0026 0.0003 (0.0002) (0.0003) (0.0004) (0.0005)1 2 3 4 5 6 7 8 9 perp
Forecast Years2005 2006 2007 2008 2009 2010 2011 2012 2013 2014 2015
Beginning BE (per share) 12.75 13.28 14.22 15.26 16.48 17.87 19.40 21.10 22.96 25.00Earnings Per Share 0.85 1.26 1.37 1.54 1.71 1.85 2.01 2.18 2.36 2.56 2.78Dividends per share 0.32 0.32 0.32 0.32 0.32 0.32 0.32 0.32 0.32 0.32 0.32Ending BE (per share) 13.28 14.22 15.26 16.48 17.87 19.40 21.10 22.96 25.00 27.24Ke 0.146
ROE 6.67% 9.48% 9.60% 10.09% 10.35% 10.38% 10.36% 10.33% 10.30% 10.25%Growth inBVE 7.07% 7.35% 7.99% 8.41% 8.59% 8.71% 8.82% 8.90% 8.97%
Observed Share Price $38.55ROE
Average ROE 10.13% 13.28 10% 20% 22% 24% 26% 28% 30% 32%Average Growth in BVE 8.31% 0 9.1 18.19 20.01 21.83 23.65 25.47 27.29 29.11
G 0.06 6.18 21.62 24.71 27.8 30.88 33.97 37.06 40.15LRResInc Perp Value 3.83 0.07 5.24 22.72 26.21 29.71 33.2 36.69 40.19 43.68
0.08 4.02 24.15 28.17 32.19 36.22 40.24 44.27 48.29Estimated Value (2005) 3.83 0.09 2.37 26.09 30.83 35.57 40.31 45.06 49.8 54.54
0.1 0 28.87 34.64 40.42 46.19 51.97 57.74 63.51
Overvalued (< 80%) $30.84Undervalued (> 120% $46.26
83
References
1www.marketwatch.com
2www.finance.yahoo.com
3Palepu, Healy, Bernard. Business Analysis & Valuation. Thomson Southwestern,
Manson, Ohio, 2004.
4www.hp.com
5http://www.shopping.hp.com/webapp/shopping/about_hpshopping.do?leftNavIndi
cator=about%20hpshopping
6http://news.zdnet.com/2100-9584_22-5853144.html
7www.sec.gov
8www.apple.com
9www.dell.com
10 http://www.shareholder.com/Common/Edgar/47217/1047469-05-929/05-00.pdf)
11 www.valueline.com
12 www.edgarscan.pcsglobal.com

84

85

86

87
Related Documents