This article appeared in a journal published by Elsevier. The attached copy is furnished to the author for internal non-commercial research and education use, including for instruction at the authors institution and sharing with colleagues. Other uses, including reproduction and distribution, or selling or licensing copies, or posting to personal, institutional or third party websites are prohibited. In most cases authors are permitted to post their version of the article (e.g. in Word or Tex form) to their personal website or institutional repository. Authors requiring further information regarding Elsevier’s archiving and manuscript policies are encouraged to visit: http://www.elsevier.com/copyright

Welcome message from author
This document is posted to help you gain knowledge. Please leave a comment to let me know what you think about it! Share it to your friends and learn new things together.
Transcript
This article appeared in a journal published by Elsevier. The attachedcopy is furnished to the author for internal non-commercial researchand education use, including for instruction at the authors institution
and sharing with colleagues.
Other uses, including reproduction and distribution, or selling orlicensing copies, or posting to personal, institutional or third party
websites are prohibited.
In most cases authors are permitted to post their version of thearticle (e.g. in Word or Tex form) to their personal website orinstitutional repository. Authors requiring further information
regarding Elsevier’s archiving and manuscript policies areencouraged to visit:
http://www.elsevier.com/copyright
Author's personal copy
Applied Catalysis B: Environmental 102 (2011) 454–463
Contents lists available at ScienceDirect
Applied Catalysis B: Environmental
journa l homepage: www.e lsev ier .com/ locate /apcatb
Heterogeneous photocatalytic degradation of citric acid over TiO2. I: Mechanismof 3-oxoglutaric acid degradation
Jorge M. Meichtrya, Natalia Quici a,1, Gilles Mailhotb,c, Marta I. Littera,d,e,∗
a Gerencia Química, Centro Atómico Constituyentes, Comisión Nacional de Energía Atómica, Av. Gral. Paz 1499, 1650 San Martín, Prov. de Buenos Aires, Argentinab Clermont Université, Université Blaise Pascal, Laboratoire de Photochimie Moléculaire et Macromoléculaire, BP 10448, F-63000 Clermont-Ferrand, Francec CNRS, UMR 6505, Laboratoire de Photochimie Moléculaire et Macromoléculaire, BP 80026, F-63171 Aubière, Franced Instituto de Investigación e Ingeniería Ambiental, Universidad de General San Martín, Peatonal Belgrano 3563, 1650 San Martín, Prov. de Buenos Aires, Argentinae Consejo Nacional de Investigaciones Científicas y Técnicas, Buenos Aires, Argentina
a r t i c l e i n f o
Article history:Received 19 October 2010Received in revised form 4 December 2010Accepted 10 December 2010Available online 17 December 2010
Keywords:Heterogeneous photocatalysisTiO2
3-Oxoglutaric acidCitric acidAcetoacetic acid
a b s t r a c t
As part of the study on TiO2-heterogeneous photocatalytic degradation of citric acid (Cit), degradation of3-oxoglutaric acid (OGA, 5 mM, pH 2.8), one of the main intermediates of Cit, was analyzed. As reactive�-ketodicarboxylic acid, OGA decays rapidly in ambient dark conditions to acetoacetic acid and acetone.The photocatalytic reaction over TiO2 under UV light is thus affected by this thermal pathway and, in addi-tion to the products found in dark conditions, other carboxylic acids like lactic, pyruvic, glyoxylic andacetic acid were detected and quantified. TOC decrease is proven due mostly by the thermal reaction.Kinetic parameters for both thermal and photochemical reactions were obtained from the experimentaldata, and mechanisms for the TiO2-photocatalytic degradation were proposed for OGA and its interme-diates. The interplay between OGA thermal and photocatalytic decay is verified, a subject not very muchdescribed in the literature.
© 2010 Elsevier B.V. All rights reserved.
1. Introduction
TiO2 heterogeneous photocatalysis is one of the most stud-ied advanced oxidation technologies (AOTs), and its capability tomineralize organic pollutants without using expensive reagents atroom temperature and pressure has been widely demonstrated.However, mechanisms of these processes are still not well under-stood, and only in a few cases have been fully elucidated. Dependingon their own structural complexity, compounds can be totallytransformed into CO2 plus water through consecutive or parallelpathways. However, before mineralization can be achieved, severaldegradation products can be formed. Consequently, before applica-tion of an AOT, the complete degradative route, together with theidentification of intermediate products, should be known to obtainparameters and features useful for further industrial purposes.
Citric acid (C(OH)(COOH)(CH2COOH)2, IUPAC name: 2-hydroxy-propane-1,2,3-tricarboxylic acid, Cit), is a model compound of
∗ Corresponding author at: Gerencia Química, Centro Atómico Constituyentes,Comisión Nacional de Energía Atómica, Av. Gral. Paz 1499, 1650 San Martín, Prov.de Buenos Aires, Argentina. Tel.: +54 11 6772 7016; fax: +54 11 6772 7886.
E-mail addresses: [email protected], [email protected] (M.I. Litter).1 Present address: Photocatalysis and Photoreaction Engineering, Department of
Chemical and Environmental Engineering, The University of Nottingham, Notting-ham, UK.
several natural systems, a chelating agent employed in the industry,and often used as a reducing agent in photolytic and photocatalyticsystems [1,2]. In a previous paper, we studied the degradation ofCit by UV/TiO2 photocatalysis (HP), photo-Fenton (PF) and HP-PFcombination [1]. In those systems, it was possible to detect 3-oxoglutaric acid (1,3-acetonedicarboxylic acid, OGA, IUPAC name:3-oxopentanedioic acid) as an intermediate product, but efforts todetect other reaction products were not made. Another paper of thegroup analyzed the synergistic effect of the addition of Cit to pho-tocatalytic systems containing Cr(VI); again, OGA was proposed asan intermediate of Cit degradation [2].
OGA is a �-ketodicarboxylic acid for which Hay and Leong [3]report acid-base ionization constants pKa1 = 3.23 and pKa2 = 4.27(25 ◦C, 0.01 M). As �-ketoacid, OGA is unstable and decomposes insolution to acetoacetic acid (AAA, IUPAC name: 3-oxobutanoic acid)and ultimately to acetone by a non-oxidative decarboxylation, witha maximum rate at pH 3.5 [3–6] (Eq. (1)).
HOOCCH2COCH2COOHOGA
→ CH3COCH2COOH + CO2AAA
→ CH3COCH3 + CO2acetone
(1)
A new study was initiated to elucidate the complete mecha-nism of Cit degradation by HP, and this will be treated in part IIof this series [7]. When the experiments of Cit degradation by HP
0926-3373/$ – see front matter © 2010 Elsevier B.V. All rights reserved.doi:10.1016/j.apcatb.2010.12.026

Author's personal copy
J.M. Meichtry et al. / Applied Catalysis B: Environmental 102 (2011) 454–463 455
were carried out, a large correlation between the kinetic behaviorof Cit and OGA were found; thus, it was decided to carry out paral-lel photocatalytic experiments on OGA to understand the involvedmechanisms, which is the objective of this part I. It will be demon-strated that the photocatalytic reaction has to take into accountthe parallel thermal degradation of the initial compound and someof its intermediates. Liquid chromatography combined with massspectrometry (LC–MS) was used as a powerful tool for the deter-mination of the photocatalytic products.
2. Experimental
2.1. Chemicals
TiO2 (Degussa P-25) was provided by Degussa AG Germanyand used as received. OGA (Aldrich) and all other chemi-cals were reagent grade. AAA, lactic acid (LA, IUPAC name:2-hydroxypropanoic acid, pyruvic acid (PA, IUPAC name:2-oxopropanoic acid), glyoxylic acid (GA, IUPAC name: oxoethanoicacid), acetic acid (AA), formic acid (FA), malic acid (MA, IUPACname: hydroxybutanedioic acid) and acetone were Sigma–Aldrich.In all experiments, Milli-Q water was used (resistivity = 18 M� cm).
2.2. Irradiation procedure
Irradiation experiments were performed using a batch system,consisting of a Pyrex tube (open to air), 28 mm ID, inserted in aPyrex jacket (56 mm ID) for water circulation, surrounded by three125 W Phillips HPW black light lamps emitting mainly at 365 nm(93% transmission). After turning on, the lamp was 30 min stabi-lized before starting the reaction. The incident photon flux per unitvolume, q0
n,p/V , was 7.9 �einstein s−1 L−1, determined by potas-sium ferrioxalate actinometry. A TiO2 suspension (1 g L−1, 100 mL)containing 5 mM OGA at pH 2.8 was filled in the inner well andirradiated for prefixed periods. This concentration was the samechosen for the Cit study [7] and pH was that obtained after dissolv-ing OGA in water. Water was continuously fed to the jacket to keepconstant temperature (15–17 ◦C) and as IR filter. The suspensionwas magnetically stirred for 30 min in the dark and during irra-diation to ensure homogeneity. Adsorption of OGA on TiO2 after30 min stirring in the dark was considered negligible as similarresults on OGA concentration were obtained in the presence andin the absence of TiO2. Changes in concentration neither of OGAnor of its degradation products due to light were expected in theabsence of TiO2, because these compounds do not absorb at theirradiation wavelength (365 nm).
Periodically, 1.5 mL samples of the photocatalytic runs weretaken, centrifuged for 10 min at 13,000 rpm in an Eppendorf Min-iSpin model centrifuge, filtered through a 0.2 �m PVDF Acrodiscfilter and analyzed (see Section 2.2).
All experiments were performed at least by duplicate and resultsaveraged. The experimental error was never higher than 10%, ascalculated by standard deviation among the replicate experiments.Changes in pH during the reaction time were not higher than 0.5units. Experiments in the dark were performed similarly, takingthe concentration of OGA and all other products 30 min after thebeginning of the run to have the same equilibrium conditions as inthe irradiated experiments. These concentrations will be denotedwith the subscript “0” in contrast with initial concentrations thatwill be denoted “in”.
2.3. Analysis of samples
Three chromatographic techniques were used to follow OGAevolution and to identify reaction intermediates, as follows.
(1) HPLC: A Waters 996 apparatus coupled with a Waters 990diode-array detector (HPLC-UV) was used. The detectionwavelength was 210 nm except for acetone, which was fol-lowed at 263 nm. A RPC-18 column Lichrosphere (Merck),125 mm × 4.6 mm, 5 �m particle diameter was employed; theeluent was water, pH 2.1 with H3PO4 at a 1 mL min−1 flow rate.Identification of compounds was made by comparisons withpure standards.
(2) LC–MS system: A LC/QTOF apparatus equipped with anorthogonal geometry Z-spray ion source was employed(Waters/Micromass, Manchester, UK). A photodiode arraydetector Waters Alliance 2695 system was used for UV detec-tion. Samples (25.0 �L) were injected on a reversed-phasecolumn (X terra, Waters, C18, 100 mm × 2.1 mm, 3.5 �m particlediameter). A flow rate of 0.3 mL min−1 was set, with a mobilephase composed of acetonitrile (solvent A) and acidified water(solvent B: formic acid 1%), 5/95 (V/V). This system allows onlythe measurement of carboxylic acids.
(3) Ionic chromatography (IC): A technique previously developed inthe laboratory [8] was used. This technique was used only qual-itatively, to detect and identify ionic compounds by comparisonwith standards. The analyses were performed with a DIONEX500 apparatus and an AS 11 column.
With the LC–MS system, MS signals and the correspondingUV–Vis spectra were obtained that could be assigned to severalcompounds. Most of them could be quantified by HPLC-UV mak-ing calibration curves with standards, except in the case of GA andFA. GA was detected by MS and IC, but it could not be quantifiedbecause it was not retained by the HPLC-UV system column. FAcould not be detected. It is important to note that OGA and AAAcould not be observed by IC due to broad peaks at long retentiontimes that prevented their separation.
Total organic carbon (TOC) measurements in aqueous solutionwere obtained with a Shimadzu Total Organic Carbon (TOC) ana-lyzer, model TOC-5050A.
3. Results
3.1. OGA thermal degradation
3.1.1. Temporal concentration profiles and identification ofintermediates
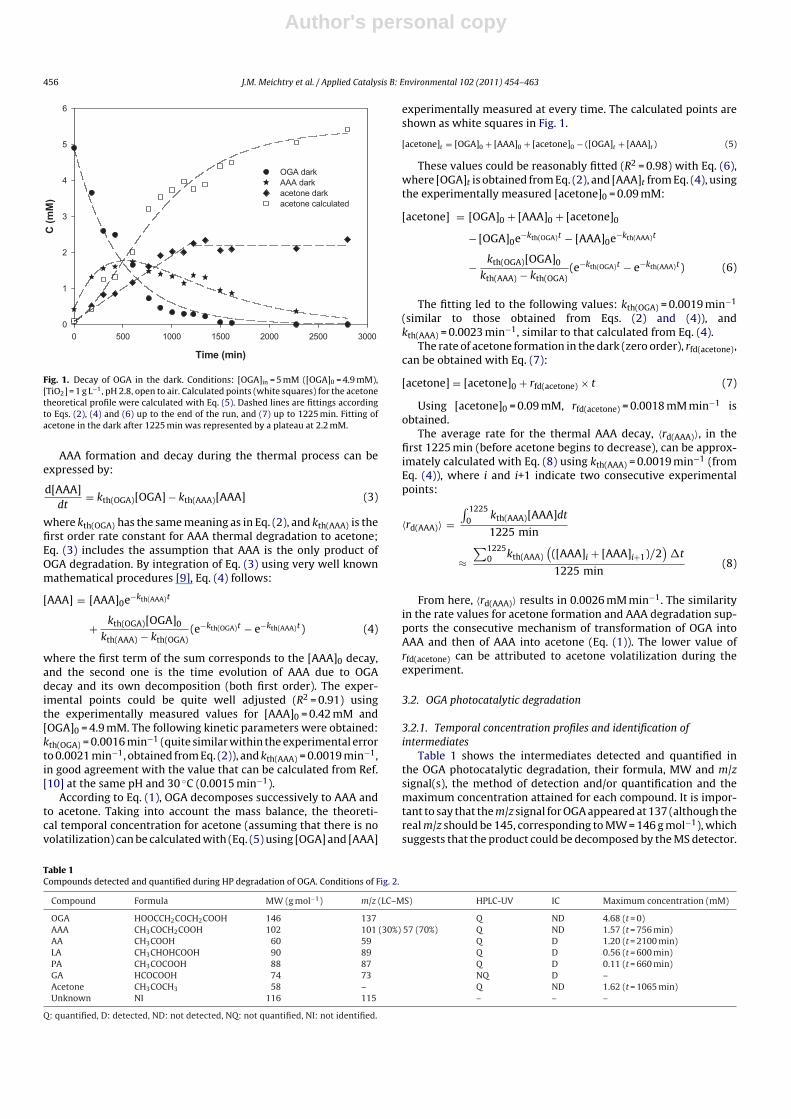
In Fig. 1, the temporal evolution of OGA concentration (5 mM,pH 2.8) in the dark and in the presence of 1 g L−1 TiO2 is displayed.Similar results were obtained in the absence of the semiconductor(not shown).
Acetone and AAA were detected as final products, according tovery well known results [4–6] (Eq. (1)). Acetone increased almostlinearly, reaching the maximum concentration at ca. 1300 min,when OGA has almost disappeared. Afterwards, acetone concen-tration reached a plateau, due probably to compensation betweenits formation and volatilization because the system was open to air.
3.1.2. Calculation of kinetic parametersThe curve of OGA decay could be fitted rather well (R2 = 0.98) to
a first order kinetics:
[OGA] = [OGA]0e−kth(OGA)t (2)
where [OGA]0 = 4.9 mM is the initial concentration of the run andkth(OGA) = 0.0021 min−1 is the decay rate constant. This result isin reasonable agreement with that reported by Hay and Leong(0.01 min−1 at 42 ◦C [3]), considering that our experiment was runat 15–17 ◦C.
Author's personal copy
456 J.M. Meichtry et al. / Applied Catalysis B: Environmental 102 (2011) 454–463
Time (min)
0 500 1000 1500 2000 2500 3000
C (m
M)
0
1
2
3
4
5
6
OGA dark AAA dark acetone dark acetone calculated
Fig. 1. Decay of OGA in the dark. Conditions: [OGA]in = 5 mM ([OGA]0 = 4.9 mM),[TiO2] = 1 g L−1, pH 2.8, open to air. Calculated points (white squares) for the acetonetheoretical profile were calculated with Eq. (5). Dashed lines are fittings accordingto Eqs. (2), (4) and (6) up to the end of the run, and (7) up to 1225 min. Fitting ofacetone in the dark after 1225 min was represented by a plateau at 2.2 mM.
AAA formation and decay during the thermal process can beexpressed by:
d[AAA]dt
= kth(OGA)[OGA] − kth(AAA)[AAA] (3)
where kth(OGA) has the same meaning as in Eq. (2), and kth(AAA) is thefirst order rate constant for AAA thermal degradation to acetone;Eq. (3) includes the assumption that AAA is the only product ofOGA degradation. By integration of Eq. (3) using very well knownmathematical procedures [9], Eq. (4) follows:
[AAA] = [AAA]0e−kth(AAA)t
+ kth(OGA)[OGA]0
kth(AAA) − kth(OGA)(e−kth(OGA)t − e−kth(AAA)t) (4)
where the first term of the sum corresponds to the [AAA]0 decay,and the second one is the time evolution of AAA due to OGAdecay and its own decomposition (both first order). The exper-imental points could be quite well adjusted (R2 = 0.91) usingthe experimentally measured values for [AAA]0 = 0.42 mM and[OGA]0 = 4.9 mM. The following kinetic parameters were obtained:kth(OGA) = 0.0016 min−1 (quite similar within the experimental errorto 0.0021 min−1, obtained from Eq. (2)), and kth(AAA) = 0.0019 min−1,in good agreement with the value that can be calculated from Ref.[10] at the same pH and 30 ◦C (0.0015 min−1).
According to Eq. (1), OGA decomposes successively to AAA andto acetone. Taking into account the mass balance, the theoreti-cal temporal concentration for acetone (assuming that there is novolatilization) can be calculated with (Eq. (5) using [OGA] and [AAA]
experimentally measured at every time. The calculated points areshown as white squares in Fig. 1.
[acetone]t = [OGA]0 + [AAA]0 + [acetone]0 − ([OGA]t + [AAA]t ) (5)
These values could be reasonably fitted (R2 = 0.98) with Eq. (6),where [OGA]t is obtained from Eq. (2), and [AAA]t from Eq. (4), usingthe experimentally measured [acetone]0 = 0.09 mM:
[acetone] = [OGA]0 + [AAA]0 + [acetone]0
− [OGA]0e−kth(OGA)t − [AAA]0e−kth(AAA)t
− kth(OGA)[OGA]0
kth(AAA) − kth(OGA)(e−kth(OGA)t − e−kth(AAA)t) (6)
The fitting led to the following values: kth(OGA) = 0.0019 min−1
(similar to those obtained from Eqs. (2) and (4)), andkth(AAA) = 0.0023 min−1, similar to that calculated from Eq. (4).
The rate of acetone formation in the dark (zero order), rfd(acetone),can be obtained with Eq. (7):
[acetone] = [acetone]0 + rfd(acetone) × t (7)
Using [acetone]0 = 0.09 mM, rfd(acetone) = 0.0018 mM min−1 isobtained.
The average rate for the thermal AAA decay, 〈rd(AAA)〉, in thefirst 1225 min (before acetone begins to decrease), can be approx-imately calculated with Eq. (8) using kth(AAA) = 0.0019 min−1 (fromEq. (4)), where i and i+1 indicate two consecutive experimentalpoints:
〈rd(AAA)〉 =∫ 1225
0kth(AAA)[AAA]dt
1225 min
≈∑1225
0 kth(AAA)
(([AAA]i + [AAA]i+1)/2
)�t
1225 min(8)
From here, 〈rd(AAA)〉 results in 0.0026 mM min−1. The similarityin the rate values for acetone formation and AAA degradation sup-ports the consecutive mechanism of transformation of OGA intoAAA and then of AAA into acetone (Eq. (1)). The lower value ofrfd(acetone) can be attributed to acetone volatilization during theexperiment.
3.2. OGA photocatalytic degradation
3.2.1. Temporal concentration profiles and identification ofintermediates
Table 1 shows the intermediates detected and quantified inthe OGA photocatalytic degradation, their formula, MW and m/zsignal(s), the method of detection and/or quantification and themaximum concentration attained for each compound. It is impor-tant to say that the m/z signal for OGA appeared at 137 (although thereal m/z should be 145, corresponding to MW = 146 g mol−1), whichsuggests that the product could be decomposed by the MS detector.
Table 1Compounds detected and quantified during HP degradation of OGA. Conditions of Fig. 2.
Compound Formula MW (g mol−1) m/z (LC–MS) HPLC-UV IC Maximum concentration (mM)
OGA HOOCCH2COCH2COOH 146 137 Q ND 4.68 (t = 0)AAA CH3COCH2COOH 102 101 (30%) 57 (70%) Q ND 1.57 (t = 756 min)AA CH3COOH 60 59 Q D 1.20 (t = 2100 min)LA CH3CHOHCOOH 90 89 Q D 0.56 (t = 600 min)PA CH3COCOOH 88 87 Q D 0.11 (t = 660 min)GA HCOCOOH 74 73 NQ D –Acetone CH3COCH3 58 – Q ND 1.62 (t = 1065 min)Unknown NI 116 115 – – –
Q: quantified, D: detected, ND: not detected, NQ: not quantified, NI: not identified.
Author's personal copy
J.M. Meichtry et al. / Applied Catalysis B: Environmental 102 (2011) 454–463 457
Time (min)
0 250 500 750 1000 1250 1500 1750 2000
[OG
A] (
mM
)
0.0
1.0
2.0
3.0
4.0
5.0
6.0OGA HP OGa dark
Time (min)
C (m
M)
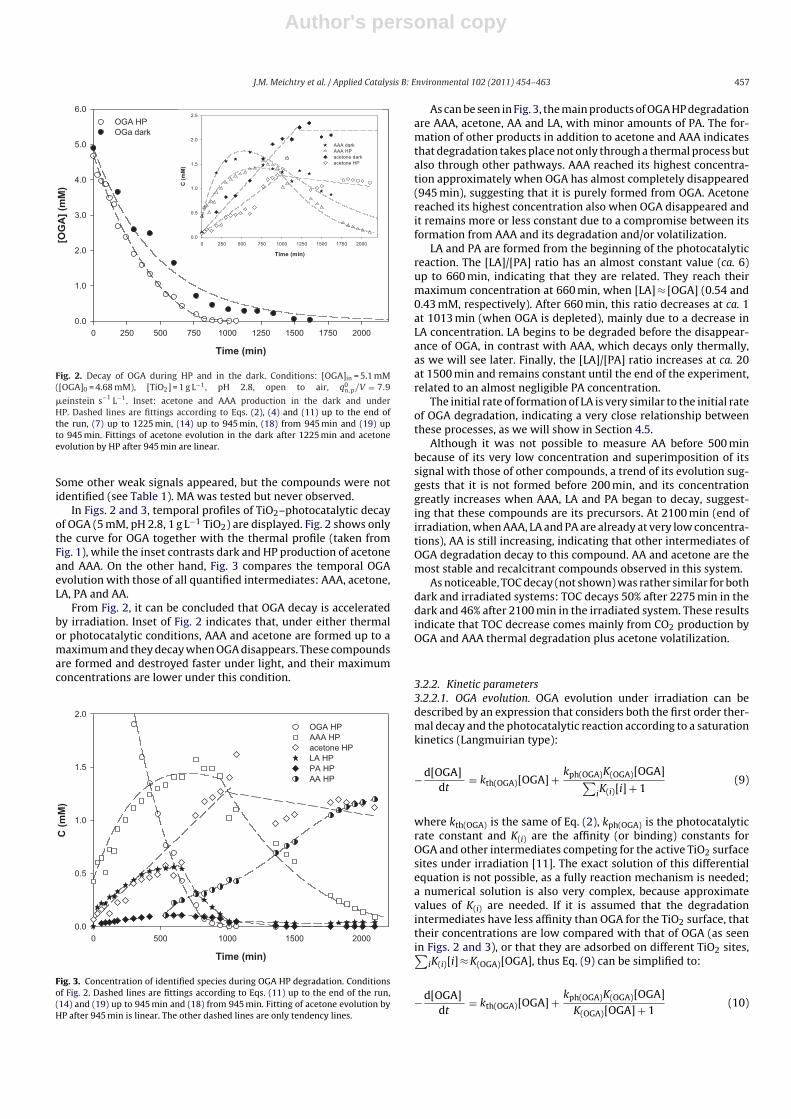
Fig. 2. Decay of OGA during HP and in the dark. Conditions: [OGA]in = 5.1 mM([OGA]0 = 4.68 mM), [TiO2] = 1 g L−1, pH 2.8, open to air, q0
n,p/V = 7.9
�einstein s−1 L−1. Inset: acetone and AAA production in the dark and underHP. Dashed lines are fittings according to Eqs. (2), (4) and (11) up to the end ofthe run, (7) up to 1225 min, (14) up to 945 min, (18) from 945 min and (19) upto 945 min. Fittings of acetone evolution in the dark after 1225 min and acetoneevolution by HP after 945 min are linear.
Some other weak signals appeared, but the compounds were notidentified (see Table 1). MA was tested but never observed.
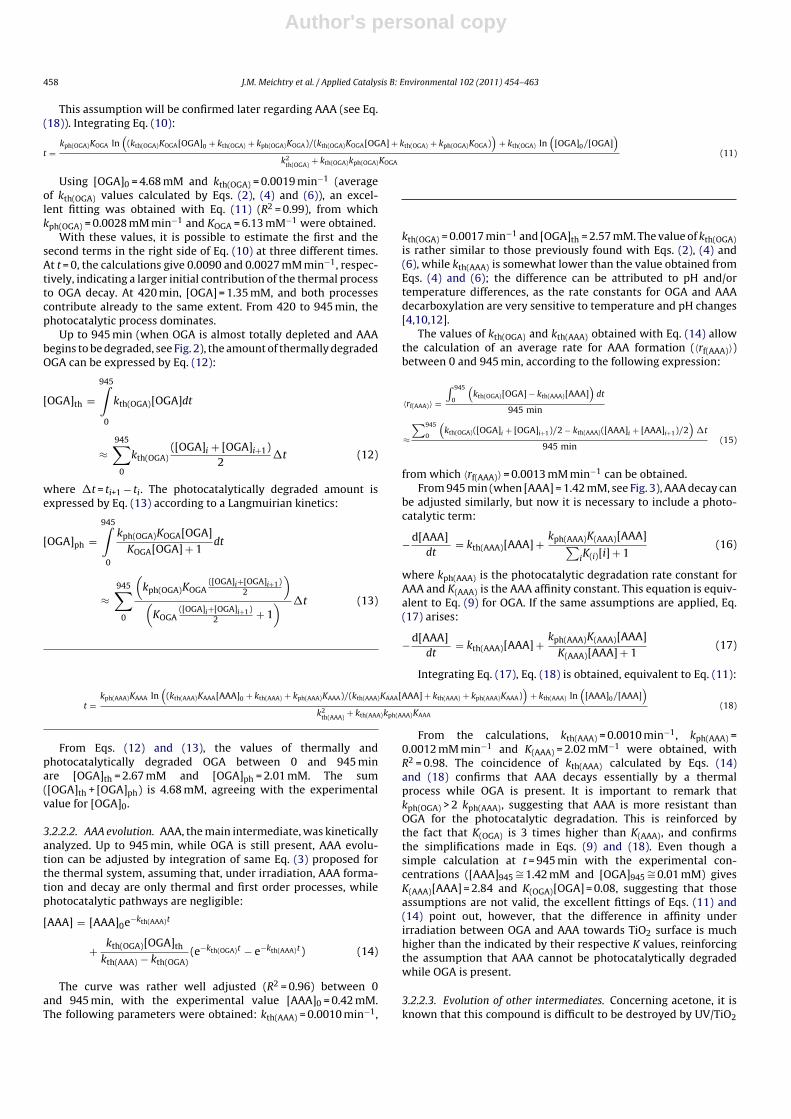
In Figs. 2 and 3, temporal profiles of TiO2–photocatalytic decayof OGA (5 mM, pH 2.8, 1 g L−1 TiO2) are displayed. Fig. 2 shows onlythe curve for OGA together with the thermal profile (taken fromFig. 1), while the inset contrasts dark and HP production of acetoneand AAA. On the other hand, Fig. 3 compares the temporal OGAevolution with those of all quantified intermediates: AAA, acetone,LA, PA and AA.
From Fig. 2, it can be concluded that OGA decay is acceleratedby irradiation. Inset of Fig. 2 indicates that, under either thermalor photocatalytic conditions, AAA and acetone are formed up to amaximum and they decay when OGA disappears. These compoundsare formed and destroyed faster under light, and their maximumconcentrations are lower under this condition.
Time (min)
0 500 1000 1500 2000
C (m
M)
0.0
0.5
1.0
1.5
2.0OGA HPAAA HPacetone HP LA HP PA HP AA HP
Fig. 3. Concentration of identified species during OGA HP degradation. Conditionsof Fig. 2. Dashed lines are fittings according to Eqs. (11) up to the end of the run,(14) and (19) up to 945 min and (18) from 945 min. Fitting of acetone evolution byHP after 945 min is linear. The other dashed lines are only tendency lines.
As can be seen in Fig. 3, the main products of OGA HP degradationare AAA, acetone, AA and LA, with minor amounts of PA. The for-mation of other products in addition to acetone and AAA indicatesthat degradation takes place not only through a thermal process butalso through other pathways. AAA reached its highest concentra-tion approximately when OGA has almost completely disappeared(945 min), suggesting that it is purely formed from OGA. Acetonereached its highest concentration also when OGA disappeared andit remains more or less constant due to a compromise between itsformation from AAA and its degradation and/or volatilization.
LA and PA are formed from the beginning of the photocatalyticreaction. The [LA]/[PA] ratio has an almost constant value (ca. 6)up to 660 min, indicating that they are related. They reach theirmaximum concentration at 660 min, when [LA] ≈ [OGA] (0.54 and0.43 mM, respectively). After 660 min, this ratio decreases at ca. 1at 1013 min (when OGA is depleted), mainly due to a decrease inLA concentration. LA begins to be degraded before the disappear-ance of OGA, in contrast with AAA, which decays only thermally,as we will see later. Finally, the [LA]/[PA] ratio increases at ca. 20at 1500 min and remains constant until the end of the experiment,related to an almost negligible PA concentration.
The initial rate of formation of LA is very similar to the initial rateof OGA degradation, indicating a very close relationship betweenthese processes, as we will show in Section 4.5.
Although it was not possible to measure AA before 500 minbecause of its very low concentration and superimposition of itssignal with those of other compounds, a trend of its evolution sug-gests that it is not formed before 200 min, and its concentrationgreatly increases when AAA, LA and PA began to decay, suggest-ing that these compounds are its precursors. At 2100 min (end ofirradiation, when AAA, LA and PA are already at very low concentra-tions), AA is still increasing, indicating that other intermediates ofOGA degradation decay to this compound. AA and acetone are themost stable and recalcitrant compounds observed in this system.
As noticeable, TOC decay (not shown) was rather similar for bothdark and irradiated systems: TOC decays 50% after 2275 min in thedark and 46% after 2100 min in the irradiated system. These resultsindicate that TOC decrease comes mainly from CO2 production byOGA and AAA thermal degradation plus acetone volatilization.
3.2.2. Kinetic parameters3.2.2.1. OGA evolution. OGA evolution under irradiation can bedescribed by an expression that considers both the first order ther-mal decay and the photocatalytic reaction according to a saturationkinetics (Langmuirian type):
−d[OGA]dt
= kth(OGA)[OGA] + kph(OGA)K(OGA)[OGA]∑iK(i)[i] + 1
(9)
where kth(OGA) is the same of Eq. (2), kph(OGA) is the photocatalyticrate constant and K(i) are the affinity (or binding) constants forOGA and other intermediates competing for the active TiO2 surfacesites under irradiation [11]. The exact solution of this differentialequation is not possible, as a fully reaction mechanism is needed;a numerical solution is also very complex, because approximatevalues of K(i) are needed. If it is assumed that the degradationintermediates have less affinity than OGA for the TiO2 surface, thattheir concentrations are low compared with that of OGA (as seenin Figs. 2 and 3), or that they are adsorbed on different TiO2 sites,∑
iK(i)[i] ≈ K(OGA)[OGA], thus Eq. (9) can be simplified to:
−d[OGA]dt
= kth(OGA)[OGA] + kph(OGA)K(OGA)[OGA]K(OGA)[OGA] + 1
(10)
Author's personal copy
458 J.M. Meichtry et al. / Applied Catalysis B: Environmental 102 (2011) 454–463
This assumption will be confirmed later regarding AAA (see Eq.(18)). Integrating Eq. (10):
t =kph(OGA)KOGA ln
((kth(OGA)KOGA[OGA]0 + kth(OGA) + kph(OGA)KOGA)/(kth(OGA)KOGA[OGA] + kth(OGA) + kph(OGA)KOGA)
)+ kth(OGA) ln
([OGA]0/[OGA]
)k2
th(OGA)+ kth(OGA)kph(OGA)KOGA
(11)
Using [OGA]0 = 4.68 mM and kth(OGA) = 0.0019 min−1 (averageof kth(OGA) values calculated by Eqs. (2), (4) and (6)), an excel-lent fitting was obtained with Eq. (11) (R2 = 0.99), from whichkph(OGA) = 0.0028 mM min−1 and KOGA = 6.13 mM−1 were obtained.
With these values, it is possible to estimate the first and thesecond terms in the right side of Eq. (10) at three different times.At t = 0, the calculations give 0.0090 and 0.0027 mM min−1, respec-tively, indicating a larger initial contribution of the thermal processto OGA decay. At 420 min, [OGA] = 1.35 mM, and both processescontribute already to the same extent. From 420 to 945 min, thephotocatalytic process dominates.
Up to 945 min (when OGA is almost totally depleted and AAAbegins to be degraded, see Fig. 2), the amount of thermally degradedOGA can be expressed by Eq. (12):
[OGA]th =945∫
0
kth(OGA)[OGA]dt
≈945∑
0
kth(OGA)([OGA]i + [OGA]i+1)
2�t (12)
where �t = ti+1 − ti. The photocatalytically degraded amount isexpressed by Eq. (13) according to a Langmuirian kinetics:
[OGA]ph =945∫
0
kph(OGA)KOGA[OGA]KOGA[OGA] + 1
dt
≈945∑
0
(kph(OGA)KOGA
([OGA]i+[OGA]i+1)2
)(
KOGA([OGA]i+[OGA]i+1)
2 + 1) �t (13)
From Eqs. (12) and (13), the values of thermally andphotocatalytically degraded OGA between 0 and 945 minare [OGA]th = 2.67 mM and [OGA]ph = 2.01 mM. The sum([OGA]th + [OGA]ph) is 4.68 mM, agreeing with the experimentalvalue for [OGA]0.
3.2.2.2. AAA evolution. AAA, the main intermediate, was kineticallyanalyzed. Up to 945 min, while OGA is still present, AAA evolu-tion can be adjusted by integration of same Eq. (3) proposed forthe thermal system, assuming that, under irradiation, AAA forma-tion and decay are only thermal and first order processes, whilephotocatalytic pathways are negligible:
[AAA] = [AAA]0e−kth(AAA)t
+ kth(OGA)[OGA]th
kth(AAA) − kth(OGA)(e−kth(OGA)t − e−kth(AAA)t) (14)
The curve was rather well adjusted (R2 = 0.96) between 0and 945 min, with the experimental value [AAA]0 = 0.42 mM.The following parameters were obtained: kth(AAA) = 0.0010 min−1,
kth(OGA) = 0.0017 min−1 and [OGA]th = 2.57 mM. The value of kth(OGA)is rather similar to those previously found with Eqs. (2), (4) and(6), while kth(AAA) is somewhat lower than the value obtained fromEqs. (4) and (6); the difference can be attributed to pH and/ortemperature differences, as the rate constants for OGA and AAAdecarboxylation are very sensitive to temperature and pH changes[4,10,12].
The values of kth(OGA) and kth(AAA) obtained with Eq. (14) allowthe calculation of an average rate for AAA formation (〈rf(AAA)〉)between 0 and 945 min, according to the following expression:
〈rf(AAA)〉 =
∫ 945
0
(kth(OGA)[OGA] − kth(AAA)[AAA]
)dt
945 min
≈
∑945
0
(kth(OGA)([OGA]i + [OGA]i+1)/2 − kth(AAA)([AAA]i + [AAA]i+1)/2
)�t
945 min(15)
from which 〈rf(AAA)〉 = 0.0013 mM min−1 can be obtained.From 945 min (when [AAA] = 1.42 mM, see Fig. 3), AAA decay can
be adjusted similarly, but now it is necessary to include a photo-catalytic term:
−d[AAA]dt
= kth(AAA)[AAA] + kph(AAA)K(AAA)[AAA]∑iK(i)[i] + 1
(16)
where kph(AAA) is the photocatalytic degradation rate constant forAAA and K(AAA) is the AAA affinity constant. This equation is equiv-alent to Eq. (9) for OGA. If the same assumptions are applied, Eq.(17) arises:
−d[AAA]dt
= kth(AAA)[AAA] + kph(AAA)K(AAA)[AAA]K(AAA)[AAA] + 1
(17)
Integrating Eq. (17), Eq. (18) is obtained, equivalent to Eq. (11):
t =kph(AAA)KAAA ln
((kth(AAA)KAAA[AAA]0 + kth(AAA) + kph(AAA)KAAA)/(kth(AAA)KAAA[AAA] + kth(AAA) + kph(AAA)KAAA)
)+ kth(AAA) ln
([AAA]0/[AAA]
)k2
th(AAA)+ kth(AAA)kph(AAA)KAAA
(18)
From the calculations, kth(AAA) = 0.0010 min−1, kph(AAA) =0.0012 mM min−1 and K(AAA) = 2.02 mM−1 were obtained, withR2 = 0.98. The coincidence of kth(AAA) calculated by Eqs. (14)and (18) confirms that AAA decays essentially by a thermalprocess while OGA is present. It is important to remark thatkph(OGA) > 2 kph(AAA), suggesting that AAA is more resistant thanOGA for the photocatalytic degradation. This is reinforced bythe fact that K(OGA) is 3 times higher than K(AAA), and confirmsthe simplifications made in Eqs. (9) and (18). Even though asimple calculation at t = 945 min with the experimental con-centrations ([AAA]945 ∼= 1.42 mM and [OGA]945 ∼= 0.01 mM) givesK(AAA)[AAA] = 2.84 and K(OGA)[OGA] = 0.08, suggesting that thoseassumptions are not valid, the excellent fittings of Eqs. (11) and(14) point out, however, that the difference in affinity underirradiation between OGA and AAA towards TiO2 surface is muchhigher than the indicated by their respective K values, reinforcingthe assumption that AAA cannot be photocatalytically degradedwhile OGA is present.
3.2.2.3. Evolution of other intermediates. Concerning acetone, it isknown that this compound is difficult to be destroyed by UV/TiO2
Author's personal copy
J.M. Meichtry et al. / Applied Catalysis B: Environmental 102 (2011) 454–463 459
Table 2Summary of the kinetic parameters.
Kinetic parameter Value
kth(OGA) 0.0021 min−1 (Eq. (2))0.0016 min−1 (Eq. (4))0.0019 min−1 (Eq. (6))0.0017 min−1 (Eq. (14))
kth(AAA) 0.0019 min−1 (Eq. (4))0.0023 min−1 (Eq. (6))0.0010 min−1 (Eqs. (14) and (18))
kph(OGA) 0.0028 mM min−1 (Eq. (11))KOGA 6.13 mM−1 (Eq. (11))kph(AAA) 0.0012 mM min−1 (Eq. (18))KAAA 2.02 mM−1 (Eq. (18))
[13,14]. FA and AA are some of the most important products,reported mainly in other AOT systems like gas phase HP [15] orUV/H2O2 [16]. The volatility of acetone in the present system affectsthe results and precludes a correct evaluation. The almost con-stant value of acetone concentration after 945 min in the HP systemreveals a compromise between formation, vaporization and somedestruction, as said for the thermal reaction.
The rate of acetone formation between 0 and 945 min (while itsconcentration is still increasing), rfHP(acetone), can be calculated withEq. (19), similar to Eq. (7):
[acetone] = [acetone]0 + rfHP(acetone) × t (19)
Using the initial experimental value, [acetone]0 = 0.07 mM,rfHP(acetone) = 0.0012 mM min−1 was obtained, 33% lower than thevalue obtained for rfd(acetone) in the dark; the difference can beascribed to the lower amount of AAA formed under irradiation.
The initial rate of LA formation can be calculated with Eq. (20)(equivalent to Eqs. (7) and (19) for acetone) between 0 and 120 min(where LA concentration increases almost linearly); after 120 min, adeceleration is observed, suggesting that the photocatalytic degra-dation becomes more important.
[LA] = [LA]0 + rfHP(LA) × t (20)
Using the initial experimental value, [LA]0 = 0.003 mM,rfHP(LA) = 0.0026 mM min−1 was obtained, very close tor0(OGA) = 0.0027 mM min−1, the initial rate for OGA photocat-alytic degradation calculated from Eq. (10) at t = 0. This clearlyindicates that LA is one of the first products formed from the OGAphotocatalytic degradation, as can be seen in Fig. 3.
A similar analysis for PA was considered non-accurate becauseof the low concentrations attained by the compound. The lack ofinitial values for AA precludes also similar calculations.
Table 2 gives a summary of all the obtained kinetic parameters.
4. Discussion
4.1. General discussion
According to calculations of Section 3.1.2, it can be proposed thatin the presence of TiO2 and light, OGA decomposes by an interplayof a thermal process (giving AAA and acetone) and simultaneousoperation of photocatalytic pathways, which are evident from: (1)the faster OGA decay compared with the dark reaction, (2) the loweramount of AAA and acetone produced, (3) the faster AAA degrada-tion after 945 min compared with the thermal decay (Fig. 2), and(4) the formation of additional compounds (LA, PA and AA) (Table 1and Figs. 2 and 3).
The spontaneous thermal decarboxylation of �-ketoacids OGAand AAA are well-understood reactions, and their mechanismswill not be discussed here as they are reported in several papers[3,4,10,12]. In contrast, we will propose some possible routes for
OGA and AAA decomposition under UV/TiO2, emphasizing thatphotocatalytic and thermal processes will coexist. Concerning thereaction intermediates, some mechanistic aspects have alreadybeen presented in the literature, and only the main points will beindicated.
According to the very well known mechanism of photocatal-ysis of organic compounds over TiO2 (see [1,17], and referencestherein), after excitation of the semiconductor with light of energyhigher than the bandgap, electron and holes are primarily pro-duced, followed by formation of reactive oxygen species such asHO•, O2
•−, HO2• and H2O2. Beyond the known controversy regard-
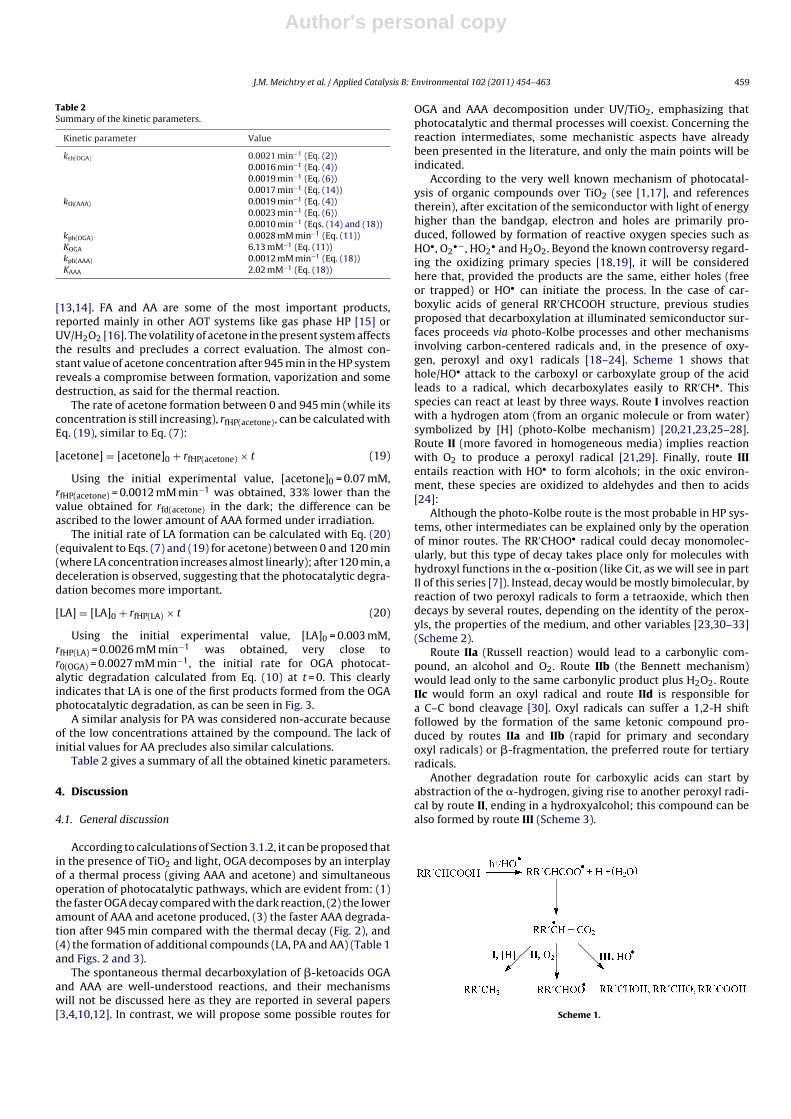
ing the oxidizing primary species [18,19], it will be consideredhere that, provided the products are the same, either holes (freeor trapped) or HO• can initiate the process. In the case of car-boxylic acids of general RR′CHCOOH structure, previous studiesproposed that decarboxylation at illuminated semiconductor sur-faces proceeds via photo-Kolbe processes and other mechanismsinvolving carbon-centered radicals and, in the presence of oxy-gen, peroxyl and oxy1 radicals [18–24]. Scheme 1 shows thathole/HO• attack to the carboxyl or carboxylate group of the acidleads to a radical, which decarboxylates easily to RR′CH•. Thisspecies can react at least by three ways. Route I involves reactionwith a hydrogen atom (from an organic molecule or from water)symbolized by [H] (photo-Kolbe mechanism) [20,21,23,25–28].Route II (more favored in homogeneous media) implies reactionwith O2 to produce a peroxyl radical [21,29]. Finally, route IIIentails reaction with HO• to form alcohols; in the oxic environ-ment, these species are oxidized to aldehydes and then to acids[24]:
Although the photo-Kolbe route is the most probable in HP sys-tems, other intermediates can be explained only by the operationof minor routes. The RR′CHOO• radical could decay monomolec-ularly, but this type of decay takes place only for molecules withhydroxyl functions in the �-position (like Cit, as we will see in partII of this series [7]). Instead, decay would be mostly bimolecular, byreaction of two peroxyl radicals to form a tetraoxide, which thendecays by several routes, depending on the identity of the perox-yls, the properties of the medium, and other variables [23,30–33](Scheme 2).
Route IIa (Russell reaction) would lead to a carbonylic com-pound, an alcohol and O2. Route IIb (the Bennett mechanism)would lead only to the same carbonylic product plus H2O2. RouteIIc would form an oxyl radical and route IId is responsible fora C–C bond cleavage [30]. Oxyl radicals can suffer a 1,2-H shiftfollowed by the formation of the same ketonic compound pro-duced by routes IIa and IIb (rapid for primary and secondaryoxyl radicals) or �-fragmentation, the preferred route for tertiaryradicals.
Another degradation route for carboxylic acids can start byabstraction of the �-hydrogen, giving rise to another peroxyl radi-cal by route II, ending in a hydroxyalcohol; this compound can bealso formed by route III (Scheme 3).
Scheme 1.

Author's personal copy
460 J.M. Meichtry et al. / Applied Catalysis B: Environmental 102 (2011) 454–463
Scheme 2.
4.2. Mechanism for OGA photocatalytic degradation
In the case of OGA, both hbv+ and HO• (free or trapped at the
TiO2 surface) can be the oxidative species. At pH 2.8, accordingto the ionization constants reported for this carboxylic acid [3],the compound is 72% in the totally protonated form, 27% as themonoanion and 1% as the dianion. At this pH, the one-electronreduction potential of OGA, E0•
H5C5O5/H5C5O5− , is not known, but
it is surely in the range of the standard potentials reported forthe oxidation of the carboxylate entity, i.e., around +1.4 V (vs.NHE) [34,35]. The value for acetic acid (a less oxidizable com-pound) was estimated to be in the range 2.05–2.7 V [36,37].Thus, hvb
+–TiO2 (Vfb = +2.7 V at pH 2.8 for Degussa P-25 [38]) andHO• (E0
HO•
/H2O = 2.6 V at pH 2.8 [39]) can easily oxidize OGA.Two points of attack are possible, the carboxyl group (position1) or the �-hydrogen (position 2). The first attack (Scheme 4)would end in AAA by route I. By route II (a, b and c), an alco-hol (MW = 118 g mol−1) and an aldehyde (MW = 116 g mol−1) canbe formed. A low MS signal corresponding to MW = 116 g mol−1
was actually observed, but its real structure was not found. Bothcompounds can be oxidized to oxalacetic acid (IUPAC name:oxobutanedioic acid, MW = 132 g mol−1) but the signal of this com-pound was not detected, probably because it is easily degradedin the oxidative medium. Actually, oxalacetic is also an unstable�-ketoacid, easily decarboxylated by a thermal reaction (reportedfirst order rate constant 0.00063 min−1 at 15 ◦C and pH 2.8[40]) and found to be decarboxylated to PA in a UV/TiO2system [41], probably by a simultaneous photo-Kolbe pro-cess like that indicated in Scheme 4. Minor routes could bepossible for oxalacetic acid but they would produce unsta-ble compounds. In addition, the reducing methylenic radical
Scheme 3.Scheme 4.
Author's personal copy
J.M. Meichtry et al. / Applied Catalysis B: Environmental 102 (2011) 454–463 461
Scheme 5.
HOOCCH2COCH2• can lead to other compounds, as we will see
in Section 4.5. Route III would produce the same alcohol ofMW = 118 g mol−1.
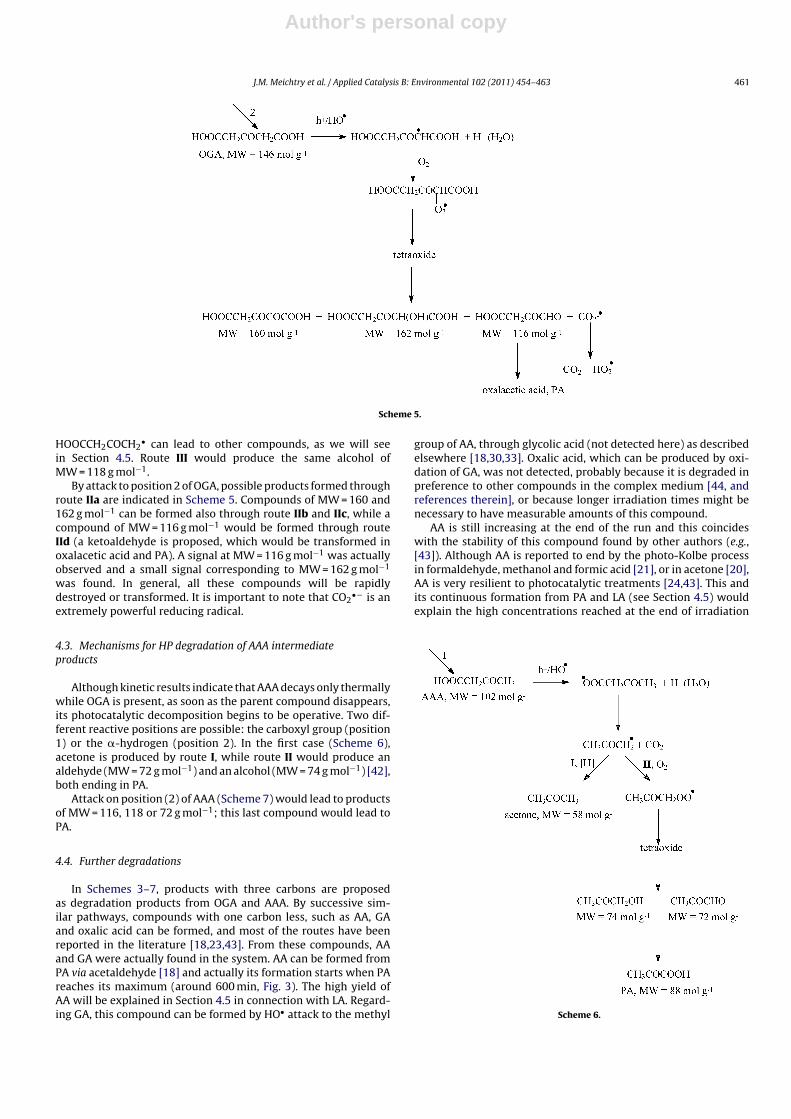
By attack to position 2 of OGA, possible products formed throughroute IIa are indicated in Scheme 5. Compounds of MW = 160 and162 g mol−1 can be formed also through route IIb and IIc, while acompound of MW = 116 g mol−1 would be formed through routeIId (a ketoaldehyde is proposed, which would be transformed inoxalacetic acid and PA). A signal at MW = 116 g mol−1 was actuallyobserved and a small signal corresponding to MW = 162 g mol−1
was found. In general, all these compounds will be rapidlydestroyed or transformed. It is important to note that CO2
•− is anextremely powerful reducing radical.
4.3. Mechanisms for HP degradation of AAA intermediateproducts
Although kinetic results indicate that AAA decays only thermallywhile OGA is present, as soon as the parent compound disappears,its photocatalytic decomposition begins to be operative. Two dif-ferent reactive positions are possible: the carboxyl group (position1) or the �-hydrogen (position 2). In the first case (Scheme 6),acetone is produced by route I, while route II would produce analdehyde (MW = 72 g mol−1) and an alcohol (MW = 74 g mol−1) [42],both ending in PA.
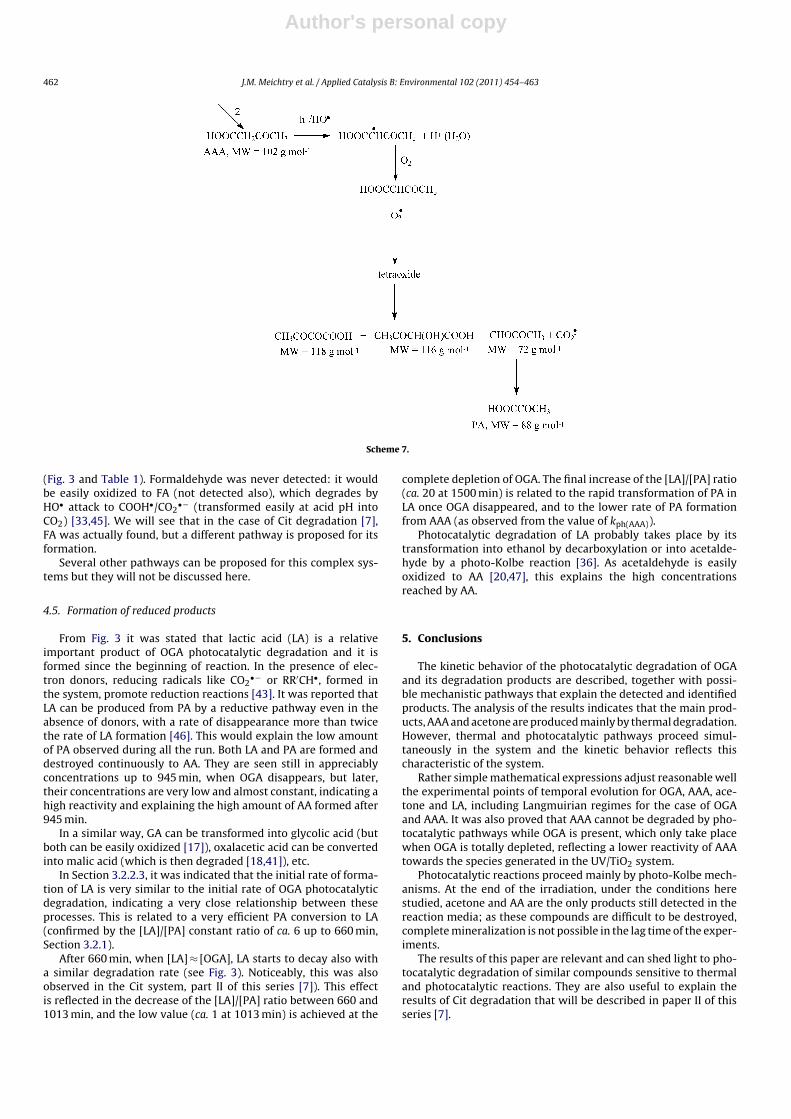
Attack on position (2) of AAA (Scheme 7) would lead to productsof MW = 116, 118 or 72 g mol−1; this last compound would lead toPA.
4.4. Further degradations
In Schemes 3–7, products with three carbons are proposedas degradation products from OGA and AAA. By successive sim-ilar pathways, compounds with one carbon less, such as AA, GAand oxalic acid can be formed, and most of the routes have beenreported in the literature [18,23,43]. From these compounds, AAand GA were actually found in the system. AA can be formed fromPA via acetaldehyde [18] and actually its formation starts when PAreaches its maximum (around 600 min, Fig. 3). The high yield ofAA will be explained in Section 4.5 in connection with LA. Regard-ing GA, this compound can be formed by HO• attack to the methyl
group of AA, through glycolic acid (not detected here) as describedelsewhere [18,30,33]. Oxalic acid, which can be produced by oxi-dation of GA, was not detected, probably because it is degraded inpreference to other compounds in the complex medium [44, andreferences therein], or because longer irradiation times might benecessary to have measurable amounts of this compound.
AA is still increasing at the end of the run and this coincideswith the stability of this compound found by other authors (e.g.,[43]). Although AA is reported to end by the photo-Kolbe processin formaldehyde, methanol and formic acid [21], or in acetone [20],AA is very resilient to photocatalytic treatments [24,43]. This andits continuous formation from PA and LA (see Section 4.5) wouldexplain the high concentrations reached at the end of irradiation
Scheme 6.
Author's personal copy
462 J.M. Meichtry et al. / Applied Catalysis B: Environmental 102 (2011) 454–463
Scheme 7.
(Fig. 3 and Table 1). Formaldehyde was never detected: it wouldbe easily oxidized to FA (not detected also), which degrades byHO• attack to COOH•/CO2
•− (transformed easily at acid pH intoCO2) [33,45]. We will see that in the case of Cit degradation [7],FA was actually found, but a different pathway is proposed for itsformation.
Several other pathways can be proposed for this complex sys-tems but they will not be discussed here.
4.5. Formation of reduced products
From Fig. 3 it was stated that lactic acid (LA) is a relativeimportant product of OGA photocatalytic degradation and it isformed since the beginning of reaction. In the presence of elec-tron donors, reducing radicals like CO2
•− or RR′CH•, formed inthe system, promote reduction reactions [43]. It was reported thatLA can be produced from PA by a reductive pathway even in theabsence of donors, with a rate of disappearance more than twicethe rate of LA formation [46]. This would explain the low amountof PA observed during all the run. Both LA and PA are formed anddestroyed continuously to AA. They are seen still in appreciablyconcentrations up to 945 min, when OGA disappears, but later,their concentrations are very low and almost constant, indicating ahigh reactivity and explaining the high amount of AA formed after945 min.
In a similar way, GA can be transformed into glycolic acid (butboth can be easily oxidized [17]), oxalacetic acid can be convertedinto malic acid (which is then degraded [18,41]), etc.
In Section 3.2.2.3, it was indicated that the initial rate of forma-tion of LA is very similar to the initial rate of OGA photocatalyticdegradation, indicating a very close relationship between theseprocesses. This is related to a very efficient PA conversion to LA(confirmed by the [LA]/[PA] constant ratio of ca. 6 up to 660 min,Section 3.2.1).
After 660 min, when [LA] ≈ [OGA], LA starts to decay also witha similar degradation rate (see Fig. 3). Noticeably, this was alsoobserved in the Cit system, part II of this series [7]). This effectis reflected in the decrease of the [LA]/[PA] ratio between 660 and1013 min, and the low value (ca. 1 at 1013 min) is achieved at the
complete depletion of OGA. The final increase of the [LA]/[PA] ratio(ca. 20 at 1500 min) is related to the rapid transformation of PA inLA once OGA disappeared, and to the lower rate of PA formationfrom AAA (as observed from the value of kph(AAA)).
Photocatalytic degradation of LA probably takes place by itstransformation into ethanol by decarboxylation or into acetalde-hyde by a photo-Kolbe reaction [36]. As acetaldehyde is easilyoxidized to AA [20,47], this explains the high concentrationsreached by AA.
5. Conclusions
The kinetic behavior of the photocatalytic degradation of OGAand its degradation products are described, together with possi-ble mechanistic pathways that explain the detected and identifiedproducts. The analysis of the results indicates that the main prod-ucts, AAA and acetone are produced mainly by thermal degradation.However, thermal and photocatalytic pathways proceed simul-taneously in the system and the kinetic behavior reflects thischaracteristic of the system.
Rather simple mathematical expressions adjust reasonable wellthe experimental points of temporal evolution for OGA, AAA, ace-tone and LA, including Langmuirian regimes for the case of OGAand AAA. It was also proved that AAA cannot be degraded by pho-tocatalytic pathways while OGA is present, which only take placewhen OGA is totally depleted, reflecting a lower reactivity of AAAtowards the species generated in the UV/TiO2 system.
Photocatalytic reactions proceed mainly by photo-Kolbe mech-anisms. At the end of the irradiation, under the conditions herestudied, acetone and AA are the only products still detected in thereaction media; as these compounds are difficult to be destroyed,complete mineralization is not possible in the lag time of the exper-iments.
The results of this paper are relevant and can shed light to pho-tocatalytic degradation of similar compounds sensitive to thermaland photocatalytic reactions. They are also useful to explain theresults of Cit degradation that will be described in paper II of thisseries [7].

Author's personal copy
J.M. Meichtry et al. / Applied Catalysis B: Environmental 102 (2011) 454–463 463
Acknowledgements
This work was performed as part of Comisión Nacional deEnergía Atómica P5-PID-36-4 Programme, CONICET/CNRS grantfor joint cooperation between Clermont-Ferrand and Argentinelaboratories, Agencia Nacional de la Promoción de la Cienciay la Tecnología PICT98-13-03672, PICT03-13-13261 and Con-sejo Nacional de Investigaciones Científicas y Técnicas (CONICET)PIP319 Projects. MIL is a member of CONICET. JMM and NQ thankCONICET for a doctoral fellowship. The authors thank Marius Para-zols for IC measurements and Bertrand Lègeret for LC/MS analysis.
References
[1] N. Quici, M.E. Morgada, R.T. Gettar, M. Bolte, M.I. Litter, Appl. Catal. B: Environ.71 (2007) 117–124.
[2] J.M. Meichtry, M. Brusa, G. Mailhot, M.A. Grela, M.I. Litter, Appl. Catal. B: Environ.71 (2007) 101–107.
[3] R.W. Hay, K.N. Leong, J. Chem. Soc. A (1971) 3639–3647.[4] E.O. Wiig, J. Phys. Chem. 32 (1928) 961–981.[5] E.O. Wiig, J. Phys. Chem. 52 (1928) 4729–4737.[6] P. Borer, S.J. Hug, B. Sulzberger, S.M. Kraemer, R. Kretzschmar, J. Phys. Chem. C
111 (2007) 10560–10569.[7] J.M. Meichtry, N. Quici, G. Mailhot, M.I. Litter, Appl. Catal. B: Environ., in press
(part II of this series).[8] A. Marinoni, P. Laj, K. Sellegri, G. Mailhot, Atmos. Chem. Phys. 4 (2004) 715–728.[9] S.W. Benson, The Foundations of Chemical Kinetics, McGraw-Hill, New York,
1960, 33-35.[10] J.P. Guthrie, F. Jordan, J. Am. Chem. Soc. 96 (1972) 9136–9141.[11] A.V. Emeline, V. Ryabchuk, N. Serpone, J. Photochem. Photobiol. A: Chem. 133
(2000) 89–97.[12] C.-L. Huang, C.-C. Wu, M.-H. Lien, J. Phys. Chem. A 101 (1997) 7867–7873.[13] T.M. El-Moris, M.A. Nanny, Engineering, Construction, and Operations in Chal-
lenging Environments: Earth & Space 2004, in: R.B. Malla, A. Maji (Eds.),Proceedings of the Ninth Biennial ASCE Aerospace Division InternationalConference on Engineering, Construction and Operations in Challenging Envi-ronments, March 7–10, League City/Houston, TXReston, VA, 2004.
[14] C. Salazar, M.A. Nanny, J. Catal. 269 (2010) 404–410.[15] C.M. Schmidt, A.M. Buchbinder, E. Weitz, F.M. Geiger, J. Phys. Chem. A 111
(2007) 13023–13031.[16] M.I. Stefan, A.R. Hoy, J.R. Bolton, Environ. Sci. Technol. 30 (1996) 2382–2390.[17] M.R. Hoffmann, S.T. Martin, W. Choi, D.W. Bahnemann, Chem. Rev. 95 (1995)
69–96.
[18] J.-M. Herrmann, H. Tahiri, C. Guillard, P. Pichat, Catal. Today 54 (1999) 131–141.[19] A. Fujishima, X. Zhang, D.A. Tryk, Surf. Sci. Reports 63 (2008) 515–582.[20] T. Sakata, T. Kawai, K. Hashimoto, J. Phys. Chem. 88 (1984) 2344–2350.[21] D.W. Bahnemann, in: E. Pelizzetti, M. Schiavello (Eds.), Photochemical Conver-
sion and Storage of Solar Energy, Kluwer Academic Publishers, Dordrecht, 1991,pp. 251–276.
[22] J. Schwitzgebel, J.G. Ekerdt, H. Gerischer, A. Heller, J. Phys. Chem 99 (1995)5633–5638.
[23] C. Guillard, J. Photochem. Photobiol. A 135 (2000) 65–75.[24] N. Serpone, J. Martin, R. Horikoshi, H. Hidaka, J. Photochem. Photobiol. A 169
(2005) 235–251.[25] I. Dolamic, T. Bürgi, J. Catal. 248 (2007) 268–276.[26] X.-J. Zheng, L.-F. Wei, Z.-H. Zhang, Q.-J. Jiang, Y.-J. Wei, B. Xie, M.-B. Wei, Int. J.
Hydrogen Energy 34 (2009) 9033–9041.[27] D. Jiang, H. Zhao, S. Zhang, R. John, J. Catal. 223 (2004) 212–220.[28] M. Kaise, H. Kondoh, C. Nishihara, H. Nozoye, H. Shindo, S. Nimura, O. Kikuchi,
J. Chem. Soc.: Chem. Commun. (1993) 395–396.[29] W.A. Pryor, in: K.L. Rinehart (Ed.), Introduction to Free Radical Chemistry, Pren-
tice Hall, New Jersey, 1966, pp. 1–12.[30] C. von Sonntag, H.-P. Schuchmann, Angew. Chem. Int. Ed. 30 (1991) 1229–1253.[31] C. von Sonntag, H.-P. Schuchmann, in: Z.B. Alfassi (Ed.), Peroxyl Radicals, Wiley,
Chichester, 1997, pp. 173–234.[32] M.N. Schuchmann, H.-P. Schuchmann, C. von Sonntag, J. Phys. Chem. 99 (1995)
9122–9129.[33] N. Karpel Vel Leitner, M. Dore, J. Photochem. Photobiol. A: Chem. 99 (1996)
137–141.[34] M.N. Baizer, H. Lund, Organic Electrochemistry, Marcel Dekker, Inc., New York,
1983.[35] J. Colucci, V. Montalvo, R. Hernandez, C. Poullet, Electrochim. Acta 44 (1999)
2507–2514.[36] H. Harada, T. Ueda, T. Sakata, J. Phys. Chem. 93 (1989) 1542–1548.[37] R. Zhao, J. Lind, G. Merenyi, T.E. Eriksen, J. Am. Chem. Soc. 120 (1998)
2811–2816.[38] S.T. Martin, H. Herrmann, M.R. Hoffmann, J. Chem. Soc. Faraday Trans. 90 (1994)
3323–3330.[39] E. Pelizzetti, C. Minero, Electrochim. Acta 38 (1993) 47–55.[40] E. Gelles, J. Chem. Soc. (1956) 4736–4739.[41] A. Danion, J. Disdier, C. Guillard, N. Jaffrezic-Renault, J. Photochem. Photobiol.
A: Chem. 190 (2007) 135–140.[42] H. Zegota, M.N. Schuchmann, D. Schulz, C.Z. von Sonntag, Naturforschung 41B
(1986) 1015–1022.[43] K. Tanaka, K.S.N. Reddy, Appl. Catal. B: Environ. 39 (2002) 305–310.[44] N. Quici, M.E. Morgada, G. Piperata, P.A. Babay, R.T. Gettar, M.I. Litter, Catal.
Today 101 (2005) 253–260.[45] P. Neta, M. Simic, E. Hayon, J. Phys. Chem. 73 (1969) 4207–4213.[46] P. Cuendet, M. Gratzel, J. Phys. Chem. 91 (1987) 654–657.[47] K. Ikeda, K. Hashimoto, A. Fujishima, J. Electroanal. Chem. 437 (1997) 241–244.
Related Documents