Original article Heterogeneity of variance for type traits in the Montbeliarde cattle breed C Robert-Granié V Ducrocq JL Foulley Station de génétique quantitative et appliquée, Institut national de la recherche agronomique Centre de recherches de Jouy-en-Josas, 78352 Jouy-en-Josas cedex, France (Received 3 April 1997; accepted 22 September 1997) Summary - This paper presents and discusses the estimation of genetic and residual (co-) variance components for conformation traits recorded in different environments using mixed linear models. Testing procedures for genetic parameters (genetic correlations between environments constant or equal to one, genetic correlation equal to one and constant intra-class correlations, homogeneity of variance-covariance components) are presented. These hypotheses were described via heteroskedastic univariate sire models taking into account genotype x environment interaction. An expectation-maximization (EM) algorithm was proposed for calculating restricted maximum likelihood (REML) estimates of the residual and genetic components of variances and co-variances. Likelihood ratio tests were suggested to assess hypotheses concerning genetic parameters. The procedures presented in the paper were used to analyze and to detect sources of variation on conformation traits in the Montbeliarde cattle breed using 24 301 progeny records of 528 sires. On all variables analyzed, several sources (stage of lactation, classifiers, type of housing) of heterogeneity of residual and genetic variances were clearly highlighted, but intra-class correlations between environments of type traits remained generally constant. heteroskedasticity / mixed model / genotype x environment interaction / EM algorithm / REML estimation Résumé - Hétérogénéité des variances de caractère d’animaux de race Montbéliarde. Cet article présente et discute l’estimation des composantes de (co)variance (génétiques et résiduelles) de caractères de conformation mesurés entre milieu! en situation d’hétéro- scédasticité. Des tests d’homogénéité de certains paramètres (corrélations génétiques entre milieux constantes ou égales à 1, corrélations génétiques égales à 1 et corrélations intra-classes constantes, homogénéité des variances-covariances génétiques et résiduelles) intéressant les généticiens sont également présentés. Ces hypothèses sont décrites par un modèle père, unidimensionnel hétéroscédastique prenant en compte les interactions génotype x milieu. Un algorithme itératif d’espérance-maximisation (EM) est proposé pour calculer les estimées du maximum de vraisemblance restreinte (REML) des composantes résiduelles et génétiques de variance-covariance. Un test de rapport des vraisemblances restreintes est présenté pour tester les différentes hypothèses considérées. Les procédures développées sont utilisées pour l’analyse des notes de pointage de quelques caractères de

Welcome message from author
This document is posted to help you gain knowledge. Please leave a comment to let me know what you think about it! Share it to your friends and learn new things together.
Transcript
Original article
Heterogeneity of variance for type traitsin the Montbeliarde cattle breed
C Robert-Granié V Ducrocq JL FoulleyStation de génétique quantitative et appliquée,Institut national de la recherche agronomique
Centre de recherches de Jouy-en-Josas,78352 Jouy-en-Josas cedex, France
(Received 3 April 1997; accepted 22 September 1997)
Summary - This paper presents and discusses the estimation of genetic and residual(co-) variance components for conformation traits recorded in different environments
using mixed linear models. Testing procedures for genetic parameters (genetic correlationsbetween environments constant or equal to one, genetic correlation equal to one andconstant intra-class correlations, homogeneity of variance-covariance components) are
presented. These hypotheses were described via heteroskedastic univariate sire modelstaking into account genotype x environment interaction. An expectation-maximization(EM) algorithm was proposed for calculating restricted maximum likelihood (REML)estimates of the residual and genetic components of variances and co-variances. Likelihoodratio tests were suggested to assess hypotheses concerning genetic parameters. Theprocedures presented in the paper were used to analyze and to detect sources of variationon conformation traits in the Montbeliarde cattle breed using 24 301 progeny records of528 sires. On all variables analyzed, several sources (stage of lactation, classifiers, type ofhousing) of heterogeneity of residual and genetic variances were clearly highlighted, butintra-class correlations between environments of type traits remained generally constant.
heteroskedasticity / mixed model / genotype x environment interaction / EMalgorithm / REML estimation
Résumé - Hétérogénéité des variances de caractère d’animaux de race Montbéliarde.Cet article présente et discute l’estimation des composantes de (co)variance (génétiqueset résiduelles) de caractères de conformation mesurés entre milieu! en situation d’hétéro-scédasticité. Des tests d’homogénéité de certains paramètres (corrélations génétiques entremilieux constantes ou égales à 1, corrélations génétiques égales à 1 et corrélationsintra-classes constantes, homogénéité des variances-covariances génétiques et résiduelles)intéressant les généticiens sont également présentés. Ces hypothèses sont décrites parun modèle père, unidimensionnel hétéroscédastique prenant en compte les interactions
génotype x milieu. Un algorithme itératif d’espérance-maximisation (EM) est proposé pourcalculer les estimées du maximum de vraisemblance restreinte (REML) des composantesrésiduelles et génétiques de variance-covariance. Un test de rapport des vraisemblancesrestreintes est présenté pour tester les différentes hypothèses considérées. Les procéduresdéveloppées sont utilisées pour l’analyse des notes de pointage de quelques caractères de
morphologie de 24 301 performances d’animau! de race Montbéliarde issus de 528 pères.Sur l’ensemble des variables analysées, différentes sources (stade de lactation, pointeurs,type de logement) d’hétérogénéité des variances génétiques et résiduelles ont été mises enévidence mais en général L’héritabilité du caractère reste constante d’un milieu à l’autre.
hétéroscédasticité / modèles mixtes / interaction génotype X milieu / algorithmeEM / estimation REML
INTRODUCTION
In many countries breeding values of dairy cattle are estimated using BLUP(best linear unbiased prediction, Henderson, 1973) methodology after estimatingvariance components via REML (restricted maximum likelihood, Patterson andThompson, 1971). An important assumption in most models of genetic evaluation(in particular BLUP) is that variance components associated with random effectsare constant throughout the support of the distribution of the records. However,the existence of heterogeneous variances for milk production and other traits ofeconomic importance in cattle has been firmly established and well-documented(eg, for milk yield in dairy cattle: Everett et al, 1982; Hill et al, 1983; VanVleck, 1987; Meinert et al, 1988; Visscher et al, 1991; Weigel, 1992; Weigeland Gianola, 1993; Weigel et al, 1993 or for growth performance in beef cattle:Garrick et al, 1989). But research on heterogeneous variance associated withconformation traits has been somewhat limited (Mansour et al, 1982; Smotherset al, 1988). Some studies (Smothers et al, 1988, 1993; Sorensen et al, 1985) showedthat sire and residual variances for final type score decreased as herd averageincreased but heritability remained constant. A number of possible causes for theheterogeneity of variance components has been suggested, including a positiverelationship between herd means and variances, differences across geographicalregions, changes over time and various herd management characteristics. Thisheterogeneity of variances can be due to many factors, eg, management factors(feedstuffs, type of housing), genotype x environment interactions, segregatingmajor genes, preferential treatments (Visscher et al, 1991). If this phenomenon isnot properly taken into account, differences in within-subclass variances can resultin biased breeding value predictions, disproportionate numbers of animals selectedfrom environments with different variances and reduced genetic progress (Hill,1984; Gianola, 1986; Vinson, 1987; Winkelman and Schaeffer, 1988; Weigel, 1992;Meuwissen and Van der Werf, 1993). To overcome this problem, one possibility is totake heteroskedasticity into account in the statistical model. In particular, potentialfactors (regions, herds, years, etc) of variance heterogeneity can be identified andthey can be tested as meaningful sources of variation of variances (Foulley et al,1990, 1992; San Cristobal et al, 1993).
The objective of this paper is to present a statistical approach for identifyingsources of variation (genetic and residual) of variances, find an appropriate modelwhich takes into account this heteroskedasticity, and to illustrate such an approachin the analysis of conformation traits in the Montbeliarde cattle breed. A completelyheteroskedastic univariate mixed model allowing for genotype x environment inter-action is used to identify various management factors associated with differences ingenetic and residual variance components. In particular, sire models with different,

simpler assumptions on genetic parameters (constant genetic correlation and/orconstant heritability) in heteroskedastic situations are described and tested usingthe restricted likelihood ratio statistic. The estimation of parameters for each modelis based on the REML method using an EM algorithm. The objective here is not toanalyze all type traits and all factors available in the data file but to illustrate theimplementation of the methodology developed on a large data set. Only four typetraits of the Montbeliarde breed are described and analyzed with three potentialfactors of heterogeneity. Finally, results of heterogeneity of variances detected onthese four type traits are presented and discussed.
MATERIALS AND METHODS
Data
Sires of the Montbeliarde cattle breed are routinely evaluated for several type traitsmeasured on their progeny, using best linear unbiased prediction applied to ananimal model (Interbull, 1996). Most cows are scored during their first lactation.Type traits are measured or scored on a linear scale from one to nine. For eachanimal, age at calving, stage of lactation at classification, year of classification,type of housing and main type of feedstuffs are available. The file analyzedincluded cows scored between September 1988 and August 1994 by techniciansfrom AI cooperatives or from the ’Institut de 1’elevage’. The data analyzed includedperformance records on 24 301 progeny of 528 sires scored for 28 type traits. Eachsire had at least 40 recorded daughters (414 sires) and each classifier had scored atleast 15 cows.
Only four traits were analyzed and these were: one measured variable (heightat sacrum) and three subjectively scored type traits. The latter consisted of twogeneral appraisal scores of parts of the animal, one with high heritability (h2 = 0.47,udder overall score) and one with low heritability (h2 = 0.18, leg overall score) andrear udder height. The means and standard deviations for each trait analyzed arepresented in table I. It is suspected that some of the factors described in table II mayinduce heterogeneous variances. For example, scores given by different classifiers areexpected to have not only different means but also different variances. Therefore,a mixed linear model with the usual assumption of homogeneous variances may beinadequate.
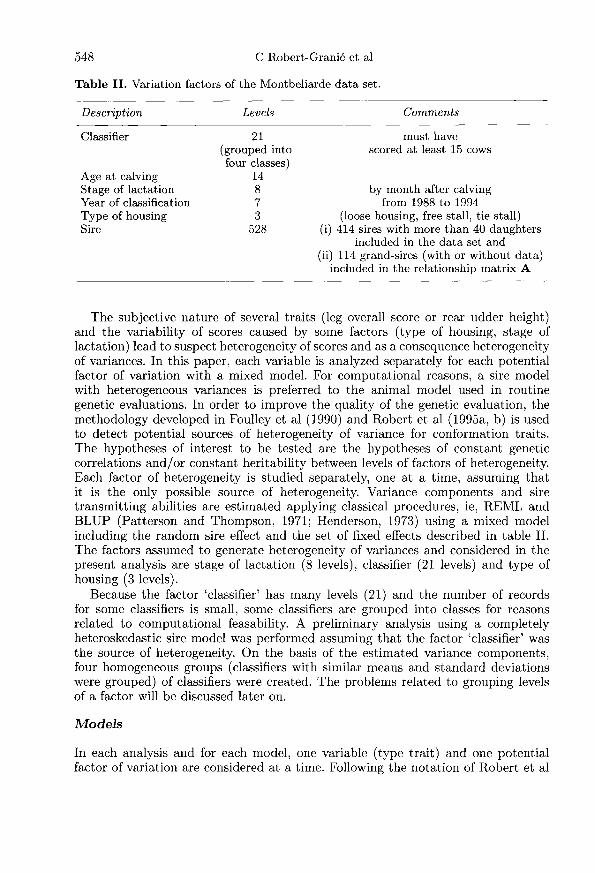
The subjective nature of several traits (leg overall score or rear udder height)and the variability of scores caused by some factors (type of housing, stage oflactation) lead to suspect heterogeneity of scores and as a consequence heterogeneityof variances. In this paper, each variable is analyzed separately for each potentialfactor of variation with a mixed model. For computational reasons, a sire modelwith heterogeneous variances is preferred to the animal model used in routinegenetic evaluations. In order to improve the quality of the genetic evaluation, themethodology developed in Foulley et al (1990) and Robert et al (1995a, b) is usedto detect potential sources of heterogeneity of variance for conformation traits.The hypotheses of interest to be tested are the hypotheses of constant geneticcorrelations and/or constant heritability between levels of factors of heterogeneity.Each factor of heterogeneity is studied separately, one at a time, assuming thatit is the only possible source of heterogeneity. Variance components and sire
transmitting abilities are estimated applying classical procedures, ie, REML andBLUP (Patterson and Thompson, 1971; Henderson, 1973) using a mixed modelincluding the random sire effect and the set of fixed effects described in table II.The factors assumed to generate heterogeneity of variances and considered in thepresent analysis are stage of lactation (8 levels), classifier (21 levels) and type ofhousing (3 levels).
Because the factor ’classifier’ has many levels (21) and the number of recordsfor some classifiers is small, some classifiers are grouped into classes for reasonsrelated to computational feasability. A preliminary analysis using a completelyheteroskedastic sire model was performed assuming that the factor ’classifier’ wasthe source of heterogeneity. On the basis of the estimated variance components,four homogeneous groups (classifiers with similar means and standard deviationswere grouped) of classifiers were created. The problems related to grouping levelsof a factor will be discussed later on.
Models
In each analysis and for each model, one variable (type trait) and one potentialfactor of variation are considered at a time. Following the notation of Robert et al

(1995a), the population is assumed to be stratified into p subpopulations or strata(indexed by i = 1, 2, ... , p) representing each level of the source of variation. Foreach factor suspected to generate heterogeneity of variances, dispersion parametersof each type trait are estimated under the following five models.
Model a
Data are analyzed using a univariate heteroskedastic sire model with genotype xenvironment interaction (Robert et al, 1995b). In matrix notation, this model canbe written as:
where yi is the vector (ni x 1) of observations in subclass i of the factor of
heterogeneity considered (i = 1, ...,p), (3 is the (p x 1) vector of fixed effectswith associated incidence matrix Xi, ui = (s)) and u2 = f hs!2!i} (j = 1, ..., s;s = 528) are two independent random normal components of the model withincidence matrices Zli and Z2i, respectively, and with variance-covariance matricesequal to A and Ip 0 A, respectively. s* is the random effect of sire j such that
s) - NID(0,1) and hs!2!! is the random sire x environment interaction such that
hS(ij) N NID(0, 1). ei is the vector of residuals for stratum i assumed N(0, afl, In, ) .21ila u 22i and u 2 are the corresponding components of variance pertaining tostratum i. The sires are related via the numerator relationship matrix A (of ranks). For instance, different environments i represent different stages of lactation.
Fixed effects (in 13) can be continuous or discrete covariates but without loss ofgenerality it is assumed here that they represent factors (discrete variables). Thefixed effects included in the model are age at calving, stage of lactation, class ofmilk production of the herd (this effect characterizes the production level of theherd) and classifier. All these effects are considered within year of classification.
Model b
Model under the hypothesis of homogeneity of genetic correlations between envi-ronments (for all i and i’, p;;, = !!1’!ul!! = p). This model
Vl-g-.2-, 2 2 2Uii 1 ! + a!2i Vo 1,1 + a!2i’defined in Robert et al (1995a) can be written as:
where the genetic correlation is p = !2 and A is a positive scalar. UnderI + A
this hypothesis, the interaction variance is proportional to the sire variance:
!2 u2c = ,B2a2 .Model c
Model under the hypothesis that all genetic correlations are equal to one
(p = 1). This hypothesis is tantamount to a heteroskedastic model without any

genotype x environment interaction. This completely additive heteroskedasticmodel can be written as:
Model d
Model under the hypothesis that all genetic correlations are equal to one (p = 1)2
and constant heritability (for all i, h2 = ——*!—— = h2) between environments.UUli + Uei!2
This hypothesis for all i is equivalent to considering: 7l = u2 U2li = T!. This model!e,
can be written as: a! &dquo;
Model e
Homoskedastic model (for all i, (j!li = (j!1 et o, 2 =or’). This model can be writtenas: for all i,
&dquo;
REML estimation using an EM algorithm
To compute REML estimates, a generalized expectation-maximization (EM) algo-rithm is applied (Foulley and Quaas, 1994). The principle of this method is describedby Dempster et al (1977). Because the method is presented in detail in Foulley andQuaas (1995) and in Robert et al (1995a, b), only a brief summary is given here.
Denote u* = (ul , L12 ) , 0’2 = {a2 } w2 {a2 } 0’2 = {a2} andy = (U2 &dquo; (r2 6e)!. For instance, y = 2,i 1, 10,2,i 1, 10,2 is the vector of
genetic and residual parameters for the general heteroskedastic model (a). Theapplication of the EM algorithm is based on the definition of a vector of completedata x (where x includes the data vector and the vectors of fixed and randomeffects of the model, except the residual effect) and on the definition of the
corresponding likelihood function L(y; x). The E step consists of computing thefunction Q*(1’I1’ltl) = E[L(1’;x)IY,1’[t]] where Y!t] is the current estimate of Y at
iteration [t] and E[.] is the conditional expectation of L(Y; x) given the data y andY = 1’lt]. The M step consists of selecting the next value 1’[tH] of y by maximizingQ*(1’I1’[t]) with respect to Y. The function to be maximized can be written:
where EJ.’ !.! is a condensed notation for a conditional expectation taken with respectto the distribution of x!y, y = y!t!.
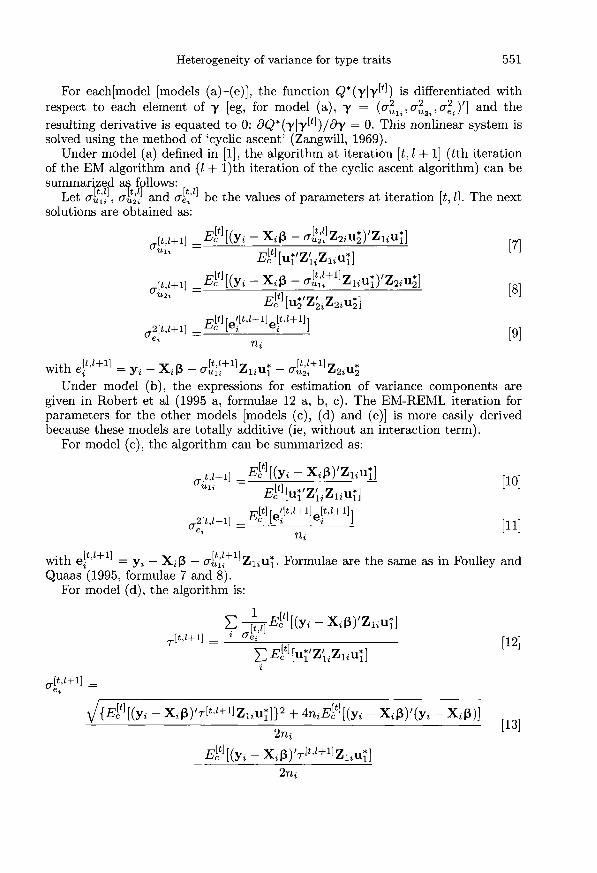
For each[model [models (a)-(e)], the function Q*(yly[tJ) is differentiated withrespect to each element of y [eg, for model (a), y = (or u 21i, or2 u2i’ ore 2i )’] and theresulting derivative is equated to 0: 8Q*(ylyltJ)/åy = 0. This nonlinear system issolved using the method of ’cyclic ascent’ (Zangwill, 1969).
Under model (a) defined in (1!, the algorithm at iteration [t, l + 1] (tth iterationof the EM algorithm and (l + l)th iteration of the cyclic ascent algorithm) can besummarized as follows:
Let O&dquo;!;!}, Qut2l! and It&dquo;] be the values of parameters at iteration [t, !]. The nextsolutions are obtained as:
Under model (b), the expressions for estimation of variance components aregiven in Robert et al (1995 a, formulae 12 a, b, c). The EM-REML iteration forparameters for the other models [models (c), (d) and (e)] is more easily derivedbecause these models are totally additive (ie, without an interaction term).
For model (c), the algorithm can be summarized as:
with e!&dquo;’+&dquo; = Yi - Xd3 - (7U¡i ZliU!, Formulae are the same as in Foulley andQuaas (1995, formulae 7 and 8).
For model (d), the algorithm is:
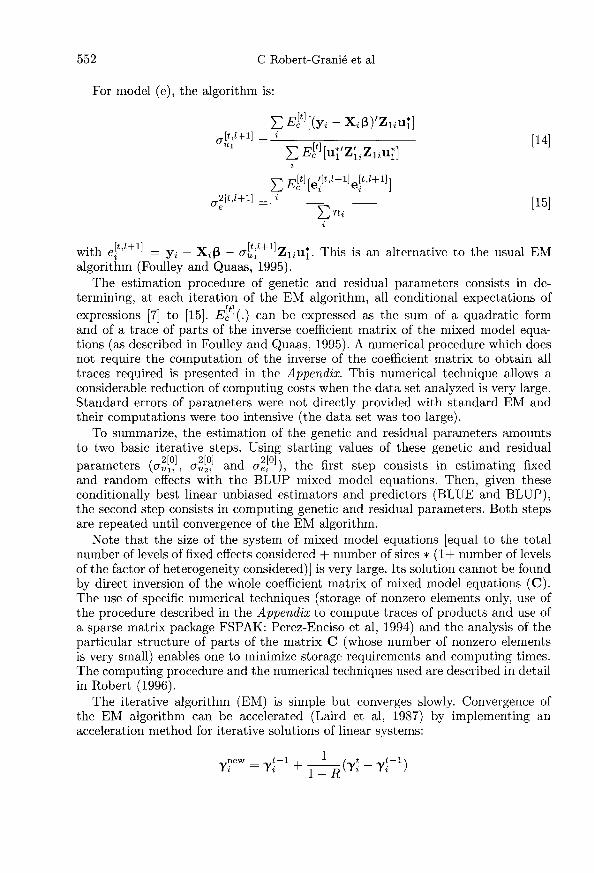
For model (e), the algorithm is:
with e2t,l+1] - y2 _ Xi/3 - (T!;IH] ZliUi. This is an alternative to the usual EM
algorithm (Foulley and Quaas, 1995).The estimation procedure of genetic and residual parameters consists in de-
termining, at each iteration of the EM algorithm, all conditional expectations of
expressions [7] to [15]. E! t’ (.) can be expressed as the sum of a quadratic formand of a trace of parts of the inverse coefficient matrix of the mixed model equa-tions (as described in Foulley and Quaas, 1995). A numerical procedure which doesnot require the computation of the inverse of the coefficient matrix to obtain alltraces required is presented in the Appendix. This numerical technique allows aconsiderable reduction of computing costs when the data set analyzed is very large.Standard errors of parameters were not directly provided with standard EM andtheir computations were too intensive (the data set was too large).
To summarize, the estimation of the genetic and residual parameters amountsto two basic iterative steps. Using starting values of these genetic and residual
parameters ((T;!!], U2[0] and (T!jO]), the first step consists in estimating fixedand random effects with the BLUP mixed model equations. Then, given theseconditionally best linear unbiased estimators and predictors (BLUE and BLUP),the second step consists in computing genetic and residual parameters. Both stepsare repeated until convergence of the EM algorithm.
Note that the size of the system of mixed model equations [equal to the totalnumber of levels of fixed effects considered + number of sires * (1+ number of levelsof the factor of heterogeneity considered)] is very large. Its solution cannot be foundby direct inversion of the whole coefficient matrix of mixed model equations (C).The use of specific numerical techniques (storage of nonzero elements only, use ofthe procedure described in the Appendix to compute traces of products and use ofa sparse matrix package FSPAK: Perez-Enciso et al, 1994) and the analysis of theparticular structure of parts of the matrix C (whose number of nonzero elementsis very small) enables one to minimize storage requirements and computing times.The computing procedure and the numerical techniques used are described in detailin Robert (1996).
The iterative algorithm (EM) is simple but converges slowly. Convergence ofthe EM algorithm can be accelerated (Laird et al, 1987) by implementing anacceleration method for iterative solutions of linear systems:

where 1’! is the ith estimable parameter of y (sire, interaction or residual variance)at iteration t, 1’iew is the new parameter at iteration t after acceleration and R isthe acceleration coefficient. This acceleration step should be applied only when theevolution of solutions from one iteration to the next becomes stable. The optimalfrequency of these acceleration steps is not given by Laird et al (1987). In ourapplication, acceleration was performed when 0.80 < R < 0.94 with:
where p is the number of estimable parameters (Robert, 1996).Programs were written in Fortran 77 and run on an IBM Rise 6000/590. The
convergence criterion used for the EM-REML procedure was the norm of the vectorof changes in variance-covariance components between two successive iterations.Let y2t! be the vector representing the set of estimable components of variance atiteration !t!, the stopping rule was:
Hypothesis testing
An adequate modelling of heteroskedasticity in variance components requires aprocedure for hypothesis testing. As proposed by Foulley et al (1990, 1992), Shaw(1991) and Visscher (1992), the theory of the likelihood ratio test (LRT) canbe applied. Let L(y; y) be the log-restricted likelihood, Ho: y E Fo be the null
hypothesis and Hl: y E r - lo its alternative, where y is the vector of geneticand residual parameters, r is the complete parameter space and ro is a subset ofit pertaining to Ho.
Let Mo and MI be the models corresponding to the hypotheses Ho and Ho U Hi,respectively. The likelihood ratio statistic is:
Under Ho, ( is asymptotically distributed according to a xr with r degreesof freedom equal to the difference between the number of parameters estimatedunder models Ml and Mo, respectively. In the normal case, explicit calculation of- 2MaxL(y; y) is analytically feasible (Searle, 1979):
where Const is a constant and ((3,u12,u2i) are mixed model solutions for ((3, u!, u!).C is the coefficient matrix of the mixed model equations.

The main burden in the computation of -2L is to determine the value of InIC1. ] .
But using results developed in Quaas (1992) and in the Appendix, this computationcan be simplified
where the liis are the diagonal elements of the Cholesky factor L of matrix C.The hypothesis of genetic correlations between environments equal to one is a
special case of the hypothesis of homogeneity of genetic correlations. This hypothesis(for all i and i’, pz;, = 1) is especially interesting because it is equivalent to theassumption of no interaction term, ie, A = 0. Some problems arise here becausethe null hypothesis sets the true value of one parameter (A) on the boundary ofits parameter space (A = 0). The basic theory in this field was developed by Selfand Liang (1987) and applications to variance components testing in mixed modelshave been discussed in Stram and Lee (1994). Contrasting models (b) and (c), ie,testing Ho (!!1. ! 0 for all i and A = 0) against Hl (!!1. ! 0 for all I and A # 0)corresponds to a situation which can be handled by referring to case 3 in Stramand Lee (1994).
In this case, the asymptotic distribution of the likelihood ratio statistic underhypothesis Ho does not have a chi-squared distribution anymore but is a mixture
of chi-squared distributions [!X6 + 2xi! with equal weight between the measureof Dirac in 0 (Mass one at zero, Kaufmann, 1965) and a x2 with one degree offreedom (Gourieroux and Montfort, Chap XXI, 1989). This means that the commonprocedure based on rejecting Ho when the variation in -2L exceeds the value of a
x2 distribution with one degree of freedom and such that p(X2 1 > s) = a (a beingthe significant level) is too conservative; or in other words, the threshold s is toohigh. What is usually done in practice is to reject Ho for a value of the chi-squaresuch that p(X2 > s) = 2a (and no longer a) when A > 0.
RESULTS
Preliminary analyses
Type trait records were categorical either because they represent subjective scoresdrawn from a limited list of possible values (one to nine) or because they resultedfrom a measure with limited precision. In this paper, the analysis of such traits wasperformed using a methodology designed for normally distributed random variables.Therefore, before any analysis of heterogeneity of variances, it seemed essentialto study the distributions of the variables considered. In a first analysis, a fixedmodel with homogeneous residual variances was used to analyze the distributionsof the residuals. On all variables analyzed, skewness and kurtosis coefficients ofresiduals were not close to theoretical coefficients for a normal distribution. Someusual tests [Kolmogorov test, Geary’s and Pearson’s tests (Morice, 1972)] wereused to analyze the normality of the distributions and most of them rejected thehypothesis of normality. To make the distribution of the residuals of type traitscores closer to normal, original scores were transformed using a normal score

transformation (Bartlett, 1947). Statistical results (means, standard deviations,skewness and kurtosis coefficients) on residuals are presented in table III. Althoughlimited, some improvement toward normality was observed for the skewness andkurtosis coefficients. Transformed variables were used in the following analysis.
Sources of variance heterogeneity
For some combinations of factors and variables (for instance, type of housingand udder overall score), it would be unexpected that heterogeneity of variancesexists and is detected. If this were the case, biological interpretation would bepotentially difficult. However, all variables presented in table I were analyzedseparately in combination with each potential factor of heterogeneity: stage oflactation, classifier and type of housing. For each variable and each factor ofheterogeneity considered, components of variance under each model proposed[models (a) to (e)] were estimated. Tables IV, VI and VIII present results ofrestricted likelihood ratio test for each variable analyzed and results are presentedby factor of heterogeneity considered. Tables V, VII and IX present estimates ofgenetic and residual parameters of variables obtained under the simplest acceptablemodel, ie, the final model accepted after all testing procedures.
Stage of lactation
Results of stage of lactation are presented in tables IV and V. Except for leg overallscore, the analysis of stage of lactation has concluded that heterogeneity of variancesexisted for all variables analyzed but with constant genetic correlation betweenlevels of factor of variation for rear udder height (model b), with genetic correlationsequal to one for height at sacrum (model c) and with constant heritability also(model d) for udder overall score. For leg overall score, the homoskedastic model
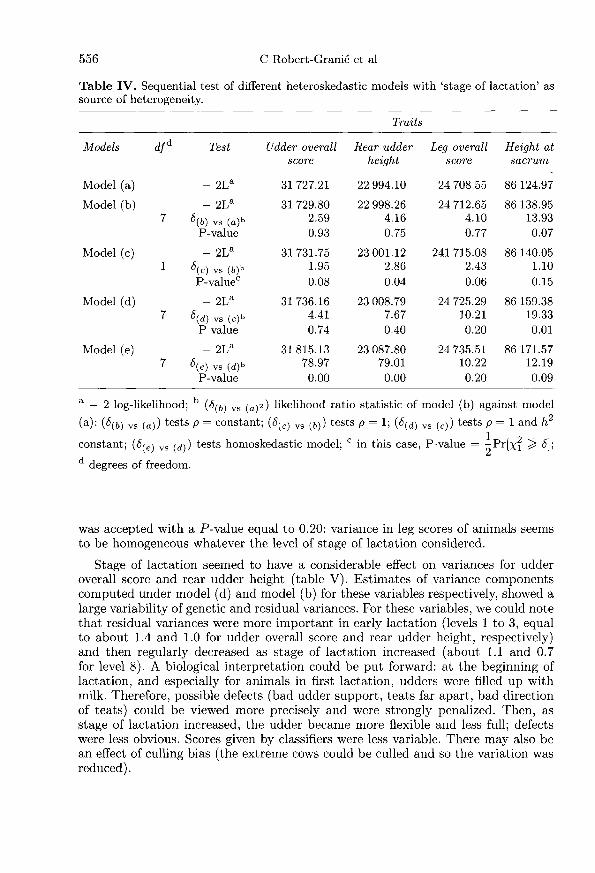
was accepted with a P-value equal to 0.20: variance in leg scores of animals seemsto be homogeneous whatever the level of stage of lactation considered.
Stage of lactation seemed to have a considerable effect on variances for udderoverall score and rear udder height (table V). Estimates of variance componentscomputed under model (d) and model (b) for these variables respectively, showed alarge variability of genetic and residual variances. For these variables, we could notethat residual variances were more important in early lactation (levels 1 to 3, equalto about 1.4 and 1.0 for udder overall score and rear udder height, respectively)and then regularly decreased as stage of lactation increased (about 1.1 and 0.7for level 8). A biological interpretation could be put forward: at the beginning oflactation, and especially for animals in first lactation, udders were filled up withmilk. Therefore, possible defects (bad udder support, teats far apart, bad directionof teats) could be viewed more precisely and were strongly penalized. Then, asstage of lactation increased, the udder became more flexible and less full; defectswere less obvious. Scores given by classifiers were less variable. There may also bean effect of culling bias (the extreme cows could be culled and so the variation wasreduced).

For udder overall score describing udder in general, the genetic variances variedin the same way as the residual variances since heritability was found to be constant(equal to 0.47). The genetic correlation between levels of stage of lactation was foundto be equal to one. But for rear udder height, the genetic correlation was equal to0.97 and the hypothesis of constant heritability was rejected. An important changebetween estimates of parameters under models (a, b, c, d) and estimates underthe homoskedastic model was observed, which explained why this last model wasclearly rejected.
For height at sacrum, heteroskedasticity was surprising. This trait was objec-tively measured by classifiers. Therefore it was expected that stage of lactation hadno impact on variances. Genetic and residual estimates of variance did not vary ina clear manner and the interpretation was less obvious. Note that the hypothesisof constant heritability was rejected with a high P-value (equal to 0.01) but thegenetic correlation was equal to one. Furthermore, the value of the likelihood ratiostatistic of model (e) against model (d) was clearly smaller than for udder overallscore for instance (6 = 12.19 against 78.97, respectively).
Classifiers
Results of this factor are presented in tables VI and VII. The analysis of the factor’classifier’ leads to clear conclusions. The model finally accepted was the modelassuming genetic correlations equal to one and constant heritability (model d) forudder overall score and height at sacrum. For leg overall score and rear udder height,only the hypothesis of constant genetic correlations was accepted [model (b)]. Forall variables analyzed, model (e) was clearly rejected with values of the likelihoodratio statistic always larger than 50.When the trait definition was very subjective, as for rear udder height or leg
overall score, the attitude of classifiers varied a lot. The same trait did not seemto be scored in a similar way by all classifiers. The analysis of rear udder heightclearly showed this situation. Genetic variances varied from 0.03 for classifiers ofgroup 2 up to 0.19 for others (group 3, table VII). The low genetic correlationbetween classifiers may result from imprecise estimates of variances of a grouppoorly represented. The scoring of groups of classifiers 2 and 3 seemed to be verydifferent from the scoring of the other groups. In the same way, the heritability ofrear udder height was not the same for all classifiers (from 0.18 to 0.72) and seemedto indicate a problem for groups 2 and 3 (these two groups had genetic variancesand heritabilities very different from the other groups). This analysis revealed areal problem of consistency regarding the definition of traits among classifiers. Thisproblem was already suspected by specialists.
The analysis of height at sacrum seemed to confirm inconsistencies betweengroups of classifiers. The residual variances varied from 9.5 for group 4 to 14.4 for
group 3. In the same way, genetic and residual variances for all traits were smallestfor group 4. An explanation of this heteroskedasticity could be that classifiers couldhave taken a variable number of measures or spent a variable amount of time inmeasuring this height and generally measures were not exact.
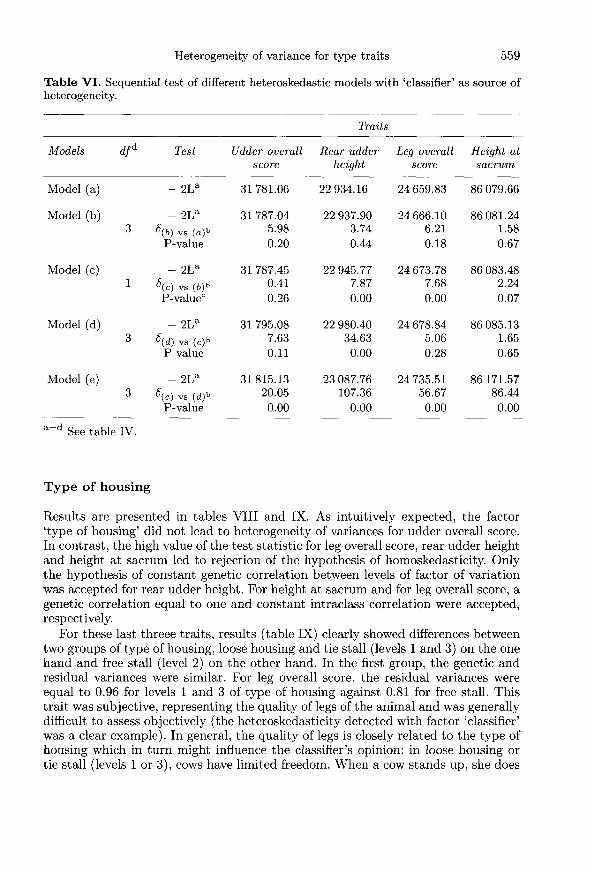
Type of housing
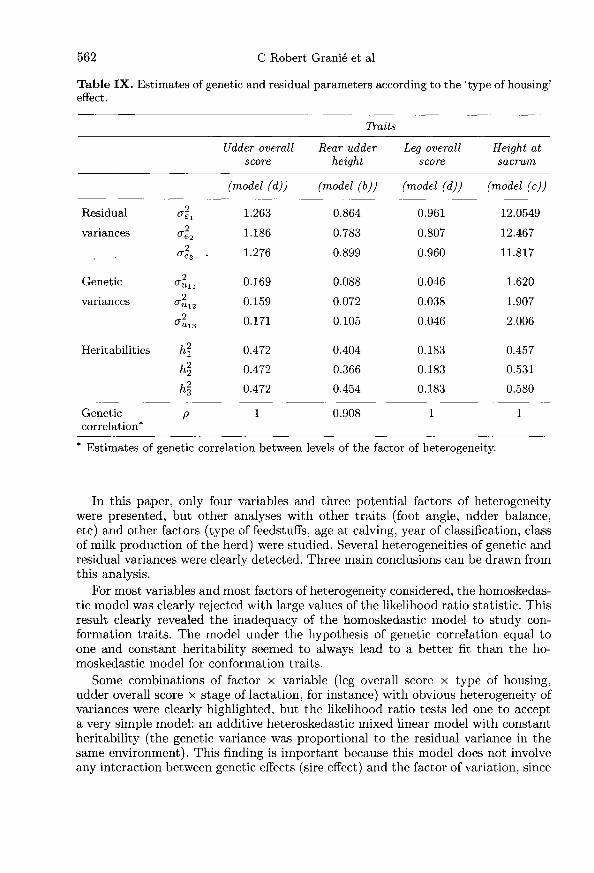
Results are presented in tables VIII and IX. As intuitively expected, the factor’type of housing’ did not lead to heterogeneity of variances for udder overall score.In contrast, the high value of the test statistic for leg overall score, rear udder heightand height at sacrum led to rejection of the hypothesis of homoskedasticity. Onlythe hypothesis of constant genetic correlation between levels of factor of variationwas accepted for rear udder height. For height at sacrum and for leg overall score, agenetic correlation equal to one and constant intraclass correlation were accepted,respectively.
For these last threee traits, results (table IX) clearly showed differences betweentwo groups of type of housing, loose housing and tie stall (levels 1 and 3) on the onehand and free stall (level 2) on the other hand. In the first group, the genetic andresidual variances were similar. For leg overall score, the residual variances wereequal to 0.96 for levels 1 and 3 of type of housing against 0.81 for free stall. Thistrait was subjective, representing the quality of legs of the animal and was generallydifficult to assess objectively (the heteroskedasticity detected with factor ’classifier’was a clear example). In general, the quality of legs is closely related to the type ofhousing which in turn might influence the classifier’s opinion: in loose housing ortie stall (levels 1 or 3), cows have limited freedom. When a cow stands up, she does

not do it in a natural way. So by chance, she may be penalized or have receiveda better score depending on the way she is standing. As a consequence, varianceswere larger in this type of housing. But we cannot dismiss a more durable influenceof the type of housing on the feet of the animal. For the rear udder height, thisheterogeneity could be explained by the fact that a cow which did not stand upstraight, gave the impression that her udder was unbalanced even if it was not thecase.
Computational aspects
Convergence for calculating the EM-REML estimates was obtained after 35 to50 rounds of iteration for the most complex models (model with interaction) andonly 25 to 35 rounds of iteration were needed to obtain the convergence with mod-els without interaction terms. However, total CPU time to estimate all parame-ters (estimation of genetic and residual parameters, evaluation of genetic values,computation of the log-restricted maximum likelihood) was large, particularly forheteroskedastic models with interaction. For instance, with model (a), 15 h of CPU

time were needed to estimate genetic and residual parameters within stage of lacta-tion (eight levels) as a factor of heterogeneity. These procedures were computation-ally intensive and may not be easily implemented in national genetic evaluationsusing an animal model.
DISCUSSION AND CONCLUSION
Most studies on type traits consider that genetic and residual variances are
homogeneous. This assumption has not been questioned. However, the results of thisfirst analysis show that heterogeneity of genetic and residual variances exists on suchtraits. Furthermore, the few studies taking into account heteroskedasticity in mixedlinear models assume constant heritability between environments (Koots et al, 1994;Visscher et al, 1991, 1992; Weigel et al, 1994). The original aspect of this paper wasto present a way to test these hypotheses (homogeneity of variance components,constant heritability, constant genetic correlation) and to detect sources of variationon type traits. In that respect, our main concern focused on ways to find models asparsimonious as possible to reduce the number of parameters needed to account forheteroskedasticity. This paper was a large application of the approach developedby Foulley et al (1994) and Robert et al (1995 a, b). Using sequential testingprocedures, a fitting model can be found for each variable and each factor ofheterogeneity considered. However, the overall type-I error rate resulting from theapplication of such a procedure will be much higher than the significant level chosenat each step.
In this paper, only four variables and three potential factors of heterogeneitywere presented, but other analyses with other traits (foot angle, udder balance,etc) and other factors (type of feedstuffs, age at calving, year of classification, classof milk production of the herd) were studied. Several heterogeneities of genetic andresidual variances were clearly detected. Three main conclusions can be drawn fromthis analysis.
For most variables and most factors of heterogeneity considered, the homoskedas-tic model was clearly rejected with large values of the likelihood ratio statistic. Thisresult clearly revealed the inadequacy of the homoskedastic model to study con-formation traits. The model under the hypothesis of genetic correlation equal toone and constant heritability seemed to always lead to a better fit than the ho-moskedastic model for conformation traits.
Some combinations of factor x variable (leg overall score x type of housing,udder overall score x stage of lactation, for instance) with obvious heterogeneity ofvariances were clearly highlighted, but the likelihood ratio tests led one to accepta very simple model: an additive heteroskedastic mixed linear model with constantheritability (the genetic variance was proportional to the residual variance in thesame environment). This finding is important because this model does not involveany interaction between genetic effects (sire effect) and the factor of variation, since

the hypothesis of genetic correlation equal to one is accepted in most of the casesconsidered. Without an interaction term, heteroskedasticity could be more easilyaccounted for in the current computing strategy used for routine genetic evaluations.A pronounced effect of the factor ’classifier’ was found with genetic and residual
heterogeneity of variances and heterogeneity of heritability for variables subjectivelyscored (rear udder height, leg overall score) but also for variables measured (heightat sacrum). A similar conclusion was drawn by San Cristobal (1992) and SanCristobal et al (1993) with respect to the subjective appreciation of muscularitydevelopment of beef cattle in the Maine-Anjou breed. The results obtained byMcGilliard and Lush (1956) showed that, on the same day, the scoring of differentclassifiers agreed more than did scoring from the same judge on different days, thecorrelation between classifiers on the same day being up to 0.74. They also found asignificant interaction between classifiers and years for the same cows, which maymean that classifiers do not account for age in quite the same manner, or for thephysical aspect of a particular cow at different times. In our analysis, heritabilitybetween classifiers varied considerably from 0.18 to 0.72 for instance, but standarderrors were unknown. One of the main problems with type classification is thehuman inaccuracy involved in all subjective assessments. The main part of variationdue to classifiers may be due to different attitudes towards different cows, herds or
sires, or simply to human inconsistency.Although computational effort is much larger to estimate genetic parameters
with genotype x environment interactions in heteroskedastic mixed models, themodel proposed here ui! _ !!l!s! + O&dquo;U2i(hs)ij offers great flexibility to defineselection criteria. In particular, selection for a general ability of bulls can be basedon predictions of the s! s.
For the factor ’classifier’, a precise redefinition of some elementary traits shouldbe considered because variances were generally more variable on elementary traits(eg, rear udder height) than for the other subjective traits (for instance, udderoverall score or leg overall score). The approach used here can be a way to helpclassifiers to homogenize their scoring techniques when the variability detectedbetween classifiers is very large. A posteriori, this analysis may allow an appreciationof the consistency of the classifiers’ work and the quality of data collection. Withrespect to the factor ’classifiers’, the grouping in four classes was only made forcomputational reasons. The likelihood ratio statistic can be used to test the datagrouping, but the robustness of the grouping approach used here is questionable.
The analysis of ’height at sacrum’ raises some problems. In this analysis, thistrait was chosen as a test variable because it is measured and heterogeneity ofvariances with any factor of variation was not suspected. From our results, thedata set must be reanalyzed to check whether these detected heterogeneities ofvariance are linked to another underlying factor. Heterogeneity may also be due toan inadequate model for means.
The approach presented here relies heavily on the assumption of normality ofthe data. This was obviously not the case here for the original data since type traitswere recorded using scores varying from one to nine. A normal score transformationwas used to improve the shape of those distributions. Although limited, the effect ofthis transformation to reduce skewness was real, which is crucial for the normalityassumption (Daumas, 1982). Nevertheless, there are still pending problems about
the way to handle such traits. Some of them might be also treated as ordinal discretedata via a threshold liability model (Foulley and Gianola, 1996).
The procedure described here allows one to detect and to precisely determinedifferent sources of heterogeneity of type traits. Once factors of variation have beendetected separately, a possible extension could be to use a structural approachcombining these factors with a limited number of parameters. Such a method isused on logarithms of variances as it has been used for decades on means (Foulleyet al, 1990, 1992; Gianola et al, 1992; San Cristobal et al, 1993). The procedure isespecially flexible owing to the possibility to incorporate prior information on somefactors of heteroskedasticity when few data are available per level, such as herds orherd x years.-In the case of genetic correlations not equal to one (when genotype xenvironment interaction exists, as in models a or b), the modelling seems more trickyand computing costs are higher than in heteroskedastic models without interaction.This problem does not have an easy solution and requires future research.
The inferential procedure chosen here is based on maximum likelihood theory(under regularity conditions). An alternative approach would have been to considera full bayesian analysis using, for example, MCMC methods (Markov chain MonteCarlo). For small sample inference, a solution may be provided by a posteriordistribution estimated by Monte Carlo methods. However, this procedure was notused here since the data set was too large (24 301 progeny of 528 sires).
Although the methodology for heteroskedastic mixed models is appealing, meth-ods of estimation of variance components must be adapted to be used in nationalsystems of genetic evaluations. Concrete and simple proposals to take into accountheterogeneity of variances in routine genetic evaluations should be made. Four pos-sible approaches can be considered:
- an approach where only one factor of heterogeneity is defined. This factor
simply represents a combination of all factors of variation found to be significantwith the present approach but number of levels of the resultant factor can be verylarge;
- an approach where the most important factor of variation is considered in theheteroskedastic model and the other factors of variance heterogeneity are ignored;
- an approach proposed by Weigel (1992) and Weigel et al (1993) where a smallset of the data is analyzed to detect heterogeneity of variances and then correctionfactors for the variances are developed;
- a structural approach as defined in Foulley et al (1990, 1992) and San Cristobalet al (1993), especially when dealing with a constant heritability coefficient (Foulley,1997), but attention must be paid to the feasibility of this method with large datasets.
ACKNOWLEDGMENT
The authors are grateful to H Larroque (Inra, SGQA Jouy-en-Josas) for providingthe data set and to B Goffinet (Inra, Biom6trie, Toulouse) for providing them withthe reference of the paper by Self and Liang.
REFERENCES
Bartlett MS (1947) The use of transformations. Biometrics 3, 39-52Daumas F (1982) M6thodes de normalisation des donn6es. Rev Stat Appl 30, 23-38Dempster AP, Laird NM, Rubin DB (1977) Maximum likelihood from incomplete data
via the EM algorithm. J R Statist Soc B 39, 1-38 .
Everett RW, Keown JF, Taylor JF (1982) The problem of heterogeneous within herderror variances when identifying elite cows. J Dairy Sci (Abstr) Suppl 1, 100
Foulley JL (1997) ECM approaches to heteroskedastic mixed models with constantvariances ratios. Genet Sel Evol 29, 297-318
Foulley JL, Gianola D, San Cristobal M, Im S (1990) A method for assessing extent andsources of heterogeneity of residual variances in mixed linear models. J Dairy Sci 73,1612-1624
Foulley JL, San Cristobal M, Gianola D, Im S (1992) Marginal likelihood and Bayesianapproaches to the analysis of heterogeneous residual variances in mixed linear Gaussianmodels. Comput Stat Data Anal 13, 291-305
Foulley JL, Quaas RL (1994) Statistical analysis of heterogeneous variances in Gaussianlinear mixed models. Proc 5th World Congress Genet Appl Livest Prod, 7-12 August,University of Guelph, Ontario, Canada, 18, 341-348
Foulley JL, H6bert D, Quaas RL (1994) Inference on homogeneity of between familycomponents of variance and covariance among environments in balanced cross-classifieddesigns. Genet Sel Evol 26, 117-136
Foulley JL, Quaas RL (1995) Heterogeneous variances in Gaussian linear mixed models.Genet Sel Evol 27, 211-228
Foulley JL, Gianola D (1996) Statistical analysis of ordered categorical data via a struc-tural heteroskedastic threshold model. Genet Sel Evol 28, 249-273
Garrick DJ, Pollack EJ, Quaas RL, Van Vleck LD (1989) Variance heterogeneity in directand maternal weight by sex and percent purebred for Simmental-sired calves. J AnimSci 67, 2513-2528
Gianola D (1986) On selection criteria and estimation of parameters when the variance isheterogeneous. Theor AppL Genet 72, 671-677
Gianola D, Foulley JL, Fernando RL, Henderson CR, Weigel KA (1992) Estimation ofheterogeneous variances using empirical Bayes methods: theoretical consideration. JDairy Sci 75, 2805-2823
Gourieroux C, Montfort A (1989) Statistique et modèles 6conom6triques. Collection’Economic et statistiques avanc6es’ Vol 2, ENSAE, Economica, Paris
Graybill FA (1983) Matrices with Applications in Statistics. Wadsworth, BelmontHenderson CR (1973) Sire evaluation and genetic trends. In: Proceedings of Animal
Breeding and Genetics Symposium in Honor of Dr JL Lush. Amer Soc Anim Sci-AmerDairy Sci Assoc, Champaign, 10-41
Hill WG (1984) On selection among groups with heterogeneous variance. Anim Prod 39,473-477
Hill WG, Edwards MR, Ahmed MKA, Thompson R (1983) Heritability of milk yield andcomposition at different levels of variability of production. Anim Prod 36, 59-68
Interbull (1996) Sire evaluation procedures for non-dairy production and growth and beefproduction traits practised in various countries. Bull 13, Uppsala
Kaufmann A (1965) Cours moderne de calcul des probabilites. Albin Michel, ParisKoots KR, Wade KM, Kennedy BW, Dekkers JCM, Smith GC, Burnside EB (1994)
Method and effect of adjustment for heterogeneous variance of Holstein conformationtraits. J Dairy Sci 77, 294-302
Laird NM, Lange N, Stram D (1987) Maximum likelihood computation with repeatedmeasures: application to the EM algorithm. J Am Stat Assoc 82, 97-105
McGilliard LD, Lush JL (1956) Changes in type classifications of dairy cattle. J DairySci 39, 1015-1026
Mansour H, Jensen EL, Johnson LP (1982) Change in phenotypic performance of finalscore with selection and age of cows. J Dairy Sci (Abstr) Suppl 1, 100
Meinert TR, Pearson RE, Vinson WE, Cassell BG (1988) Prediction of daughter’s per-formance from dam’s cow index adjusted for within-herd variance. J Dairy Sci 71,2220-2231
Meuwissen THE, Van der Werf JHJ (1993) Impact of heterogeneous within herd varianceson dairy cattle breeding schemes. Livestock Prod Sci 33, 31-41
Morice E (1972) Tests de normalite d’une distribution observ6e. Rev Stat Appl 20, 5-25Patterson HD, Thompson R (1971) Recovery of interblock information when block sizes
are unequal. Biometrika 58, 545-554Perez-Enciso M, Misztal I, Elzo MA (1994) FSPAK: An interface for public domain
sparse matrix subroutines. In: 5th World Congress on Genetics Applied to LivestockProduction, August 7-12, University of Guelph, Ontario, 22, 87-88
Quaas RL (1992) REML Notebook. Mimeo, Dept Anim Sci, Cornell Univ, Ithaca, NYRobert C, Foulley JL, Ducrocq V (1995a) Genetic variation of traits measured in sev-
eral environments. I. Estimation and testing of homogeneous genetic and intra-classcorrelations between environments. Genet Sel Evol 27, 111-123
Robert C, Foulley JL, Ducrocq V (1995b) Genetic variation of traits measured in severalenvironments. II. Inference on between-environment homogeneity of intra-class corre-lations. Genet Sel Evol 27, 125-134
Robert C (1996) Etude de quelques probl6mes lies a la mise en oeuvre du REML eng6n6tique quantitative. These de doctorat. Universite Paul Sabatier, Toulouse
San Cristobal M (1992) M6thodes d’inf6rence statistique en mod6lisation de la variance.Application en g6n6tique quantitative. These de doctorat. Universite Paul Sabatier,Toulouse
San Cristobal M, Foulley JL, Manfredi E (1993) Inference about multiplicative het-eroskedastic components of variance in a mixed linear Gaussian model with an ap-plication to beef cattle breeding. Genet Sel Evol 25, 3-30
Searle SR (1979) Notes on variance component estimation. A detailed account of maxi-mum likelihood and kindred methodology. Paper BU-673-M, Cornell University, Ithaca
Self SG, Liang KY (1987) Asymptotic properties of maximum likelihood estimators andlikelihood ratio tests under nonstandard conditions. J Am Stat Assoc 82, 605-610
Shaw RG (1991) The comparison of quantitative genetic parameters between populations.Evolution 45, 143-151
Smothers CD, Pearson RE, Vinson WE (1988) Relationships among herd parameters ofconformation traits in Holsteins. J Dairy Sci (Abstr) Suppl 1, 272
Smothers CD, Pearson RE, Hoeschele I, Funk DA (1993) Herd final score and its rela-tionships to genetic and environmental parameters of conformation traits of UnitedStates Holsteins. J Dairy Sci 76, 1671-1677
Sorensen DA, Kennedy BW (1985) Relationships between herd type and genetic andenvironmental variances in Holsteins. J Dairy Sci 68, 1770-1777
Stram DO, Lee JW (1994) Variance components testing in the longitudinal mixed effectsmodel. Biometrics 50, 1171-1177
Van Vleck LD (1987) Selection when traits have different genetic and phenotypic envi-ronments. J Dairy Sci 70, 337-344
Vinson WE (1987) Potential bias in genetic evaluations from differences in variation withinherds. J Dairy Sci 70, 2450-2455
Visscher PM (1992) On the power of likelihood ratio test for detecting heterogeneity ofintra-class correlations and variances in balanced half-sib designs. J Dairy Sci 73, 1320-1330
Visscher PM, Thompson R, Hill WG (1991) Estimation of genetic and environmentalvariances for fat yield in individual herds and an investigation into heterogeneity ofvariance between herds. Livestock Prod Sci 28, 273-290
Visscher PM, Hill WG (1992) Heterogeneity of variance and dairy cattle breeding. AnimProd 55, 321-329
Weigel KA (1992) Estimation of heterogeneous components of variance in mixed linearmodels with an application to dairy cattle breeding. PhD Thesis, University of Wis-consin, Madison
Weigel KA, Gianola D (1993) A computationally simple bayesian method for estimationof heterogeneous within-herd phenotypic variances J Dairy Sci 76, 1455-1465
Weigel KA, Gianola D, Yandell BS, Keown JL (1993) Identification of factors causingheterogeneous within-herd variance components using a structural model for variancesJ Dairy Sci 76, 1466-1478
Weigel KA, Lawlor TJ (1994) Adjustment for heterogeneous variance in genetic evalua-tions for conformation of United States Holsteins. J Dairy Sci 77, 1691-1701
Winkelman A, Schaeffer LR (1988) Effect of heterogeneity of variance in dairy sireevaluation. J Dairy Sci 71, 3033
Zangwill (1969) Non-Lin,ear Programming: a Unified Approach. Prentice-Hall, EnglewoodCliffs, NJ
APPENDIX
Numerical techniques used for the computation of heteroskedastic
genetic parameters
Notations
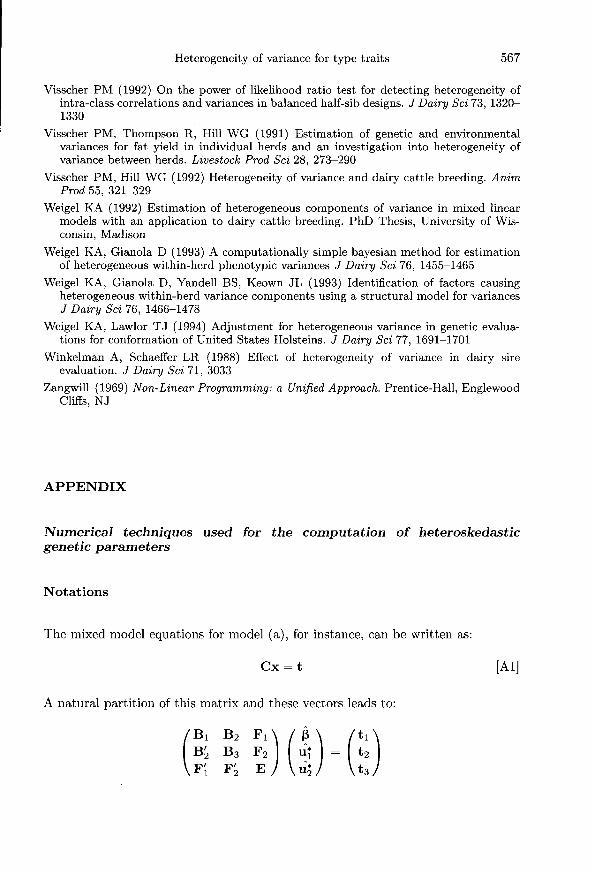
The mixed model equations for model (a), for instance, can be written as:
A natural partition of this matrix and these vectors leads to:

A-1 is the inverse of the numerator relationship matrix between sires and 0 is thedirect matrix product.
Because the number of levels of fixed and random effects in mixed linear models is
very large and the matrix C is sparse, the storage of all elements of matrix C shouldbe avoided. Advantage should be taken of the special structure of C. In fact, if thematrix E is partioned according to level of factor of heterogeneity, it can be writtenas a block diagonal matrix where each block is of the form (Z!i Z2;a!2i 0&dquo;;.2 +A-1).The p blocks differ only by their diagonal elements and each block has few nonzeroelements (the matrix A-1 has less than 2% of nonzero elements). The matrix Falso has few nonzero elements.
Consequently, parts of matrix C are stored as follows:- all elements of the rather dense matrix B are stored;- for the matrix E, only the nonzero elements of the inverse of the relationship
matrix A-1 and all diagonal elements of matrices ZZZZ2i!!Zi!e!2 are stored;- for the matrix F, only the nonzero elements are stored.
For this storage and matrix manipulations, the matrix package FSPAK (Perez-Enciso et al, 1994) is used.
Computation of genetic parameters
We denote C-’ the inverse of the coefficient matrix of the mixed model equations:
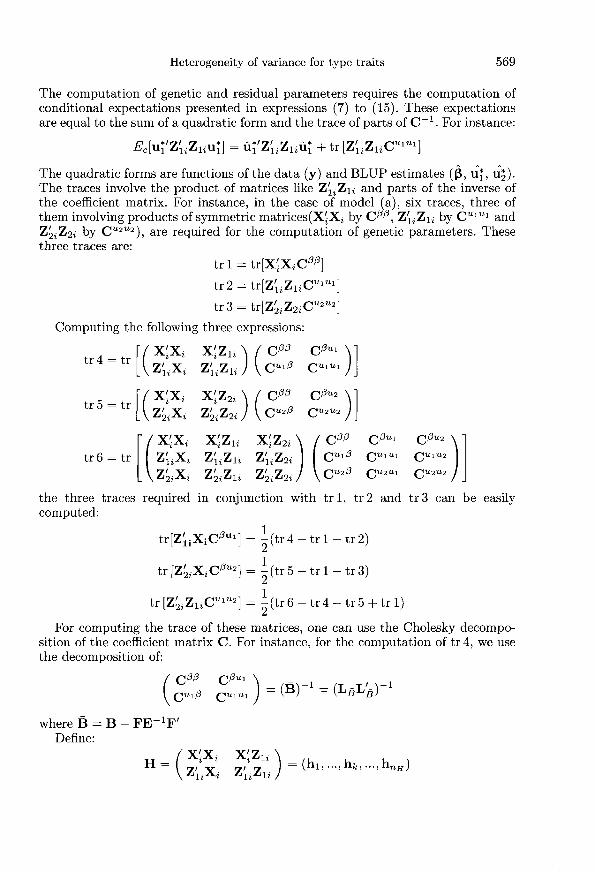
The computation of genetic and residual parameters requires the computation ofconditional expectations presented in expressions (7) to (15). These expectationsare equal to the sum of a quadratic form and the trace of parts of C-1. For instance:
The quadratic forms are functions of the data (y) and BLUP estimates ((3, ui 1 l!2The traces involve the product of matrices like Z!iZli and parts of the inverse ofthe coefficient matrix. For instance, in the case of model (a), six traces, three ofthem involving products of symmetric matrices(X’Xj by Caa, Z!iZli by C!1!1 andZ2iZ2i by CU2U2), are required for the computation of genetic parameters. Thesethree traces are:
Computing the following three expressions:
the three traces required in conjunction with tr 1, tr 2 and tr 3 can be easilycomputed:
For computing the trace of these matrices, one can use the Cholesky decompo-sition of the coefficient matrix C. For instance, for the computation of tr 4, we usethe decomposition of:

where hk is the kth column vector of H. The element (l, k) of each of these matrices(XiXi, Xizli, ZiiZl2) is equal to the number of observations simultaneouslyinfluenced by the effects corresponding to equations k and l. The trace tr 4 canbe computed using these expressions:
where U = LBTLB1H and ukk is the kth diagonal element of matrix U.So, for k = 1 to nH where nH is the dimension of matrix H, the elements ukk
are obtained after solvingLB Vk = h! for vk,
and
LB uk = v! for uk, the kth column vector of matrix U.
Only the kth element of vector uk contributes to the computation of the trace.The computation of elements of vector Uk can be stopped as soon as the kth elementof vector u! is found. The number of triangular systems to solve is equal to at mosttwice the dimension of matrix H.
The procedure used for the computation of the other traces is identical. We usethe expression for the inverse of partitioned matrices to determine the inverse ofparts of the coefficient matrix (Graybill, 1983). In particular:
Related Documents