Abstract. According to the current paradigm, replication foci are discrete sites in the interphase nucleus where as- semblies of DNA replication enzymes simultaneously elongate the replication forks of 10–100 adjacent rep- licons (each ~100 kbp). Here we review new results and provide alternative interpretations for old results to show that the current paradigm is in need of further develop- ment. In particular, many replicons are larger than previ- ously thought – so large that their complete replication takes much longer (several hours) than the measured av- erage time to complete replication at individual foci (45–60 min). In addition to this large heterogeneity in replicon size, it is now apparent that there is also a cor- responding heterogeneity in the size and intensity of in- dividual replication foci. An important property of all replication foci is that they are stable structures that per- sist, with constant dimensions, during all cell cycle stag- es including mitosis, and therefore likely represent a fundamental unit of chromatin organization. With this in mind, we present a modified model of replication foci in which many of the foci are composed of clusters of small replicons as previously proposed, but the size and number of replicons per focus is extremely heterogene- ous, and a significant proportion of foci are composed of Heterogeneity of eukaryotic replicons, replicon clusters, and replication foci Ronald Berezney 1 , Dharani D. Dubey 2 , Joel A. Huberman 3 1 Department of Biological Sciences, State University of New York at Buffalo, Buffalo, NY 14260, USA 2 Department of Zoology, Kutir Postgraduate College, Chakkey, Jaunpur, U.P. 222146, India 3 Department of Cancer Genetics, Roswell Park Cancer Institute, Buffalo, NY 14263, USA Received: 16 August 1999 / Accepted: 17 August 1999 This review is dedicated to the memory of Professor J. Herbert Taylor, whose pioneering studies of chromosomal replication us- ing 3 H-thymidine autoradiography formed the foundation on which the studies described herein were constructed. Correspondence to: J.A. Huberman e-mail: [email protected] Chromosoma (2000) 108:471–484 Chromosoma Focus © Springer-Verlag 2000 single large replicons. We further speculate that very large replicons may extend over two or more individual foci and that this organization may be important in regu- lating the replication of such large replicons as the cell proceeds through S-phase. Introduction This review article grew out of discussions between two of the authors (R.B. and J.A.H.) regarding interpretation of some of the experiments performed by Ma et al. (1998). These discussions took place in two contexts – during thesis committee meetings for Hong Ma (R.B. was Hong Ma’s thesis advisor, and J.A.H. was a member of her thesis committee) and during meetings of the Buf- falo DNA Replication Group, which sponsors discus- sions among scientists interested in DNA replication who work in Buffalo, N.Y. When D.D. visited the labo- ratory of J.A.H. for 2 months during the spring of 1999, he, too, joined in the discussions. All three of us learned a great deal from our interactions and debates. This re- view article represents our attempt to share some of what we learned with the rest of the world. In addition to acknowledging the stimulating atmo- sphere created by our colleagues in the DNA replication field in Buffalo, we also wish to give credit to the review article by Liapunova (1994), which first brought to our attention the important experiments of Yurov and Liapu- nova (1977), who were the first to demonstrate that mammalian replicons can be very large, in some cases greater than 1 Mbp.

Welcome message from author
This document is posted to help you gain knowledge. Please leave a comment to let me know what you think about it! Share it to your friends and learn new things together.
Transcript
Abstract. According to the current paradigm, replicationfoci are discrete sites in the interphase nucleus where as-semblies of DNA replication enzymes simultaneouslyelongate the replication forks of 10–100 adjacent rep-licons (each ~100 kbp). Here we review new results andprovide alternative interpretations for old results to showthat the current paradigm is in need of further develop-ment. In particular, many replicons are larger than previ-ously thought – so large that their complete replicationtakes much longer (several hours) than the measured av-erage time to complete replication at individual foci(45–60 min). In addition to this large heterogeneity inreplicon size, it is now apparent that there is also a cor-responding heterogeneity in the size and intensity of in-dividual replication foci. An important property of allreplication foci is that they are stable structures that per-sist, with constant dimensions, during all cell cycle stag-es including mitosis, and therefore likely represent afundamental unit of chromatin organization. With this inmind, we present a modified model of replication foci inwhich many of the foci are composed of clusters ofsmall replicons as previously proposed, but the size andnumber of replicons per focus is extremely heterogene-ous, and a significant proportion of foci are composed of
Heterogeneity of eukaryotic replicons, replicon clusters, and replication fociRonald Berezney1, Dharani D. Dubey2, Joel A. Huberman3
1 Department of Biological Sciences, State University of New York at Buffalo, Buffalo, NY 14260, USA2 Department of Zoology, Kutir Postgraduate College, Chakkey, Jaunpur, U.P. 222146, India3 Department of Cancer Genetics, Roswell Park Cancer Institute,Buffalo, NY 14263, USA
Received: 16 August 1999 / Accepted: 17 August 1999
This review is dedicated to the memory of Professor J. HerbertTaylor, whose pioneering studies of chromosomal replication us-ing 3H-thymidine autoradiography formed the foundation onwhich the studies described herein were constructed.
Correspondence to: J.A. Huberman e-mail: [email protected]
Chromosoma (2000) 108:471–484
Chromosoma Focus
© Springer-Verlag 2000
single large replicons. We further speculate that verylarge replicons may extend over two or more individualfoci and that this organization may be important in regu-lating the replication of such large replicons as the cellproceeds through S-phase.
Introduction
This review article grew out of discussions between twoof the authors (R.B. and J.A.H.) regarding interpretationof some of the experiments performed by Ma et al.(1998). These discussions took place in two contexts –during thesis committee meetings for Hong Ma (R.B.was Hong Ma’s thesis advisor, and J.A.H. was a memberof her thesis committee) and during meetings of the Buf-falo DNA Replication Group, which sponsors discus-sions among scientists interested in DNA replicationwho work in Buffalo, N.Y. When D.D. visited the labo-ratory of J.A.H. for 2 months during the spring of 1999,he, too, joined in the discussions. All three of us learneda great deal from our interactions and debates. This re-view article represents our attempt to share some ofwhat we learned with the rest of the world.
In addition to acknowledging the stimulating atmo-sphere created by our colleagues in the DNA replicationfield in Buffalo, we also wish to give credit to the reviewarticle by Liapunova (1994), which first brought to ourattention the important experiments of Yurov and Liapu-nova (1977), who were the first to demonstrate thatmammalian replicons can be very large, in some casesgreater than 1 Mbp.
The major lesson that has emerged from our discus-sions is that the “textbook” description of the relation-ships between replicons and replication foci is in need ofrevision. It appears that, in fact, the range of possibilitiesis considerably greater than previously imagined. Somereplicons are so large that most of S-phase is required tocomplete them, while others are so short that they can becompleted in less than an hour. Some replication focimay contain just one replicon while others appear tocontain many. Whatever the number of replicons per fo-cus, however, recent data suggest that replication fociare a reflection of fundamental, stable properties ofchromatin structure, valid in both interphase and meta-phase.
Evidence for replicon clusters
In this section, we summarize the evidence on which theclassic view of replicon clusters and replication foci isbased. According to this classic view, each replicationfocus represents a cluster of small (<~200 kbp) repli-cons, which complete replication in a small portion of S-phase (45–60 min).
DNA fiber studies
Many of the features of eukaryotic DNA replication, in-cluding bidirectional replication from irregularly spacedorigins, were first characterized in experiments (reviewedin Edenberg and Huberman 1975; Hand 1978) in whichDNA molecules labeled in vivo with 3H-thymidine werestretched out on filters or microscope slides and then au-toradiographed (exposed to a photographic emulsion sen-sitive to the β-particles given off by 3H). Wherever 3H-thymidine had been incorporated into the DNA molecule,a track of silver grains was generated in the overlyingemulsion, and the density of silver grains in those trackswas proportional to the specific activity of the 3H-thymi-dine. Thus, by intentionally altering the specific activityof the 3H-thymidine during an experiment, a researchercould infer the direction of DNA replication fork move-ment from the corresponding change in grain density in
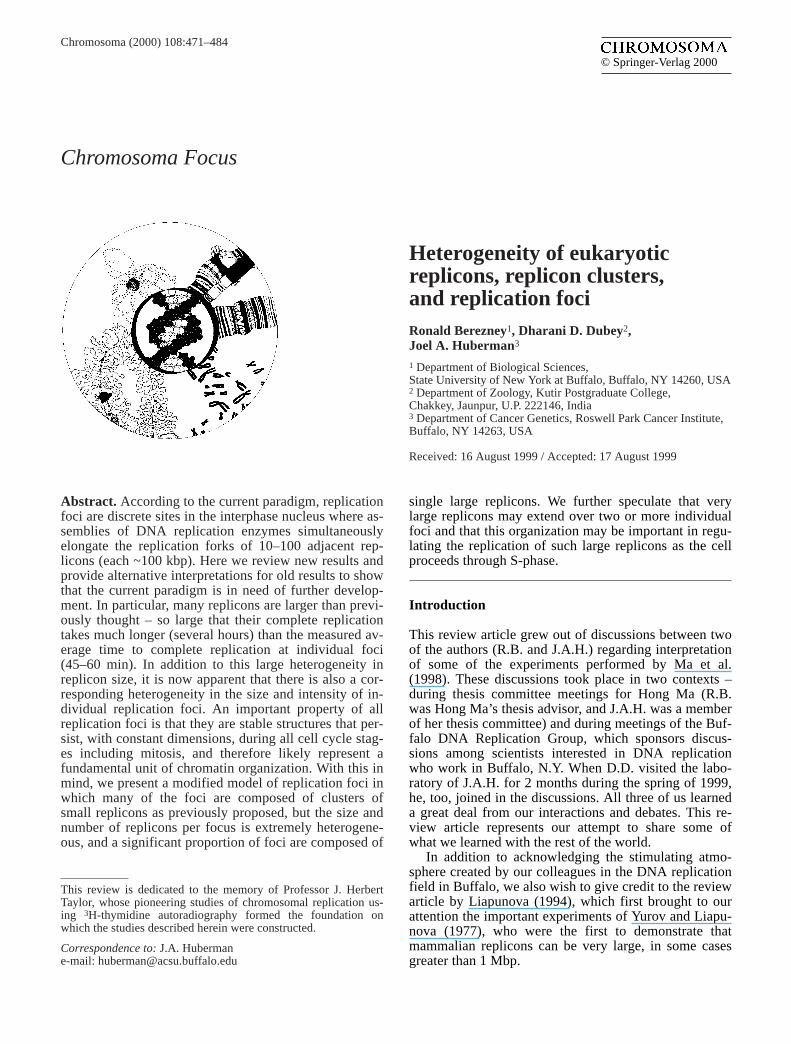
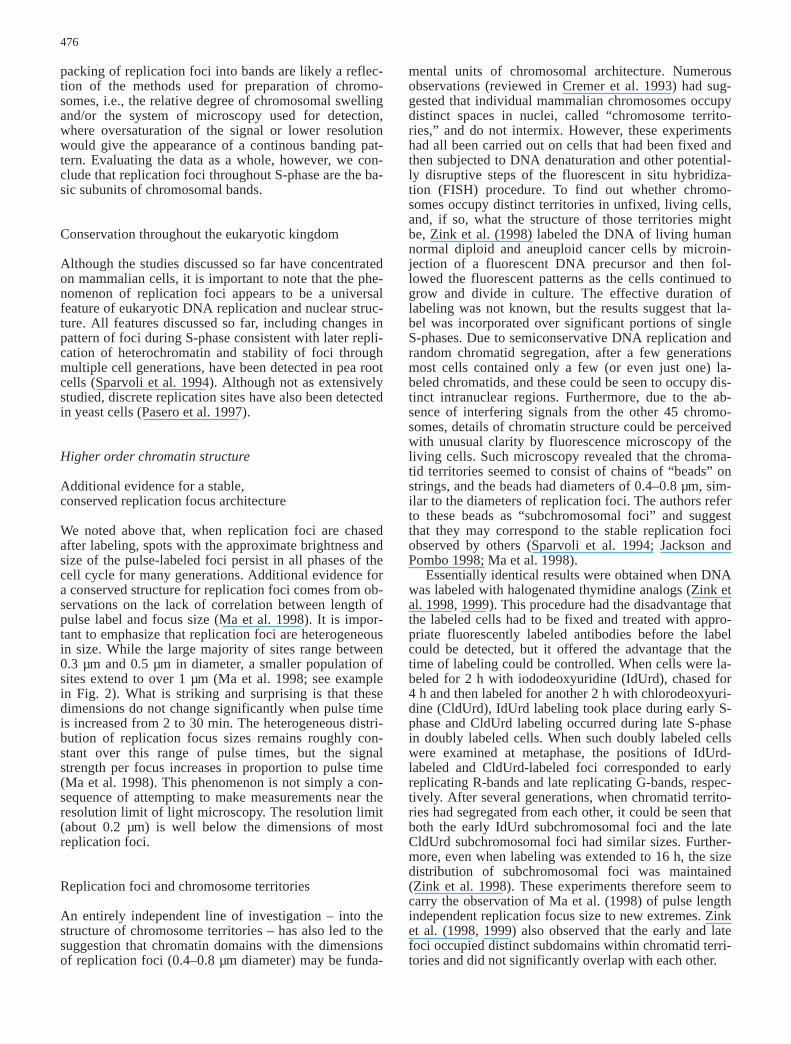
the final autoradiogram. An example is shown in Fig. 1.In this case, Chinese hamster ovary cells were first exposed to 3H-thymidine at high specific activity for 30 min and then chased with cold thymidine for 45 min.During the cold chase, the specific activity of the dTTPinside the cells gradually declined, leading to gradients ofgrain density that declined in the direction of replicationfork movement. Based on this information, it seemsstraightforward to conclude that the DNA molecule inFig. 1 was replicated by forks from three origins spaced200 and 300 kbp apart from each other (arrows in Fig. 1)that had fired before the start of the high specific activitypulse. Similar measurements by many investigators onnumerous additional DNA molecules in a variety ofmammalian species led to the generalization that mam-malian replicons are heterogeneous in size but that mostfall into the range of 30–450 kbp with the most frequentsizes in the range 75–150 kbp. Furthermore, the ap-pearance of tandem arrays of neighboring replicons thathad initiated replication at similar times (like the array inFig. 1) suggested that replicons may frequently be ar-ranged in groups with all of the replicons in each groupfiring at similar times in S-phase (reviewed in Edenbergand Huberman 1975; Hand 1978).
Today similar experiments on extended DNA fiberscan be carried out by in vivo labeling with a halogenatedanalog of thymidine such as 5-bromo-2′-deoxyuridine(BrdUrd) and then detecting the labeled DNA segmentswith fluorescent anti-BrdUrd antibodies. This modernapproach obviates the need for the multi-month expo-sure times required for 3H autoradiography and provideshigher resolution. Using such an approach with similarmeasurement criteria, Jackson and Pombo (1998) recent-ly reached similar conclusions with regard to repliconsize and grouping.
Fiber autoradiography and fiber fluorography can alsobe used to study rates of replication fork movement. Re-sults from many investigations (reviewed in Edenberg andHuberman 1975; see also Jackson and Pombo 1998) indi-cate that movement rates of mammalian replication forks,like replicon sizes, are heterogeneous. Fork movementrates vary according to species, cell type and time withinS-phase but generally fall within the range 0.3–6 kbp/min.Even for cells of a single species at a single time during
472
150 kbp
a b
Fig. 1. Example of tandemly arranged replicons with origins fir-ing at approximately the same time. Chinese hamster ovary cellswere grown in Joklik-modified MEM supplemented with non-essential amino acids and 7% fetal calf serum (Life Technolo-gies). 5-Fluoro-2′-deoxyuridine (FdUrd, an inhibitor of thymidyl-ate synthetase; 0.1 µg/ml) and uridine (2.5 µg/ml) were added 12 hbefore the start of labeling. When 2×10⁵ cells/ml had beenreached, 3H-thymidine (51 Ci/mmol; 100 µCi/ml) was added for30 min. The pulse was terminated by removing the radioactivemedium and replacing it with pre-warmed medium containingcold thymidine (5 µg/ml) for 45 min. Then the cells were harvest-
ed and processed for fiber autoradiography as described (Huber-man and Tsai 1973). This figure is a modification of Plate IIIa inHuberman and Tsai (1973). The arrows show the deduced posi-tions of replication origins. The brace labeled a shows the graintracks generated by the two forks that moved outward from a sin-gle origin that fired prior to the start of the hot pulse and then con-tinued through at least a portion of the cold chase. The brace la-beled b shows the grain tracks produced by a single fork that wasactive during the entire hot pulse and at least a portion of the coldchase. Grain track patterns similar to a and b were used by Yurovand Liapunova (1977) to estimate the sizes of large replicons
S-phase (Housman and Huberman 1975), and even for in-dividual cells at a single time during S-phase (Yurov1980), replication fork rates are heterogeneous. For exam-ple, rates of fork movement within single human diploidfibroblasts can range from 0.6 to 3.6 kbp/min (Yurov1980). It is important to note that, in these single cell mea-surements, fork movement rates at different forks operat-ing at the same time within one cell were measured. Thusin this case the variability cannot be attributed to S-phasestage but appears to be characteristic of different repliconswithin the same nucleus.
Even within single replicons, variability of fork ratesappears to be a frequent phenomenon (example in therightmost replicon of Fig. 1). In a comparison of therates of sister replication forks moving away from singleorigins in cells from the rodents Bandicota bengalensisand Nesokia indica, Dubey and Raman (1987a) noticedthat a significant portion (~40%) of the sister forksmoved at unequal rates (ratio of fast fork to slow fork≥1.2).
Chromosomal replication bands
Additional evidence for functional grouping of eukaryot-ic replicons comes from studies on the relationships be-tween replication time during S-phase and the bandingpatterns that can be detected in mammalian metaphasechromosomes after application of appropriate stainingprotocols (reviewed in ISCN 1995). The most common-ly used protocol employs Giemsa stain; bands that ap-pear dark with this technique are called G-bands. Appli-cation of other staining protocols results in bands withintensities opposite to those of the Giemsa technique.Bands appearing dark under these conditions are re-ferred to as R (reverse) bands. The number of detectablebands depends on the staining technique employed andon the degree of condensation of the chromosomes beingstained. The International Standing Committee on Hu-man Cytogenetic Nomenclature recognizes low-, medi-um- and high-resolution banding patterns with 400, 550and 850 bands, respectively (ISCN 1995).
Various techniques permit DNA replicated at a partic-ular time during S-phase to be detected in the context ofmetaphase chromosomes so that its position can be cor-related with standard banding locations. The results ofexperiments with these so-called “replication banding”methods consistently demonstrate that R-bands replicatein early S-phase while G-bands replicate in late S-phase(reviewed in Drouin et al. 1994). It is interesting to notethat replication banding can also be detected in bothcold-blooded vertebrates (Schmid and Guttenbach 1988)and plants (Sparvoli et al. 1994), in whose chromosomesG- and R-bands are not evident.
When well-extended metaphase chromosomes arestudied using replication banding techniques, it issometimes possible to detect as many as 1200–1300bands (Drouin et al. 1990). Even at this high level ofresolution, all bands appear to fire either in early or inlate S-phase. With the synchronization protocol em-ployed in these experiments, no bands were detected
that replicated in both portions of S-phase (Drouin etal. 1990).
Taken together, these observations also lead to theconclusion that replicons are likely to be arranged infunctional groups. At 1200–1300 bands per haploid hu-man genome, the average band would contain 2.5 Mbp.Each band completes replication in half of S-phase(about 4 h), and human replication fork movement ratesrange from 0.6 to 3.6 kbp/min (Yurov 1980). Therefore,the largest replicons that could possibly exist within ahuman chromosomal replication band would correspondto the amount of DNA that could be synthesized by two forks moving at these rates for a full 4 h: between290 kbp and 1.7 Mbp. Thus, each replication band mustcontain at least 2–9 replicons. If any of the repliconswithin the band should complete replication within lessthan 4 h, the number of replicons in the band would haveto be even larger.
Replication foci
First observation
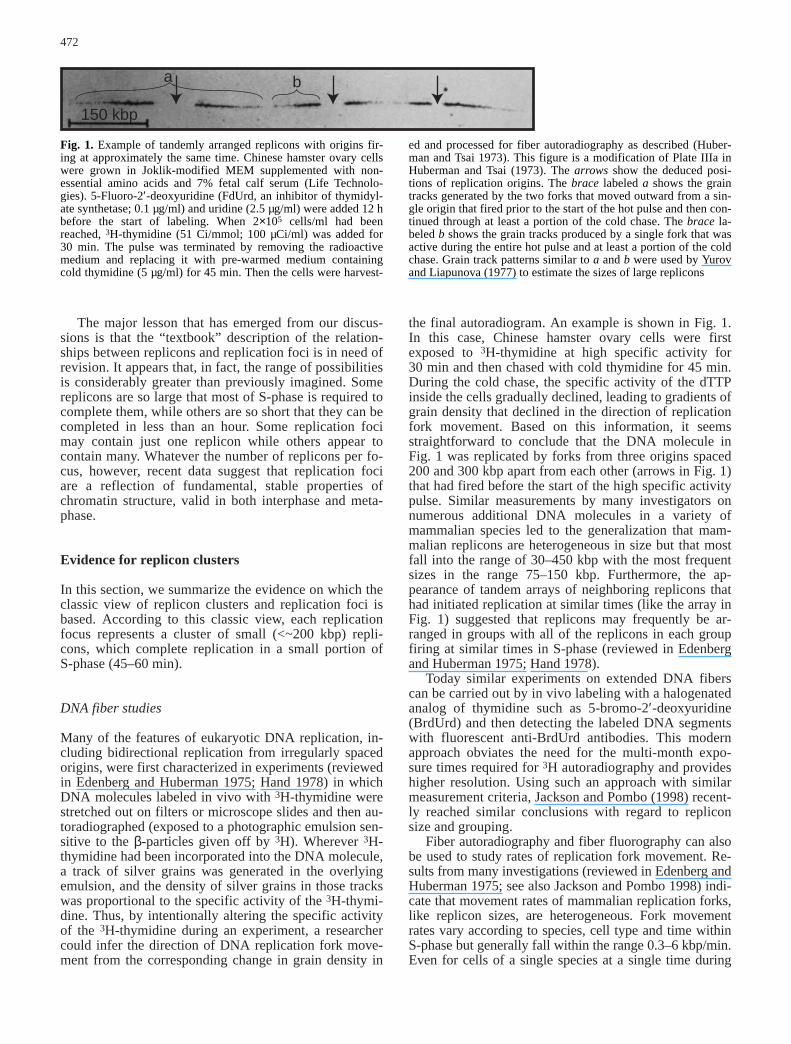
The evidence we have discussed so far makes a strongcase for the existence of groups of adjacent replicons thatfire at similar times in S-phase. None of this evidence,however, requires that the replication forks of the indi-vidual replicons within a group be clustered together in the nucleus. If DNA undergoing replication were de-condensed to the same extent as 30 nm chromatin fibers(packing ratio ~40:1), then two adjacent origins spaced100 kbp from each other along a DNA molecule could beas far apart from each other as 0.75 µm – easily resolv-able by the light microscope. The first evidence suggest-ing that the replicons in a cluster may replicate in muchcloser proximity to each other came from studies by Nakamura et al. (1986), who observed that, when mam-malian cells entering S-phase were labeled with BrdUrdfor increasing lengths of time and then stained with anti-BrdUrd antibodies, replication appeared to start at ~126discrete sites within the nucleus. A similar view of dis-crete, BrdUrd-labeled sites within a mammalian nucleusis shown in Fig. 2. Nakamura et al. (1986) observed thatduring the first hour of S-phase, the number of sites (alsocalled replication foci, granules or domains) remainedroughly constant, but each site became brighter and ap-peared to grow larger, first appearing globular and subse-quently appearing to form “novel ring-like or sometimeshorseshoe-shaped structures.” After about an hour, newsmall foci appeared in different positions, and the processrepeated itself until the mature and replicating sites be-came so crowded that they were no longer resolvable.Based on the brightness of the apparently mature, ring-like regions compared with the brightness of mitochon-drial DNA, Nakamura et al. (1986) deduced that eachmature region contained at least 1 Mbp of DNA – in oth-er words, at least ten replicons of 100 kbp.
That each of the mature regions studied by Nakamuraet al. (1986) seemed likely to contain multiple repliconscould also be inferred from the sizes of the mature re-
473

gions (≥1 Mbp), the apparent time required to reach mat-uration (~60 min) and the average bidirectional replica-tion fork movement rate (1.5–3.4 kbp/min; Housmanand Huberman 1975; Jackson and Pombo 1998) in earlymammalian S-phase. These data suggested that the max-imum size replicon capable of being completed within60 min would be 90–200 kbp. Thus, each mature regionought to contain at least five such replicons.
Changes during S-phase
Subsequent experiments employing BrdUrd or other flu-orescent labels have amply confirmed the major conclu-sion of Nakamura et al. (1986) – that replication takesplace at discrete sites in the nucleus – but have raisedquestions about some of the details. Use of single- ordouble-color pulse labeling with variable chases be-tween pulses, instead of or in combination with continu-ous labeling, and the use of laser scanning confocal mi-croscopy or epifluorescence microscopy with sensitiveCCD cameras plus techniques for removing interfering
signals from neighboring focal planes have permitteddevelopment of a more detailed understanding of nucle-ar replication patterns during S-phase. All studies to datedemonstrate that early S-phase replication sites are dis-tributed throughout the nucleoplasm (with the exceptionof regions occupied by heterochromatin or nucleoli) asrelatively discrete sites. The estimated number of sitesvaries considerably. While many reports estimate100–350 sites in early S-phase (Nakayasu and Berezney1989; van Dierendonck et al. 1989; Fox et al. 1991;Manders et al. 1992; Neri et al. 1992; O’Keefe et al.1992; Hassan and Cook 1993; Manders et al. 1996),some of these measurements are likely to be underesti-mates due to analysis by epifluorescence microscopy ofa single focal plane or to use of segmentation approach-es following three-dimensional confocal microscopy,which grossly underestimate the number of sites (see Maet al. 1998). Using an improved segmentation program,Ma et al. (1998) recently estimated over 1000 individualreplication foci in early S-phase following a 5 min pulseof mouse 3T3 fibroblast cells, and Jackson and Pombo(1998) arrived at a similar number in HeLa cells using a
474
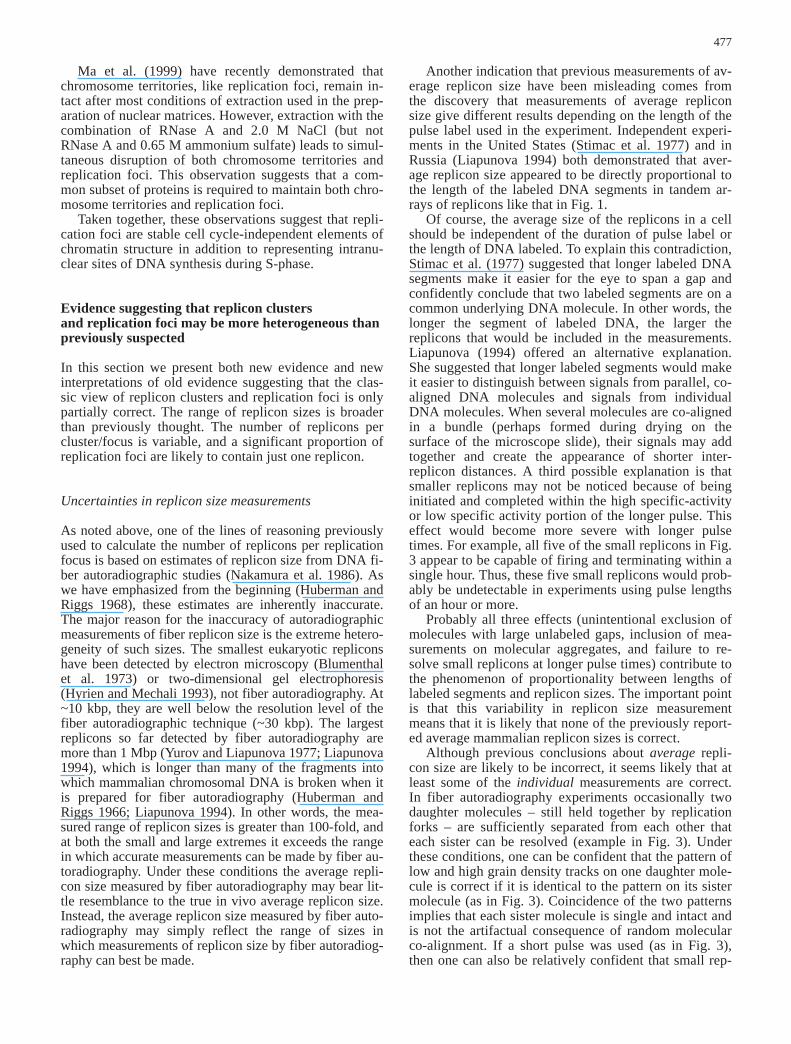
Fig. 2. Normal human diploidfibroblast cells (NHF-1) weregrown on coverslips and pulsedfor 5 min with 5-bromo-2′-deoxyuridine (BrdUrd). Theimage is a 0.5 µm section obtained by laser scanning con-focal microscopy using TexasRed secondary antibodies following reaction with anti-BrdUrd monoclonal antibodies.The bar represents 5 µm in 1 µm divisions. This image ismodified from Fig. 3A of Ma et al. (1999)
direct counting method following extensive spreading ofthe samples. Interestingly, some studies have indicatedthat in very early S-phase (e.g., the first 30 min) thenumber of foci is much smaller than later in early S-phase (van Dierendonck et al. 1989; Fox et al. 1991;Neri et al. 1992). Whether this corresponds to a specialsubpopulation of replication foci or results from asyn-chronous initiation within a larger population of earlyfiring foci is an important question that deserves furtherattention.
All recent studies also indicate that replication pat-terns change in mid- and late S-phase. The number ofreplication foci associated with euchromatic regions inthe nucleoplasm gradually drops to zero, while the num-ber of foci associated with heterochromatic regions inthe nucleoplasm, around the nucleoli, and at the nuclearmembrane increases. The number of resolvable foci inmid- and late S-phase is generally smaller than in earlyS-phase, but the sizes of the mid- and late S-phase fociare frequently larger. Furthermore, many of the largepulse-labeled mid- and late S-phase foci have a ring- orhorseshoe-like appearance (Nakayasu and Berezney1989; O’Keefe et al. 1992), greatly resembling the ring- and horseshoe-like “mature regions” detected byNakamura et al. (1986). This observation suggests thatthe large mature regions reported by Nakamura et al.(1986) may, in fact, have corresponded to mid- or late S-phase replication sites, which Nakamura et al. (1986)failed to resolve from early S-phase foci owing to theiruse of continuous labeling.
There is minor disagreement regarding the precise se-quence of patterns in mid- and late S-phase. In some ex-periments, foci appear at the nuclear and nucleolar pe-ripheries before they appear at internal heterochromatinblocks (Nakayasu and Berezney 1989; Manders et al.1992; O’Keefe et al. 1992; Hassan and Cook 1993;Manders et al. 1996; Ma et al. 1998; Wei et al. 1998),while in other studies the heterochromatin at the nuclearperiphery is the last to be labeled (van Dierendonck etal. 1989; Fox et al. 1991; Neri et al. 1992; Ferreira et al.1997). While we do not know the reasons for these dif-ferences, the use of different cell lines and synchroniza-tion procedures offers one possible explanation. The im-portant point, agreed on by all investigators, is that eu-chromatic regions in the nucleoplasm tend to replicatebefore heterochromatic regions, wherever those regionsmay be located. In mid-S-phase, overlap between thesepatterns is frequently detected. The nucleus shown inFig. 2 is an example. In addition to the multiple, discretefoci distributed throughout the internal portion of the nu-cleus (typical of early S-phase euchromatic replication),there is also a concentration of foci near the heterochro-matin-rich nuclear periphery (typical of mid-S-phase la-beling, under these conditions). The apparent contradic-tion between the detection of overlap of early and latepatterns in these replication foci experiments and thelack of overlap in the high-resolution replication band-ing experiments (Drouin et al. 1990) can probably be ex-plained on the basis of the different synchronization pro-tocols employed. The protocol employed for the replica-tion banding experiments blocked replication at the tran-
sition between R- and G-band labeling (between earlyand late S-phase), and it permitted completion of R-bandreplication before G-band replication commenced(Drouin et al. 1990).
Adjacency of replicons within each focus
The phenomenon of replication foci provided strongsupport for the concept of replicon clusters but did notprove that the replicons within each cluster are adjacentto each other on chromosomal DNA molecules. Evi-dence for the adjacency of the replicons within individu-al foci comes from more recent experiments (Sparvoli etal. 1994; Jackson and Pombo 1998; Ma et al. 1998),which show that the signals from individual replicationfoci persist undiminished (except at the first mitosis,when signal strength is reduced by half) when theBrdUrd pulse label is followed by growth in the absenceof BrdUrd through the subsequent phases of the cell cy-cle and then for numerous generations. The number offoci per daughter cell is decreased by approximately halfat each generation after the second, consistent withsemiconservative segregation of labeled chromatids todaughter cells. If non-adjacent replicons, even on thesame chromatid, contributed significantly to individualreplication foci, then, at each cell division, the processesof mitotic recombination (chromatid segregation and sis-ter chromatid exchange) would be expected to reducethe signal within individual foci and to increase the totalnumber of foci. This is not observed (Sparvoli et al.1994; Jackson and Pombo 1998; Ma et al. 1998). Thus,it is most likely that, in the case of foci containing multi-ple replicons, those replicons are adjacent to each otheron the same chromosomal DNA molecule.
Relationship to chromosomal replication bands
Consistent with the calculations that the average high-resolution replication band contains ~2.5 Mbp of DNA(see above) while the average replication focus containsonly ~1 Mbp (Ma et al. 1998), the experimental resultsshow that, when short pulse labeled early S-phase repli-cation foci are chased into mitosis, multiple discretespots are displayed on the metaphase chromosomes(Jackson and Pombo 1998; Ma et al. 1998). While noneof the spots spans the width of the metaphase chromo-some and forms a complete band, the individual replica-tion foci labeled in early S-phase are often very close to-gether in band-like array (see Ma et al. 1998). Longerperiods of labeling (2 h) do generate complete replica-tion bands (Zink et al. 1999). Moreover in the study ofFerreira et al (1997), labeled regions appear to form con-tinuous chromosomal bands that correspond to R-bandsfollowing a pulse of only 15 min during early S-phase.Similar variation from band-like arrays of individualreplication foci (Sparvoli et al. 1994) to apparently con-tinuously labeled replication bands (Ferreira et al. 1997;D. Dimitrova and D. Gilbert, personal communication)has been reported for late S-phase. These variations in
475
packing of replication foci into bands are likely a reflec-tion of the methods used for preparation of chromo-somes, i.e., the relative degree of chromosomal swellingand/or the system of microscopy used for detection,where oversaturation of the signal or lower resolutionwould give the appearance of a continous banding pat-tern. Evaluating the data as a whole, however, we con-clude that replication foci throughout S-phase are the ba-sic subunits of chromosomal bands.
Conservation throughout the eukaryotic kingdom
Although the studies discussed so far have concentratedon mammalian cells, it is important to note that the phe-nomenon of replication foci appears to be a universalfeature of eukaryotic DNA replication and nuclear struc-ture. All features discussed so far, including changes inpattern of foci during S-phase consistent with later repli-cation of heterochromatin and stability of foci throughmultiple cell generations, have been detected in pea rootcells (Sparvoli et al. 1994). Although not as extensivelystudied, discrete replication sites have also been detectedin yeast cells (Pasero et al. 1997).
Higher order chromatin structure
Additional evidence for a stable, conserved replication focus architecture
We noted above that, when replication foci are chasedafter labeling, spots with the approximate brightness andsize of the pulse-labeled foci persist in all phases of thecell cycle for many generations. Additional evidence fora conserved structure for replication foci comes from ob-servations on the lack of correlation between length ofpulse label and focus size (Ma et al. 1998). It is impor-tant to emphasize that replication foci are heterogeneousin size. While the large majority of sites range between0.3 µm and 0.5 µm in diameter, a smaller population ofsites extend to over 1 µm (Ma et al. 1998; see examplein Fig. 2). What is striking and surprising is that thesedimensions do not change significantly when pulse timeis increased from 2 to 30 min. The heterogeneous distri-bution of replication focus sizes remains roughly con-stant over this range of pulse times, but the signalstrength per focus increases in proportion to pulse time(Ma et al. 1998). This phenomenon is not simply a con-sequence of attempting to make measurements near theresolution limit of light microscopy. The resolution limit(about 0.2 µm) is well below the dimensions of mostreplication foci.
Replication foci and chromosome territories
An entirely independent line of investigation – into thestructure of chromosome territories – has also led to thesuggestion that chromatin domains with the dimensionsof replication foci (0.4–0.8 µm diameter) may be funda-
mental units of chromosomal architecture. Numerousobservations (reviewed in Cremer et al. 1993) had sug-gested that individual mammalian chromosomes occupydistinct spaces in nuclei, called “chromosome territo-ries,” and do not intermix. However, these experimentshad all been carried out on cells that had been fixed andthen subjected to DNA denaturation and other potential-ly disruptive steps of the fluorescent in situ hybridiza-tion (FISH) procedure. To find out whether chromo-somes occupy distinct territories in unfixed, living cells,and, if so, what the structure of those territories mightbe, Zink et al. (1998) labeled the DNA of living humannormal diploid and aneuploid cancer cells by microin-jection of a fluorescent DNA precursor and then fol-lowed the fluorescent patterns as the cells continued togrow and divide in culture. The effective duration of labeling was not known, but the results suggest that la-bel was incorporated over significant portions of singleS-phases. Due to semiconservative DNA replication andrandom chromatid segregation, after a few generationsmost cells contained only a few (or even just one) la-beled chromatids, and these could be seen to occupy dis-tinct intranuclear regions. Furthermore, due to the ab-sence of interfering signals from the other 45 chromo-somes, details of chromatin structure could be perceivedwith unusual clarity by fluorescence microscopy of theliving cells. Such microscopy revealed that the chroma-tid territories seemed to consist of chains of “beads” onstrings, and the beads had diameters of 0.4–0.8 µm, sim-ilar to the diameters of replication foci. The authors referto these beads as “subchromosomal foci” and suggestthat they may correspond to the stable replication fociobserved by others (Sparvoli et al. 1994; Jackson andPombo 1998; Ma et al. 1998).
Essentially identical results were obtained when DNAwas labeled with halogenated thymidine analogs (Zink etal. 1998, 1999). This procedure had the disadvantage thatthe labeled cells had to be fixed and treated with appro-priate fluorescently labeled antibodies before the labelcould be detected, but it offered the advantage that thetime of labeling could be controlled. When cells were la-beled for 2 h with iododeoxyuridine (IdUrd), chased for 4 h and then labeled for another 2 h with chlorodeoxyuri-dine (CldUrd), IdUrd labeling took place during early S-phase and CldUrd labeling occurred during late S-phasein doubly labeled cells. When such doubly labeled cellswere examined at metaphase, the positions of IdUrd-labeled and CldUrd-labeled foci corresponded to earlyreplicating R-bands and late replicating G-bands, respec-tively. After several generations, when chromatid territo-ries had segregated from each other, it could be seen thatboth the early IdUrd subchromosomal foci and the lateCldUrd subchromosomal foci had similar sizes. Further-more, even when labeling was extended to 16 h, the sizedistribution of subchromosomal foci was maintained(Zink et al. 1998). These experiments therefore seem tocarry the observation of Ma et al. (1998) of pulse lengthindependent replication focus size to new extremes. Zinket al. (1998, 1999) also observed that the early and latefoci occupied distinct subdomains within chromatid terri-tories and did not significantly overlap with each other.
476
Ma et al. (1999) have recently demonstrated thatchromosome territories, like replication foci, remain in-tact after most conditions of extraction used in the prep-aration of nuclear matrices. However, extraction with thecombination of RNase A and 2.0 M NaCl (but notRNase A and 0.65 M ammonium sulfate) leads to simul-taneous disruption of both chromosome territories andreplication foci. This observation suggests that a com-mon subset of proteins is required to maintain both chro-mosome territories and replication foci.
Taken together, these observations suggest that repli-cation foci are stable cell cycle-independent elements ofchromatin structure in addition to representing intranu-clear sites of DNA synthesis during S-phase.
Evidence suggesting that replicon clusters and replication foci may be more heterogeneous thanpreviously suspected
In this section we present both new evidence and newinterpretations of old evidence suggesting that the clas-sic view of replicon clusters and replication foci is onlypartially correct. The range of replicon sizes is broaderthan previously thought. The number of replicons percluster/focus is variable, and a significant proportion ofreplication foci are likely to contain just one replicon.
Uncertainties in replicon size measurements
As noted above, one of the lines of reasoning previouslyused to calculate the number of replicons per replicationfocus is based on estimates of replicon size from DNA fi-ber autoradiographic studies (Nakamura et al. 1986). Aswe have emphasized from the beginning (Huberman andRiggs 1968), these estimates are inherently inaccurate.The major reason for the inaccuracy of autoradiographicmeasurements of fiber replicon size is the extreme hetero-geneity of such sizes. The smallest eukaryotic repliconshave been detected by electron microscopy (Blumenthalet al. 1973) or two-dimensional gel electrophoresis (Hyrien and Mechali 1993), not fiber autoradiography. At~10 kbp, they are well below the resolution level of thefiber autoradiographic technique (~30 kbp). The largestreplicons so far detected by fiber autoradiography aremore than 1 Mbp (Yurov and Liapunova 1977; Liapunova1994), which is longer than many of the fragments intowhich mammalian chromosomal DNA is broken when itis prepared for fiber autoradiography (Huberman andRiggs 1966; Liapunova 1994). In other words, the mea-sured range of replicon sizes is greater than 100-fold, andat both the small and large extremes it exceeds the rangein which accurate measurements can be made by fiber au-toradiography. Under these conditions the average repli-con size measured by fiber autoradiography may bear lit-tle resemblance to the true in vivo average replicon size.Instead, the average replicon size measured by fiber auto-radiography may simply reflect the range of sizes inwhich measurements of replicon size by fiber autoradiog-raphy can best be made.
Another indication that previous measurements of av-erage replicon size have been misleading comes fromthe discovery that measurements of average repliconsize give different results depending on the length of thepulse label used in the experiment. Independent experi-ments in the United States (Stimac et al. 1977) and inRussia (Liapunova 1994) both demonstrated that aver-age replicon size appeared to be directly proportional tothe length of the labeled DNA segments in tandem ar-rays of replicons like that in Fig. 1.
Of course, the average size of the replicons in a cellshould be independent of the duration of pulse label orthe length of DNA labeled. To explain this contradiction,Stimac et al. (1977) suggested that longer labeled DNAsegments make it easier for the eye to span a gap andconfidently conclude that two labeled segments are on acommon underlying DNA molecule. In other words, thelonger the segment of labeled DNA, the larger the replicons that would be included in the measurements.Liapunova (1994) offered an alternative explanation.She suggested that longer labeled segments would makeit easier to distinguish between signals from parallel, co-aligned DNA molecules and signals from individualDNA molecules. When several molecules are co-alignedin a bundle (perhaps formed during drying on the surface of the microscope slide), their signals may addtogether and create the appearance of shorter inter-replicon distances. A third possible explanation is thatsmaller replicons may not be noticed because of beinginitiated and completed within the high specific-activityor low specific activity portion of the longer pulse. Thiseffect would become more severe with longer pulsetimes. For example, all five of the small replicons in Fig.3 appear to be capable of firing and terminating within asingle hour. Thus, these five small replicons would prob-ably be undetectable in experiments using pulse lengthsof an hour or more.
Probably all three effects (unintentional exclusion ofmolecules with large unlabeled gaps, inclusion of mea-surements on molecular aggregates, and failure to re-solve small replicons at longer pulse times) contribute tothe phenomenon of proportionality between lengths oflabeled segments and replicon sizes. The important pointis that this variability in replicon size measurementmeans that it is likely that none of the previously report-ed average mammalian replicon sizes is correct.
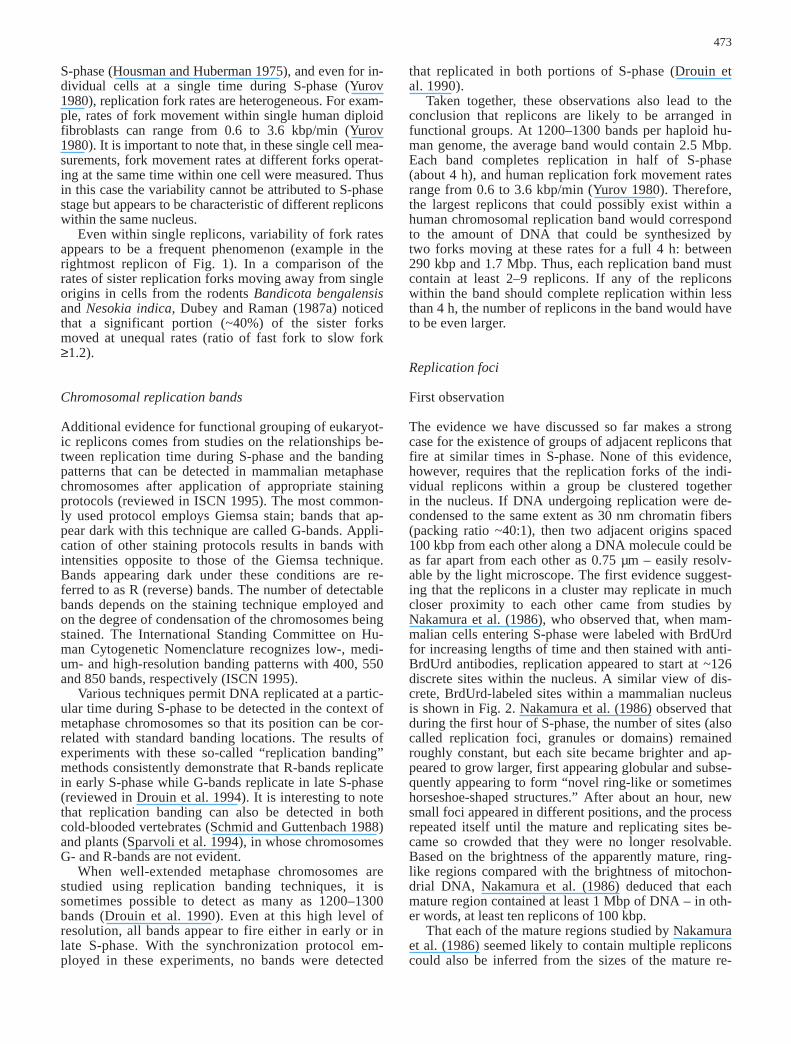
Although previous conclusions about average repli-con size are likely to be incorrect, it seems likely that atleast some of the individual measurements are correct.In fiber autoradiography experiments occasionally twodaughter molecules – still held together by replicationforks – are sufficiently separated from each other thateach sister can be resolved (example in Fig. 3). Underthese conditions, one can be confident that the pattern oflow and high grain density tracks on one daughter mole-cule is correct if it is identical to the pattern on its sistermolecule (as in Fig. 3). Coincidence of the two patternsimplies that each sister molecule is single and intact andis not the artifactual consequence of random molecularco-alignment. If a short pulse was used (as in Fig. 3),then one can also be relatively confident that small rep-
477
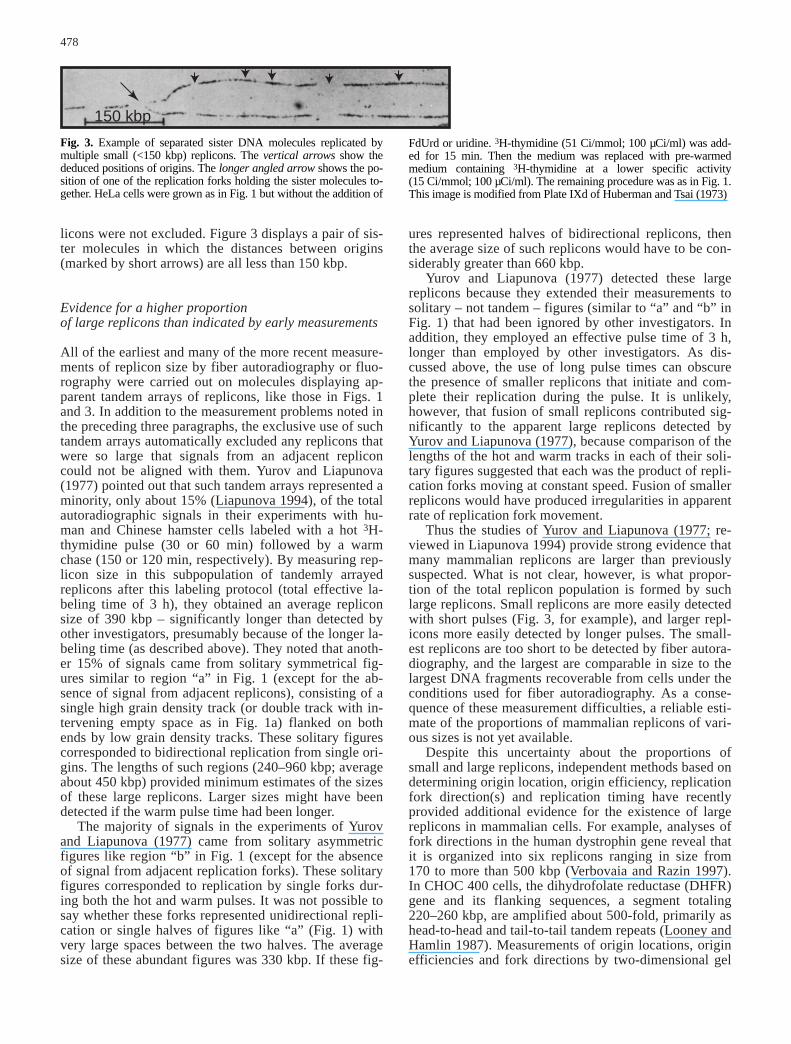
licons were not excluded. Figure 3 displays a pair of sis-ter molecules in which the distances between origins(marked by short arrows) are all less than 150 kbp.
Evidence for a higher proportion of large replicons than indicated by early measurements
All of the earliest and many of the more recent measure-ments of replicon size by fiber autoradiography or fluo-rography were carried out on molecules displaying ap-parent tandem arrays of replicons, like those in Figs. 1and 3. In addition to the measurement problems noted inthe preceding three paragraphs, the exclusive use of suchtandem arrays automatically excluded any replicons thatwere so large that signals from an adjacent repliconcould not be aligned with them. Yurov and Liapunova(1977) pointed out that such tandem arrays represented aminority, only about 15% (Liapunova 1994), of the totalautoradiographic signals in their experiments with hu-man and Chinese hamster cells labeled with a hot 3H-thymidine pulse (30 or 60 min) followed by a warmchase (150 or 120 min, respectively). By measuring rep-licon size in this subpopulation of tandemly arrayedreplicons after this labeling protocol (total effective la-beling time of 3 h), they obtained an average repliconsize of 390 kbp – significantly longer than detected byother investigators, presumably because of the longer la-beling time (as described above). They noted that anoth-er 15% of signals came from solitary symmetrical fig-ures similar to region “a” in Fig. 1 (except for the ab-sence of signal from adjacent replicons), consisting of asingle high grain density track (or double track with in-tervening empty space as in Fig. 1a) flanked on bothends by low grain density tracks. These solitary figurescorresponded to bidirectional replication from single ori-gins. The lengths of such regions (240–960 kbp; averageabout 450 kbp) provided minimum estimates of the sizesof these large replicons. Larger sizes might have beendetected if the warm pulse time had been longer.
The majority of signals in the experiments of Yurovand Liapunova (1977) came from solitary asymmetricfigures like region “b” in Fig. 1 (except for the absenceof signal from adjacent replication forks). These solitaryfigures corresponded to replication by single forks dur-ing both the hot and warm pulses. It was not possible tosay whether these forks represented unidirectional repli-cation or single halves of figures like “a” (Fig. 1) withvery large spaces between the two halves. The averagesize of these abundant figures was 330 kbp. If these fig-
ures represented halves of bidirectional replicons, thenthe average size of such replicons would have to be con-siderably greater than 660 kbp.
Yurov and Liapunova (1977) detected these largereplicons because they extended their measurements tosolitary – not tandem – figures (similar to “a” and “b” inFig. 1) that had been ignored by other investigators. Inaddition, they employed an effective pulse time of 3 h,longer than employed by other investigators. As dis-cussed above, the use of long pulse times can obscurethe presence of smaller replicons that initiate and com-plete their replication during the pulse. It is unlikely,however, that fusion of small replicons contributed sig-nificantly to the apparent large replicons detected byYurov and Liapunova (1977), because comparison of thelengths of the hot and warm tracks in each of their soli-tary figures suggested that each was the product of repli-cation forks moving at constant speed. Fusion of smallerreplicons would have produced irregularities in apparentrate of replication fork movement.
Thus the studies of Yurov and Liapunova (1977; re-viewed in Liapunova 1994) provide strong evidence thatmany mammalian replicons are larger than previouslysuspected. What is not clear, however, is what propor-tion of the total replicon population is formed by suchlarge replicons. Small replicons are more easily detectedwith short pulses (Fig. 3, for example), and larger repl-icons more easily detected by longer pulses. The small-est replicons are too short to be detected by fiber autora-diography, and the largest are comparable in size to thelargest DNA fragments recoverable from cells under theconditions used for fiber autoradiography. As a conse-quence of these measurement difficulties, a reliable esti-mate of the proportions of mammalian replicons of vari-ous sizes is not yet available.
Despite this uncertainty about the proportions ofsmall and large replicons, independent methods based ondetermining origin location, origin efficiency, replicationfork direction(s) and replication timing have recentlyprovided additional evidence for the existence of largereplicons in mammalian cells. For example, analyses offork directions in the human dystrophin gene reveal thatit is organized into six replicons ranging in size from170 to more than 500 kbp (Verbovaia and Razin 1997).In CHOC 400 cells, the dihydrofolate reductase (DHFR)gene and its flanking sequences, a segment totaling220–260 kbp, are amplified about 500-fold, primarily ashead-to-head and tail-to-tail tandem repeats (Looney andHamlin 1987). Measurements of origin locations, originefficiencies and fork directions by two-dimensional gel
478
150 kbp
Fig. 3. Example of separated sister DNA molecules replicated bymultiple small (<150 kbp) replicons. The vertical arrows show thededuced positions of origins. The longer angled arrow shows the po-sition of one of the replication forks holding the sister molecules to-gether. HeLa cells were grown as in Fig. 1 but without the addition of
FdUrd or uridine. 3H-thymidine (51 Ci/mmol; 100 µCi/ml) was add-ed for 15 min. Then the medium was replaced with pre-warmed medium containing 3H-thymidine at a lower specific activity (15 Ci/mmol; 100 µCi/ml). The remaining procedure was as in Fig. 1.This image is modified from Plate IXd of Huberman and Tsai (1973)
electrophoresis show that within this region replicationinitiates primarily in a 55-kbp segment downstream of the DHFR gene (Vaughn et al. 1990; Dijkwel andHamlin 1992). In any one S-phase initiations are esti-mated to take place in only about 15% of the repeat units (Dijkwel and Hamlin 1992; Dijkwel et al. 1994). The re-maining repeat units are passively replicated by forkscoming from active origins in flanking repeats (Dijkwelet al. 1994). Thus the effective replicon size for the DHFRamplicons appears to be (~240 kbp)/0.15 or ~1.6 Mbp.In Chinese hamster cells, the maximal bidirectional rateof fork movement is about 6 kbp/min (Housman andHuberman 1975). At this rate, these large DHFR repl-icons would be completed in ~4.5 h.
Ermakova et al. (1999) recently combined detailedreplication timing analyses with measurements of forkdirection to obtain evidence that, in most mouse cells,the immunoglobulin heavy chain (IgH) region is part of a large asymmetric or unidirectional replicon. The400 kbp IgH region is bounded on one side by a regionof at least 250 kbp that is uniformly replicated in veryearly S-phase and on the other by a region of at least 600 kbp that is uniformly replicated in late S-phase. TheIgH region itself is replicated by a single fork travellingfrom the early replicating region to the late replicatingregion. The fork direction and timing assays suggest thatboth the early and late replicating flanking regions arereplicated by forks from several small, synchronouslyfiring origins. In other words, the flanking regions ap-pear to be replicated by the mechanism first suggestedby fiber autoradiography experiments – clusters of
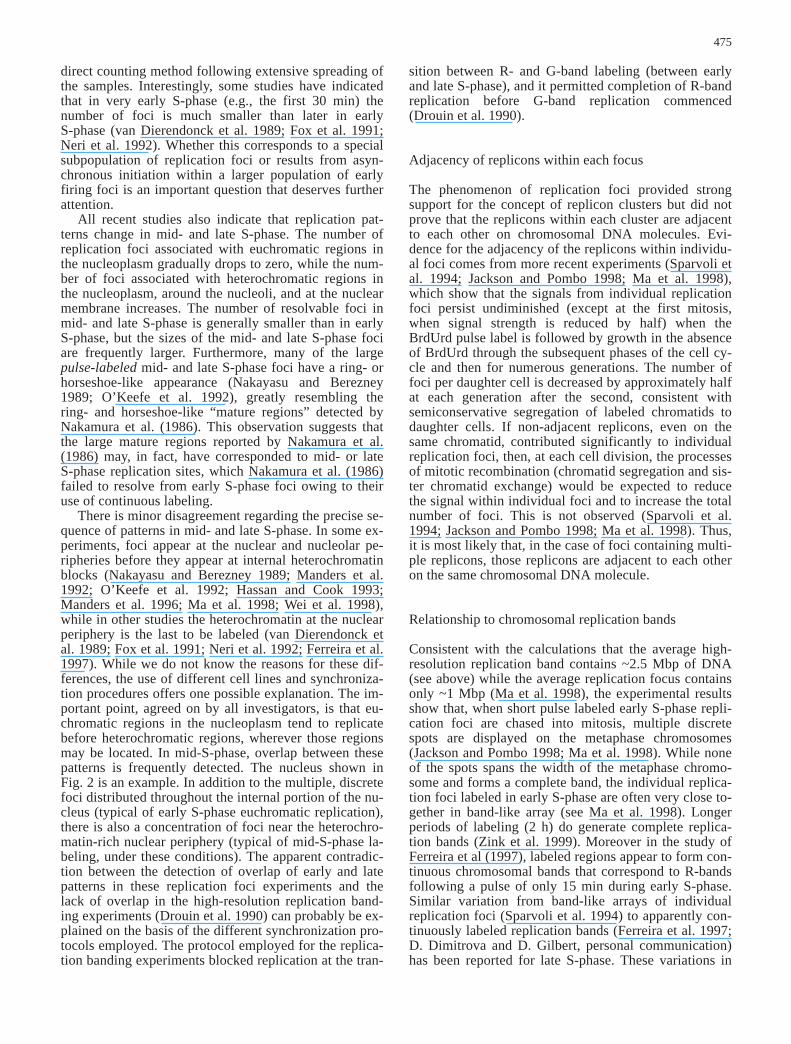
small, synchronously firing origins. The results indicatethat the IgH-proximal origin in the early cluster sends itsIgH-proximal fork through the IgH region, and that forkprogresses until, in late S-phase, it meets a fork comingfrom the IgH-proximal origin in the late-firing cluster(approximately as shown in the diagram in Fig. 4).
Evidence for frequent asynchrony in the firing of adjacent origins
Evidence for significant synchrony in the firing ofneighboring origins within tandem arrays is apparent inmany fiber autoradiographic experiments (reviewed inHand 1978). For example, a certain amount of synchro-ny is evident in Fig. 1. All three origins (marked by ar-rows) fired before the start of the high specific activitypulse. At the same time, it is also obvious that synchro-ny was not perfect in Fig. 1. The origins appear to havefired one after the other in order from left to right. Amore obvious example of asynchronous replicon firingis shown in Fig. 3, where two of the origins (first andfourth from the left) fired before the high specific ac-tivity pulse, while the other three origins (second, thirdand fifth from the left) fired during the high specific ac-tivity pulse. However, because the pulse length was only15 min in this experiment, it is likely that all five originsfired within 30 min of each other.
Dubey and Raman (1987b) attempted to quantitatethe degree of synchrony of origin firing in various tis-sues of the mole rat. By pairwise comparisons between
479
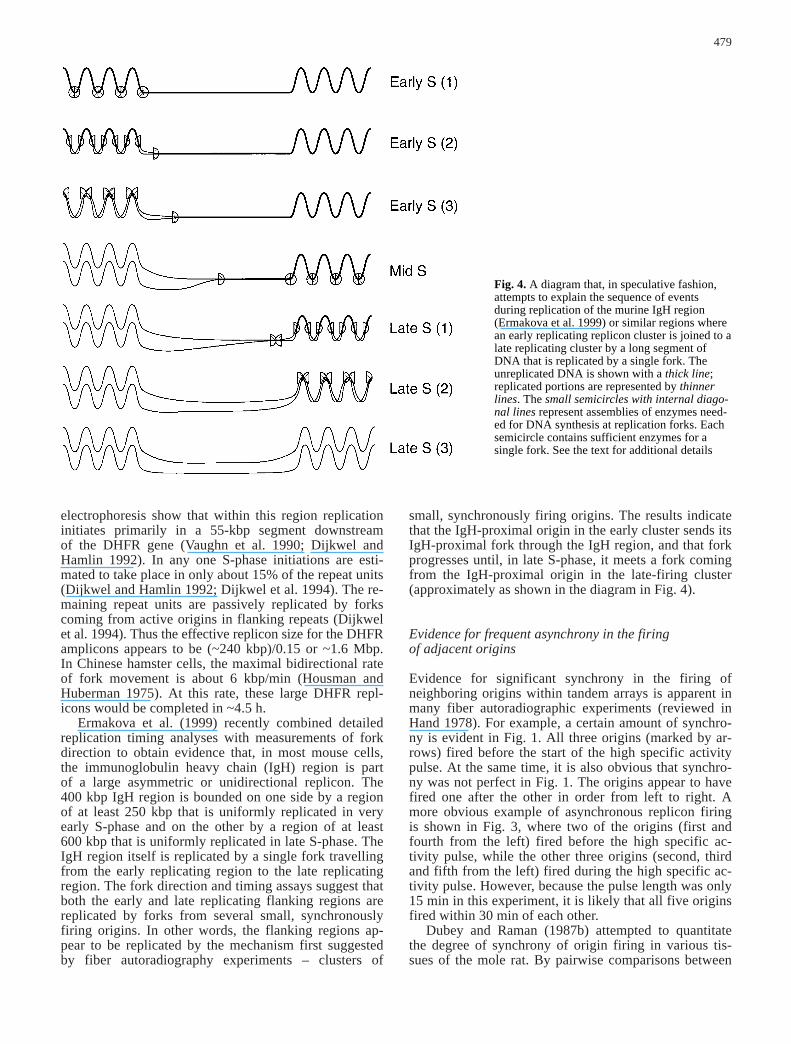
Fig. 4. A diagram that, in speculative fashion,attempts to explain the sequence of events during replication of the murine IgH region (Ermakova et al. 1999) or similar regions wherean early replicating replicon cluster is joined to alate replicating cluster by a long segment ofDNA that is replicated by a single fork. The unreplicated DNA is shown with a thick line;replicated portions are represented by thinnerlines. The small semicircles with internal diago-nal lines represent assemblies of enzymes need-ed for DNA synthesis at replication forks. Eachsemicircle contains sufficient enzymes for a single fork. See the text for additional details

neighboring origins in tandem arrays of three to eightreplicons, they found that the majority (55%–77%) ofpairs fired within 30 min of each other, but a significantminority (23%–45%) did not.
Thus the generalization that neighboring replicons intandem arrays fire synchronously is only partially valid.Perfectly synchronous initiations are rare, but imperfectsynchrony (initiation within the same 30 min interval) iscommon. However, asynchronous initiations (greaterthan 30 min apart) take place about one-third of thetime. The relationships between degree of synchronyand organization into replication foci are not yet clear.
Heterogeneity of focus size and brightness suggests a variable number of replicons per focus
As is evident from Fig. 2, replication foci differ fromeach other in both size and brightness. Ma et al. (1998)have used a spot-based segmentation algorithm to assistin quantitating the differences in size. Their measure-ments reveal a heterogeneous volume distribution with apredominance (~90%) of smaller and intermediate vol-umes (0.04–0.33 µm3) and a small but reproducible pop-ulation (~10%) of larger (up to ~0.8 µm3) foci. Jacksonand Pombo (1998) independently quantitated brightnessper replication focus and found a range of tenfold ormore. What could be the sources of these variations?
The brightness of each focus should be proportionalto the amount of DNA synthesized in the focus duringthe pulse. Thus for those foci that are active during theentire pulse, brightness should be directly proportionalto both the replication fork rate and the number of rep-licons in the focus. The distribution of brightnesses mea-sured by Jackson and Pombo (1998) is heavily skewedto lower brightnesses, consistent with the skewed distri-bution of replicons per cluster measured by the same au-thors using fiber fluorography. In contrast, the distribu-tions of replication fork rate frequencies measured by fi-ber autoradiography (Housman and Huberman 1975;Yurov 1980) are more symmetric. Thus it seems likely,as concluded by Jackson and Pombo (1998), that the ma-jor determinant of the variability of replication focusbrightness is variations in the number of replicons perfocus. In other words, a replication focus with a singleactive replicon of 200 kbp would be less intensely la-beled than one with ten active replicons of 20 kbp each.
It is reasonable to think that the heterogeneity of sizesmeasured for replication foci is directly related to het-erogeneity in the amount of DNA present within eachfocus, assuming a similar packing density for the DNAcontained within each site. Since the average focus has avolume of ~0.2 µm3 and contains ~1 Mbp of DNA (Maet al. 1998), it can be calculated that the entire volumerange of ~0.04–~0.4 µm3 (which accounts for nearly theentire population of replication foci) corresponds to arange of DNA content for each site from ~0.2–~4 Mbp.Thus the largest foci contain much more DNA than eventhe largest replicons (up to 1.7 Mbp; see above) andtherefore must contain more than one replicon. Thesmaller foci may contain variable numbers of replicons
of variable size, with the constraints that the total massof DNA per focus should be sufficient to account for fo-cus size and the number of replicons per focus should besufficient to account for focus brightness.
Some replication foci may contain just a single replicon
Several lines of reasoning lead us to consider that somereplication foci may contain just a single replicon. First,as noted above, the simplest explanation of the largevariations in replication focus size and brightness is thatdifferent foci contain different numbers of replicons.Second, if replication focus architecture is sufficientlyflexible that different foci can have different numbers ofreplicons, then there is no obvious a priori reason whyfoci with just one replicon should not be possible. Third,the fact that current technology is sufficiently sensitiveto detect single stretched-out DNA molecules labeledwith BrdUrd (Jackson and Pombo 1998) suggests thatthere should be no problem in detecting single repliconsinside nuclei, where the signal is expected to be moreconcentrated owing to chromatin compaction. However,since no one has yet demonstrated a single replicon in areplication focus, it cannot be ruled out that manysingle-replicon-containing foci are not detected underthe conditions used for microscopy and image collec-tion. Fourth, as the apparent average size of repliconshas become larger due to expansion of possibilities foridentifying and characterizing large replicons (seeabove), and as the apparent average number of foci percell has become larger owing to use of more sensitivedetection methods, the calculated need for large numbersof replicons per focus has diminished. In fact, if the av-erage size of a mammalian replicon is 500 kbp ratherthan 100 kbp (see above), and the average number of fo-ci per cell is ~10,000 (~1000 foci completing replicationevery 45 min during an 8 h S-phase; Ma et al. 1998),then the average number of replicons required per focusto replicate a 10 Gbp mammalian diploid genome is justtwo! Thus, although there are good reasons to think that,in many cases, replication foci are likely to contain mul-tiple replicons (see above), it now seems possible that asignificant portion of replication foci may contain singlereplicons.
The implications of pulse-chase-pulse experiments
The finding that certain antibodies raised againstBrdUrd-containing DNA can discriminate between DNAlabeled with CldUrd and DNA labeled with IdUrd (re-viewed in Manders et al. 1992) has permitted sophisti-cated comparisons between the replication foci labeledwithin a single cell at different times during S-phase.This is accomplished with a pulse-chase-pulse protocol,in which a pulse with one of the halogenated thymidineanalogs, say CldUrd, is followed by a chase of variablelength, which is then followed by a second pulse, thistime with the other analog (IdUrd in our example). Thecells are then fixed and stained with modified antibodies
480

that fluoresce in different colors. For example, the anti-CldUrd antibody might produce green fluorescence, andthe anti-IdUrd antibody might produce red fluorescence.Manders et al. (1992, 1996) and Ma et al. (1998) haveused this approach with relatively short chase periods inan attempt to learn when one set of replication foci com-pletes replication and a new set begins. The results showthat, if the chase time is zero, there is essentially com-plete overlap (as expected) between the first (green) andsecond (red) pulse labels, but as the pulse length increas-es, the amount of overlap diminishes, reaching a lowbackground level in less than 1 h.
Although the experimental results are simple and re-producible, they lend themselves to more than one inter-pretation. Here we present two alternative views. Due touncertainties in measurements of proportions of rep-licons of various sizes (mentioned above) and to uncer-tainties about the relative intranuclear locations of spe-cific DNA sequences, it is possible for each of these al-ternative interpretations to be both self-consistent andconsistent with what is known about replicon size distri-butions and the arrangement of DNA in the nucleus.When more is learned about replicon size distributionsand intranuclear DNA positions and their relationshipsto replication foci, it will become possible to distinguishbetween these alternatives. We also note that the twoviews presented here are not mutually exclusive andmay provide equally valid interpretations of reality, albe-it with different emphases.
Interpretation A: the brighter foci contain multiple replicons, and these replicons complete synthesis within 45 min
In a particularly thorough pulse-chase-pulse study, Ma etal. (1998) demonstrated that the brighter replication fociin mouse 3T3 fibroblasts in early S-phase behave like ahomogeneous population with a replication lifetime of45 min. That is, red and green signals were completelyseparated from each other when the chase time was lon-ger than 45 min. Furthermore, the yellow signals (wherered and green overlapped) displayed the same size con-straints as the signals produced by simple pulses: vary-ing chase time affected the amount of yellow signal butnot the size distribution of yellow signals (Ma et al.1998). This argues strongly that each replication focus isan independent structural unit that increases in signal in-tensity but not in size until it completes replication. Inother words, absence of significant yellow after 45 minimplies completion of replication in 45 min, not move-ment of DNA labeled in the first pulse away from DNAlabeled in the second pulse. The latter possibility mightwell require an increase in replication focus size with in-creasing pulse time, which is not observed (Ma et al.1998). This interpretation is equally consistent with theexperimental results of Manders et al. (1992, 1996), whoshowed loss of most yellow overlap signals in less than60 min in V79 Chinese hamster cells.
Based on this interpretation, a significant portion ofmammalian replicons should be smaller than ~150 kbp,
the size of replicons that could be completed in 45 minat an average early S-phase bidirectional replication rateof 3.4 kbp/min (Jackson and Pombo 1998). The presenceof larger replicons is compatible with this view of theexperimental results if most of the larger replicons are insingle-replicon foci, because single-replicon foci wouldbe expected to give faint signals and may not have beendetected by the threshold-based methods employed byManders et al. (1992, 1996) or the direct visual methodused by Ma et al. (1998) for this experiment. Indeed,since single-replicon-containing replication foci have yetto be identified, it is conceivable that all such foci, ifthey exist, may not be detectable by current methods.
This view of the data is also compatible with the dis-tribution of large and small replicons suggested by thedetailed analysis of replication of the murine IgH regionby Ermakova et al. (1999). The IgH genes are part of alarge (~400 kbp) segment of DNA that is replicated by a single fork, from one end to the other, during most ofS-phase (see the generalized diagram in Fig. 4). This in-terpretation assumes that the replication focus containingthat single fork would have been too faint to be includedin the measurements (Manders et al. 1996; Ma et al.1998). The 400 kb IgH segment is flanked on each sideby segments containing multiple smaller replicons thatcomplete replication in a small portion of S-phase (thedata are compatible with completion within 45 min). Itseems likely that each of these two multi-replicon flank-ing segments may have given rise to a single replicationfocus, which, due to its content of multiple replicons,would have given brighter signals and therefore wouldhave been included in the study (Manders et al. 1996;Ma et al. 1998).
Interpretation B: some replicons complete replication in 45 min, but others do not
According to interpretation B, the disappearance ofoverlap between green and red foci after a 45 min chaseis attributable to two different effects. The first is identi-cal to that described above for interpretation A and ac-counts for the fact that in many cases after a chase of30–60 min, green and red foci appear far from each oth-er (Manders et al. 1996; Ma et al. 1998). The distancesof these foci from each other suggests that the first-pulsefoci that are far from second-pulse foci must have com-pleted replication during the first pulse or during thechase, and the second-pulse foci that are far from first-pulse foci must have initiated replication during thechase or second pulse, as proposed by interpretation A.
The second effect proposed by interpretation B is dif-ferent from interpretation A. The second effect is pro-posed to explain the fact that, in many other cases afterchases of 30–60 min, green and red foci appear relativelyclose to each other (Manders et al. 1996; Ma et al. 1998),and the average distance between them appears to in-crease with chase time. Indeed, computer-based analysisby Manders et al. (1996) of the distances (in three dimen-sions) between green and red foci as a function of chasetime suggests that on average red and green foci separate
481

from each other at a rate of ~0.5 µm/h when the chase time is varied from 0 to 65 min. Note that Man-ders et al. (1996) did not necessarily detect moving foci.Their data do not distinguish between continual motionof the first- and second-pulse foci with respect to eachother and the transient appearance of new second-pulsefoci at increasing (but fixed) distances from the first-pulse foci as chase time is increased. Since we are notaware of experimental observations suggesting move-ments of replication foci, we favor the second alternative,which is consistent with the possibility that some largereplicons may extend across more than one replicationfocus. If this is the case, then some foci labeled duringthe first pulse would necessarily remain physically closeto some foci labeled during the second pulse.
Note that the data of Manders et al. (1996) can alsobe explained by interpretation A, which would suggestthat separate replication foci that overlap temporally inactivity may frequently be close together spatially. Theincreased distance that Manders et al. (1996) measuredmay, therefore, be a consequence of new sites of replica-tion that become spatially more distant as the chase timebetween the two pulses increases. Thus while juxtaposi-tioning of replication foci offers the possibility of singlelarge replicons extending across more than one replica-tion focus, this possibility remains to be demonstratedexperimentally.
Both interpretations A and B are based on the stabili-ty of replication focus structure summarized earlier inthis review. Recall that the studies of Zink et al. (1998,1999) suggest that individual chromosomes occupy dis-crete portions of the nucleus (chromosome territories)and consist of linear fibers with the appearance ofstrings of closely packed beads, and the beads have di-ameters typical of replication foci (0.4–0.8 µm).
Let us assume for purposes of discussion that thesebeads are, indeed, replication foci at the time when theDNA in them is replicated, and that they are stable ele-ments of chromatin structure at all times. Exactly howDNA is packed within these beads/foci is not known, butone can imagine the DNA being packed in such a waythat, even after pulses as short as 1 min, the newly la-beled DNA would be distributed throughout the volumeof the bead. At longer pulse times, the newly synthe-sized DNA would continue to be restrained within thevolume of the bead, until all of the DNA in the bead hadbeen replicated. This would explain the observed pulse-length independence of replication focus volume (Ma etal. 1998; Zink et al. 1998).
To illustrate how some large replicons might extendacross two or more beads/foci, consider the diagram in Fig. 4, which generalizes the situation described byErmakova et al. (1999) – the case of a large DNA seg-ment separating an early replicating cluster from a latereplicating cluster. It seems likely that the early repli-cating and late replicating clusters would each form their own beads and function as independent replicationfoci, but what about the long intervening DNA segment?We suggest that this segment may also form one or more beads with their own fixed structure. The results(Ermakova et al. 1999) indicate that the origin responsi-
ble for replicating the long segment is part of the earlyreplicating cluster. Thus, if our supposition that the earlyreplicating cluster and long segment form differentbeads is correct, the replicon of which the long segmentis a part should extend into at least two adjacent beads,possibly into a third (the bead formed by the late-firingcluster).
Based on these considerations, the following scenarioseems likely in the case of the IgH region described byErmakova et al. (1999) and similar situations. A replica-tion focus containing a cluster of small, early firing rep-licons completes replication in early S-phase (Fig. 4, ear-ly S). A replication fork at an end of the cluster continueson into the next replication focus. In this particular case,the proposed replication focus contains only half a repli-con – just a single replication fork – and is active in mid-S-phase (Fig. 4, mid S) as well as in portions of early andlate S-phase. In late S-phase, the adjacent replication fo-cus containing a cluster of small, late-firing replicons ini-tiates replication, and forks from the long segment andthe late cluster meet and terminate (Fig. 4, late S).
This example (Fig. 4) deals with the case of repliconsso long that a large portion of S-phase is required to rep-licate them completely. One can imagine, however, thatthere may be a limit to the length of DNA that can fitwithin a single bead/focus, and this length limit may dic-tate that all replicons requiring more than 45 min tocomplete their replication must extend across more thanone bead. This would simultaneously explain the obser-vation that a significant portion of second-pulse foci ap-pears close to first-pulse foci (Manders et al. 1996; Maet al. 1998) and the observation that replication foci pos-sess pulse length-independent volumes (Ma et al. 1998)that are preserved during the cell cycle (Jackson andPombo 1998; Ma et al. 1998). This interpretation can ac-commodate replicons of any size, because large repl-icons can be packed into multiple beads/foci. The onlyconstraint is that, in the case of the brighter beads/foci,the amount of DNA and number of replication forks perfocus must be consistent with completion of replicationin that focus within 45 min (Ma et al. 1998).
In summary, we propose two models (which are notmutually exclusive) for replication foci. These modelscombine the properties of (i) an approximately 45 mintime limit for replication at brighter foci and (ii) the like-ly presence of much larger replicons that take much lon-ger than 45 min to complete replication. According tothe first model, the larger replicons produce fainter sig-nals and thus were not included in the measurements,suggesting a 45 min maximum time to complete replica-tion in most foci. According to the second model, singlelarge replicons may be packaged into two or more repli-cation foci. Organization of large replicons into multiplefoci may provide a means for organizing and coordinat-ing their replication through S-phase.
Conclusions
We hope that the evidence we have reviewed has con-vinced the reader, as it has us, that it is no longer accu-
482

rate to describe replication foci as representing exclu-sively clusters of relatively large numbers of relativelysmall replicons. Indeed, many foci probably do containlarge numbers of small replicons, but it also appears thatsome foci contain just one replicon. The data suggestthat there is a continuum in the number of replicons perfocus, ranging from one to ten or more, but the lownumbers (one to five replicons per focus) predominate(Jackson and Pombo 1998). Whatever the number ofreplicons per focus, the data suggest that foci are stablechromatin structures that persist during the entire cellcycle, even in mitosis (Sparvoli et al. 1994; Ferreira etal. 1997; Jackson and Pombo 1998; Ma et al. 1998).Thus all chromatin fibers appear to be strings of struc-tures with the same size and shape as the replication focivisualized by pulse labeling with a DNA precursor (Zinket al. 1998), and these structures may be stabilized bythe same small set of proteins that stabilizes chromo-some territories (Ma et al. 1999). Moreover recent datasuggest that individual replication foci are further orga-nized into even higher order chromatin domains or “nu-clear replication zones” that are completely segregatedspatially from similarly organized “transcription zones”(Wei et al. 1998).
Both older fiber autoradiographic data and newer re-sults obtained with modern replicon-mapping methodsprovide evidence for the existence and relative abun-dance of replicons much larger than previously consid-ered – replicons so long that most or all of S-phase is re-quired to complete them. It is equally clear that theselarge replicons co-exist in the same cell with smallerreplicons, including some so small that only minutes areneeded for their replication. Current methods do not al-low determination of the relative abundances of rep-licons of different sizes, but it is probably a mistake tocontinue assuming that the average replicon size inmammalian cells is ~100 kbp. The average is likely tobe larger.
The data show that many replication foci fire duringearly S-phase, while many others fire in late S-phase.Although these two sets of foci share similar sizes, theyoccupy different locations in the nucleus and on chromo-somal bands. Thus there is an intimate relationship be-tween replication foci and control of replication timing.Virtually nothing other than phenomenology is currentlyknown about control of replication timing in mammaliancells; this is clearly an important area for future re-search.
Obtaining a full understanding of replicons and repli-cation foci will also require learning more about the na-ture of mammalian replication origins, about relation-ships between replication and transcription, about the ef-fects of transcriptional regulation on replication controland about the arrangement of DNA/chromatin in the in-terphase nucleus.
The studies we have reviewed point to extreme het-erogeneity within the mammalian nucleus with regard toreplicon sizes, replicon clustering and replication foci.The only way in which the full extent of this heterogene-ity and its biological relevance will be revealed and un-derstood is through numerous detailed studies at the lev-
el of small regions (a few adjoining replication bands,perhaps) within individual chromosomes. These studieswill need to combine replicon and timing analyses (simi-lar to the work of Ermakova et al. 1999) with combinedFISH and BrdUrd labeling to identify the specific DNAsequences and replicons present in single replication foci. Much remains to be done, but the fascinating re-sults obtained in the studies reviewed here suggest thatthe story will continue to be interesting and exciting aswe continue to make progress and obtain a more detailedunderstanding of replicons in relationship to replicationfoci.
References
Blumenthal AB, Kriegstein HJ, Hogness DS (1973) The units ofDNA replication in Drosophila melanogaster chromosomes.Cold Spring Harbor Symp Quant Biol 38:205–223
Cremer T, Kurz A, Zirb el R, Dietzel S, Rinke B, Schröck E,Speicher MR, Mathieu U, Jauch A, Emmerich P, Scherthan H,Ried T, Cremer C, Lichter P (1993) The role of chromosometerritories in the functional compartmentalization of the cellnucleus. Cold Spring Harbor Symp Quant Biol 58:777–792
Dijkwel PA, Hamlin JL (1992) Initiation of DNA replication inthe dihydrofolate reductase locus is confined to the early S pe-riod in CHO cells synchronized with the plant amino acid mi-mosine. Mol Cell Biol 12:3715–3722
Dijkwel PA, Vaughn JP, Hamlin JL (1994) Replication initiationsites are distributed widely in the amplified CHO dihydrofo-late reductase domain. Nucleic Acids Res 22:4989–4996
Drouin R, Lemieux N, Richer C-L (1990) Analysis of DNA repli-cation during S-phase by means of dynamic chromosomebanding at high resolution. Chromosoma 99:273–280
Drouin R, Holmquist G, Richer C-L (1994) High resolution repli-cation bands compared with morphologic G- and R-bands.Adv Hum Genet 22:47–115
Dubey DD, Raman R (1987a) Do sister forks of bidirectionallygrowing replicons proceed at unequal rates? Exp Cell Res168:555–560
Dubey DD, Raman R (1987b) Factors influencing replicon orga-nization in tissues having different S-phase durations in themole rat, Bandicota bengalensis. Chromosoma 95:285–289
Edenberg HJ, Huberman JA (1975) Eucaryotic chromosome repli-cation. Annu Rev Genet 9:245–284
Ermakova OV, Nguyen LH, Little RD, Chevillard C, Riblet R,Ashouian N, Birshtein BK, Schildkraut CL (1999) Evidencethat a single replication fork proceeds from early to late repli-cating domains in the IgH locus in a non-B cell line. Mol Cell3:321–330
Ferreira J, Paolella G, Ramos C, Lamond AI (1997) Spatial orga-nization of large-scale chromatin domains in the nucleus: amagnified view of single chromosome territories. J Cell Biol139:1597–1610
Fox MH, Arndt-Jovin DJ, Jovin TM, Baumann PH, Robert-Nicoud M (1991) Spatial and temporal distribution of DNAreplication sites localized by immunofluorescence and confo-cal microscopy in mouse fibroblasts. J Cell Sci 99:247–253
Hand R (1978) Eucaryotic DNA: organization of the genome forreplication. Cell 15:317–325
Hassan AB, Cook PR (1993) Visualization of replication sites inunfixed human cells. J Cell Sci 105:541–550
Housman D, Huberman JA (1975) Changes in the rate of DNAreplication fork movement during S phase in mammaliancells. J Mol Biol 94:173–181
Huberman JA, Riggs AD (1966) Autoradiography of chromosom-al DNA fibers from Chinese hamster cells. Proc Natl Acad SciUSA 55:599–606
483

Huberman JA, Riggs AD (1968) On the mechanism of DNA rep-lication in mammalian chromosomes. J Mol Biol 32:327–341
Huberman JA, Tsai A (1973) Direction of DNA replication inmammalian cells. J Mol Biol 75:5–12
Hyrien O, Mechali M (1993) Chromosomal replication initiatesand terminates at random sequences but at regular intervals inthe ribosomal DNA of Xenopus early embryos. EMBO J 12:4511–4520
ISCN (1995) An international system for human cytogenetic no-menclature. S. Karger, Basel
Jackson DA, Pombo A (1998) Replicon clusters are stable units ofchromosome structure: evidence that nuclear organizationcontributes to the efficient activation and propagation of Sphase in human cells. J Cell Biol 140:1285–1295
Liapunova NA (1994) Organization of replication units and DNAreplication in mammalian cells as studied by DNA fiber auto-radiography. Int Rev Cytol 154:261–308
Looney JE, Hamlin JL (1987) Isolation of the amplified dihydro-folate reductase domain from methotrexate-resistant Chinesehamster ovary cells. Mol Cell Biol 7:569–577
Ma H, Samarabandu J, Devdhar RS, Acharya R, Cheng P-C,Meng C, Berezney R (1998) Spatial and temporal dynamics ofDNA replication sites in mammalian cells. J Cell Biol 143:1415–1425
Ma H, Siegel AJ, Berezney R (1999) Association of chromosometerritories with the nuclear matrix: disruption of human chro-mosome territories correlates with the release of a subset ofnuclear matrix proteins. J Cell Biol 146:531–541
Manders EMM, Stap J, Brakenhoff GJ, van Driel R, Aten JA(1992) Dynamics of three-dimensional replication patternsduring the S-phase analyzed by double labelling of DNA andconfocal microscopy. J Cell Sci 103:857–862
Manders EMM, Strap J, Strackee J, van Driel R, Aten JA (1996)Dynamic behavior of DNA replication domains. Exp Cell Res226:328–335
Nakamura H, Morita T, Sato C (1986) Structural organizations ofreplicon domains during DNA synthetic phase in the mamma-lian nucleus. Exp Cell Res 165:291–297
Nakayasu H, Berezney R (1989) Mapping replicational sites inthe eucaryotic cell nucleus. J Cell Biol 108:1–11
Neri LM, Mazzotti G, Capitani S, Maraldi NM, Cinti C, BaldiniN, Rana R, Martelli AM (1992) Nuclear matrix-bound repli-
cational sites detected in situ by 5-bromodeoxyuridine. Histo-chemistry 98:19–32
O’Keefe RT, Henderson SC, Spector DL (1992) Dynamic organi-zation of DNA replication in mammalian cell nuclei: spatiallyand temporally defined replication of chromosome-specific α-satellite DNA sequences. J Cell Biol 116:1095–1110
Pasero P, Braguglia D, Gasser SM (1997) ORC-dependent and or-igin-specific initiation of DNA replication at defined foci inisolated yeast nuclei. Genes Dev 11:1504–1518
Schmid M, Guttenbach M (1988) Evolutionary diversity of re-verse (R) fluorescent chromosome bands in vertebrates. Chro-mosoma 97:104–114
Sparvoli E, Levi M, Rossi E (1994) Replicon clusters may formstructurally stable complexes of chromatin and chromosomes.J Cell Sci 107:3097–3103
Stimac E, Housman D, Huberman JA (1977) Effects of inhibitionof protein synthesis on DNA replication in cultured mammali-an cells. J Mol Biol 115:485–511
van Dierendonck JH, Keyzer R, van de Velde CJH, Cornelisse CJ(1989) Subdivision of S-phase by analysis of nuclear 5-bromodeoxyuridine staining patterns. Cytometry 10:143–150
Vaughn JP, Dijkwel PA, Hamlin JL (1990) Replication initiates ina broad zone in the amplified CHO dihydrofolate reductasedomain. Cell 61:1075–1087
Verbovaia LV, Razin SV (1997) Mapping of replication originsand termination sites in the Duchenne muscular dystrophygene. Genomics 45:24–30
Wei X, Samarabandu J, Devdhar RS, Siegel AJ, Acharya R, Berezney R (1998) Segregation of transcription and replica-tion sites into higher order domains. Science 281:1502–1505
Yurov YB (1980) Rate of DNA replication fork movement withina single mammalian cell. J Mol Biol 136:339–342
Yurov YB, Liapunova NA (1977) The units of DNA replication inthe mammalian chromosomes: evidence for a large size ofreplication units. Chromosoma 60:253–267
Zink D, Cremer T, Saffrich R, Fischer R, Trendelenburg MF, Ansorge W, Stelzer EHK (1998) Structure and dynamics ofhuman interphase chromosome territories in vivo. Hum Genet102:241–251
Zink D, Bornfleth H, Visser A, Cremer C, Cremer T (1999) Orga-nization of early and late replicating DNA in human chromo-some territories. Exp Cell Res 247:176–188
484
Related Documents