HERI Faculty Survey 2004-2005 Selected IVCC Results Office of Institutional Research

HERI Faculty Survey
Dec 30, 2015
HERI Faculty Survey. 2004-2005 Selected IVCC Results Office of Institutional Research. HERI. Based in the Graduate School of Education & Information Studies at the University of California, Los Angeles Sixth in a series of national faculty surveys Conducted every 3 yrs since 1989-1990 - PowerPoint PPT Presentation
Welcome message from author
This document is posted to help you gain knowledge. Please leave a comment to let me know what you think about it! Share it to your friends and learn new things together.
Transcript
HERI Faculty Survey
2004-2005
Selected IVCC ResultsOffice of Institutional Research

HERI
• Based in the Graduate School of Education & Information Studies at the University of California, Los Angeles
• Sixth in a series of national faculty surveys
• Conducted every 3 yrs since 1989-1990
• 2004-2005 = 1st IVCC Faculty Participation

Higher Education Research Institute
• 421 Colleges & Universities participated
• “faculty member” = any full-time employee of an accredited college or university who spends at least part of his/her time teaching undergraduates
• Data reported separately for men & women faculty

2004-2005 HERI Faculty Survey
• Includes new items relating to remedial & developmental education, community service & spirituality
• 41 Public 2-Yr Colleges in the norm group; 2678 faculty
• 35% participation rate required to be counted in the norm group
• IVCC had 51/82 = 62% survey participation rate; 23 men & 28 women

Survey Focus
• Demographics
• How faculty members spend their time
• How they interact with their students
• Their preferred methods of teaching
• Their perceptions of institutional climate
• Their primary sources of stress and satisfaction.

Age of IVCC Faculty: Women v Men
0.0%
5.0%
10.0%
15.0%
20.0%
25.0%
30.0%
35.0%
<30 30-34 35-39 40-44 45-49 50-54 55-59 60-64 65-69 70+
Women Men

Age of Faculty: IVCC v Public 2YR
0.0%
5.0%
10.0%
15.0%
20.0%
25.0%
<30 30-34 35-39 40-44 45-49 50-54 55-59 60-64 65-69 70+
Per
cen
t o
f T
ota
l
IVCC Public 2YR

Children Under 18:by Gender and Institution
0.0%
10.0%
20.0%
30.0%
40.0%
50.0%
60.0%
70.0%
None One Two Three Four +
Women Men IVCC Public 2YR
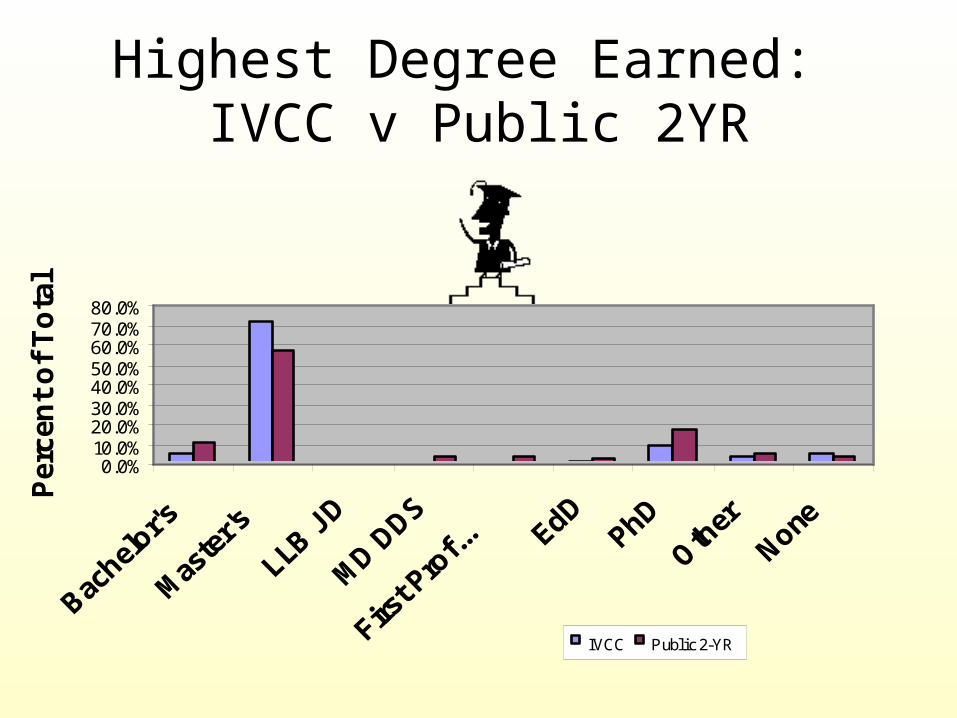
Highest Degree Earned: IVCC v Public 2YR
0.0%10.0%20.0%30.0%40.0%50.0%60.0%70.0%80.0%
Per
cen
t o
f T
ota
l
IVCC Public 2-YR

Goals for Undergraduate Education(“Very Important” or “Essential”)
IVCC Women Men Public-2YR
Develop ability to think critically 98.0 96.4 100.0 98.5
Help master knowledge in a discipline 86.3 89.3 82.6 92.1
Prepare for employment after college 84.3 89.3 78.3 83.1
Promote ability to write effectively 74.5 78.6 69.6 82.8
Develop moral character 62.0 77.8 43.5 66.6
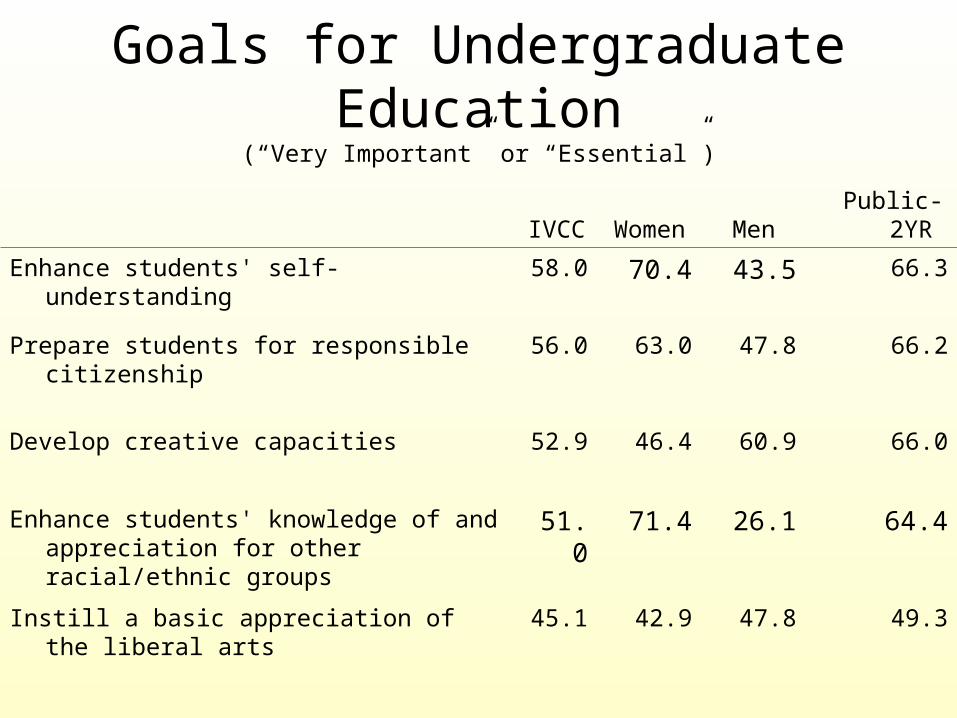
Goals for Undergraduate Education(“Very Important” or “Essential”)
IVCC Women Men Public-
2YR
Enhance students' self-understanding 58.0 70.4 43.5 66.3
Prepare students for responsible citizenship 56.0 63.0 47.8 66.2
Develop creative capacities 52.9 46.4 60.9 66.0
Enhance students' knowledge of and appreciation for other racial/ethnic groups
51.0 71.4 26.1 64.4
Instill a basic appreciation of the liberal arts 45.1 42.9 47.8 49.3
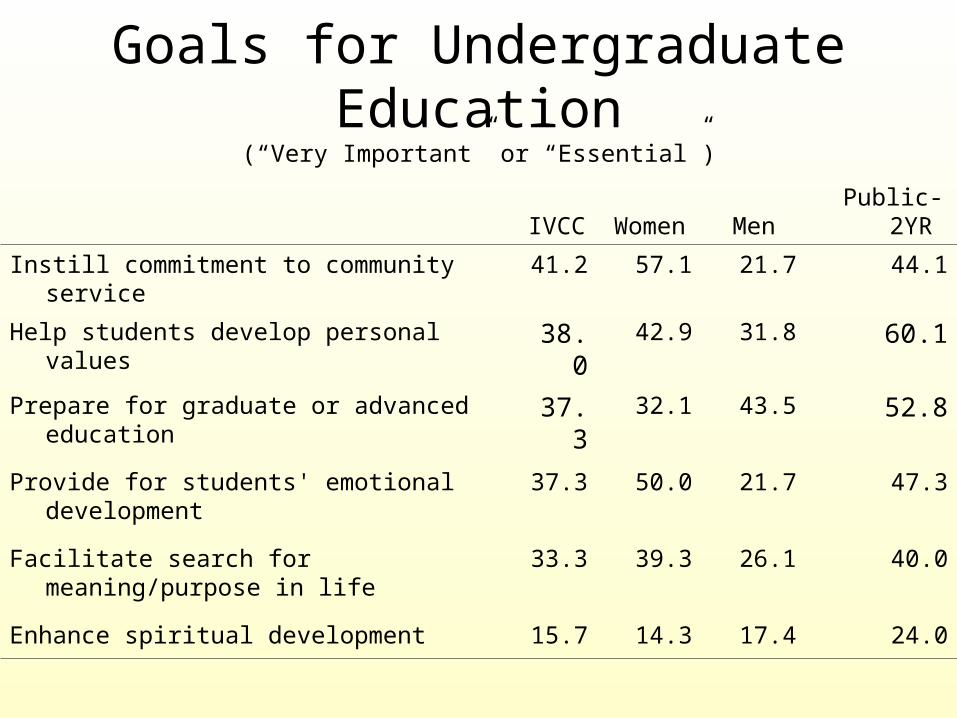
Goals for Undergraduate Education(“Very Important” or “Essential”)
IVCC Women Men Public-
2YR
Instill commitment to community service 41.2 57.1 21.7 44.1
Help students develop personal values 38.0 42.9 31.8 60.1
Prepare for graduate or advanced education 37.3 32.1 43.5 52.8
Provide for students' emotional development 37.3 50.0 21.7 47.3
Facilitate search for meaning/purpose in life 33.3 39.3 26.1 40.0
Enhance spiritual development 15.7 14.3 17.4 24.0

Underprepared Students
Faculty Views on Underprepared Students (percentages)
Agree "somewhat" or "strongly" IVCC Women Men Public 2-YR
Faculty feel that most students are well-prepared academically
24.0 32.1 13.6 21.5
Most of the students I teach lack the basic skills for college level work
52.0 53.6 50.0 65.4

Approaches to TeachingFaculty Approaches to Teaching and Evaluation (percentages)
Teaching/evaluation method used in "most" or "all" classes
IVCC Women Men Public 2-YR
Class discussion 88.0 92.9 81.8 83.7
Extensive lecturing 60.0 50.0 72.7 54.7
Multiple choice mid-term and/or final exams 56.0 67.9 40.9 49.0
Reflective writing/journaling 36.0 50.0 18.2 19.6
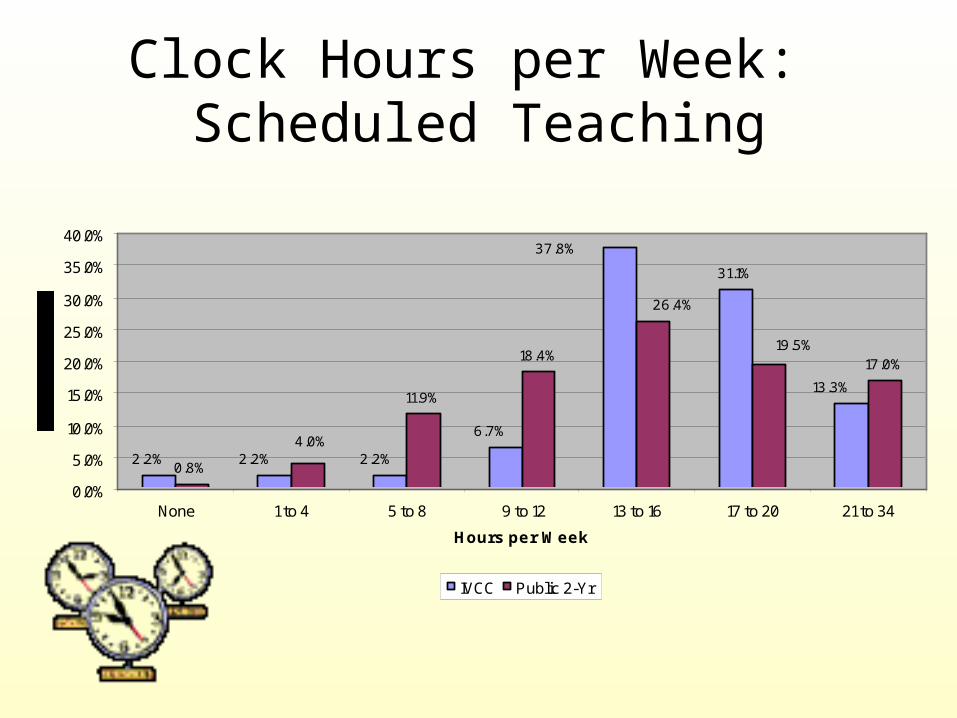
Clock Hours per Week: Scheduled Teaching
31.1%
0.8%
11.9%
18.4%17.0%
2.2% 2.2% 2.2%
6.7%
13.3%
37.8%
4.0%
19.5%
26.4%
0.0%
5.0%
10.0%
15.0%
20.0%
25.0%
30.0%
35.0%
40.0%
None 1 to 4 5 to 8 9 to 12 13 to 16 17 to 20 21 to 34
Hours per Week
IVCC Public 2-Yr

Clock Hours per Week: Preparing to Teach
10.8%
25.5%
16.7%
2.1%
14.6%14.6%16.7%
22.9%
6.3%
9.1%
12.9%14.0%
23.7%
0.5%
0.0%
5.0%
10.0%
15.0%
20.0%
25.0%
30.0%
None 1 to 4 5 to 8 9 to 12 13 to16 17 to 20 21 to 34
Hours per Week
IVCC Public 2-YR

Clock Hours per Week:Committee Work + Meetings
8.5%
2.1%0.0%
12.8%8.5%
66.0%
0.2%1.0%3.0%
15.8%
12.8%
67.0%
0.0%
10.0%
20.0%
30.0%
40.0%
50.0%
60.0%
70.0%
80.0%
None 1 to 4 5 to 8 9 to 12 13 to 16 17 to 20
Hours per Week
IVCC Public 2-YR
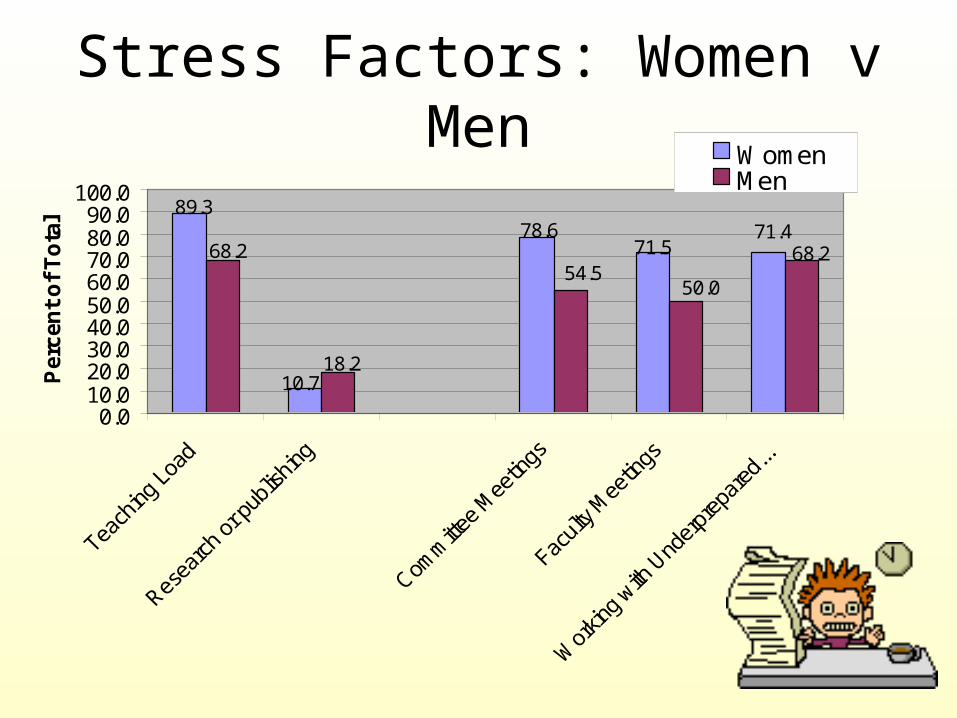
Stress Factors: Women v Men
89.3
71.578.6 71.4
10.718.2
68.2
50.054.5
68.2
0.010.020.030.040.050.060.070.080.090.0
100.0
Per
cen
t o
f T
ota
l
WomenMen
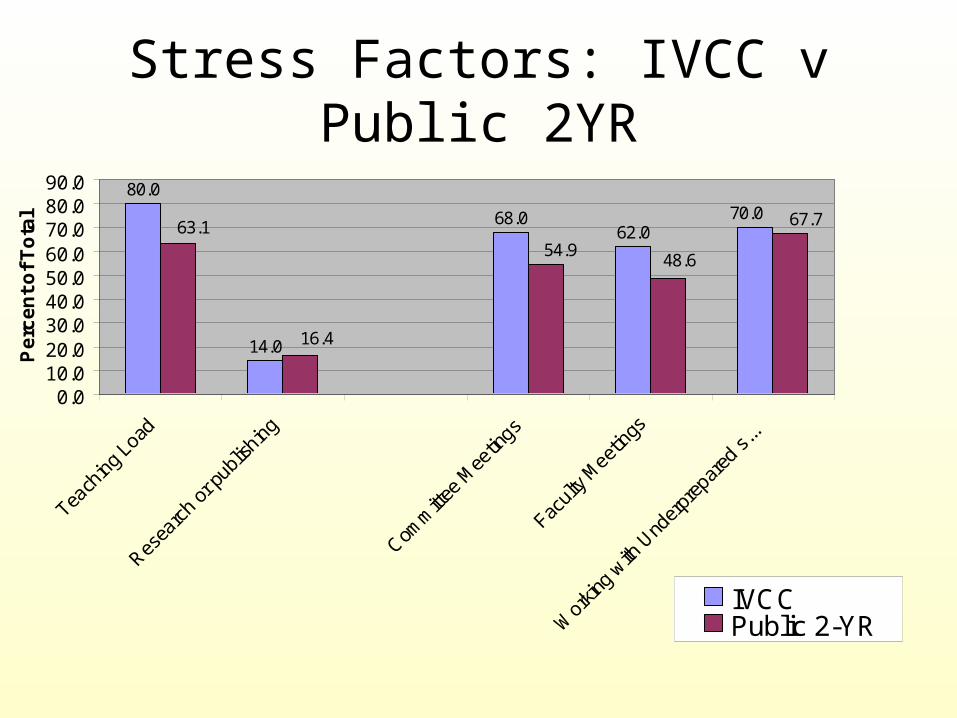
Stress Factors: IVCC v Public 2YR
80.0
14.0
68.062.0
70.0 67.7
48.654.9
16.4
63.1
0.010.020.030.040.050.060.070.080.090.0
Teach
ing L
oad
Resea
rch
or p
ublis
hing
Comm
ittee
Mee
tings
Facult
y Mee
tings
Wor
king
with U
nder
prep
ared
s...
Pe
rce
nt
of
To
tal
IVCCPublic 2-YR

Sources of Stress: Women v Men
53.6
78.6
27.3
85.7
0.0
10.0
20.0
30.0
40.0
50.0
60.0
70.0
80.0
90.0
Review and Promotion Process Self-Imposed High Expectations
Pe
rce
nt
of
To
tal
WOMEN MEN

Sources of Stress: IVCC v Public 2YR
42.0
81.6
37.1
74.2
0.0
10.0
20.0
30.0
40.0
50.0
60.0
70.0
80.0
90.0
Review and Promotion Process Self-Imposed High Expectations
Pe
rce
nt
of
To
tal
IVCC PUBLIC 2yr

Personal Sources of Stress
43.7%
60.0%
71.4%
81.3%
26.0%
54.7%
60.6%
74.3%
0.0% 10.0% 20.0% 30.0% 40.0% 50.0% 60.0% 70.0% 80.0% 90.0%
Child Care
Physical Health
Personal Finances
Householdresponsibilities
Pub 2 yr
IVCC
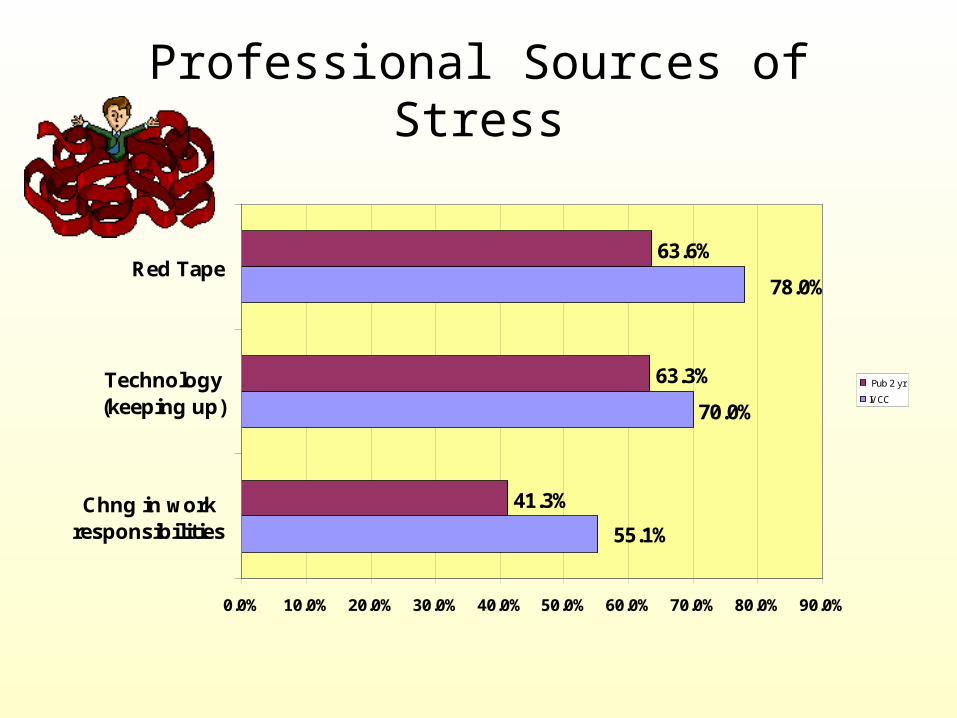
Professional Sources of Stress
70.0%
41.3%
63.3%
63.6%
55.1%
78.0%
0.0% 10.0% 20.0% 30.0% 40.0% 50.0% 60.0% 70.0% 80.0% 90.0%
Chng in workresponsibilities
Technology(keeping up)
Red Tape
Pub 2 yr
IVCC
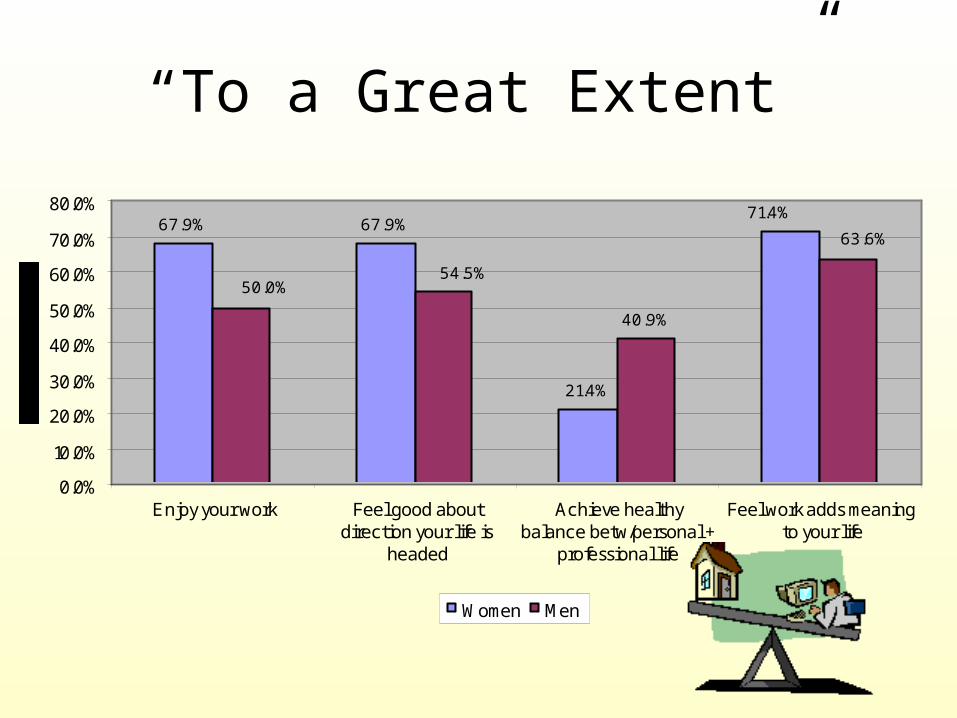
“To a Great Extent”
67.9% 67.9%
21.4%
40.9%
71.4%
63.6%
50.0%54.5%
0.0%
10.0%
20.0%
30.0%
40.0%
50.0%
60.0%
70.0%
80.0%
Enjoy your work Feel good aboutdirection your life is
headed
Achieve healthybalance betw/personal +
professional life
Feel work adds meaningto your life
Women Men
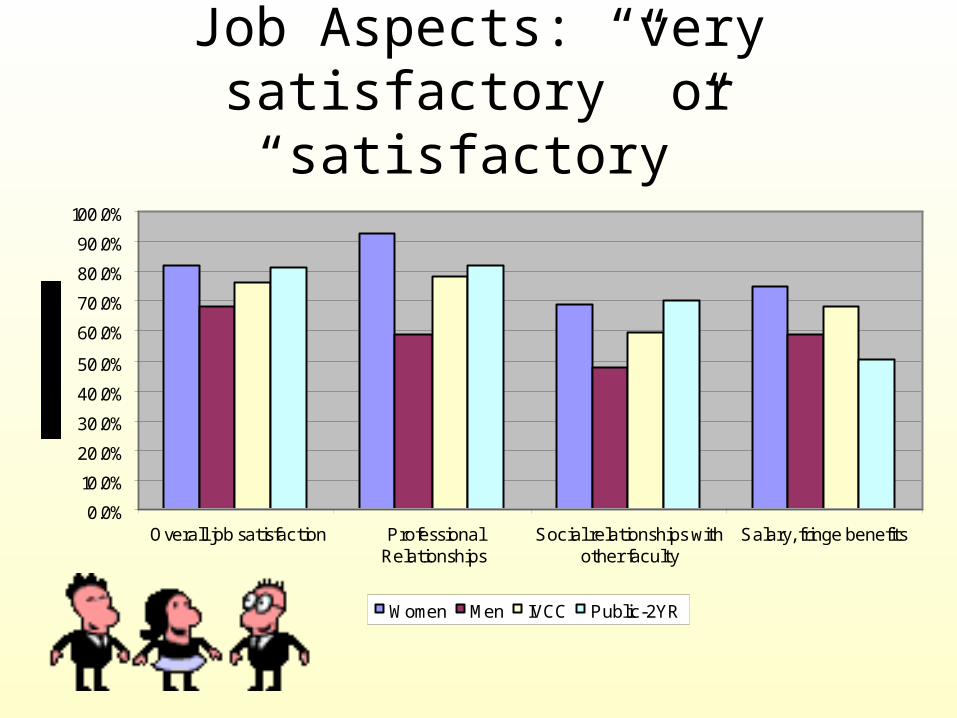
Job Aspects: “very satisfactory” or “satisfactory”
0.0%
10.0%
20.0%
30.0%
40.0%
50.0%
60.0%
70.0%
80.0%
90.0%
100.0%
Overall job satisfaction ProfessionalRelationships
Social relationships withother faculty
Salary, fringe benefits
Women Men IVCC Public-2YR

Faculty Relationship w/ Administration
0.0%
10.0%
20.0%
30.0%
40.0%
50.0%
60.0%
70.0%
80.0%
Relationship with administration "very satisfactory"or "satisfactory'
Faculty at odds w/ Administration
Women Men IVCC Public-2YR
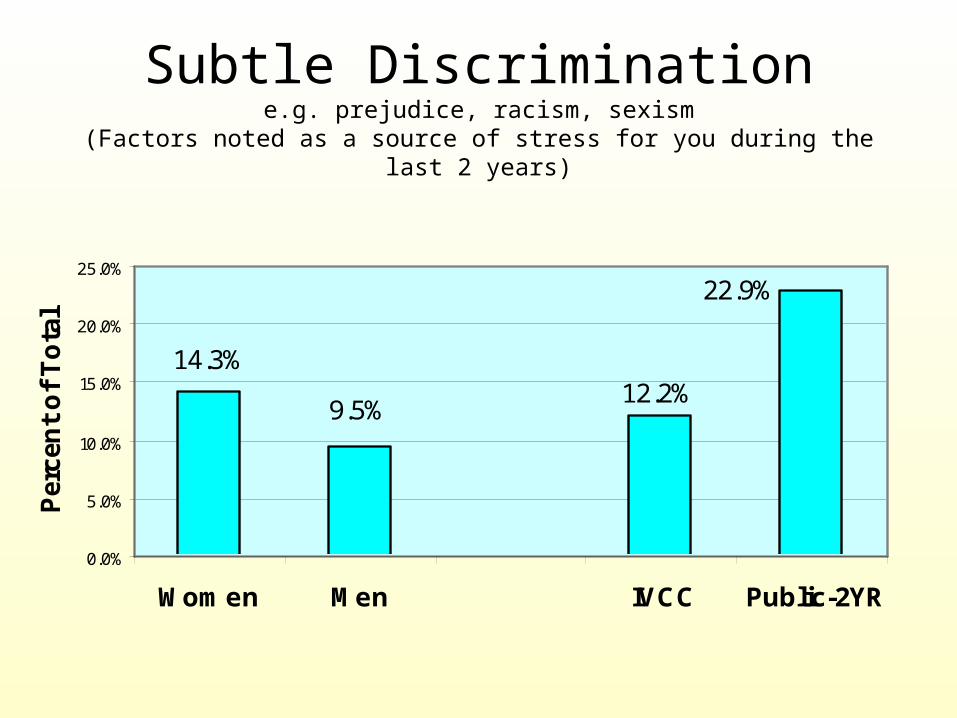
Subtle Discriminatione.g. prejudice, racism, sexism
(Factors noted as a source of stress for you during the last 2 years)
22.9%
12.2%9.5%
14.3%
0.0%
5.0%
10.0%
15.0%
20.0%
25.0%
Women Men IVCC Public-2YR
Per
cen
t o
f T
ota
l
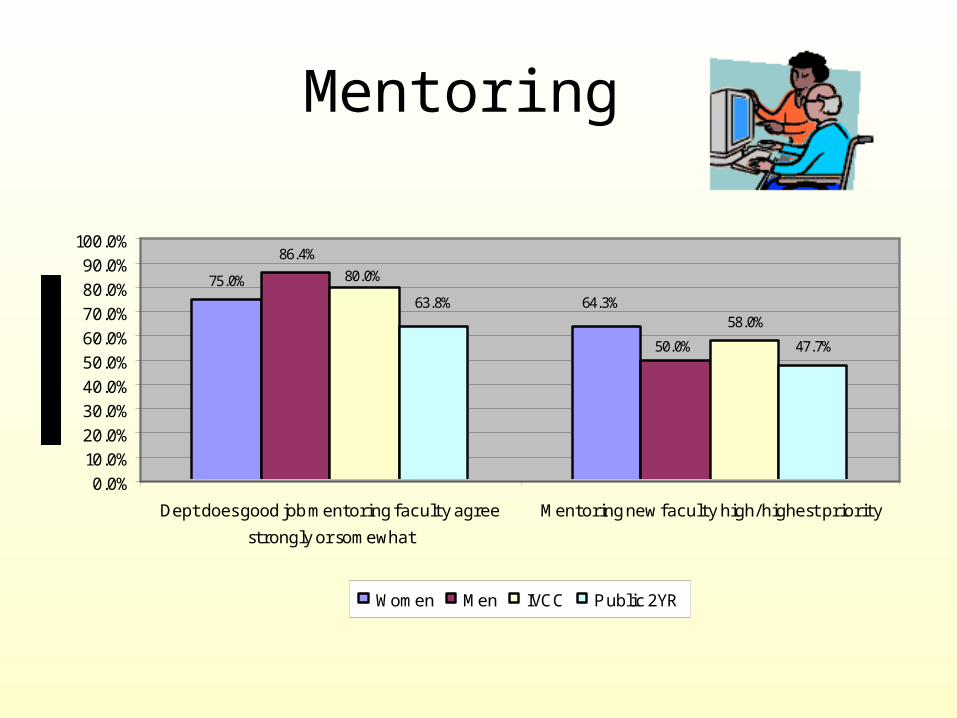
Mentoring
75.0%
86.4%
58.0%
47.7%
64.3%
50.0%
80.0%
63.8%
0.0%10.0%20.0%30.0%40.0%50.0%60.0%70.0%80.0%90.0%
100.0%
Dept does good job mentoring faculty agree
strongly or somewhat
Mentoring new faculty high/highest priority
Women Men IVCC Public 2YR

It’s the Teaching
0.0%
10.0%
20.0%
30.0%
40.0%
50.0%
60.0%
70.0%
80.0%
90.0%
100.0%
Teaching is PrincipleActivity
Being a Good Teacheris Personal Goal
My teaching is valued byfaculty in my dept
Faculty are rewarded forbeing good teachers
Women Men IVCC Public -2YR
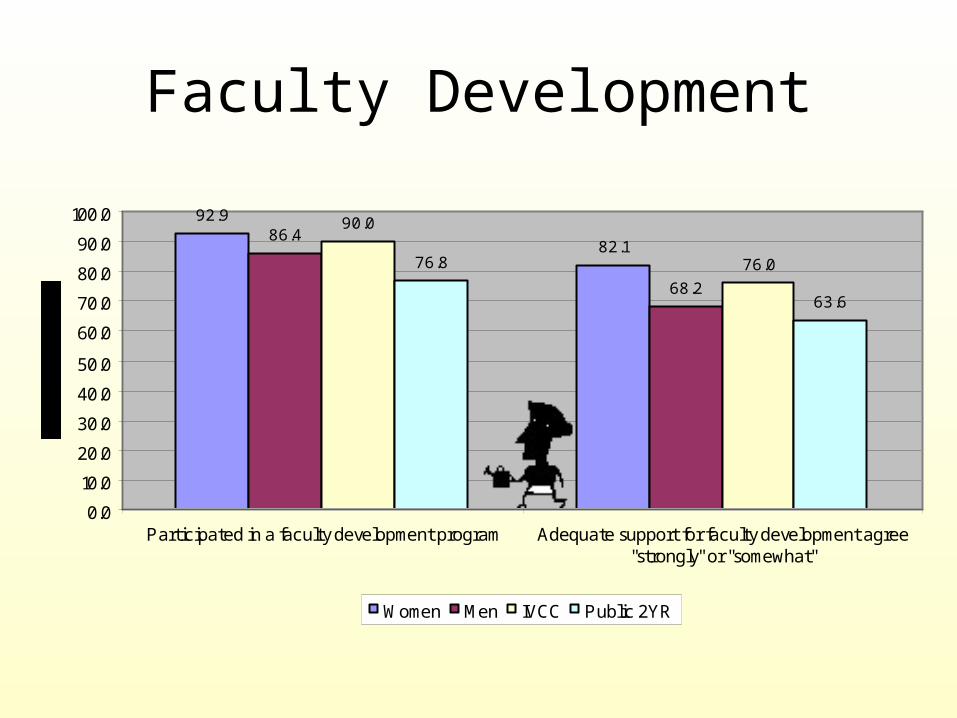
Faculty Development
92.9
82.186.4
68.2
90.0
76.076.8
63.6
0.0
10.0
20.0
30.0
40.0
50.0
60.0
70.0
80.0
90.0
100.0
Participated in a faculty development program Adequate support for faculty development agree"strongly" or "somewhat"
Women Men IVCC Public 2YR

Priority Issues
0.0
20.0
40.0
60.0
80.0
100.0
Promote intellectualdevelopment of students
Develop sense ofcommunity among students
and faculty
Help students learn how tobring about change in
American society
Per
cen
t o
f T
ota
l
Women Men IVCC Public 2YR
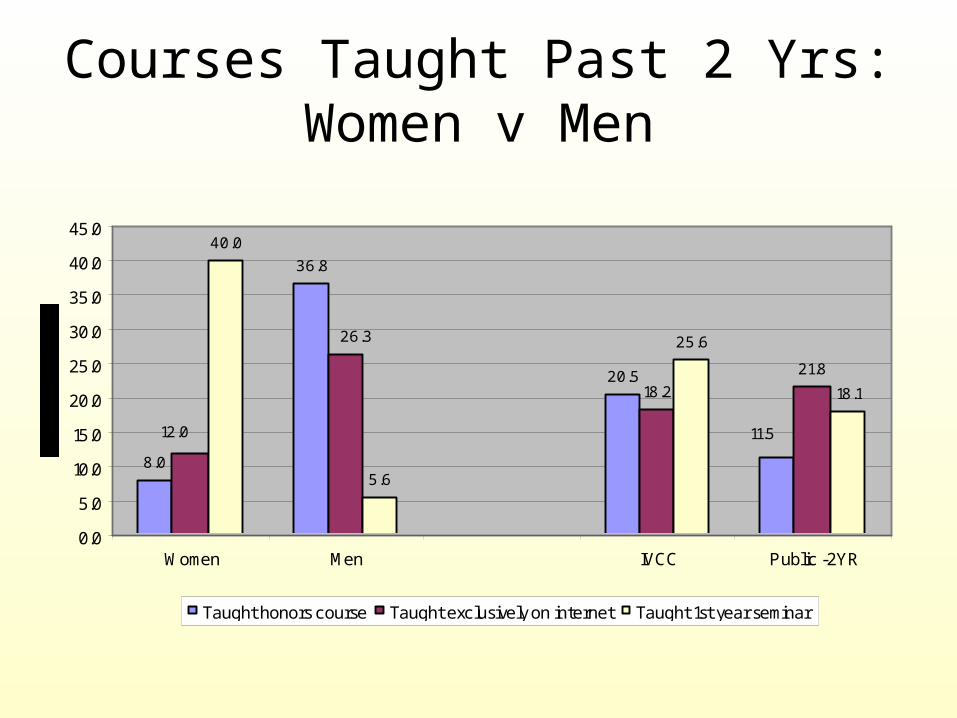
Courses Taught Past 2 Yrs:Women v Men
8.0
36.8
20.5 21.8
40.0
5.6
25.6
18.1
11.5
18.2
26.3
12.0
0.0
5.0
10.0
15.0
20.0
25.0
30.0
35.0
40.0
45.0
Women Men IVCC Public -2YR
Taught honors course Taught exclusively on internet Taught 1st year seminar

So Where Do We Go From Here?
• To Infinity and Beyond…………………..
Related Documents