Weaning and Post-weaning Management of Calves and Heifers for Optimizing Long-term Productivity Mike Van Amburgh and Rodrigo Molano-Torres Dept. of Animal Science Email:[email protected]; cell: 607-592-1212 Overview of today’s discussion • Introduction • Focus on weaning and starter intake and composition • Nutrition formulation and benchmarking related to stage of growth and mature size – still a big problem • Summary Herd Replacement Objectives • Focus on return on investment – over their productive life • Minimize non‐completion (animals that are born and either never milk or finish a lactation) • Optimize the productivity of the animal (manage them for their genetic potential starting at birth) Snapshot Evaluation of the Potential Quality of The Replacement • 1st Calf Heifers “Treated” as Calf/Heifer* ≤30% 24 hrs. 3 mos. ____, 4 mos. fresh ____ • DOAs in first calf heifers ≤7% Male DOAs. ____, Female DOAs ____ • 1st Calf avg. peak ≥80% of Mature 1st Calf lactation total yield ≥80% of Mature • 1st Calf Culls ≤ 60 Days in Milk ≤5% • 1st Calf ME’s ≥Mature • 1st Calf “Treated” in Lactation* ≤15% • 85% retention (any herd) to 2nd lactation ≥85% • Lower #1 reason for 1st lact. culls(continuous improvement)

Welcome message from author
This document is posted to help you gain knowledge. Please leave a comment to let me know what you think about it! Share it to your friends and learn new things together.
Transcript

Weaning and Post-weaning Management of Calves and Heifers for Optimizing Long-term
Productivity
Mike Van Amburgh and Rodrigo Molano-TorresDept. of Animal Science
Email:[email protected]; cell: 607-592-1212
Overview of today’s discussion
• Introduction
• Focus on weaning and starter intake and composition
• Nutrition formulation and benchmarking related to stage of growth and mature size – still a big problem
• Summary
Herd Replacement Objectives
• Focus on return on investment – over their productive life
• Minimize non‐completion (animals that are born and either never milk or finish a lactation)
• Optimize the productivity of the animal (manage them for their genetic potential starting at birth)
Snapshot Evaluation of the Potential Quality of The Replacement
• 1st Calf Heifers “Treated” as Calf/Heifer* ≤30% 24 hrs. 3 mos. ____, 4 mos. fresh ____
• DOAs in first calf heifers ≤7% Male DOAs. ____, Female DOAs ____
• 1st Calf avg. peak ≥80% of Mature 1st Calf lactation total yield ≥80% of Mature
• 1st Calf Culls ≤ 60 Days in Milk ≤5% • 1st Calf ME’s ≥Mature • 1st Calf “Treated” in Lactation* ≤15% • 85% retention (any herd) to 2nd lactation ≥85% • Lower #1 reason for 1st lact. culls(continuous improvement)

• Behavior is most likely the primary factor affecting a majority of thestudies that have evaluated calf starter intake and preferences.
• A calf under natural conditions would learn to consume feed fromthe dam and be encouraged and taught to do so as it developed andbecame physiologically ready for that type of diet.
• Several studies have been conducted on feeding behavior of grazinganimals and it is clear that the dam teaches the calf what to eat andhow to eat under those management conditions (Howery, L. D., etal. 1998; Provenza, 2005).
• Under most of the conditions we offer calves starter grain, there arebarriers to learning that affect the how the calf views and acceptsthe starter grain as a food source.
Weaning and Dry Matter Intake of Starter• Our way of managing that learning has been to limit the nutrients
from milk or milk replacer in an effort to enhance hunger so theyare encouraged to consume nutrients from other sources.
• Having calves of somewhat varying ages in group housed conditionshelps with the learning process because the older calves providelessons in eating behavior for the calves not yet experienced enoughto understand where and what the starter grain might be.
• Creating an environment that allows calves to teach each otherabout starter grain intake is essential to enhance nutrient deliveryand weaning efficiency in dairy calves and help avoid any post‐weaning energy balance problems.
Weaning and Dry Matter Intake of Starter
• Adding flavors and odors to starter grain helps this process,especially for calves fed grain in situations where they receiveno visual feedback about what other calves are doing.
• Making sure all nutrient requirements are met by the starter isalso important – industry not willing to pay for that yet
• Other options are enzymes that enhance digestibility andreduce digestive stress
Weaning and Dry Matter Intake of Starter Group behavior vs isolated hutches

Starter Intake, Nutrient Balance and Weaning Efficiency
Days relative to weaning
Dry
Mat
ter I
ntak
e, K
g/d
Adapted from Smith and Van Amburgh, 2000
MilkReplacer
0-14 -7 7 14 21 28 35
0.6
1.3
2.0
2.6
3.2
3.9
Dry Feed
Assumptions:Developed Ruminal function
Appropriate Feed Intake
Weaning
Rodrigo's calf starterPellet ingredients Amount, kg % of DM DM kgWheat midds 0.6 0.199 397.09Soyplus 0.6 0.199 397.09Canola meal 0.2 0.066 132.36Sugar 0.1 0.033 66.18Dried whey 0.18 0.060 119.13Blood meal 0.12 0.040 79.42Metasmart dry 0.022 0.007 14.56Minerals 0.02 0.007 13.24Vitamins ADE 0.01 0.003 6.62Rumensin premix 0.01 0.003 6.62Flavor enhancer 0.01 0.003 6.62Molasses 0.1 0.033 66.18Fat 0.02 0.007 13.24Yeast cell wall 0.02 0.007 13.24External ingredientsBeet pulp shreds 0.4 0.132 264.73Flaked corn 0.61 0.202 403.71
Starter Nutrient Content% Dry Matter
CP 24.8Sol CP 6.2 (24.9)aNDFom 21.0ADF 10.0Starch 21.2Sugar 14.9Soluble fiber 4.9Ether extract 4.4ME allowable gain, kg/d 1.16MP allowable gain, kg/d 1.13
Experimental Periods
d 0 W 13W 9
Weaning
W 7
Milk Replacer 30% CP 32% Fat12 L/d Max., 15% Solids, 3X/d
Calf Starter Ad LibitumFormulated with CNCPS v 7.0
Treatments (Estimated Req.)Gel capsules daily, Adj. bi-wkly
W 3
No B-Vitamin (Placebo)
Unprotected B-Vitamin BlendRumen Protected B-Vitamin Blend
Post WeaningPre Weaning

Results
*Kg ADG/Kg DMI
RPBV UPBV CTRLPre-weaning(Wk 7) Wt, kg 84.57 83.55 85.94ADG, kg/d 0.89 0.86 0.9MR intake, kg/d 1.22 1.2 1.24Grain Intake, kg/d 0.06 0.06 0.07DMI, Kg/d 1.28 1.26 1.32Feed Efficiency* 0.67 0.65 0.68
Weaning(Wk 9) Wt, kg 95.6 94.59 96.8ADG, kg/d 0.79 0.79 0.78MR intake, kg/d 0.8 0.84 0.82Grain Intake, kg/d 0.73 0.65 0.77DMI, kg/d 1.54 1.5 1.59Feed Efficiency* 0.51 0.52 0.47
Results
*Kg ADG/Kg DMI
RPBV UPBV CTRL
Post-weaning(Wk 13) wt, Kg 133.51 131.99 135.61ADG, kg/d 1.35 1.33 1.40Grain Intake, kg/d 3.15 3.1 3.18Feed Efficiency* 0.43 0.43 0.44
OverallADG, kg/d 1 0.98 1.02DMI, kg/d 1.89 1.87 1.94Feed Efficiency* 0.53 0.52 0.53
ResultsDry Matter Intake
RPBVUPBVCTRL
MR
Grain
0
0.5
1
1.5
2
2.5
3
3.5
4
1 2 3 4 5 6 7 8 9 10 11 12 13
DMI, kg DM/d
Age, Wk
ResultsADG
0.2
0.4
0.6
0.8
1
1.2
1.4
1.6
1 2 3 4 5 6 7 8 9 10 11 12 13
ADG, kg/d
Age, wk
RPBV
UPBV
CRTL

ResultsBody weight
40
50
60
70
80
90
100
110
120
130
140
0 1 2 3 4 5 6 7 8 9 10 11 12 13 14
Weight, kg
Age, wk
RPBV
UPBV
CRTL
0.5
0.7
0.9
1.1
1.3
1.5
1.7
1.9
7 14 21 28 35 42 49 56
DMI from M
R, kg
Days on treament
Milk replacer intake per day
0
0.5
1
1.5
2
2.5
3
42 49 56 63
Starter Intake, kg/d
Days on treatment
Starter intake – using an β-mannase enzyme for the starter
Effect of days on treatment and treatment on DMI from starter for calves fed either whey protein based MR or soy protein based MR with or without added enzymes for 9 weeks. Treatment A (all whey protein MR, ♦), treatment B (soy protein based MR, enzyme A added, ■), treatment C (▲soy protein based MR, enzyme B added), treatment D (×, soy protein based MR, no enzyme, salt added).
11.21.41.61.82
2.22.42.6
7 14 21 28 35 42 49 56 63
DMI, kg/d
Days on treatment
Total dry matter intake from milk replacer and starter
Enzyme treatment

Fetal growth rate and requirements and mammogenesis
191 days pregnant - beginning of third trimester
191 days pregnant - beginning of third trimester
Growth rate = 0.92 lb/dBirth weight = 103 lb
Growth rate = 1.01 lb/dBirth weight = 108 lb
Fetal growth in multiparous Holstein cows (Bell et al., 1995)
Requirements of ME and MP for pregnancy
• Calculated based upon expected birth weight of calf and day of gestation
• Become meaningful beginning on day 191 of pregnancy
• Efficiency of ME use for pregnancy is 14%
• Efficiency of MP use for pregnancy is 33%
Mammogenesis
• Based upon Bell et al. (2000) and VandeHaar and Donkin (1999)
• “Switch” is turned on from 259 days of pregnancy until 21 days of lactation
• Assumes 80 grams of NP deposition in mammary gland and efficiency of use of 29%
• ME requirements calculated based upon requirements to support 80 g/d of protein deposition
• Result for MP is additional requirement of 277 g/d

Pregnant heifers – 1,212 lb, 1,770 lb mature BW
180 days pregnant – at the end of the 2nd trimester
Target gain: 3.15 lb/dME allowable: 3.2 lb/dMP allowable: 4.3 lb/d
Pregnant heifers – 1,278 lb; 1,770 lb mature BW
200 days pregnant – into the 3rd trimester
Target gain: 3.63 lb/dME allowable: 2.65 lb/dMP allowable: 2.06 lb/d
The Need and Importance for Monitoring Body Weight Gain
and Age at First Calving and Productivity
Growth Benchmarks to Optimize First and Subsequent Lactation Milk Yield Birth to weaning: double body weight
Puberty: 45% mature weight
Breeding and Pregnancy: 55-60% mature weight
First lact. post-calving BW: 82 to 85% mature weightGoal is to achieve 82% of mature size to achieve 80% of mature cow milk yield
Mature weight determined at middle of 3rd and 4th
lactation – 80 to 200 days in milk on healthy cows, not cull cows

Peak ~ 69% mature cowsOverall lactation ~ 69% of mature cows5/5 case studies in last 1.5 yr – same problem
Discussion Group Heifer ProjectQuestion from group: How do we optimize first lactation milk yield and the quality of the heifer as she arrives at lactation?
Herd % Mature Peak1 682 853 754 825 796 797 768 779 7010 7611 7512 72
Location• Pen study ‐‐‐16 cows in 12 pens (192 total)
– Random allocation of cow to pen, pen to diet– 12 multiparous, 4 primiparous animals per pen
Photo: S. Fessenden
Body weight and BCSItem Mean RangeLactation 2.4 1‐6DIM at trial start 115 50‐180Mature weight, lbs 1710 1350‐2200
2+ lactationBody weight, lbs 1675 1320‐2200BCS 2.95 2.2‐3.6
1st lactationBody weight, lbs 1350 1050‐1575BCS 3.1 2.87‐3.5

Cattle characterization
2,204 lbs
Body weight by week
y = 9.297x + 1294.5
y = 9.4485x + 1566.5
y = 5.0788x + 1696.31000
1100
1200
1300
1400
1500
1600
1700
1800
1900
2000
0 1 2 3 4 5 6 7 8 9 10
Body
Wt, lbs
Week
1st Lactation2nd Lactation3+ Lactation
79% of mature
2
2.2
2.4
2.6
2.8
3
3.2
3.4
3.6
3.8
4
0 1 2 3 4 5 6 7 8 9 10
BCS
Week
1st Lactation2nd Lactation3+ Lactation
BCS by week Cattle inputs
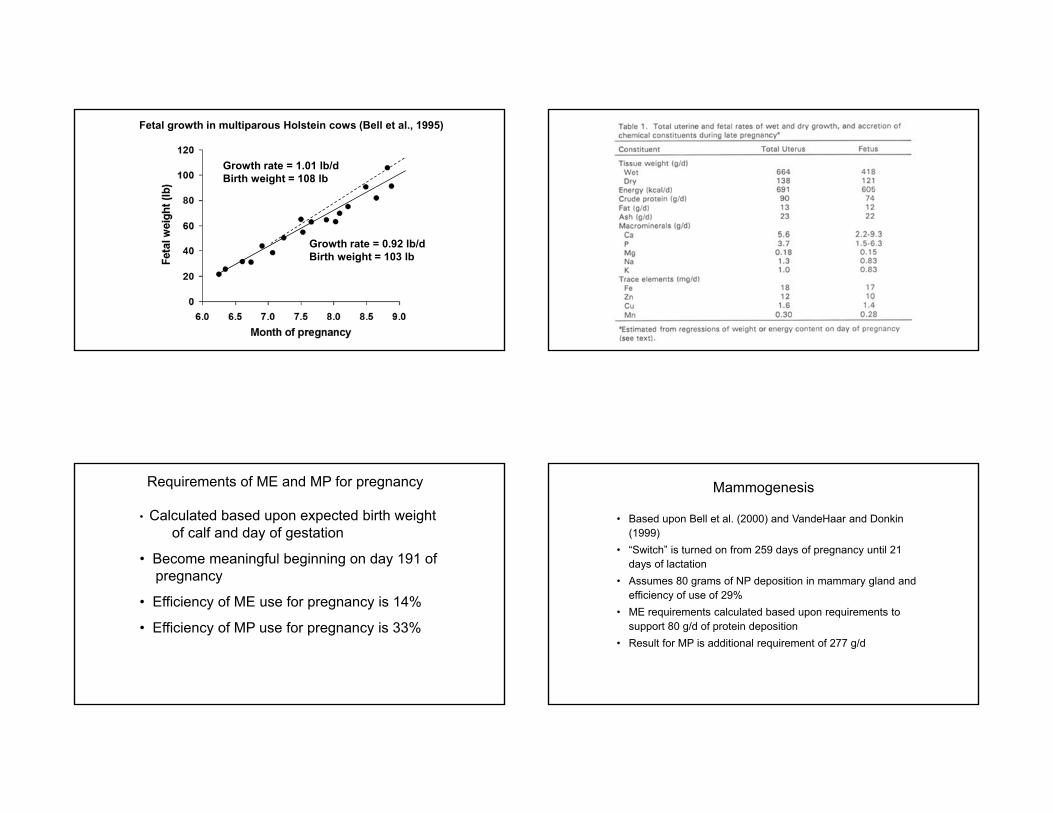
Milk productionItem Predicted ObservedDMI, lb/d 60.5 62.4ECM, lb/d 99.8ME predicted milk 110.4MP predicted milk 100.1Milk fat, % 3.73Milk fat, lb/d 3.61Milk protein, % 3.17Milk protein, lb/d 3.04MUN, mg/dL 6.7
Milk production
60
70
80
90
100
110
120
0 1 2 3 4 5 6 7 8 9 10
Milk, lbs/d
Week
1st Lactation
2nd Lactation
3+ Lactation
78% of mature
Mature weight, lb900 1,300 1,760
% mature wt. Target weight, lbpregnancy 55% 495 715 968
1st lact. fresh 82% 765 1,105 1,496
2nd lact. fresh 92% 828 1,196 1,619
3rd lact. fresh 96% 864 1,248 1,690
Target weights
Input AFC – sets breeding age for you and breeding weight is a function of the mature size. Requirements are then
calculated to meet the targets.
How Early Should Heifers Calve to Optimize Lifetime Productivity?
https://images.search.yahoo.com/images/view;_ylt=AwrB8pDZVaxURX0ACv.JzbkF;_ylu=X3oDMTIzYXAyanEwBHNlYwNzcgRzbGsDaW1nBG9pZAM5YjcxYmNmMjczMjg3NzJhNDYxYzc0ZTk2MDAwNjJhMARncG9zAzM1BGl0A2Jpbmc‐?.origin=&back=https%3A%2F%2Fimages.search.yahoo.com%2Fyhs%2Fsearch%3Fp%3Ddairy%2Bcalves%26n%3D60%26ei%3DUTF‐8%26fr%3Dyhs‐mozilla‐001%26fr2%3Dsb‐top‐images.search.yahoo.com%26hsimp%3Dyhs‐001%26hspart%3Dmozilla%26tab%3Dorganic%26ri%3D35&w=640&h=426&imgurl=www.thisisdairyfarming.com%2Fmedia%2F44446%2Fcalves‐large.jpg&rurl=http%3A%2F%2Fpics8.this‐pic.com%2Fkey%2F%2520Dairy%2520Calves&size=307.6KB&name=%3Cb%3EDairy+Calves%3C%2Fb%3E&p=dairy+calves&oid=9b71bcf27328772a461c74e9600062a0&fr2=sb‐top‐images.search.yahoo.com&fr=yhs‐mozilla‐001&tt=%3Cb%3EDairy+Calves%3C%2Fb%3E&b=0&ni=384&no=35&ts=&tab=organic&sigr=11f41fkce&sigb=15c6ri9ag&sigi=11naftgmn&sigt=10jgshr31&sign=10jgshr31&.crumb=Wwy.W2nYpMA&fr=yhs‐mozilla‐001&fr2=sb‐top‐images.search.yahoo.com&hsimp=yhs‐001&hspart=mozilla

Lactation records from
2,519,232 first lactation cows
937 herds in the Northeast and California
Within herd analysis
Accounts for management, environment, and genetic differences among farms
Within Herd Analysis of AFC on Productive Days, Milk Yield, Longevity
Retrospective assignment to AFC treatment groups
Herd avg. AFC was calculated each year
Heifers were assigned to one of 5 AFC age groups:
1) Less than -63 days from herd avg. AFC
2) -22 to -63 days from herd avg. AFC
3) -21 to 21 days from herd avg. AFC
4) 22 to 63 days from herd avg. AFC
5) Greater than 63 days from herd avg. AFC
Within Herd Analysis of AFC on Productive Days, Milk Yield, Longevity
Retrospective assignment to AFC treatment groups
Herd avg. AFC was calculated each year
Heifers were assigned to one of 5 AFC age groups:
1) 23.3 months AFC
2) 24.3 months AFC
3) 25.6 months AFC
4) 27.2 months AFC
5) 30.3 months AFC
Within Herd Analysis of AFC on Productive Days, Milk Yield, Longevity
-150
-100
-50
0
50
100
3 4 5 6 7 8
23.3
24.3
25.6
27.2
30.3
Figure 1. Average number of productive days, difference from study herd mean AFC (25.6 month)
Within Herd Analysis of AFC on Productive Days, Milk Yield, Longevity
Opportunity Group, years
Pro
duct
ive
days
,
diffe
renc
e fro
m m
ean
AFC
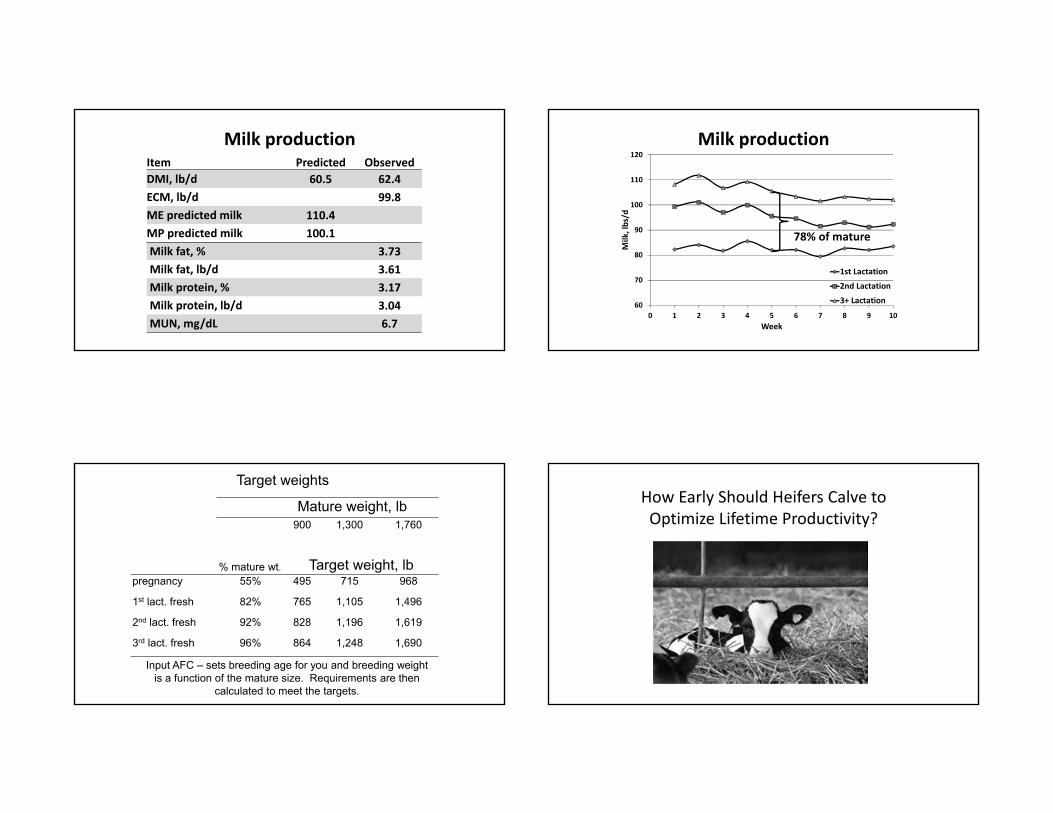
Within Herd Analysis of AFC on Productive Days, Milk Yield, Longevity
Opportunity Group, years
Tota
l milk
pro
duct
ion,
lbs,
diffe
renc
e fro
m m
ean
AFC
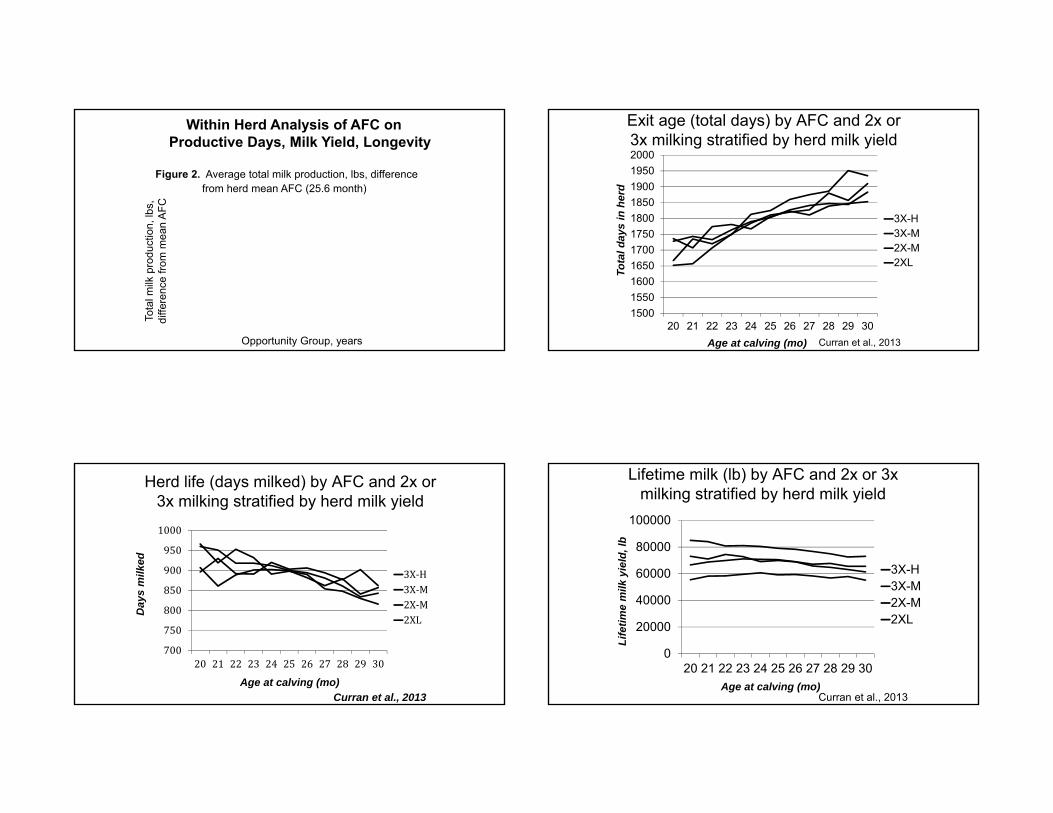
Figure 2. Average total milk production, lbs, difference from herd mean AFC (25.6 month)
15001550160016501700175018001850190019502000
20 21 22 23 24 25 26 27 28 29 30
3X-H3X-M2X-M2XL
Exit age (total days) by AFC and 2x or 3x milking stratified by herd milk yield
Curran et al., 2013
Tota
l day
s in
her
d
Age at calving (mo)
Herd life (days milked) by AFC and 2x or 3x milking stratified by herd milk yield
700
750
800
850
900
950
1000
20 21 22 23 24 25 26 27 28 29 30
3X‐H3X‐M2X‐M2XL
Curran et al., 2013
Day
s m
ilked
Age at calving (mo)
0
20000
40000
60000
80000
100000
20 21 22 23 24 25 26 27 28 29 30
3X-H3X-M2X-M2XL
Lifetime milk (lb) by AFC and 2x or 3x milking stratified by herd milk yield
Curran et al., 2013Age at calving (mo)
Life
time
milk
yie
ld, l
b
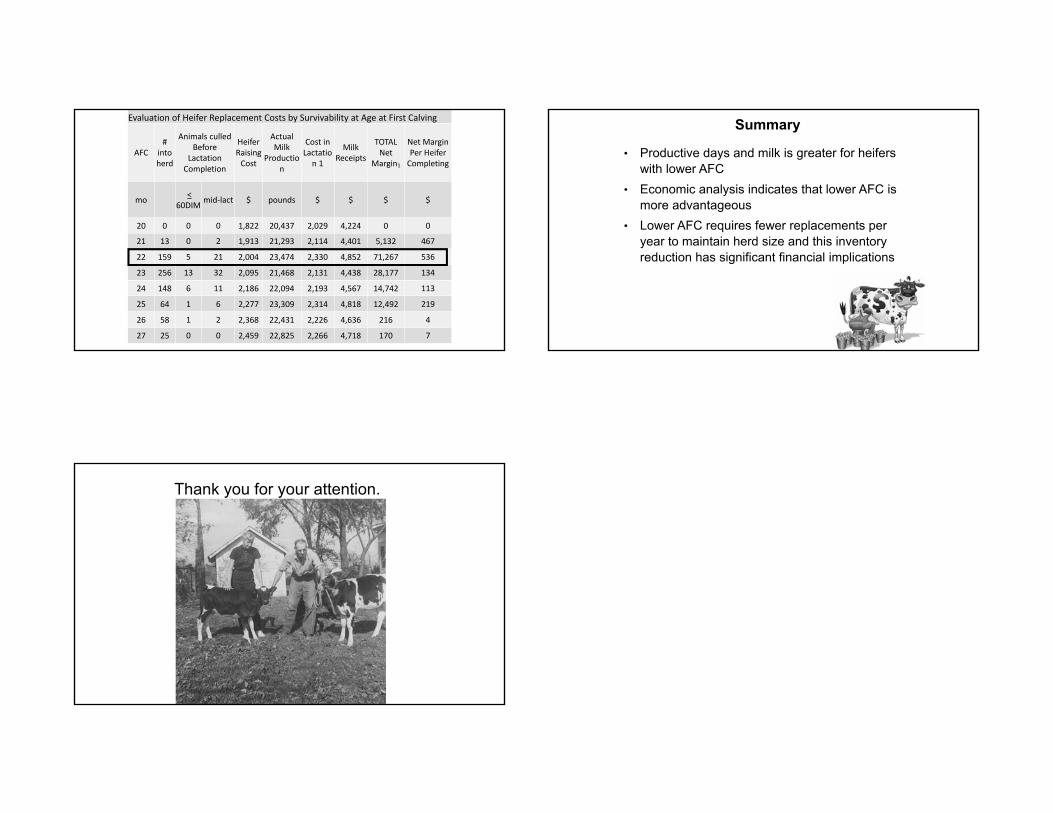
Evaluation of Heifer Replacement Costs by Survivability at Age at First Calving
AFC#
into herd
Animals culled Before
Lactation Completion
Heifer Raising Cost
Actual Milk
Production
Cost in Lactation 1
Milk Receipts
TOTAL Net
Margin1
Net Margin Per Heifer Completing
mo <60DIM mid‐lact $ pounds $ $ $ $
20 0 0 0 1,822 20,437 2,029 4,224 0 0
21 13 0 2 1,913 21,293 2,114 4,401 5,132 467
22 159 5 21 2,004 23,474 2,330 4,852 71,267 536
23 256 13 32 2,095 21,468 2,131 4,438 28,177 134
24 148 6 11 2,186 22,094 2,193 4,567 14,742 113
25 64 1 6 2,277 23,309 2,314 4,818 12,492 219
26 58 1 2 2,368 22,431 2,226 4,636 216 4
27 25 0 0 2,459 22,825 2,266 4,718 170 7
Summary
• Productive days and milk is greater for heifers with lower AFC
• Economic analysis indicates that lower AFC is more advantageous
• Lower AFC requires fewer replacements per year to maintain herd size and this inventory reduction has significant financial implications
Thank you for your attention.
Related Documents