Hepatitis-C and HIV Michael T. Wong, MD Assistant Professor of Medicine, Harvard Medical School Division of Infectious Diseases, Beth Israel Deaconess Medical Center

Hepatitis-C and HIV
Dec 30, 2015
Hepatitis-C and HIV. Michael T. Wong, MD Assistant Professor of Medicine, Harvard Medical School Division of Infectious Diseases, Beth Israel Deaconess Medical Center. HCV Primarily through blood and blood products, IDU - PowerPoint PPT Presentation
Welcome message from author
This document is posted to help you gain knowledge. Please leave a comment to let me know what you think about it! Share it to your friends and learn new things together.
Transcript
Hepatitis-C and HIV
Michael T. Wong, MD
Assistant Professor of Medicine, Harvard Medical School
Division of Infectious Diseases,
Beth Israel Deaconess Medical Center
Michael T. Wong, MD
Assistant Professor of Medicine, Harvard Medical School
Division of Infectious Diseases,
Beth Israel Deaconess Medical Center

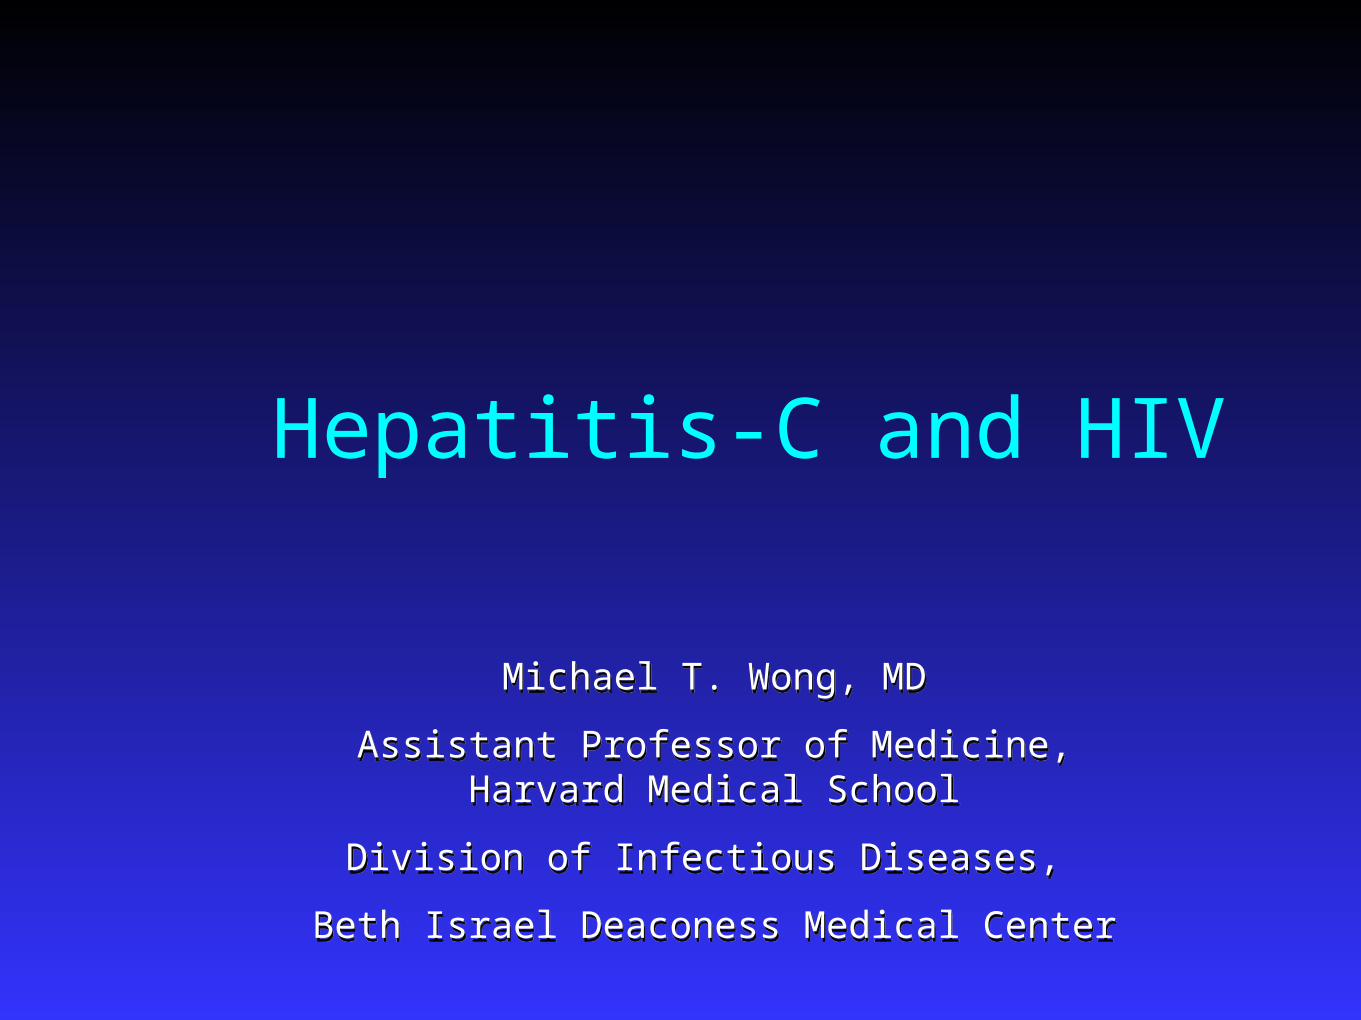
Modes of Transmission HCVHCV
Primarily through blood and Primarily through blood and blood products, IDUblood products, IDU
Historical data now supports Historical data now supports sexual risk of ~10-12% over sexual risk of ~10-12% over lifetime in discordant couple lifetime in discordant couple studiesstudies
Perinatal transmission ~7% but Perinatal transmission ~7% but increases to 28% in HIV increases to 28% in HIV coinfected motherscoinfected mothers
Association with intranasal Association with intranasal recreational agents like cocaine.recreational agents like cocaine.
HIVHIV Sexually through body fluids Sexually through body fluids
(semen, vaginal secretions, (semen, vaginal secretions, blood)blood)
Blood (percutaneous Blood (percutaneous exposures, IDU, blood exposures, IDU, blood products)products)
Perinatally (risk decreased to Perinatally (risk decreased to almost 0 with perinatal almost 0 with perinatal prophylaxis and elective C-prophylaxis and elective C-sections in right settings, sections in right settings, restriction on breast feedingrestriction on breast feeding

HCVHCV Infect primarily Infect primarily
hepatocytes without hepatocytes without becoming integrated becoming integrated into the host genome, into the host genome, but more recently but more recently found in T-found in T-lymphocytes which lymphocytes which represent a secondary represent a secondary reservoirreservoir
HIV-HIV- Infect primarily CD4 Infect primarily CD4
bearing T-lymphocytes bearing T-lymphocytes via secondary binding via secondary binding site, CCR5 or CXCR4site, CCR5 or CXCR4
Also found in variety Also found in variety of other cells including of other cells including neural dendritic cells, neural dendritic cells, GI epithelium, gonadal GI epithelium, gonadal tissuestissues

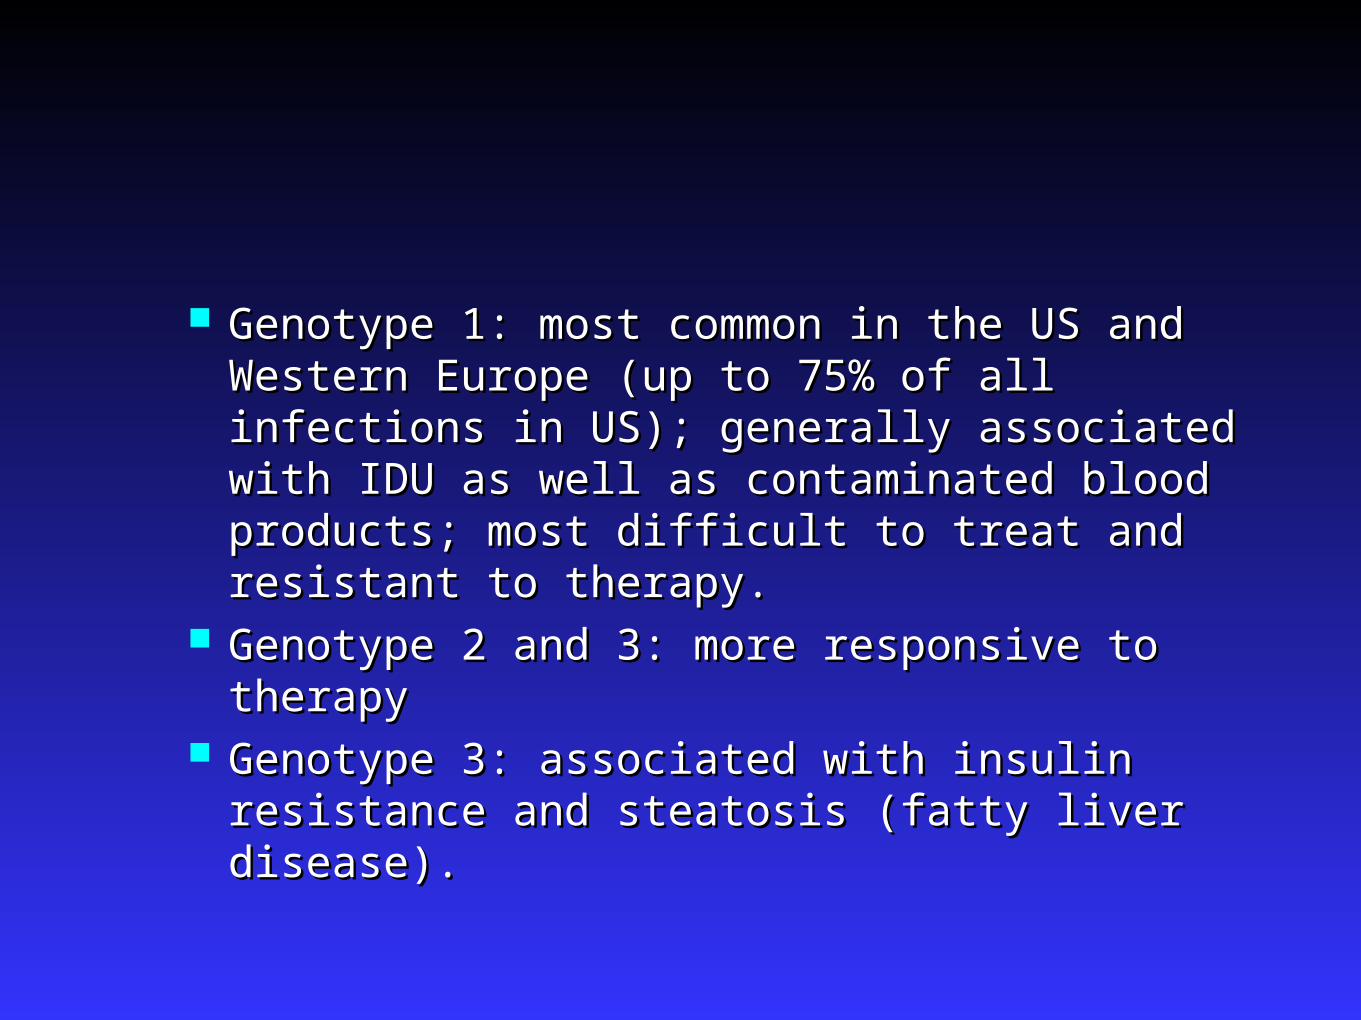
Genotype 1: most common in the US and Genotype 1: most common in the US and Western Europe (up to 75% of all infections in Western Europe (up to 75% of all infections in US); generally associated with IDU as well as US); generally associated with IDU as well as contaminated blood products; most difficult to contaminated blood products; most difficult to treat and resistant to therapy.treat and resistant to therapy.
Genotype 2 and 3: more responsive to therapyGenotype 2 and 3: more responsive to therapy Genotype 3: associated with insulin resistance Genotype 3: associated with insulin resistance
and steatosis (fatty liver disease).and steatosis (fatty liver disease).
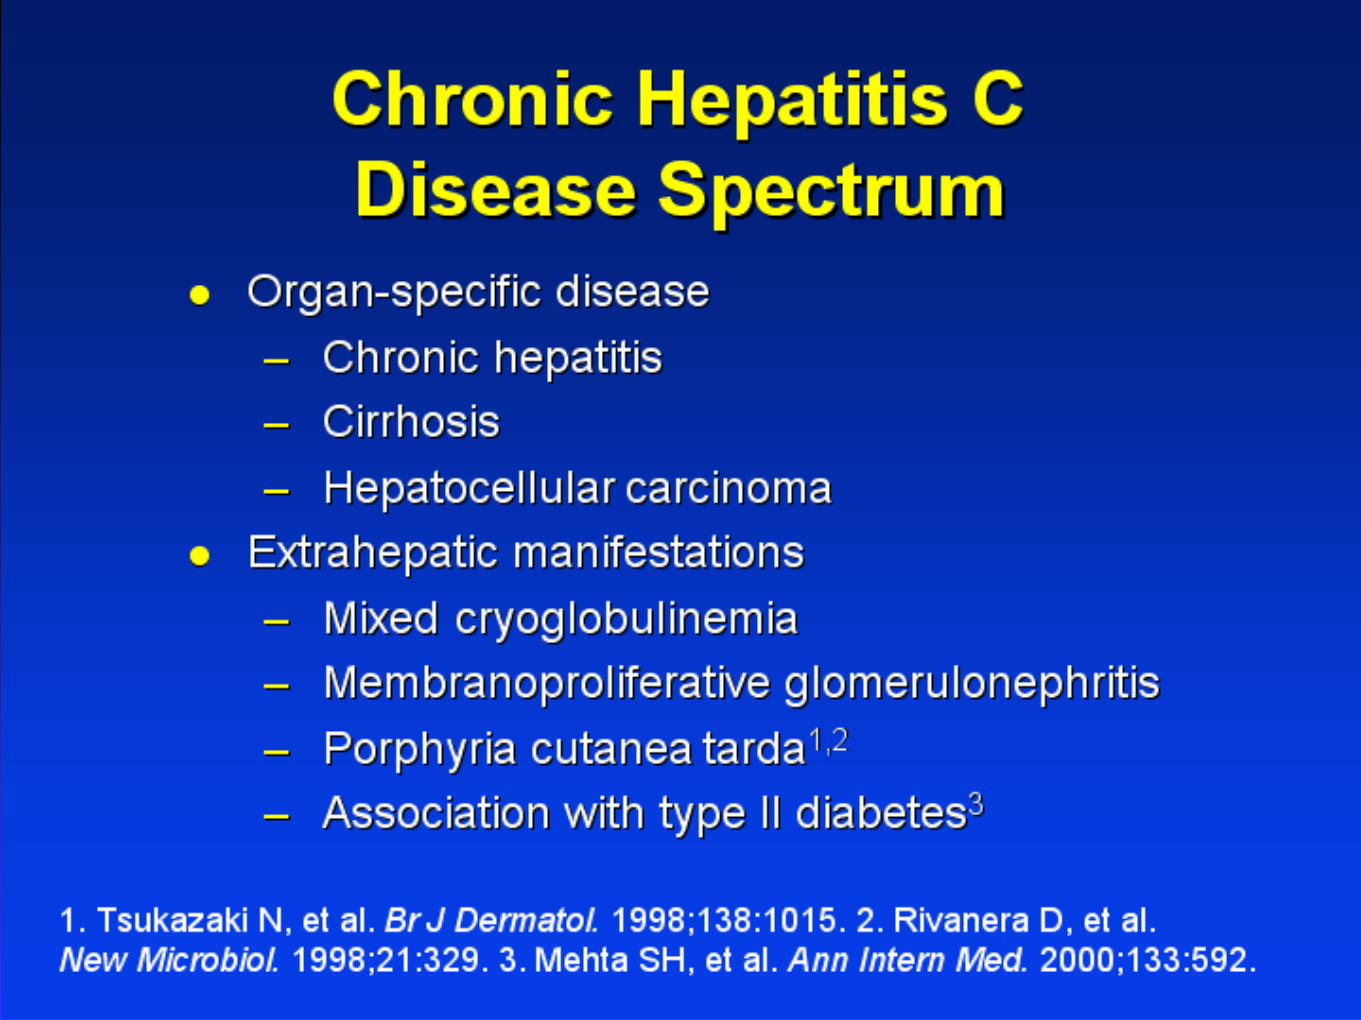

Extrahepatic ManifestationsConditionCondition Relative FrequencyRelative Frequency
Mixed CryoglobulinemiaMixed Cryoglobulinemia 36-45%36-45%11
Porphyria Cutanea TardaPorphyria Cutanea Tarda 62-82%62-82%22
Renal Failure (MPGN, Renal Failure (MPGN, membranous GN, GN membranous GN, GN associated with mixed associated with mixed cryoglobulinemia)cryoglobulinemia)
Uncertain; suggestion of Uncertain; suggestion of up to 27%up to 27%33
Cognitive DysfunctionCognitive Dysfunction 9-38%9-38%44
1. Ferri et al. Blood 1993;81:1132. 2. DeCastro et al. Hepatology 1993;17:551. 3. Johnson et al. N Engl J Med 1993;328:465. 4. Hilsabeck et al. J Int Neuropsychol Soc. 2003;9:847.
Other conditions reported in HCV include: hyper/hypothyroidism, idiopathic pulmonary fibrosis; ITP, non Hodgkins lymphoma,
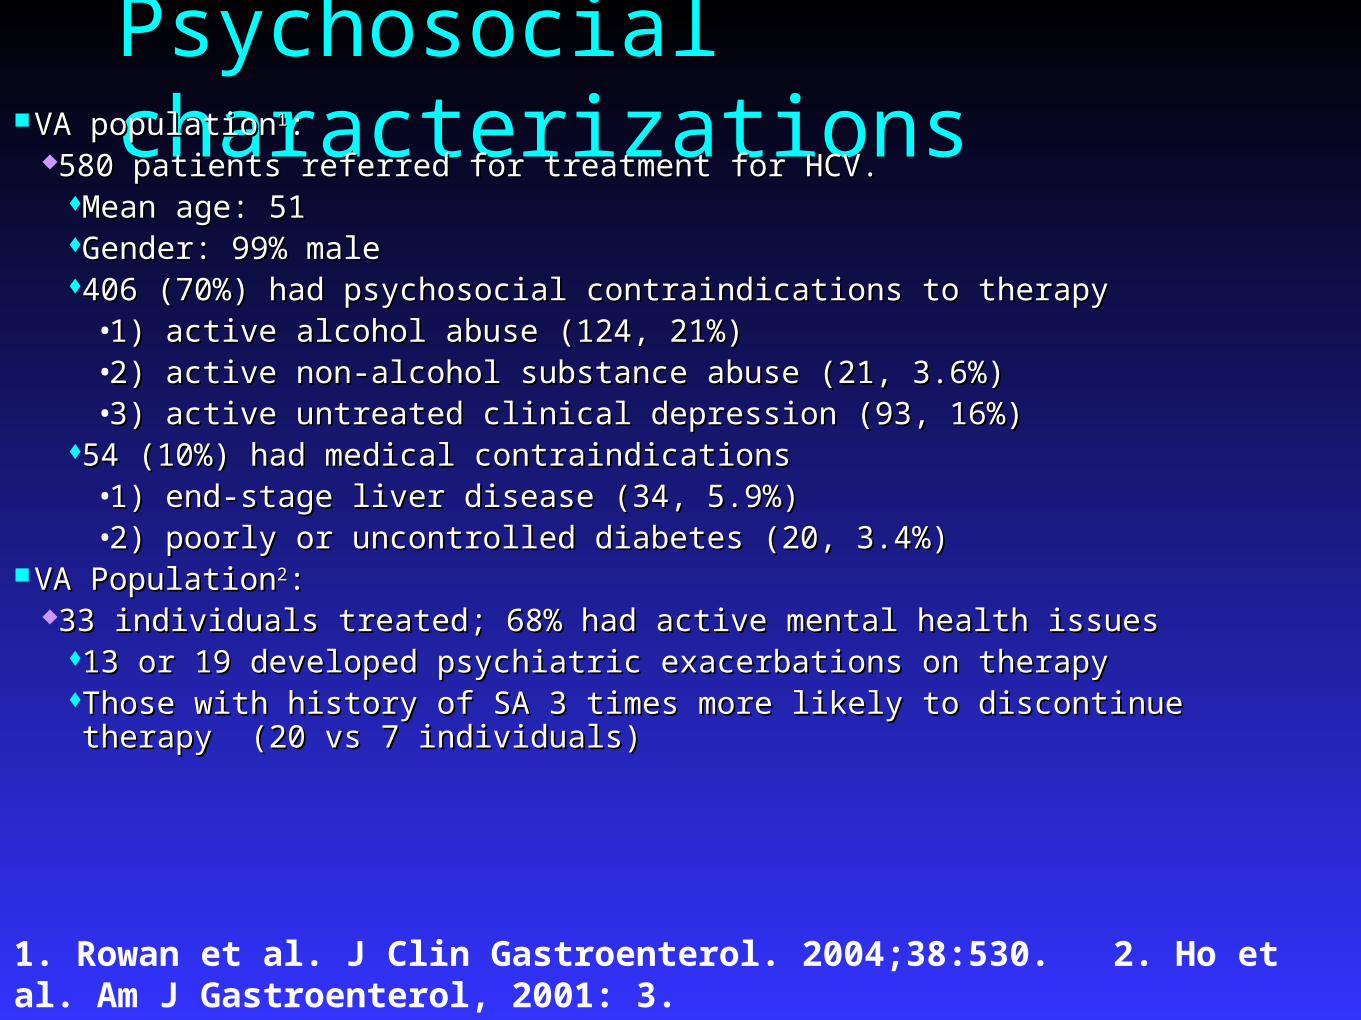
Psychosocial characterizations VA populationVA population11: :
580 patients referred for treatment for HCV.580 patients referred for treatment for HCV.Mean age: 51Mean age: 51Gender: 99% maleGender: 99% male406 (70%) had psychosocial contraindications to therapy406 (70%) had psychosocial contraindications to therapy
• 1) active alcohol abuse (124, 21%)1) active alcohol abuse (124, 21%)• 2) active non-alcohol substance abuse (21, 3.6%)2) active non-alcohol substance abuse (21, 3.6%)• 3) active untreated clinical depression (93, 16%)3) active untreated clinical depression (93, 16%)
54 (10%) had medical contraindications54 (10%) had medical contraindications• 1) end-stage liver disease (34, 5.9%)1) end-stage liver disease (34, 5.9%)• 2) poorly or uncontrolled diabetes (20, 3.4%)2) poorly or uncontrolled diabetes (20, 3.4%)
VA PopulationVA Population22::33 individuals treated; 68% had active mental health issues33 individuals treated; 68% had active mental health issues
13 or 19 developed psychiatric exacerbations on therapy13 or 19 developed psychiatric exacerbations on therapyThose with history of SA 3 times more likely to discontinue therapy (20 vs 7 individuals)Those with history of SA 3 times more likely to discontinue therapy (20 vs 7 individuals)
1. Rowan et al. J Clin Gastroenterol. 2004;38:530. 2. Ho et al. Am J Gastroenterol, 2001: 3.


Activated, Activated, HIV- cells HIV- cells t1/2 = 1.5 dt1/2 = 1.5 d
Productive Productive HIV+ cells, HIV+ cells, t1/2=1/2-1 dt1/2=1/2-1 d
Free HIV Free HIV t1/2= 30 t1/2= 30 minmin
Macrophage Macrophage t1/2= 14 dt1/2= 14 d
Latent Memory Latent Memory CD4+ HIV+ cell, CD4+ HIV+ cell, T1/2>>>6 moT1/2>>>6 mo
Latent, CD4+ Latent, CD4+ HIV+ cell, HIV+ cell, t1/2= 8.5 dt1/2= 8.5 d
Long-lived CD4+ Long-lived CD4+ HIV+ cells, HIV+ cells, t1/2= 6 mot1/2= 6 mo
93-99%93-99%
1%1%
1-7%1-7%
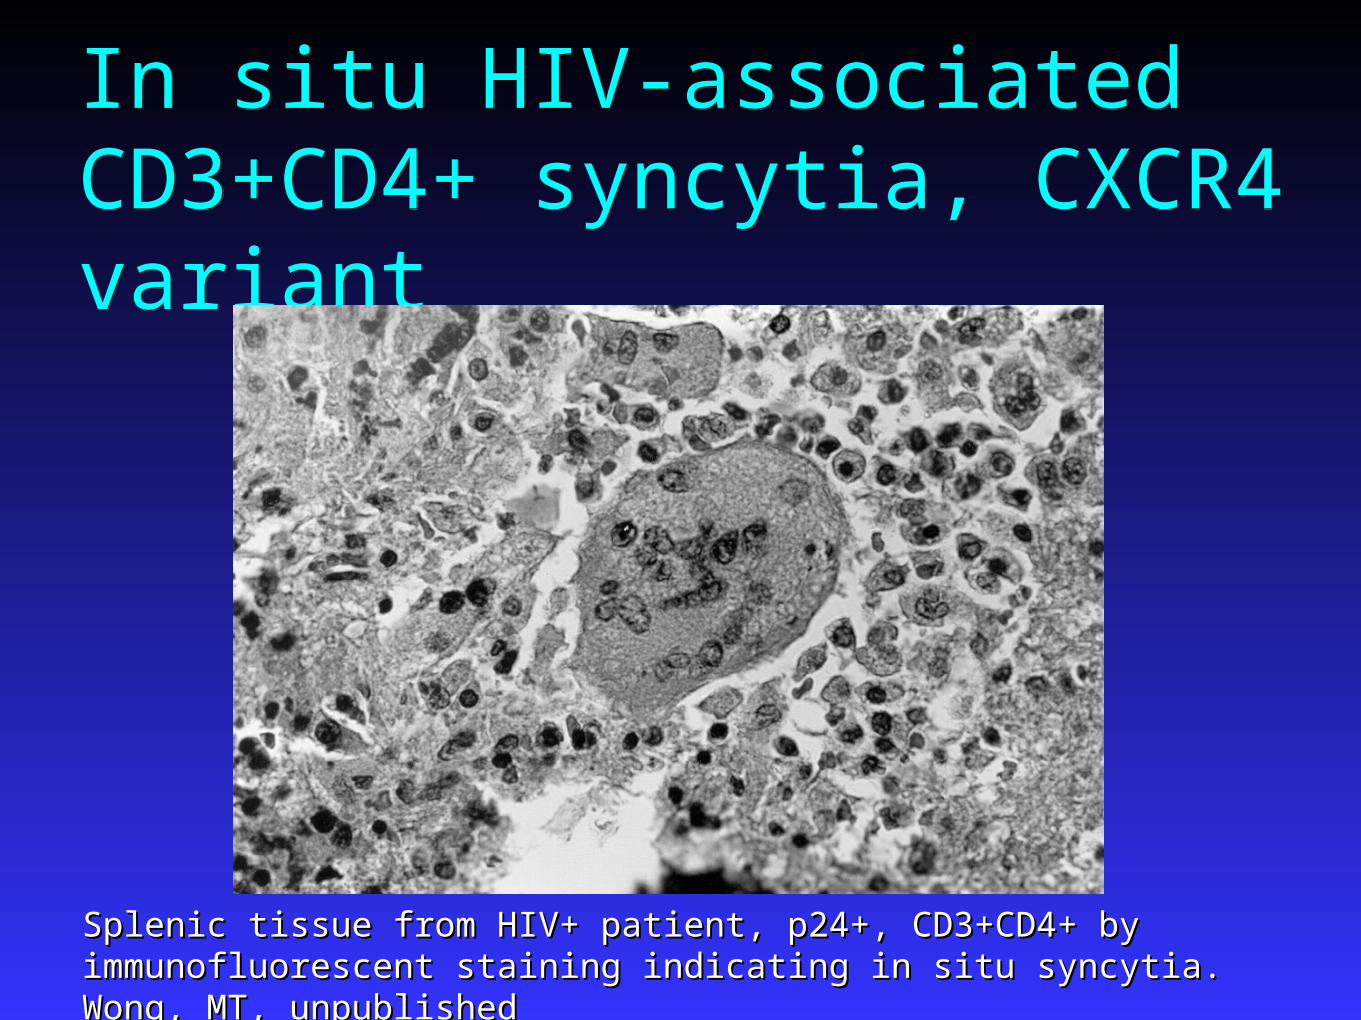
In situ HIV-associated CD3+CD4+ syncytia, CXCR4 variantIn situ HIV-associated CD3+CD4+ syncytia, CXCR4 variant
Splenic tissue from HIV+ patient, p24+, CD3+CD4+ by immunofluorescent Splenic tissue from HIV+ patient, p24+, CD3+CD4+ by immunofluorescent staining indicating in situ syncytia. Wong, MT, unpublishedstaining indicating in situ syncytia. Wong, MT, unpublished
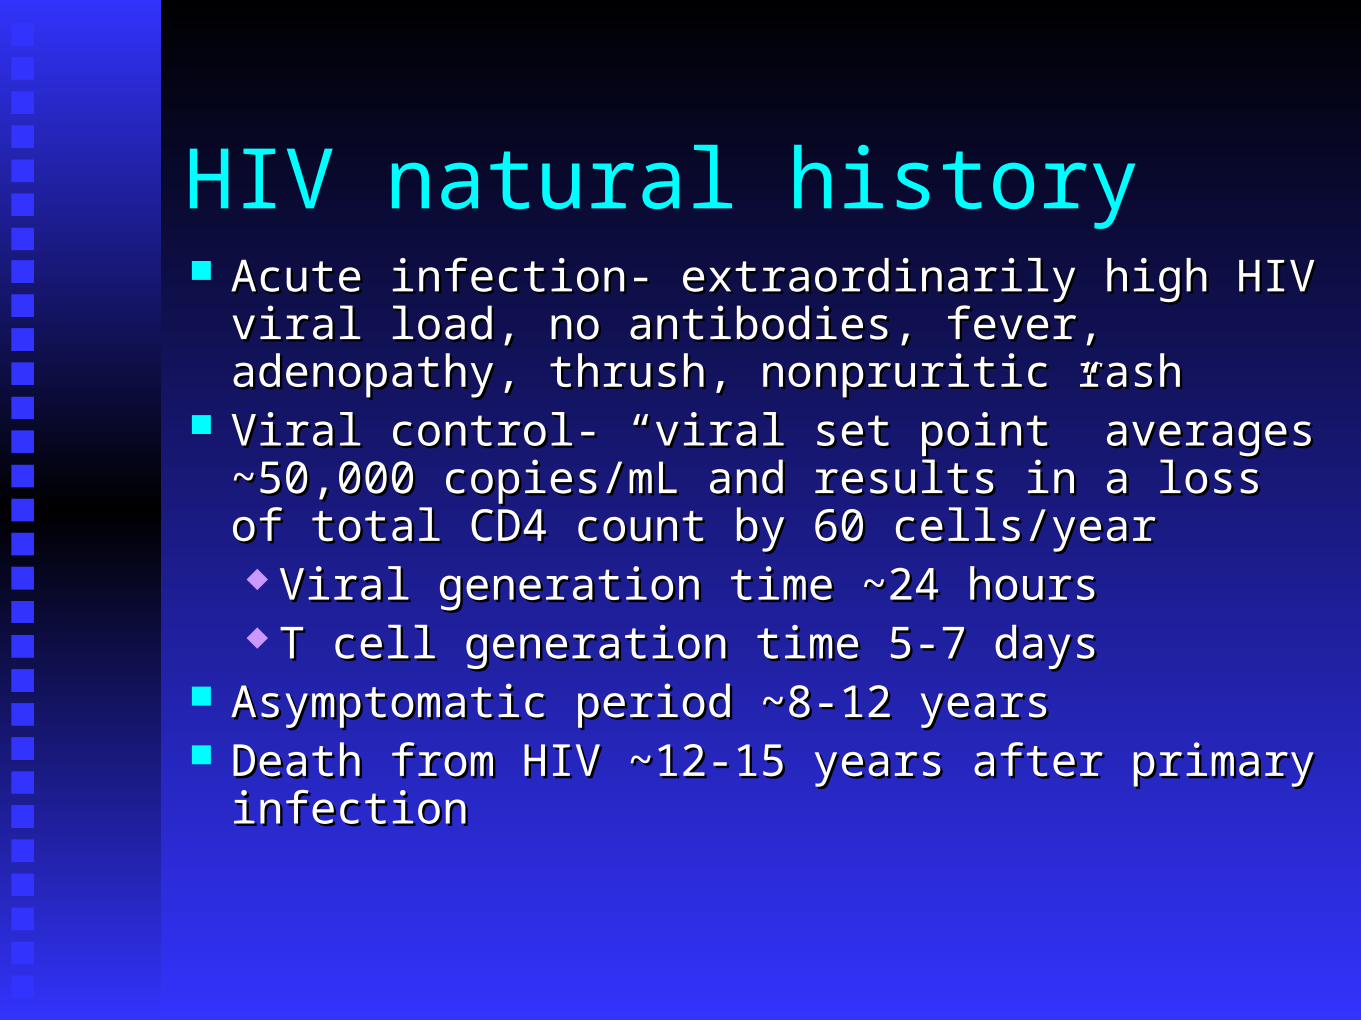
HIV natural history Acute infection- extraordinarily high HIV viral load, Acute infection- extraordinarily high HIV viral load,
no antibodies, fever, adenopathy, thrush, nonpruritic no antibodies, fever, adenopathy, thrush, nonpruritic rashrash
Viral control- “viral set point” averages ~50,000 Viral control- “viral set point” averages ~50,000 copies/mL and results in a loss of total CD4 count by copies/mL and results in a loss of total CD4 count by 60 cells/year60 cells/year Viral generation time ~24 hoursViral generation time ~24 hours T cell generation time 5-7 daysT cell generation time 5-7 days
Asymptomatic period ~8-12 yearsAsymptomatic period ~8-12 years Death from HIV ~12-15 years after primary infectionDeath from HIV ~12-15 years after primary infection
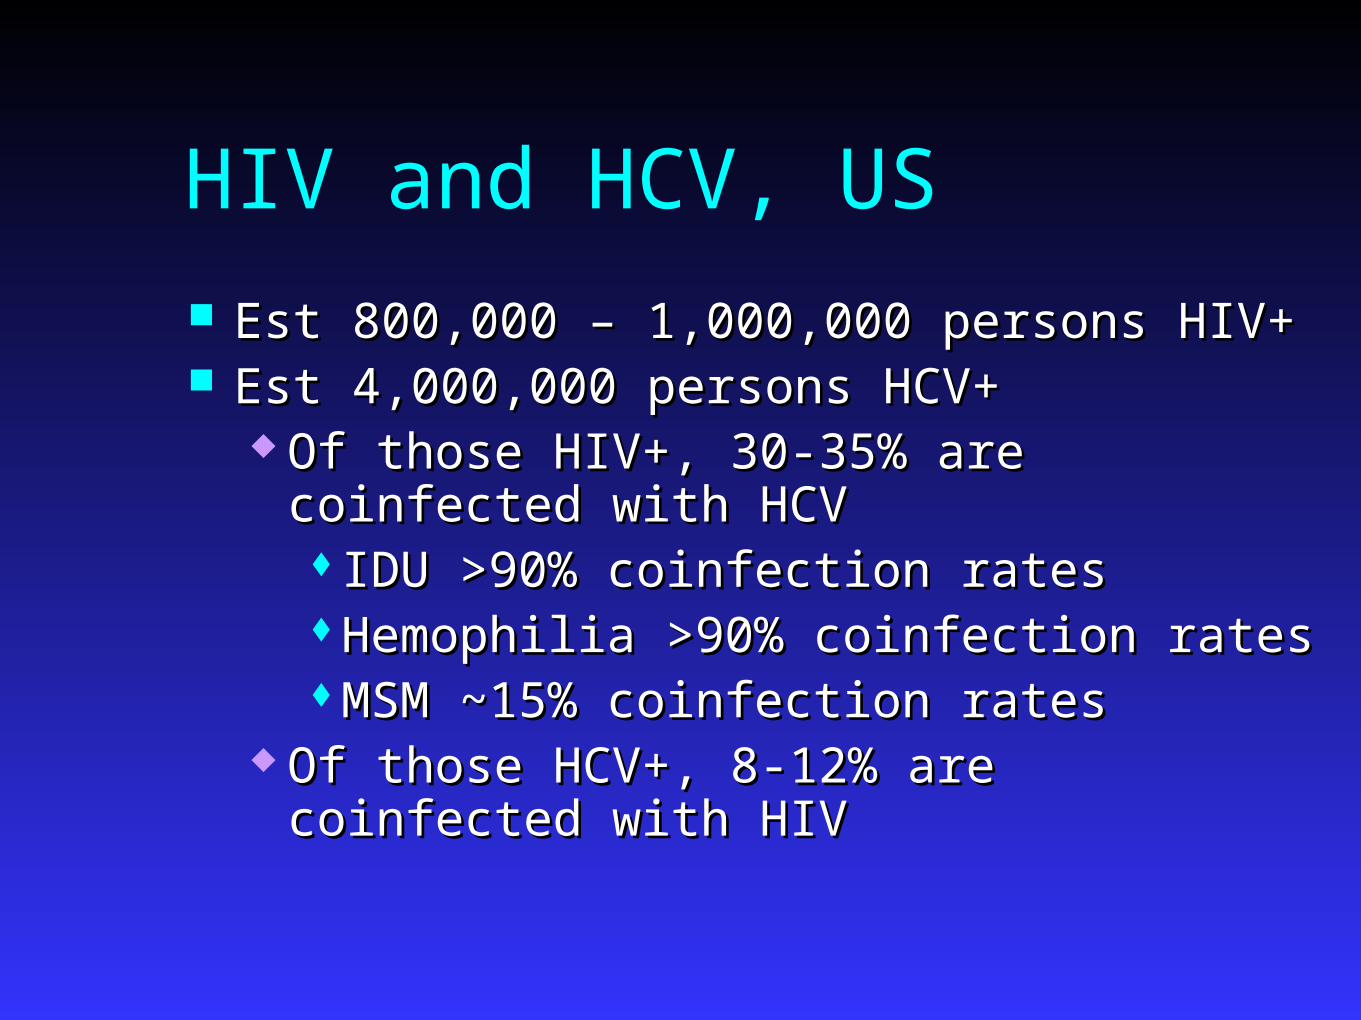
HIV and HCV, US
Est 800,000 – 1,000,000 persons HIV+ Est 800,000 – 1,000,000 persons HIV+ Est 4,000,000 persons HCV+Est 4,000,000 persons HCV+
Of those HIV+, 30-35% are coinfected with Of those HIV+, 30-35% are coinfected with HCVHCVIDU >90% coinfection ratesIDU >90% coinfection ratesHemophilia >90% coinfection ratesHemophilia >90% coinfection ratesMSM ~15% coinfection ratesMSM ~15% coinfection rates
Of those HCV+, 8-12% are coinfected with Of those HCV+, 8-12% are coinfected with HIVHIV
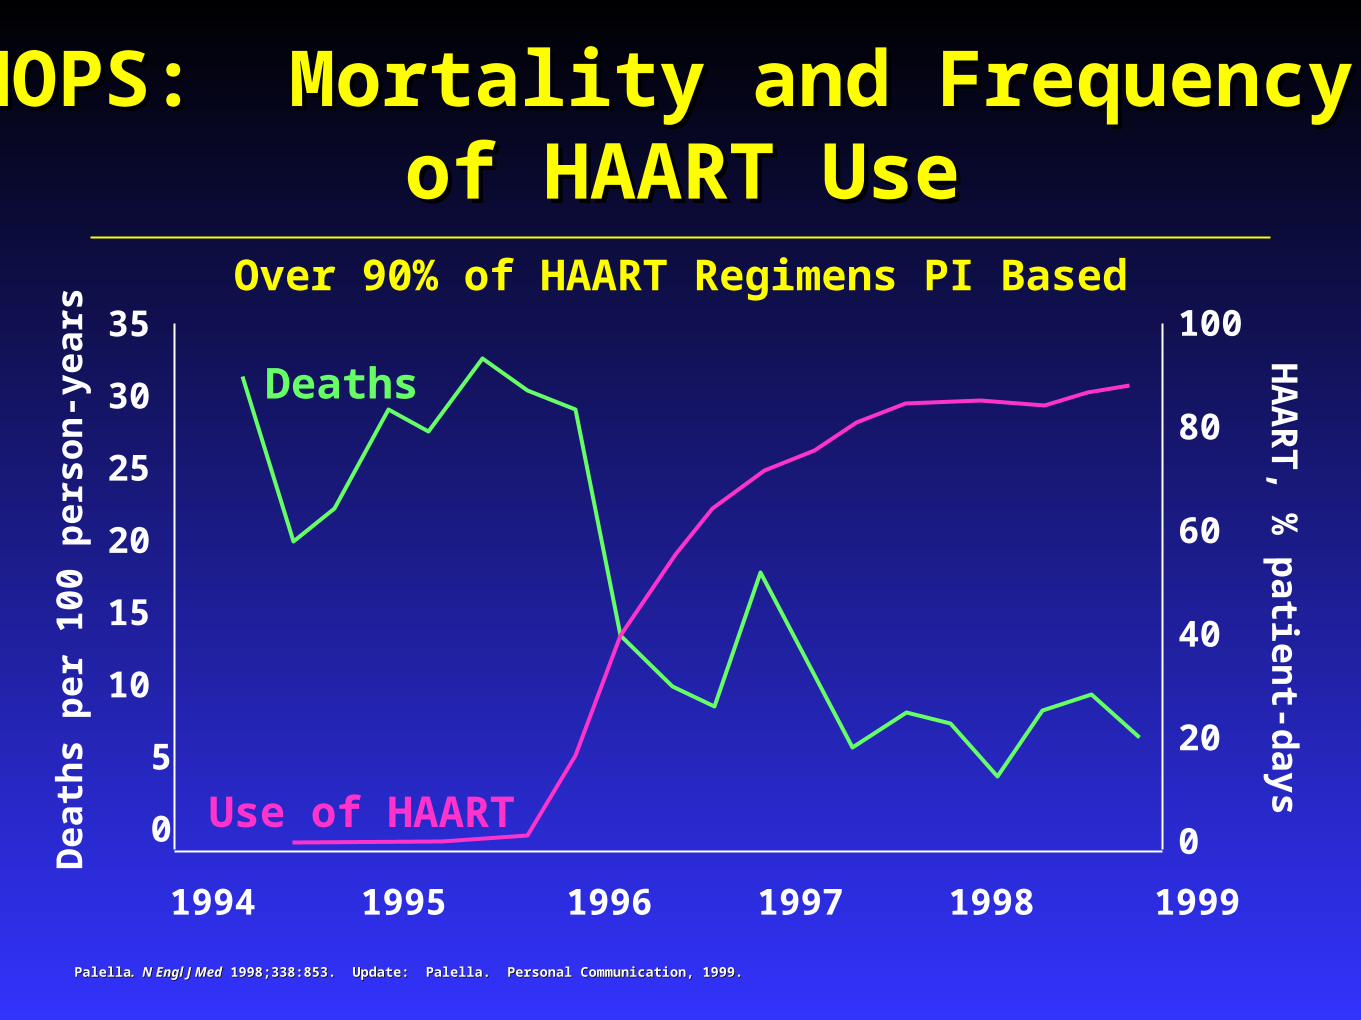
Over 90% of HAART Regimens PI Based100
80
60
40
20
0
35
30
25
20
15
10
5
0
1994 1995 1996 1997 1998 1999
HOPS: Mortality and Frequency HOPS: Mortality and Frequency of HAART Useof HAART Use
Dea
ths
per
100
per
son
-yea
rs
Deaths
Use of HAART
HA
AR
T, %
patien
t-days
PalellaPalella. N Engl J Med. N Engl J Med 1998;338:853. Update: Palella. Personal Communication, 1999. 1998;338:853. Update: Palella. Personal Communication, 1999.

Causes of Death in HIV-HCV Co-infection240 HIV/HCV co-infected patients in France who 240 HIV/HCV co-infected patients in France who
died in 2000 died in 2000At death:At death:
38% had CD4 count >200 cells/mm38% had CD4 count >200 cells/mm3 3
37% had a viral load <500 c/mL37% had a viral load <500 c/mL
AIDS 28%Non AIDS-related cancer
6%
End-stage liver disease 33%
Other 11%Suicide 4%
Drug overdose 4%
Cardiovascular disease 8%
Bacterial infections 6%
Dominique S et al. 42nd ICAAC; San Diego, 2002: Abstract #1719.

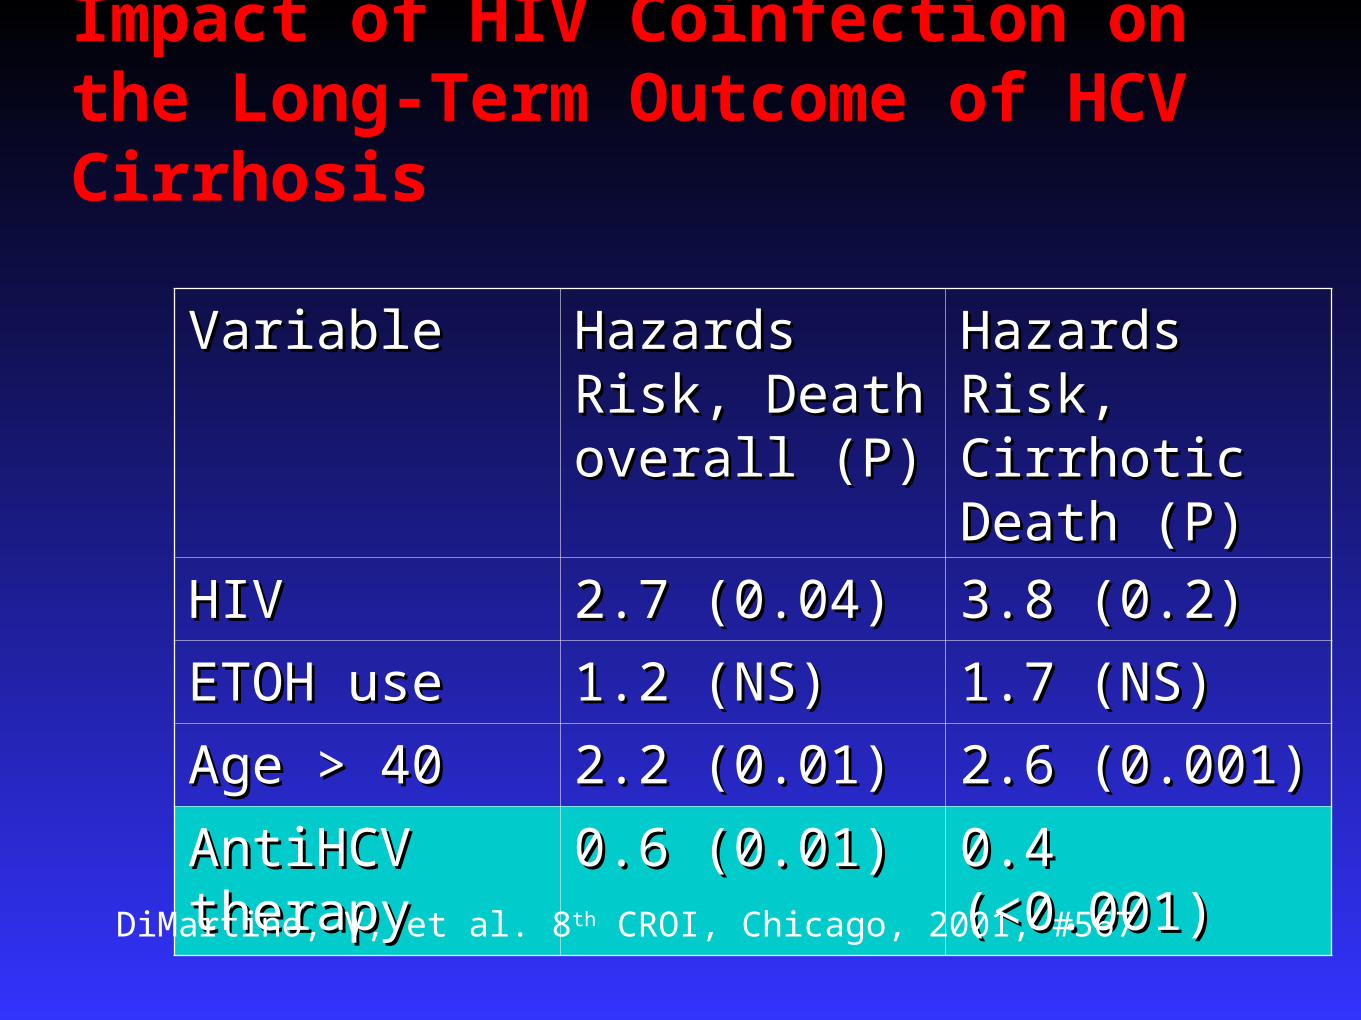
Impact of HIV Coinfection on the Long-Term Outcome of HCV Cirrhosis
VariableVariable Hazards Risk, Hazards Risk, Death overall Death overall (P)(P)
Hazards Risk, Hazards Risk, Cirrhotic Death Cirrhotic Death (P)(P)
HIVHIV 2.7 (0.04)2.7 (0.04) 3.8 (0.2)3.8 (0.2)
ETOH useETOH use 1.2 (NS)1.2 (NS) 1.7 (NS)1.7 (NS)
Age > 40Age > 40 2.2 (0.01)2.2 (0.01) 2.6 (0.001)2.6 (0.001)
AntiHCV AntiHCV therapytherapy
0.6 (0.01)0.6 (0.01) 0.4 (<0.001)0.4 (<0.001)
DiMartino, V, et al. 8th CROI, Chicago, 2001, #567
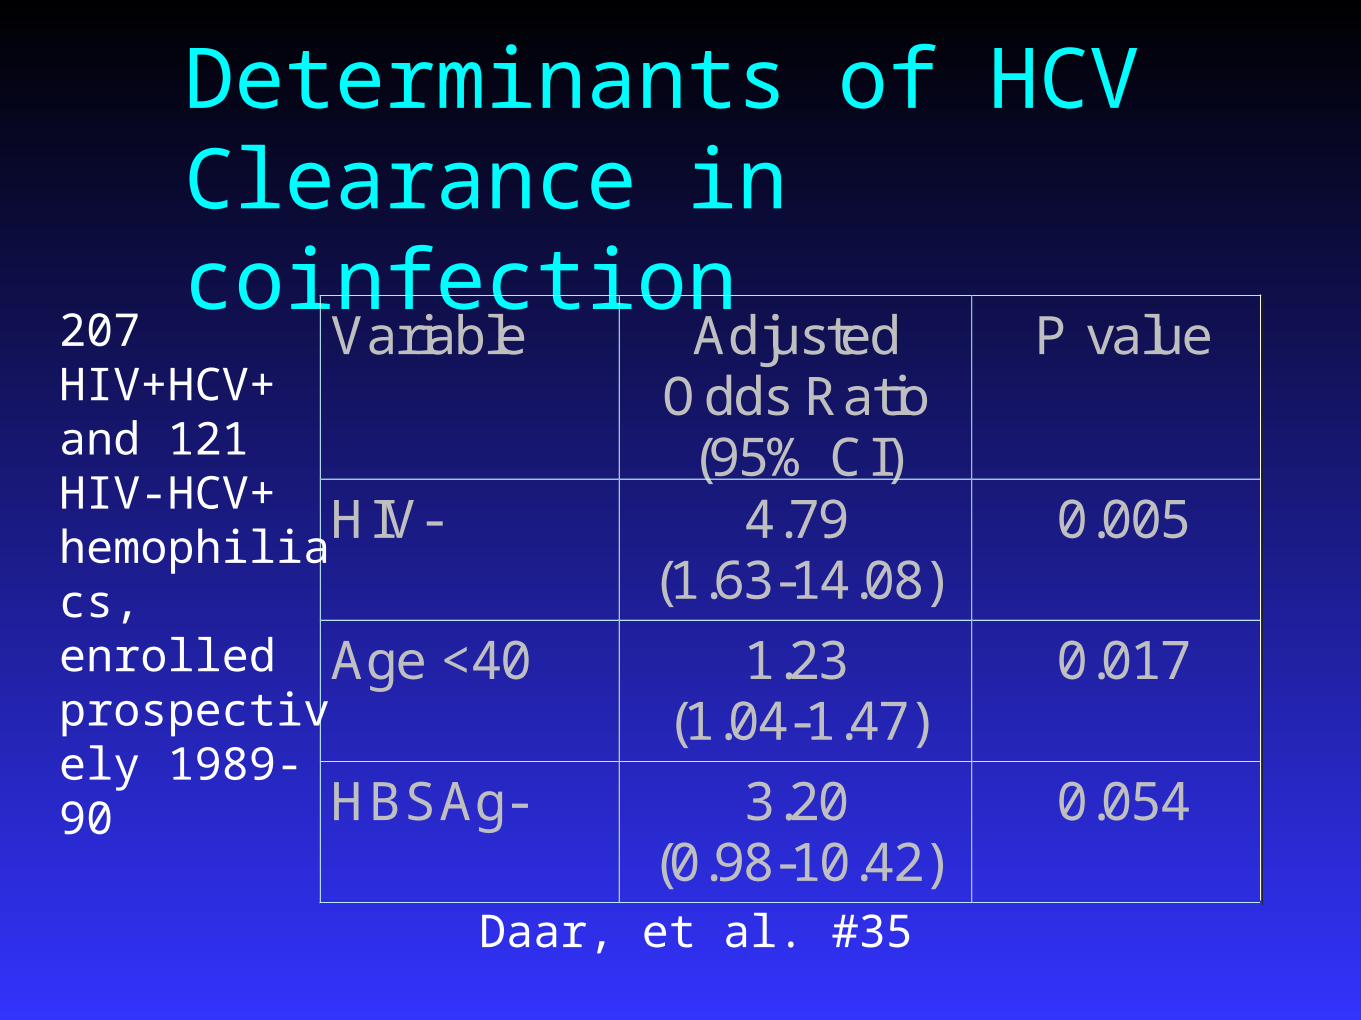
Determinants of HCV Clearance in coinfection
Variable Adjusted Odds Ratio (95% CI)
P value
HIV- 4.79 (1.63-14.08)
0.005
Age <40 1.23 (1.04-1.47)
0.017
HBSAg- 3.20 (0.98-10.42)
0.054
207 HIV+HCV+ and 121 HIV-HCV+ hemophiliacs, enrolled prospectively 1989-90
Daar, et al. #35
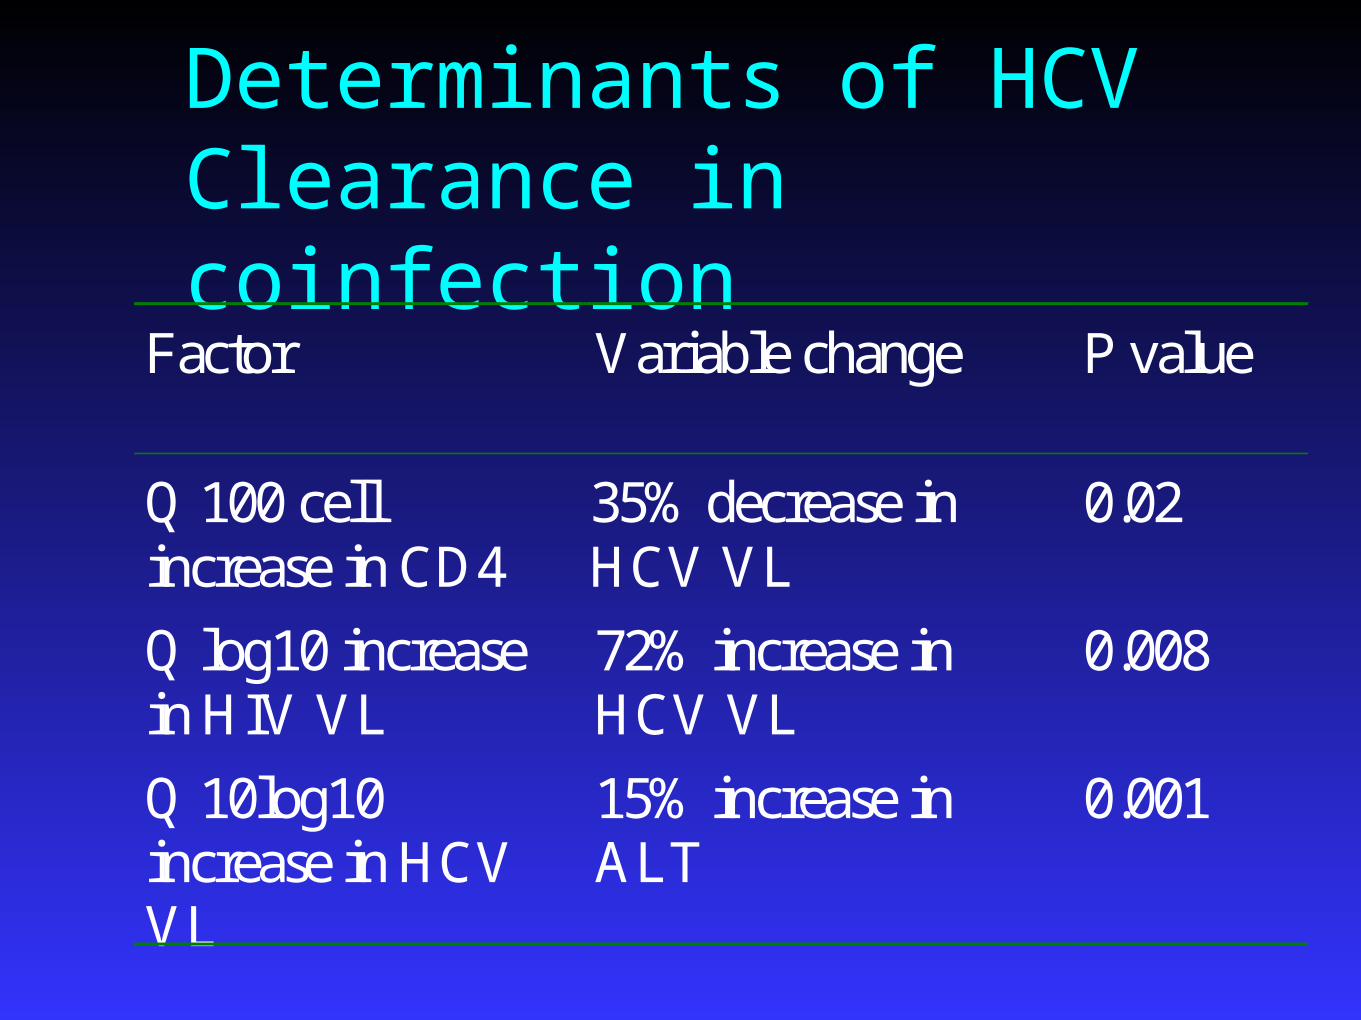
Determinants of HCV Clearance in coinfection
Factor Variable change P value
Q 100 cell increase in CD4
35% decrease in HCV VL
0.02
Q log10 increase in HIV VL
72% increase in HCV VL
0.008
Q 10log10 increase in HCV VL
15% increase in ALT
0.001
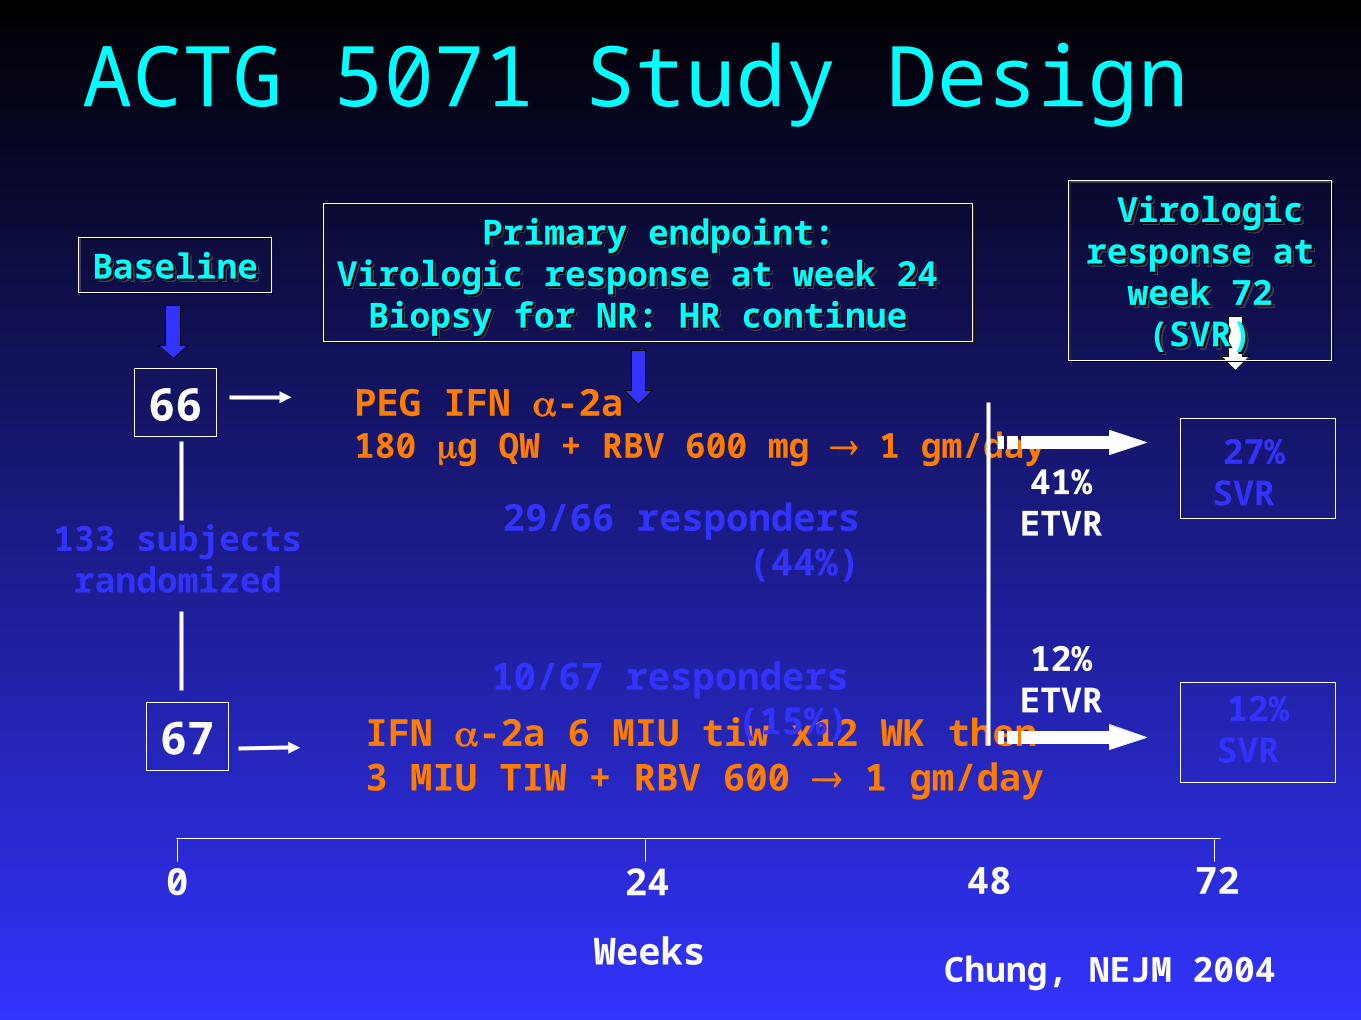
ACTG 5071 Study Design
IFN -2a 6 MIU tiw x12 WK then 3 MIU TIW + RBV 600 1 gm/day
PEG IFN -2a 180 g QW + RBV 600 mg 1 gm/day
133 subjects randomized
BaselineBaselineBaselineBaseline
66
67
0 24
41% ETVR
12% ETVR
48
27% SVR
Virologic Virologic response at response at
week 72 week 72 (SVR)(SVR)
Virologic Virologic response at response at
week 72 week 72 (SVR)(SVR)
12% SVR
72
Weeks
10/67 responders (15%)
29/66 responders (44%)
Primary endpoint:Primary endpoint:Virologic response at week 24 Virologic response at week 24
Biopsy for NR: HR continue Biopsy for NR: HR continue
Primary endpoint:Primary endpoint:Virologic response at week 24 Virologic response at week 24
Biopsy for NR: HR continue Biopsy for NR: HR continue
Chung, NEJM 2004

Interferon Interferon PegIFNPegIFN
Overall Response (SVR)Overall Response (SVR) 15%15% 44%44%
Genotype 1Genotype 1 7%7% 33%33%
Non Type 1Non Type 1 40%40% 82%82%
Bx Results (non responders) Bx Results (non responders) 40%40% 26%26%
VR+BRVR+BR 37%37% 53%53%
Absolute CD4Absolute CD4 -215-215 -158-158
CD4 %CD4 % +2.5+2.5 +3.5+3.5
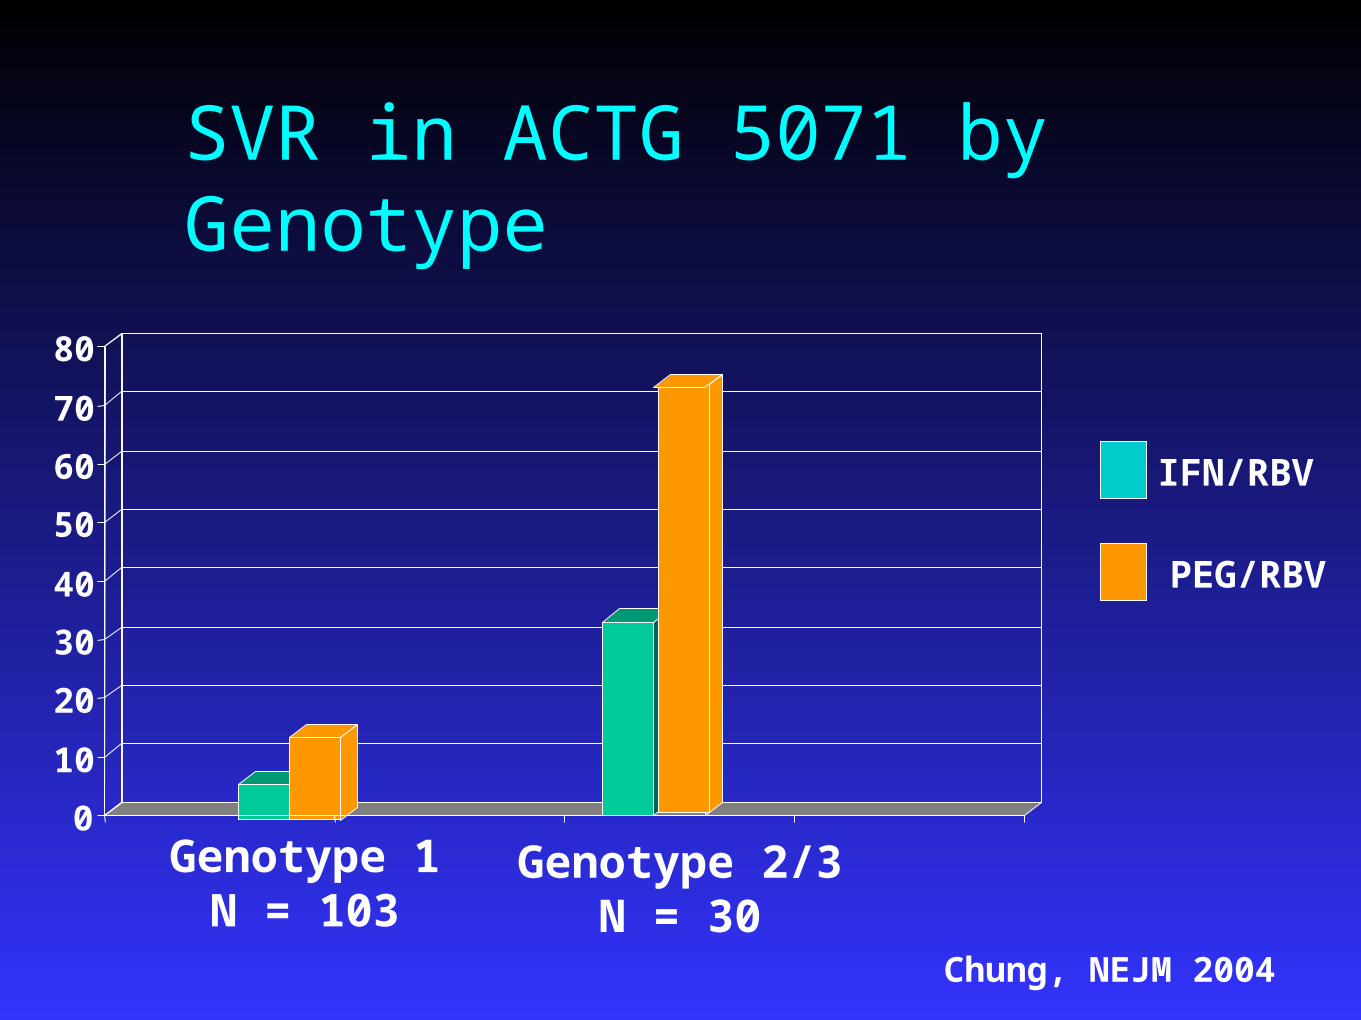
SVR in ACTG 5071 by Genotype
0
10
20
30
40
50
60
70
80
Genotype 1N = 103
Genotype 2/3N = 30
IFN/RBV
PEG/RBV
Chung, NEJM 2004
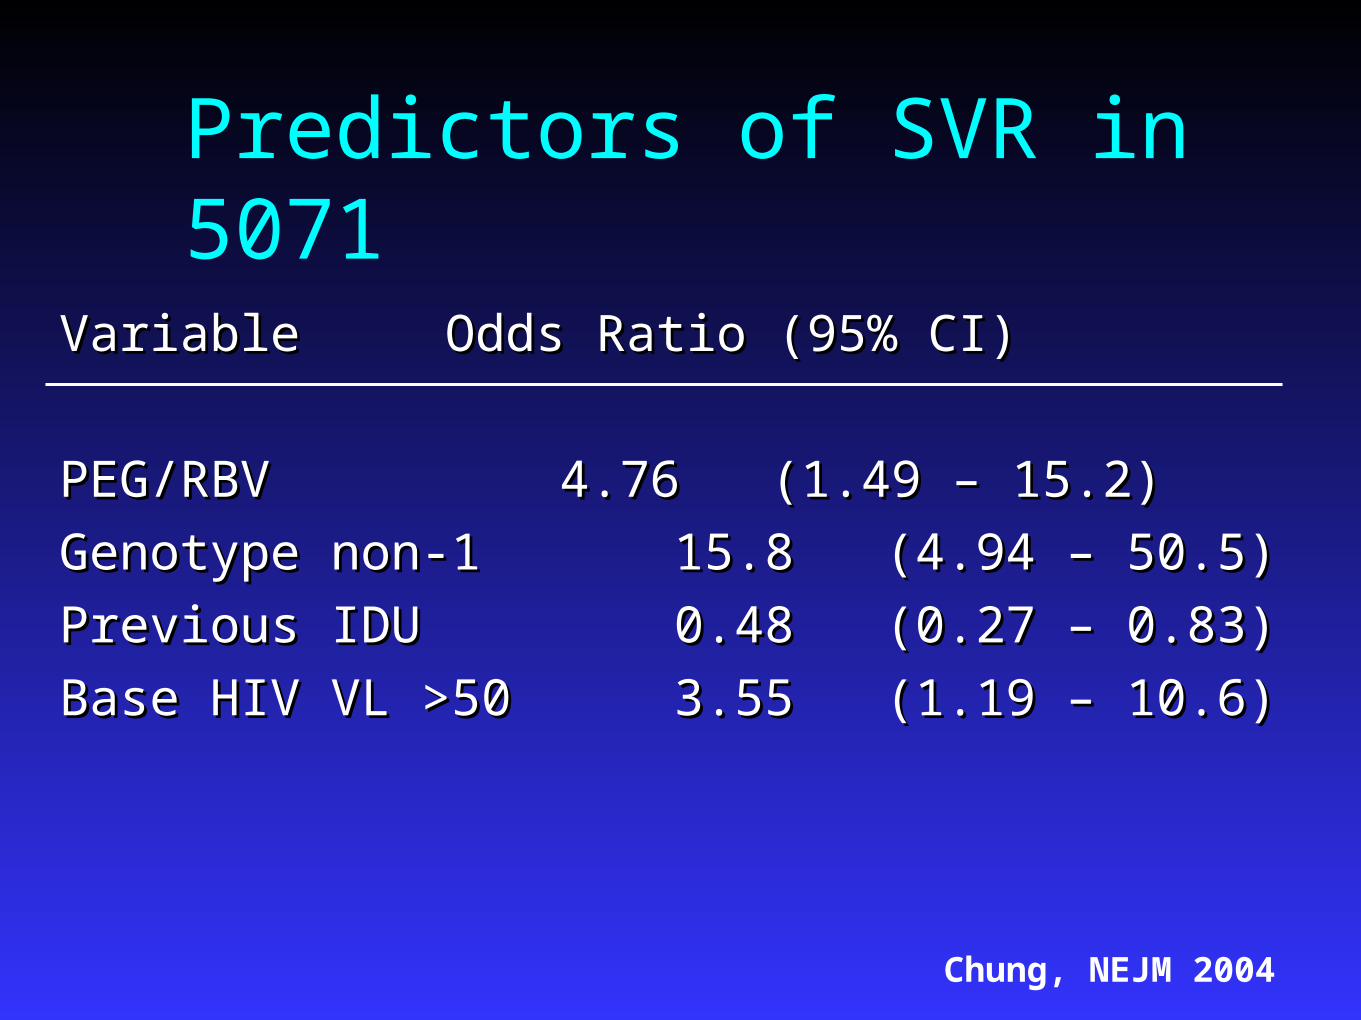
Predictors of SVR in 5071
VariableVariable Odds Ratio (95% CI)Odds Ratio (95% CI)
PEG/RBVPEG/RBV 4.76 (1.49 – 15.2)4.76 (1.49 – 15.2)
Genotype non-1 Genotype non-1 15.8 (4.94 – 50.5)15.8 (4.94 – 50.5)
Previous IDU Previous IDU 0.48 (0.27 – 0.83)0.48 (0.27 – 0.83)
Base HIV VL >50 Base HIV VL >50 3.55 (1.19 – 10.6)3.55 (1.19 – 10.6)
Chung, NEJM 2004

APRICOT
868 patients with HIV/HCV enrolled at 95 868 patients with HIV/HCV enrolled at 95 centers in 19 countriescenters in 19 countries
Randomized to one of three arms for 48 weeks:Randomized to one of three arms for 48 weeks:IFN alfa-2a (3 MIU TIW) + RBV 800 mgIFN alfa-2a (3 MIU TIW) + RBV 800 mgPEG-IFN alfa 2a 180 PEG-IFN alfa 2a 180 g QW + placebog QW + placeboPEG-IFN alfa 2a 180 PEG-IFN alfa 2a 180 g QW + RBV 800 mgg QW + RBV 800 mg
5 –7 % had CD4 <2005 –7 % had CD4 <200 25% (PEG/RBV) to 39% (IFN/RBV) 25% (PEG/RBV) to 39% (IFN/RBV)
discontinuation rate and 20% dose reduction ratediscontinuation rate and 20% dose reduction rateTorriani, NEJM 2004
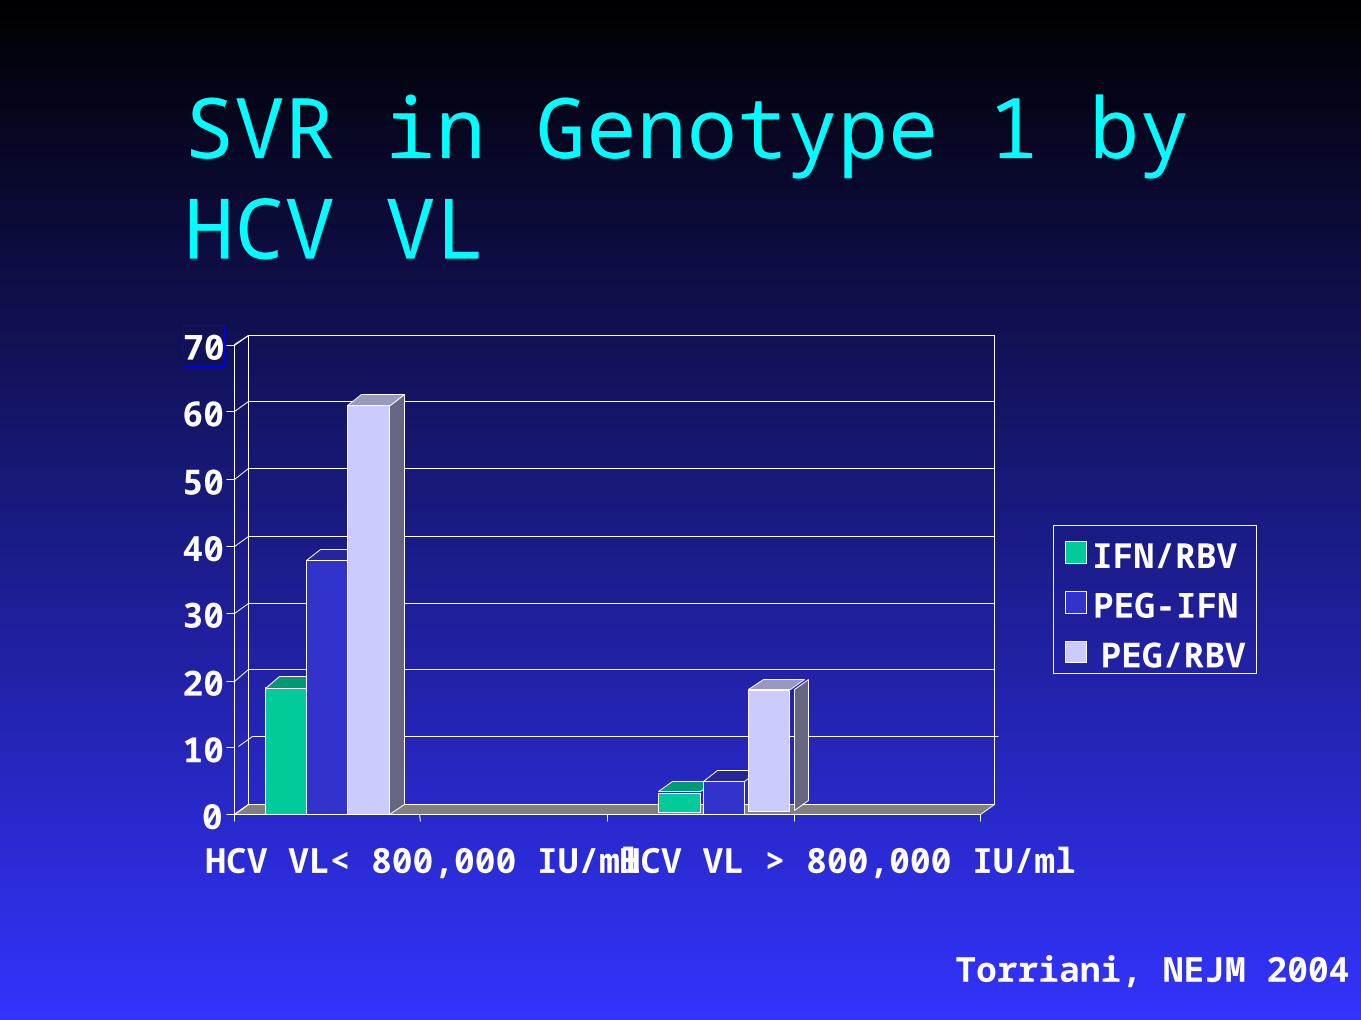
SVR in Genotype 1 by HCV VL
0
10
20
30
40
50
60
70
HCV VL< 800,000 IU/ml HCV VL > 800,000 IU/ml
IFN/RBV
PEG-IFN
PEG/RBV
Torriani, NEJM 2004
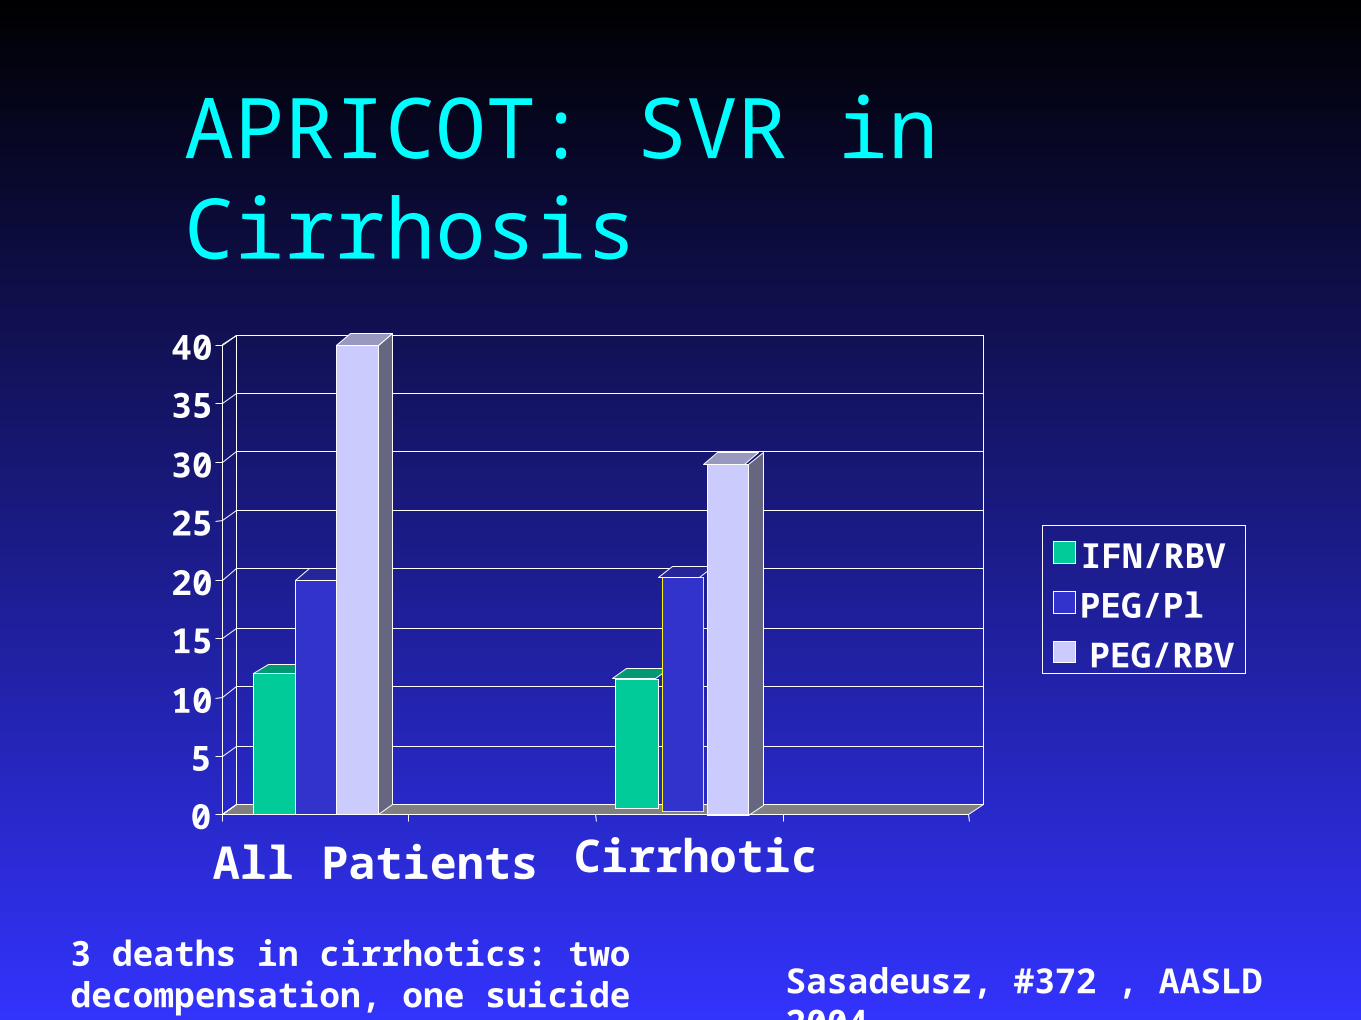
APRICOT: SVR in Cirrhosis
0
5
10
15
20
25
30
35
40
Cirrhotic
IFN/RBV
PEG/Pl
PEG/RBV
All Patients
3 deaths in cirrhotics: two decompensation, one suicide Sasadeusz, #372 , AASLD 2004
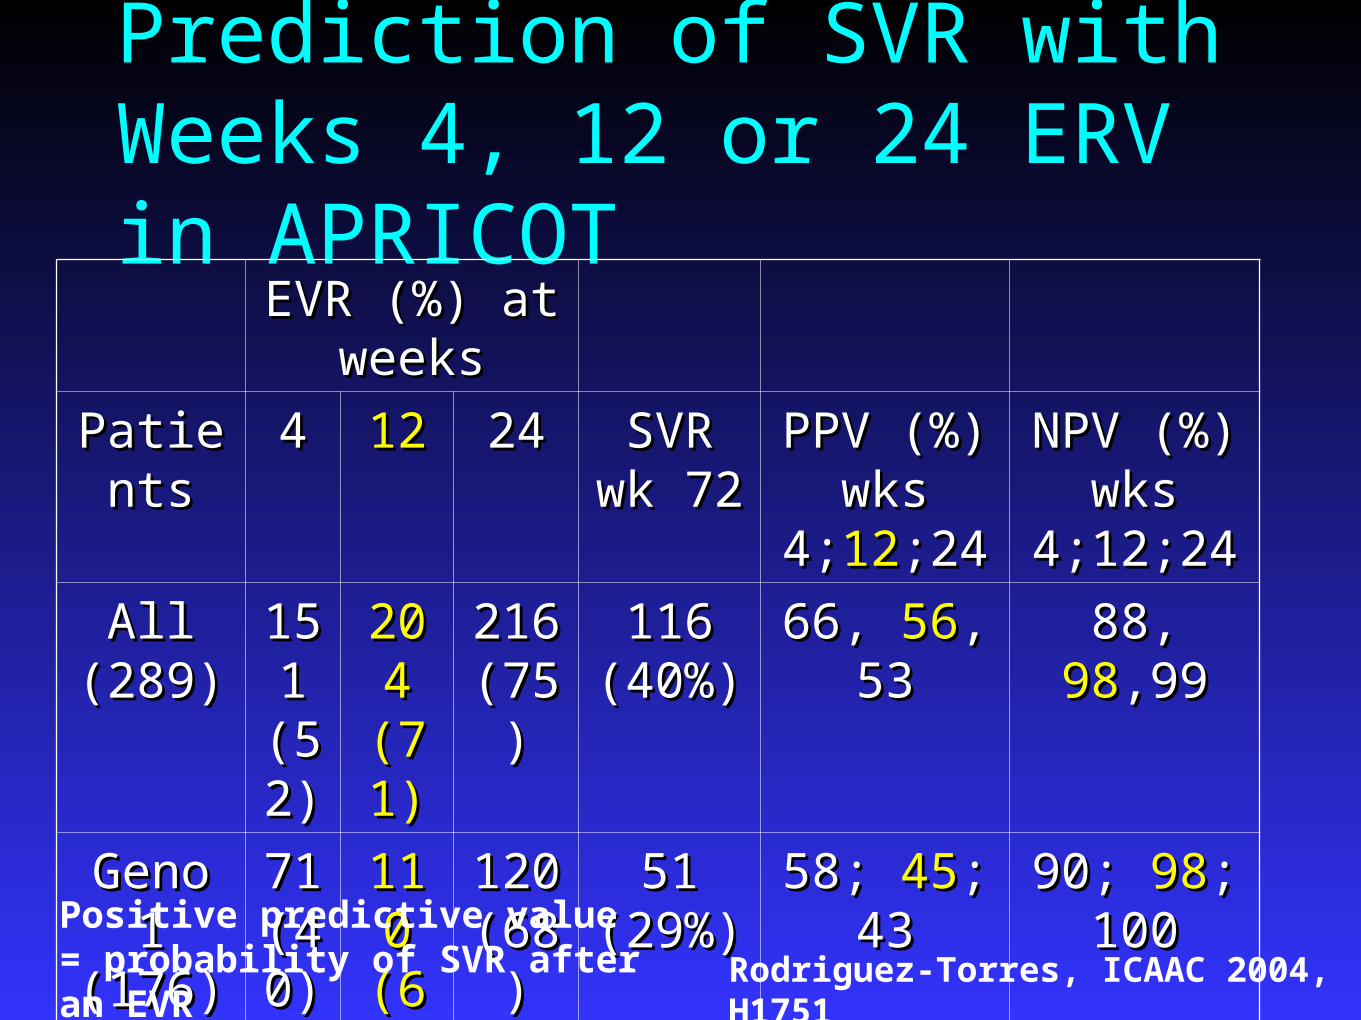
Prediction of SVR with Weeks 4, 12 or 24 ERV in APRICOT
EVR (%) at EVR (%) at weeksweeks
PatientsPatients 44 1212 2424 SVR SVR wk 72wk 72
PPV (%) PPV (%) wks wks
4;4;1212;24;24
NPV (%) NPV (%) wks wks
4;12;244;12;24
All All (289)(289)
15151 1
(52(52))
204 204 (71)(71)
216 216 (75)(75)
116 116 (40%)(40%)
66, 66, 5656, 53, 53 88, 88, 9898,99,99
Geno 1 Geno 1 (176)(176)
71 71 (40(40))
110 110 (63)(63)
120 120 (68)(68)
51 51 (29%)(29%)
58; 58; 4545; 43; 43 90; 90; 9898; ; 100100
Geno Geno 2,3 (95)2,3 (95)
76 76 (80(80))
84 84 (88)(88)
85 85 (89)(89)
59 59 (62%)(62%)
74; 74; 7070; 69; 69 84; 84; 100100; ; 100100
Positive predictive value = probability of SVR after an EVR Rodriguez-Torres, ICAAC 2004, H1751

Predictors of SVR for PEG-IFN/RBV Arm in APRICOT
VariableVariable Odds RatioOdds Ratio
Genotype non-1 Genotype non-1 3.373.37
ALT quotient (I unit incr)ALT quotient (I unit incr) 1.171.17
Age (per 10 year decr)Age (per 10 year decr) 1.281.28
No cirrhosisNo cirrhosis 1.961.96
HCV VL <800,000 IU/mlHCV VL <800,000 IU/ml 3.563.56
Cooper, Bangkok IAC 2004
*Baseline CD4 count did not predict SVR
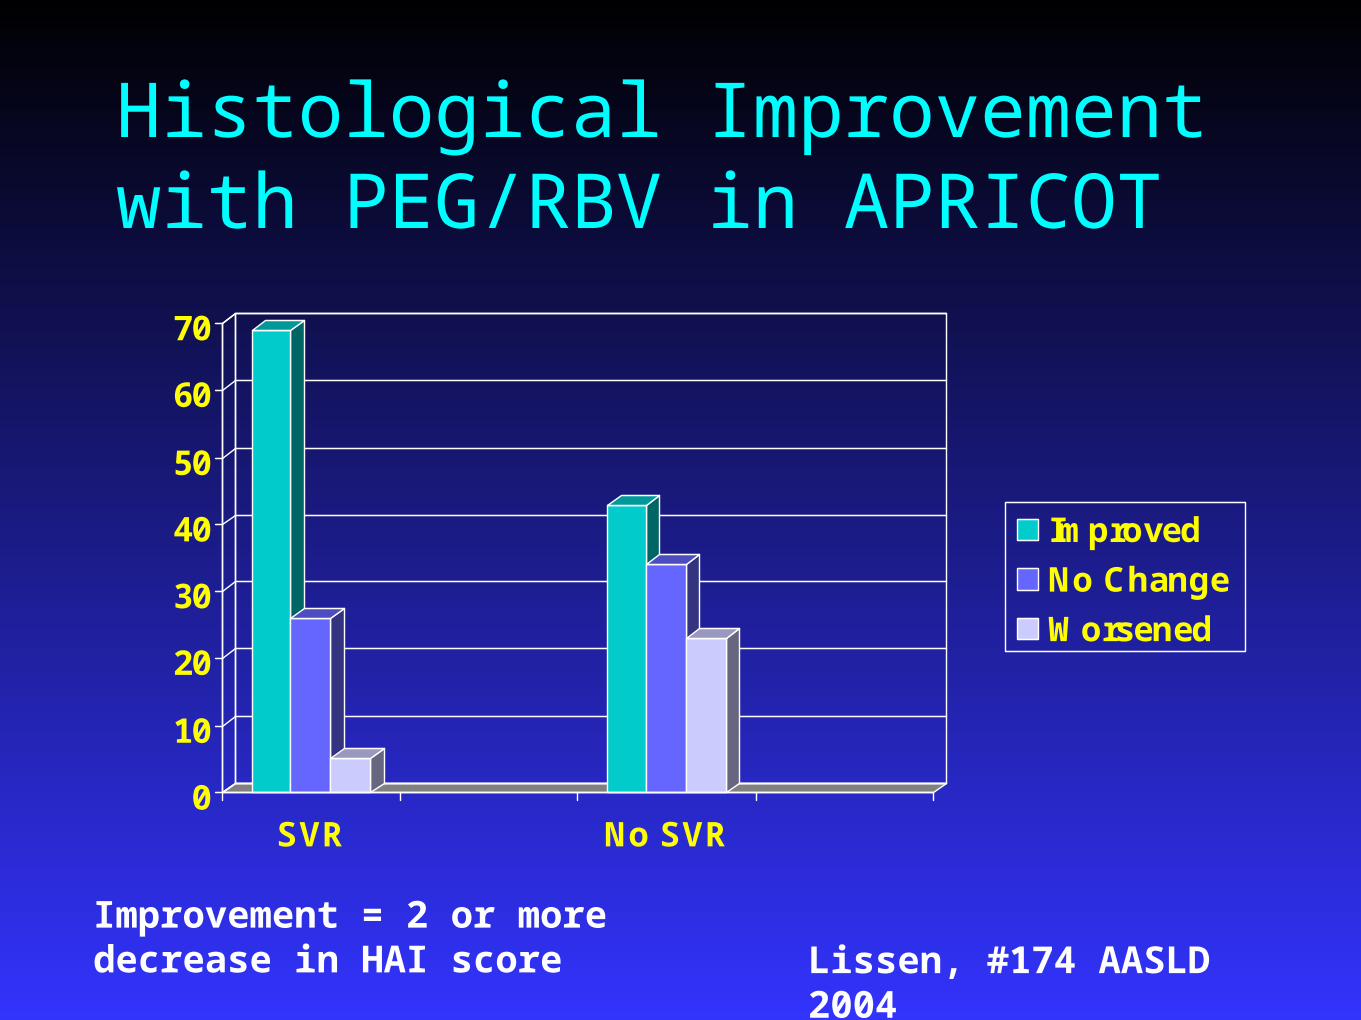
Histological Improvement with PEG/RBV in APRICOT
0
10
20
30
40
50
60
70
SVR No SVR
Improved
No Change
Worsened
Improvement = 2 or more decrease in HAI score Lissen, #174 AASLD 2004

Adverse events in APRICOTAdverse event PEG-IFN/Placebo PEG-IFN + ribavirin Number Patients 286 288
D/C for any reason 31% 25% Serious Adverse events 21% 17%Dose reduce - anemia 8% 17%Dose reduce - WBC 30% 28%Influenza like symptoms Headache 38% 39% Fatigue 41% 44% Myalgias 33% 36% Fever 43% 44%
GI symptoms Diarrhea 26% 28% Nausea 27% 30%
Psychiatric symptoms Depression 20% 26% Insomnia 21% 26% Asthenia 22% 28%
Torriani, NEJM 2004
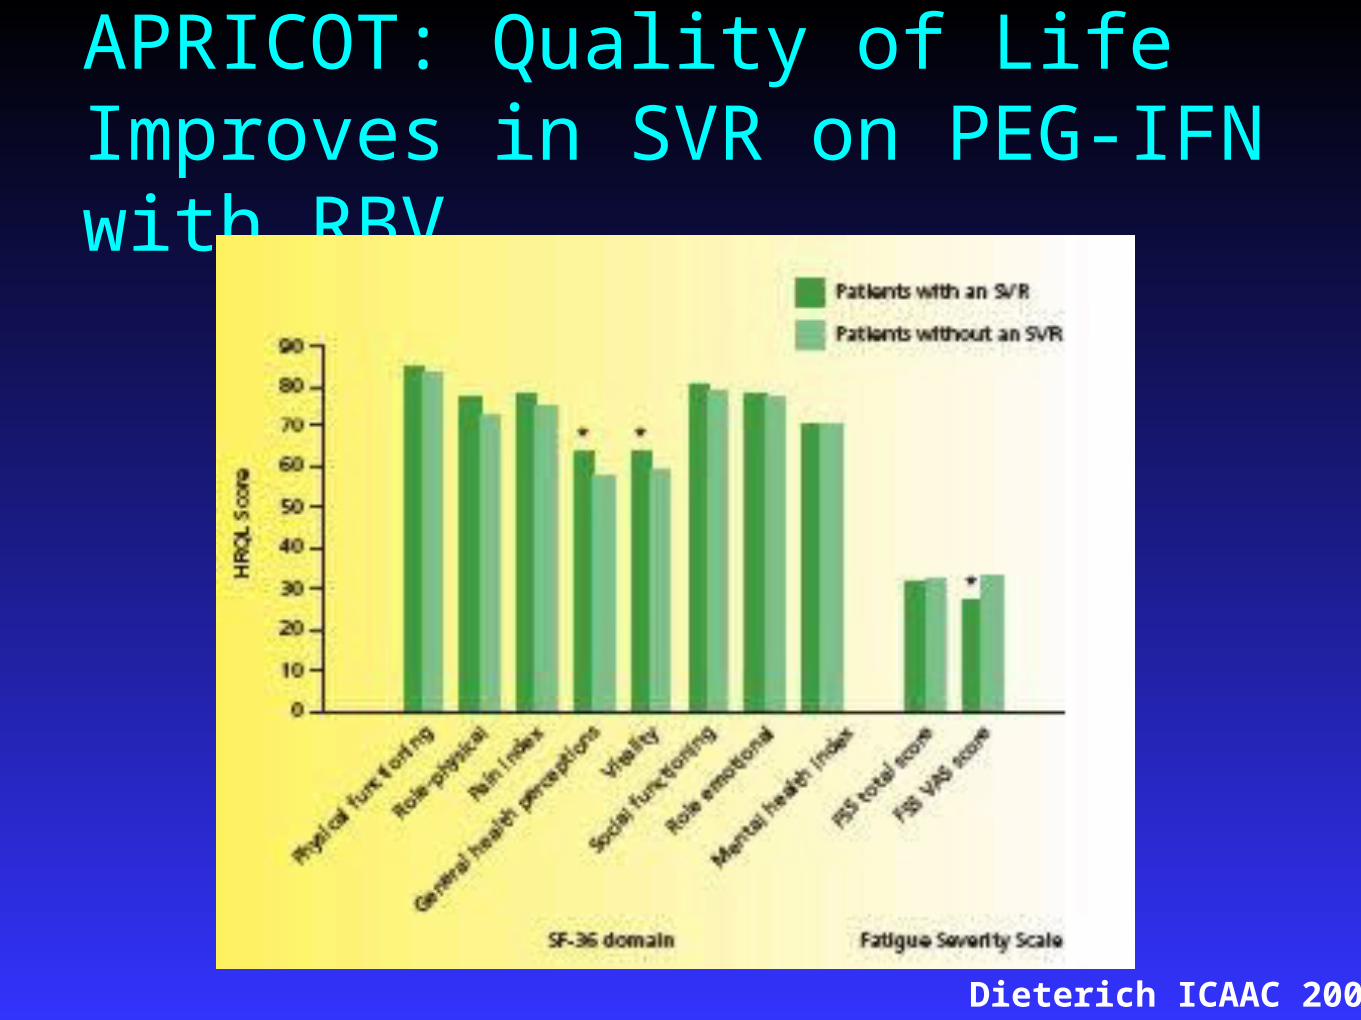
APRICOT: Quality of Life Improves in SVR on PEG-IFN with RBV
Dieterich ICAAC 2004

APRICOT Summary
PEG-IFN + RBV was the most effective PEG-IFN + RBV was the most effective regimen for clearance of HCVregimen for clearance of HCV
Relapse rate was lower than 5071:Relapse rate was lower than 5071: Genotype 1: ETR 38% and SVR 29%Genotype 1: ETR 38% and SVR 29% Genotype 2/3: ETR 64% and SVR 62%Genotype 2/3: ETR 64% and SVR 62%
APRICOT had more Caucasian patients than APRICOT had more Caucasian patients than 5071 – in HCV alone, African-Americans 5071 – in HCV alone, African-Americans have a lower response ratehave a lower response rate
Torriani, NEJM 2004
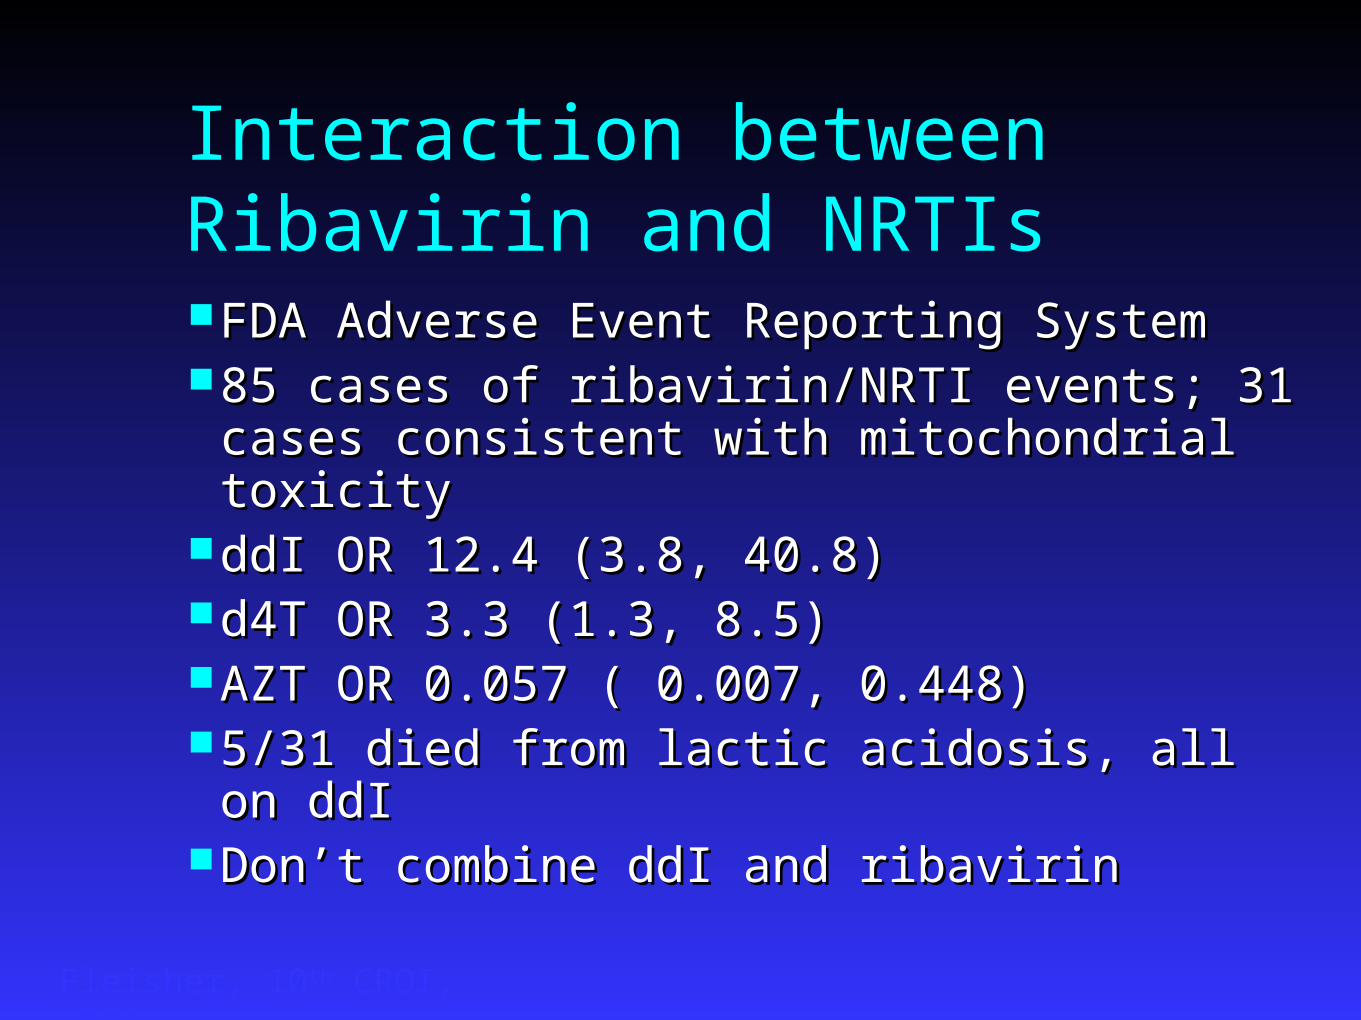
Interaction between Ribavirin and NRTIs FDA Adverse Event Reporting SystemFDA Adverse Event Reporting System 85 cases of ribavirin/NRTI events; 31 cases 85 cases of ribavirin/NRTI events; 31 cases
consistent with mitochondrial toxicityconsistent with mitochondrial toxicity ddI OR 12.4 (3.8, 40.8)ddI OR 12.4 (3.8, 40.8) d4T OR 3.3 (1.3, 8.5)d4T OR 3.3 (1.3, 8.5) AZT OR 0.057 ( 0.007, 0.448)AZT OR 0.057 ( 0.007, 0.448) 5/31 died from lactic acidosis, all on ddI5/31 died from lactic acidosis, all on ddI Don’t combine ddI and ribavirinDon’t combine ddI and ribavirin
Fleisher, 10th CROI, #763

Effect of AZT on Anemia 107 subjects with HIV/HCV on IFN 3 mu TIW with 107 subjects with HIV/HCV on IFN 3 mu TIW with
RBV 800 mg/day or IFN + placebo for first 16 weeks, RBV 800 mg/day or IFN + placebo for first 16 weeks, then RBV added if HCV VL detectablethen RBV added if HCV VL detectable
Hgb decreased –2.52 g/dl on IFN/RBV compared to –Hgb decreased –2.52 g/dl on IFN/RBV compared to –1.02 g/dl on IFN/Placebo1.02 g/dl on IFN/Placebo
On IFN/RBV, those taking AZT had –3.64 g/dl decrease On IFN/RBV, those taking AZT had –3.64 g/dl decrease compared to no AZT –2.08compared to no AZT –2.08Nadir Hgb in AZT group 10.1 g/dl compared to Nadir Hgb in AZT group 10.1 g/dl compared to
13.0 with no AZT13.0 with no AZT 60% of subjects on AZT had anemia related dose 60% of subjects on AZT had anemia related dose
reduction of RBV compared to 16% of those not on AZT reduction of RBV compared to 16% of those not on AZT
Bräu, Hepatotolgy, 2004; 39:989

Drug-Drug Interactions: NRTI and HCV TherapyRibavirin - inhibits the phosphorylation of AZT, d4T and Ribavirin - inhibits the phosphorylation of AZT, d4T and
ddC in vitroddC in vitroRibavirin - enhances the anti-HIV activity of didanosine Ribavirin - enhances the anti-HIV activity of didanosine
(ddI) by increasing intracellular conversion to its active (ddI) by increasing intracellular conversion to its active metabolite and may also increase its toxicitymetabolite and may also increase its toxicity
ddI/d4T and IFN increase mitochondrial toxicityddI/d4T and IFN increase mitochondrial toxicity77% of 47 patients lost weight and 65% had elevated 77% of 47 patients lost weight and 65% had elevated
lactate levels on d4T or ddI with IFN/RBVlactate levels on d4T or ddI with IFN/RBV11
16% of 416 patients with ddI and IFN developed 16% of 416 patients with ddI and IFN developed MT over 48 weeksMT over 48 weeks22
Competition among AZT, d4T, and ribavirin in vitro for Competition among AZT, d4T, and ribavirin in vitro for thymidine kinase phosphorylation is not clinically thymidine kinase phosphorylation is not clinically importantimportant
1Gonzalez-Benayas et al. 42nd ICAAC; San Diego, 2002: Abs #H1727.2Hor ICAAC 2002 Abs H1735.


Incidence of Elevated ALT/AST with HAART: The TARGET Cohort
NNRTIs NRTIs Pls
NV
P
EF
V
ZD
V
d4
T
Co
mb
ivir
3T
C
dd
l
AB
C
NF
V
SQ
V
RT
V
IDV
AP
V
5
4
3
2
1
0
Ra
te (
pe
r 1
00
pe
rso
n-y
ea
rs)
Imperiale et al. 4th International Workshop on Adverse Events and Lipodystrophy in HIV; 2002: Abstract 89.
Risk of ALT/AST >5 x ULN among 2198 patients who received antiretroviral
therapy between 1997 and 2001

Incidence and Relative Risk of Grade 3-4 Hepato-toxicity* Associated With Antiretroviral Regimens
ART RegimenART Regimen
NRTINRTI
PIsPIs
RTV (single PI)RTV (single PI)
RTV + SQVRTV + SQV
SQVSQV
IDVIDV
NFVNFV
TotalTotal
No. of Subjects
87
211
22
28
17
117
51
298
Cases
5
26
6
9
1
8
3
31
Person-Time(100 Person-Month)
246
795
96
79
98
520
153
1041
Incidence (Cases/100
Person-Months)(95% CI)
246
795
96
79
98
520
153
1041
Relative Risk (95% CI)
1.0
2.2 (0.9-5.4)
4.8 (1.6-14.1)
5.6 (2.1-15.3)
1.0 (0.1-8.2)
1.2 (0.4-3.5)
1.0 (0.3)-4.1)
NA
*>5 x ULN AST or ALT levels; > 10 x ULN AST or ALT
Sulkowski. JAMA 2000;283(1):74.

Hepatotoxicity associated with NNRTI
8.2 (3.6-15.6)897EFV
16.7 (11.8-22.6)34203NVP
Incidence (95% CI)Cases (Grade 4)
N*
Sulkowski, M. et al. 8th CROI, Chicago, 2001, #618
* 49% NVP recipients HCV+; 45% EFV recipients HCV+. In multivariate regression analysis, Grade 4 hepatotoxicity was determined only by CD4 increase of >50 cells/uL from baseline.

Impact of PI Containing regimens on HCVBenhamou Y et al, Hepatology 2001;34:283-7
PI PI ContainingContaining
Non PI Non PI based based
RegimensRegimens
P valueP value
Fibrosis ScoreFibrosis Score 1.25+/-0.111.25+/-0.11 1.53+/-0.091.53+/-0.09 0.020.02
Inflammation Inflammation ScoreScore
1.69+/-0.171.69+/-0.17 2.10+/-0.112.10+/-0.11 0.030.03
Multivariate factors associated with HCV progression: absence of PI based therapy; CD4 count <200 cells/mL; alcohol consumption >5g/d; age >20 at time of infection.

SummaryLiver disease has emerged as a major cause of morbidity and Liver disease has emerged as a major cause of morbidity and
mortality in HIV positive patientsmortality in HIV positive patientsPreservation of liver function is important in the co-infected Preservation of liver function is important in the co-infected
populationpopulationMust balance HIV therapy with liver healthMust balance HIV therapy with liver healthTherapies for HCV are not easy, come with significant side Therapies for HCV are not easy, come with significant side
effects and may interact with HIV therapieseffects and may interact with HIV therapiesNewer HCV regimens including serine protease inhibitors Newer HCV regimens including serine protease inhibitors
that act directly upon HCV are in phase 2 and 3 trials nowthat act directly upon HCV are in phase 2 and 3 trials nowSince the initiation of NAT for HIV and HCV RNA in blood Since the initiation of NAT for HIV and HCV RNA in blood
donations, the nation’s blood supply has become significantly donations, the nation’s blood supply has become significantly safersafer
Related Documents