9/24/2018 1 Henry Ford Health System’s No Harm Campaign Martin Levesque, MPH, MBA, CIC, FAPIC System Director, Infection Prevention and Control Henry Ford Health System, Detroit, Mich. Disclosures ¯\_(ツ)_/¯ Nothing of significance to disclose…

Welcome message from author
This document is posted to help you gain knowledge. Please leave a comment to let me know what you think about it! Share it to your friends and learn new things together.
Transcript

9/24/2018
1
Henry Ford Health System’s
No Harm Campaign
Martin Levesque, MPH, MBA, CIC, FAPIC
System Director, Infection Prevention and Control
Henry Ford Health System, Detroit, Mich.
Disclosures
¯\_(ツ)_/¯Nothing of significance to disclose…

9/24/2018
2
Henry Ford Health System
• A not-for-profit corporation
• 25,554 full-time equivalent
employees
• More than 31,000 total employees
• More than 7,400 nurses including
501 from Canada; more than 4,400
allied health professionals
• More than 117,000 hospital
admissions
• 61 percent of hospital admissions
are by patients ages 50 and older
• More than 74,800 surgical
procedures performed
• Payor distribution:
– Medicare and Medicare HMO, 42%
– Blue Cross, 25%
– Medicaid and Medicaid HMO, 17%
– Other, 16%
• Revenue, $5.98 billion; Net
income, $203.6 million;
Uncompensated care, $443 million
Source: Henry Ford Health System Fact Sheet, 2018, produced by the Public Relations Department
Henry Ford Health System
• Henry Ford Hospital
– 877-bed tertiary care hospital
– 10 ICUs (152 beds), NICU (35 beds)
– One of the largest teaching
hospitals in U.S.
– Level 1 Trauma Center
• Henry Ford Allegiance
– 365-bed Acute Care
– 14-bed ICU
– Level II Trauma
• Henry Ford Macomb
– 361-bed Acute Care
– 2 ICUs (48 beds)
– Level II Trauma
• Henry Ford West Bloomfield
– 175-bed Acute Care
– 3 ICUs (36 beds)
– All private rooms
– Level III Trauma
• Henry Ford Wyandotte
– 360-bed Acute Care
– 3 ICUs (82 beds)
– Level III Trauma
• Henry Ford Kingswood
– 100-bed inpatient psychiatric
– Children, adolescent, and
adults
Source: Henry Ford Health System Fact Sheet, 2018, produced by the Public Relations Department

9/24/2018
3
Henry Ford Health System’s
No Harm Campaign
Some history…
• Early in 2008, Henry Ford Health System launched a
three-year No Harm Campaign
• Initial goal to decrease patient and employee harm
events by 50 percent by 2010
• The broad scope of the “No Harm Campaign” uses an
approach to report and study harm events, research
causality, identify priorities, and change practice to
eliminate all harm to patients and staff.
9/24/2018
4
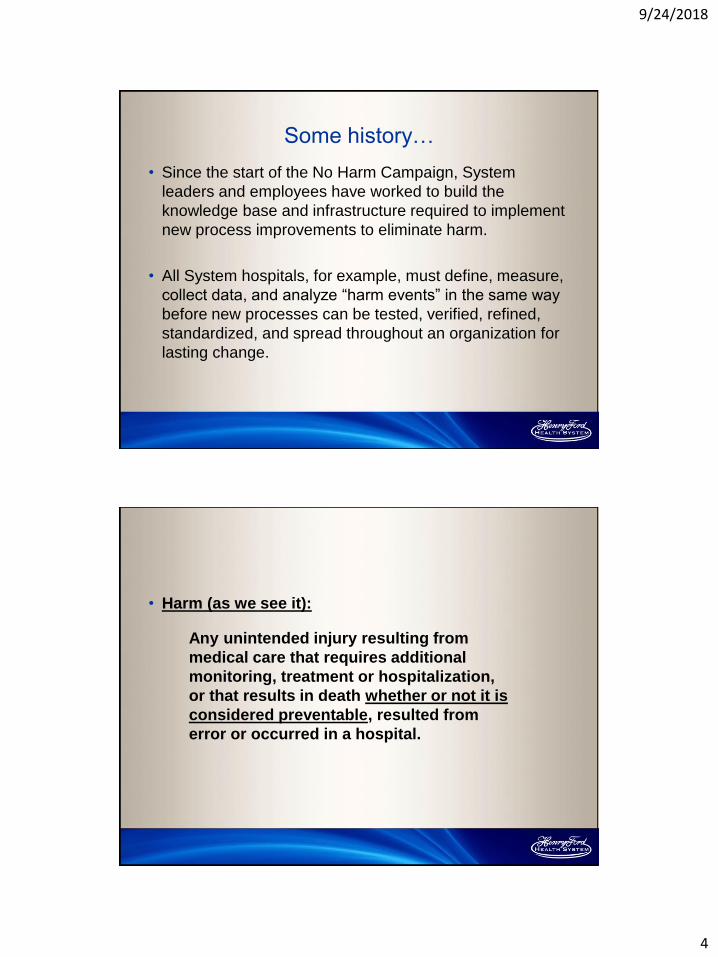
Some history…
• Since the start of the No Harm Campaign, System
leaders and employees have worked to build the
knowledge base and infrastructure required to implement
new process improvements to eliminate harm.
• All System hospitals, for example, must define, measure,
collect data, and analyze “harm events” in the same way
before new processes can be tested, verified, refined,
standardized, and spread throughout an organization for
lasting change.
• Harm (as we see it):
Any unintended injury resulting from
medical care that requires additional
monitoring, treatment or hospitalization,
or that results in death whether or not it is
considered preventable, resulted from
error or occurred in a hospital.

9/24/2018
5
Some history…
• Henry Ford identified its own broad agenda for harm
reduction in all Henry Ford facilities and a unique
aggregate harm score, which includes the following
measures of harm:
– Infection-Related Harm
– Procedure-Related Harm
– Medication-Related Harm
– Care Related Harm
– Other Preventable Harm• Health Care-Acquired Acute Renal Failure
• Employee Injuries
16

9/24/2018
6
17
• Infection Control
– BSI
– VAP
– UTI
– C-diff
– SSI
– Sepsis
• Employee Harm
• Other
– Renal Failure
– Blue Alert
– DVT
Data Sharing – System Level Dashboard

9/24/2018
7
Data Sharing – System Level
Data Sharing – Local Level
Newest member facility, Henry
Ford Allegiance, data started
streaming in July 2017…

9/24/2018
8
The Power of Sharing Data…
Drilling down deeper…
Spark Reports

9/24/2018
9
So How Does This Look
at the Front Line?
Example #1
Delivering Safe and Patient Focused
Care Through the Reduction of Hospital
Acquired Clostridium difficile using a
Multi-Disciplinary Approach

9/24/2018
10
The Challenge…
• Clostridium difficile infection (CDI) is one of the most
common healthcare-associated infections (HAI)
• According to the Center for Disease Dynamics,
Economics, and Policy…
– Cost per CDI - $11,285
– Attributable LOS – 3.3 days
– Contributes to increased morbidity and mortality
• Our Goal: Reduce CDI by 25% from previous year
Source: The Center for Disease Dynamics, Economics & Policy (CDDEP) (https://cddep.org/tool/overall_and_unit_costs_five_most_common_hospital_acquired_infections_hais_us/)
PDCA: PLAN
ENGAGE
Key Stakeholders:
Infection Prevention and Control
Environmental Services
Culinary Wellness
Antimicrobial Stewardship
Nurse Managers
Front Line Staff
Laboratory
Senior Leadership

9/24/2018
11
PDCA: PLANEDUCATE Providers and nursing on C. diff testing appropriateness
Heighten awareness of front line staff on implications and complications of CDI
EVS on the importance of environmental cleaning and disinfection
Front line staff on the importance of cleaning frequently used patient care items
and use patient dedicated equipment for isolation patients
House wide education on the importance of hand hygiene and coaching on
missed moments
Educate providers on increased CDI risk as an adverse effect of antibiotic over-
utilization
Raise awareness on the increased risk of CDI with proton pump inhibitor (PPI)
use
Staff and patients on yogurt as a probiotic
PDCA: PLAN
EXECUTE
Prioritize and target opportunities
Appropriate testing for C. diff
Antimicrobial Stewardship
Implementation of yogurt as probiotic
Increase hand hygiene compliance

9/24/2018
12
PDCA: PLAN
EVALUATE
Root Cause Analysis
Isolation Compliance
Data shared transparently at daily safety huddles
Dashboard reporting with comparison to last year data
PDCA: DO

9/24/2018
13
Isolation Compliance Monitoring
Correct
Isolation
Sign
Hand Hygiene Week ExcitementHand Hygiene
“Caught in the
Moment” Tokens of
Appreciation

9/24/2018
14
PDCA: DO
Post Huddle Working Board for HA C.
diff

9/24/2018
15
Targeted Approach of UV Robot
Patient Education/Information on Yogurt as Probiotic

9/24/2018
16
Staff Awareness and Empowerment
PDCA: Check

9/24/2018
17
As a System, Our C. diff progress
33% reduction since 2014!
PDCA: Check

9/24/2018
18
0
50
100
150
200
250
Q4 2015 Q1 2016 Q2 2016 Q3 2016 Q4 2016 Q1 2017 Q2 2017 Q3 2017
3rd, 4th, 5th Gen CephsDays of Therapy/ 1,000 Patient Days
WYN MAC WB DET
Q4 2015 Q1 2016 Q2 2016 Q3 2016 Q4 2016 Q1 2017 Q2 2017 Q3 2017
WYN 149.34 166.33 159.67 147.75 121.75 118.59 113.93 106.14
MAC 149.38 160.07 140.88 125.68 128.87 142.34 136.49 130.59
WB 189.92 204.3 188.68 175.11 173.2 187.25 156.74 143.17
DET 181.05 176.22 179.41 111.23 110.97 152.79 134.66 127.87
0
10
20
30
40
50
60
Q4 2015 Q1 2016 Q2 2016 Q3 2016 Q4 2016 Q1 2017 Q2 2017 Q3 2017
Quinolone Days of Therapy/ 1,000 Patient Days
WYN MAC WB DET
Quinolones Q4 2015 Q1 2016 Q2 2016 Q3 2016 Q4 2016 Q1 2017 Q2 2017 Q3 2017
WYN 41.96 43.51 42.88 26.97 21.96 17.71 18.92 14.13
MAC 53.63 48.85 40.34 47.37 40.91 48.79 37.77 28.38
WB 37.64 32.74 34.81 28.5 30.26 27.81 17.86 16.05
DET 27.76 31.41 33.35 35.41 30.12 29.4 26.39 23.61

9/24/2018
19
0
50
100
150
200
250
300
350
400
450
500
Q4 2015 Q1 2016 Q2 2016 Q3 2016 Q4 2016 Q1 2017 Q2 2017 Q3 2017
High Risk Antibiotics Days of Therapy/ 1,000 Patient Days
WYN MAC WB DET
67
141
145
742
43
99
277
471
198
0 100 200 300 400 500 600 700 800
Broaden therapy
Change empiric therapy
Change definitive therapy
De-escalation
Enforced restricted/monitored antibiotic policy
Initiate antimicrobial therapy
Other assistance with infectious disease management
Stop therapy; duration sufficient for infection
Stop therapy; no indication for antibiotic(s)
Number of Inventions Attempted
Antimicrobial Stewardship Interventions Attempted 09/2015 -10/2017 at HFWH
• Other stewardship activities not included above include antibiotic dosing and antibiotic allergy updates.
• Intervention acceptance rate is no longer tracked, but interventions had 85% acceptance rate during the
first 6 months of the antimicrobial stewardship program.

9/24/2018
20
Reduction in HA C. diff
Increased Hand
Hygiene Compliance
Focused Daily Post Huddles on HAIs
Proper Isolation
Antimicrobial
Stewardship
PDCA: Act
Continue post daily safety huddles to discuss new HAI
and opportunities for improvement
Partner with EVS to broaden targeted UV robot usage
Maintain a sense of ownership with a collaborative, non-
punitive environment among staff
Maintain high-level antimicrobial stewardship program
with continued support from leadership
System sharing of findings/ trends from Root Cause
Analyses

9/24/2018
21
PDCA: Act
KEYS TO SUCCESS AND LESSONS LEARNED
• The importance of a multi-disciplinary approach proved to be
invaluable to reduce HA C. diff.
• Opportunities to hear and share challenges from front line staff
proved to be an essential component to implementing process
improvements.
• Heighten awareness of front line staff and key stake holders help
promote and move forward all initiatives and improvements.
• Local in-house testing played a vital role in eliminating
inappropriate testing.
• Strong support from Senior Leadership and Physicians help drive a
culture change within HFWH.
Example #2
Delivering Safe and Patient Focused
Care Through the Reduction of
Catheter-Associated Urinary Tract
Infections (CAUTIs)

9/24/2018
22
The Challenge…
• Catheter-associated urinary tract infection (CAUTI) is the fourth most
frequent healthcare-associated infection
• Urinary catheter use in hospitals is common (12% - 16%)
• 3-7% increase risk of acquiring a CAUTI for each day an indwelling
urinary catheter remains in place
• Leads to:
– Unnecessary use of antibiotics
– Possibly an increase in hospital length of stay
– Increase in health care cost ($896/CAUTI)
• Our Goal:
– Achieve equal or better than the NHSN 25th percentile for catheter utilization
and CAUTI rate.
– Reduce urine culture utilization (cultures/100 catheter days)
Source: CDC.gov (https://www.cdc.gov/nhsn/PDFs/pscManual/7pscCAUTIcurrent.pdf)
CDDEP (https://cddep.org/tool/overall_and_unit_costs_five_most_common_hospital_acquired_infections_hais_us/)
PDCA: PLAN
ENGAGE
Key Stakeholders:
• Infection Prevention and Control
• Unit Champions (nurses, providers, patients)
• Pharmacy
• Data Analytics
• EMR
• Laboratory
• Senior Leadership

9/24/2018
23
PDCA: PLANEDUCATE
• Various methods (Healthstream, lectures, rounds, patient
education pamphlet) on:
• Indications for catheter placement and importance of early
removal
• Alternatives to urinary catheter
• Bladder bundle – care of catheter
• Mindful culturing
PDCA: PLAN
EXECUTE
• Epic build for indications for catheter insertion
• Best practice advisory for early removal
• Shift toward electronic surveillance
• Antimicrobial stewardship
• Mindful culturing*
• Alternatives to urinary catheters- identify, innovate and
trial -especially female external devices

9/24/2018
24
A Few Words Regarding “Mindful Culturing”
• Did we create this monster…
Fever = “pan-culturing”
• Take pause, asses for source of fever (blood/urine/gut)
• Urine that is cloudy / foul odor ≠ infection
• Asses where culture is (to be) taken from
– Urine: Foley bag vs straight cath?
– Blood: Central line or peripheral (i.e. line colonization)
– Stool: is patient on pro-motility agents? (i.e. are the laxatives
causing the diarrhea?)
• Repeating cultures to document clearance
PDCA: PLAN
EVALUATE
• Gap Analysis
• Root Cause Analysis
• Dashboard reporting with comparison to national
benchmarks

9/24/2018
25
PDCA: DO
PDCA: Check

9/24/2018
26
PDCA: Act
CAUTI
System sharing of findings/trends from Root Cause
Analyses to identify further opportunities for
improvement
18.7% decrease in CAUTI compared to 2015 rate, with
estimated 24 CAUTI’s avoided annually
Estimated cost savings in CAUTI avoidance = $24,000
annually
Sustained decrease in CAUTI’s over 18 months, nearing
goal of NHSN 25%ile
PDCA: Act
Urine Culturing
23.6% reduction in urine cultures ordered
compared to 2015 rate
Estimated cost savings in urine culture
avoidance = $27,000 annually

9/24/2018
27

9/24/2018
28
Indwelling Urinary Catheter Patient
Information Guide
• 8 page guide for patients
• Patient Advisor was
invaluable to the success of the
team
• Provide insights from a patient’s
unique perspective
• Inform and empower patients
to:
– assure their catheter is
indicated
– cared for properly
– discontinued as soon as
possible
Henry Ford Health System’s
Progress with HAI Reduction
CAUTI CLABSI SSI COLO SSI HYST MRSA Bac. C. diff
2014 Total 167 27 27 5 19 338
2015 Total 137 98 14 3 14 294
2016 Total 111 58 22 5 32 253
2017 Total 60 45 20 5 30 237
2018 YTD 30 28 11 2 15 114 (YTD)

9/24/2018
29
Questions?
Related Documents