Henrique de Campos Meirelles Brazilian-American Chamber of Commerce October 2010 2010 Brazil Economic Conference

Welcome message from author
This document is posted to help you gain knowledge. Please leave a comment to let me know what you think about it! Share it to your friends and learn new things together.
Transcript

Henrique de Campos Meirelles
Brazilian-American Chamber of Commerce
October 2010
2010 Brazil Economic Conference

2
Brazil in 2003
60% of total sovereign debt denominated in dollars
IMF debtor country
High public debt to GDP ratio: 60.6%
Policy rate at 25%
Rising inflation
High country risk premiums and sovereign debt rated as speculative grade
Unemployment rate at 12%
Minimum wage at US$ 60

3
Quick disinflation
Jan 03: 30% (annual rate)
Jul 03: 0%
Inflation on target since 2004
Decrease in the public debt
Decrease in sovereign debt exposure on FX
As a result: decrease in country risk premium
Changes in Economic Policy
2003: Monetary and fiscal policy stance
Austere monetary policy Strong fiscal adjustment

4
Public Sector Net Debt%
of
GD
P
Sources: Central Bank of Brazil
60.6
54.9
50.648.2
47.045.1
42.7
38.4
42.840.6
30
35
40
45
50
55
60
Dec02
Dec03
Dec04
Dec05
Dec06
Dec07
Aug08
Dec08
Dec09
Dec10
marketconsensus
5
Floating Exchange Rate Regime and Build Up of International Reserves
Source: Central Bank of Brazil
international reserves allow for a safe fluctuation of the exchange rate Oct 6th
278.7
Aug 08205.1
0
50
100
150
200
250
Jan02
Jan03
Jan04
Jan05
Jan06
Jan07
Jan08
Jan09
Jan10
US
D b
illi
on

6
Net External Debt and RiskU
SD
bil
lio
n
1Q03165.2
4Q04135.7
-49.5
BBB-
BB+
BB
BB-
B+
BB-
Sources: Central Bank of Brazil and S&P
7
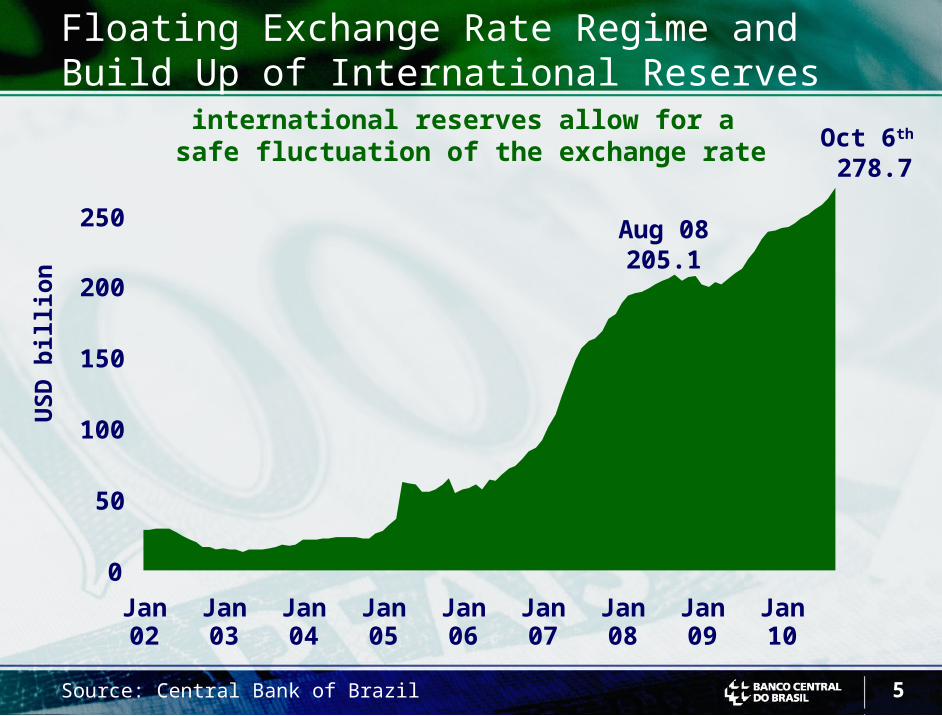
reduction of interest rate with more credibility
amplified effect
lower risk premiums
Macroeconomic Responsability
Virtuous Circle:
macroeconomic stability
inflation targets
lower inflationary risks
decaying net foreign debt
floating exchange and intl reserves
reduced external risk
decline in public debt
primary surpluses
lower fiscal risk
8
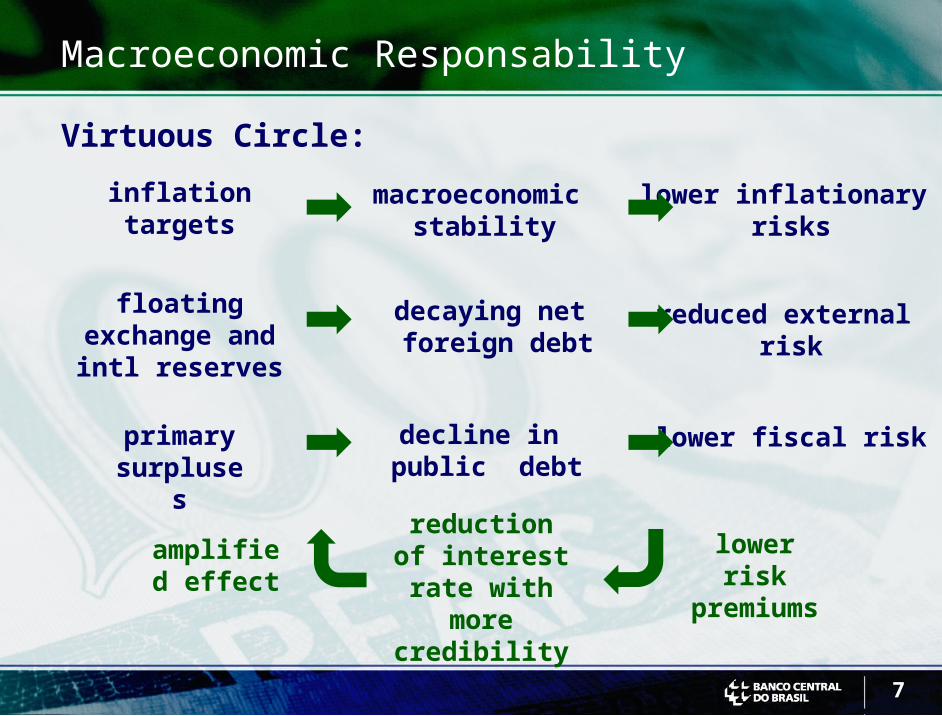
Macroeconomic Policy Framework
Macroeconomic fundamentals of inflation targeting, fiscal responsibility, exchange rate flexibility,
combined with
Adequate prudential policy and solid bank supervision,
resulted in
capacity to absorb internal and external shocks
macroeconomic and financial stability
sustainable growth
investment growth
credit and capital market development

9
100
290
480
670
860
1050
1240
1430
1620
1810
2000
90
100
110
120
130
140
150
160
170
1Q 00
1Q 01
1Q 02
1Q 03
1Q 04
1Q 05
1Q 06
1Q 07
1Q 08
1Q 09
3Q 10
investmentsGFCF (left)
country risk - Brasil t-2 (right)
1995
= 1
00
bas
is p
oin
ts
Investments x Country Risk
2Q 10
Sources: IBGE and JPMorgan
10
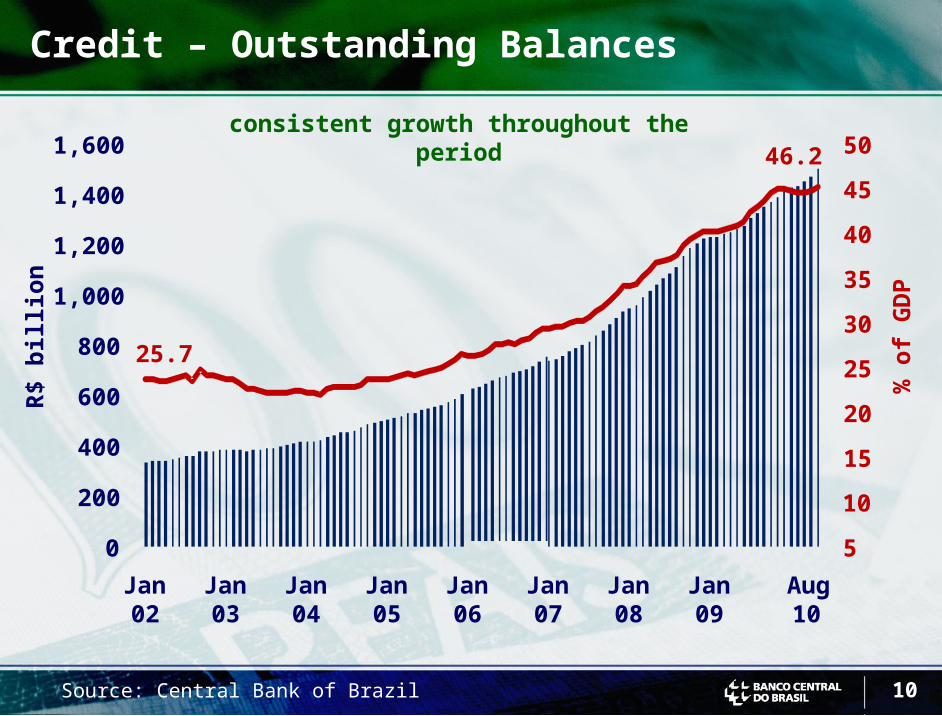
Credit – Outstanding Balances
25.7
46.2
5
10
15
20
25
30
35
40
45
50
0
200
400
600
800
1,000
1,200
1,400
1,600
Jan02
Jan03
Jan04
Jan05
Jan06
Jan07
Jan08
Jan09
Aug10
R$
bil
lio
n
% o
f G
DP
consistent growth throughout the period
Source: Central Bank of Brazil

11Source: CVM (Brazilian Securities Comission) *12 months to August
Capital market – primary issues
0
20
40
60
80
100
2000 2001 2002 2003 2004 2005 2006 2007 2008 2009 2010*
Stocks Commercial papers Others
R$
bil
lio
n

12
Net Foreign Direct Investment
market consensus
US
D b
illi
on
2007-09 35.2
2002-0615.7
0
10
20
30
40
50
02 03 04 05 06 07 08 09 10 11 12 13 14
2010-1437.8
Source: Central Bank of Brazil (market consensus)
13
0 20 40 60 80 100
Spain
Peru
South Africa
Chile
Japan
Canada
Malaysia
Australia
France
Poland
Tailand
Vietnan
Indonesia
German
United Kingdom
Mexico
Russia
United States
Brazil
India
China
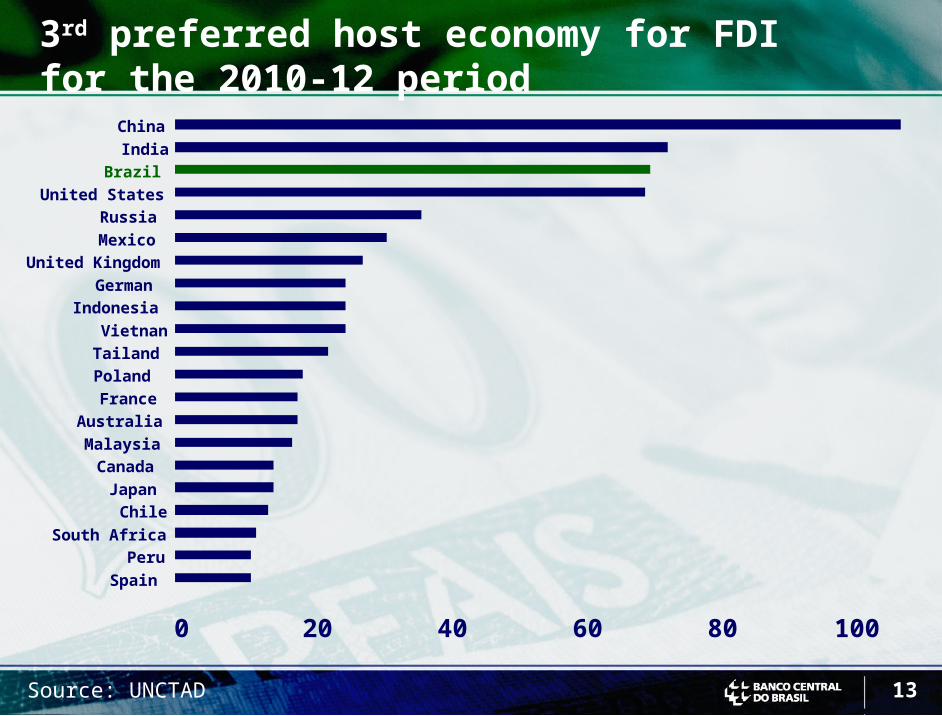
3rd preferred host economy for FDI for the 2010-12 period
Source: UNCTAD
14
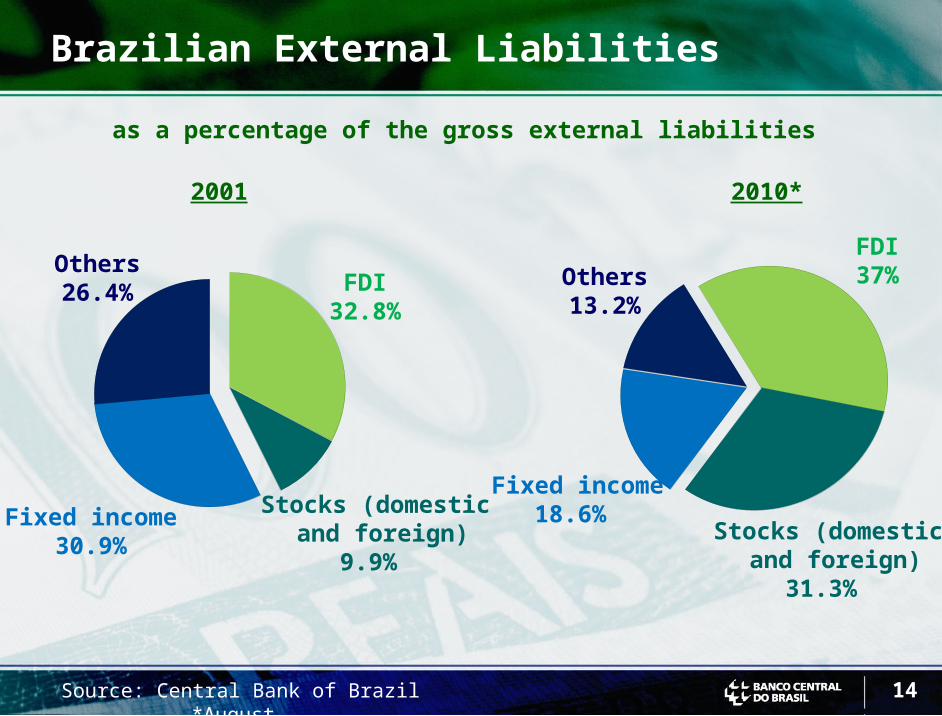
as a percentage of the gross external liabilities
Brazilian External Liabilities
2001 2010*
FDI37%
Stocks (domestic and foreign)
31.3%
Fixed income18.6%
FDI32.8%
Stocks (domestic and foreign)
9.9%
Fixed income 30.9%
Others13.2%
Others26.4%
Source: Central Bank of Brazil*August

15
50
100
150
200
250
80 85 90 95 00 05 10
1980-8925.5
1990-9942.7
2000-09111.1
2010-14229.6
Source: Central Bank of Brazil (market consensus)
ExportsU
SD
bil
lio
n
14

16
Exports’ Diversification
Source: Central Bank of Brazil * July
%
9.9
21.4
23.7
27.8
9
12
15
18
21
24
27
30
2000 2001 2002 2003 2004 2005 2006 2007 2008 2009 2010*
USAEurope
Latin America
Asia

17
Price Stability and Real Payroll Growth
Source: Central Bank of Brazil
% c
han
ge
in 1
2 m
on
ths
Jan
03
= 1
00
95
100
105
110
115
120
125
130
135
-
2
4
6
8
10
12
14
16
18
Jan03
Jan04
Jan05
Jan06
Jan07
Jan08
Jan09
Jul10
IPCA
real payroll
stability generates increasing well-being

18
Formal Job Creation
Source: MTE/CAGED
1804
680
1954
average 96-99128
average 00-03741
average 04-071312
0
500
1000
1500
2000
96 97 98 99 00 01 02 03 04 05 06 07 08 09 10
14 million jobs created since 2003
from January to August
tho
usa
nd
s

19
Unemployment in Brazil
seasonally adjusted
Source: IBGE
6.737
8
9
10
11
12
13
Jan03
Jan04
Jan05
Jan06
Jan07
Jan08
Jan09
Ago10
%

20
relatively dynamic labor market
Source: Bloomberg
Unemployment Rate
25.320.3
18.316.4
13.613.3
11.811.4
1110.810.7
10.510
9.69.3
8.98.78.58.428.38.17.97.87.67.4
6.73
South AfricaSpain
LithuaniaCroaciaIreland
ColombiaGreecePoland
HungaryPortugal
IndiaTurkey
Euro zoneUnited States
FranceBelgium
VenezuelaFinland
ItalyChile
CanadaArgentina
United KingdomGermany
SwedenBrazil

21
0.566
0.56 0.5580.553
0.545
0.5350.532
0.528
0.52
0.5140.509
0.50
0.51
0.52
0.53
0.54
0.55
0.56
0.57
98 99 01 02 03 04 05 06 07 08 09
Source: IBGE/PNAD
Gini Index
Income Inequality Reduction

22
From 2003 to 2009
35.7 million people have entered the middle class
20.5 million have crossed the poverty line upwards
2010-2014 forecast for the current trend
36.0 million more will enter the middle class
14.5 million more will come out of poverty
Family Grant Program (Bolsa Família): reduction of people
in extreme poverty from 12% to the 4% level
Middle Class Growth andPoverty Reduction
Source: FGV-CPS

23
Lower Level of Poverty%
of
po
pu
lati
on
Source: CPS/FGV
28.1
25.4
22.8
19.318.3
16.015.3
10
15
20
25
30
2003 2004 2005 2006 2007 2008 2009

24
Social Mobility
4929 16
47
4440
6695
113
1320 31
0
50
100
150
200
2003 2009 2014*
A/B C D E
mil
lio
ns
of
peo
ple
+44.1% +19.0%
Source: Finance Ministry; * estimated
25Source: FMI (WEO Oct 2010); * estimated
2007 2008 2009 2010
GD
P r
eal
gro
wth
%
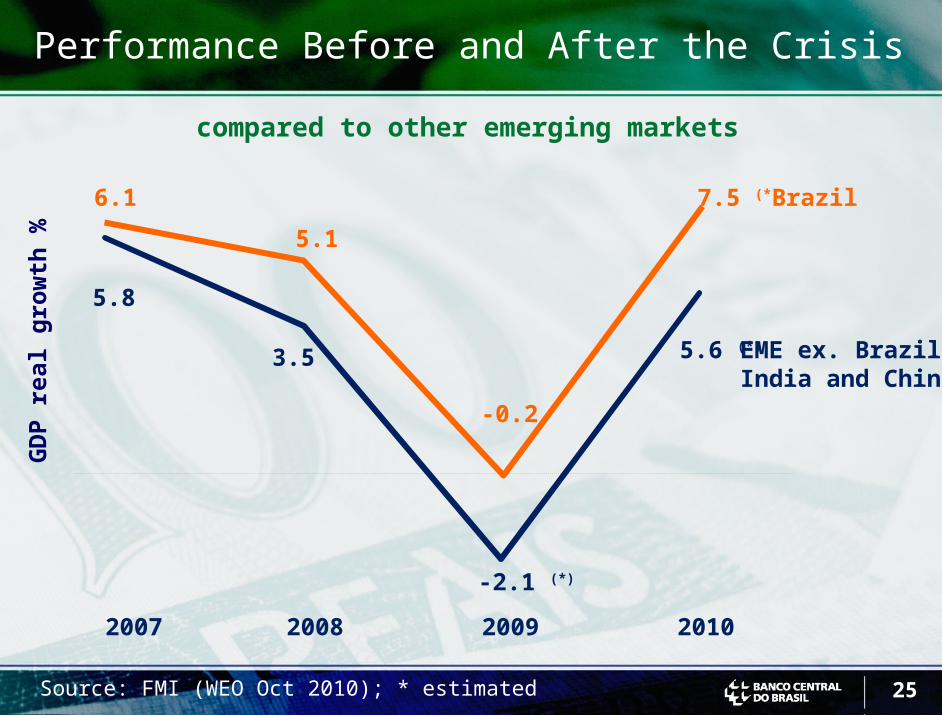
compared to other emerging markets
Performance Before and After the Crisis
5.8
3.5
-2.1 (*)
5.6 (*)
6.1
5.1
-0.2
7.5 (*)
EME ex. Brazil,India and China
Brazil
26
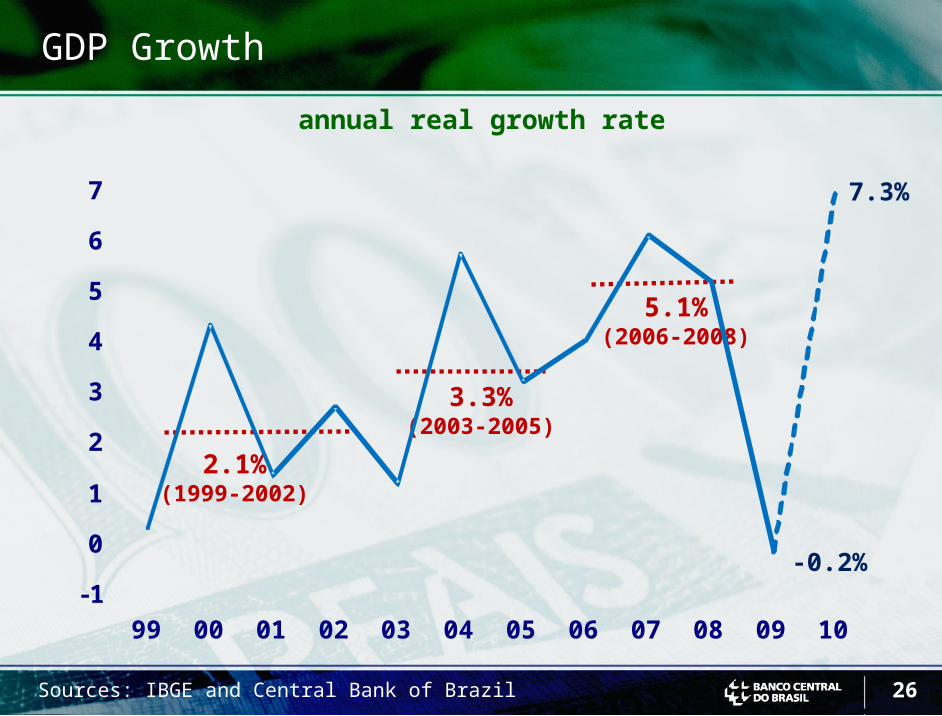
GDP Growth
Sources: IBGE and Central Bank of Brazil
annual real growth rate
-0.2%
7.3%
-1
0
1
2
3
4
5
6
7
99 00 01 02 03 04 05 06 07 08 09 10
2.1%(1999-2002)
3.3%(2003-2005)
5.1%(2006-2008)

27
Agenda for the Future
Level of Domestic Saving
Quality of Public Expenditures
Investment Rate and Infra-Structure
Education
Review and Simplification of the Tax System
Legal Environment more favorable to Business
Incentive to Long Term Investment
28
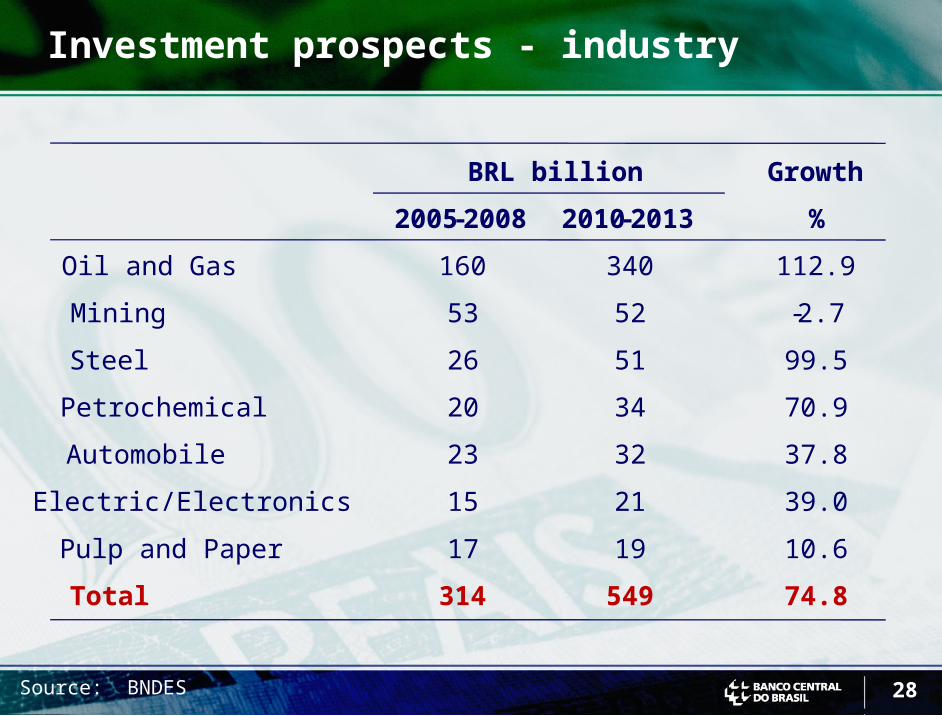
Investment prospects - industry
Source: BNDES
2005-2008 2010-2013 %
Oil and Gas 160 340 112.9
Mining 53 52 -2.7
Steel 26 51 99.5
Petrochemical 20 34 70.9
Automobile 23 32 37.8
Electric/Electronics 15 21 39.0
Pulp and Paper 17 19 10.6
Total 314 549 74.8
BRL billion Growth

29
Investment prospects - infrastructure
Source: BNDES
2005-2008 2010-2013 %
Electricity 67 98 45.2
Telecommunication 66 67 2.1
Sanitation 22 39 76.5
Railways 19 56 195.3
Highways 21 36 73.0
Ports 5 15 217.9
Total 199 310 55.6
BRL billion Growth

Henrique de Campos Meirelles
October 2010
Related Documents