Hennepin Health 300 South Sixth Street, MC 604 Minneapolis, Minnesota 55487-0604

Welcome message from author
This document is posted to help you gain knowledge. Please leave a comment to let me know what you think about it! Share it to your friends and learn new things together.
Transcript
Hennepin Health300 South Sixth Street, MC 604Minneapolis, Minnesota 55487-0604

2021 Consumer Assessment of Healthcare Providers and Systems (CAHPS) Survey - PMAP
Description The Consumer Assessment of Healthcare Providers and Systems (CAHPS) survey is an Agency for Healthcare Research and Quality (AHRQ) program that began in 1995. The survey results are used to evaluate and compare health care providers and to improve patient experience with health care services.
Process and documentation Health Services Advisory Group (HSAG), on behalf of DHS, administers the Consumer Assessment of Healthcare Providers and Systems (CAHPS) survey to the Minnesota Medicaid Health Care Programs (MHCP) members, including Hennepin Health members. HSAG analyzed the 2021 survey results to compare rates of satisfaction with health plans.
The survey results help Hennepin Health measure how satisfied members are with their health plan and helps Hennepin Health identify areas for improvement.
The survey is conducted from January through March annually. Members are asked to reflect on their experiences with their health plan for the last six months. Participation in the survey is voluntary. The survey is mailed to members and if members do not complete it, HSAG calls them to complete the survey. Materials are sent in English and Spanish (Spanish surveys are sent to those identified as Spanish speaking/Spanish is their first language). The mailings also include a telephone number that members can call to request the survey in additional languages.
Analysis Of the 4,050 randomly selected Hennepin Health members, 652 members completed the questionnaire. The sampling criteria included: members who were 18 to 64 years of age and continuously enrolled in one of the Hennepin Health programs –PMAP, MinnesotaCare, or SNBC. The individual program response can be found in Table 1. MinnesotaCare did not have enough members to sample. Therefore, the MinnesotaCare population was combined with other MinnesotaCare plans that did not have sufficient population size to obtain an adequate survey sample size, including: IMCare, PrimeWest (PW) and South Country Health Alliance (SCHA). Of those who responded, Hennepin Health members accounted for 17.9%; IMCare members accounted for 8.5%; PW members accounted for 45.4% percent; and SCHA members accounted for 28.2%. IMCare, PW and SCHA health plans provide services to members in greater Minnesota.

2021 Consumer Assessment of Healthcare Providers and Systems (CAHPS) Survey - PMAP
Table 1. 2021 CAHPS response rates Health program Sample size Complete
surveys Response
rates
Hennepin Health - PMAP 1350 214 16.07%
Hennepin Health - SNBC 1350 355 27.06%
Hennepin Health – MinnesotaCare
1350 80 33.58%
All health plans 30,807 8,907 30.03%
CAHPS results The CAHPS global ratings and composite measures results described below represent the percentage of people who responded most favorably to the questions. The survey results were adjusted for age and self-reported health status using a regression technique, so health plans could be fairly compared.
Global ratings Survey respondents were asked to rate the health care received from their health plan and health care providers, using a scale of 0 to 10, where 0 = worse possible and 10 = best possible. The satisfaction scores represent the percentage of members who responded most positively (a score of 9 or 10) on the following four survey questions:
• Rating of all health care • Rating of personal doctor • Rating of specialist seen most often • Rating of health plan

2021 Consumer Assessment of Healthcare Providers and Systems (CAHPS) Survey - PMAP
Figure 1. 2021 PMAP (F&C-MA) global ratings, all health plans
Data source: HSGA
Figure 1 above provides a comparison of the global ratings for Hennepin Health – PMAP to the rates of the other health plans that also offer PMAP. The program average which is an aggregate of the combined health plan scores for that program, is provided for comparison.
Rating of Health Plan Rating of All HealthCare
Rating of PersonalDoctor
Rating of SpecialistSeen Most Often
F&C-MA Program 60.60% 57.30% 71.40% 68.20%Blue Plus 58.50% 61.40% 72.00% 68.50%HealthPartners 62.40% 62.10% 73.00% 69.10%Hennepin Health (PMAP) 50.30% 54.50% 71.80% 60.90%Itasca Medical Care 60.00% 55.90% 65.40% 66.00%PrimeWest Health System 57.30% 51.10% 74.40% 67.60%South Country Health Alliance 64.60% 54.40% 72.00% 72.40%UCare 69.60% 61.90% 70.50% 71.40%
0%
10%
20%
30%
40%
50%
60%
70%
80%
90%
100%
2021 F&C-MA (PMAP) global ratings - all health plans

2021 Consumer Assessment of Healthcare Providers and Systems (CAHPS) Survey - PMAP
Figure 2 below provides Hennepin Health - PMAP’s overall satisfaction ratings from calendar years 2016 – 2021.
Figure 2. Hennepin Health - PMAP (F&C-MA) composite measure, CY 2016 - 2021
Data source: HSGA
Rating of Health Plan Rating of All Health Care Rating of PersonalDoctor
Rating of Specialist SeenMost Often
2016 39.50% 44.70% 65.00% 53.20%2017 51.30% 47.10% 61.80% 63.90%2018 44.00% 39.70% 66.40% 62.10%2019 44.00% 51.30% 71.80% 61.50%2020 49.80% 51.20% 68.40% 59.70%2021 50.30% 54.50% 71.80% 60.90%
0%
10%
20%
30%
40%
50%
60%
70%
80%
90%
100%
Hennepin Health - PMAPglobal rating CY 2016 - 2021

2021 Consumer Assessment of Healthcare Providers and Systems (CAHPS) Survey - PMAP
Figure 3 below provides a comparison of the overall satisfaction rates for Hennepin Health – MinnesotaCare to the rates of the other health plans that also provide the MinnesotaCare program. The MinnesotaCare program average is provided for comparison. As stated above, the Hennepin Health – MinnesotaCare results are combined with the MinnesotaCare programs of IMCare, PW and SCHA results to provide a reportable rate. The collaborative rates for Hennepin Health – MinnesotaCare are comparable to the program average for all ratings. When the rates are lower than the program average, it is less than 2% difference.
Figure 3. 2021 MinnesotaCare global ratings, all health plans
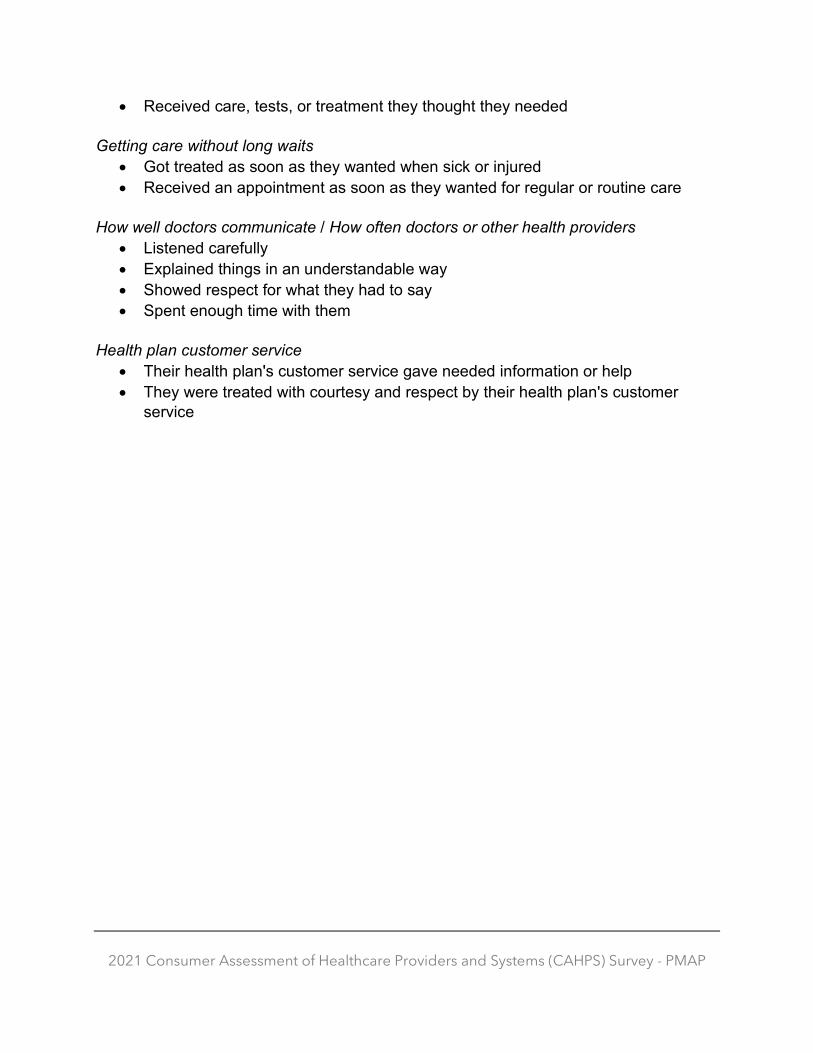
Composite measure The CAHPS composite measures assesses various topics. Members had the option to respond ‘never’, ‘sometimes’, ‘usually’, or ‘always’ to the survey questions. The score is a composite of members who responded most favorably (always) to the questions in that area. Questions in each area are as follows.
Getting needed care • Found it easy to get appointments with specialists
2021 Consumer Assessment of Healthcare Providers and Systems (CAHPS) Survey - PMAP
• Received care, tests, or treatment they thought they needed
Getting care without long waits • Got treated as soon as they wanted when sick or injured • Received an appointment as soon as they wanted for regular or routine care
How well doctors communicate / How often doctors or other health providers
• Listened carefully • Explained things in an understandable way • Showed respect for what they had to say • Spent enough time with them
Health plan customer service
• Their health plan's customer service gave needed information or help • They were treated with courtesy and respect by their health plan's customer
service

2021 Consumer Assessment of Healthcare Providers and Systems (CAHPS) Survey - PMAP
Figure 4 provides a comparison of the composite scores for Hennepin Health - PMAP to the rates of the other health plans that also provide the PMAP. The program average is provided for comparison. The scores for Hennepin Health – PMAP are higher than the program average for Getting Needed Care, How Well Doctors Communicate, and Customer Service. Hennepin Health – PMAP’s Getting Care Quickly is about 4% lower below the program average. Hennepin Health – PMAP’s composite measures rates have been comparable with the other health plans over the past four years.
Figure 4. 2021 PMAP (F&C-MA) composite measures, all health plans
Data Source: HSGA
Getting Needed Care Getting Care Quickly How Well DoctorsCommunicate Customer Service
F&C-MA Program 85.10% 85.20% 95.10% 90.60%Blue Plus 89.10% 87.70% 97.60% 89.70%HealthPartners 82.60% 83.30% 95.40% 92.10%Hennepin Health (PMAP) 85.70% 81.10% 95.20% 91.70%Itasca Medical Care 84.20% 84.10% 96.20% 89.20%PrimeWest Health System 85.50% 86.20% 94.40% 86.30%South Country Health Alliance 83.90% 88.60% 93.70% 92.20%UCare 85.80% 84.60% 93.50% 91.60%
0%10%20%30%40%50%60%70%80%90%
100%
PMAP composite measuresall health plans
2021 Consumer Assessment of Healthcare Providers and Systems (CAHPS) Survey - PMAP
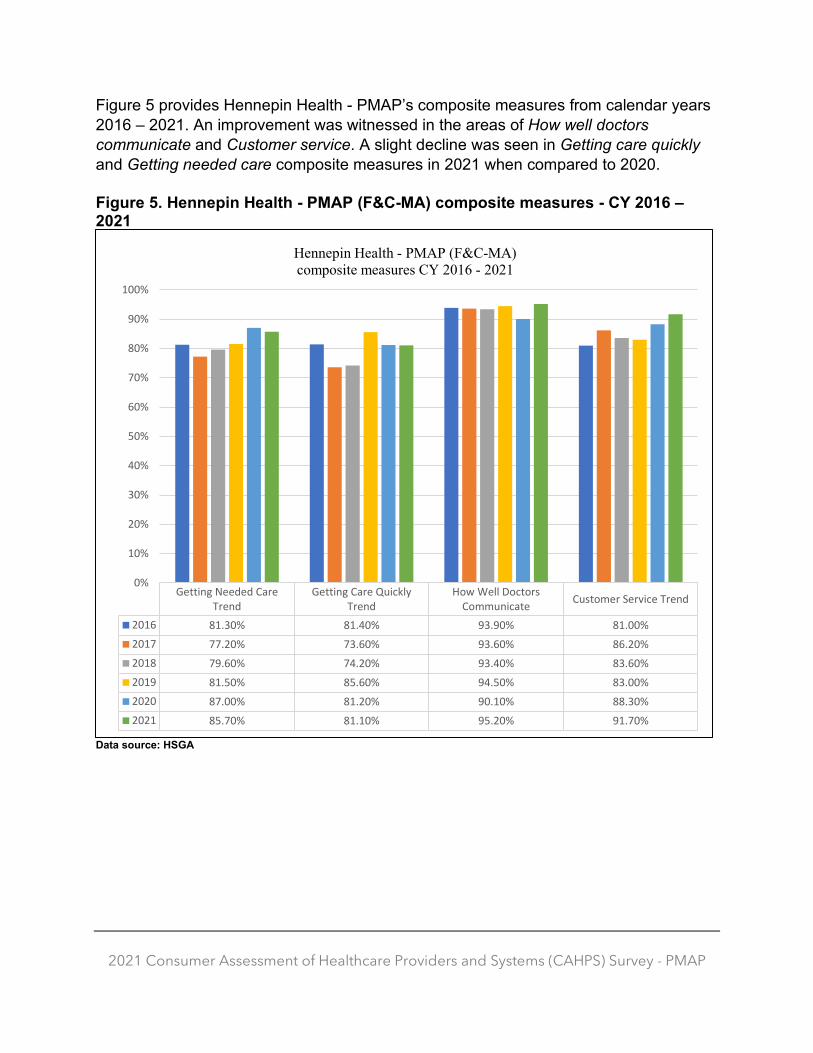
Figure 5 provides Hennepin Health - PMAP’s composite measures from calendar years 2016 – 2021. An improvement was witnessed in the areas of How well doctors communicate and Customer service. A slight decline was seen in Getting care quickly and Getting needed care composite measures in 2021 when compared to 2020. Figure 5. Hennepin Health - PMAP (F&C-MA) composite measures - CY 2016 – 2021
Data source: HSGA
Getting Needed CareTrend
Getting Care QuicklyTrend
How Well DoctorsCommunicate Customer Service Trend
2016 81.30% 81.40% 93.90% 81.00%2017 77.20% 73.60% 93.60% 86.20%2018 79.60% 74.20% 93.40% 83.60%2019 81.50% 85.60% 94.50% 83.00%2020 87.00% 81.20% 90.10% 88.30%2021 85.70% 81.10% 95.20% 91.70%
0%
10%
20%
30%
40%
50%
60%
70%
80%
90%
100%
Hennepin Health - PMAP (F&C-MA)composite measures CY 2016 - 2021
2021 Consumer Assessment of Healthcare Providers and Systems (CAHPS) Survey - PMAP
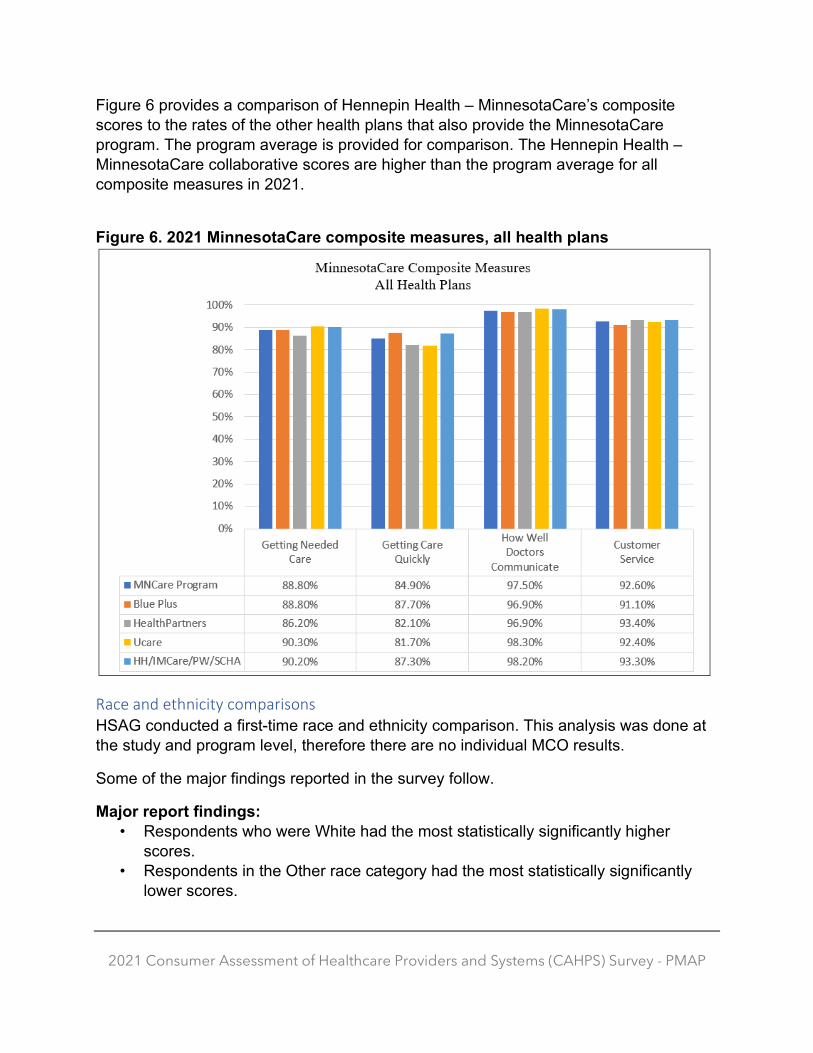
Figure 6 provides a comparison of Hennepin Health – MinnesotaCare’s composite scores to the rates of the other health plans that also provide the MinnesotaCare program. The program average is provided for comparison. The Hennepin Health – MinnesotaCare collaborative scores are higher than the program average for all composite measures in 2021.
Figure 6. 2021 MinnesotaCare composite measures, all health plans
Race and ethnicity comparisons HSAG conducted a first-time race and ethnicity comparison. This analysis was done at the study and program level, therefore there are no individual MCO results.
Some of the major findings reported in the survey follow.
Major report findings: • Respondents who were White had the most statistically significantly higher
scores. • Respondents in the Other race category had the most statistically significantly
lower scores.

2021 Consumer Assessment of Healthcare Providers and Systems (CAHPS) Survey - PMAP
Multi-racial respondents were statistically significantly less likely to: • Have a positive experience with their health plan and health care. • Get an interpreter when they needed one.
White respondents were: • Statistically significantly less likely to get an interpreter when they needed one. • Statistically significantly more likely to not feel like they were judged or treated
unfairly by a doctor because of their race.
Black respondents were: • Statistically significantly more likely to be told they showed up too late to an
appointment to still be seen.
Asian respondents were statistically significantly less likely to: • Get the care they needed. • Get their care quickly. • Have a positive experience with their health plan’s customer service. • Get access to after-hours care.
Other race category respondents were statistically significantly less likely to: • Have a positive experience with their health care and personal doctor. • Receive good communication from their doctor. • Get an interpreter when they needed one. • Get access to after-hours care.

2021 Consumer Assessment of Healthcare Providers and Systems (CAHPS) Survey - PMAP
Key findings HSAG provided key survey findings within its analysis. Key survey findings are defined as individual program results to the total health plan program that are significantly different then the total health plan program average.
Table 2 provides the 2021 CAHPs survey key findings by program. For PMAP, no key findings were cited for 2021. For MinnesotaCare, Rating of Health Plan was significantly below the total health plan program, while Getting Needed Care and How Well Doctors Communicate was significantly above the total health plan program. For SNBC, Rating of All Healthcare was statistically significantly lower than the total health plan program.
Table 2. 2021 CAHPs Survey key findings

hennepinhealth.org300 South Sixth Street, MC 604Minneapolis, Minnesota 55487-0604
Related Documents