Henderson European Focus Trust plc Annual Report 2020

Welcome message from author
This document is posted to help you gain knowledge. Please leave a comment to let me know what you think about it! Share it to your friends and learn new things together.
Transcript

Henderson European Focus Trust plc
Annual R
eport 2020
JHI9218/2020
Hend
erson E
urop
ean Fo
cus Trust p
lc – Annual R
epo
rt 2020
Henderson European Focus Trust plc Registered as an investment company in England and Wales with registration number 427958 Registered office: 201 Bishopsgate, London EC2M 3AE
SEDOL/ISIN number: Ordinary Shares: 0526885/GB0005268858 London Stock Exchange (TIDM) Code: HEFT Global Intermediary Identification Number (GIIN): THMNPN.99999.SL.826 Legal Entity Identifier (LEI): 213800GS89AL1DK3IN50
Telephone: 0800 832 832 Email: [email protected]
www.hendersoneuropeanfocus.com
JHI9218/2020Designed and typeset by 2112 Communications, London Printed by Pureprint, Sussex
This report is printed on Revive 100 Silk cover board containing 100% recycled waste and Revive 50 Silk paper containing 50% recycled waste and 50% virgin fibre and manufactured at a mill certified with ISO 14001 environmental management standard. The pulp used in this product is bleached using an Elemental Chlorine Free process.
This product is made of material from well-managed FSC®– certified forests, recycled materials, and other controlled sources.
Front Cover image: Aerial view of the Fuerwigge Dam near Meinerzhagen in the Sauerland in Germany
ShareholderCommunication
Awards
2020
ShareholderCommunication
Awards
2019

Strategic ReportPerformance 2-3
Chair’s Statement 4-7
Portfolio Information 8
Fund Managers’ Report 9-13
Investment Portfolio 14
Top Ten Holdings 15-16
Historical Information 17
Business Model 18-28
Section 172 statement 20-22
Measuring performance 24
Managing our risks 24-27
Viability statement 27-28
GovernanceBoard of Directors 30
Corporate Governance Report 31-37
Audit and Risk Committee Report 38-41
Directors’ Remuneration Report 42-44
Directors’ Report 45-46
Statement of Directors’ Responsibilities 47
Financial StatementsIndependent Auditor’s Report to the Members 49-54
Financial Statements 55-58
Notes to the Financial Statements 59-72
Additional InformationGlossary 74
Alternative Performance Measures 75-76
General Shareholder Information 77
Service Providers 78
Warning to shareholders Many companies are aware that their shareholders have received unsolicited phone calls or correspondence concerning investment matters. These are typically from overseas based “brokers” who target UK shareholders offering to sell them what often turn out to be worthless or high-risk shares in US or UK investments. They can be persistent and extremely persuasive. Shareholders are therefore advised to be wary of any unsolicited advice, offers to buy shares at a discount or offers of free company reports. Please note that it is unlikely that either the Company or the Company’s registrar, Equiniti, would make unsolicited telephone calls to shareholders. Any such calls would relate only to official documentation already circulated to shareholders and never in respect of investment “advice”. If you are in any doubt about the veracity of an unsolicited phone call, please call the corporate secretary at the number provided on page 78.
Strategic Report
1
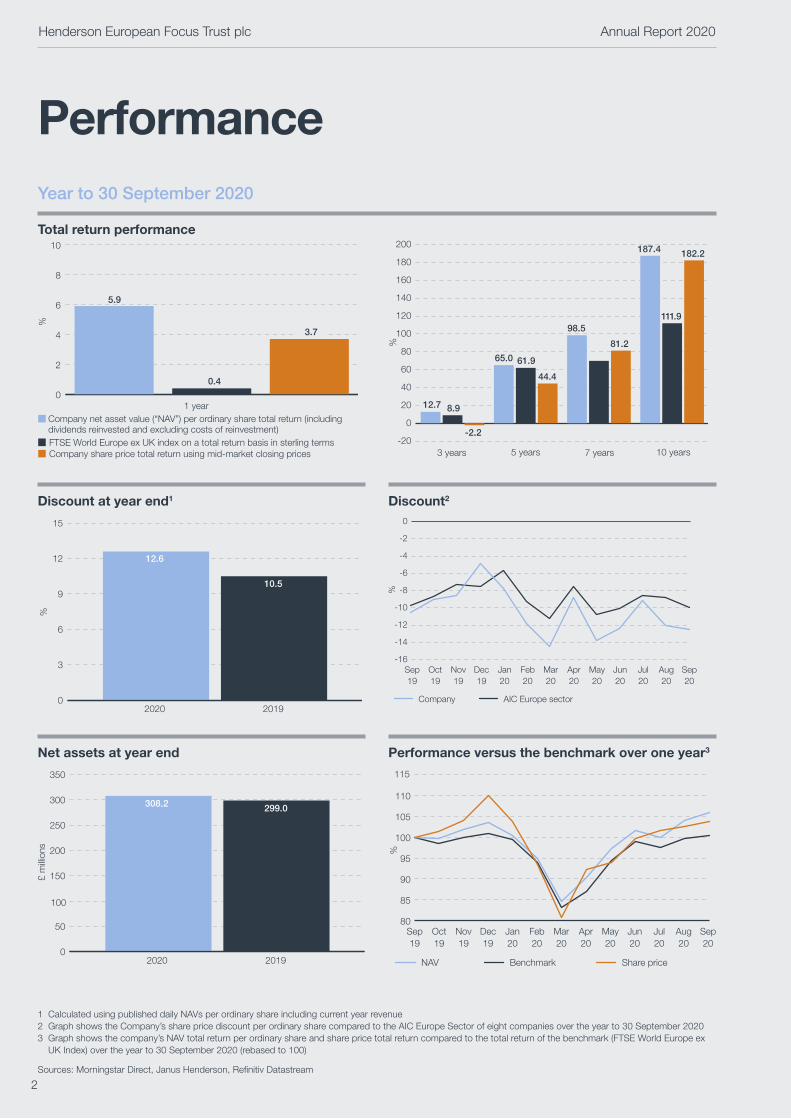
Year to 30 September 2020
Total return performance
1 year
%
Company net asset value (“NAV”) per ordinary share total return (including dividends reinvested and excluding costs of reinvestment)FTSE World Europe ex UK index on a total return basis in sterling termsCompany share price total return using mid-market closing prices
0
2
4
6
8
10
5.9
0.4
3.7
Discount at year end1
0
3
6
9
12
15
2020
12.6
2019
10.5
%
Net assets at year end
0
50
100
150
200
250
300
350
2020
308.2
2019
299.0
£ m
illion
s
Discount2
Company AIC Europe sector
-16
-14
-12
-10
-8
-6
-4
-2
0
May20
Jun20
Jul20
Aug20
Apr20
Mar20
Feb20
Jan20
Dec19
Nov19
Oct19
Sep20
Sep19
%
Performance versus the benchmark over one year3
NAV Benchmark Share price
80
85
90
95
100
105
110
115
May20
Jun20
Jul20
Aug20
Apr20
Mar20
Feb20
Jan20
Dec19
Nov19
Oct19
Sep20
Sep19
%
Performance
1 Calculated using published daily NAVs per ordinary share including current year revenue2 Graph shows the Company’s share price discount per ordinary share compared to the AIC Europe Sector of eight companies over the year to 30 September 20203 Graph shows the company’s NAV total return per ordinary share and share price total return compared to the total return of the benchmark (FTSE World Europe ex
UK Index) over the year to 30 September 2020 (rebased to 100)
Sources: Morningstar Direct, Janus Henderson, Refinitiv Datastream
5 years3 years 10 years7 years
%
-20
0
20
40
60
80
100
120
140
160
180
200
12.7 8.9
-2.2
65.0
44.4
61.9
98.5
81.2
69.8
187.4 182.2
111.9
Henderson European Focus Trust plc Annual Report 2020
2
Year to 30 September 2020
Performance
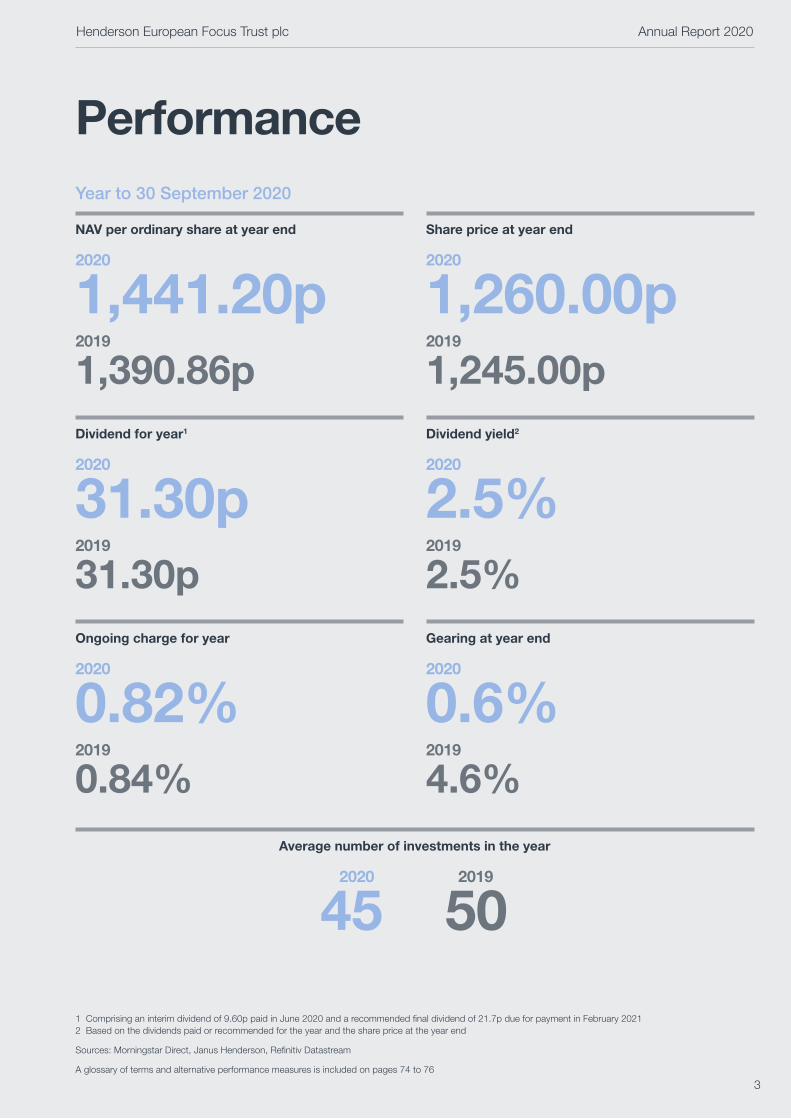
NAV per ordinary share at year end
2020
1,441.20p2019
1,390.86pDividend for year1
2020
31.30p 2019
31.30p Ongoing charge for year
2020
0.82%2019
0.84%
Share price at year end
2020
1,260.00p 2019
1,245.00pDividend yield2
2020
2.5%2019
2.5%Gearing at year end
2020
0.6%2019
4.6%
1 Comprising an interim dividend of 9.60p paid in June 2020 and a recommended final dividend of 21.7p due for payment in February 20212 Based on the dividends paid or recommended for the year and the share price at the year end
Sources: Morningstar Direct, Janus Henderson, Refinitiv Datastream
A glossary of terms and alternative performance measures is included on pages 74 to 76
Average number of investments in the year
2020 2019
45 50
Henderson European Focus Trust plc Annual Report 2020
3

“ This is truly active management... it has delivered positive absolute returns and is well ahead of its benchmark index”
Chair of the Board, Vicky Hastings, reporting on the year to 30 September 2020
Chair’s Statement
4

Chair’s Statement
These past twelve months have been unprecedented as we all know: the emergence of the Covid-19 pandemic; governments’ responses to the unfolding health, economic and social crisis and the ensuing impact on our daily lives. With this has come huge uncertainty – both for us as individuals but also for governments, and corporate management teams who are trying to operate and forecast in a highly unpredictable environment. Stock markets do not deal well with uncertainty and we have seen huge volatility during the financial year – to give you an idea, our benchmark index of Continental European companies, the FTSE World Europe ex UK Index, fell by 27.6% from the highest point (on 20 February 2020) to trough (16 March 2020) and then showed such a strong recovery that the financial year as a whole finished in positive territory.
As you will see from the performance section below, your fund management team led by John Bennett has navigated this with aplomb, and their investment philosophy of buying companies with sound balance sheets and solid cash flow potential, integrating environmental, social and governance considerations into their assessment of the management team and then constructing the portfolio with conviction at both the stock and sector level has served them well. This is truly active management – it does not seek to represent an index but to provide shareholders with substantial outperformance compared to an index basket over the long term. Indeed, it is noteworthy that in a period when companies with overt growth profiles have been highly sought after, virtually to the exclusion of all else, a well-diversified portfolio of hand-picked companies with these characteristics has delivered positive absolute returns and is well ahead of its benchmark index. The chart on page 2 highlights this over a number of time periods and as a Board we look to the longer term to ensure we are adding value for shareholders.
For our part, the AGM in January 2020 was the last opportunity that the Board had to come together in person. Since then we have met virtually, both for our routine board meetings, ad hoc calls and strategy session, but also during early April and mid-May at additional meetings convened to assure ourselves that the business continuity planning by Janus Henderson and our other service providers was working appropriately. It was reassuring to learn that working from home was not proving problematic from an operational perspective. Importantly it was also an opportunity for us to have more frequent contact with John Bennett and his co-manager Tom O’Hara as to their thinking – both in terms of how risk in the portfolio was being considered as well as being alert to the potential opportunities that could arise. I shall leave it to John but he goes into detail in his report as to his thinking behind some of the changes over the year as well as his prospective view on the markets and the economic and social environment in which we now find ourselves.
Performance1
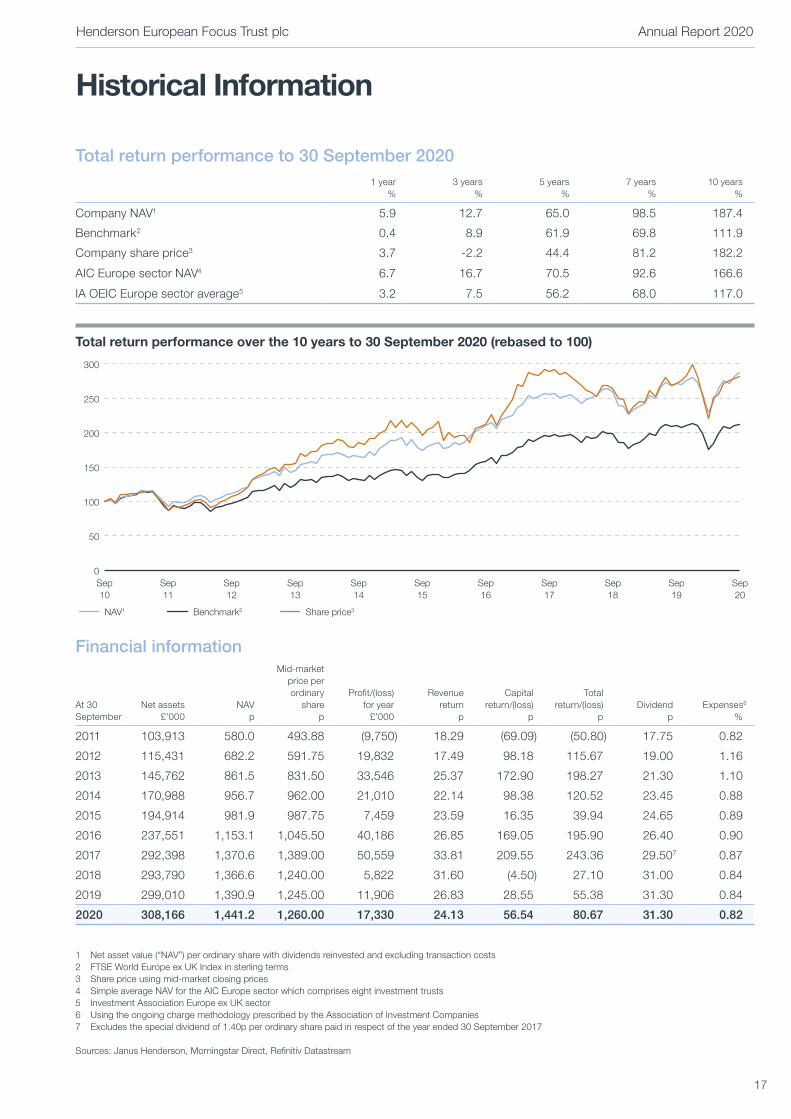
In the financial year to 30 September 2020, the Company’s net asset value (“NAV”) total return per share rose by 5.9% (2019: 4.3%), considerably ahead of the Company’s benchmark index, the FTSE World Europe ex UK Index, which increased by 0.4% (2019: 6.4%). Over the longer term, the NAV total return per share is ahead of this benchmark index on three, five, seven and ten year periods to 30 September 2020.
The share price total return was slightly lower at 3.7% (2019: 3.1%) as the discount at which the shares traded to NAV widened marginally over the period. I comment further on this below. Over the past 10 years, the share price has returned 182.2%, compared to the benchmark index of 111.9%. This is outperformance of 70.3% for our shareholders.
Another yardstick the Board look at regularly is the NAV performance relative to other investment companies as well as their open-ended company counterparts in the Investment Association Europe sector (“OEICs”): over the past year the average return for companies in the AIC Europe sector average return has been 6.7% (comprising 8 companies) whilst the average OEIC has returned 3.2%.2
The reduction in our number of holdings to a range of 35-45 was approved by shareholders at the last annual general meeting (“AGM”). The purpose of this further concentration in the portfolio was to offer investors an even clearer proposition. In other words, the Company has sought to evolve, building on its credentials as an actively managed portfolio, fashioned by research and conviction. It is encouraging that this approach has delivered substantial outperformance in the year under review, enabling the Company to strengthen its long-term track record of delivering to shareholders.
DividendsThe Board is recommending a final dividend of 21.7p per share which, subject to shareholder approval at the AGM, will be paid on 5 February 2021. When added to the interim payment of 9.6p (2019: 9.6p) this brings the full year dividend to 31.3p and represents a maintained distribution level. With the shares at 1,260.0p at the year end, this represents a yield to investors of 2.5%.
Whilst the Company’s investments are managed to generate superior total returns rather than to have an income focus, the Board is mindful that one of the benefits of the closed-ended structure is to have the opportunity in bad times to dip into revenue reserves that might have accrued historically. We are fortunate to have a healthy level of reserves and with the recommendation of the final dividend, propose to utilise some of these to smooth the level of dividend we can pay out until the Covid-related impact has ceased.
1 The performance figures referenced in this section are net of fees, with dividends reinvested and in sterling2 Comprising 121 funds when including the maximum number of funds in the peer group during the year
Henderson European Focus Trust plc Annual Report 2020
5

Chair’s Statement (continued)
Borrowings and gearingDespite the problems of unpredictable lockdowns and new outbreaks of Covid-19, our Fund Managers continue to identify opportunities in new holdings. However, with some of those opportunities in the more economically cyclical areas, they have been careful not to add financial leverage at the portfolio level, not least during this period of heightened uncertainty. Hence gearing ended the financial year at 0.6% (2019: 4.6%) having stayed under 5% for most of the year (see chart on page 8). Borrowings are in the form of a multi-currency overdraft facility with HSBC and more details can be found on page 20.
Share rating and buybacksWhilst the NAV return is determined by the performance of the Fund Managers’ stock selection decisions, shareholders own shares and therefore the share price and the level at which the shares trade relative to the NAV – the discount or premium – is obviously a key measure. Despite good investment performance, the Company’s shares have continued to trade at a discount to NAV over the past year, ending the year at 12.6% compared with 10.5% at the end of the prior year. Frustratingly this is more a reflection of the general widening of investment company discounts over the period as well as the fact that Europe has been considered unattractive as a region for investment. The discount averaged 10.8% over this period (2019: 8.9%). Your Board believes that when that sentiment changes and investment in Continental Europe increases, this discount should once again narrow.
The Board considers all options in respect of managing the discount in a manner that is beneficial to the long-term interests of shareholders. As well as ensuring that promotion of the Company is appropriately supported (through regular and informative content on a variety of websites and Fund Manager meetings with investors and media), it is also within the Company’s powers to buy back its own shares. Over the course of the financial year under review the Company bought back 115,683 shares, representing 0.5% of the total number of shares outstanding at the start of the year and enhancing the NAV by 0.1%. These shares will be held in treasury and are available to reissue at a time when the Company’s shares are trading at a premium to NAV. Shareholders may recall that the Company issued new stock as recently as 2017.
Governance, shareholder engagement and annual general meeting (“AGM”)The Annual Report is our opportunity to report to you on the Company’s performance, provide audited financial statements and engage with you on broader issues. You will note that the Annual Report is a few pages longer than in the past. We hope that you will find the additional content, which describes our broader stakeholder engagement and the
Company’s culture, purpose and values, interesting and informative. However, as we know, much can change in a year, so we are pleased that our Fund Managers are increasingly looking to use virtual media to bring you video updates and afford opportunities for virtual meetings. As always, if you have questions for either the Board or the Fund Management team please don’t hesitate to get in touch (contact details can be found on page 78) and on behalf of the Board I hope you are encouraged by what you read. Do use the sign-up function on our website at www.janushenderson.com/en-gb/investor/subscriptions/ to receive regular information.
The Company’s AGM will be held at 2.30 pm on Thursday, 28 January 2021 and we very much hope as many shareholders as possible will join us. In view of the ongoing restrictions on public gatherings, we will be inviting shareholders to attend the AGM via a Zoom webinar, and ask shareholders to submit proxy forms via their voting agent/platform to ensure their vote counts, as there will be no live voting. Your Fund Managers will present their review of the year and thoughts on the future during the webinar, and will be available to answer your questions, as will I and my fellow directors. Further information on AGM arrangements are included in the Notice of AGM sent with this Annual Report and on our website at www.hendersoneuropeanfocus.com. If you have questions but can’t attend on the day please do send them in advance to the company secretary at [email protected], and we will do our best to answer them.
We look forward to being able to resume holding physical meetings in the future, but will also be responsive to your views as to whether these should be of a hybrid nature to allow a greater number of shareholders to join and ask questions. One of the resolutions we are putting to shareholders concerns amendments to our Articles of Association, the main change being to equip us with the flexibility to hold a combination of virtual and physical shareholder meetings in the future, in case of any further crises like the Covid-19 lockdown. We commit to holding physical meetings when this is legally allowed and can be safely accomplished, as these offer full and open ‘face-to-face’ debate with the Board and Fund Managers.
Within our mailing of the Annual Report and AGM Notice, we are also taking the opportunity to offer shareholders the option to receive documents from us electronically and also to place proxy votes electronically in future years. A resolution to this effect is included in our AGM Notice. Electronic communication should reduce unnecessary usage of paper, and also support us in communicating with our stakeholders in the most convenient and accessible manner for each. Do advise us of your preference by returning the enclosed form. Please be aware that if you do not return your form to us by 31 January 2021, we will assume you have agreed to us making shareholder information available to you through the
Henderson European Focus Trust plc Annual Report 2020
6

Chair’s Statement (continued)
Company’s website, and you’ll receive hard copy notification whenever annual reports, half-year reports and shareholder meeting notices are published.
Finally, I would like to draw your attention to the announcement we made in September that Robert Jeens was resigning as a director and Chairman of the Board for personal reasons. We are all very grateful to Robert for his contribution during his tenure. As Senior Independent Director, the Board has appointed me as Interim Chair. Though for now we are a small Board, we are confident that we have the necessary breadth and depth of skills and experience to carry out our duties fully, although we do expect to make further appointments in 2021 and the Company will announce progress on that in due course. Full details of the Board’s background, skills and experience can be found on page 30.
OutlookThese are certainly unusual times, but for stock market participants the uncertainty is extreme. Funded by government-driven quantitative easing to repair economies after the financial crash of 2009-2010, we have witnessed an elongated bull market for equity markets, resulting in valuation levels that are generally higher than many are comfortable with, especially for those companies who exhibit growth criteria. They are priced as though low inflation will continue indefinitely and yet one of the consequences of Covid looks likely to be that governments will continue to keep the taps turned ‘on’ to support economies and we should expect government borrowing to rise dramatically.
The recent positive news on a vaccine development and a sooner ‘return to normal’ will only have increased this likelihood. Your Fund Managers’ Report explains the investment implications of this and also how the team’s investment thinking determines the shape of the portfolio and the choice of individual companies. If nothing else, reminding oneself to “be ready to be wrong” has served John well over the last ten years at the helm of the Company with substantial added value for shareholders. Your Board is confident that this pragmatism will continue to stand shareholders in good stead for whatever may lie ahead over the next ten years.
Vicky Hastings Chair of the Board 10 December 2020
Henderson European Focus Trust plc Annual Report 2020
7
Sector exposure at 30 September
2020 %
2019 %
Industrials 30.2 18.6Consumer Goods 20.7 27.4Basic Materials 12.0 11.2Technology 10.9 9.2Health Care 9.8 20.4Financials 9.0 3.1Utilities 6.0 –Oil & Gas 1.4 4.5Telecommunications – 4.6Consumer Services – 1.0
Sector overweights/underweights at 30 September 20201
-20
-15
-10
-5
0
5
10
15
Consu
mer
Ser
vices
Tech
nolog
y
Indus
trials
Health
Car
e
Consu
mer
Goo
ds
Basic
Mat
erial
s
Telec
omm
unica
tions
Oil & G
as
Utilitie
s
Finan
cials
%
-6.8
-2.0
1.0
-2.9
6.5
1.6
-7.5-4.5
1.3
13.3
Currency exposure at 30 September2
2020 %
2019 %
Euro 72.1 61.5Swiss franc 15.2 22.1Swedish krona 9.3 8.6Danish krone 3.4 5.1Norwegian krone – 2.7
Gearing levels over the year to 30 September 20203
0
1
2
3
4
5
SepAugJulJunMayAprMarFebJanDecNovOct
%
4.3 4.3
3.5
1.0
2.1
1.0
0.4
2.9
1.6
2.8 2.7
0.6
Geographic exposure at 30 September
2020 %
2019 %
France 16.5 9.7Germany 15.9 17.2
Switzerland 15.2 21.0Finland 13.7 8.4Netherlands 13.0 13.3Sweden 9.3 8.1Italy 4.7 2.2Denmark 3.4 4.8Spain 3.3 2.7Belgium/Luxembourg 2.5 2.5Portugal 1.5 2.2Iceland 1.0 –United Kingdom – 5.3Norway – 2.6
Country overweights/underweights at 30 September 20201
-10
-5
0
5
10
15
%Fin
land
Nethe
rland
sSwed
enPor
tuga
l
Switzer
land
Denm
ark
Norway
Belgium
Luxe
mbo
urg
Czech
Rep
ublic
Hunga
ryGre
ece
Austri
aTu
rkey
Poland
Germ
any
Italy
Spain
Fran
ce
10.8
1.22.
2
4.0
-2.9-1
.6
0.0
-0.1
-0.2
-0.2
-0.3
-0.4
-0.5
-3.9
0.1
-1.3
-6.6
0.5
-1.3
Irelan
d-0
.5
Key performance influences over the year to 30 September4
2020%
2019%
Return of the portfolio of investments
from sector allocation (ex cash) 5.0 (0.6)
from stock selection (ex cash) 1.3 0.7
from currency effect 0.7 0.8
Impact of gearing (net) (0.7) (0.5)
Impact of share buybacks 0.1 –
Impact of expenses (0.8) (0.8)
NAV return relative to the benchmark 5.5 (2.1)
Portfolio Information
1 Relative to the FTSE World Europe ex UK index for the year to 30 September 2020, and excluding cash
2 Excludes sterling balances
3 Gearing at each month end. See definition in alternative performance measures on page 75
4 Relative to the FTSE World Europe ex UK index for the year to 30 September 2020
Sources: Janus Henderson and Factset
Henderson European Focus Trust plc Annual Report 2020
8
Fund Managers’ Report
“ We can’t help but question the prevailing investment zeitgeist…”John Bennett
Fund Manager
Tom O’Hara Fund Manager
9

It seems only right that we begin our report with reference to the unique challenge of Covid-19. This is a challenge which has, of course, thudded into our lives, both personal and professional.
Often, an investment manager will be presented with situations which induce the reflexive response of “I’ve seen this before”. Good examples would be the perennial imposters of euphoria and despair, sentiments which might, today, fit growth and value investors respectively. “I’ve seen this before” cannot be applied to the challenges presented by the Covid-19 pandemic. And yet, our response was somewhat reflexive: it did display muscle memory. I’ve always maintained that a portfolio of stocks should reflect the investment DNA of its manager. This Company is, for sure, an example of that.
The key strands of this investment team’s “DNA” include the following:
1. Follow the cash
2. Avoid excessive leverage
3. Believe in change
4. Believe in cycles
5. Give yourself time (clients willing)
6. Be ready to be wrong
This is not an exhaustive list. Crucially, as indicated by number six, it is not tantamount to a religion. As a team, we often say: “investing must never be a religion”. This is merely a health (and wealth) warning to self: in investing, it is crucial not to box oneself in: never to become so wedded to a position that it “must work”. Those who know us will know this is why we resolutely refuse to become ardent, inflexible “style” managers: particularly apposite in the current growth versus value predicament: a situation some might describe as the humiliation of value by growth. To us, it is never as binary as that.
Back to those DNA strands: at times deemed old fashioned, strands one and two are, probably, our most vital. A focus on cash-generative businesses, combined with ample, but not excessive, balance sheet leverage has, over time, served us and our investors well. As a trainee fund manager I recall being told “don’t layer financial leverage upon operational leverage”. Yes, it may have been preached from a dusty drawing-room-turned-office in a Georgian Edinburgh townhouse but, like most lessons worth learning, it has never left me (a Glaswegian).
Such focus came into its own at the onset of this pandemic. It is a focus that naturally makes us wary of businesses and industries hobbled by overcapacity, weak balance sheets or poor cash conversion. Examples include airlines, banks, retail and the hospitality and leisure sectors. Thus, our initial response to the pandemic was to change very little. We felt that our portfolio companies were inherently resilient and that we were not particularly exposed to the most vulnerable sectors. Our priority was to engage with our investee companies. We sought to quiz the management teams of those companies on how they were running their business in response to the situation. It quickly became clear that each
and every management team we engaged with had the priorities right: businesses were being run for cash; DNA strand one – follow the cash.
Once this had been established, we, as a team, mulled over what shape the recovery might look like. Opinion poll fearing, media fed and led politicians, advised by highly questionable “scientists” have made the task all the more challenging. It is clear that no economy can withstand lockdown for any lengthy period. The “macro” conclusion that we came to was that, as with the virus itself, economic recovery would spread from East to West. This has largely been the case. Underwriting such recovery was the extraordinary monetary and fiscal response by governments worldwide. Further stimulus came in the form of something less talked about at the time: in following the cash, companies flushed their inventory channels. Thus, the scene was set for inevitable demand recovery to meet the dry tinder of lean inventories. This is one reason why industrial companies and economies have fared better than those with heavy exposure to services. It is also reason to remind those who may have given up on Europe of the wealth of industrial champions and outstanding management teams the so-called Old Continent offers the investor.
Thus, we used the early summer months to buy into selected industrial names, giving the portfolio a more cyclical – some might say value – tilt. Notwithstanding the continuing triumph of “growth” investing over the “value” style, anticipating the recovery shape and our subsequent stock selections have been key factors in the portfolio’s outperformance. As the Chair has highlighted in her report, this, in turn, has meant that the Company has been able to strengthen its long-term record of outperformance.
Europe – a leader in “The Green Recovery”?Much has been made of Europe’s laggard status when it comes to the technology sector. A wistful glance at the NASDAQ and its stark contrast with the once mighty Ericsson and Nokia, Europe’s erstwhile tech poster children, might induce a pang and a pine at what might have been. We would simply say: that race may have been lost but we mustn’t be blinded to the success and enduring merits of European technology champions such as ASML, Infineon and STMicroelectronics, all portfolio holdings.
It is a new race that intrigues us and one that is still in its early stages: the ESG race. Amidst the sound and fury surrounding the whole subject of climate change, the “business” of ESG investing is serious. It is no exaggeration to talk of a state-sponsored ESG investment world: in the past year we have seen EU governments agree on the ‘Next Generation EU’ green recovery fund, and, perhaps more surprisingly, President Xi Jinping, announce that China aims to hit peak emissions before 2030 and achieve carbon neutrality by 2060. The timeline may lag that of the EU and the UK, which have targeted zero emissions by 2050, but the scale of the transition is that much larger, China being the world’s biggest producer of greenhouse
Fund Managers’ Report
Henderson European Focus Trust plc Annual Report 2020
10
gases (“GHG”). Indeed, China accounts for roughly 25% of global GHG, which is almost triple that produced by the EU and almost double that of the United States.
Europe is in an excellent position to lead in this world of sustainability. For example, as its governments and central banks sponsor and “underwrite” the dash for sustainable energy, it may well be that prime beneficiaries, at least in the early years, are European utilities’ shareholders. In an era of paltry to negative sovereign government bond yields, the hunt for yield underpins the new phenomenon of green bonds, lowering the cost of capital to those utilities, to the benefit of their equity owners. This train of thought led us, at the turn of calendar 19/20 to enter the sector. Here was an industry not exactly known for its growth prospects, yet it was big and liquid enough to attract those ESG funds. To do so, the companies had to change and it is no surprise to see them shed their “brown” assets for “green”: to move their asset base from carbon producing energy sources to sustainable sources. Forgive the pun but the wind has only been strengthened by European governments.
If European utilities represent an obvious play in the era of ESG investing, some less obvious candidates have also become important holdings in our portfolio. Forever stalked by the career risk of not running with the pack, the professional investor must deal with a perennial challenge: to avoid being swept up in a bandwagon. This, in turn, requires iron discipline, so as not to deploy our investors’ capital in the wrong places or at the wrong prices. Financial markets are nothing if not prone to fashion. At times, therefore, discipline can feel quaint. Nevertheless, as already noted, one strand of
our team’s DNA is the discipline of cash flow. In a nutshell, we prefer our investee companies to self-fund their growth.
Another of our strands is applicable to sustainable investing: believe in change. This is vitally important in the context of the ESG challenge. There is no shortage of rating agencies and consultants prepared to “rank” companies based upon their ESG credentials. We would call these “spot credentials”; they apply today, here and now. But what of the future? Armed with such rankings, it is all too easy to apply a “scorecard” approach to sustainable investing. In other words, to hunt for today’s most optically virtuous companies and concentrate our efforts and our shareholders’ funds there. This, in our opinion, has two major flaws:
1. If something “scores highly” it is more likely to be fully valued
2. A “spot” approach to investing risks ignoring that things can change
If we combine the two points above, we allow ourselves the freedom, the openness and flexibility of mind to identify those companies which might not be today’s highest achievers, according to often subjective ESG scorecards. What is important is that they are embracing the era of sustainability and often at an under-appreciated pace. In other words, by believing in change, we can identify a delta, a rate of change. This strand has always informed our thinking. We have typically applied it to the financial metrics of a company and will continue to do so. Today, with equal rigour, we apply the same strand to how companies approach the challenges and opportunities presented by the age of sustainability.
In summary, by combining our preference for self-funded growth with the “change” candidates, we believe we optimise the opportunity to apply sustainable investing without the pitfalls of falling for concept stocks or overvalued situations. Perhaps the unlikeliest of examples would be our single biggest investment, LafargeHolcim. Notwithstanding the Covid-19 pandemic, the long-term global trend of urbanisation is intact. To be simple about it, all those roads, prisons, bridges, schools and hospitals cannot be built without concrete. The challenge is to make that product in a sustainable way. LafargeHolcim already leads the world in exactly that. Moreover, we would confidently predict that the company will, in a few years’ time, be less about its past – cement – and more about the future – sustainable building products. In other words, it is changing. It is a change funded by internally generated cash flow and it is a change that is already seeing LafargeHolcim climb the charts of sustainability scorecards. During 2020 Sustainalytics, a leading independent global provider of ESG research and ratings, upgraded LafargeHolcim to such an extent that it now represents the highest score of all 101 construction materials companies covered by that agency. LafargeHolcim thereby becomes the first construction materials company to rank below 20 in the “low risk” category. It also places the company in the top 20% of all companies assessed by Sustainalytics, regardless of sector. Quite something for a so-called cement company and proof positive of believing in change.
Fund Managers’ Report (continued)
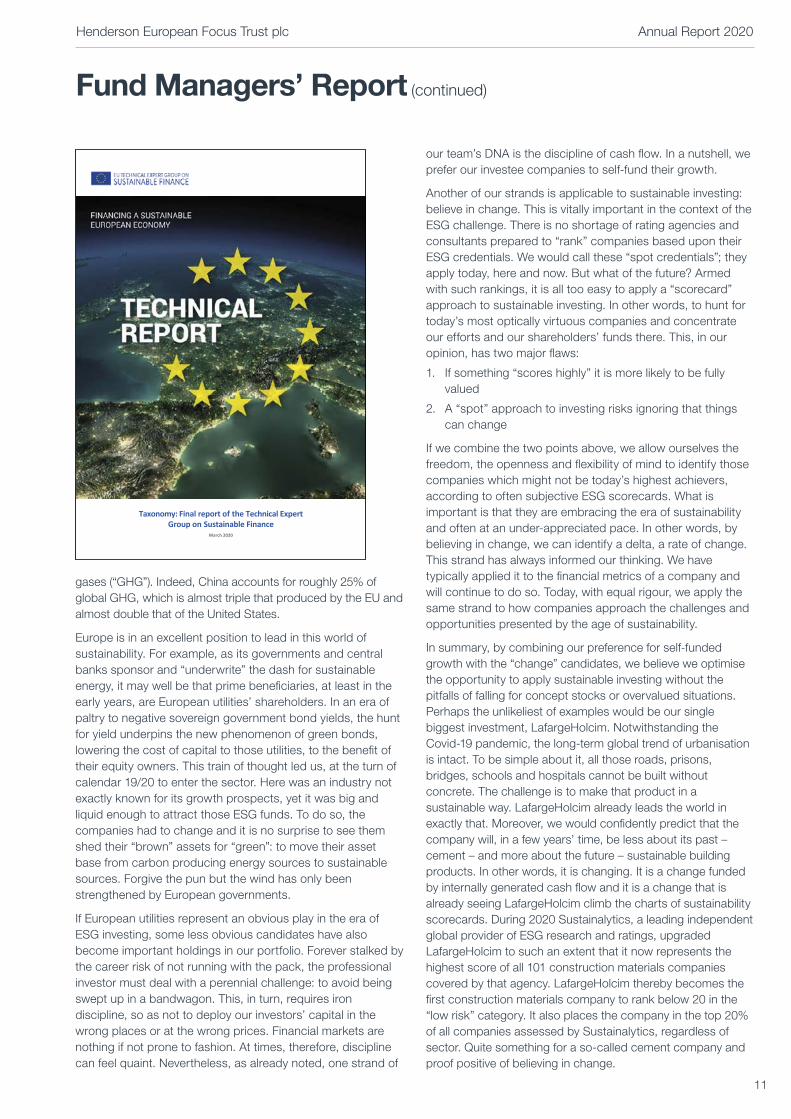
Taxonomy: Final report of the Technical Expert Group on Sustainable Finance
March 2020
Henderson European Focus Trust plc Annual Report 2020
11

Two other portfolio holdings worthy of mention in the context of “less obvious ESG” are UPM-Kymmene and Signify. We would refer the reader of this Annual Report to the section covering our top ten investments on pages 15-16, where brief descriptions of both companies are to be found.
UPM-Kymmene (5.1% of portfolio)
Photos: UPM-Kymmene Corporation – UPM forestry and biochemicals process
Signify (2.7% of portfolio)
Photo: Signify, Brighter Lives: Food availability
Both companies are fine examples of how we like to invest. Both start from the base of robust balance sheets and strong cash generation, in the hands of proven management teams. It is this foundation of well-established core businesses that generates the cash necessary to fund the growth opportunities presented by the era of sustainability. Contrast that with some of the parvenus, who present investors with a paper chase, as they continually issue new shares to fund a land grab built on a promise. The latter usually fare well in a bull market, but when the wind turns – pun forgiveness request number two – they are often denuded.
Notable stock contributors1
The technology sector has been the star of the show in world stock markets in recent times and the Company’s year benefited from our selections in the semiconductor space. STMicroelectronics contributed some 160bps to our NAV outperformance while ASML produced 80bps.
Arguably less obvious stars came in the shape of Dometic (99bps) and Kion (120bps). Dometic is a Swedish company supplying equipment to the outdoor leisure markets in Recreational Vehicles, camping and boating. You could say that it has been the epitome of a V-shaped recovery since its end markets have rebounded extremely strongly since the dark days of Spring 2020. Perhaps this is not too surprising given the much-increased appetite for staycations and outdoor activities.
Photo: Dometic
Kion, the German manufacturer of warehouse and materials handling trucks, exemplifies our approach of looking to “secondary” plays, or beneficiaries, of the boom in online shopping. After all, those consumer orders must be stored, handled and fulfilled. Kion’s products make that possible. It’s no stretch of the imagination to say that the pandemic has changed the way we shop and vacation. If so, Dometic and Kion are in a fine position to capitalise.
No performance attribution would be fair without a look at our portfolio’s detractors. Our single biggest negative contributor was our largest portfolio holding, LafargeHolcim (-62bps). Our second largest negative came from German defence and automotive equipment supplier, Rheinmetall (-61bps). It is perhaps instructive that both stocks, notwithstanding excellent management execution, are considered “victims” in the world of ESG investing. Indeed, a number of conversations within and outside our team, including with sell-side analysts and the management of both companies, confirm that the “optics” of being in the cement or defence industries can be sufficient to deter what we would call “ESG scorecard” investors. This presents us with a dilemma: continue to back the management of these businesses to continue to do the right thing, or take our leave, since to resist the ESG tide renders us the apocryphal Canute. Having sold out of our holding in Rheinmetall, it is a dilemma we continue to wrestle with in LafargeHolcim, mindful that we cannot, alas, indulge in indefinite patience.
Fund Managers’ Report (continued)
1 The figures referenced in this section are the contribution in basis points to relative outperformance
Henderson European Focus Trust plc Annual Report 2020
12

Fund Managers’ Report (continued)
RiskWhile on the subject of investment DNA, we thought it might be useful to share a few words on how we think about risk. This, perhaps, is all the more relevant since shareholders approved, at the 2020 AGM, the reduction in the maximum number of portfolio stocks to 45, from 60. Many people consider a more focused portfolio of holdings to be synonymous with increased risk, notwithstanding studies which demonstrate that ample diversification can be achieved by a portfolio of holdings numbering half that of the Company’s.
Our sense of risk starts with the fundamental risk inherent in a business. Assuming management of the business is both honest and competent, the key risks then become the market position, cyclicality and, crucially, financial indebtedness of the company. It then behoves us not to overpay. Such factors can be considered as components of DNA strands one to four. As simple as these concepts are, they remain vital, indeed the most important, factors in our assessment of risk.
Then there is portfolio risk. This comes down to shape. The Company’s “bandwidth” of 35-45 stocks affords us ample room to assemble a diversified portfolio of businesses across the large and mid-cap spectrum, at all times applying our skill set of stock picking. We do like our portfolios to have a shape. In this context we like continuously to be aware of the beta of our portfolio and its skew – “cyclical”, “value”, “defensive”, “growth”, etc. Thus, to take one example, it is not just the stock specific merits of Nestlé that keep it as a top ten holding for the Company. Nestlé offers portfolio ballast. In other words, as a stock, rather than a business, it offers our portfolio a hedge against the continuing threat of deflation in Europe. This is a very valid factor when we consider that our portfolio shape through 2020 has played to a cyclical-led, reflationary environment. It won’t, therefore, be lost on the reader that Nestlé is, in part, a representation of DNA strand number six: we do not concentrate a portfolio in “things that must work” – we are ready to be wrong.
OutlookWhen asked to offer an outlook, fund managers often feel the pressure to translate it into some form of forecast: of market level or direction and, madly as well as maddeningly, over a short period, such as one year. It’s at this point that the fund manager should send a memo to self. It should read: there are
two types of forecaster; one who doesn’t know and one who doesn’t know that he/she doesn’t know. In other words forecasting is a mug’s game.
It may be the DNA thing again but when we think in terms of outlook, we tend to think of what could challenge, disrupt or derail the prevailing investment consensus. Our report this year has referenced the very real and very durable threats and opportunities presented by Environmental, Social and Governance challenges. For us, ESG is now a given; it is hard wired into how we think, act and invest. It is here to stay.
It’s the things that might not be here to stay that challenge, as well as fascinate, us. There is one particular investment challenge which has been prevailing, dominating investors and shaping their portfolios for some decades now. This has meant that it, too, is deemed to be hard wired. It is the lack of inflation. Such has been the dominance of disinflation, globally, that we have a generation of equity fund managers who have only known the supremacy of growth stocks over value stocks. We also have a whole bunch of other assets priced for more of the same: continuing disinflation. Witness Italian versus German government bond yields or the price of Austrian 100-year bonds.
The last of our DNA strands referenced at the beginning of this report is the one we shall therefore end on: be ready to be wrong. Such has been the bonanza in disinflationary beneficiaries that we stand at a time when some of today’s most popular holdings in investment portfolios cannot afford to be wrong. In other words, they cannot afford for inflation to return. Your portfolio is managed by a team of stock pickers. The team doesn’t seek to make dramatic macroeconomic calls. And yet, we can’t help but question the prevailing investment zeitgeist. Humanity is currently battling a pandemic. As the recent vaccine news demonstrates, humanity will win that battle. We suspect that part of the recovery process, in the financial and economic world, may well involve the return of at least some inflation. If this proves to be the case, many a portfolio, having gotten religion, is not ready to be wrong.
John Bennett and Tom O’Hara Fund Managers 10 December 2020
Henderson European Focus Trust plc Annual Report 2020
13

Investment Portfolio as at 30 September 2020
Note: All securities are equity investments
Ranking 2020
Ranking 2019 Company Sector Country of listing
Valuation 2020 £’000
Percentage of portfolio
1 1 LafargeHolcim Construction & Materials Switzerland 21,958 7.08
2 3 UPM–Kymmene Forestry & Paper Finland 15,755 5.08
3 2 Nestlé Food Producers Switzerland 14,973 4.83
4 6 SAP Software & Computer Services Germany 10,869 3.51
5 9 ASML Technology Hardware & Equipment Netherlands 10,406 3.36
6 4 Roche Pharmaceuticals & Biotechnology Switzerland 10,075 3.25
7 – Saint-Gobain Construction & Materials France 9,664 3.12
8 – ASR Nederland Nonlife Insurance Netherlands 8,897 2.87
9 5 Autoliv Automobiles & Parts Sweden 8,882 2.86
10 – Signify Electronic & Electrical Equipment Netherlands 8,362 2.70
10 Largest 119,841 38.66
11 20 AKZO Nobel Chemicals Netherlands 8,213 2.65
12 15 Dometic Leisure Goods Sweden 7,772 2.51
13 7 STMicroelectronics Technology Hardware & Equipment France 7,716 2.49
14 29 Nokian Renkaat Automobiles & Parts Finland 7,714 2.49
15 13 Tessenderlo Chemicals Belgium 7,662 2.47
16 – Nordea Bank Banks Finland 7,473 2.41
17 – Volvo Industrial Transportation Sweden 7,157 2.31
18 22 Rheinmetall Automobiles & Parts Germany 7,087 2.29
19 21 Kion Industrial Engineering Germany 6,904 2.23
20 – Daimler Automobiles & Parts Germany 6,778 2.19
20 largest 194,317 62.70
21 – Peugeot Automobiles & Parts France 6,281 2.03
22 – Enel Electricity Italy 6,230 2.01
23 38 Kone Industrial Engineering Finland 6,109 1.97
24 27 Deutsche Boerse Financial Services Germany 6,011 1.94
25 – DSV Panalpina Industrial Transportation Denmark 5,960 1.92
26 – Sanofi Pharmaceuticals & Biotechnology France 5,848 1.89
27 11 Grifols Pharmaceuticals & Biotechnology Spain 5,669 1.83
28 37 Interpump Industrial Engineering Italy 5,319 1.71
29 – Metso Industrial Engineering Finland 5,273 1.70
30 – Arkema Chemicals France 5,122 1.65
30 largest 252,139 81.35
31 – Infineon Technology Hardware & Equipment Germany 4,932 1.59
32 – Atlas Copco Industrial Engineering Sweden 4,881 1.58
33 – Schneider Electric Electronic & Electrical Equipment France 4,727 1.53
34 30 LVMH Moet Hennessy Louis Vuitton
Personal Goods France 4,660
1.50
35 19 Novo–Nordisk Pharmaceuticals & Biotechnology Denmark 4,645 1.50
36 – EDP Electricity Portugal 4,573 1.47
37 – Legrand Electronic & Electrical Equipment France 4,482 1.45
38 – Iberdrola Electricity Spain 4,481 1.45
39 18 SBM Offshore Oil Equipment Services & Distribution Netherlands 4,337 1.40
40 10 Merck Pharmaceuticals & Biotechnology Germany 3,951 1.28
40 largest 297,808 96.10
41 – RWE Gas, Water & Multiutilities Germany 3,156 1.02
42 – Marel Industrial Engineering Iceland 3,019 0.97
43 – Intesa Sanpaolo Banks Italy 2,998 0.97
44 – BNP Paribas Banks France 2,901 0.94
Total listed equity investments at fair value 309,882 100.00
14
Henderson European Focus Trust plc Annual Report 2020

Top Ten Holdings
LafargeHolcim Percentage of portfolio: 7.08%
Sector: Construction & Materials
Fund Managers’ view: LafargeHolcim is a world leader in the production of building materials. Formed by the merger of France’s Lafarge with Holcim of Switzerland, here is a group which we had long considered an under-achieving behemoth. It is fair to say that we would not have been attracted to the company were it not for the arrival of the new CEO and CFO in September 2017 and January 2018 respectively. What we identify here is a classic case of root and branch reform, transforming a hitherto sprawling empire into a best-in-class global group focusing increasingly on downstream building materials, as opposed to upstream cement. This should drive ongoing improvements in cash flow return on invested capital. At first glance a “dirty” business, LafargeHolcim is in the throes of demonstrating to investors and the wider community that it is a genuine champion of sustainability within the building materials industry. On its way to becoming a net-zero company, LafargeHolcim offers global solutions such as ECOPact, enabling carbon-neutral construction. Additionally, with its circular business model, the company is a global leader in repurposing waste as a source of energy and raw materials through products like Susteno, the world’s most circular cement.
UPM-KymmenePercentage of portfolio: 5.08%
Sector: Forestry & Paper
Fund Managers’ view: UPM-Kymmene is a leading producer of wood based products. It has an excellent management team with a strong record of value-creating capital allocation. With a balance sheet in net cash, UPM is in a phase of transformational organic growth in the areas of pulp, biofuel from wood, and replacing oil-based PET plastic with wood- based material. Together, these three investments should enable group earnings to grow by over 40% in 2023 compared to 2020, even without a cyclical recovery. Including all indirect effects, UPM is committed to reducing its carbon emissions by at least 65% by 2030. Based simply on its direct emissions, the company is already a carbon sink, given significant forestry assets.
Nestlé Percentage of portfolio: 4.83%
Sector: Food Producers
Fund Managers’ view: Nestlé is a multi-national packaged food and beverages company, whose brands are divided into seven product segments: powdered & liquid beverages, nutrition & health care, pet care, milk products & ice cream, prepared dishes & cooking aids, confectionary and water. Recent years have seen a welcome focus by the company on its food, beverages and nutritional health products,
exemplified by the disposal of Nestlé Skin Health for CHF 10.2 billion, as well as the US ice cream business, Fromneri, for some USD 4 billion. These businesses were no longer considered as core to the nutrition, health and wellness strategy. The redeployment of capital can be seen in the form of the acquisitions of Zenpep and Viokace, business producing pancreatic medications and both fitting into the Nestlé medical nutrition business.
SAPPercentage of portfolio: 3.51%
Sector: Software & Computer Services
Fund Managers’ view: SAP is a market leader in end-to-end enterprise application software, database, analytics, supply chain and customer experience management. We view the new CEO as transformational to the company after a period of dilutive mergers and acquisitions activity, profit margin declines and weak cash flows under the former management. There is now a renewed focus on execution excellence, improved industry functionality and product integration in order to realise the true cross-sell potential of SAP’s impressive suite of cloud apps into its vast installed customer base. We believe this should at least sustain or even accelerate top-line momentum and drive a re-rating.
ASMLPercentage of portfolio: 3.36%
Sector: Technology Hardware & Equipment
Fund Managers’ view: ASML is the leading supplier of lithography equipment needed for manufacturing ever more powerful, yet lower cost semiconductor chips. It is the monopolist machinery provider for advanced node semiconductors, a technology experiencing disproportionate growth. Capital equipment spending by semiconductor companies is set to rise further given increasing penetration growth via the digitisation of more and more aspects of our lives. ASML has a direct target of reducing the power consumption of its new tools by 35%, though the indirect positive effects from reducing power consumption of data centres running on leading edge chips produced on ASML machines are magnitudes bigger.
RochePercentage of portfolio: 3.25%
Sector: Pharmaceuticals & Biotechnology
Fund Managers’ view: A long-term portfolio holding, global pharmaceutical leader Roche is at the forefront of oncology research and treatment. Now the world’s leading biotechnology company, with over seventeen biopharmaceuticals on the market, Roche offers world-leading cancer treatments. Perhaps less well known is its leadership in in-vitro diagnostics, which influences over 60% of clinical decision-making, while accounting for only 2% of
Henderson European Focus Trust plc Annual Report 2020
15

Top ten holdings (continued)
total healthcare spending. We consider Roche’s diagnostics expertise as vital in a world where patient-specific, targeted treatments are experiencing strong growth. In addition, the company’s long track record of science-based success bodes well in newer therapeutic fields such as neuroscience and immunotherapy.
Saint-GobainPercentage of portfolio: 3.12%
Sector: Construction & Materials
Fund Managers’ view: Saint-Gobain is a global building materials company with a broad portfolio including plasterboards, insulation and glass. While it has an, at best, chequered history in value creation, the investment case is supported by the combination of significant internal change plus a market position which should make it a prime facilitator for improving the eco-credentials of European buildings. Regarding the former, while not yet confirmed by management, a pending CEO change promises to bring about a fundamental rethink on core value drivers like return on capital, with first steps in terms of long-overdue portfolio rationalisation now underway. The various European stimulus packages announced this year as well as the still to be formalised EU Green Deal appear significantly biased towards subsidising green building renovations, e.g. target to at least double the renovation rate of the European building stock. With 30-40% of its revenue exposed to the European renovation market, Saint-Gobain will clearly be a key beneficiary here.
ASR Nederland Percentage of portfolio: 2.87%
Sector: Nonlife Insurance
Fund Managers’ view: ASR Nederland is one of the leading Dutch insurance companies with its earnings splitting roughly 50-50 between life and non-life. The company is purely focused on its domestic market and is known for its conservative capital position. The resilience of its business model appears at odds with its valuation: 7-8% cash returns (dividend + buybacks) together with a mid-single digit growth profile. An improved pricing environment following recent industry consolidation, as well as pronounced private equity interest in the space, could act as catalysts for the stock.
AutolivPercentage of portfolio: 2.86%
Sector: Automobiles & Parts
Fund Managers’ view: Autoliv is the leading global manufacturer of passive safety systems (seatbelts, airbags, inflators etc) in the automotive industry. The fallout from Takata, Autoliv’s main competitor, producing faulty airbags and inflators culminated in the US National Highway Traffic
Safety Administration announcing the biggest recall campaign in its history in 2014-16. This event has helped Autoliv to command more than 40% market share and to continue winning over 50% of new orders for the safety products it produces. The company is now largely through the investment required to launch the various programmes and should be in a harvesting phase. We estimate that this should enable free cash flow (“FCF”) to quadruple to approximately $600m by 2023, putting it on an attractive FCF yield of 8.3%. Further, given the number of new launches and the increased safety content per vehicle means that we should see Autoliv easily outperform light vehicle production (“LVP”). Lastly, the management of Autoliv has ambitions to increase their margins to 12% in the medium term from 8.5% in 2019 – this will come from a number of areas including standardisation of product and normalisation of research and development spend.
SignifyPercentage of portfolio: 2.70%
Sector: Electronic & Electrical Equipment
Fund Managers’ view: Signify is a carbon-neutral company whose leading positions in lighting solutions should see it benefit from a number of secular growth trends in the coming decade – energy-efficient or “smart” buildings, controlled-climate agriculture (smart greenhouses and vertical farms) and UVC disinfection. Disowned as the runt of the Philips litter, Signify’s life as an independent listed entity has to date been defined by managing the deflationary transition from conventional lighting to LEDs. This has seen it largely shunned by investors; at its Covid trough it offered almost 20% FCF yield, a business priced for rapid run-off. However, management’s impressive cost management and delivery of margin stability – despite a significant Covid-induced top line decline – suggests the market has underestimated the quality of the business. Furthermore, we see a brighter future for Signify: the EU’s green recovery plan will support demand for energy efficiency solutions in buildings and the US could well follow suit depending on the political landscape. Signify’s decades-old leadership in UVC lighting – which has been proven to disinfect surfaces, air and water of Covid – is undergoing a renaissance and capacity expansion of 8x. Signify’s horticulture business should also experience high growth rates courtesy of an expansion in sophisticated agricultural infrastructure; the company offers food growers unique “light recipes” tailored to the crop, thus contributing a key pillar to a system which offers real-time monitoring and management of plant health, reduces water consumption by up to 90%, brings greater local food security and reduces the significant carbon footprint created through the transportation and refrigeration of food.
Henderson European Focus Trust plc Annual Report 2020
16
1 Net asset value (“NAV”) per ordinary share with dividends reinvested and excluding transaction costs2 FTSE World Europe ex UK Index in sterling terms3 Share price using mid-market closing prices4 Simple average NAV for the AIC Europe sector which comprises eight investment trusts5 Investment Association Europe ex UK sector6 Using the ongoing charge methodology prescribed by the Association of Investment Companies7 Excludes the special dividend of 1.40p per ordinary share paid in respect of the year ended 30 September 2017 Sources: Janus Henderson, Morningstar Direct, Refinitiv Datastream
Total return performance to 30 September 20201 year
% 3 years
%5 years
%7 years
%10 years
%
Company NAV1 5.9 12.7 65.0 98.5 187.4
Benchmark2 0.4 8.9 61.9 69.8 111.9
Company share price3 3.7 -2.2 44.4 81.2 182.2
AIC Europe sector NAV4 6.7 16.7 70.5 92.6 166.6
IA OEIC Europe sector average5 3.2 7.5 56.2 68.0 117.0
Total return performance over the 10 years to 30 September 2020 (rebased to 100)
NAV1
Sep10
Sep11
Sep12
Sep13
Sep14
Sep15
Sep20
Sep19
Sep18
Sep17
Sep16
0
50
100
150
200
250
300
Benchmark2 Share price3
Financial information
At 30 September
Net assets £’000
NAV p
Mid-market price per ordinary
share p
Profit/(loss) for year
£’000
Revenue return
p
Capital return/(loss)
p
Total return/(loss)
pDividend
pExpenses6
%
2011 103,913 580.0 493.88 (9,750) 18.29 (69.09) (50.80) 17.75 0.82
2012 115,431 682.2 591.75 19,832 17.49 98.18 115.67 19.00 1.16
2013 145,762 861.5 831.50 33,546 25.37 172.90 198.27 21.30 1.10
2014 170,988 956.7 962.00 21,010 22.14 98.38 120.52 23.45 0.88
2015 194,914 981.9 987.75 7,459 23.59 16.35 39.94 24.65 0.89
2016 237,551 1,153.1 1,045.50 40,186 26.85 169.05 195.90 26.40 0.90
2017 292,398 1,370.6 1,389.00 50,559 33.81 209.55 243.36 29.507 0.87
2018 293,790 1,366.6 1,240.00 5,822 31.60 (4.50) 27.10 31.00 0.84
2019 299,010 1,390.9 1,245.00 11,906 26.83 28.55 55.38 31.30 0.84
2020 308,166 1,441.2 1,260.00 17,330 24.13 56.54 80.67 31.30 0.82
Historical Information
17
Henderson European Focus Trust plc Annual Report 2020
Purpose and valuesThe Company’s purpose is to provide our shareholders with long-term growth through investing in a portfolio of stocks listed in Europe, and making this form of investment widely accessible to investors large and small. We do this by following a disciplined process of investment and by controlling costs and using borrowings to enhance returns.
The Board aspires to follow high standards of governance, with a culture based upon openness, mutual respect, integrity, constructive challenge and trust, as described further on pages 23 and 25. The Board seeks always to act in the best interests of shareholders, making the most effective use possible of the diversity of skills and experience of its members. This culture of openness and constructive challenge extends to the Board’s interaction with the Manager, being the Company’s most important service provider. The Board expects the Manager and all other service providers to hold values which align with the high standards promoted by the Board.
StrategyThe Company fulfills its purpose by doing business as an investment trust, and maintains a primary listing on the London Stock Exchange. Investment trusts are collective investment vehicles constituted as closed-ended public limited companies. The Company is governed by a board of independent non-executive directors and the management of the Company’s investments is delegated to the Manager.
The Company’s day-to-day functions, including administrative, financial and share registration services are carried out by duly appointed third-party service providers. The framework of delegation provides the Company with a cost-effective mechanism for delivering operations whilst allowing the Company to benefit from the capital gains treatment afforded to investment trusts. The closed-ended nature of the Company permits the Fund Managers to hold a longer-term view on investments and remain fully invested while taking advantage of any illiquidity in normal and volatile market conditions, as redemptions do not arise.
The Company complies, where relevant, with the Financial Conduct Authority’s (“FCA”) Handbook. Regulatory and portfolio information is announced via the regulatory news service on a daily, monthly and other periodic basis thereby assisting current and potential investors in making informed investment decisions. Additional portfolio information, commentary and corporate information is available on the Company’s website www.hendersoneuropeanfocus.com.
Investment objectiveThe Company seeks to maximise total return (a combination of income and capital growth) from a portfolio of stocks listed in Europe.
Investment policy
Asset allocationThe portfolio is predominantly invested in stocks listed in Continental Europe and has a bias to larger capitalised companies but may, within limits, be invested in the stocks of mid and smaller capitalised companies or in companies listed elsewhere, including UK, providing Continental European exposure.
Stock selection is not constrained by the benchmark and the stock weighting in the portfolio may be materially higher or lower than the weighting of any index used for performance comparisons, including in respect of geographical allocation.
Actual weightings of stocks held in the Company’s portfolio are based upon the Manager’s views of total return prospects. The portfolio is not constructed with a yield target.
DiversificationThe portfolio contains between 35 to 45 stocks with a maximum single stock weighting of 10% of net asset value (“NAV”) of the portfolio at the time of investment. Stocks weighted at 5% of the portfolio or more are not expected to exceed 50% of NAV in aggregate. The typical minimum stock weight is 1% of NAV.
Continental European listed stocks will consist of not less than 80 per cent of NAV at the time of investment, with the remaining exposure being in stocks listed elsewhere with exposure to Continental European economies. The exposure to smaller capitalised stocks at the time of investment is limited to 10% of NAV. (Smaller capitalised companies are considered to be those with a market capitalisation of less than €1 billion.)
DerivativesThe Company may use financial instruments, known as derivatives, for the purpose of investment and for efficient portfolio management for up to 10% of NAV at the time of entering into the contract.
GearingThe Company can borrow with the aim of achieving a return that is greater than the cost of the borrowing. The Company can borrow up to 20% of net assets at the time the borrowing is assumed.
Investment approach
Stock selectionThe Fund Managers use rigorous research to identify high-quality, attractively valued companies with strong balance sheet and cash flow potential. Free cash flow yields are an important valuation metric, rather than price/earnings ratios. The benchmark is the FTSE World Europe ex UK Index.
Business Model
Henderson European Focus Trust plc Annual Report 2020
18
Business Model (continued)
Company engagementThe Janus Henderson European Equities team’s experience in the European market has created a deep knowledge base. Management analysis is further supplemented by a body of increasingly sophisticated data related to environmental, social and governance (“ESG”) factors, broker research and company meetings.
The European Equities team works closely with the in-house Governance and Responsible Investment team to screen portfolios for ESG issues and to identify broader themes for discussion in making and holding investments.
The Fund Managers believe that if they were to invest in companies they judged to be systemically low scoring or failing businesses from an ESG perspective, this would detract from investment performance as well. They consider there to be a clear link between good corporate governance – in each of the E, S and G – and the cost of capital applied by global investors.
Their approach is built upon fundamental stock-picking blended with sector themes. This allows them to isolate investment decisions from market noise; however, the resulting approach can be contrarian, and can lead to investing in change. ESG factors can play a role in identifying these trends in corporate change and sector development.
It is during the in-depth research stage of the investment process where the Fund Managers will make an assessment on ESG considerations for each stock or sector. Their analysis tends to focus on the rate of change rather than existing scores. They want to gain a good understanding of what procedures and initiatives the company is putting in place to improve their ESG practices. This research is often far ranging, including topics such as board composition and staff remuneration as well as carbon targets and green financing.
Whist headline ratings from external providers can be a useful starting point, the Fund Managers caution investors from giving them too much significance. They are often backward looking and external providers face huge difficulties in aligning subjective topics contained within the ESG arena with a scoring system used to compare stocks. This has resulted in a high level of dispersion in ratings depending on the agency. One area where rating agencies appear to be in agreement is mega-cap technology companies, which tend to score well, yet even here we find cause for debate. Compared to their size, mega-cap tech generally has a disproportionately small work force and the market disruption on which their business models are built has wider implications on the employment market both in terms of overall employment but also wage inflation. The asset-light nature of tech business models means that they score well from an environmental perspective, but it could be argued that the ‘E’ is in conflict with the ‘S’. These are just a few of the reasons why the Fund Managers choose to focus on the delta as well as the absolute when it comes to ESG integration in stock selection.
Further information on the Company’s ESG approach is available on the Company’s website www.hendersoneuropeanfocus.com.
ESG integration in practiceThe European Utilities sector scores poorly given its legacy ‘brown energy’ assets, but with the European Commission’s plan for net zero carbon emissions by 2050, approximately 75% of power generation capacity in Europe must come from wind and solar compared with approximately 15% today. European Utility companies will play a large role in this transition and see their carbon output fall dramatically. The Fund Managers believe it represents a large, quasi-regulated growth opportunity which could see earnings growth elevated for a sustained period.
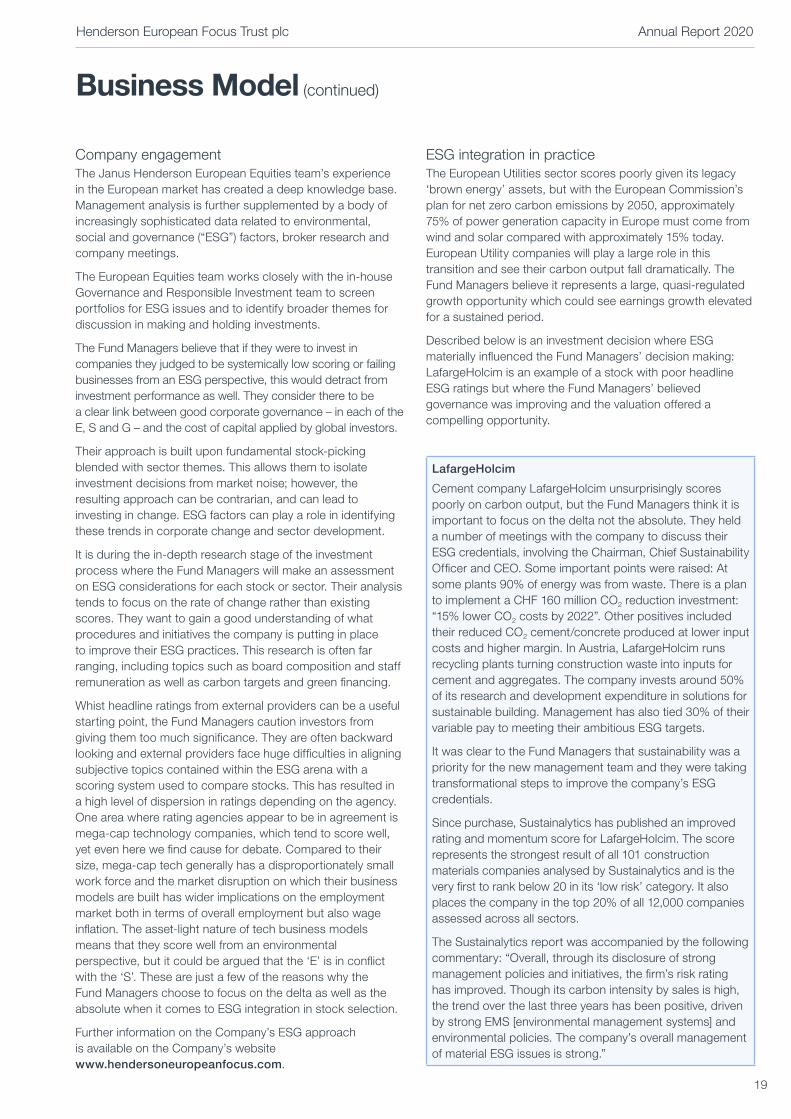
Described below is an investment decision where ESG materially influenced the Fund Managers’ decision making: LafargeHolcim is an example of a stock with poor headline ESG ratings but where the Fund Managers’ believed governance was improving and the valuation offered a compelling opportunity.
LafargeHolcim
Cement company LafargeHolcim unsurprisingly scores poorly on carbon output, but the Fund Managers think it is important to focus on the delta not the absolute. They held a number of meetings with the company to discuss their ESG credentials, involving the Chairman, Chief Sustainability Officer and CEO. Some important points were raised: At some plants 90% of energy was from waste. There is a plan to implement a CHF 160 million CO2 reduction investment: “15% lower CO2 costs by 2022”. Other positives included their reduced CO2 cement/concrete produced at lower input costs and higher margin. In Austria, LafargeHolcim runs recycling plants turning construction waste into inputs for cement and aggregates. The company invests around 50% of its research and development expenditure in solutions for sustainable building. Management has also tied 30% of their variable pay to meeting their ambitious ESG targets.
It was clear to the Fund Managers that sustainability was a priority for the new management team and they were taking transformational steps to improve the company’s ESG credentials.
Since purchase, Sustainalytics has published an improved rating and momentum score for LafargeHolcim. The score represents the strongest result of all 101 construction materials companies analysed by Sustainalytics and is the very first to rank below 20 in its ‘low risk’ category. It also places the company in the top 20% of all 12,000 companies assessed across all sectors.
The Sustainalytics report was accompanied by the following commentary: “Overall, through its disclosure of strong management policies and initiatives, the firm’s risk rating has improved. Though its carbon intensity by sales is high, the trend over the last three years has been positive, driven by strong EMS [environmental management systems] and environmental policies. The company’s overall management of material ESG issues is strong.”
Henderson European Focus Trust plc Annual Report 2020
19
Business Model (continued)
ManagementThe Company qualifies as an alternative investment fund in accordance with the Alternative Investment Fund Managers Directive (“AIFMD”). The Board has appointed Henderson Investment Funds Limited (“HIFL”) to act as its alternative investment fund manager (“AIFM”). HIFL delegates investment management services to Henderson Global Investors Limited in accordance with an agreement effective from 22 July 2014. The management agreement with HIFL is reviewed annually and can be terminated on six months’ notice. Both entities are authorised and regulated by the FCA and are part of the Janus Henderson group of companies. References to ‘Janus Henderson’ or the ‘Manager’ refer to the services provided to the Company by the Manager’s group.
The fund management team is led by John Bennett, appointed as Fund Manager in 2010, and Tom O’Hara, appointed as Co-Fund Manager in January 2020.
Ongoing charge and feesThe management agreement provides for the payment of a composite management fee. The fee is charged at 0.65% per annum of net assets up to £300 million, and 0.55% of net assets above £300 million. Any holdings in funds managed by Janus Henderson, of which there were none, are excluded from the calculation of the management fee. There is no performance fee.
The Board believes that the Company’s ongoing charge in the year was reasonable at 0.82% (2019: 0.84%), as detailed on page 76. As a key performance indicator, the ongoing charge is a measure of cost and competitiveness. The Board scrutinises all costs borne by the Company, and compares these to its peers in the AIC Europe sector.
BorrowingsThe Company has in place a multi-currency overdraft facility with HSBC Bank plc which allows borrowings up to the lesser of £46.8 million and 25% of custody assets. The Company may use leverage to increase returns for shareholders, which provides us with a significant advantage over other investment fund structures. The Board has delegated responsibility to the Fund Managers for deciding on the currency mix of the borrowings and seeks to avoid active currency positions relative to the benchmark. As at 30 September 2020, the facility was drawn down by £35.5 million.
Promoting the Company’s success
Section 172 statementThe directors act to promote the success of the Company for the benefit of its shareholders as a whole. In so doing, they have regard to the matters set out in s172(1) Companies Act 2006 (“CA06”). This includes the likely consequences of their decisions in the longer term and how they have taken wider stakeholders’ needs into account. The Board’s strategy is facilitated by engaging with a wide range of stakeholders through direct meetings, research and presentations and through our service providers’ interactions within the investment community and beyond.
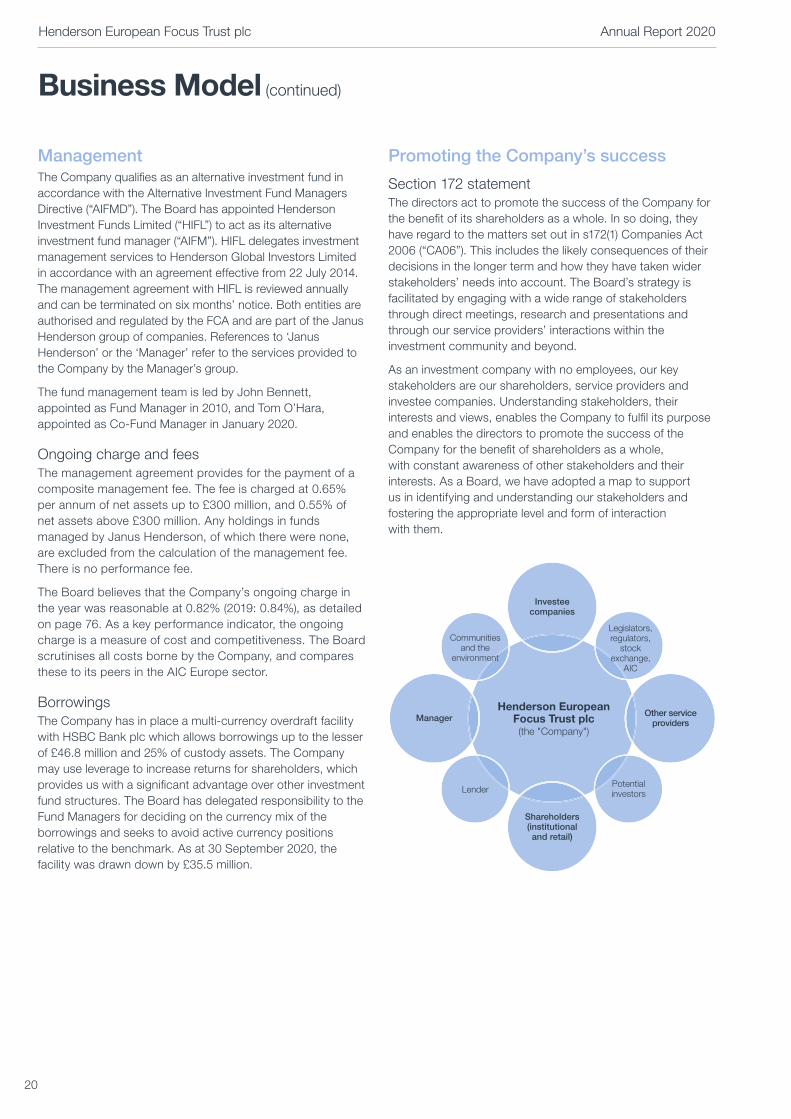
As an investment company with no employees, our key stakeholders are our shareholders, service providers and investee companies. Understanding stakeholders, their interests and views, enables the Company to fulfil its purpose and enables the directors to promote the success of the Company for the benefit of shareholders as a whole, with constant awareness of other stakeholders and their interests. As a Board, we have adopted a map to support us in identifying and understanding our stakeholders and fostering the appropriate level and form of interaction with them.
Investeecompanies
Henderson EuropeanFocus Trust plc(the "Company")
Manager
Communitiesand the
environment
Other serviceproviders
Shareholders(institutionaland retail)
Lender
Legislators,regulators,
stockexchange,
AIC
Potentialinvestors
Henderson European Focus Trust plc Annual Report 2020
20
Business Model (continued)
Set out below are examples of the ways in which the Board and the Company have interacted with key stakeholders in the year under review, in line with s172 CA06.
Stakeholders Engagement Outcome
Shareholders The Board communicates with shareholders through the annual and half-yearly reports factsheets, press releases, website and videos recorded by the Fund Managers. The directors meet with shareholders at the AGM and provide a forum for face-to-face debate with the Board and Fund Managers.
The Chair is always available to meet with shareholders or to answer questions, and welcomes conversations. After the 2020 AGM, the Board wrote to larger shareholders during the year to offer meetings.
The Board invited representatives of two of its shareholders to its annual strategy meeting in July 2020 to discuss their views on the Company, its external profile, their perception and expectations in respect of governance and performance against investment objective and policy.
Clear communication of strategy and the Company’s performance against its objective helps shareholders make informed decisions about their investments, based on clear information on short, medium and longer term aspects of the Company and its performance. This should also support a consistent and strong rating in the secondary market for the Company’s shares.
Close interaction with shareholders enables the Board to run the Company in line with shareholders’ interests as a whole and for the Company’s long-term success.
Fund Management Group
(Janus Henderson, providing investment management, administration, secretarial services as well as expertise in sales and marketing)
The Board regularly reviews performance against objective, policy and guidelines, and receives presentations from the Fund Managers and other representatives of the Manager at each board meeting to exercise effective oversight of portfolio, performance and strategic objectives. The Manager’s performance in all respects is reviewed formally by the Management Engagement Committee each year.
The directors work closely with the Fund Management Group outside scheduled board meetings on matters relating to portfolio management, administration and governance oversight, including relationships with third parties. They also meet to develop strategy, including a sales and marketing plan to promote the Company with the aim of raising its profile which in turn helps raise its rating. The Board also discusses stakeholder engagement and governance matters with the Manager’s representatives.
The Company is well managed and receives appropriate and timely advice and guidance for a reasonable cost.
Throughout the course of the Covid-19 pandemic the Board has been in regular contact with the Manager, receiving updates in the form of video conference calls, emails on matters including portfolio activity, and gearing levels and assurances on the resilience and health of key personnel.
Other service providers, including BNP Paribas as accountant and administrator (outsourced by the Manager), HSBC Bank as custodian and depositary, Equiniti as registrar, Winterflood as broker, and Ernst & Young as auditor
Representatives of all the main service provider functions present regularly to the Board.
The Company contracts directly with certain service providers for custodian, depositary and registrar services, and indirectly with BNP Paribas for fund administration and accounting services.
The Board and Manager work with the broker, including their research and sales teams to provide access to the market and liquidity in the Company’s shares.
The Board invites representatives of the broker and the Manager’s marketing and sales teams to provide regular updates on shareholders and is provided with analyses of shareholder movements. The Board addresses shareholder correspondence and voting patterns at general meetings are received and considered.
Reporting to the Board between meetings has been heightened since the onset of the Covid-19 crisis. This enabled monitoring of the Company’s operations and performance during these challenged times via all service providers, ensuring resilience of service provision and health of key personnel.
The Company is an attractive investment and there is liquidity in its shares. It is supported by experienced and capable third parties for all the services required to be a well-functioning Company.
Henderson European Focus Trust plc Annual Report 2020
21

Stakeholders Engagement Outcome
Investee Companies The Board sets the investment objective, with shareholder approval, and discusses stock selection, asset allocation, performance and prospects pertaining to investee companies, including strategy, current trading and ESG issues, with the Fund Managers at each board meeting.
The Manager has a dedicated Corporate Governance and Responsible Investment Team which supports the Fund Managers in the investment process, and engages with investee companies on behalf of the Company to exercise good stewardship practices on matters including ESG and voting at company meetings.
The Fund Managers, European Equities fund management team has conducted face-to-face and/or virtual meetings with all our portfolio companies’ management teams in the past year to enable them to interrogate current trading and prospects for their businesses.
In this way the Company is a responsible investor.
Lender (HSBC Bank) The Company maintains long-term borrowings at low rates through the use of an overdraft facility with HSBC. Further details are set out on page 20. The Manager keeps regular and good contact with the provider of the overdraft facility.
The Board monitors borrowing, and through its financial reporting to stakeholders, provides validation of compliance with lending limits.
Communities and the environment
The Board mandates the Manager, supported by its governance function, to engage with investee companies, when and where appropriate, on ESG matters in line with good stewardship practices, and with an approach agreed with the Board. The Board is also conscious of the importance of providing an investment product which meets the needs of its investors, including retail investors.
The Board is conscious of the need to take appropriate account of broader ESG concerns and for the Company to act as a good corporate citizen.
An investment approach that meets the needs of investors provides a service valuable to the communities in which the Company operates.
Potential investors The Board and Manager liaise to engage with the wider investor community through various forums to understand their requirements in addition to those of the current shareholders.
The material made available to current shareholders, as set out at the top of this table on page 21, is also publicly available for the benefit of potential investors.
By understanding the Company’s activities, performance, risks and prospects, potential investors will also be able to make informed decisions about their investments.
Board decision-makingThe Board is aware that not all decisions made by the Board will result in a positive outcome for all the Company’s stakeholders. The Board takes into consideration the Company’s purpose, investment objective and investment policy as well as the interests of the Company’s stakeholders when discussing matters and making decisions. The following are examples of the key discussions held and decisions made by the Board during the financial year ended 30 September 2020:
● the Board understands that shareholders and potential investors require information in order to make decisions about their investment in the Company. Through the presentation of the Company’s half-year and annual results to shareholders in the Half-Year Update, AGM and Annual Report, and making them available on the website to other stakeholders, the Company has provided information to support shareholders and potential investors to make informed decisions about their investment in the Company;
● directors are required to act in a way they consider to be for the benefit of its members as a whole. Consideration of the resolutions put to shareholders at the AGM and the proposed amendments to the Company’s Articles of Association (ensuring shareholders have access to general meetings in the future) are considered by the directors to be for the benefit of its members as a whole;
● the Company aims to return income on shareholder investments in the Company. The Board facilitates this through the approval of the Company’s interim and full year dividends. The directors assessed the impact on the Company’s shareholders and on the Fund Managers’ investment decisions in the short and long-term and ultimately agreed that the dividend should be maintained with the use of revenue reserves in order to align the interests of the shareholders and those of the Fund Managers in his management of the portfolio;
● another aspect of shareholder interests is management of the Company’s discount, including shares bought back
Business Model (continued)
Henderson European Focus Trust plc Annual Report 2020
22
during the year as part of the discount control mechanism. The Board, representatives of the Manager and the broker have regular in-depth discussions on this topic, and all feedback from shareholders and potential investors are shared with the Board in order to agree how best to approach the management of the Company’s discount;
● the Fund Managers’ approach to investing responsibly includes analysis of the environmental, social and governance impact the companies in the portfolio have on the wider community and the environment. The Company votes on investee companies’ resolutions where possible; and
● a key decision taken every year is validating the Company’s policy and strategic approach to investment and how that aligns with the make-up of ownership interests, as well as potential interests in the future. This includes a detailed consideration of structure, costs and promotion of the Company’s interests to the secondary market on issues such as repurchasing the Company’s shares.
CultureAs explained on page 20, the directors’ overarching duty is to promote the success of the Company for the benefit of investors, with consideration of other stakeholders’ interests. The directors promote mutual respect combined with constructive challenge, informed enquiry and a strong focus on shareholder interests. Integrity, fairness and diligence are defining characteristics of the Board’s culture. All directors seek to properly discharge their responsibilities and meet shareholder expectations in an open, transparent manner.
The Company has a number of policies and procedures in place to assist with maintaining a culture of good governance including those relating to directors’ conflicts of interest, directors’ dealings in the Company’s shares, bribery and tax evasion.
The Board welcomes diversity, and describes its activities in this respect under ‘Board diversity’ below.
The Board considers the culture of the Manager and other service providers through regular reporting and presentations from these stakeholders.
Board diversityThe Company’s affairs are overseen by a Board currently comprising three non-executive directors – two women and one man. In terms of progress in achieving diversity, the Board’s gender balance among directors comfortably exceeds the target of 33% of women on FTSE 350 company boards by 2020 set under the Hampton-Alexander Review, and is a notable increase from the 67% male, 33% female position at 30 September 2019.
The Board welcomes diversity of thought, and is working to increase this as far as possible. The directors are broad in their experience, bringing knowledge of investment markets, business, financial services, accounting and regulatory
expertise to discussions on the Company’s business, as demonstrated on page 30. The directors regularly consider the leadership needs and specific skills required to achieve the Company’s investment objective. Whilst appointments are based on skills and experience, the Board is cognisant of diversity of gender, social and ethnic backgrounds, cognitive and personal strengths and experience. All appointments are based on objective criteria and merit, and are made following a formal, rigorous and transparent process. The Company has no employees and therefore has no further disclosures to make in respect of gender representation within the Company.
Board approach to ESG mattersThe Board has reviewed the Manager’s Stewardship Statement and its ESG Investment Principles. Janus Henderson supports the UK Stewardship Code, and seeks to protect and enhance value for shareholders through active management, integration of ESG factors into investment decision making, voting and company engagement. Janus Henderson is a signatory to the United Nations Principles of Responsible Investment and an active member of a wide range of organisations and initiatives that work to promote ESG integration and responsible investment.
Voting and the Stewardship CodeThe Board believes that voting at general meetings is an important aspect of corporate stewardship and a means of signalling shareholder views on Board policy, practices and performance. Responsibility for voting the rights attached to the shares held in the Company’s portfolio has been delegated to the Manager, who actively votes at shareholder meetings and engages with companies as part of the voting process. Janus Henderson is committed to becoming a signatory of the Stewardship Code and, as required by the FRC, will report on how it has applied the provisions in its annual Responsible Investment Review in early 2021.
Voting decisions are guided by the best interests of the investee companies’ shareholders and made in consultation with the Fund Managers, who have an in-depth understanding of the respective company’s operations. Voting decisions are taken in keeping with the provisions of the Manager’s ESG Investment Principles, which set out the Manager’s approach to corporate governance, corporate responsibility and compliance with the Stewardship Code, and are publicly available on the Manager’s website at www.janushenderson.com. To retain oversight of the process, the directors receive reports on how the Manager has voted the shares held in the Company’s portfolio at each board meeting, and they review the Manager’s ESG Investment Principles at least annually.
The level of governance in leading global companies is generally of a high standard in terms of best practice, which meant support for the resolutions proposed by management was often warranted. However, in respect of 7% of resolutions at general meetings of the Company’s investees, support was
Business Model (continued)
Henderson European Focus Trust plc Annual Report 2020
23
Business Model (continued)
not warranted and, following discussion between the Fund Managers and Janus Henderson’s governance team, the shares were voted against board recommendations. These resolutions related to the remuneration of directors and auditors, re-election of directors and issuance of securities.
The Company’s shares in one jurisdiction were instructed as “do not vote” due to operational issues that might have led to a position where the Fund Managers were unable to transact in voted shares until after the relevant meeting.
The environmentAs an investment company with all its activities outsourced to third parties, the Company’s own direct environmental impact is minimal, occurring through the investments it makes.
The Company has no greenhouse gas emissions to report from its operations, nor does it have responsibility for any other emissions-producing sources1. The Fund Managers engage with investee companies on environmental matters where they arise, and the companies themselves report directly on their own emissions.
Business ethicsAs the Company’s operations are delegated to third-party service providers, the Board seeks assurances, at least annually, from its suppliers that they comply with the provisions of the UK Modern Slavery Act 2015 and maintain adequate safeguards in keeping with the provisions of the Bribery Act 2010 and Criminal Finances Act 2017.
Measuring performance
To measure the success of the Company in meeting its objective and to evaluate the performance of the Manager, the directors consider the following key performance indicators (“KPIs”). The charts, tables and data on pages 2, 3, 8 and 17 show how the Company has performed against those KPIs, and a glossary of terms and alternative performance measures is on pages 74 to 76.
Performance measurement
Whilst the portfolio is not constrained by the benchmark, the Board measures performance of NAV total return and share price total return against the FTSE World Europe ex UK index (in sterling) as benchmark terms and both the AIC and OEIC Europe sectors as its peer groups. The portfolio is not constructed with a yield target.
Discount or premium of share price to NAV per share
This is the level of discount or premium at which the ordinary shares trade relative to the NAV per share. The Board has a pragmatic approach to both allotting shares and to share buybacks and keeps its policy under review. The Board’s objective is to support an orderly market in the Company’s shares in a manner that is beneficial to the long-term interests of shareholders.
Ongoing charge The costs of running the Company calculated using the AIC ongoing charge methodology, including fees payable to the Manager.
Managing our risksThe Board, with the assistance of the Manager, regularly carries out a robust assessment of the principal risks facing the Company, including those which would threaten its business model, future performance and liquidity in its shares. The assessment includes consideration of economic and political risks, most of which are outside the Board’s direct control.
The Board has drawn up a detailed matrix of risks facing the Company, together with a strategic heat map charting the top ten risks, which it has distilled into six categories of principal risks, as shown on pages 25-27. To assist in mitigating the decision-taking risks as far as practicable, it has put in place a schedule of investment limits and restrictions, appropriate to the Company’s investment objective and policy, which it reviews at each board meeting.
The Board considers closely changes to the risk profile of the Company, arising from both internal and external triggers, and examines emerging risks as part of its regular review of the Company’s risk profile. The Board defines emerging risks as potential trends, sudden events or changing risks which are characterised by a high degree of uncertainty in terms of occurrence probability and possible effects on the Company. Once the emerging risks become sufficiently clear, they may be treated as specific risks and enter the Company’s matrix of risks.
1 Under the Companies Act 2006 (Strategic Report and Directors’ Reports) Regulations 2013 and the Companies (Directors’ Report) and Limited Liability Partnerships (Energy and Carbon Report) Regulations 2019
Henderson European Focus Trust plc Annual Report 2020
24

The Board receives regular and detailed reporting on specific and emerging risks from the Manager and other service providers. In addition, the Board receives reports on specialist topics from professional advisors, including lawyers and tax agents. These reports, as well as the directors’ own experience, enable effective monitoring of the risk landscape and changes to it. The Board encourages a culture of anticipating and scanning for direct and indirect market events and constructive challenge to identify and manage risk, where it can, including external risks which need a rapid response, as has been the case this year as a result of the Covid-19 pandemic.
The Board has met frequently during the year to monitor and manage risks related to the Covid-19 pandemic and considers it to be a major event with an ongoing impact on the likelihood and severity of the Company’s principal risks. Originally identified as an emerging risk early in Q1 2020, the pandemic developed significantly and quickly, triggering sharp falls in global stock markets and resulting in uncertainty about the ongoing impact on markets and companies, and around future dividend income. The risks associated with the pandemic were therefore moved from ‘emerging’ into three of the ‘principal’ risks facing the Company. The pandemic is likely to continue to have an impact on both the portfolio and the operations of the Company, as it will on so many aspects of economic and social activity. The Manager takes into account the impact of the pandemic, but the investment process remains unchanged and the operational requirements of the Company have, to date, proven resilient.
Principal risks The Company’s principal risks and mitigating steps are as follows:
Risk Controls and mitigation
Market
The Company’s absolute performance in terms of net asset value, total return and share price total return is dependent on the performance of the companies and markets in which it invests and is also impacted on by currency and interest rate movements, as well as by political and economic events.
Investment risk is spread by holding a diversified portfolio of companies, typically with strong balance sheets and good growth prospects. The Company does not currently embark on any currency or market movement hedging strategies, though it has the ability to do so.
The Company’s investment strategy is reviewed formally by the Board at least annually, and takes into account shareholder views, developments in the marketplace and how the structure of the Company is positioned to meet them.
Investment performance
The relative performance of the Company against its benchmark and European open and closed-ended peers depends principally on asset allocation and stock selection, which, in turn, require investment skills. In exercising these skills, the Manager is responsible for adhering to the investment policy and investment guideline restrictions set by the Board and amended from time to time.
The Board is responsible for ensuring that the investment policy is met. The day-to-day management of the Company’s assets is delegated to the Manager under investment guidelines, with close monitoring of the guidelines being applied.
The Board meets the Manager on a regular basis and keeps investment performance, in terms of both capital and income returns, under close review, as well as having an annual review of the Manager’s performance by the Management Engagement Committee. The Board has received frequent updates from the Fund Managers since the Covid-19 pandemic emerged, enabling the directors to monitor and manage risks related to the pandemic. Although the Company is not invested against any income criteria, the net income of the Company and the revenue reserves are monitored against dividend pay outs and anticipated future net income.
Investment performance is monitored over the short, medium and longer term against the Company’s benchmark and against a wider peer group of open and closed-ended investment vehicles investing in listed European equities. The Board also reviews the performance attribution analysis against benchmark in detail, to understand the main drivers of performance in reporting periods.
The Fund Managers keep the global political and economic picture under review as part of the investment process.
Business Model (continued)
Henderson European Focus Trust plc Annual Report 2020
25

Risk Controls and mitigation
Business strategy and market rating
A number of factors, including the setting of an appropriate investment proposition, changing investor demand or investment performance may lead to an increase or decrease in demand for and/or supply of the Company’s shares and will impact on how the shares are priced in relation to the Company’s underlying net asset value per share.
The Board monitors the Company’s ordinary share price relative to net asset value per share and reviews changes in shareholdings in the Company to try and understand short or longer-term trends in demand for and supply of the shares.
The Company is able, when appropriate, to issue or to buy back shares in order to help maintain an orderly secondary market in the Company’s shares, but not against any prescribed discount or premium levels, other than avoiding dilution to existing shareholders’ interests through share issuance at a discount. The Board also monitors the rating of the Company’s shares against other closed-ended investment companies in the sector and continues to deploy tools at its disposal in shareholders’ best interests.
The Company is ‘evergreen’ and does not have a liquidity event, such as periodic tenders or continuation votes.
The liquidity of the portfolio is monitored and is considered sufficient for the purposes of a closed-ended fund, including instances whereby the Company buys back its own shares.
Gearing
The Fund Managers have authority to use gearing in line with the Company’s investment policy. In the event of a significant or prolonged fall in equity markets any gearing in place would exacerbate the effect of the falling market on the Company’s net asset value and, consequently, its share price. (Gearing would have the opposite effect in the event of a significant or prolonged rise in equity markets in which the Company is invested.)
The Company’s investment policy sets a limit on gearing of 20% of net assets and the Board monitors the level of gearing at each meeting.
In practice, gearing is of a flexible, short-term nature, and it tends to fluctuate between 0% and 10% of net assets depending on the Fund Managers’ views of investment opportunities and views on the direction of European equity markets.
Operational
The Company is reliant on third-party service providers for all its operational activities, including reliance on Janus Henderson as investment manager, company secretary and administrator to the Company.
The Company depends on the diligence, skill and judgement of the Manager’s investment team. Continuity of service of the team and individuals in the team could impact on the future success of the Company.
Failure of third parties’ operational or internal control systems could prevent the accurate reporting or monitoring of the Company’s financial position. Janus Henderson sub-contracts some of the operational functions (principally those relating to trade processing, investment administration and accounting) to BNP Paribas.
Failure of controls could also impact on the Company meeting its regulatory obligations.
The Management Engagement Committee reviews each service provider at least annually, and, in conjunction with the Audit and Risk Committee, considers reports on internal controls, including any reported breaches, throughout the year, from all the service providers. This reporting covers such matters as continuity planning and cyber security risk as well as matters that are subject to review as part of the annual audit of the Company.
Janus Henderson has a strong European Equities team, which supports the Fund Managers in the management of the Company’s portfolio. Constructive challenge, succession and continuity planning are key elements of the management of the team and are reported on to the Board.
The Board reviews the internal control structure and reporting for the Company from all its agents and meets with their representatives throughout the year to make enquiry on the systems and controls.
The risk of failure of the Manager to manage financial or administrative controls, due to the increased possibility of cyber attacks whilst many employees worked from home, was increased due to the Covid-19 pandemic. The directors report that there has been no change to the level of service provided by the Manager or the Company’s other third-party suppliers and the pandemic has served to highlight the resilience and high quality of the services provided.
Business Model (continued)
Henderson European Focus Trust plc Annual Report 2020
26
Business Model (continued)
Risk Controls and mitigation
Regulatory and reporting
The Company operates in a highly regulated environment which could inter alia affect the listing in the Company’s shares and the Company’s tax status, as well as how the Company conducts its affairs in the market more generally. The Company also has strict reporting requirements that need to be adhered to both internally and externally to the market.
The Board is apprised regularly of impending regulatory and reporting changes and monitors closely, through its various agents, the Company’s adherence to existing requirements, including maintaining investment trust and listed company status.
The Board is also kept apprised of corporate governance guidance and, as far as practical, adheres to corporate governance guidelines that are applicable to an investment company.
The Board is kept informed by the Manager and professional advisors of relevant regulatory and reporting changes arising as a result of the Covid-19 measures and other geopolitical events, including the ongoing trade negotiations following the UK’s departure from the European Union.
Details of how the Board monitors the services provided by Janus Henderson and its other suppliers, and the key elements designed to provide effective internal control, are explained further on pages 35 and 40. Note 14 contains further details on the Company’s exposure to market risk (including market price risk, currency risk and interest rate risk), liquidity risk, credit and counterparty risk and how they are managed.
The Company’s viabilityThe AIC Code of Corporate Governance includes a requirement for the Board to assess the future prospects for the Company, and to report on that assessment within the Annual Report.
The Board considers that certain characteristics of the Company’s business model and strategy are relevant to this assessment:
● the Board looks to ensure that the Company seeks to deliver long-term performance;
● the Company’s investment objective, strategy and policy, which are subject to regular Board monitoring, mean that the Company is invested mainly in readily realisable, EU-listed securities and that the level of borrowings is restricted; and
● the Company is a closed-ended investment company and therefore does not suffer from the liquidity issues arising from unexpected redemptions.
Also relevant were a number of aspects of the Company’s operational agreements:
● the Company retains title to all assets held by the custodian under the terms of formal agreements with the custodian and depositary;
● revenue and expenditure forecasts are reviewed by the directors at each board meeting; and
● cash is held with approved banks.
In addition, the directors carried out a robust assessment of the principal risks and uncertainties which could threaten the Company’s business model, including future performance, liquidity and solvency, and considered emerging risks that could have a future impact on the Company.
The Board takes into account the liquidity of the portfolio, the gearing and the income stream from the portfolio, and the Company’s ability to meet its liabilities as they fall due. This includes consideration of how the forecast income stream, expenditure and levels of reserves could impact on the Company’s ability to pay dividends to shareholders over that period. Detailed income and expense forecasts are made over a shorter time frame. However, the nature of the Company’s business means that such forecasts are equally valid to be considered over the longer five-year period as a means of assessing whether the Company can continue in operation. The directors assess viability over five-year rolling periods, taking account of foreseeable severe but plausible scenarios. In coming to this conclusion, the directors have considered the impact of the Covid-19 pandemic and the UK’s ongoing trade negotiations with the European Union (“Brexit”), in particular the Company’s ability to meet its investment objective. The Board does not believe that these factors will have a long-term impact on the viability of the Company and its ability to continue in operation, notwithstanding any short-term uncertainty they have caused in the markets.
Henderson European Focus Trust plc Annual Report 2020
27
Business Model (continued)
In common with investment companies generally, the viability statement does not take into account corporate events which might be initiated by the Company or to which the Company might be subject, and where the Company’s circumstances might be dramatically changed. An investment company has relatively liquid assets, compared to industrial or commercial companies, and can, therefore, be subject to major and unexpected strategic change. No such event or change is known or currently in contemplation by the Company.
The directors believe that a rolling five-year period best balances the Company’s long-term objective, its financial flexibility and scope with the difficulty in forecasting economic conditions affecting the Company and its shareholders.
Based on their assessment, and in the context of the Company’s business model, strategy and operational arrangements set out on the previous pages, the directors have a reasonable expectation that the Company will be able to continue in operation and meet its liabilities as they fall due over the five-year period to September 2025.
For and on behalf of the Board
Vicky Hastings Chair of the Board 10 December 2020
Henderson European Focus Trust plc Annual Report 2020
28

Governance
Peugeot ION electric car
29
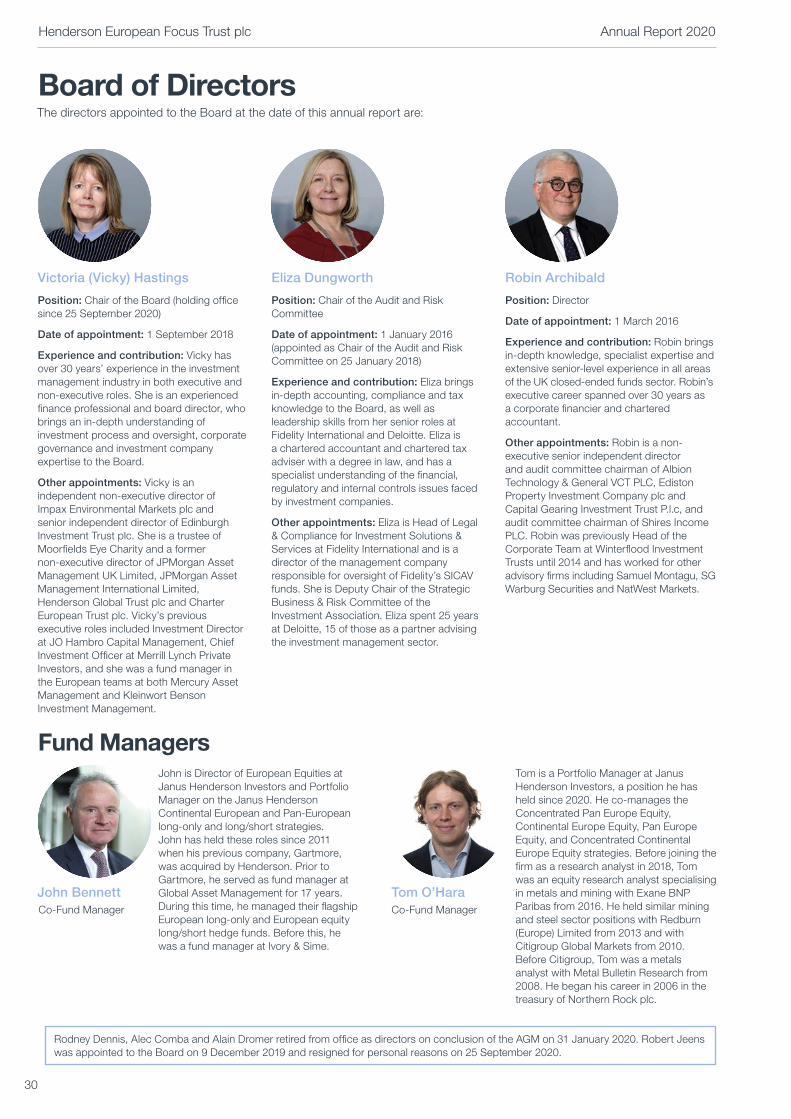
Victoria (Vicky) Hastings
Position: Chair of the Board (holding office since 25 September 2020)
Date of appointment: 1 September 2018
Experience and contribution: Vicky has over 30 years’ experience in the investment management industry in both executive and non-executive roles. She is an experienced finance professional and board director, who brings an in-depth understanding of investment process and oversight, corporate governance and investment company expertise to the Board.
Other appointments: Vicky is an independent non-executive director of Impax Environmental Markets plc and senior independent director of Edinburgh Investment Trust plc. She is a trustee of Moorfields Eye Charity and a former non-executive director of JPMorgan Asset Management UK Limited, JPMorgan Asset Management International Limited, Henderson Global Trust plc and Charter European Trust plc. Vicky’s previous executive roles included Investment Director at JO Hambro Capital Management, Chief Investment Officer at Merrill Lynch Private Investors, and she was a fund manager in the European teams at both Mercury Asset Management and Kleinwort Benson Investment Management.
Eliza Dungworth
Position: Chair of the Audit and Risk Committee
Date of appointment: 1 January 2016 (appointed as Chair of the Audit and Risk Committee on 25 January 2018)
Experience and contribution: Eliza brings in-depth accounting, compliance and tax knowledge to the Board, as well as leadership skills from her senior roles at Fidelity International and Deloitte. Eliza is a chartered accountant and chartered tax adviser with a degree in law, and has a specialist understanding of the financial, regulatory and internal controls issues faced by investment companies.
Other appointments: Eliza is Head of Legal & Compliance for Investment Solutions & Services at Fidelity International and is a director of the management company responsible for oversight of Fidelity’s SICAV funds. She is Deputy Chair of the Strategic Business & Risk Committee of the Investment Association. Eliza spent 25 years at Deloitte, 15 of those as a partner advising the investment management sector.
Robin Archibald
Position: Director
Date of appointment: 1 March 2016
Experience and contribution: Robin brings in-depth knowledge, specialist expertise and extensive senior-level experience in all areas of the UK closed-ended funds sector. Robin’s executive career spanned over 30 years as a corporate financier and chartered accountant.
Other appointments: Robin is a non-executive senior independent director and audit committee chairman of Albion Technology & General VCT PLC, Ediston Property Investment Company plc and Capital Gearing Investment Trust P.l.c, and audit committee chairman of Shires Income PLC. Robin was previously Head of the Corporate Team at Winterflood Investment Trusts until 2014 and has worked for other advisory firms including Samuel Montagu, SG Warburg Securities and NatWest Markets.
Board of DirectorsThe directors appointed to the Board at the date of this annual report are:
Fund Managers
John Bennett Tom O’Hara Co-Fund Manager Co-Fund Manager
Rodney Dennis, Alec Comba and Alain Dromer retired from office as directors on conclusion of the AGM on 31 January 2020. Robert Jeens was appointed to the Board on 9 December 2019 and resigned for personal reasons on 25 September 2020.
John is Director of European Equities at Janus Henderson Investors and Portfolio Manager on the Janus Henderson Continental European and Pan-European long-only and long/short strategies. John has held these roles since 2011 when his previous company, Gartmore, was acquired by Henderson. Prior to Gartmore, he served as fund manager at Global Asset Management for 17 years. During this time, he managed their flagship European long-only and European equity long/short hedge funds. Before this, he was a fund manager at Ivory & Sime.
Tom is a Portfolio Manager at Janus Henderson Investors, a position he has held since 2020. He co-manages the Concentrated Pan Europe Equity, Continental Europe Equity, Pan Europe Equity, and Concentrated Continental Europe Equity strategies. Before joining the firm as a research analyst in 2018, Tom was an equity research analyst specialising in metals and mining with Exane BNP Paribas from 2016. He held similar mining and steel sector positions with Redburn (Europe) Limited from 2013 and with Citigroup Global Markets from 2010. Before Citigroup, Tom was a metals analyst with Metal Bulletin Research from 2008. He began his career in 2006 in the treasury of Northern Rock plc.
Henderson European Focus Trust plc Annual Report 2020
30

Corporate Governance Report
Chair’s statement on corporate governanceYour Board is pleased to report below on the Board’s approach to the governance of your Company. On page 30, you will find details of each director. As a Board, we believe that good governance creates value and we are committed to high standards of corporate governance, business ethics and transparency.
Compliance with corporate governance codesBy virtue of its premium listing on the London Stock Exchange, the Board is required to report on how the principles of the UK Corporate Governance Code (the “UK Code”) have been applied. Being an investment company, a number of the provisions of the UK Code are not applicable as the Company has no executive directors or internal operations. The Board has therefore considered the principles and recommendations of the AIC Code, being the 2019 Code of Corporate Governance published by the Association of Investment Companies, of which the Company is a member. The AIC Code addresses the principles set out in the UK Code as well as additional principles and recommendations on issues that are of specific relevance to investment companies. The Financial Reporting Council (“FRC”) has endorsed the AIC Code and confirmed that, by following it, the boards of investment companies should fully meet their obligations under the UK Code and paragraph 9.8.6 of the Listing Rules.
The AIC Code and the UK Code can be found on the respective organisations’ websites: www.theaic.co.uk and www.frc.org.uk. The AIC Code includes an explanation of how it adapts the principles and provisions set out in the UK Code to make them relevant for investment companies.
Statement of complianceThe Board confirms that the Company has applied the principles and adhered to the provisions of the AIC Code throughout the year under review and to the date of this report, other than in respect of a senior independent director (“SID”). Since Vicky Hasting’s appointment as Chair on 25 September 2020, the role of SID is vacant until further consideration by the Board in the coming year. Shareholders are invited to raise any concerns with any of the directors, each of whom has expertise on which they lead.
The Company has no chief executive or other executive directors and therefore has no need to consider the remuneration of executive directors. In addition, the Company does not have any internal operations and therefore does not
maintain an internal audit function, though the Audit and Risk Committee considers the need for such a function at least annually.
A separate remuneration committee has not been established as the Board consists of only three non-executive directors and the Company has no employees. The Board has expanded the remit of the Nominations Committee to include responsibility for remuneration (see the Nominations Committee Report on pages 36 to 37). The Board Chair does not however act as Chair of the Nominations Committee when it considers matters relating to the performance, succession or remuneration of the Chair.
The BoardThe Board comprises three non-executive directors, whose biographies are included on page 30. These details demonstrate the breadth of investment, financial, commercial and professional experience relevant to their position as directors. Together as a Board they have overall responsibility for the Company’s affairs and for promoting the long-term success of the Company. All directors in office at the date of this report served throughout the year.
The Board meets formally at least five times a year, with additional board or committee meetings arranged when required. The directors have regular contact with the Fund Managers, representatives of the corporate secretary and other employees of the Manager between formal meetings.
The Board has a formal schedule of matters specifically reserved for its decision, which includes setting strategy and providing oversight of performance against agreed measures. All matters that are not delegated to the Manager under the management agreement, such as the purchase and sale of investments, are reserved for the Board’s decision. It approves any changes to the structure and capital arrangements for the Company, has oversight of financial reporting and assesses the effectiveness of the internal control framework. The Board approves annual and half-year results, communications with shareholders, the appointment of new directors, oversees corporate governance matters and is responsible for determining the remuneration of directors.
The Board has three principal committees: the Audit and Risk Committee, the Management Engagement Committee and the Nominations Committee, as set out in the governance structure chart on page 32. The Board keeps its schedule of matters reserved and terms of reference for each committee under regular review, and these are available on the Company’s website www.hendersoneuropeanfocus.com. Reports on the activities undertaken by each committee during the reporting period are set out on pages 36 to 41.
Henderson European Focus Trust plc Annual Report 2020
31

Corporate Governance Report (continued)
Governance structure
Audit and Risk Committee
Chair: Eliza Dungworth
Purpose: Ensure the integrity of the financial reporting,
evaluate the effectiveness of the systems of internal control
and risk management, and oversee the relationship with
the external auditors
Nominations Committee
Chair: Vicky Hastings
Purpose: Ensure the Board has a balance of skills, experience
and diversity, oversee effectiveness reviews of the Board and its committees, review directors’ fees and
maintain an effective framework for succession planning, with a
formal approach to the appointment of directors
Management Engagement Committee
Chair: Vicky Hastings
Purpose: Ensure that the performance of service
providers meets expectations and their terms of
engagement remain appropriate
Board of Directors
Comprises independent non-executive directors
Chair: Vicky Hastings
Third-party service providers appointed by the Board
HSBC Bank plc Custodian and
depositary
Ernst & Young LLP
Auditor
Equiniti Limited Registrar
Winterflood Securities
Limited Corporate broker
Janus Henderson InvestorsFund Management: European Equities team with John Bennett and Tom O’Hara
as the Company’s appointed Fund Managers
Sales, Marketing, Corporate Secretary
Alternative Investment Fund Manager: Henderson Investment Funds Limited
Henderson European Focus Trust plc Annual Report 2020
32

Corporate Governance Report (continued)
Board leadership and responsibilities
Role Primary responsibilities
Board ● Responsible for providing leadership of the Company’s affairs● Sets the Company’s investment objective, policy and strategy● Establishes a robust internal control framework enabling effective risk management● Appoints and monitors the performance of service providers in meeting the objective within
the control framework● Sets the Company’s culture and values● Ensures that obligations to shareholders and other stakeholders are understood and met● All directors are non-executive and independent of the Manager● No directors are linked via any other directorships
Chair of the Board ● Vicky Hastings is Chair of the Board● Provides effective leadership of the Board including setting its agenda with the support of other
directors and the corporate secretary● Leads the Board’s relationship and engagement with shareholders and other stakeholders● Manages the relationship with the Manager● Vicky Hastings was independent on appointment in accordance with the AIC Code criteria and has no
relationships that may create a conflict of interest between her interests and those of shareholders
Senior independent director (“SID”)
● Provides a sounding board for the Chair● Serves as an intermediary for the other directors, shareholders and other stakeholders● Leads the effectiveness review of the Chair● Leads in place of the Chair on other occasions as required● During the year, Alec Comba held office to 31 January 2020, Vicky Hastings held office from 28 May
2020 to 25 September 2020● At the date of this Report, there is no SID in office, due to the small size of the Board. Under the
provisions of the AIC Code, the Chair of the Audit and Risk Committee will fulfill this role, if required to do so
Audit and Risk Committee
● Chaired by Eliza Dungworth, who has recent and relevant financial experience● All directors are Committee members, which brings a combination of financial, investment and other
experience, enabling the Committee to have broad competence relevant to its mandate● Responsible for the integrity of the financial statements, internal controls and risk management, and
the relationship with the statutory auditor
Management Engagement Committee
● Chaired by Vicky Hastings● All directors are Committee members● Responsible for evaluating the overall performance of the Manager and other third-party service
providers
Nominations Committee
● Chaired by Vicky Hastings, except when considering matters relating to the Chair’s succession, performance or fees
● All directors are Committee members● Responsible for Board succession planning, recruitment, directors’ fee recommendations, Board
effectiveness reviews, diversity and related matters
Insider Committee ● Chaired by Vicky Hastings● All directors are Committee members● Meets when required to assist the Board in discharging its responsibilities under the Market Abuse
Regulations and the FCA’s Listing Rules and Disclosure Guidance and Transparency Rules
Henderson European Focus Trust plc Annual Report 2020
33
Corporate Governance Report (continued)
Operation of the BoardEach board meeting follows a formal agenda, which includes a review of the Company’s investment performance, financial position, compliance with the investment parameters, a review of shareholder movements along with any sales and marketing activities undertaken and any other relevant business matters in order to ensure that control is maintained over the Company’s affairs. Employees of the Manager attend each board meeting enabling the directors to discuss the affairs of the Company and to probe further on matters of concern. The Board receives and considers regular reports from the Manager and ad hoc reports and information from other parties as required.
The Board has engaged third-party service providers to deliver the operations of the Company. Janus Henderson has been appointed to provide investment management services, and also provides the day-to-day accounting, company secretarial, administrative, sales and marketing activities. The Company has appointed a depositary, HSBC Bank plc, who in turn appoints the custodian who is responsible for the safe custody of the Company’s assets. The Company has appointed a registrar, Equiniti Limited, to maintain the register of members and assist shareholders with queries in respect of their holdings. Each of these principal contracts was entered into after full and proper consideration by the Board of the quality and cost of the services offered, including the control systems in operation in so far as they relate to the affairs of the Company. The Board and its committees maintain oversight of the third-party service providers through regular and ad hoc reporting. The Board meets annually with representatives from the depositary and custodian to discuss amongst other matters performance, service levels, their value for money, information security and business continuity plans.
The Manager ensures that all directors receive, in a timely manner, relevant management, regulatory and financial information, to allow them to discharge their responsibilities and enable smooth functioning of the Board and its committees. The directors have access to the advice and services of the corporate secretary through its appointed representative who is responsible to the Board for ensuring that Board and Committee procedures are followed and that applicable rules and regulations are complied with. The proceedings at all Board and Committee meetings are minuted, with any director’s concerns recorded in the minutes.
The corporate secretary, Henderson Secretarial Services Limited, is a subsidiary of Janus Henderson with its own reporting lines and audited internal controls. There are processes and controls in place to ensure that there is a clear distinction between the two entities, particularly when dealing with any conflicts or issues between the Company and Janus Henderson. Any correspondence from shareholders addressed to the Chair or to the Company received by Janus Henderson is forwarded to the Chair in line with the audited procedures in place, and is submitted to the next board meeting as appropriate.
The Board, the Fund Managers and the corporate secretary operate in a supportive, co-operative and open environment.
Arrangements with directors
Appointment, tenure and retirementThe Board may appoint directors to the Board at any time during the year. Any director so appointed should stand for election by shareholders at the next annual general meeting in accordance with the provisions of the Company’s Articles of Association.
The directors and the Chair of the Board are generally expected to serve for no more than nine years, other than in exceptional circumstances, subject to satisfactory Board effectiveness review. All directors stand for re-election by shareholders annually in keeping with the provisions of the AIC Code.
The Articles permit shareholders to remove a director before the end of his or her term by passing an ordinary resolution at a general meeting. An appointment may be terminated by either party giving written notice without compensation payable.
IndependenceThe independence of the directors is determined with reference to the AIC Code and is reviewed by the Board at least annually. The Board considers each director’s external appointments and commitments, as well as their tenure of service and any connections they may have with the Manager. Following completion of the annual Board effectiveness review in September 2020 and assessment by the Nominations Committee, the Board concluded that all directors continue to be independent in character and judgement.
Induction and ongoing trainingNewly appointed directors are offered an induction programme bespoke to their role which covers the legal and regulatory framework for investment companies and the operations of the Manager, including the compliance and risk management frameworks, accounting, sales and marketing, and other administrative services.
Directors are provided with information on the Company’s policies, regulatory and statutory requirements affecting the Company, as well as changes to the directors’ responsibilities as they arise. Directors are encouraged to attend external training and industry seminars and may do so at the expense of the Company.
In addition, the Chair is able to attend meetings of all the chairs of the investment trust companies managed by Janus Henderson which provide a forum to discuss industry matters which would then be reported back to the Board.
The Company has a procedure for directors to take independent professional advice in the furtherance of their duties at the expense of the Company.
Henderson European Focus Trust plc Annual Report 2020
34

Corporate Governance Report (continued)
Directors’ insurance and indemnificationDirectors’ and officers’ liability insurance cover is in place which indemnifies the directors against certain liabilities when carrying out their duties. The Company’s Articles of Association provide for an indemnity in respect of costs which directors may incur relating to the defence of any proceedings brought against them arising from their position as directors, where they are acquitted or judgment is given in their favour. The Company has granted an indemnity to each director to the extent permitted by law regarding their potential liabilities as directors of the Company.
Directors’ conflicts of interestThe Articles of Association permit the Board to consider and, if it sees fit, to authorise situations where a director has an interest that conflicts, or may possibly conflict, with the interests of the Company (“situational conflicts”). The Board has a formal system in place for directors to declare situational conflicts for authorisation by those directors who have no interest in the matter being considered. In deciding whether to authorise a situational conflict, the non-conflicted directors must act honestly and in good faith with a view to the best interests of the Company. The directors may impose limits or conditions when giving the authorisation, or subsequently, if they think this is appropriate. Any situational conflicts are recorded in the minutes and reviewed at each board meeting.
On appointment, and throughout the Chair’s tenure, it is confirmed that Vicky Hastings has had no relationship that may have created a conflict between her interests and those of the Company’s shareholders.
Board attendanceThe table below sets out the number of formal board and committee meetings held during the year under review and the number of meetings attended by each director. The number in brackets denotes the number of meetings each director was entitled to attend.
Board AC NC MEC
Number of meetings 6 3 3 1
Vicky Hastings1 6 (6) 3 (3) 3 (3) 1 (1)
Robin Archibald 6 (6) 3 (3) 3 (3) 1 (1)
Alexander Comba2 2 (2) 1 (1) n/a n/a
Rodney Dennis2 2 (2) 1 (1) n/a n/a
Alain Dromer2 2 (2) 1 (1) n/a n/a
Eliza Dungworth 6 (6) 3 (3) 3 (3) 1 (1)
Robert Jeens3 3 (4) 2 (2) 2 (2) n/a
1 Appointed Chair 25 September 20202 Retired 31 January 20203 Appointed 9 December 2019 and resigned 25 September 2020
All directors attended the 2020 Annual General Meeting, and the Insider Committee did not meet during the year. Outside the formal meetings identified above, the Board, or committees of it, had regular interaction over the year on various corporate activities, and met to undertake business such as the approval of the Company’s results and dividends, as well as holding frequent investment and operational update calls throughout the Covid-19 pandemic.
Board effectiveness reviewIn the year under review, the Board also conducted an internal review of its own performance, together with that of its committees and individual directors, through the use of a questionnaire. The Chair in office held discussions with each director individually. The Senior Independent Director in office undertook a review of the Chair’s performance, taking feedback from each director.
On the basis of the findings from the internal effectiveness review, the Board concluded that:
● each director makes a significant contribution to the affairs of the Company and brings different qualities to the Board;
● the Chair displayed strong leadership and strong shareholder engagement;
● the Board has an effective leadership structure; ● directors seeking re-appointment at the Company’s AGM
merit re-appointment by shareholders;● no director is ‘overboarded’, and each director continues
to dedicate the time required to fulfil their duties to the Company effectively;
● the Board’s size and composition remain sufficient for the Company;
● the Board retains a good balance of skills and business experience, as set out on page 30;
● the Board continues to operate effectively; and ● the committees continue to support the Board efficiently
in fulfilling its duties.
Audit, risk and internal controlThe Board has overall responsibility for the Company’s system of internal control and for reviewing its effectiveness, as set out in the chart on page 40.
The Board has reviewed the effectiveness of the Company’s system of internal controls for the year ended 30 September 2020. During the course of its review the Board did not identify and was not advised of any failings or weaknesses that were determined as significant. The Audit and Risk Committee supports the Board in the continuous monitoring of the internal controls and risk management framework. Its considerations in this respect, including why the Company does not have its own internal audit function, are set out on pages 38 to 41.
Henderson European Focus Trust plc Annual Report 2020
35

Management Engagement Committee
Role and responsibilities The Management Engagement Committee (“MEC”) is responsible for reviewing the management contract on a regular basis, ensuring that the terms are fair and reasonable and that its continuance, given the Company’s performance over both short and longer terms, is in the best interests of the Company and its shareholders. It is also responsible for reviewing the performance and cost effectiveness of the Company’s other service providers.
MembershipAll directors are members of the MEC, which is chaired by the Chair of the Board.
MeetingsThe MEC meets at least annually, with additional meetings scheduled when required.
Activities during the yearIn discharging its duties over the course of the year, the Committee considered:
● the investment performance of the Company over the short and longer term, taking account of the benchmark and performance of competitors in the AIC peer group, the share price total return, NAV total return, dividend growth, dividend yield and discount versus the peer group;
● the quality of other services provided by the Manager, including company secretarial and accounting;
● the quality and experience of the team involved in managing all aspects of the Company’s business;
● the fee structures of its competitors in the AIC peer group and other Janus Henderson managed investment companies;
● the key clauses of the management agreement, how the Manager had fulfilled these and whether these continued to be appropriate; and
● the performance and fees of the Company’s other third-party service providers, including the brokers, depositary, custodian, registrar, auditors, legal counsel and the Company’s accountants.
Continued appointment of the ManagerThe Board considers the arrangements for the provision of investment management and other services to the Company
on an ongoing basis. The principal contents of the agreement with the Manager are contained on page 20.
Following completion of the annual review and on recommendation by the MEC, it is the Board’s opinion that the continuing appointment of the Manager and other service providers on the existing terms is in the interests of the Company and its shareholders as a whole.
MEC effectiveness reviewThe activities of the MEC were considered as part of the Board effectiveness review.
Nominations Committee
Role and responsibilities The Nominations Committee (“NC”) is responsible for reviewing Board succession planning and tenure policy, the effectiveness of the Board as a whole and its committees, the appointment of new directors through an established formal procedure, and reviewing directors’ fees.
MembershipThe NC is chaired by the Chair of the Board, except when the Chair’s performance, successor or fees are being considered. All directors are members of the NC.
MeetingsThe NC meets at least annually, with additional meetings scheduled when required.
Activities during the yearIn discharging its duties over the course of the year, the NC considered and made recommendations for approval by the Board as appropriate:
● the composition of the Board and each of its committees, taking account of the contribution of the skills, experience and knowledge of each director to the success of the Company;
● the outcomes of the Board effectiveness review with a view as to whether adjustments should be made to the number of directors or knowledge and skills represented on the Board;
● the tenure of each of the directors, giving consideration as to whether the Board retained a sufficient balance of tenure without becoming complacent;
Corporate Governance Report (continued)
Henderson European Focus Trust plc Annual Report 2020
36
● the independence of the directors, taking account of the directors’ other commitments, in line with the guidelines established by the AIC Code;
● changes to directors’ fees to ensure their ongoing suitability;
● the appointment of Vicky Hastings as Senior Independent Director in May 2020, following Alec Comba’s retirement in January 2020;
● the appointment of Vicky Hastings in September 2020 as Chair of the Board in the interim period to the 2021 AGM, following Robert Jeens’ resignation;
● the time commitment of the directors, in the context of their other business commitments and appointments, and whether this had been sufficient over the course of the year;
● succession planning for appointments to the Board, and recommendations of the AIC Code in respect of the length of service of directors and the Chair;
● adoption of a formal diversity policy; and● the effectiveness and contribution of the directors
standing for re-election at the forthcoming AGM.
Succession planning and recruitment When considering succession planning and tenure policy, the NC bears in mind the balance of skills, knowledge, experience, gender and diversity on the Board, the achievement of the Company’s investment objective and compliance with the Company’s Articles of Association and the AIC Code. Individual performance and the contribution of each director remain an integral element of the Company’s approach.
The NC considers diversity as part of the annual effectiveness review and it is considered that there is a broad range of backgrounds, skills, knowledge and experience to achieve effective stewardship of the Company and each director brings different qualities to the Board and its discussions. The NC will make recommendations when the recruitment of additional non-executive directors is required and ensure that long lists of candidates should include diverse individuals of appropriate experience and merit.
Once a decision is made to recruit additional directors to the Board, a formal job description is drawn up. The Company may use external recruitment agencies and did so for the recruitment of Robert Jeens who joined the Board on 9 December 2019. Tyzack Associates was selected to assist with this search, and has not provided any other services to the Company during the year and to date.
The NC also reviews and recommends to the Board the directors seeking re-election. Recommendation is not automatic and will follow a process of evaluation of each director’s performance and consideration of the director’s independence, as well as the mix of skills and experience of the current Board members. The NC considers the time commitment of the directors, including other business commitments and appointments.
Board effectiveness review The NC met in September 2020 to carry out its annual review of the Board and its committees. Following completion of its review, the NC concluded that the Board continued to operate effectively. Taking into account the FRC’s guidance, the NC considered that no director was ‘overboarded’. Having considered the effectiveness of individual directors, the NC recommended to the Board that it should support the re-election of the directors seeking re-election at the 2021 AGM. Further results of the Board effectiveness review are detailed on page 35.
NC effectiveness reviewThe activities of the NC were considered as part of the Board effectiveness review.
By order of the Board
Henderson Secretarial Services Limited Corporate Secretary 10 December 2020
Corporate Governance Report (continued)
Henderson European Focus Trust plc Annual Report 2020
37

Audit and Risk Committee Report
MembershipThe members of the Audit and Risk Committee (the “Committee”) are Eliza Dungworth, Robin Archibald and Vicky Hastings. The Committee is chaired by Eliza Dungworth, who is a chartered accountant and chartered tax adviser, with a degree in law. The Committee as a whole has competence relevant to the sector in which the Company operates and to the Company as an investment trust. The Board believes that it is appropriate at present for the Chair of the Board to be a member of the Committee, as the Board comprises only three directors. Furthermore to lose the Chair’s contribution would not be in the best interests of shareholders, given her experience and expertise. The Committee will reassess its requirements as the current year progresses and take into account shareholder views.
MeetingsThe Committee met formally three times during the year under review: in advance of the publication of the annual and the half-year results and on one other occasion with an agenda that was focused on its broader risk and internal control responsibilities. The Company’s auditor is invited to attend meetings as appropriate. Representatives of the Manager attend at least on an annual basis, including the Financial Reporting Manager, representatives of the Operational Risk, Internal Audit, Business Continuity functions, the Chief Information Security Officer, and BNP Paribas Securities Services may also be invited.
Committee effectiveness reviewThe activities of the Committee were considered as part of the Board effectiveness review process.
Role and responsibilitiesThe Committee is responsible for ensuring the integrity of the Company’s financial reporting, evaluating the effectiveness of the systems of internal control and risk management and monitoring the effectiveness and objectivity of the external auditor.
The Committee Chair formally reports to the Board after each meeting, and makes recommendations for approval where relevant. The Committee’s responsibilities are set out in formal
terms of reference, available on the website, which are reviewed at each formal meeting.
In discharging its duties over the course of the year, the Committee considered:
● accounting policies and the quality and effectiveness of the accounting records and management information maintained on behalf of the Company;
● the half-year and annual results and the Annual Report. This includes disclosures on internal controls, risk management, viability, going concern and related parties, and consideration of whether the report is fair, balanced and understandable and provides the information necessary for the Company’s shareholders to assess the Company’s position and performance, business model and strategy;
● appropriate level of dividend to be paid by the Company, including sufficiency of revenue reserves, for recommendation to the Board;
● internal controls in place at Janus Henderson, BNP Paribas Securities Services as administrator, HSBC Bank plc as depositary and custodian and Equiniti as registrar;
● Janus Henderson’ policies and activities in relation to information security and business continuity, meeting with representatives of Janus Henderson’ internal audit, information security and risk departments;
● the key risks, risk management systems in place and the Company’s risk map;
● the Company’s Anti-Bribery Policy and the policies and procedures in place to prevent tax evasion;
● the nature and scope of the external audit and its findings;● whether there is a need for an internal audit function;● the appointment of the auditor, their performance,
remuneration and tenure of appointment, their independence, objectivity and effectiveness, and the reporting of the external auditor;
● the audit plan, including the principal areas of focus;● the Manager’s and other key service providers’
whistleblowing policies for staff to raise concerns about possible improprieties, including in relation to the Company, in confidence;
● the management fee calculations;● the allocation of expenses between capital and revenue to
ensure the appropriate split; ● the Company’s taxation affairs, including withholding tax
recoverability and the Committee Chair’s annual meeting with the Company’s custodian on taxation matters;
● Committee members’ meetings during the year on risk, resilience and reporting matters outside formal Committee meetings; and
● the impact on Covid-19 on the Company, including its risks and internal controls, and how that should be reported.
The Chair of the Audit and Risk Committee, Eliza Dungworth, reports to shareholders on the year to 30 September 2020
Henderson European Focus Trust plc Annual Report 2020
38
Audit appointment and tenureRegulations currently in force require the Company to rotate audit firms after a period of ten years, which may be extended where audit tenders are carried out or where more than one audit firm is appointed to carry out the audit. Ernst & Young LLP (“EY”) was appointed as the Company’s auditor on 25 July 2014 following the last formal tender process.
The auditor is required to rotate partners every five years. This is the second year in which Mike Gaylor, the Audit Partner, has been in place.
Auditor review and independenceThe Committee monitors the auditor’s independence through the approval of a policy regulating the non-audit services that may be provided by the auditor to the Company, assessing the appropriateness of audit fees paid and by reviewing the information and assurances provided by the auditor on their compliance with the relevant ethical standards.
EY confirmed that all its partners and staff involved with the audit were independent of any links to the Company, and that these individuals had complied with their ethics and independence policies and procedures which are fully consistent with the FRC’s Ethical Standards.
The Audit and Risk Committee has the opportunity to discuss the audit process with the auditor without representatives of the Manager present and considers the effectiveness of the audit process.
Audit feesThe fees payable to EY for audit services were £35,000 (2019: £24,000) and EY provided no other services. The regulator is now requiring auditors to price their independent audits of investment trusts on a standalone basis, and we anticipate that the increase in fees for this reason will continue in the coming year.
Policy on non-audit servicesThe Committee has approved, and keeps under regular review, a policy on the provision of non-audit services by the auditor. The policy sets out that the Company’s auditor will only be considered for non-audit work where this is not prohibited by current regulations and where it does not appear to affect the independence and objectivity of the auditor. In addition, the provision of any non-audit services by the auditor is not permitted to exceed 70% of the average annual statutory audit fee for the three consecutive financial periods preceding the financial period to which the cap applies. Such services require approval in advance by the Committee, or Committee Chair, following due consideration of the proposed services. No non-audit services were provided in the year under review or in the previous year.
Audit for the year ended 30 September 2020 In relation to the Annual Report for the year ended 30 September 2020, the following significant issues were considered by the Committee:
Significant issue How the issue was addressed
Valuation and ownership of the Company’s investments
There is a risk that assets are incorrectly valued or ownership of assets is not secured. Actively traded investments are valued using stock exchange prices provided by third-party pricing providers and the portfolio valuation is reviewed at each meeting of the Board. Ownership of listed investments is verified by BNP via reconciliation to the custodian’s records.
Recognition of income Income received is accounted for in line with the Company’s accounting policies (as set out on page 60). The Committee considered the treatment of any special dividends received during the course of the year. The Committee reviewed in detail the likely impact of the Covid-19 pandemic on investment income over the coming several years, and the potential effect on the dividend in light of these revenue projections.
Compliance with section 1158 of the Corporation Tax Act 2010
The Committee reviews the Manager’s procedures for ensuring compliance with relevant regulations for ensuring the Company maintains its investment trust status and regularly seeks confirmation of compliance with the relevant regulations.
Maintaining internal controls The Committee carries out the annual assessment of the effectiveness of the Company’s internal control and risk management systems by reviewing the framework and summary of the reporting received from its service providers throughout the course of the financial year, including any impact of Covid-19 on risk and internal controls.
Audit and Risk Committee Report (continued)
Henderson European Focus Trust plc Annual Report 2020
39

Audit and Risk Committee Report (continued)
Internal control and risk management The Board has overall responsibility for the Company’s system of internal control and for reviewing its effectiveness. The Committee supports the Board in the continuous monitoring of the internal control and risk management framework. The Board has established an ongoing process for identifying, evaluating and managing the principal and new or emerging risks faced by the Company. The process accords with the FRC’s guidance on Risk Management, Internal Control and Related Business and Financial Reporting published in September 2014. The system was in operation throughout the period and up to the date of this report and is designed to meet the specific risks faced by the Company, taking account of the nature of the Company’s reliance on its service providers and their internal controls. The system therefore manages rather than eliminates the risk of failure to achieve the Company’s business objectives and provides reasonable, but not absolute assurance against material misstatement or loss.
The key components of the internal control framework include:
● clearly defined investment criteria which specify levels of authority and exposure limits. The Board reviews reports on compliance with the criteria at each meeting;
● regular reporting which allows the Board to assess the Company’s financial position. The management accounts and forecasts are reviewed by the Board at each meeting;
● the contractual agreements with the Manager and other third-party service providers. The Management Engagement Committee reviews performance levels and adherence to relevant provisions of the agreements on a regular basis through reports received and conducts a formal evaluation of the overall level of service provided at least annually;
● the review of controls at the Manager and other third-party service providers. The Board receives quarterly reporting from the Manager and Depositary and reviews annual assurance reports on the effectiveness of the control environments at the Company’s key service providers; and
● review of additional reporting provided by:
– the Manager’s Operational Risk team on the control environment in operation at the Manager and their view of the control environments in place at the third-party service providers used by the Company; and
– the Manager’s Internal Audit team on areas of operation which are relevant to the Company.
The Committee has reviewed the Company’s system of internal controls for the year ended 30 September 2020. During the course of its review it determined and reported to the Board that it has not identified or been advised of any failings or weaknesses relating to the Company’s portfolio that have been determined as significant.
System of Internal Controls
How the system of internal control operatesThe Board delegates contractually to service providers for all the Company’s operational requirements. It maintains oversight of these providers throughout the year by receiving regular reporting on their activities. All are considered key stakeholders.
The Management Engagement Committee formally evaluates the performance and service delivery of each service provider annually.
The Audit and Risk Committee evaluates the performance of the auditor on completion of each audit cycle, and monitors the effectiveness of the control environment of the Manager, Equiniti, HSBC and BNP on an annual basis through review of their annual assurance reports, supplemented by the view of the Manager’s Operational Risk team.
Winterflood (Corporate broker)
Ernst & Young (Independent auditor)
Janus Henderson(Investment management,
company secretarial, sales, marketing, PR and
administration)
Reporting• Investment
performance update (at each meeting)
• Compliance with investment limits and restrictions (monthly)
• Internal controls report (quarterly)
• Effectiveness of control environment (annually)
HSBC(Depositary and
custodian)
Reporting• Depositary report
(quarterly)
• Presentation from the depositary and custodian (annually)
• Effectiveness of control environment (annually)
BNP Paribas (Accounting services
(engaged by the Manager))
Reporting• Balance sheet
• Liquidity and gearing
• Revenue forecasts
• Portfolio valuation
• Portfolio transactions
• Effectiveness of control environment (annually)
Equiniti (Registrar)
Board of Directors(comprises independent, non-executive directors)
Henderson European Focus Trust plc Annual Report 2020
40

Internal audit function Systems are in operation to safeguard the Company’s assets and shareholders’ investments, to maintain proper accounting records and to ensure that financial information used within the business, or published, is reliable.
Being an investment company with no employees, all executive activities are delegated to service providers, principally among them, the investment manager, Janus Henderson. The Board places reliance on the Company’s framework of internal control and the Committee’s view on reporting received from specific second and third line of defence teams at the Manager.
The Manager’s Operational Risk team supports the Committee in considering the independently audited reports on the effectiveness of internal controls in place at the Company’s service providers. The Manager’s Internal Audit department provides regular reporting to the Board on the operations at the Manager and presents at least annually to the Committee. The Board has therefore concluded that it is not necessary at the present time for the Company to have its own internal audit function.
Effectiveness of the external audit The Committee’s process for evaluating the effectiveness of the external audit comprises two components: consideration is given to the findings of the FRC’s Audit Quality Inspection Report and a post-audit assessment is carried out led by the Committee Chair.
In assessing the effectiveness of the audit process, the Committee Chair invites views from the directors, the Fund Managers and other members of the Manager’s staff in assessing the robustness of the audit, level of challenge offered by the audit team, the quality of the audit team and timeliness of delivering the tasks required for the audit and reporting to the Committee. The Committee also met privately with the Audit Partner to discuss how the audit operated from his perspective.
Overall, the Committee considers that the audit quality for the year ended 30 September 2020 has been high and that the Manager and EY have worked together to enhance and improve reporting to shareholders.
Following completion of the assessment, the Committee remained satisfied with the effectiveness of the audit provided by EY and therefore recommended to the Board their continuing appointment. EY has indicated their willingness to continue in office. Accordingly, resolutions reappointing EY as auditor to the Company and authorising the directors to determine their remuneration will be proposed at the 2021 AGM.
Eliza Dungworth Chair of the Audit and Risk Committee 10 December 2020
Audit and Risk Committee Report (continued)
Henderson European Focus Trust plc Annual Report 2020
41

Directors’ Remuneration Report
Remuneration PolicyThe Remuneration Policy (the “Policy”) sets out the principles applied in the remuneration of the Company’s directors. Shareholders last approved the Remuneration Policy at the AGM held on 25 January 2018. In accordance with section 439A of the Act, the Board is requesting shareholders to approve the Policy at the 2021 AGM. No changes to the Policy are proposed, and the Board may amend the level of remuneration paid to individual directors only within the parameters of the Policy. Further details can be found in the Notice of AGM and on the website: www.hendersoneuropeanfocus.com.
In determining the Remuneration Policy, the Board takes into account all factors which it deems necessary including relevant legal and regulatory requirements, the provisions and recommendations of the AIC Code.
The Board’s approach is that fees payable to the directors should:● reflect the time spent by them on the Company’s affairs;● reflect the responsibilities borne by them as directors;● be sufficient to promote the long-term success of the
Company and comparable to the remuneration paid by other investment trusts of a similar size with a similar capital structure and investment objective; and
● not exceed the current aggregate remuneration limit of £250,000 per annum.
Directors are remunerated in the form of fees which are payable quarterly in arrears. No director is eligible to receive bonuses, pension benefits, share options or other benefits and no long-term incentive schemes are in place. The directors may be reimbursed for all reasonable and properly documented expenses incurred in the performance of their duties and may be eligible to receive additional remuneration, in specific circumstances, for services which go beyond the ordinary duties of a non-executive director. The level of remuneration paid to each director is reviewed annually, particularly in terms of whether the Policy supports the Company’s long-term sustainable success, though such review will not necessarily result in a change to the rates. The review incorporates analysis of up-to-date information about remuneration in other companies of comparable scale and complexity, in order to avoid and manage conflicts of interest in determining fee levels.
Shareholders’ viewsAny feedback from shareholders on the fees paid to directors would be taken into account by the Board when reviewing remuneration levels.
Letters of AppointmentAll directors are appointed under a letter of appointment, which is an engagement for services and not a contract for employment. The appointment may be terminated at any time by written notice with no compensation payable. The Company has no executive directors or employees.
Recruitment principlesAll directors, including any new appointments to the Board, are paid at the same rate. The Chair of the Board, Senior Independent Director and the Chair of the Audit and Risk Committee are paid a higher fee in recognition of their additional responsibilities.
Report on implementationThe Directors’ Remuneration Report (the “Report”) is prepared in accordance with Schedule 8 of The Large and Medium-sized Companies and Groups (Accounts and Reports) Regulations 2008 as amended in August 2013 (the “Regulations”). A resolution to approve the Report will be put to shareholders at the 2021 AGM.
Annual StatementAs the Company has no employees and the Board comprises entirely non-executive directors, the Board has not established a separate remuneration committee. Directors’ remuneration is determined by the Board as a whole within the parameters of the Policy approved by shareholders. The Nominations Committee reviews directors’ fees and makes recommendations to the Board for its decision as to the appropriate level of fees.
Directors’ fees for the year under review were £37,000 for the Chair, £29,000 for the Chair of the Audit and Risk Committee and Senior Independent Director. All remaining directors were paid £25,000 per annum.
The Board has agreed the first increases in directors’ fees since 2017 to take effect from 1 October 2020, as detailed on page 44. Prior to that, fees were last increased in 2011. The current changes follow a review of fee levels which utilised external published reviews as well as a desktop review. The Board believes that both the individual remuneration and the aggregate fee levels take account of the needs of a small but very engaged non-executive Board of experienced practitioners in the sector, and the likely need to add to the Board in the near to mid term. There have been no other major decisions on directors’ remuneration or any other changes to the remuneration paid to each individual director in the year under review.
Directors’ interests in shares (audited)Ordinary shares of 50p
30 September 2020
1 October 2019
Vicky Hastings1 5,000 5,000
Robin Archibald 2,231 2,231
Alexander Comba2 N/A 5,000
Rodney Dennis2 N/A 7,515
Alain Dromer2 N/A 4,500
Eliza Dungworth 480 480
1 Chair and highest paid director2 Retired on 31 January 2020
Henderson European Focus Trust plc Annual Report 2020
42

Directors’ Remuneration Report (continued)
Directors’ remuneration (audited)The remuneration paid to the directors who served during the years ended 30 September 2020 and 30 September 2019 were as follows:
Year ended 30 September
2020 Total salary
and fees £
Year ended 30 September
2019 Total salary
and fees £
Change* %
Year ended 30 September
2020 Taxable
benefits† £
Year ended 30 September
2019 Taxable
benefits† £
Year ended 30 September
2020 Total
£
Year ended 30 September
2019 Total
£
Rodney Dennis1 12,401 37,000 (66.5) – – 12,401 37,000
Robin Archibald 25,000 25,000 0.0 1,059 1,140 26,059 26,140
Alexander Comba2 9,720 29,000 (66.5) 1,177 1,845 10,897 30,845
Alain Dromer4 8,379 25,000 (66.5) 6,245 3,067 14,624 28,067
Eliza Dungworth3 29,000 29,000 0.0 – – 29,000 29,000
Vicky Hastings5 25,913 25,000 3.7 – – 25,913 25,000
Robert Jeens6 28,291 – n/a – – 28,291 –
Total 138,704 170,000 8,481 6,052 147,185 176,052
Notes: The table above omits other columns set out in the relevant regulations because no payments of other types such as performance related pay, vesting performance related pay and pension related benefits were made
1 Retired 31 January 2020. Chairman until retirement on 31 January 2020 2 Retired 31 January 2020. Senior Independent Director until retirement on 31 January 2020 3 Chair of the Audit and Risk Committee4 Retired 31 January 20205 Appointed Senior Independent Director with SID fee level taking effect from 21 July 2020. Appointed Chair 25 September 2020 6 Appointed as director on 9 December 2019. Appointed Chairman 31 January 2020. Retired 25 September 2020
* In accordance with The Companies (Directors’ Remuneration Policy and Directors’ Remuneration Report) Regulations 2019, this column shows the annual percentage change over the preceding financial year and the relevant financial year in respect of each director that has served for a minimum of two financial years. The Board will publish this annual percentage change cumulatively each year going forward until there is an annual percentage change over the five financial years preceding the relevant financial year to meet the legislative requirements
† Reimbursement of travel expenses to attend board meetings and board recruitment meetings. The expenses are ‘grossed up’, reimbursed through payroll and in certain circumstances are subject to personal taxation and national insurance
No other remuneration or compensation was paid or payable by the Company during the year to any of the current or former directors or third parties specified by any of them.
The interests of the directors in the shares of the Company at the beginning and end of the financial year are shown in the table on the previous page. There have been no changes to any of the current directors’ holdings in the period up to the date of this report. Robert Jeens’ shareholding is not shown in the table, as he did not hold office as director at the start or end of the financial year. Directors are not required to hold shares of the Company by way of qualification.
PerformanceThe graph compares the share price total return of the Company’s shares over the ten-year period ended 30 September 2020 with the return from the FTSE World Europe ex UK index on the same basis in sterling terms, assuming the investment of £100 on 30 September 2010 and reinvestment of all dividends and income (excluding dealing expenses). During the 10-year period the assets of the Company increased from £103.9 million to £308.2 million, and dividends increased from 17.75 pence per share to 31.30 pence per share.
Share price total return Benchmark
2017 202020192018201620152014201320122011201050
100
150
200
250
300£
Sources: Morningstar Direct and Refinitiv Datastream
Henderson European Focus Trust plc Annual Report 2020
43
Directors’ Remuneration Report (continued)
Changes to feesFrom 1 October 2020 the fees payable to the directors were as follows (previous rates in brackets): Chair £38,000 (£37,000), Audit and Risk Committee Chair £32,000 (£29,000) and director £27,000 (£25,000).
Relative importance of spend on payIn order to show the relative importance of spend on pay, the table below sets out the total level of remuneration compared to the distributions to shareholders by way of dividends. There were no other significant distributions, payments or other uses of the Company’s profit or cash flow deemed to assist in the understanding of the relative importance of spend on pay.
2020 £
2019 £
Change £
Change %
Total remuneration 147,185 176,052 (28,867) (16.4)
Ordinary dividends paid 6,728,956 6,685,959 42,997 0.6
Statement of voting at AGMAn ordinary resolution adopting the Directors’ Remuneration Report was approved at the AGM held on 31 January 2020. The votes cast by proxy in favour of the resolution were 10,276,792 (99.7%), votes against the resolution were 11,470 (0.1%) and 22,349 (0.2%) were placed at the discretion of the chair of the meeting. A total of 9,204 votes were withheld. The percentage of votes in favour, against and discretionary excludes the number of votes withheld.
A binding ordinary resolution adopting the directors’ Remuneration Policy was approved at the AGM held on 25 January 2018. The votes cast by proxy in favour of the resolution were 3,863,778 (98.5%), votes cast against the resolution were 53,889 (1.4%) and 6,235 (0.1%) votes were placed at the discretion of the chair of the meeting to vote. A total of 12,085 votes were withheld. The percentage of votes in favour, against and discretionary excludes the number of votes withheld.
For and on behalf of the Board
Vicky Hastings Chair of the Board 10 December 2020
Henderson European Focus Trust plc Annual Report 2020
44
The directors present their report and the audited financial statements of the Company for the year ended 30 September 2020. The Company is a public limited company registered and domiciled in England & Wales with company number 427958. It was active throughout the year.
The Investment Portfolio on page 14, the Corporate Governance Report and Audit and Risk Committee Report on pages 30 to 41, Statement of Directors’ Responsibilities on page 47 and the additional information on pages 74 onwards form part of the Directors’ Report.
Share capitalAs at 30 September 2020 the Company’s paid up share capital consisted of 21,638,991 ordinary shares of 50p each, of which 256,413 shares were held in treasury. Holders of the Company’s shares are entitled to one vote for every share. Shares in treasury do not carry voting rights.
At the AGM held on 31 January 2020, shareholders authorised the directors to allot up to 2,163,899 new shares. Shareholders further authorised directors to repurchase up to 3,243,685 shares where the Company’s shares were trading at a discount to the net asset value. A total of 115,683 shares have been repurchased in the year to 30 September 2020 and to the date of this report. The authority to allot and repurchase shares will expire at the earlier of 15 months from the date of the passing of the resolution and the next AGM.
There are no restrictions concerning the transfer of securities in the Company, no special rights with regard to control attached to securities, no restrictions on voting, no agreements between holders of securities regarding their transfer known to the Company and no agreement which the Company is party to that affects its control following a takeover bid. Where they exist, the revenue profits of the Company (including accumulated revenue reserves) are available for distribution by way of dividends to the holders of the shares. Upon a winding-up, after meeting the liabilities of the Company, the surplus assets would be distributed to the shareholders pro rata to their holding of shares.
Holdings in the Company’s sharesDeclarations of interests in the voting rights of the Company as at 30 September 2020 in accordance with the Disclosure Guidance and Transparency Rules were as follows:
% of voting rights
1607 Capital Partners LLC 12.9
Investec Wealth & Investment 10.0
City of London Investment Management Company Limited 5.1
Rathbone Investment Management 5.0
No changes have been notified since 30 September 2020 to the date of this report.
Related-party transactionsThe Company’s transactions with related parties in the year were with the directors and the Manager. There were no material transactions between the Company and its directors during the year other than amounts paid to them in respect of expenses and remuneration for which there were no outstanding amounts payable at the year end. Directors’ shareholdings in the Company are disclosed on page 42. In respect of the provision of services by Janus Henderson, other than fees payable by the Company in the ordinary course of business and the facilitation of marketing activities with third parties, there were no material transactions with the Manager affecting the financial position of the Company during the year under review. More details on transactions with the Manager, including amounts outstanding at the year end, are given in note 22 on page 71.
Annual general meeting (“AGM”)The Company’s AGM will be held at 2.30 pm on Thursday, 28 January 2021. In view of the ongoing restrictions on public gatherings, the Board invites shareholders to attend the AGM via a Zoom webinar. Shareholders are strongly encouraged to submit their proxy forms ahead of the proxy-voting deadline at 2.30 pm on 26 January 2020 to ensure their vote counts, as there can be no live voting due to technological restrictions. The statutory business of the AGM will be conducted on a poll, counting the directors in the quorum, and the Chair will hold shareholders’ proxy votes. Your Fund Managers will present their review of the year and thoughts on the future during the webinar, and will be pleased to answer your questions, as will your Board.
The Board commits to holding physical meetings in future when restrictions are not in place and these can be held safely. However, in case of any further extraordinary crises such as Covid-19 lockdowns, the Company is putting a proposed amendment to the Company’s Articles of Association to shareholders to enable a combination of virtual and physical meetings to be held in future, thereby protecting shareholders’ rights where they may otherwise not be able to be exercised.
Instructions on joining the meeting and details of resolutions to be put to the AGM are included in the Notice of Meeting sent to shareholders with this Annual Report and are on the Company’s website at www.hendersoneuropeanfocus.com. If shareholders would like to submit any questions in advance of the AGM, they are welcome to send these to the corporate secretary at [email protected].
Directors’ Report
Henderson European Focus Trust plc Annual Report 2020
45
Directors’ Report (continued)
Disclosure of information to auditor and Listing Rule 9.8.4Each director in office at the date of approval of this report confirms that to the best of his or her knowledge and belief, there is no information relevant to the preparation of the Annual Report of which the Company’s auditor is unaware and that he or she has taken all the steps a director might reasonably be expected to have taken to be aware of relevant audit information and to establish that the Company’s auditor is aware of that information.
Listing Rule 9.8.4 requires the Company to include certain information in a single identifiable section of the Annual Report or a cross-reference table indicating where the information is set out. There are no further disclosures to be made in this regard.
Greenhouse gas emissionsThe Company’s environmental statements are set out in the Strategic Report on page 24.
Reappointment of auditorErnst & Young LLP has indicated their willingness to continue in office as auditor to the Company, and a resolution proposing their reappointment and authorising the directors to determine their remuneration for the ensuing year will be put to shareholders at the AGM. Further information about their reappointment can be found in the Audit and Risk Committee Report on pages 38 to 41.
Other informationThe Directors’ Report has been approved by the Board. Information on recommended dividends, future developments and financial risks is detailed in the Strategic Report.
By order of the Board
Henderson Secretarial Services Limited Corporate Secretary 10 December 2020
Henderson European Focus Trust plc Annual Report 2020
46
The directors are responsible for preparing the Annual Report and the financial statements in accordance with applicable law and regulations.
Company law requires the directors to prepare financial statements for each financial year. The directors have prepared the financial statements in accordance with United Kingdom Generally Accepted Accounting Practice (United Kingdom Accounting Standards comprising FRS 102, the financial reporting standard applicable in the United Kingdom and Republic of Ireland, and applicable law). Under company law the directors must not approve the financial statements unless they are satisfied that they give a true and fair view of the state of affairs of the Company and of the profit or loss of the Company for that year.
In preparing these financial statements, the directors are required to:
● select suitable accounting policies and then apply them consistently;
● make judgements and accounting estimates that are reasonable and prudent;
● state whether applicable UK accounting standards have been followed, subject to any material departures disclosed and explained in the financial statements; and
● prepare the financial statements on the going concern basis unless it is inappropriate to presume that the Company will continue in business.
The directors are responsible for keeping adequate accounting records that are sufficient to show and explain the Company’s transactions and disclose with reasonable accuracy at any time the financial position of the Company and enable them to ensure that the financial statements comply with the Companies Act 2006. They are also responsible for safeguarding the assets of the Company and hence for taking reasonable steps for the prevention and detection of fraud and other irregularities.
The directors consider that the Annual Report, taken as a whole, is fair, balanced and understandable and provides the information necessary for shareholders to assess the Company’s position and performance, business model and strategy.
Statement under DTR 4.1.12Each director, as listed on page 30, confirms that, to the best of his or her knowledge:
● the financial statements, which have been prepared in accordance with United Kingdom Generally Accepted Accounting Practice (United Kingdom Accounting Standards comprising FRS 102 and applicable law) give a true and fair view of the assets, liabilities, financial position and profit and loss of the Company; and
● the Strategic Report includes a fair review of the development and performance of the business and the position of the Company, together with a description of the principal risks and uncertainties that it faces.
For and on behalf of the Board
Vicky Hastings Chair of the Board 10 December 2020
Statement of Directors’ Responsibilities
Henderson European Focus Trust plc Annual Report 2020
47

Financial Statements
ENEL, Chile
48

OpinionWe have audited the financial statements of Henderson European Focus Trust PLC (the “Company”) for the year-ended 30 September 2020, which comprise the Income Statement, the Statement of Financial Position, the Statement of Changes in Equity, the Cash Flow Statement, and the related notes 1 to 23, including a summary of significant accounting policies. The financial reporting framework that has been applied in their preparation is applicable law and United Kingdom Accounting Standards including FRS 102 “The Financial Reporting Standard applicable in the UK and Republic of Ireland” (United Kingdom Generally Accepted Accounting Practice).
In our opinion, the financial statements:
● give a true and fair view of the Company’s affairs as at 30 September 2020 and of its profit for the year-then ended;● have been properly prepared in accordance with United Kingdom Generally Accepted Accounting Practice; and ● have been prepared in accordance with the requirements of the Companies Act 2006.
Basis for opinion We conducted our audit in accordance with International Standards on Auditing (UK) (“ISAs (UK)”) and applicable law. Our responsibilities under those standards are further described in the Auditor’s responsibilities for the audit of the financial statements section of our report below. We are independent of the Company in accordance with the ethical requirements that are relevant to our audit of the financial statements in the UK, including the FRC’s Ethical Standard as applied to public interest entities, and we have fulfilled our other ethical responsibilities in accordance with these requirements.
We believe that the audit evidence we have obtained is sufficient and appropriate to provide a basis for our opinion.
Conclusions relating to principal risks, going concern and viability statementWe have nothing to report in respect of the following information in the annual report, in relation to which the ISAs (UK) require us to report to you whether we have anything material to add or draw attention to:
● the disclosures in the annual report set out on pages 25 to 27 that describe the principal risks and explain how they are being managed or mitigated;
● the directors’ confirmation set out on page 47 in the annual report that they have carried out a robust assessment of the emerging and principal risks facing the entity, including those that would threaten its business model, future performance, solvency or liquidity;
● the directors’ statement set out on page 59 in the financial statements about whether they considered it appropriate to adopt the going concern basis of accounting in preparing them, and their identification of any material uncertainties to the entity’s ability to continue to do so over a period of at least twelve months from the date of approval of the financial statements;
● whether the directors’ statement in relation to going concern required under the Listing Rules in accordance with Listing Rule 9.8.6R(3) is materially inconsistent with our knowledge obtained in the audit; or
● the directors’ explanation set out on page 27 in the annual report as to how they have assessed the prospects of the entity, over what period they have done so and why they consider that period to be appropriate, and their statement as to whether they have a reasonable expectation that the entity will be able to continue in operation and meet its liabilities as they fall due over the period of their assessment, including any related disclosures drawing attention to any necessary qualifications or assumptions.
Overview of our audit approachKey audit matters 1. Risk of incomplete or inaccurate revenue recognition, including
classification of special dividends as revenue or capital items in the Income Statement.
2. Risk of incorrect valuation or ownership of the investment portfolio held at fair value through profit and loss.
3. Impact of Covid-19.
Materiality ● Overall materiality of £3.08m which represents 1% of Net Assets as at 30 September 2020.
Independent Auditor’s Report to the Members of Henderson European Focus Trust plc
49
Henderson European Focus Trust plc Annual Report 2020

Key audit matters Key audit matters are those matters that, in our professional judgment, were of most significance in our audit of the financial statements of the current period and include the most significant assessed risks of material misstatement (whether or not due to fraud) that we identified. These matters included those which had the greatest effect on: the overall audit strategy; the allocation of resources in the audit; and directing the efforts of the engagement team. These matters were addressed in the context of our audit of the financial statements as a whole, and in our opinion thereon, and we do not provide a separate opinion on these matters.
Risk Our response to the riskKey observations communicated to the Audit and Risk Committee
Risk of incomplete or inaccurate revenue recognition, including classification of special dividends as revenue or capital items in the Income Statement
Refer to the Audit and Risk Committee Report (pages 38-41); Accounting policy 1e) (page 60); and Note 3 of the Financial Statements (page 61).
Investment income is received primarily in the form of dividends from European quoted equities. Overseas dividends are recorded gross of withholding tax.
The investment income receivable by the Company during the year directly affects the Company’s ability to pay a dividend to shareholders. There is a risk of incomplete or inaccurate recognition of revenue through the failure to recognise proper income entitlements or apply the appropriate accounting treatment. There is a risk that income accrued at the year-end is subsequently cancelled and is therefore not receivable.
Special dividends represent dividends paid by investee companies that are additional to the normal or expected dividend cycle for that company. In accordance with the Statement of Recommended Practice “Financial Statements of Investment Trust Companies and Venture Capital Trusts” (‘SORP’), special dividends can be included within either the revenue or capital column of the Income Statement, depending on the commercial circumstances behind the payments.
The classification of special dividend income to either the revenue or capital column of the Income Statement is determined based on the judgment of Janus Henderson Global Investors (“the Manager”) which is subsequently validated by the Directors. We recognise the potential incentivisation to classify a special dividend incorrectly, particularly as revenue, in order to meet shareholder expectations that the Company will maintain or increase dividend payments. As such we consider this to be a fraud risk.
In the current year there were no special dividends declared by portfolio companies.
We have performed the following procedures:
● Obtained an understanding of the Manager’s and BNP Paribas’s (“the Administrator”) processes and controls for recording investment income, including the review of special dividend classifications by the Board.
● Reviewed a sample of dividends received from the Company’s income report and agreed key details (dividend rate, ex-date, payment date and withholding tax rate) to an independent source, agreed holdings at ex-date to the transactions report and agreed proceeds net of withholding taxes to bank statements.
● Agreed a sample of dividends paid on investments held during the year from an independent pricing source to the income report.
● For all accrued dividends, agreed key details (dividend rate, ex-date, payment date) to an independent source, agreed the holding at ex-date to the transactions report and where possible, agreed proceeds net of withholding taxes to post year-end bank statements.
● We reviewed the income report for items above our testing threshold and confirmed whether these items were special, or otherwise, as a test of completeness.
● Tested the completeness of special dividends by comparing, for a sample of investments, the special dividends declared by that portfolio company during the year to the list of special dividends reported by the Company.
● We reviewed the transaction listing for special dividends through filtering for items that were corporate actions and tested items above the testing threshold.
The results of our procedures are:
We had no matters to report to the Audit and Risk Committee.
Independent Auditor’s Report to the Members of Henderson European Focus Trust plc (continued)
50
Henderson European Focus Trust plc Annual Report 2020

Independent Auditor’s Report to the Members of Henderson European Focus Trust plc (continued)
Risk Our response to the riskKey observations communicated to the Audit and Risk Committee
Risk of incorrect valuation or ownership of the investment portfolio held at fair value through profit and loss
Refer to the Audit and Risk Committee Report (pages 38-41); Accounting policies 1c) (page 59); and Note 11 of the Financial Statements (page 64).
The Company holds a portfolio of quoted investments throughout Europe.
The valuation of the assets held in the investment portfolio is the key driver of the Company’s net asset value and total return. Incorrect asset pricing or a failure to maintain proper legal title of the assets held by the Company could have a significant impact on the portfolio valuation and the return generated for shareholders.
We have performed the following procedures:
● Obtained an understanding of the Administrator’s processes surrounding the investment portfolio by reviewing their internal control reports and by performing our walkthrough procedures.
● Agreed the prices of 100% of the quoted investment portfolio to an independent pricing vendor, which is different to the vendor used by the Company.
● Reviewed the stale price report to assess the liquidity of the investments held. There were no such items listed on the Administrators report.
● Recalculated 100% of the value of quoted investments in foreign currencies to verify the accuracy of the corresponding Sterling balances based upon exchange rates from an external source.
● Agreed the Company’s holdings as at 30 September 2020 to independently obtained Custodian and Depositary reports from HSBC.
The results of our procedures are:
We had no matters to report to the Audit and Risk Committee.
Impact of Covid-19
Refer to the accounting policy 1b) (page 59).
The Covid-19 pandemic has adversely impacted global commercial activity and contributed to significant volatility in global equity and debt markets. As of the date of our audit report, the longer-term impact remains uncertain. This uncertainty had an impact on our risk assessment and, as a result, on our audit of the financial statements.
The Covid-19 pandemic had the most significant impact on our audit of the financial statements in the following areas:
Going concern
There is increased uncertainty in certain of the assumptions underlying management’s assessment of future prospects, which includes the ability of the Company to remain within its borrowing limits and fund ongoing costs.
Financial statement disclosures
There is a risk that the impact of Covid-19 is not adequately disclosed in the financial statements.
We performed the following procedures:
Going Concern
We inspected the Board’s assessment of going concern, which includes consideration of the impact of Covid-19 on revenue and cash forecasting. We have agreed the inputs and assumptions used in the assessment to our audit working papers and historically observed results of the Company.
We inspected the Board’s assessment of the risk of breaching borrowing limits as a result of a reduction in the value of the Company’s portfolio and reviewed the Company’s ability to repay the overdraft if required.
Financial statements disclosures
We reviewed the adequacy of the going concern disclosures by evaluating whether they were consistent with the Board’s assessment. We reviewed the disclosures for compliance with the reporting requirements.
The results of our procedures are:
As a result of our procedures, we have determined that the Director’s conclusion that there is no material uncertainty relating to going concern is appropriate. We have reviewed the disclosures relating to going concern and determined that they are appropriate.
51
Henderson European Focus Trust plc Annual Report 2020

Independent Auditor’s Report to the Members of Henderson European Focus Trust plc (continued)
We have included a risk in relation to the impact of Covid-19 which was not included in our prior year audit report. This has been included to set out our approach in addressing this new and developing risk.
An overview of the scope of our audit
Tailoring the scopeOur assessment of audit risk, our evaluation of materiality and our allocation of performance materiality determine our audit scope for the Company. This enables us to form an opinion on the financial statements. We take into account size, risk profile, the organisation of the Company and effectiveness of controls, including changes in the business environment, when assessing the level of work to be performed. All audit work was performed directly by the audit engagement team.
Our application of materiality We apply the concept of materiality in planning and performing the audit, in evaluating the effect of identified misstatements on the audit and in forming our audit opinion.
MaterialityThe magnitude of an omission or misstatement that, individually or in the aggregate, could reasonably be expected to influence the economic decisions of the users of the financial statements. Materiality provides a basis for determining the nature and extent of our audit procedures.
We determined materiality for the Company to be £3.09 million (2019: £2.99 million), which is 1% (2019: 1%) of Net Assets. We believe that shareholders’ funds provides us with materiality aligned to the key measurement of the Company’s performance.
During the course of our audit, we reassessed initial materiality and found no reason to alter the basis of calculation at year-end.
Performance materialityThe application of materiality at the individual account or balance level. It is set at an amount to reduce to an appropriately low level the probability that the aggregate of uncorrected and undetected misstatements exceeds materiality.
On the basis of our risk assessments, together with our assessment of the Company’s overall control environment, our judgment was that performance materiality was 75% (2019: 75%) of our planning materiality, namely £3.08 million (2019: £2.99 million). We have set performance materiality at this percentage due to our past experience of the audit that indicates a lower risk of misstatements, both corrected and uncorrected.
Given the importance of the distinction between revenue and capital for the Company we also applied a separate testing threshold for the revenue column of the Income Statement of £0.29 million (2019: 0.32million), being 5% of the revenue net return before taxation.
Reporting thresholdAn amount below which identified misstatements are considered as being clearly trivial.
We agreed with the Audit and Risk Committee that we would report to them any uncorrected audit differences in excess of £0.15 million (2019: £0.15 million), which is set at 5% of planning materiality, as well as differences below that threshold that, in our view, warranted reporting on qualitative grounds.
We evaluate any uncorrected misstatements against both the quantitative measures of materiality discussed above and in light of other relevant qualitative considerations in forming our opinion.
Other information The other information comprises the information in the annual report, other than the financial statements and our auditor’s report thereon. The directors are responsible for the other information.
Our opinion on the financial statements does not cover the other information and, except to the extent otherwise explicitly stated in this report, we do not express any form of assurance conclusion thereon.
In connection with our audit of the financial statements, our responsibility is to read the other information and, in doing so, consider whether the other information is materially inconsistent with the financial statements or our knowledge obtained in the audit or otherwise appears to be materially misstated. If we identify such material inconsistencies or apparent material misstatements, we are required to determine whether there is a material misstatement in the financial statements or a material misstatement of the other information. If, based on the work we have performed, we conclude that there is a material misstatement of the other information, we are required to report that fact.
We have nothing to report in this regard.
52
Henderson European Focus Trust plc Annual Report 2020

Independent Auditor’s Report to the Members of Henderson European Focus Trust plc (continued)
In this context, we also have nothing to report in regard to our responsibility to specifically address the following items in the other information and to report as uncorrected material misstatements of the other information where we conclude that those items meet the following conditions:
● Fair, balanced and understandable set out on page 47 – the statement given by the directors that they consider the annual report and financial statements taken as a whole is fair, balanced and understandable and provides the information necessary for shareholders to assess the Company’s performance, business model and strategy, is materially inconsistent with our knowledge obtained in the audit; or
● Audit and Risk Committee reporting set out on pages 38-41 – the section describing the work of the Audit and Risk Committee does not appropriately address matters communicated by us to the Audit and Risk Committee; or
● Directors’ statement of compliance with the UK Corporate Governance Code set out on page 31 – the parts of the directors’ statement required under the Listing Rules relating to the company’s compliance with the UK Corporate Governance Code containing provisions specified for review by the auditor in accordance with Listing Rule 9.8.10R(2) do not properly disclose a departure from a relevant provision of the UK Corporate Governance Code.
Opinions on other matters prescribed by the Companies Act 2006In our opinion the part of the Directors’ Remuneration Report to be audited has been properly prepared in accordance with the Companies Act 2006.
In our opinion, based on the work undertaken in the course of the audit:
● the information given in the Strategic Report and the Directors’ Report for the financial year for which the financial statements are prepared is consistent with the financial statements; and
● the Strategic Report and Directors’ Report have been prepared in accordance with applicable legal requirements.
Matters on which we are required to report by exceptionIn the light of the knowledge and understanding of the Company and its environment obtained in the course of the audit, we have not identified material misstatements in the strategic report or directors’ report.
We have nothing to report in respect of the following matters in relation to which the Companies Act 2006 requires us to report to you if, in our opinion:
● adequate accounting records have not been kept, or returns adequate for our audit have not been received from branches not visited by us; or
● the financial statements and the part of the Directors’ Remuneration Report to be audited are not in agreement with the accounting records and returns; or
● certain disclosures of directors’ remuneration specified by law are not made; or● we have not received all the information and explanations we require for our audit.
Responsibilities of directorsAs explained more fully in the directors’ responsibilities statement set out on page 47, the directors are responsible for the preparation of the financial statements and for being satisfied that they give a true and fair view, and for such internal control as the directors determine is necessary to enable the preparation of financial statements that are free from material misstatement, whether due to fraud or error.
In preparing the financial statements, the directors are responsible for assessing the company’s ability to continue as a going concern, disclosing, as applicable, matters related to going concern and using the going concern basis of accounting unless the directors either intend to liquidate the company or to cease operations, or have no realistic alternative but to do so.
Auditor’s responsibilities for the audit of the financial statements Our objectives are to obtain reasonable assurance about whether the financial statements as a whole are free from material misstatement, whether due to fraud or error, and to issue an auditor’s report that includes our opinion. Reasonable assurance is a high level of assurance, but is not a guarantee that an audit conducted in accordance with ISAs (UK) will always detect a material misstatement when it exists. Misstatements can arise from fraud or error and are considered material if, individually or in the aggregate, they could reasonably be expected to influence the economic decisions of users taken on the basis of these financial statements.
53
Henderson European Focus Trust plc Annual Report 2020

Explanation as to what extent the audit was considered capable of detecting irregularities, including fraud The objectives of our audit, in respect to fraud, are; to identify and assess the risks of material misstatement of the financial statements due to fraud; to obtain sufficient appropriate audit evidence regarding the assessed risks of material misstatement due to fraud, through designing and implementing appropriate responses; and to respond appropriately to fraud or suspected fraud identified during the audit. However, the primary responsibility for the prevention and detection of fraud rests with both those charged with governance of the entity and management.
Our approach was as follows:
● We obtained an understanding of the legal and regulatory frameworks that are applicable to the Company and determined that the most significant are the Companies Act 2006, the Listing Rules, the UK Corporate Governance Code and section 1158 of the Corporation Tax Act 2010.
● We understood how the Company is complying with those frameworks through discussions with the Audit and Risk Committee and Company Secretary and review of the Company’s documented policies and procedures.
● We assessed the susceptibility of the Company’s financial statements to material misstatement, including how fraud might occur by considering the key risks impacting the financial statements. We identified a fraud risk with respect to management override in relation to inappropriate journals pertaining to the allocation of special dividends. Further discussion of our approach is set out in the section on the key audit matters above.
● Based on this understanding we designed our audit procedures to identify non-compliance with such laws and regulations. Our procedures involved review of the reporting to the Directors with respect to the application of the documented policies and procedures and review of the financial statements to ensure compliance with the reporting requirements of the Company.
● We have reviewed that the Company’s control environment is adequate for the size and operating model of such a listed investment company.
A further description of our responsibilities for the audit of the financial statements is located on the Financial Reporting Council’s website at https://www.frc.org.uk/auditorsresponsibilities. This description forms part of our auditor’s report.
Other matters we are required to address We were appointed by the Company on 25 July 2014 to audit the financial statements for the year ended 30 September 2014 and subsequent financial periods.
The period of total uninterrupted engagement including previous renewals and reappointments is 7 years, covering the years ending 30 September 2014 to 30 September 2020.
The non-audit services prohibited by the FRC’s Ethical Standard were not provided to the company and we remain independent of the company in conducting the audit.
The audit opinion is consistent with the additional report to the Audit and Risk Committee.
Use of our reportThis report is made solely to the company’s members, as a body, in accordance with Chapter 3 of Part 16 of the Companies Act 2006. Our audit work has been undertaken so that we might state to the company’s members those matters we are required to state to them in an auditor’s report and for no other purpose. To the fullest extent permitted by law, we do not accept or assume responsibility to anyone other than the company and the company’s members as a body, for our audit work, for this report, or for the opinions we have formed.
Mike Gaylor (Senior statutory auditor) For and on behalf of Ernst & Young LLP (Statutory auditor) London 10 December 2020
Independent Auditor’s Report to the Members of Henderson European Focus Trust plc (continued)
Notes:1. The maintenance and integrity of www.hendersoneuropeanfocus.com, the Henderson European Focus Trust plc page of the Janus Henderson website, is the
responsibility of Janus Henderson; the work carried out by the auditor does not involve consideration of these matters and, accordingly, the auditor accepts no responsibility for any changes that may have occurred to the financial statements since they were initially presented on the website
2. Legislation in the United Kingdom governing the preparation and dissemination of financial statements may differ from legislation in other jurisdictions
54
Henderson European Focus Trust plc Annual Report 2020
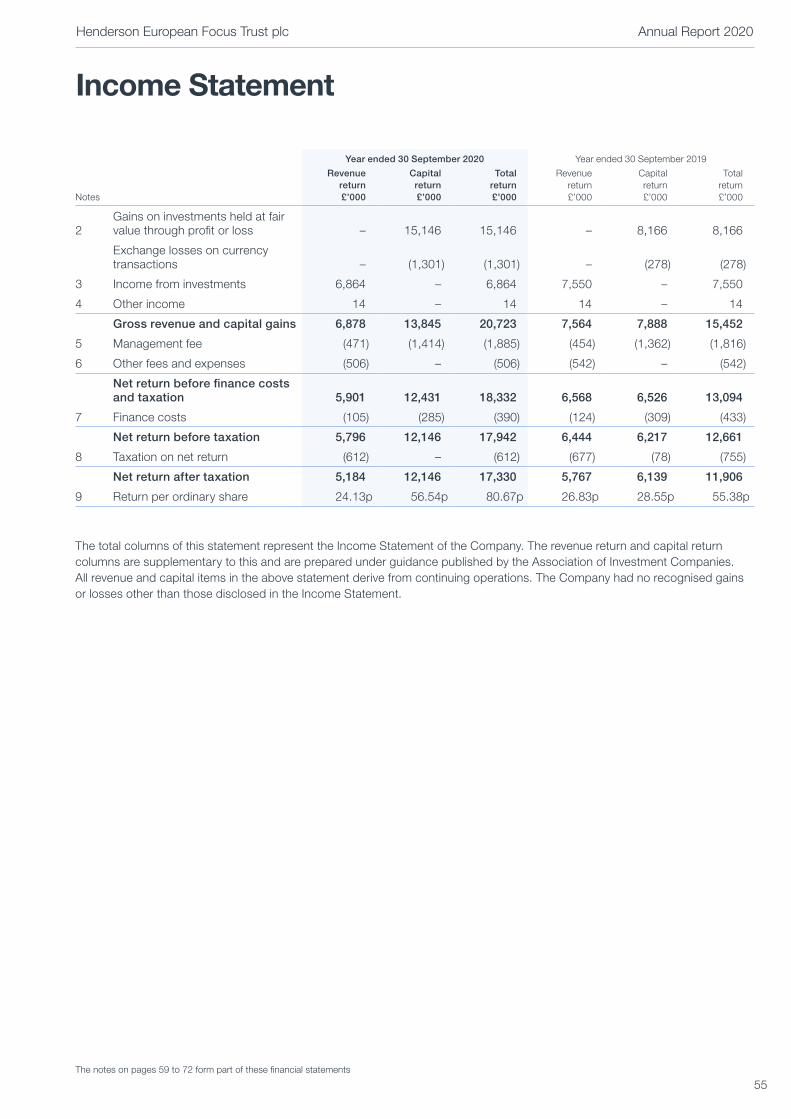
Income Statement
Year ended 30 September 2020 Year ended 30 September 2019
Notes
Revenue return £’000
Capital return £’000
Total return £’000
Revenue return £’000
Capital return £’000
Total return £’000
2 Gains on investments held at fair value through profit or loss – 15,146 15,146 – 8,166 8,166
Exchange losses on currency transactions – (1,301) (1,301) – (278) (278)
3 Income from investments 6,864 – 6,864 7,550 – 7,550
4 Other income 14 – 14 14 – 14
Gross revenue and capital gains 6,878 13,845 20,723 7,564 7,888 15,452
5 Management fee (471) (1,414) (1,885) (454) (1,362) (1,816)
6 Other fees and expenses (506) – (506) (542) – (542)
Net return before finance costs and taxation 5,901 12,431 18,332 6,568 6,526 13,094
7 Finance costs (105) (285) (390) (124) (309) (433)
Net return before taxation 5,796 12,146 17,942 6,444 6,217 12,661
8 Taxation on net return (612) – (612) (677) (78) (755)
Net return after taxation 5,184 12,146 17,330 5,767 6,139 11,906
9 Return per ordinary share 24.13p 56.54p 80.67p 26.83p 28.55p 55.38p
The total columns of this statement represent the Income Statement of the Company. The revenue return and capital return columns are supplementary to this and are prepared under guidance published by the Association of Investment Companies. All revenue and capital items in the above statement derive from continuing operations. The Company had no recognised gains or losses other than those disclosed in the Income Statement.
The notes on pages 59 to 72 form part of these financial statements
55
Henderson European Focus Trust plc Annual Report 2020

Statement of Changes in Equity
Notes Year ended 30 September 2020
Called up share
capital £’000
Share premium account
£’000
Capital reserve
£’000
Revenue reserve
£’000
Other reserves
£’000Total
£’000
At 30 September 2019 10,819 41,995 138,013 11,572 96,611 299,010
Net return after taxation – – 12,146 5,184 – 17,330
Buyback of ordinary shares for treasury – – (1,445) – – (1,445)
10 Ordinary dividends paid – – – (6,729) – (6,729)
At 30 September 2020 10,819 41,995 148,714 10,027 96,611 308,166
Notes Year ended 30 September 2019
Called up share
capital £’000
Share premium account
£’000
Capital reserve
£’000
Revenue reserve
£’000
Other reserves
£’000Total
£’000
At 30 September 2018 10,819 41,995 131,874 12,491 96,611 293,790
Net return after taxation – – 6,139 5,767 – 11,906
10 Ordinary dividends paid – – – (6,686) – (6,686)
At 30 September 2019 10,819 41,995 138,013 11,572 96,611 299,010
The notes on pages 59 to 72 form part of these financial statements
56
Henderson European Focus Trust plc Annual Report 2020

Statement of Financial Position
Notes
At 30 September 2020
£’000
At 30 September 2019
£’000
Fixed assets
11 Investments held at fair value through profit or loss 309,882 312,880
Current assets
12 Debtors 5,898 1,644
Cash at bank 34,345 11,807
40,243 13,451
13 Creditors: amounts falling due within one year (41,959) (27,321)
Net current liabilities (1,716) (13,870)
Net assets 308,166 299,010
Capital and reserves
15 Called up share capital 10,819 10,819
16 Share premium account 41,995 41,995
17 Capital reserve 148,714 138,013
18 Revenue reserve 10,027 11,572
19 Other reserves 96,611 96,611
Shareholders' funds 308,166 299,010
20 Net asset value per ordinary share 1,441.20p 1,390.86p
These financial statements were approved and authorised for issue by the Board of Directors on 10 December 2020 and were signed on its behalf by:
Eliza Dungworth Director
The notes on pages 59 to 72 form part of these financial statements
57
Henderson European Focus Trust plc Annual Report 2020

Cash Flow Statement
Year ended 30 September
2020 £’000
Year ended 30 September
2019 £’000
Cash flows from operating activities
Net return before taxation 17,942 12,661
Add back: finance costs 390 433
Gains on investments held at fair value through profit or loss (15,146) (8,166)
Losses on foreign exchange 1,301 278
Taxation paid (802) (1,228)
Increase in debtors (10) (6)
Increase in creditors 338 588
Net cash inflow from operating activities1 4,013 4,560
Cash flows from investing activities
Sales of investments held at fair value through profit or loss 261,275 217,431
Purchases of investments held at fair value through profit or loss (245,374) (212,242)
Net cash inflow from investing activities 15,901 5,189
Cash flows from financing activities
Buyback of shares for treasury (1,445) –
Equity dividends paid (6,729) (6,686)
Drawdown/(repayment) of bank overdraft 12,448 (24,767)
Interest paid (349) (453)
Net cash inflow/(outflow) from financing activities 3,925 (31,906)
Net increase/(decrease) in cash and equivalents 23,839 (22,157)
Cash and cash equivalents at beginning of period 11,807 34,242
Losses on foreign exchange (1,301) (278)
Cash and cash equivalents at end of period 34,345 11,807
Comprising:
Cash at bank 34,345 11,807
1 Cash inflow from dividends was £6,290,000 (2019: £6,869,000) and cash inflow from interest was £14,000 (2019: £12,000)
The notes on pages 59 to 72 form part of these financial statements
58
Henderson European Focus Trust plc Annual Report 2020

Notes to the Financial Statements
1 Accounting policies(a) Basis of preparation
The Company is a registered investment company as defined in s833 Companies Act 2006 and is incorporated in the United Kingdom. It operates in the United Kingdom and is registered at the address on page 78.
The financial statements have been prepared in accordance with the Companies Act 2006, FRS 102 – The Financial Reporting Standard applicable in the UK and Republic of Ireland, which is effective for periods commencing on or after 1 January 2018, and with the Statement of Recommended Practice: Financial Statements of Investment Trust Companies and Venture Capital Trusts (the “SORP”) issued in October 2019.
The principal accounting policies applied in the presentation of these financial statements are set out below. These policies have been consistently applied to all the years presented.
The accounts have been prepared under the historical cost basis except for the measurement of investments at fair value. In applying FRS 102, financial instruments have been accounted for in accordance with section 11 and 12 of the Standard. All the Company’s operations are of a continuing nature.
The preparation of the Company’s financial statements requires the directors to make judgements, estimates and assumptions that affect the reported amounts in the primary financial statements and the accompanying disclosures. These assumptions and estimates could result in outcomes that require a material adjustment to the carrying amount of assets or liabilities affected in the current and future periods, depending on circumstance.
The directors do not believe that any accounting judgements or estimates have been applied to this set of financial statements that have a significant risk of causing a material adjustment to the carrying amount of assets and liabilities within the next financial year.
(b) Going concernThe assets of the Company consist of securities that are readily realisable and, accordingly, the directors believe that the Company has adequate resources to continue in operational existence for at least 12 months from the date of approval of the financial statements. The directors have also considered the impact of Covid-19, including cash flow forecasting and an assessment of the liquidity of the portfolio. They have concluded that the Company is able to meet its financial obligations, including the repayments of the bank overdraft, as they fall due for at least 12 months from the date of approval of the financial statements. Having assessed these factors, the principal risks and other matters discussed in connection with the viability statement, the directors have determined that it is appropriate for the financial statements to be prepared on a going concern basis.
(c) Investments held at fair value through profit or lossInvestment purchases are accounted for and initially recognised at the trade date of the acquisition. All investments are designated upon initial recognition as held at fair value through profit or loss. Sales of investments are accounted for at the trade date of the disposal. Proceeds are measured at fair value, which are regarded as the proceeds of sale less any transaction costs. The fair value of the investments is based on their quoted bid price at the Statement of Financial Position date, without deduction of the estimated future selling costs.
Changes in investments held at fair value through profit or loss and gains and losses on disposal are recognised in the Income Statement as gains or losses from investments held at fair value through profit or loss. Also included in this caption are transaction costs incurred on the purchase and disposal of assets. All purchases and sales are accounted for on a trade date basis.
(d) Foreign currencyThe results and financial position of the Company are expressed in pounds sterling, which is the functional and presentational currency of the Company. Sterling is the functional currency of the primary economic environment in which the Company operates.
Transactions recorded in overseas currencies during the year are translated into sterling at the appropriate daily exchange rates. Monetary assets and liabilities and equity investments held at fair value through profit or loss, which are denominated in foreign currencies at the Statement of Financial Position date, are translated into sterling at the exchange rates ruling at that date.
Any gains or losses on translation of foreign currency balances, whether realised or unrealised, are taken to the capital or to the revenue return of the Income Statement depending on whether the gain or loss is of a capital or revenue nature.
59
Henderson European Focus Trust plc Annual Report 2020
Notes to the Financial Statements (continued)
1 Accounting policies (continued)(e) Income
Dividends receivable from equity shares are taken to the revenue return on an ex-dividend basis except where, in the opinion of directors, the dividend is capital in nature in which case it is taken to the capital return. The ordinary element of scrip dividends received in lieu of cash dividends is recognised as revenue. Any enhancement above the cash dividend is treated as capital.
Bank interest is accounted for on an accruals basis.
(f) Management and administrative expenses and finance costsAll expenses and finance costs are accounted for on an accruals basis. The annual management fee and borrowing interest charges are allocated 75% to capital and 25% to revenue in line with the Board’s expected long-term split of returns in the form of capital and income profits respectively. All other administrative expenses are charged to the revenue return of the Income Statement.
(g) TaxationThe tax expense represents the sum of the tax currently payable and deferred tax.
The tax currently payable is based on the taxable profit for the year. Taxable profit differs from net profit as reported in the Income Statement because it excludes items of income or expense that are taxable or deductible in other years and it further excludes items that are never taxable or deductible. The Company’s liability for current tax is calculated using the applicable rate of corporation tax for the accounting period.
In line with the recommendations of the SORP, the allocation method used to calculate tax relief on expenses presented against capital returns in the supplementary information in the Income Statement is the “marginal basis”. Under this basis, if taxable income is capable of being offset entirely by expenses presented in the revenue return column of the Income Statement, then no tax relief is transferred to the capital return column.
Deferred taxation is provided on all timing differences that have originated but not reversed by the Statement of Financial Position date. This is subject to deferred tax assets only being recognised if it is considered more likely than not that there will be suitable profits from which the future reversal of timing differences can be deducted. Any liability to deferred tax is provided at the tax rates expected to apply based on laws that have been enacted or substantially enacted at the Statement of Financial Position date. Deferred tax assets and liabilities are not discounted to reflect the time value of money.
(h) BorrowingsInterest bearing bank loans and overdrafts are recorded initially at fair value, being the proceeds received, less direct issue costs. They are subsequently remeasured at amortised cost. Finance costs, including interest payable, premiums on settlement or redemption and direct issue costs, are accounted for on an accruals basis in the Income Statement using the effective interest rate method.
(i) Dividends payable to shareholdersDividends payable to shareholders are recognised in the financial statements when they are paid, or in the case of final dividends, when they are approved by shareholders. Dividends are dealt with in the Statement of Changes in Equity.
(j) Issue and repurchase of ordinary shares and associated costsThe proceeds from issuing shares less issue costs are taken to equity and the costs of repurchasing shares, including related stamp duty and transaction costs, are taken directly to equity and reported through the Statement of Changes in Equity, with the cost of repurchase being charged to a capital distributable reserve. Share issues and repurchase transactions are accounted for on a trade date basis. The nominal value of share capital repurchased and cancelled is transferred out of called-up share capital and into the capital redemption reserve, in accordance with s733 of the Companies Act 2006. Where shares are repurchased and held in treasury, the transfer to the capital redemption reserve is made if and when such shares are subsequently cancelled.
(k) Capital and reservesCalled up share capital represents the nominal value of ordinary shares issued.
The share premium account represents the excess received (subsequent to 11 July 2007) where treasury shares are sold for more than the Company paid to purchase the shares placed in treasury and the excess over the nominal value for new shares issued, less the costs of issue.
60
Henderson European Focus Trust plc Annual Report 2020
Notes to the Financial Statements (continued)
1 Accounting policies (continued)(k) Capital and reserves (continued)
The capital reserves are split into two components, the capital reserve arising on investments sold and the capital reserve arising on investments held. The following analyses what is accounted for in each of these components:
Capital reserve arising on investments sold
The following are accounted for in this reserve:● gains and losses on the disposals of investments;● other capital charges and credits charged to this account in accordance with the above policies;● realised foreign exchange differences of a capital nature; and● cost of repurchasing share capital.
Capital reserve arising on investments held
The following are accounted for in this reserve:● increases and decreases in the valuation of investments held at the year end; and● unrealised foreign exchange differences of a capital nature.
The revenue reserve represents accumulated revenue profits retained by the Company that have not been distributed to shareholders as a dividend.
Other reserves comprise the following reserves:● The special distributable reserve was created on 11 July 2007 following the cancellation of the share premium account
and the capital redemption reserve and is available to fund market purchases and the subsequent cancellation of own shares.
● The merger reserve represents the premium over the nominal value of ordinary shares issued in March 1997 in connection with the acquisition of The German Investment Trust plc.
● The capital redemption reserve represents the nominal value of ordinary shares that have been repurchased and cancelled.
(l) Distributable reservesThe Company’s special distributable reserve, capital reserve arising on investments sold and revenue reserve may be distributed by way of dividend.
2 Gains on investments held at fair value through profit or loss2020
£’0002019
£’000
Gains on the sale of investments based on historical cost 11,726 865
Revaluation gains recognised in previous years (19,552) (18,123)
Losses on investments sold in the year based on carrying value at previous Statement of Financial Position date (7,826) (17,258)
Revaluation gains on investments held at 30 September 22,972 25,424
Gains on investments held at fair value through profit or loss 15,146 8,166
3 Income from investments2020
£’0002019
£’000
Listed investments:
Overseas dividends 6,730 6,983
UK dividends 134 567
6,864 7,550
61
Henderson European Focus Trust plc Annual Report 2020

Notes to the Financial Statements (continued)
4 Other income2020
£’0002019
£’000
Deposit interest 14 14
14 14
5 Management fees2020 2019
Revenue return £’000
Capital return £’000
Total return £’000
Revenue return £’000
Capital return £’000
Total return £’000
Management fee 471 1,414 1,885 454 1,362 1,816
471 1,414 1,885 454 1,362 1,816
A description of the basis for calculating the management fee is given in the Business Model on page 20.
Management fees are allocated 25% to revenue and 75% to capital in the Income Statement.
6 Other fees and expenses2020
£’0002019
£’000
Directors' fees and taxable benefits (see Directors' Remuneration Report on page 43) 147 176
Fees payable to the Company's auditor
– for audit services 42 29
AIC subscriptions 21 21
Directors' and officers' liability insurance 4 7
Listing fees 28 23
Depositary charges 44 41
Custody charges 57 55
Printing and postage 26 11
Other expenses payable to the Manager 7 60
Registrar’s fees 42 42
Legal and professional fees 66 63
Other expenses 22 14
506 542
7 Finance costs2020 2019
Revenue return £’000
Capital return £’000
Total return £’000
Revenue return £’000
Capital return £’000
Total return £’000
On bank overdrafts payable within one year 95 285 380 103 309 412
Interest payable to HMRC due to refund of French withholding tax 10 – 10 21 – 21
105 285 390 124 309 433
Interest payable is allocated 25% to revenue and 75% to capital in the Income Statement. Interest rates are set at the time drawings are made based on the bank’s base rate, plus a margin of 1.25% per annum. During the year the weighted average interest rate was 1.65% (2019: 2.00%).
During the year to 30 September 2017 the Company received a refund of French withholding tax relating to tax suffered in 2007 and 2008. A provision was made for potential corporation tax payable and interest payment thereon to HMRC. During the year to 30 September 2020 a further amount of £10,000 has been accrued for the potential additional interest payable. The refund and any associated corporation tax payable and interest have all been credited or charged to revenue.
62
Henderson European Focus Trust plc Annual Report 2020
Notes to the Financial Statements (continued)
8 Taxation(a) Analysis of charge for the year
Year ended 30 September 2020 Year ended 30 September 2019
Revenue return £’000
Capital return £’000
Total return £’000
Revenue return £’000
Capital return £’000
Total return £’000
Overseas tax suffered 612 – 612 677 78 755
Total taxation for the year 612 – 612 677 78 755
(b) Factors affecting the tax charge for the yearYear ended 30 September 2020 Year ended 30 September 2019
Revenue return £’000
Capital return £’000
Total return £’000
Revenue return £’000
Capital return £’000
Total return £’000
Return/(loss) before taxation 5,796 12,146 17,942 6,444 6,217 12,661
Corporation tax at 19.0% (2019: 19.0%) 1,101 2,308 3,409 1,224 1,181 2,405
Effects of:
Non-taxable capital profits – (2,630) (2,630) – (1,498) (1,498)
Non-taxable income (1,262) – (1,262) (1,360) – (1,360)
Expenses not deductible for tax purposes 2 – 2 – – –
Current year expenses not utilised 159 322 481 136 317 453
Overseas tax 612 – 612 677 78 755
612 – 612 677 78 755
The UK corporation tax rate is 19.00% (2019: 19.00%). The tax charge for the year is lower than the corporation tax rate.
No provision for deferred tax has been made in the current or prior accounting year. At the period end, after offset against income taxable on receipt, there is a potential deferred tax asset of £4,645,000 (2019: £3,719,000) in relation to surplus management expenses. It is unlikely that the Company will generate sufficient taxable profits in the future to utilise these amounts and therefore no deferred tax asset has been recognised.
9 Return per ordinary shareThe return per share is based on the net return attributable to the shares of £17,330,000 (2019: net return of £11,906,000) and on 21,480,288 shares (2019: 21,498,261) being the weighted average number of shares in issue during the year. The return per share can be further analysed between revenue and capital as below.
2020 £’000
2019 £’000
Net revenue return 5,184 5,767
Net capital return 12,146 6,139
Net total return 17,330 11,906
Weighted average number of shares in issue during the year 21,480,288 21,498,261
Revenue return per share 24.13p 26.83p
Capital return per share 56.54p 28.55p
Total return per share 80.67p 55.38p
The Company does not have any dilutive securities, therefore the basic and diluted returns per share are the same.
63
Henderson European Focus Trust plc Annual Report 2020

Notes to the Financial Statements (continued)
10 Dividends paid and payable on the ordinary shares
Dividends on ordinary shares Record date Payment date2020
£’0002019
£’000
Final dividend (21.50p) for the year ended 30 September 2018 11 January 2019 8 February 2019 – 4,622
Interim dividend (9.60p) for the year ended 30 September 2019 7 June 2019 29 June 2019 – 2,064
Final dividend (21.70p) for the year ended 30 September 2019 10 January 2020 7 February 2020 4,665 –
Interim dividend (9.60p) for the year ended 30 September 2020 5 June 2020 26 June 2020 2,064 –
6,729 6,686
The final dividend for the year ended 30 September 2020 has not been included as a liability in these financial statements. The total dividend payable in respect of the financial year, which forms the basis of the retention test under s1158 Corporation Tax Act, is set out below.
2020 £’000
2019 £’000
Revenue available for distribution by way of dividend for the year 5,184 5,767
Interim dividend (9.60p) for the year ended 30 September 2020 (based on 21,498,261 shares in issue at 5 June 2020) (2,064) –
Final dividend (21.70p) for the year ended 30 September 2020 (based on 21,382,578 shares in issue at 10 December 2020) (4,640) –
Interim dividend (9.60p) for the year ended 30 September 2019 (based on 21,498,261 shares in issue at 7 June 2019) – (2,064)
Final dividend (21.70p) for the year ended 30 September 2019 (based on 21,498,261 shares in issue at 10 January 2020) – (4,665)
Transfer from revenue reserve (1,520) (962)
All dividends have been paid or will be paid out of revenue profits or revenue reserves.
11 Investments held at fair value through profit or loss2020
£’0002019
£’000
Valuation at 1 October 312,880 309,954
Investment holding gains at 30 September (39,832) (32,531)
Cost at 1 October 273,048 277,423
Additions at cost 247,184 212,191
Disposals at cost (253,602) (216,566)
Cost at 30 September 266,630 273,048
Investment holding gains at 30 September 43,252 39,832
Valuation at 30 September 309,882 312,880
The Company received £265,328,000 (2019: £217,431,000) from investments sold in the year. The book cost of these investments when they were purchased were £253,602,000 (2019: £216,566,000). These investments have been revalued over time and until they were sold any unrealised gains/losses were included in the fair value of investments.
The Company’s investments are registered in the name of nominees of, and held to the order of, HSBC Bank plc, as custodian to the Company. There were no contingent liabilities in respect of the investments held at the year end.
Purchase transaction costs for the year ended 30 September 2020 were £278,000 (2019: £191,000). These comprise mainly broker commission. Sale transaction costs for the year ended 30 September 2020 were £92,000 (2019: £83,000).
64
Henderson European Focus Trust plc Annual Report 2020
Notes to the Financial Statements (continued)
12 Debtors2020
£’0002019
£’000
Amounts receivable within one year:
Investments sold awaiting settlement 4,053 –
Accrued income – 37
Prepaid expenses 17 17
Overseas withholding tax recoverable 1,781 1,590
Other receivables 47 –
5,898 1,644
13 Creditors: amounts falling due within one year 2020
£’0002019
£’000
Amounts payable within one year:
Investments purchased awaiting settlement 4,372 2,561
Accrued expenses and interest 1,743 1,364
Taxation payable 347 347
Bank overdraft 35,497 23,049
41,959 27,321
The Company has an uncommitted, secured multi-currency overdraft facility equal to the lesser of £46,800,000 and 25% of custody assets with HSBC Bank plc. Interest is charged at the bank’s fluctuating base rate, plus a margin of 1.25% per annum. Borrowings are repayable on demand.
14 Financial risk management policies and proceduresAs an investment trust, the Company invests in equities and other investments for the long term so as to secure its investment objective and policy as stated on page 18. In pursuing its investment objective and policy, the Company is exposed to a variety of financial risks that could result in either a reduction in the Company’s net assets or a reduction in the profits available for distribution by way of dividends.
The financial risks, being market risk (comprising market price risk, currency risk and interest rate risk), credit risk, liquidity risk and gearing, and the directors’ approach to the management of these risks, are set out below and have not changed from the previous accounting period. The Board and Janus Henderson coordinate the Company’s risk management and there are various risk management systems in place.
The Board determines the objectives, policies and processes for managing risks, and these are set out below under the relevant risk category. The policies for the management of risk have not changed from the previous accounting period.
14.1 Market riskThe fair value of a financial instrument held by the Company may fluctuate due to changes in market prices. This market risk comprises market price risk (see note 14.1.1), currency risk (see note 14.1.2) and interest rate risk (see note 14.1.3). The Board reviews and agrees policies for managing these risks. The Manager assesses the exposure to market risk when making each investment decision and monitors the overall level of market risk on the whole of the investment portfolio on an ongoing basis.
14.1.1 Market price riskThe Company is an investment company and as such its performance is dependant on the valuation of its investments. Consequently, market price risk is the most significant risk to which the Company is exposed. The Company’s investment objective and policy require it to invest mainly in listed Continental Europe.
At 30 September 2020 the fair value of the Company’s assets exposed to market price risk was £309,882,000 (2019: £312,880,000). The fair value of the investments in the portfolio is normally their quoted bid price. The market price of investee companies’ shares is subject to their performance, supply and demand for the shares and investor sentiment regarding the companies, their industry sectors and the countries in which they operate.
65
Henderson European Focus Trust plc Annual Report 2020

Notes to the Financial Statements (continued)
14 Financial risk management policies and procedures (continued)14.1.1 Market price risk (continued)
The Company invests in a diversified portfolio of investments. In accordance with the Company’s investment objective and policy the portfolio contains between 35 and 45 stocks, with a maximum single stock weighting of 10% of the net asset value (“NAV”) of the portfolio at the time of investment. Stocks weighted at 5% of the portfolio or more will not exceed 50% of the NAV in aggregate. The typical minimum stock weight is 1% of NAV at the time of investment. The largest individual stock at the year end represented 7.08% of the value of the portfolio. The Company may use derivative instruments (such as futures and options) for the purpose of efficient portfolio management up to 10% of net assets. As at 30 September 2020 the Company had no exposure to such instruments.
The level of risk relative to the benchmark is increased by over or underweighting industry sectors and, to a lesser extent, country exposures and stock exposures relative to the benchmark, which tends to concentrate risk in those over and underweighted areas.
To illustrate the Company’s sensitivity to market prices, a 10% change to the market value (in sterling terms) of the equity portfolio at 30 September 2020 would generate a corresponding increase or decrease in the NAV per share of 10.1% or £31.0 million (2019: 10.5% or £31.3 million).
14.1.2 Currency riskThe majority of the Company’s assets are denominated in currencies other than sterling so the Company’s total return and Statement of Financial Position can be significantly affected by currency fluctuations. No hedging of the currency exposure is currently undertaken. Revenue received in currencies other than sterling is converted into sterling on, or shortly after, the date of receipt. Whilst the Board and the Fund Managers monitor geographic and currency exposure it is not a key determinant of investment decisions. At the year end 95.3% (2019: 91.5%) of the Company’s net assets were denominated in currencies other than sterling, the largest proportion being euro, at 60.3% (2019: 57.8%) of net assets.
The table below shows, by currency, the split of the Company’s non-sterling monetary assets and investments at the year end:
2020 £’000
2019 £’000
Monetary assets
Cash and short-term receivables:
Euro 4,790 490
Swiss franc 8,549 863
Swedish krona – 1,385
Danish krone 4,782 212
Norwegian krone 5,663 25
Monetary liabilities
Bank overdraft and short-term payables:
Euro (35,141) (9,687)
Swiss franc – (11,797)
Swedish krona (4,727) –
Danish krone – (2,801)
Norwegian krone – (1,351)
Non-monetary assets
Non-current asset investments held at fair value:
Euro 216,107 182,065
Swiss franc 47,005 65,609
Swedish krona 36,165 25,348
Danish krone 10,605 15,169
Norwegian krone – 8,091
Total 293,798 273,621
66
Henderson European Focus Trust plc Annual Report 2020

Notes to the Financial Statements (continued)
14 Financial risk management policies and procedures (continued)14.1.2 Currency risk (continued)
The level of assets exposed to currency risk decreased by approximately 7% during the year. The relative levels of exposure to currencies at the beginning and end of the year were broadly representative of levels through the period.
As can be seen from the table on the previous page, the most significant currency exposures are to the euro and Swiss francs.
The following table illustrates the Company’s sensitivity to movements in exchange rates relative to sterling. The sensitivity analysis is based on the Company’s non-sterling monetary assets and investments held at the Statement of Financial Position date and assumes a 10% appreciation or depreciation of sterling against each of the currencies to which the Company is exposed, with all other variables held constant.
2020 2019
Net assets £’000
Revenue return £’000
Net assets £’000
Revenue return £’000
Euro 16,887 341 15,715 331
Swiss francs 5,050 190 4,970 163
Other currencies 4,772 80 4,189 139
26,709 611 24,874 633
The effect on capital return would be materially the same as the effect on net assets.
It should be noted that a number of investee companies derive a proportion of their profits from markets subject to currencies other than that in which their shares are denominated, so changes in the relevant currency exchange rates relative to each other are also likely to have an indirect impact. Also, the above illustration is based on exposures at the year end. Exposures may be subject to change during the year as a result of investment decisions.
14.1.3 Interest rate riskThe Company finances part of its activities through the use of a secured uncommitted multi-currency overdraft facility provided by HSBC Bank plc equal to the lesser of £46,800,000 and 25% of custody assets. Interest rates are set at the time drawings are made based on the bank’s base rate, plus a margin of 1.25% per annum. During the year, the maximum drawn under the facility (net of any cash balances) was £22,780,000 (2019: £22,560,000) and the weighted average interest rate was 1.65% (2019: 2.00%). No hedging of the interest rate is undertaken. At 30 September 2020 there were drawings of £35,497,000 outstanding, of which £35,497,000 were in foreign currencies (2019: £23,049,000 of which £23,049,000 was in foreign currencies).
Interest is paid on the cash and short-term deposits. Overdraft drawings and deposits are rarely fixed for periods of more than one week.
At 30 September 2020, financial assets and liabilities exposed to floating interest rates were as follows:
2020 £’000
2019 £’000
Financial assets
Cash balances 34,345 11,807
Financial liabilities
Bank overdraft (35,497) (23,049)
The Company has no direct exposure to fixed interest rates.
The year-end amounts are not representative of the exposure to interest rates either during the year just ended nor for the year ahead, since the level of borrowings and/or cash held will be affected by the strategy being followed in response to the Board’s and Fund Managers’ perception of market prospects and the investment opportunities available at any particular time. However, to illustrate the potential sensitivity to changes in interest rates, if £46.8 million were drawn from the uncommitted multi-currency overdraft facility (based on the 20% gearing limit set by the Board), a change of 0.5% in the rate of interest charged would, over the course of a year, amount to £234,000 (ignoring any exchange rate movements), less than 0.1% of year end net assets.
67
Henderson European Focus Trust plc Annual Report 2020

Notes to the Financial Statements (continued)
14 Financial risk management policies and procedures (continued)14.2 Credit risk
Credit risk is the Company’s exposure to financial loss from failure of a counterparty to deliver securities or cash for acquisitions or disposals of investments or to repay deposits, or the failure of the Company’s custodian. The Company manages credit risk by using brokers from a database of approved financial institutions who have undergone rigorous due diligence tests by the Manager’s risk management team and by dealing through Janus Henderson with banks authorised by the Financial Conduct Authority.
At 30 September 2020, the maximum exposure to credit risk was £34,345,000 (2019: £11,807,000) comprising:
2020 £’000
2019 £’000
Cash at bank 34,345 11,807
The Company is exposed to credit risk through its cash position. Bankruptcy or insolvency of banks may cause the Company’s rights with respect to cash held by banks to be delayed or limited. The Company’s cash balances are held by its custodian, HSBC Bank Plc. The directors believe the counterparty is of high credit quality and, therefore, the Company has minimal exposure to credit risk.
All of the above financial assets are current, their fair values are considered to be the same as the values shown and the likelihood of default is considered to be low.
14.3 Liquidity riskLiquidity risk is the possibility of the Company failing to realise sufficient assets to meet its financial obligations. The Company minimises this risk by having a bias to larger capitalised companies, by investing in listed companies and by ensuring that it has adequate cash and credit facilities in place to meet its obligations. The Company’s liquidity is almost entirely on interest-bearing current accounts or short-term deposits in the money market. Deposits are rarely fixed for terms in excess of one week and cash net of any overdraft balances are limited to 10% of net assets with any one bank or institution to manage counterparty risk. Cash requirements are monitored on a regular basis by the Manager.
At 30 September 2020, the fair value of financial liabilities was £41,959,000 (2019: £27,321,000), comprising:
2020 £’000
2019 £’000
Due within one month:
Investments purchased awaiting settlement 4,372 2,561
Bank overdraft 35,497 23,049
Accrued expenses and interest 1,743 1,364
Taxation payable 347 347
14.4 GearingMarket risks can be amplified by gearing. In addition to using shareholders’ funds to finance investments the Company can also invest funds available from gearing. Such gearing will exaggerate the effect on the NAV of a change in the value of the portfolio. If the Company’s gearing were extended to the level permitted under the investment policy, it would amount to 20% of net assets and in those circumstances a change of 10% in the value of the portfolio would be expected to change the NAV by approximately 12.5%.
As noted on page 67 in the interest rate risk section, the level of borrowings and/or cash held during the year will be affected by the strategy being followed in response to the Board’s and Manager’s perception of market prospects and the investment opportunities available at any particular time.
At the year end there was gearing of 0.6% (2019: 4.6%).
68
Henderson European Focus Trust plc Annual Report 2020
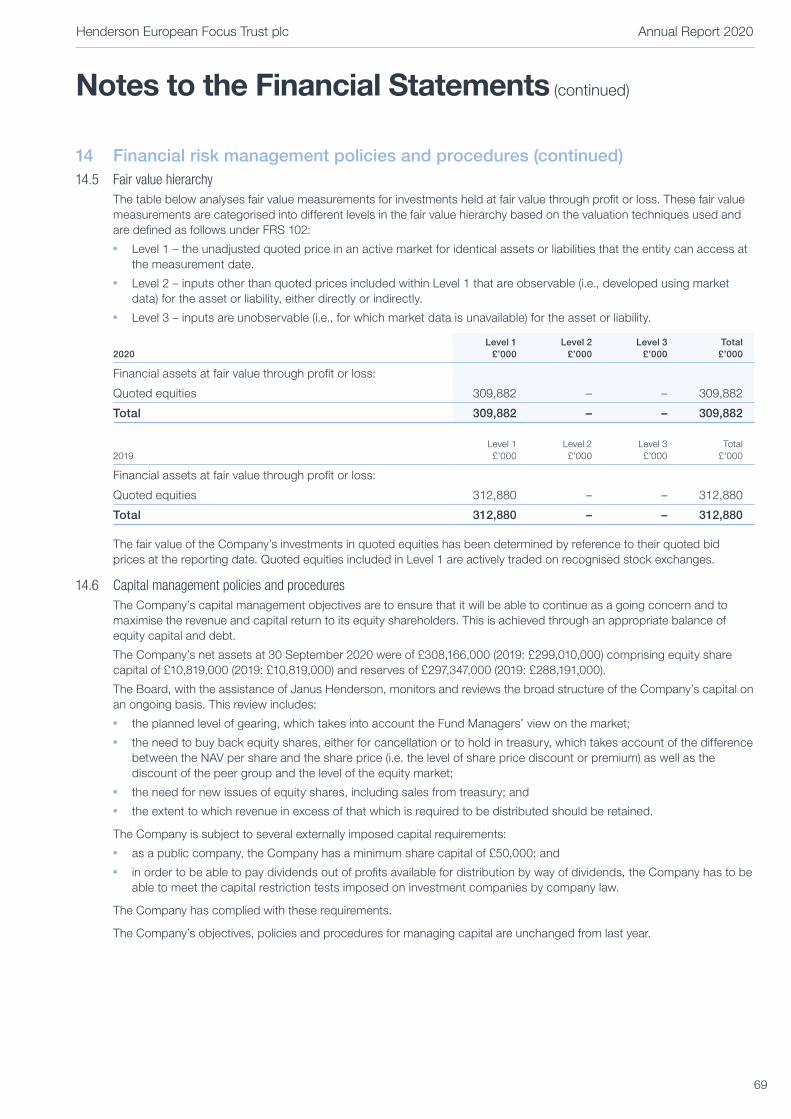
Notes to the Financial Statements (continued)
14 Financial risk management policies and procedures (continued)14.5 Fair value hierarchy
The table below analyses fair value measurements for investments held at fair value through profit or loss. These fair value measurements are categorised into different levels in the fair value hierarchy based on the valuation techniques used and are defined as follows under FRS 102:
● Level 1 – the unadjusted quoted price in an active market for identical assets or liabilities that the entity can access at the measurement date.
● Level 2 – inputs other than quoted prices included within Level 1 that are observable (i.e., developed using market data) for the asset or liability, either directly or indirectly.
● Level 3 – inputs are unobservable (i.e., for which market data is unavailable) for the asset or liability.
2020Level 1
£’000Level 2
£’000Level 3
£’000Total
£’000
Financial assets at fair value through profit or loss:
Quoted equities 309,882 – – 309,882
Total 309,882 – – 309,882
2019Level 1 £’000
Level 2 £’000
Level 3 £’000
Total £’000
Financial assets at fair value through profit or loss:
Quoted equities 312,880 – – 312,880
Total 312,880 – – 312,880
The fair value of the Company’s investments in quoted equities has been determined by reference to their quoted bid prices at the reporting date. Quoted equities included in Level 1 are actively traded on recognised stock exchanges.
14.6 Capital management policies and proceduresThe Company’s capital management objectives are to ensure that it will be able to continue as a going concern and to maximise the revenue and capital return to its equity shareholders. This is achieved through an appropriate balance of equity capital and debt.
The Company’s net assets at 30 September 2020 were of £308,166,000 (2019: £299,010,000) comprising equity share capital of £10,819,000 (2019: £10,819,000) and reserves of £297,347,000 (2019: £288,191,000).
The Board, with the assistance of Janus Henderson, monitors and reviews the broad structure of the Company’s capital on an ongoing basis. This review includes:
● the planned level of gearing, which takes into account the Fund Managers’ view on the market;● the need to buy back equity shares, either for cancellation or to hold in treasury, which takes account of the difference
between the NAV per share and the share price (i.e. the level of share price discount or premium) as well as the discount of the peer group and the level of the equity market;
● the need for new issues of equity shares, including sales from treasury; and● the extent to which revenue in excess of that which is required to be distributed should be retained.
The Company is subject to several externally imposed capital requirements:● as a public company, the Company has a minimum share capital of £50,000; and● in order to be able to pay dividends out of profits available for distribution by way of dividends, the Company has to be
able to meet the capital restriction tests imposed on investment companies by company law.
The Company has complied with these requirements.
The Company’s objectives, policies and procedures for managing capital are unchanged from last year.
69
Henderson European Focus Trust plc Annual Report 2020

Notes to the Financial Statements (continued)
15 Called up share capital2020
£’0002019
£’000
Allotted, issued and fully paid
21,382,578 (2019: 21,498,261) ordinary shares of 50p each 10,690 10,748
256,413 (2019: 140,730) ordinary shares of 50p each held in treasury 129 71
10,819 10,819
During the year to 30 September 2020, the Company repurchased 115,683 (2019: nil) shares at a cost of £1,445,000 including expenses (2019: £nil). All of these shares were placed in treasury. The shares held in treasury have no voting rights and are not entitled to dividends.
16 Share premium account2020
£’0002019
£’000
Balance brought forward 41,995 41,995
Balance at 30 September 41,995 41,995
17 Capital reserve2020 2019
Capital reserve
arising on investments
sold £’000
Capital reserve
arising on investments
held £’000
Capital reserves total
£’000
Capital reserve arising on
investments sold
£’000
Capital reserve arising on
investments held
£’000
Capital reserves total
£’000
Balance brought forward 98,260 39,753 138,013 99,344 32,530 131,874
Transfer on disposal of investments 19,552 (19,552) – 18,123 (18,123) –
Movement in fair value of investments (7,826) 22,972 15,146 (17,258) 25,424 8,166
Exchange losses on currency transactions (1,301) – (1,301) (278) – (278)
Management fee allocated to capital (1,414) – (1,414) (1,362) – (1,362)
Interest payable allocated to capital (285) – (285) (309) – (309)
Buyback of ordinary shares for treasury (1,445) – (1,445) – – –
Irrecoverable withholding tax deducted at source – – – – (78) (78)
Balance at 30 September 105,541 43,173 148,714 98,260 39,753 138,013
18 Revenue reserve2020
£’0002019
£’000
Balance brought forward 11,572 12,491
Net revenue return for the year after tax 5,184 5,767
Dividends paid (note 10) (6,729) (6,686)
Balance at 30 September 10,027 11,572
70
Henderson European Focus Trust plc Annual Report 2020

Notes to the Financial Statements (continued)
19 Other reserves2020 2019
Special distribut able
reserve £’000
Merger reserve
£’000
Capital redemption
reserve £’000
Total £’000
Special distributable
reserve £’000
Merger reserve
£’000
Capital redemption
reserve £’000
Total £’000
Balance brought forward 25,846 61,344 9,421 96,611 25,846 61,344 9,421 96,611
Balance at 30 September 25,846 61,344 9,421 96,611 25,846 61,344 9,421 96,611
20 Net asset value per shareThe NAV per share is based on the net assets attributable to the shares of £308,166,000 (2019: £299,010,000) and on 21,382,578 (2019: 21,498,261) shares in issue on 30 September 2020, excluding treasury shares.
The movements during the year of the assets attributable to the shares were as follows:
2020 £’000
2019 £’000
Total net assets at start of year 299,010 293,790
Net return for the year after tax 17,330 11,906
Buyback of shares for treasury (1,445) –
Dividends paid (6,729) (6,686)
Net assets attributable to the shares at 30 September 308,166 299,010
21 Capital commitments and contingent liabilitiesThere were no capital commitments or contingent liabilities as at 30 September 2020 (2019: nil).
22 Transactions with the Manager and related partiesUnder the terms of an agreement effective from 22 July 2014, the Company has appointed a wholly owned subsidiary of Janus Henderson Group plc (“Janus Henderson”) to provide investment management, accounting, secretarial and administrative services. Janus Henderson has contracted with BNP Paribas Securities Services to provide accounting and administration services.
Details of the fee arrangements for these services are given on page 20. The management fees payable to Janus Henderson under the agreement in respect of the year ended 30 September 2020 were £1,885,000 (2019: £1,816,000). The amount outstanding at 30 September 2020 was £1,385,000 payable to Janus Henderson (2019: £963,000).
In addition to the above services, Janus Henderson facilitates marketing activities with third parties which are recharged to the Company. The total amount paid to Janus Henderson in respect of these third-party marketing activities, including VAT, for the period ended 30 September 2020 was £7,000 (2019: £60,000).
Details of fees paid to directors are included in the Directors’ Remuneration Report on page 43 and in note 6 on page 62.
71
Henderson European Focus Trust plc Annual Report 2020

Notes to the Financial Statements (continued)
23 Changes in net debtThe following table shows the movements during the period of net debt in the statement of financial position:
Non-cash changes
At 1 October
2019 £’000
Cash flows £’000
Foreign exchange
movement £’000
At 30 September
2020 £’000
Financing activities
Bank overdraft (23,049) (12,448) – (35,497)
(23,049) (12,448) – (35,497)
Non-financing activities
Cash and cash equivalents 11,807 23,839 (1,301) 34,345
11,807 23,839 (1,301) 34,345
Total (11,242) 11,391 (1,301) (1,152)
Non-cash changes
At 1 October
2018 £’000
Cash flows £’000
Foreign exchange
movement £’000
At 30 September
2019 £’000
Financing activities
Bank overdraft (47,816) 24,767 – (23,049)
(47,816) 24,767 – (23,049)
Non-financing activities
Cash and cash equivalents 34,242 (22,157) (278) 11,807
34,242 (22,157) (278) 11,807
Total (13,574) 2,610 (278) (11,242)
72
Henderson European Focus Trust plc Annual Report 2020

Additional Information
LVMH Fondation LV
73

Alternative Investment Fund Managers Directive (“AIFMD”)Agreed by the European Parliament and the Council of the European Union and transposed into UK legislation, the AIFMD classifies certain investment vehicles, including investment companies, as alternative investment funds (“AIFs”) and requires them to appoint an alternative investment fund manager (“AIFM”) and depositary to manage and oversee the operations of the investment vehicle. The Board retains responsibility for strategy, operations and compliance. The directors retain a fiduciary duty to shareholders.
Association of Investment Companies (“AIC”)The Company is a member of the AIC which is the trade body for investment companies and represents the industry in relation to various matters which impact the regulation of such entities.
BenchmarkAn index against which performance is compared. For the Company this is the FTSE World Europe ex UK Index on a total return basis in sterling terms.
Continental EuropeEvery country in Europe except the UK, the Channel Islands and the Isle of Man.
CustodianThe custodian is responsible for ensuring the safe custody of the Company’s assets and that all transactions in the underlying holdings are transacted in an accurate and timely manner.
DepositaryAs an AIF, the Company is required to appoint a depositary which has responsibility for overseeing the operations of the Company including safekeeping, cash monitoring and verification of ownership and valuation of the underlying holdings and is responsible for the appointment of a custodian. The depositary is strictly liable for the loss of any investments or other assets in its custody unless it has notified that it has discharged its liability in certain markets. The depositary has confirmed that it has not discharged liability in relation to any of the Company’s assets.
Dividend datesWhen declared or recommended, each dividend will have three key dates applied to it. The payment date is the date on which shareholders will receive their dividend, either by BACS transfer or by receipt of a dividend cheque. The record date applied to the dividend is used as a cut-off for the Company’s registrars to know which shareholders should be paid a dividend. Only shareholders on the Register of Members at the close of business on the record date will receive the dividend. The ex-dividend date is the business day before the record date and is the date upon which the Company’s net asset value per ordinary share will be disclosed ex-dividend.
Investment trustsInvestment trusts are public limited companies, listed on the London Stock Exchange, which provide shareholders with a professionally managed portfolio of investments. Investment trusts are exempt from tax on the capital gains arising on their investments subject to meeting certain criteria. Income, net of expenses and tax, is substantially distributed to shareholders. Investment trusts are also known as investment companies, although the tax legislation retains the reference to investment trusts.
LiquidityIn the context of the liquidity of shares in the stock market, this refers to the availability of buyers and sellers in the market for the share in question. Where the market in a particular share is described as liquid, that share will be in demand and holders wishing to sell their shares should find ready buyers. Conversely, where the market in a share is illiquid the difficulty of finding a buyer or seller will tend to depress or increase the price that might be negotiated for a sale or purchase. Investment companies can use allotment or buyback powers to assist the market liquidity in their shares.
Market capitalisation (“market cap”)The market value of a company, calculated by multiplying the mid-market price per share by the number of shares in issue.
Treasury sharesShares repurchased by the Company, but not cancelled, and available for re-issue under the appropriate circumstances.
Glossary
Henderson European Focus Trust plc Annual Report 2020
74

The Company uses the following alternative performance measures (‘APMs’) throughout the Annual Report, Financial Statements and Notes to the Financial Statements. The APMs are reconciled to the Financial Statements through the narrative below. The Board believes that each of the APMs, which are typically used within the investment trust sector, provide additional useful information to shareholders to help assess the Company’s performance against its peer group.
Capital return per shareThe capital return per share is the capital profit/(loss) for year (see Income Statement) divided by weighted average number of shares in issue during the year (see note 9 on page 63).
Discount or premiumThe amount by which the market price per share of an investment trust is either higher (premium) or lower (discount) than the NAV per share, expressed as a percentage of the NAV per share.
30 September 2020
30 September 2019
Net asset value per share (pence) (A) 1,441.20 1,390.86
Share price per share (pence) (B) 1,260.00 1,245.00
(Discount) or Premium (C= (B-A)/A) (%) (C) (12.6%) (10.5%)
Gearing/(net cash) Gearing is a measure of the level of the Company’s net borrowings. It is calculated as defined by the AIC as the excess of total investments above shareholders’ funds, expressed as a percentage of shareholders’ funds. If the amount calculated is negative, this is a ‘net cash’ position and there is no gearing.
2020 2019
Investments held at fair value through profit or loss (page 57) (£'000) (A) 309,882 312,880
Net assets (page 57) (£'000) (B) 308,166 299,010
Gearing (C = (A / B) – 1) (%) (C) 0.6% 4.6%
Net asset value (“NAV”) per ordinary shareThe value of the Company’s assets less any liabilities for which the Company is responsible divided by the number of shares in issue excluding shares held in treasury (see note 15). The aggregate NAV is also referred to as shareholders’ funds in the Statement of Financial Position. The NAV per share is published daily and the year end NAV can be found on page 57 and further information is available on page 71 in note 20 within the Notes to the Financial Statements.
Alternative Performance Measures
75
Henderson European Focus Trust plc Annual Report 2020
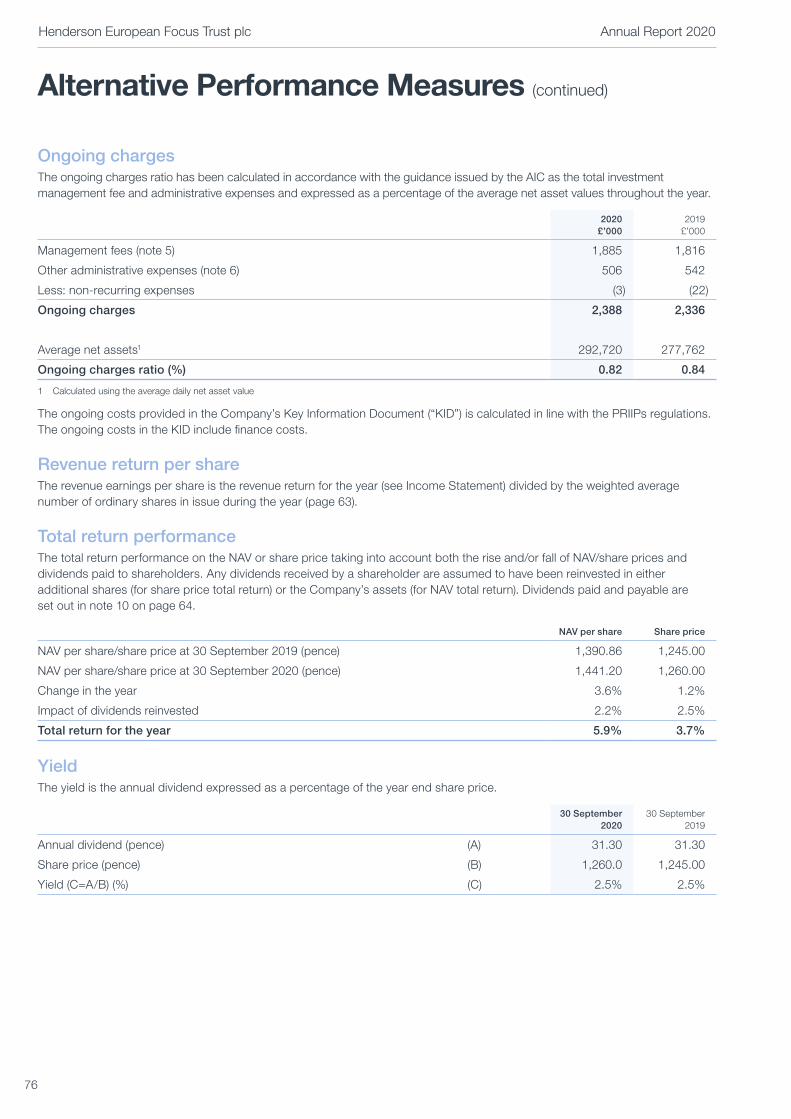
Alternative Performance Measures (continued)
Ongoing charges The ongoing charges ratio has been calculated in accordance with the guidance issued by the AIC as the total investment management fee and administrative expenses and expressed as a percentage of the average net asset values throughout the year.
2020 £’000
2019 £’000
Management fees (note 5) 1,885 1,816
Other administrative expenses (note 6) 506 542
Less: non-recurring expenses (3) (22)
Ongoing charges 2,388 2,336
Average net assets1 292,720 277,762
Ongoing charges ratio (%) 0.82 0.84
1 Calculated using the average daily net asset value
The ongoing costs provided in the Company’s Key Information Document (“KID”) is calculated in line with the PRIIPs regulations. The ongoing costs in the KID include finance costs.
Revenue return per shareThe revenue earnings per share is the revenue return for the year (see Income Statement) divided by the weighted average number of ordinary shares in issue during the year (page 63).
Total return performanceThe total return performance on the NAV or share price taking into account both the rise and/or fall of NAV/share prices and dividends paid to shareholders. Any dividends received by a shareholder are assumed to have been reinvested in either additional shares (for share price total return) or the Company’s assets (for NAV total return). Dividends paid and payable are set out in note 10 on page 64.
NAV per share Share price
NAV per share/share price at 30 September 2019 (pence) 1,390.86 1,245.00
NAV per share/share price at 30 September 2020 (pence) 1,441.20 1,260.00
Change in the year 3.6% 1.2%
Impact of dividends reinvested 2.2% 2.5%
Total return for the year 5.9% 3.7%
Yield The yield is the annual dividend expressed as a percentage of the year end share price.
30 September 2020
30 September 2019
Annual dividend (pence) (A) 31.30 31.30
Share price (pence) (B) 1,260.0 1,245.00
Yield (C=A/B) (%) (C) 2.5% 2.5%
76
Henderson European Focus Trust plc Annual Report 2020

General Shareholder Information
AIFMD DisclosuresIn accordance with the Alternative Investment Fund Managers Directive (“AIFMD”), information in relation to the Company’s leverage and remuneration of Henderson Investment Funds Limited, as the Company’s alternative investment fund manager (“AIFM”), is required to be made available to investors. These disclosures, including those on the AIFM’s remuneration policy, are contained in a separate document, the “AIFMD Disclosure”, which can be found on the Company’s website www.hendersoneuropeanfocus.com.
BACSDividends can be paid by means of BACS (Bankers’ Automated Clearing Services), and mandate forms for this purpose are available from the registrar. Alternatively, shareholders can write to the registrar, Equiniti Limited (the address is on the page 78), to give their instructions, which must include the bank account number, the bank account title and the sort code of the bank to which payments are to be made.
Common Reporting StandardWith effect from 1 January 2016, tax legislation under The Organisation for Economic Co-operation and Development Common Reporting Standard for Automatic Exchange of Financial Account Information was introduced. The legislation requires the Company to provide personal information to HMRC on certain investors who purchase shares in investment trusts. This information is provided annually to the local tax authority of the tax residencies of a number of non-UK based certificated shareholders and corporate entities.
Equality Act 2010This Annual Report and other documents issued by the Company are available from the corporate secretary. If needed, copies can be made available in a variety of formats, including Braille or larger type as appropriate. You may contact the registrar who has installed textphones to allow speech and hearing impaired people who have their own textphone to contact them directly, without the need for an intermediate operator by dialling 0371 384 2457. Specially trained operators are available during normal business hours to answer queries via this service. Alternatively, if you prefer to go through a “typetalk” operator (provided by the Royal National Institute for Deaf People) dial 18001 followed by the number you wish to dial.
FATCA The Foreign Account Tax Compliance Act (“FATCA”) is a United States federal law enacted in 2010 whose intent is to enforce the requirement for US persons to file annual reports on their non-US financial accounts. As a result of HMRC’s change of interpretation on the meaning of shares and securities “regularly traded on an established securities market”, investment trusts monitor the trading volume and frequency of their shares and securities each year to assess whether they have financial accounts. The Company makes an annual assessment to determine if the shares represent financial accounts and would report any US accounts to HMRC, as required.
GDPR The General Data Protection Regulation (“GDPR”) came into force on 25 May 2018. It aims to protect and empower individual data privacy and reshape the way organisations approach data privacy. A privacy statement can be found on the website www.janushenderson.com.
ISAThe Company intends to continue to manage its affairs in order to qualify as an eligible investment for holdings through a stocks and shares ISA.
Non-mainstream pooled investments (“NMPI”) statusThe Company currently conducts its affairs so that its ordinary shares of 50p each can be recommended by IFAs to ordinary retail investors in accordance with the Financial Conduct Authority’s rules in relation to non-mainstream investment products and intends to continue to do so for the foreseeable future. The shares are excluded from the FCA’s restrictions which apply to non-mainstream investment products because they are shares in an investment trust.
Packaged Retail and Insurance-based Investment Products Regulation (“PRIIPs”)/Key Information Document (“KID”)Investors should be aware that PRIIPs requires the Manager, as the PRIIP manufacturer, to prepare a KID in respect of the Company. This KID must be made available by the Manager to retail investors prior to them making any investment decision and is available on the Company’s website. The Company is not responsible for the information contained in the KID and investors should note that the procedures for calculating the risks, costs and potential returns are prescribed by law and will indicate different cost numbers from those provided in the Company’s financial statements. The figures in the KID may not reflect the expected returns for the Company and anticipated performance returns cannot be guaranteed.
Performance share price and publicationThe Company’s NAV is published daily. Details of the Company’s share price and NAV per share can be found on the website www.hendersoneuropeanfocus.com and in the London Stock Exchange Daily Official List.
The market price of the Company’s shares is also published daily in the Financial Times and on Trustnet.
Shareholder detailsShareholders who hold their shares in certificated form can check their shareholding with the registrar, Equiniti Limited, via www.shareview.co.uk. To gain access to your details on the Equiniti site you will need the holder reference number shown on your share certificate.
The market price of the Company’s shares is published daily in The Financial Times, which also shows figures for the estimated NAV per share and discount.
Henderson European Focus Trust plc Annual Report 2020
77

Registered office201 Bishopsgate London EC2M 3AE
Other service providers
Alternative investment fund managerHenderson Investment Funds Limited 201 Bishopsgate London EC2M 3AE
Depositary and custodianHSBC Bank Plc 8 Canada Square London E14 5HQ
StockbrokerWinterflood Securities Limited The Atrium Building Cannon Bridge, 25 Dowgate Hill London EC4R 2GA
Corporate secretaryHenderson Secretarial Services Limited 201 Bishopsgate London EC2M 3AE Telephone: 020 7818 1818 [email protected]
RegistrarEquiniti Limited Aspect House, Spencer Road, Lancing, West Sussex BN99 6DA Telephone: 0371 384 2457 (or +44 121 415 0804 if calling from overseas) Lines are open 9.00 am to 5.00 pm UK time, Monday to Friday. There is a range of shareholder information online. You can check your holding and find practical help on transferring shares or updating your details at www.shareview.co.uk
Independent auditorErnst & Young LLP 25 Churchill Place London E14 5EY
Financial calendarAnnual results announced December 2020 Ex dividend date 7 January 2021 Dividend record date 8 January 2021 Annual General Meeting 28 January 2021 Final dividend payable 5 February 2021 Half-year results announced May 2021 Interim dividend payable June 2021
Information sourcesFor more information about the Company, visit the website at www.hendersoneuropeanfocus.com. This includes factsheets, interviews and current information on the Company and up-to-date share price and net asset value information.
To receive regular insights on investment trusts from the Manager, visit: https://www.janushenderson.com/en-gb/investor/subscriptions/
Follow investment trusts on Twitter, YouTube and Facebook
InvestingShares can be purchased in the market via a stockbroker or through share dealing platforms. They can also be held through share plans, ISAs or pensions, and links to various providers are included on the website.
Potential investors are reminded that the value of investments and the income from them may go down as well as up and investors may not receive the full amount invested. Tax benefits may vary as a result of statutory changes and their value will depend on individual circumstances.
Nominee share codeWhere notification has been provided in advance, the Company will arrange for shareholder communications to be provided to the operators of nominee accounts. Nominee investors may attend general meetings and speak at them when invited to do so by the Chair.
Service Providers
Henderson European Focus Trust plc Annual Report 2020
78

Strategic ReportPerformance 2-3
Chair’s Statement 4-7
Portfolio Information 8
Fund Managers’ Report 9-13
Investment Portfolio 14
Top Ten Holdings 15-16
Historical Information 17
Business Model 18-28
Section 172 statement 20-22
Measuring performance 24
Managing our risks 24-27
Viability statement 27-28
GovernanceBoard of Directors 30
Corporate Governance Report 31-37
Audit and Risk Committee Report 38-41
Directors’ Remuneration Report 42-44
Directors’ Report 45-46
Statement of Directors’ Responsibilities 47
Financial StatementsIndependent Auditor’s Report to the Members 49-54
Financial Statements 55-58
Notes to the Financial Statements 59-72
Additional InformationGlossary 74
Alternative Performance Measures 75-76
General Shareholder Information 77
Service Providers 78
Warning to shareholders Many companies are aware that their shareholders have received unsolicited phone calls or correspondence concerning investment matters. These are typically from overseas based “brokers” who target UK shareholders offering to sell them what often turn out to be worthless or high-risk shares in US or UK investments. They can be persistent and extremely persuasive. Shareholders are therefore advised to be wary of any unsolicited advice, offers to buy shares at a discount or offers of free company reports. Please note that it is unlikely that either the Company or the Company’s registrar, Equiniti, would make unsolicited telephone calls to shareholders. Any such calls would relate only to official documentation already circulated to shareholders and never in respect of investment “advice”. If you are in any doubt about the veracity of an unsolicited phone call, please call the corporate secretary at the number provided on page 78.

Henderson European Focus Trust plc
Annual R
eport 2020
JHI9218/2020
Hend
erson E
urop
ean Fo
cus Trust p
lc – Annual R
epo
rt 2020
Henderson European Focus Trust plc Registered as an investment company in England and Wales with registration number 427958 Registered office: 201 Bishopsgate, London EC2M 3AE
SEDOL/ISIN number: Ordinary Shares: 0526885/GB0005268858 London Stock Exchange (TIDM) Code: HEFT Global Intermediary Identification Number (GIIN): THMNPN.99999.SL.826 Legal Entity Identifier (LEI): 213800GS89AL1DK3IN50
Telephone: 0800 832 832 Email: [email protected]
www.hendersoneuropeanfocus.com
JHI9218/2020Designed and typeset by 2112 Communications, London Printed by Pureprint, Sussex
This report is printed on Revive 100 Silk cover board containing 100% recycled waste and Revive 50 Silk paper containing 50% recycled waste and 50% virgin fibre and manufactured at a mill certified with ISO 14001 environmental management standard. The pulp used in this product is bleached using an Elemental Chlorine Free process.
This product is made of material from well-managed FSC®– certified forests, recycled materials, and other controlled sources.
Front Cover image: Aerial view of the Fuerwigge Dam near Meinerzhagen in the Sauerland in Germany
ShareholderCommunication
Awards
2020
ShareholderCommunication
Awards
2019
Related Documents