Hemispheric differences in stop task performance Menno Van der Schoot * , Robert Licht, Tako M. Horsley, Joseph A. Sergeant Department of Clinical Neuropsychology, Vrije Universiteit, Van der Boechorststraat 1, 1081 BT Amsterdam, The Netherlands Accepted 23 October 2002 Abstract This study examined hemispheric specialization for stop task performance. It was found that inhibitory performance was better for stop signals presented in the right visual field. This result provided support for the hypothesis that, during stop task performance, subjects call upon the left-lateralized neural system that is involved in active attention. It was suggested that a stop task requires such a mode of attention because subjects maintain a tonic readiness for inhibitory action while being engaged in the stop taskÕs go routine. Subjects are continu- ously alert for possible stop signals while discriminating between go stimuli. The stop task may be considered a typical activation task. Ó 2002 Elsevier Science B.V. All rights reserved. PsycINFO classification: 2330; 2346 Keywords: Stop task; Motor inhibition; Hemispheric differences; Attention 1. Introduction The motor inhibition process has been studied using the stop signal paradigm (Logan & Cowan, 1984), in which subjects perform a primary choice reaction time (RT) task and are occasionally presented with a stop signal that instructs them to suppress the response. Logan and CowanÕs model accounts for response inhibi- tion in terms of a Ôhorse raceÕ between the go process (triggered by the primary task stimulus) and the stop process (triggered by the sudden presentation of the stop Acta Psychologica 112 (2003) 279–295 www.elsevier.com/locate/actpsy * Corresponding author. Tel.: +31-20-4448908. E-mail address: [email protected] (M. Van der Schoot). 0001-6918/03/$ - see front matter Ó 2002 Elsevier Science B.V. All rights reserved. PII:S0001-6918(02)00133-6

Welcome message from author
This document is posted to help you gain knowledge. Please leave a comment to let me know what you think about it! Share it to your friends and learn new things together.
Transcript
Hemispheric differences in stop task performance
Menno Van der Schoot *, Robert Licht, Tako M. Horsley,Joseph A. Sergeant
Department of Clinical Neuropsychology, Vrije Universiteit, Van der Boechorststraat 1,
1081 BT Amsterdam, The Netherlands
Accepted 23 October 2002
Abstract
This study examined hemispheric specialization for stop task performance. It was found
that inhibitory performance was better for stop signals presented in the right visual field. This
result provided support for the hypothesis that, during stop task performance, subjects call
upon the left-lateralized neural system that is involved in active attention. It was suggested
that a stop task requires such a mode of attention because subjects maintain a tonic readiness
for inhibitory action while being engaged in the stop task�s go routine. Subjects are continu-
ously alert for possible stop signals while discriminating between go stimuli. The stop task may
be considered a typical activation task.
� 2002 Elsevier Science B.V. All rights reserved.
PsycINFO classification: 2330; 2346
Keywords: Stop task; Motor inhibition; Hemispheric differences; Attention
1. Introduction
The motor inhibition process has been studied using the stop signal paradigm
(Logan & Cowan, 1984), in which subjects perform a primary choice reaction time(RT) task and are occasionally presented with a stop signal that instructs them
to suppress the response. Logan and Cowan�s model accounts for response inhibi-
tion in terms of a �horse race� between the go process (triggered by the primary
task stimulus) and the stop process (triggered by the sudden presentation of the stop
Acta Psychologica 112 (2003) 279–295
www.elsevier.com/locate/actpsy
*Corresponding author. Tel.: +31-20-4448908.
E-mail address: [email protected] (M. Van der Schoot).
0001-6918/03/$ - see front matter � 2002 Elsevier Science B.V. All rights reserved.
PII: S0001-6918 (02 )00133-6
stimulus). The subject succeeds in suppressing his/her response if the stop process fin-
ishes before the go process.
The concept of inhibition has been the subject of intense interest in recent years.
Since the race model provides a powerful method for comparing inhibitory compe-
tence in different conditions, tasks or subject groups, the stop signal paradigm hasbeen used in a variety of studies. Especially within the fields of developmental and
clinical psychology, the inhibition function and stop signal reaction time (SSRT) –
the two main dependent variables in the stop signal paradigm – have proved to be
valid diagnostic tools for establishing inhibitory deficits. Research in the former do-
main tries to describe and explain differences in cognitive abilities between young and
old subjects in terms of age-related changes in inhibitory capacity (e.g., Bedard et al.,
2002; Kramer, Humphrey, Larish, Logan, & Strayer, 1994; Ridderinkhof, Band, &
Logan, 1999; Williams, Ponesse, Schachar, Logan, & Tannock, 1999). The latterdomain of investigation aims at uncovering the relation between a variety of psycho-
pathological (childhood) disorders – in particular that of attention deficit hyper-
activity disorder – and deficiencies in inhibitory control (e.g., Logan, Schachar,
& Tannock, 1997; Overtoom et al., 2002; Schachar & Logan, 1990).
In order to investigate the nature of the stop process, a number of studies have
also focused on within-subject factors affecting the SSRT (e.g., Kramer et al.,
1994; Ridderinkhof et al., 1999; Van den Wildenberg, Van der Molen, & Logan,
2002; Van der Schoot, Licht, Horsley, & Sergeant, submitted for publication).Van der Schoot et al. found that SSRT in an auditory stop signal condition was fas-
ter than SSRT in a visual stop signal condition. They attributed this modality effect
to differences in the neurophysiological processes underlying perception. Ridderink-
hof et al. found that stop processes were completed more slowly when the imperative
signal (a target arrow) was flanked by distractor stimuli that were associated with the
incorrect primary response (noncorresponding flanker arrows) and that response
suppression in the primary task was less efficient when stop processes were active si-
multaneously. According to Ridderinkhof et al., these results indicate that the oper-ation of response inhibition in the primary task processes and response inhibition in
the stop process affected one another negatively.
Other studies used psychophysiological variables to examine the control processes
that underlie response inhibition in the stop signal paradigm (e.g., De Jong, Coles,
Logan, & Gratton, 1990; Pliszka, Liotti, & Woldorff, 2000; Van der Schoot, Licht,
Horsley, & Sergeant, in press). In the study by De Jong et al., event related brain po-
tentials and electromyogram measures suggested that response inhibition involved
both the inhibition of central response activation and a more peripherally operatingmechanism. Recently, Band and Van Boxtel (1999) reviewed the literature on the
neural mechanisms underlying the stop process. Based on the available anatomical,
neurophysiological and psychophysiological data, they concluded that the prefrontal
cortex, basal ganglia and supplementary motor area are the most likely sources of
inhibitory activity.
From a neuropsychological point of view, it would be interesting to further exam-
ine the stop process by studying hemispheric differences in stop task performance.
Therefore, we decided to repeat the visual stopping task of the above-mentioned ex-
280 M. Van der Schoot et al. / Acta Psychologica 112 (2003) 279–295
periment under conditions of hemifield stimulation, flashing the stop stimuli in the
left or right visual fields. From a large number of behavioral experiments that em-
ployed this methodology, it has been established that left–right differences in speed
and accuracy can be interpreted as providing evidence for an asymmetry of cerebral
hemispheric function (e.g., Bradshaw & Nettleton, 1981). That is, if stop perfor-mance would be found faster and more efficient with the stop stimulus presented
in one or the other visual half field (VHF), one may conclude that the hemisphere
opposite to the side of better performance is in some way specialized for processing
a stop task. Below, it is hypothesized that there is a left-hemispheric superiority for
stop task performance.
1.1. Active versus receptive attention
It may be argued that subjects performing a stop task feel obliged to actively mon-
itor for stop signals while responding to the primary stimuli. That is, a stop task
causes subjects to give priority to their stopping record as a result of which they
try to maintain a tonic readiness for inhibitory action while being engaged in a pri-
mary task routine. A similar suggestion has been made by Douglas (1999), Kramer
et al. (1994), and Oosterlaan and Sergeant (1995). Kramer et al. suggested that dur-
ing go task performance, subjects are continuously on the alert for a stop signal.
Douglas argued that a stop task shares some characteristics with the vigilance orcontinuous performance task: �in both tasks, subjects must monitor stimuli carefully
while maintaining preparation to make the appropriate response (either inhibit or re-
spond) to rare and unpredictable stimuli�. Following a similar line of argumentation,
Oosterlaan and Sergeant (1995) suggested that a stop task assesses preparation, as
well as inhibition.
How is the above �attentional claim� that a stop task is presumed to make on a
subject related to hemispheric differences? Drawing from the Pribram and McGuin-
ness (1975) formulation of attentional control in the brain, Tucker and Williamson(1984) differentiated between an active attentional system controlling motor readi-
ness and a receptive attentional system controlling perceptual responsivity. Hemi-
spheric asymmetries have been observed in tasks that appeal to either of both
systems. The left hemisphere was found to be linked to an active, vigilant attentional
mode (Dimond & Beaumont, 1971, 1973; Kinsbourne, 1974). In the experiments by
Dimond and Beaumond, subjects showed a right visual field (RVF) superiority for a
task that required them to maintain attention to respond to an unwarned stimulus.
Attentional tasks that do not require the vigilance of the motor readiness system maybe performed better by the right hemisphere (Heilman, 1979; Heilman & Van Den
Abell, 1980; Mesulam, 1981; Semmes, 1968). Heilman and Van Den Abell observed
a significant asymmetry in the facilitation of reaction speed by laterally presented
warning stimuli, with a superior performance following left visual field (LVF)
warning stimuli. Assuming that a stop task includes both a stop component
(maintaining vigilance to respond to unwarned stop signals) and a go component
(producing orienting responses to warning stimuli and discriminating between sub-
sequent go signals), we hypothesize that the former component requires the active,
M. Van der Schoot et al. / Acta Psychologica 112 (2003) 279–295 281
left-lateralized, attentional mode and that the latter component calls for the recep-
tive, right-lateralized, attentional mode. The present study is focused on the first hy-
pothesis.
1.2. Activation and arousal
To gain insight into the possible operation of left-lateralized attentional processes
during stop task performance, we elaborate on the basic neural control systems that
are believed to be involved in active and receptive attention: activation and arousal
(see Pribram & McGuinness, 1975). Arousal is defined in terms of phasic physiolog-
ical responses to input. Activation is defined in terms of tonic physiological readiness
to respond. Pribram and McGuinness� formulation is founded on the distinct neural
circuits that underlie both attentional control systems. Arousal is regulated by thenorepinephrine and serotonine pathways that spring from brainstem nuclei and in-
nervate widespread brain areas to support alertness and the brain�s responsivity to
perceptual input (McGuinness & Pribram, 1980; Tucker & Williamson, 1984). Acti-
vation is hypothesized to increase neural activity to maintain a tonic readiness for
action. It is thought to be regulated by dopamine pathways from the substantia nigra
combined with cholinergic influences on the basal ganglia of the extrapyramidal
motor system (McGuinness & Pribram, 1980). Attention directed by the activation
system is more internally controlled and more integral to vigilance and motoroperations than attention directed by the arousal system. It is important to recognize
that the neurotransmitter pathways underlying activation have been found to be
asymmetric in their distribution and function. Glick, Ross, and Hough (1982)
showed that the levels of dopamine and choline acetyltransferase, an index of acet-
ylcholine activity, are higher in the left than in the right basal ganglia. PET scan in-
spection additionally demonstrated a similar asymmetry in the concentration of
dopamine receptors (Wagner et al., 1983). Kooistra and Heilman (1988) showed that
especially the globus pallidus appears to be a nucleus with significant left-laterality.Given the assumption that the stop component of a stop task demands that sub-
jects appeal to the left-lateralized activation system, we predict that the left hemi-
sphere will be favored in the present experiment. That is, subjects are not only
assumed to actively monitor for stop signals while being engaged in the go task rou-
tine, they are also expected to display a RVF-preference for them.
1.3. The visual half field procedure
In the present study, hemispheric differences in stop task performance were exam-
ined by using the VHF procedure: sensory input and motor response were restricted
to one hemisphere, and then speed and accuracy were measured in all possible pair-
ings. In the case of visual input, LVF information will project first to the right hemi-
sphere, and vice versa. Likewise, motor responses are contralaterally controlled.
Hence, latency differences between conditions in which stimulus perception and
response generation are controlled by the same hemisphere (uncrossed: LVF-LH
(left hand), RVF-RH (right hand)) and conditions in which stimulus perception and
282 M. Van der Schoot et al. / Acta Psychologica 112 (2003) 279–295
response generation are controlled by the opposite hemispheres (crossed: LVF-RH,
RVF-LH) reflect the time it takes the motor signal and, possibly, the sensory signal
to cross the corpus callosum. Whether there is a delay in response due to the cross-
callosal transfer of the laterally presented visual information depends on the model
one departs from. Two standpoints can be taken. First, the callosal relay model (Zai-del, 1983, 1985) presupposes that one hemisphere is unable to process the informa-
tion at all, leaving the other to be exclusively specialized for the task. Therefore, the
callosal transmission of the stimulus from the competent to the incompetent hemi-
sphere is included in the laterality effect. Second, the direct access model (Zaidel,
1983, 1985) assumes that both hemispheres are able to process the information
but one hemisphere may use less efficient strategies.
Since previous RT research (Davis & Schmit, 1971; Filbey & Gazzaniga, 1969;
Geffen, Bradshaw, & Wallace, 1971) revealed that the detection of laterally presentedvisual stimuli, exempting specific identification and analysis, is not sufficient to in-
duce RT differences between the hemispheres, we decided to adopt the direct access
interpretation of laterality effects as our working model. That is, when an inhibitory
response is required with either the right or left hand, as in the present experiment,
no crossing of information is assumed to emerge according to which hemisphere
originally receives the stop signal. As a consequence, laterality effects that cannot
be due to the cross-callosal transfer of the motor command from the input-receiving
hemisphere to the motor cortex of the hemisphere controlling the responding handnecessarily indicate a hemispheric difference in stop task competence. The main goal
of the present study is to examine the hypothesis that there is a left-hemispheric dom-
inance for stop task performance.
2. Method
2.1. Subjects
Eighteen students (10 males, 8 females, between 18 and 26 years of age, 8 left-
handed, 10 right-handed) were paid about €8 per hour for participation in the study.
All were healthy and had a normal or corrected-to-normal vision.
2.2. Apparatus
The stimuli were presented on a NEC Multisync 5FG monitor positioned 50 cmfrom the subject�s eyes. Subjects were lying on a couch in a dimly illuminated cubicle.
A response box was positioned on either side of the couch.
2.3. Task and stimuli
2.3.1. Primary task
Each trial began with the presentation of a square warning stimulus
ð1:40 cm� 1:40 cmÞ for 500 ms. It was followed by the primary task stimulus, which
M. Van der Schoot et al. / Acta Psychologica 112 (2003) 279–295 283
was displayed for 125 ms. After the imperative signal was extinguished, the screen
went blank for a 2375 ms intertrial interval. The stimuli for the primary task were
the uppercase letters X and O. Each letter was 1.80 cm wide and 2.90 cm high. Both
the warning stimuli and the stimulus letters were presented in black-on-white and
in the center of the screen. In the primary choice RT task a capital X required a re-sponse with the index finger of the right or left hand and a capital O required a re-
sponse with the middle finger of the same hand. We counterbalanced the hand used
so that half the subjects used the right hand (RH) first and half used the left hand
(LH) first. Across the right-hand-first-subjects and left-hand-first-subjects, mapping
of letters onto fingers was also counterbalanced.
Hemifield laterality experiments necessitate fixation. Therefore, we employed a
short primary task stimulus duration. This forced subjects to fix their eyes on the
center of the screen since a slight gaze deviation from the middle at the momentof presentation could lead to missing a signal. To further prevent subjects from scan-
ning – besides repeatedly instructing them to fixate their eyes on the center of the
screen – the 500-ms warning stimulus presently served as a signal for fixation along
with its warning function. In addition, a central fixation point (a little black �þ� sym-
bol) was displayed whenever the screen went blank.
2.3.2. Stopping task
A stop signal was presented on 25% of the trials, occurring equally often at eachof six stop signal delays, and equally often with an X and an O. The sequence of pri-
mary task stimuli, stop signals, and stop signal delays was pseudo-randomized. The
stop signal was a red circle (3.60-cm diameter) exposed for 200 ms. It was presented
in the center of the visual field (CVF), in the LVF, or in the RVF. The lateral stop
stimuli were placed 14.00 cm away from the center of the screen. The visual angle
between lateral and central stimuli was 15.6�.
2.4. Design and procedure
Subjects participated in two sessions either consistingof nine test blocksof 144 trials.
After the first session, the response handhad tobe changed.Apractice blockof 48 trials
preceded each session. The test blocks were arranged in groups of three, and a short
break was scheduled after each part. In between sessions, subjects took a longer rest.
In every block, 36 stop signals were presented: two CVFs (1 after an X and 1 after
an O), two LVFs (1 after an X and 1 after an O) and two RVFs (1 after an X and 1
after an O) at each stop signal delay. Consequently, in all six resulting conditions(CVF/RH, LVF/RH, RVF/RH, CVF/LH, LVF/LH, RVF/LH), a total of 18 stop
signals occurred at each delay.
Under the assumption that inhibition functions are linear, variation in mean pri-
mary task reaction time (MRT) will affect the intercept, i.e. the height, of the inhi-
bition function. To take account of differences between subjects in mean reaction
time (MRT) and strategy (e.g., a subject may have delayed a response in an attempt
to enhance the probability of inhibiting), stop signal delay was defined as the inter-
val between the onset of the stop signal and the expected MRT (i.e., MRT-delay). In
284 M. Van der Schoot et al. / Acta Psychologica 112 (2003) 279–295
order to set delays relative to MRT, alterations of MRT were tracked block-to-
block; that is, the MRT was calculated after each block of trials whereupon stop sig-
nal delays were adapted to it in the following block. More specifically, the MRT in
block n was used to set the stop signal delays in block nþ 1 equal to MRT-500,
MRT-400, MRT-300, MRT-200, MRT-100 and MRT-0 ms. The stop signal delaysin the first test block of each session were set relative to the MRT of the practice
block preceding it. Whereas it is almost impossible to inhibit a response to a stop
signal presented at the subject�s MRT (MRT-0), the more a stop signal delay approx-
imates zero (MRT-500), the greater the probability of inhibition. The intermediate
delays trace out the inhibition function between these extremes.
No negative delays were employed. In practice, this meant that the primary stim-
ulus and the stop signal were presented simultaneously in the MRT-500 condition (in
block n) in case the MRT was less than 500 ms (in block n� 1).Instructions for the primary choice reaction time task were given first. Subjects
were instructed to respond as fast and accuratly as possible. Then, the subjects were
instructed to try to withhold the response whenever a stop signal occurred. It was
clarified that stop signal delays were varied by the experimenter in such a way that
sometimes stop signals would be presented so late that it would be extremely difficult
to suppress the primary response. Finally, subjects were explicitly instructed not to
delay their responses to the go task in order to improve their odds of stopping.
2.5. Data analysis
2.5.1. Primary task measures
For each subject, the following primary task measures were derived from the no-
stop signal trials: mean reaction time (MRT), standard deviation (SD), percentage of
errors (pressing with the X-finger when O was presented or vice versa) and percent-
age of omissions (nonresponses).
2.5.2. Inhibition function
Inhibition functions were generated by computing the proportion of stop signal
trials, at each stop signal delay, on which subjects successfully inhibited their pri-
mary response (i.e. P ðInhibitÞ). Effects of all possible LVF/CVF/RVF-RH/LH pair-
ings on the probability of inhibition (over all delays) were examined in analyses of
variance (ANOVA) with repeated measures across delay. An interaction between
delay and experimental condition would then demonstrate differences in the shape
of inhibition functions.
2.5.3. SSRT
To explore more specific deficits in the stopping process, mean SSRTs were esti-
mated for each individual in each VHF/response hand condition by means of the fol-
lowing procedure. The point in time at which the stop process finishes was computed
from the data by setting it equal to the nth RT of the rank ordered go task RTs,
where n is the number of RTs that make up the distribution multiplied by the
observed P ðRespondÞ (¼ 1� PðInhibitÞ). Subtracting stop signal delay from this
M. Van der Schoot et al. / Acta Psychologica 112 (2003) 279–295 285
value yielded the SSRT. It is important to realize that this procedure was carried out
for each stop signal delay employed in the experiment. The mean SSRT was then ob-
tained by averaging over stop signal delays (see Logan & Cowan, 1984, for an exten-
sive, and more theoretical, discussion on the SSRT estimation procedure). We realize
that this method assumes that SSRT is a constant. However, Logan and Cowan(1984) showed that estimates obtained in this way approximate the estimates of
SSRT obtained by more advanced methods that treat SSRT as a random variable.
The effects of visual field and response hand on SSRT were examined in ANOVA
and subsequent paired-samples t-tests.
2.5.4. Estimating SSRT at the central stop signal delay
Band, Van der Molen, and Logan (2003) found the estimation of SSRT to be
most reliable around the central delay, where subjects have a 50% chance of success-ful inhibition. In a simulation study, Band et al. showed that the impact of using
noncentral delays on the estimation of SSRT is considerable. Especially the SSRTs
that are calculated at stop signal delays that yield a lower-than-50% inhibition rate
underestimate the true latency of the stop process (see also Logan & Burkell, 1986).
The reason for this is that there is variability in SSRT, and that at the late delays,
only the faster stop processes are able to win the race against the go processes. This
is unfortunate because we are interested in the mean SSRT. Since the classical
method mentioned above assumes that SSRT is a constant and since its estimationprocedure takes into account the P ðInhibitionÞ at each stop signal delay, we decided
to also estimate SSRT at the delay that would yield a 0.5 inhibition rate. The best
possible estimate of the central delay was obtained by fitting a regression line to
the most central observations of the inhibition function (MRT-500, MRT-400 and
MRT-300) and entering 0.5 in the computed regression equation (it should be recog-
nized that in some cases this procedure yielded a negative 50%-inhibition delay).
SSRT was then calculated by subtracting the central delay from the point in time
at which the stop process finished. The stop process finish time could be computedfrom the data by setting it equal to the median of the go task RTs.
3. Results
3.1. Primary task measures
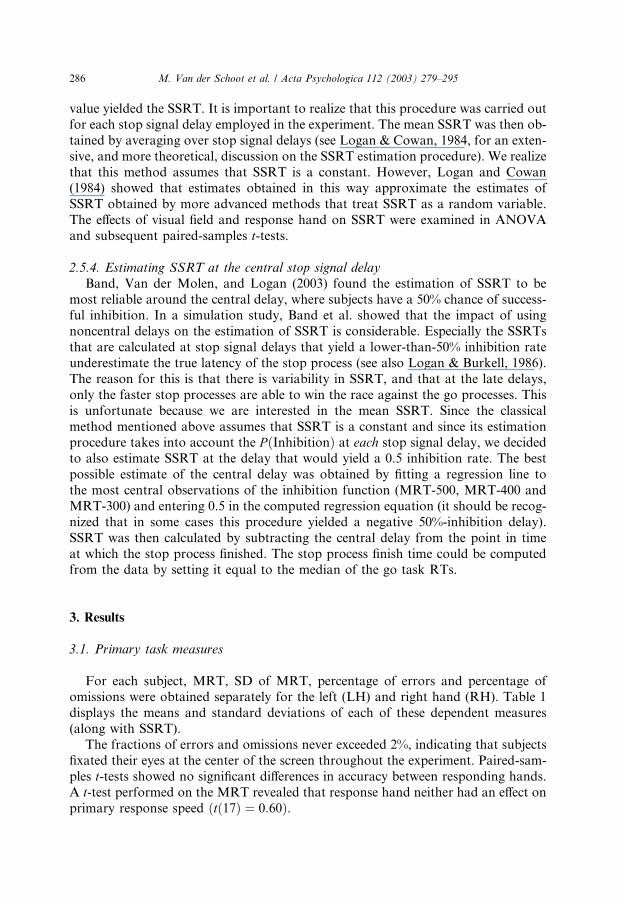
For each subject, MRT, SD of MRT, percentage of errors and percentage ofomissions were obtained separately for the left (LH) and right hand (RH). Table 1
displays the means and standard deviations of each of these dependent measures
(along with SSRT).
The fractions of errors and omissions never exceeded 2%, indicating that subjects
fixated their eyes at the center of the screen throughout the experiment. Paired-sam-
ples t-tests showed no significant differences in accuracy between responding hands.
A t-test performed on the MRT revealed that response hand neither had an effect on
primary response speed ðtð17Þ ¼ 0:60Þ.
286 M. Van der Schoot et al. / Acta Psychologica 112 (2003) 279–295
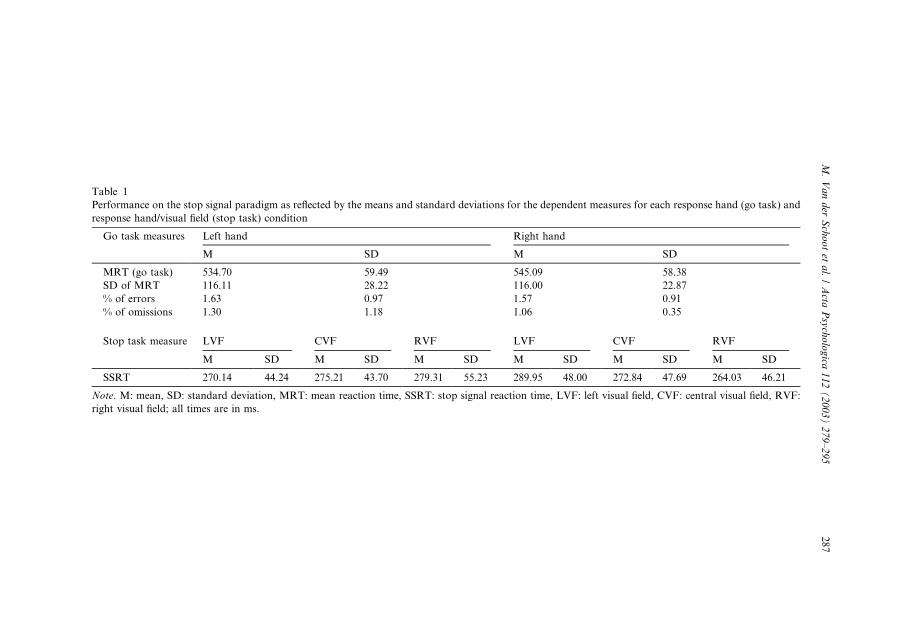
Table 1
Performance on the stop signal paradigm as reflected by the means and standard deviations for the dependent measures for each response hand (go task) and
response hand/visual field (stop task) condition
Go task measures Left hand Right hand
M SD M SD
MRT (go task) 534.70 59.49 545.09 58.38
SD of MRT 116.11 28.22 116.00 22.87
% of errors 1.63 0.97 1.57 0.91
% of omissions 1.30 1.18 1.06 0.35
Stop task measure LVF CVF RVF LVF CVF RVF
M SD M SD M SD M SD M SD M SD
SSRT 270.14 44.24 275.21 43.70 279.31 55.23 289.95 48.00 272.84 47.69 264.03 46.21
Note. M: mean, SD: standard deviation, MRT: mean reaction time, SSRT: stop signal reaction time, LVF: left visual field, CVF: central visual field, RVF:
right visual field; all times are in ms.
M.VanderSchootetal./Acta
Psychologica
112(2003)279–295
287
3.2. Inhibition function
Table 2 presents the mean probability of inhibiting a response to the primary task
at each stop signal delay for each visual field/response hand condition.
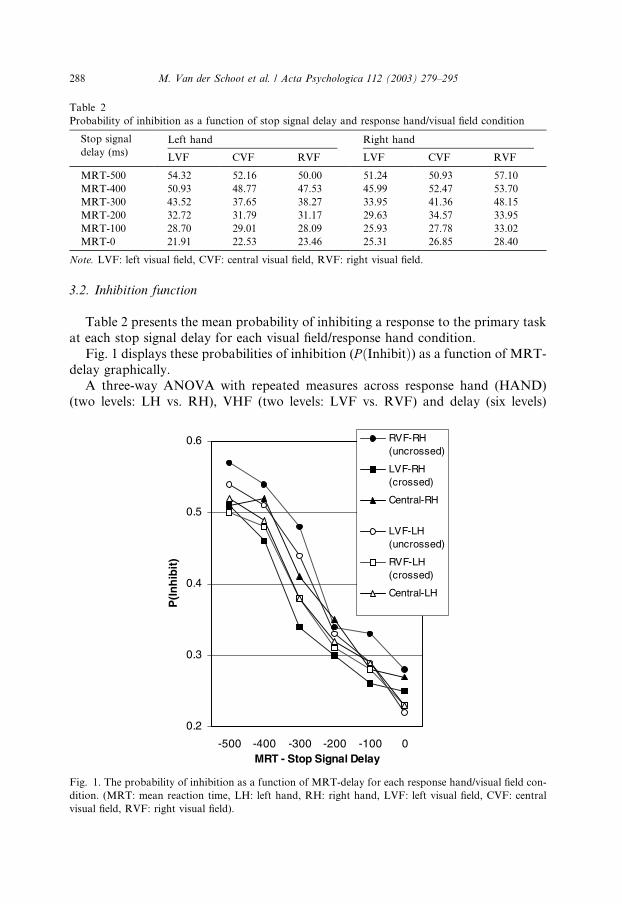
Fig. 1 displays these probabilities of inhibition (P ðInhibitÞ) as a function of MRT-
delay graphically.
A three-way ANOVA with repeated measures across response hand (HAND)
(two levels: LH vs. RH), VHF (two levels: LVF vs. RVF) and delay (six levels)
Table 2
Probability of inhibition as a function of stop signal delay and response hand/visual field condition
Stop signal
delay (ms)Left hand Right hand
LVF CVF RVF LVF CVF RVF
MRT-500 54.32 52.16 50.00 51.24 50.93 57.10
MRT-400 50.93 48.77 47.53 45.99 52.47 53.70
MRT-300 43.52 37.65 38.27 33.95 41.36 48.15
MRT-200 32.72 31.79 31.17 29.63 34.57 33.95
MRT-100 28.70 29.01 28.09 25.93 27.78 33.02
MRT-0 21.91 22.53 23.46 25.31 26.85 28.40
Note. LVF: left visual field, CVF: central visual field, RVF: right visual field.
Fig. 1. The probability of inhibition as a function of MRT-delay for each response hand/visual field con-
dition. (MRT: mean reaction time, LH: left hand, RH: right hand, LVF: left visual field, CVF: central
visual field, RVF: right visual field).
288 M. Van der Schoot et al. / Acta Psychologica 112 (2003) 279–295
was conducted for the probability of inhibition. As predicted by the race model, the
probability of inhibition increased significantly as stop signal delay decreased ðF ð5;85Þ ¼ 62:10, p < 0:0001Þ. There was a significant HAND� VHF interaction ðF ð1;17Þ ¼ 14:90, p < 0:001Þ, even though these factors did not interact with delay, nei-
ther separately (F ð5; 85Þ ¼ 0:33 and F ð5; 85Þ ¼ 0:27, respectively), nor in combina-tion ðF ð5; 85Þ ¼ 1:44Þ.
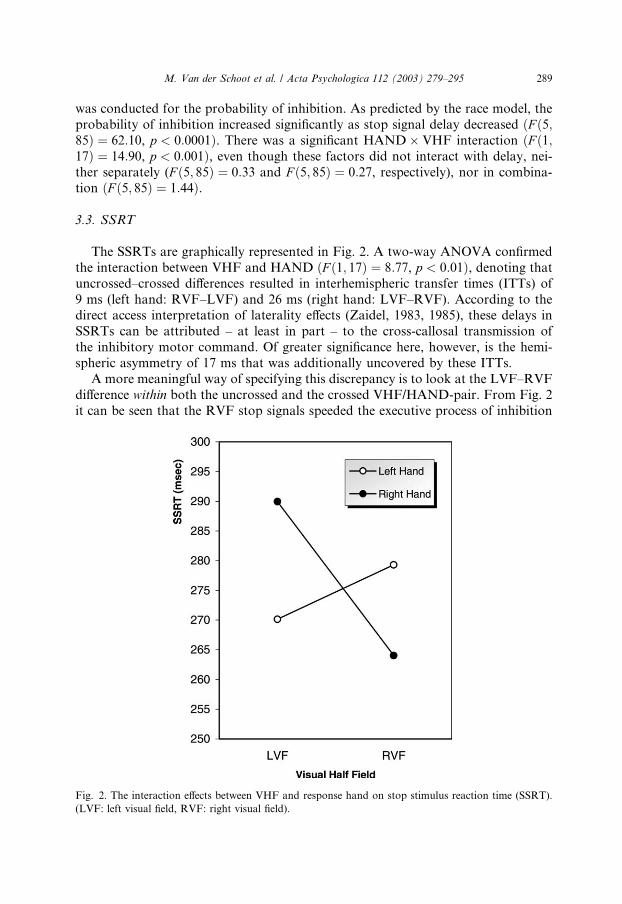
3.3. SSRT
The SSRTs are graphically represented in Fig. 2. A two-way ANOVA confirmed
the interaction between VHF and HAND ðF ð1; 17Þ ¼ 8:77, p < 0:01Þ, denoting that
uncrossed–crossed differences resulted in interhemispheric transfer times (ITTs) of
9 ms (left hand: RVF–LVF) and 26 ms (right hand: LVF–RVF). According to thedirect access interpretation of laterality effects (Zaidel, 1983, 1985), these delays in
SSRTs can be attributed – at least in part – to the cross-callosal transmission of
the inhibitory motor command. Of greater significance here, however, is the hemi-
spheric asymmetry of 17 ms that was additionally uncovered by these ITTs.
A more meaningful way of specifying this discrepancy is to look at the LVF–RVF
difference within both the uncrossed and the crossed VHF/HAND-pair. From Fig. 2
it can be seen that the RVF stop signals speeded the executive process of inhibition
Fig. 2. The interaction effects between VHF and response hand on stop stimulus reaction time (SSRT).
(LVF: left visual field, RVF: right visual field).
M. Van der Schoot et al. / Acta Psychologica 112 (2003) 279–295 289
with 6 and 11 ms, respectively, suggesting that, for the benefit of a fast stopping pro-
cess, stop signals need to be presented to the left hemisphere. Although not signifi-
cant within uncrossed and crossed VHF/HAND-pairings, the mere LVF vs. RVF
effect on stopping speed indirectly manifested itself through the pattern of VHF ef-
fects on left and right hand performance. Planned comparisons indicated that theVHF effect on SSRT was significant for the right hand ðtð17Þ ¼ 2:83, p < 0:05Þ,but not for the left hand ðtð17Þ ¼ 0:94Þ.
It should be noted that the additional LVF–RVF difference of the right hand as
compared to the left hand (17 ms) reflects the sum of the �pure� RVF-facilitation of
SSRT in an uncrossed (RVF/RH) and crossed (RVF/LH) arrangement: the former
adds 6 ms to the VHF effect of the right hand, the latter subtracts 11 ms from the
VHF effect of the left hand. Together, they result in the differential outcomes of
the above post hoc test conducted separately for the right hand (significant VHFeffect) and left hand (nonsignificant VHF effect).
3.4. Central delay-SSRT
The SSRTs that were obtained by the central delay approach were 456.39
ðSD ¼ 300:63Þ, 514.11 (326.15), 536.94 (314.69) and 396.61 (215.86) ms, respectively,
in the LVF/LH, RVF/LH, LVF/RH and RVF/RH condition. These SSRTs are
slower than those obtained by the traditional SSRT estimation procedure, and theabsolute differences in SSRT between the VHF/HAND conditions are inflated. Still,
the VHF�HAND interaction was only marginally significant ðF ð1; 17Þ ¼ 4:33,p < 0:06Þ. Probably, the interaction failed to reach conventional levels of significance
because the between-subject variability in central delay-SSRT was large. The reason
for this is that in subjects with low and flat inhibition functions the operating regres-
sion procedure yielded fairly negative 50%-inhibition delays. Since these delays were
added to the median of the primary task RTs so as to obtain the central delay-
SSRTs, it may be argued that these SSRTs overestimate the true latency of the stopprocess in subjects with low inhibitory capacity. In part, these overestimates may
also account for the relatively slow mean SSRTs obtained by the central delay ap-
proach.
Nevertheless, post hoc tests performed on the central delay-SSRTs confirmed
that – although not significant within uncrossed ðtð17Þ ¼ 0:79Þ and crossed
ðtð17Þ ¼ 0:22Þ VHF/HAND-pairings – the mere LVF vs. RVF effect on stopping
speed indirectly manifested itself through the pattern of VHF effects on left and right
hand performance. Post hoc t-tests indicated that the VHF effect on SSRT was sig-nificant for the right hand ðtð17Þ ¼ 2:21, p < 0:05Þ, but not for the left hand
ðtð17Þ ¼ 0:73Þ.
3.5. Handedness
To minimize the chance that the effects resulted, in part, from handedness (i.e., the
characteristic preference that individuals show for one or the other hand for per-
forming unimanual tasks), left-handed ðn ¼ 8Þ and right-handed ðn ¼ 10Þ subjects
290 M. Van der Schoot et al. / Acta Psychologica 112 (2003) 279–295
were equally represented in the experiment. Furthermore, the ANOVAs that were
conducted for the probability of inhibition and SSRT were repeated with handedness
as the between-subject factor. These analyses showed that there was neither a main
effect of hand-preference on the probability of inhibition ðF ð1; 16Þ ¼ 1:50Þ and SSRT
ðF ð1; 16Þ ¼ 1:93Þ, nor did this factor interact with any of the within-subject vari-ables. These results are supportive of previous findings that there is no motor asym-
metry for response acts as simple as button-pressing (Alegria & Bertelson, 1970;
Beaumont, 1974).
4. Discussion
The most important implications of the present experiment apply to the (asymme-try of) hemispheric engagement in stop task processing. As previously stated, the
two uncrossed conditions and the two crossed conditions were anticipated to gener-
ate divergent SSRTs only in case of differential hemispheric functioning. Whereas
differences between uncrossed and crossed sensorimotor routes simply reflect the an-
atomic restraints of interhemispheric transfer, differences within each contingency
can differentiate between balanced and unbalanced hemispheric involvement during
stop task performance. Balanced hemispheric involvement predicts a fully symmet-
rical field by hand interaction that can be accounted for on a mere anatomical basis.Unbalanced hemispheric involvement predicts a deviation from this pattern as a
hemispheric difference in stop task competence will �bend� the interaction in favor
of one or the other hemifield. In the present study, the results showed a slight
improvement of stop task performance for the RVF.
The left-hemispheric dominance manifested itself indirectly. That is, the hemifield
effects on inhibitory speed (SSRT) did not reach significance within equivalent field/
hand pairings (i.e. uncrossed and crossed routes). However, when added up in the
subsequent post hoc tests, the within-route effects made the hemifield difference sig-nificant for the right hand, but not for the left hand. The RVF advantage within the
uncrossed field/hand pairing enlarged the RH-VHF effect and the RVF advantage
within the crossed field/hand pairing reduced the LH-VHF effect. The finding that
the VHF effect was significant for the right hand but not for the left hand reflects
the hypothesized left-hemispheric superiority for motor stopping in the stop signal
paradigm.
Accordingly, empirical support has been provided for the notion that the stop
task is actually composed of a go and stop component, the latter of which appealsto an active, left-lateralized, attentional system controlling motor readiness (see
Tucker & Williamson, 1984). It was reasoned that a stop task requires such a mode
of attention because subjects actively monitor for stop stimuli while being engaged in
its go routine (see also Douglas, 1999; Kramer et al., 1994; Oosterlaan & Sergeant,
1995).
In the introduction of this paper, it has been demonstrated that the hemispheric
specialization for active and receptive attention is equivalent to the asymmetry
observed in the neural substrates of the two major attentional control systems
M. Van der Schoot et al. / Acta Psychologica 112 (2003) 279–295 291
characterized by Pribram and McGuinness (1975). The arousal system produces a
phasic response to input and is found to be right-lateralized. The activation system
maintains a tonic readiness to respond, and the function and distribution of its un-
derlying neurotransmitter circuits are found to be left-lateralized (e.g., Glick et al.,
1982; Kooistra & Heilman, 1988; Wagner et al., 1983). The idea that subjects appealto this system during stop task performance is supported by the RVF advantage dis-
closed by the present findings.
We argue that because of the current experimental design, the Simon effect (Si-
mon, 1968, 1969, 1990) may have inflated the differences between uncrossed and
crossed arrangements of response hand and side of stop stimulus presentation.
The Simon effect represents the impact of compatibility between task-irrelevant stim-
ulus location and response location (see for a review Proctor & Reeve, 1990). When
left stimuli are responded to by pressing a left response key and right stimuli are re-sponded to by pressing a right response key, performance is better (in terms of RT
and error rates) than when left stimuli are paired with right responses and vice versa.
It should be emphasized that such phenomena occur even when the stimulus position
is completely irrelevant for the task. Usually, the Simon effect has been associated
with response selection. Simon (1969) speculated about an automatic tendency to re-
act toward stimulus location. Interestingly, Hommel (1995) demonstrated that the
Simon effect can occur under conditions comparable to those used in the present
study. He used arrows, pointing either to the left or to the right, that required a spa-tially corresponding reaction. Briefly, on stimulus presentation, subjects received a
second stimulus appearing randomly to the left or the right side. This was a green
Go or a red No-go signal, indicating whether the precued response should be per-
formed or suppressed. The location of the second color-stimulus was irrelevant (like
our hemifield stop signals) but still caused a Simon effect. Being focused on �go� RT
and proportion of errors, Hommel only related the Simon effect to the location of the
Go signal. It is conceivable, however, that the participants would have displayed an
ideomotor tendency to respond toward the source of stimulation in case of inhibitoryresponses to laterally presented No-go signals as well. It may be easier, in other
words, to suppress a right hand response after a right stop signal and a left hand re-
sponse after a left stop signal because of a spatial stimulus–response compatibility,
exerting a facilitatory influence on stopping speed and accuracy. Although the un-
crossed/crossed effects on inhibition function and SSRT should be interpreted pri-
marily in anatomical terms, a contribution of the Simon effect cannot be ruled out
in the present experiment.
Significantly, the above proposition is supported by the data. It was found thatinhibition functions tended to be higher when stop signals were displaced from the
center of the screen to the side of the active hand ðF ð1; 17Þ ¼ 4:36, p < 0:06Þ. Thatis, left stop signals facilitate left hand response suppression and right stop signals fa-
cilitate right hand response suppression, both in comparison with central stop sig-
nals. Since stimuli presented in the CVF equally innervate both hemispheres, these
effects cannot be explained in anatomical terms. Accordingly, another mechanism
has to be in operation. In view of the above, the Simon effect appears to be a likely
candidate. There may be an alternative explanation for the results, however. Since
292 M. Van der Schoot et al. / Acta Psychologica 112 (2003) 279–295
subjects used only the right hand or only the left hand in each block of trials, re-
sponse preparation may have shifted attention to the side of preparation. As a con-
sequence, this may have positively affected the stop process by facilitating the
detection of the stop signal.
Acknowledgement
We wish to thank Guido Band for his helpful comments on earlier versions of this
article.
References
Alegria, J., & Bertelson, P. (1970). Time uncertainty, number of alternatives and particular signal-response
pairs as determinants of choice reaction time. In A. F. Sanders (Ed.), Attention and performance III.
Amsterdam: North-Holland.
Band, G. P. H., & Van Boxtel, G. J. M. (1999). Inhibitory control in stop paradigms: review and
reinterpretation of neural mechanisms. Acta Psychologica, 101, 179–211.
Band, G. P. H., Van der Molen, M. W., & Logan, G. D. (2003). Horse-race simulations of the stop-signal
paradigm. Acta Psychologica, 112, 105–142.
Beaumont, J. G. (1974). Handedness and hemispheric function. In S. J. Dimond & J. G. Beaumont (Eds.),
Hemispheric function in the human brain. London: Elek Science.
Bedard, A. C., Nichols, S., Barbosa, J. A., Schachar, R. J., Logan, G. D., & Tannock, R. (2002). The
development of selective inhibitory control across the life span. Developmental Neuropsychology, 21,
93–111.
Bradshaw, J. L., & Nettleton, N. C. (1981). The nature of hemispheric specialization in man. The
Behavioral and Brain Sciences, 4, 51–91.
Davis, R., & Schmit, V. (1971). Timing the transfer of information between hemispheres in man. Acta
Psychologica, 35, 335–346.
De Jong, R., Coles, M. G. H., Logan, G. D., & Gratton, G. (1990). In search of the point of no return: The
control of response processes. Journal of Experimental Psychology: Human Perception and Performance,
16(1), 164–182.
Dimond, S. J., & Beaumont, J. G. (1971). Hemisphere function and vigilance. Quarterly Journal of
Experimental Psychology, 23, 443–448.
Dimond, S. J., & Beaumont, J. G. (1973). Differences in the vigilance performance of the right and left
hemispheres. Cortex, 9, 259–265.
Douglas, V. I. (1999). Cognitive control processes in attention-deficit/hyperactivity disorder. In H. C.
Quay & A. E. Hogan (Eds.), Handbook of disruptive behavior disorders. New York: Kluwer Academic/
Plenum Publishers.
Filbey, R. A., & Gazzaniga, M. S. (1969). Splitting the normal brain with reaction time. Psychonomic
Science, 17, 335–336.
Geffen, G., Bradshaw, J. L., & Wallace, G. (1971). Interhemispheric effects on reaction time to verbal and
nonverbal visual stimuli. Journal of Experimental Psychology, 87, 415–422.
Glick, S. D., Ross, D. A., & Hough, L. B. (1982). Lateral asymmetry of neurotransmitters in human brain.
Brain Research, 234, 53–63.
Heilman, K. M. (1979). Neglect and related disorders. In K. M. Heilman & E. Valenstein (Eds.), Clinical
Neuropsychology. New York: Oxford University Press.
Heilman, K., & Van Den Abell, T. (1980). Right hemisphere dominance for attention: the mechanism
underlying hemispheric asymmetry of inattention. Neurology, 30, 327–330.
M. Van der Schoot et al. / Acta Psychologica 112 (2003) 279–295 293
Hommel, B. (1995). Stimulus–response compatibility and the Simon effect: toward an empirical
clarification. Journal of Experimental Psychology: Human Perception and Performance, 21(4), 764–775.
Kinsbourne, M. (1974). Mechanisms of hemispheric interaction in man. In M. Kinsbourne & W. L. Smith
(Eds.), Hemispheric disconnection and cerebral function. Springfield, IL: Charles C. Thomas.
Kooistra, C. A., & Heilman, K. M. (1988). Motor dominance and the lateral asymmetry of the globus
pallidus. Neurology, 38(3), 388–390.
Kramer, A. F., Humphrey, D. G., Larish, J. F., Logan, G. G., & Strayer, D. L. (1994). Aging and
inhibition: beyond a unitary view of inhibitory processing in attention. Psychology and Aging, 9(4),
491–512.
Logan, G. D., & Burkell, J. (1986). Dependence and independence in responding to double stimulation: a
comparison of stop, change and dual-task paradigms. Journal of Experimental Psychology: Human
Perception and Performance, 12(4), 549–563.
Logan, G. D., & Cowan, W. B. (1984). On the ability to inhibit thought and action: a theory of an act of
control. Psychological Review, 91(3), 295–327.
Logan, G. D., Schachar, R. J., & Tannock, R. (1997). Impulsivity and inhibitory control. Psychological
Science, 8(1), 60–64.
McGuinness, D., & Pribram, K. H. (1980). The neuropsychology of attention: emotional and motivational
controls. In M. C. Wittrock (Ed.), The brain and psychology. New York: Academic Press.
Mesulam, M. M. (1981). A cortical network for directed attention and unilateral neglect. Annals of
Neurology, 10, 309–325.
Oosterlaan, J., & Sergeant, J. A. (1995). Response choice and inhibition in ADHD, anxious and aggressive
children: The relationship between S–R compatibility and stop signal task. In J. A. Sergeant (Ed.),
European approaches to hyperkinetic disorder (pp. 225–240). Zurich, Switzerland: Fotorotar.
Overtoom, C. C. E., Kenemans, J. L., Verbaten, M. N., Kemmer, C., Van der Molen, M. W., Van
Engeland, H., Buitelaar, J. K., & Koelega, H. S. (2002). Inhibition in children with attention-deficit/
hyperactivity disorder: A psychophysiological study of the stop task. Biological Psychiatry, 51, 668–
676.
Pliszka, S. R., Liotti, M., & Woldorff, M. G. (2000). Inhibitory control in children with attention-deficit
hyperactivity disorder: event-related potentials identify the processing component and timing of an
impaired right-frontal response-inhibition mechanism. Biological Psychiatry, 48, 238–246.
Pribram, K. H., & McGuinness, D. (1975). Arousal, activation, and effort in the control of attention.
Psychological Review, 82, 116–149.
Proctor, R., & Reeve, T. G. (Eds.). (1990). Stimulus–response compatibility. Amsterdam: North-Holland.
Ridderinkhof, K. R., Band, G. P. H., & Logan, G. D. (1999). A study of adaptive behavior: effects of age
and irrelevant information on the ability to inhibit one�s actions. Acta Psychologica, 101, 315–337.Schachar, R. J., & Logan, G. D. (1990). Impulsivity and inhibitory control in normal development and
childhood psychopathology. Developmental Psychology, 26(5), 710–720.
Semmes, J. (1968). Hemispheric specialization: a possible clue to mechanism. Neuropsychologia, 6, 11–26.
Simon, J. R. (1968). Effect of ear stimulated on reaction time and movement time. Journal of Experimental
Psychology, 78(2), 344–346.
Simon, J. R. (1969). Reactions toward the source of stimulation. Journal of Experimental Psychology,
81(1), 174–176.
Simon, J. R. (1990). The effects of an irrelevant directional cue on human information processing. In R. W.
Proctor & T. G. Reeve (Eds.), Stimulus–response compatibility. Amsterdam: North-Holland.
Tucker, D. M., & Williamson, P. A. (1984). Asymmetric neural control in human self-regulation.
Psychological Review, 91(2), 185–215.
Van den Wildenberg, W. P. M., Van der Molen, M. W., & Logan, G. D. (2002). Reduced response
readiness delays stop signal inhibition. Acta Psychologica, 111, 155–169.
Van der Schoot, M., Licht, R., Horsley, T. M., & Sergeant, J. A. (in press). Fronto-central dysfunctions in
reading disability depend on sub-type: guessers but not spellers. Developmental Neuropsychology.
Van der Schoot, M., Licht, R., Horsley, T. M., & Sergeant, J. A. (submitted for publication). Effects of
stop signal modality, instruction and tracking method on inhibitory performance as determined by use
of the stop signal paradigm.
294 M. Van der Schoot et al. / Acta Psychologica 112 (2003) 279–295

Wagner, H. N., Burns, D. H., Dannals, R. F., Wong, D. F., Langstrom, B., Duelfer, T., Frost, J. J.,
Ravert, H. T., Links, J. M., Rosenbloom, S. B., Lucas, S. E., Kramer, A. V., & Kuhlar, M. J. (1983).
Imaging dopamine receptors in the human brain by positron tomography. Science, 221, 1264–
1266.
Williams, B. R., Ponesse, J. S., Schachar, R. J., Logan, G. D., & Tannock, R. (1999). Development of
inhibitory control across the life span. Developmental Psychology, 35, 205–213.
Zaidel, E. (1983). Disconnection syndrome as a model for laterality effects in the normal brain. In J. B.
Hellige (Ed.), Cerebral hemisphere asymmetry: method, theory, and application (pp. 95–151). New York:
Praeger Publishers.
Zaidel, E. (1985). Biological and psychological studies of hemispheric specialization: Introduction. In D.
F. Benson & E. Zaidel (Eds.), The dual brain: hemisphere specialization in humans (pp. 47–63). New
York/London: The Guilford Press.
M. Van der Schoot et al. / Acta Psychologica 112 (2003) 279–295 295
Related Documents