Hem nao, SOLOMON ISLANDS, tis taem Community Sector Program Report of the CSP Community Snapshot Volume 3 Appendix to main reports: Provincial Perspectives by David Lawrence With assistance from: Solomon Rakei Community Sector Program Honiara 2007

Welcome message from author
This document is posted to help you gain knowledge. Please leave a comment to let me know what you think about it! Share it to your friends and learn new things together.
Transcript
Hem nao, SOLOMON ISLANDS, tis taem
Community Sector Program
Report of the CSP Community Snapshot
Volume 3
Appendix to main reports:
Provincial Perspectives
by
David Lawrence
With assistance from:
Solomon Rakei
Community Sector Program
Honiara
2007
CSP Community Snapshot
Background to Main Reports
The CSP Community Snapshot was conceived as an effective tool for measuring longer termoutcomes and impacts of the program. It provided an opportunity to measure outcomes at theCSP Goal and Purpose level as well as providing an analysis of the link between performanceindicators for the various components, the various program activities, and program leveloutcomes monitoring.
The CSP Community Snapshot was designed to provide a picture of:
the current situation (2005-2006) in relation to community sector issues across allnine provinces;
data to support decision making in the provinces;
a methodology for tracking these changes over time, for example over 3 and/or 5years; and
a picture in 2010 of the impact of CSP.
The CSP Community Snapshot has been designed as one of the four tools of the Monitoringand Evaluation System. The key themes that underpin the CSP Community Snapshot includecommunities own perceptions of self-reliance, capacity and poverty; livelihood issues such asaccess to goods and services and well-being in terms of peace, security and the quality of life.The CSP Community Snapshot also provides data and analysis of interest to a wide variety ofstakeholders in the Solomon Islands and overseas.
Themes and Indicators
Key themes which underpinned the CSP Community Snapshot included:
A non-intrusive approach aimed at facilitating discussion about key issues butminimising the creation of expectations;
A replicable model of site selection, tool selection, and field implementation that canbe repeated at various stages of the Program;
The collection of data that will be used in a practical way to monitor and evaluate theimpact of CSP, and that avoids the collection of data that subsequently will not beused;
A focus on understanding communities own perceptions of self-reliance, livelihoods,capacity building, peace and security, networks and poverty.
Snapshot Survey Design and Implementation
The Community Snapshot commenced on 6 September 2005 with the mobilisation of theResearch Adviser (RA), David Hegarty, the Research Coordinator (RC), David Lawrence,
and the Field Coordinator (FC), Matthew Allen. Together with the former Project Director(Ken Marshall), a series of planning meetings were held in Honiara between 7 and 20September 2005 involving the CSP Team Leader and Long Term Advisers, and the ResearchAdviser, Research Coordinator and Field Coordinator. The Research Coordinator hadprepared a series of Village Survey Forms prior to arriving in Honiara. These forms werebased on the list of baseline indicators that had been earlier developed in consultation withthe CSP team in Honiara and provided by the team.
Survey Design
Using these draft survey documents as a guide, it was possible to workshop the survey outlinerapidly with members of the Honiara based staff. This was purposely planned to be anefficient, effective method of developing complex survey documents that reflected localissues, standard research methodology and the obvious constraints of working in a countrywith poor infrastructure and a limited pool of skilled researchers. After two intensiveworkshop periods, a final series of six draft village survey sheets was compiled. Buildingupon an earlier background paper, the planning sessions further developed and finalised themethodology and scope of the Community Snapshot.
The survey design was complex as the actual survey would be detailed and time consumingand analysis would require the manipulation of large amounts of data. As it was essentially abaseline survey some of the data collected was not be directly comparable with existinginformation. For this reason, a comprehensive but balanced series of Provincial Profiles wasconsidered to be essential. For the Field Coordinator it was also a logistically difficult projectas the success of the survey depended on the positive support of the CSP ProvincialFacilitators who already have a difficult task in implementing programs in the provinces.
The Community Snapshot design was to focus on a survey of 300 villages selected on a rangeof criteria from each of the nine provinces of the Solomon Islands. Because of the problemsfaced by statistical bias and the complexity of defining the nature and extend of a ‘village’ inan urban setting, Honiara was excluded from the Community Snapshot program. Thedecision to exclude Honiara was taken with the agreement of the Team Leader (SolomonIslands), the Project Director and the Research Adviser. For administrative purposes, theCommunity Snapshot was organised into four different regions:
1. Western and Choiseul.
2. Malaita
3. Guadalcanal and Central.
4. Makira, Temotu, Rennell-Bellona and Isabel.
It was estimated that 30 teams of three data collectors each, one mature male, one maturefemale and one junior researcher, either male or female, would be required to implement thesurvey in the maximum 42 days available before Christmas 2005. Based on this, it wasestimated that the final program would collect a maximum of 900 survey forms: 90 datacollectors working in 10 villages each or three focus group meetings held in 300 villages. Anextra team of three data collectors was used in Rennell-Bellona for logistical purposes, thusbringing the total number of teams to 31.
Between late September and early October 2005, four Community Snapshot Coordinators(one for each region) were appointed on the basis of submitted CVs and personal interviews.The Community Snapshot Coordinators were responsible for training the Data Collectors,coordinating fieldwork in the regions and for organisation of payment and supply ofequipment. The four Community Snapshot Coordinators were:
Western and Choiseul Provinces – Hazel Lulei
Malaita Province – Joe Rausi
Guadalcanal and Central Provinces – Hilda Kii
Makira, Temotu, Rennell-Bellona and Isabel Provinces – John Foimua
In mid October 2005, 300 villages were selected across the Solomon Islands that would bevisited by the 90 data collectors. At the same time that the villages were being chosen, CVsfrom potential data collectors were being received and coordinated by the CommunitySnapshot Coordinators responsible for those regions. In collaboration with the ProvincialFacilitators, the Community Snapshot Coordinators were responsible for the final choice ofdata collectors. This was completed by the end of October 2005.
Considerable support was given to the team by the Chief Statistician, Nicholas Gagahe, whowas able to provide accurate locations and population sizes for all villages across the country.The Statistics Office database was also accessible on a laptop and so it could be used during ameeting of all CSP Provincial Facilitators in Honiara. A complete set of village names,locations and general characteristics was completed in a timely manner. The work on villageselection was undertaken principally by the Field Coordinator.
In early November 2005, the Research Coordinator visited Auki in Malaita and assisted theCommunity Snapshot Coordinator for Malaita, Joe Rausi, at a training program for the DataCollectors from that island. The north Malaita team set off for the field on 3 November. Thetraining and mobilisation of all data collectors had commenced in the first week of Novemberand by mid-November all 31 survey teams were in the field.
The fieldwork phase was completed by mid-December. It should be noted, to their credit,that all teams completed the fieldwork before the 42 days allocated. In addition, datacollectors were instructed to collect village maps and seasonal calendars from each focusgroup meeting. This was also successfully completed.
Filemaker Pro 8 Database
In late November 2005, Filemaker Pro software was installed on the computers used for thedata entry work in the CSP office in Honiara. Filemaker Pro was chosen because the dataentry template could be constructed along the same lines as the original survey document.This made data entry easy and accurate. The database also automatically saves on everyentry and this was a key function when working in Honiara where power supply was irregularand power surges common. The database is highly flexible, it can be easily saved into other
formats and can be quickly exported and emailed. The original database can be quarantinedfor safety and other users can be supplied with copies without problems of corrupting theoriginal dataset. Mapping and sorting functions are also easily incorporated.
A data entry operator was employed under the supervision of the Field Coordinator and theResearch Coordinator. In late January 2006 Solomon Rakei was employed to complete thedata entry and assist with the creation of the seasonal calendar dataset. The NationalStatistics Office database of villages proved to be accurate. In conjunction with a listing ofall geographic features in the Solomon Islands it was possible to secure accurate GIScoordinates to all villages chosen for this study. The GIS coordinates were then added to theVillage Survey data during the final editing process. This collection of accurate GIScoordinates has made the production of maps relatively easy and inexpensive.
During the period of the field data collection, the Research Coordinator and the FieldCoordinator were able to visit Totongo, a village in East Guadalcanal, and observe a fieldcollection team in action. The experience was informative. It was also apparent that villagecommunities had a great many issues that they wished to discuss and welcomed theopportunity to participate in the Village Survey. In particular issues of security and stability,livelihoods and infrastructure remained high on the list of problem areas. Villagecommunities were vocal in expressing their opinions on the state of government services andtheir desire for a better quality of life.
Editing of the Database
The complex task of editing the entire database commenced in the first week of February2006 and was completed by the end of May 2006. Tasks included the editing and organisingof the Filemaker Pro database, collating and filing the Village Maps and Seasonal Calendarsand supervising the creation of the seasonal calendar project.
The preparation of provincial background reports (known as Provincial Profiles) byCommunity Snapshot Coordinators had been an on-going activity since September 2005 andthe draft versions of the profiles were completed by March 2006. Analysis of the databasecommenced in April 2006 and report writing was completed by August 2006.
Key Indicators
The two main elements of the Snapshot, the Provincial Profiles (see Volume 1) and theVillage Survey (Volume 2) were designed to capture information relating to five keyindicators which had been developed from the verifiable indicators in the Project DesignDocument (PDD) log frame. The five key indicators were:
1. Security and stability;
2. Livelihoods/Economic Well-being;
3. Basic Services/Health, Education and Welfare;
4. Decision-making;
5. Networking/Connecting outside the area;
The survey forms were based around, but did not specifically address the following issues.
1. Security/stability:o Permanent houses versus bush materials;o Number of businesses, variety /size;o Community groups and degree of participation;o Local court system, within village conflict resolution western and traditional;o Leadership effectiveness;o Willingness / confidence to use outside security systems;o Conflict: type, social, degree, resolution mechanism, what are the issues for tension;o Level of anxiety, fear, optimism, other perceptions; domestic violence;o Urban v rural youth opportunities / dynamics: marijuana, kwaso, gangs – issues;o Migration.
2. Rural Incomes (Livelihoods) Economic wellbeing:o Employment;o Business;o Private enterprise;o Diversity of production;o Quantity;o Involvement of young people;o Understanding of sustainability concepts;o Food security;o Number of household “luxury” items in the community / consumption indicator;o Size / type of weekly church offering;o Access to markets / transportation infrastructure;o Remittances – money and in-kind;o Environmental resources / pressure/degradation/availability;o Demonstration projects in bio-regions.

3. Access to Effective Basic Services:o Transport – what form, cost / time factor, seasonality;o Distance to institutions;o Education – level of enrolment, primary, secondary, vocational, RTC;o Health – RHC, Aid Post, clinics, medical supply;o Agricultural extension;o Administration (police, government, court, land officers);o Communications;o No of skilled individuals and range of skills in community (including traditional);o Government / NGO / Church/ private sector (providers) – services (formal / informal);o Frequency of visits by government extension staff.
4. Involvement in Decision Making:o Representation on community committees and involvement in decision making y
women, men and youtho Range of committees, House of Chiefs, Church, Women’s Groups – Level of activityo Level of participation by individuals in community activitieso House of chiefs and how it functionso Type of local form of government – implications for desegregating data by regiono Concepts – community dynamics, power, authority, legitimacy
5. Networks:o Level of in and out migrationo Information availability – radio, PFNet, newspapers, drama, telephoneso Residential status of elected members of parliamento Outreach programs by individuals, government institution, churcheso Knowledge / awareness of / access to service providerso Engagement with service providerso CBO / NGO presence and capacityo Frequency of use, how often do you have contact with service providerso Private sector engagement (also has to be considered in 1 and 4 as appropriate)
Village Survey Forms
The focus group questionnaire forms provided the bulk of the information which wasanalysed for the main report of the Community Snapshot. The questionnaire forms weredesigned to directly address the five key indicators listed above.
Following discussions with the CSP Team Leader and Long Term Advisers in Honiara inSeptember 2005, seven detailed survey forms were designed. The first form was a VillageInfrastructure List to be completed by the Data Collectors. This was to support the VillageMaps and Seasonal Calendars. This form did not contain any questions for the community.Its primary purpose was to be a cross-check with villager statements on infrastructure and toquantify and qualify the nature and extent of village services.
A second form, the Cover Sheet, was to be completed by the Data Collector recorded the typeof focus group meeting and project reference data. Of the 300 villages selected, 150 werechosen because they had previous CPRF or current CSP projects. The other 150 were chosenbecause they had no contact with either CPRF or CSP but may have had contact with otherdonor agencies. This form also contained information on the villagers’ knowledge of donorprojects and aid that had been successfully or unsuccessfully introduced into the community.
The first survey form contained detailed questions on Security and Stability; the secondfocussed on Livelihoods/Economic Well-being; the third on Basic Services/Health/Educationand Welfare; the fourth contained questions on Decision Making within the community andthe fifth and final survey form sought answers to questions on Networking/Connectingoutside the area. Copies of the village survey forms can be found in volume 2 of the mainreport.
The Village Survey
Organisational Structure
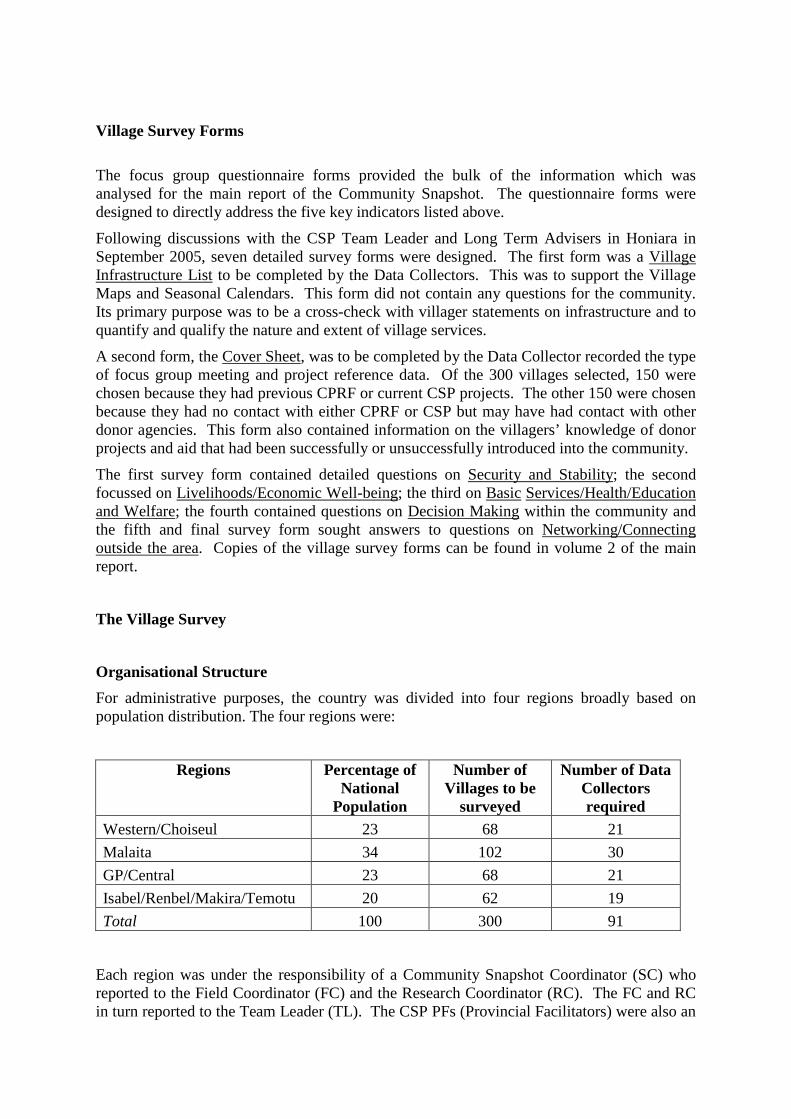
For administrative purposes, the country was divided into four regions broadly based onpopulation distribution. The four regions were:
Regions Percentage ofNational
Population
Number ofVillages to be
surveyed
Number of DataCollectorsrequired
Western/Choiseul 23 68 21
Malaita 34 102 30
GP/Central 23 68 21
Isabel/Renbel/Makira/Temotu 20 62 19
Total 100 300 91
Each region was under the responsibility of a Community Snapshot Coordinator (SC) whoreported to the Field Coordinator (FC) and the Research Coordinator (RC). The FC and RCin turn reported to the Team Leader (TL). The CSP PFs (Provincial Facilitators) were also an
integral part of the organisational structure of the Community Snapshot. The ProvincialFacilitators were responsible for providing logistical support for the teams of Data Collectors(Data Collectors) within their respective areas of responsibility. The Provincial Facilitatorsalso held primary responsibility for managing Community Snapshot financial arrangements atthe provincial level.
Selection of Survey Villages
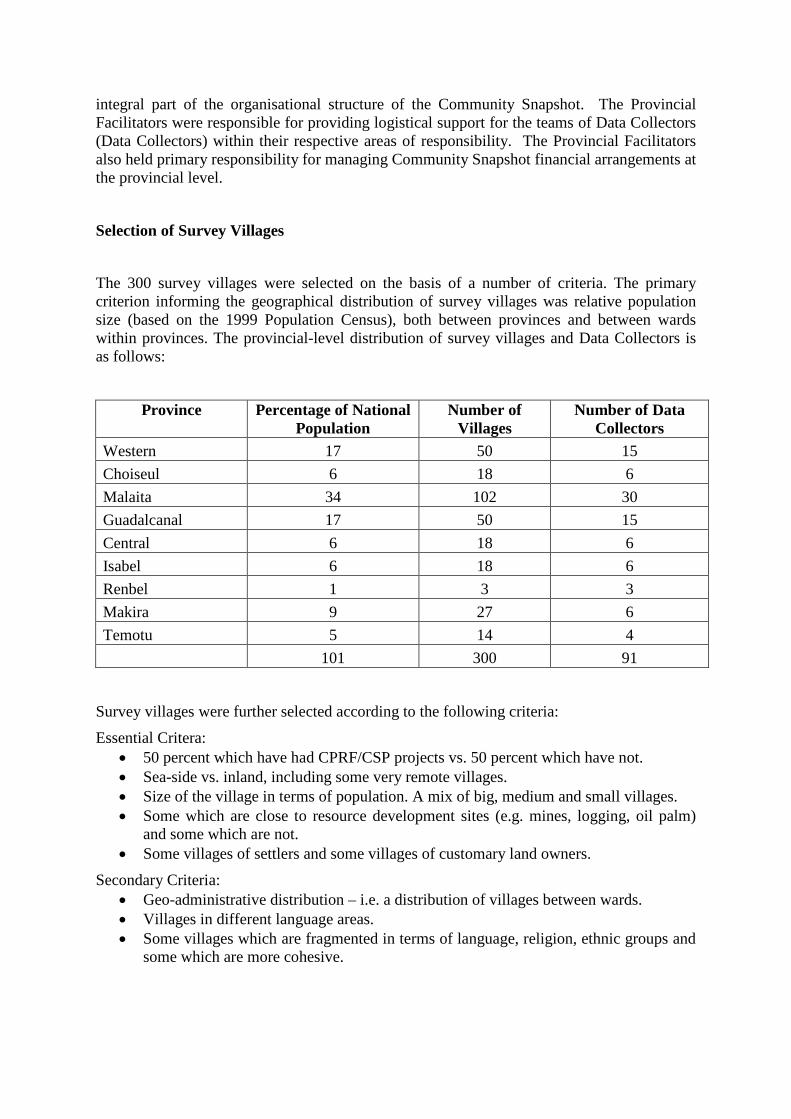
The 300 survey villages were selected on the basis of a number of criteria. The primarycriterion informing the geographical distribution of survey villages was relative populationsize (based on the 1999 Population Census), both between provinces and between wardswithin provinces. The provincial-level distribution of survey villages and Data Collectors isas follows:
Province Percentage of NationalPopulation
Number ofVillages
Number of DataCollectors
Western 17 50 15
Choiseul 6 18 6
Malaita 34 102 30
Guadalcanal 17 50 15
Central 6 18 6
Isabel 6 18 6
Renbel 1 3 3
Makira 9 27 6
Temotu 5 14 4
101 300 91
Survey villages were further selected according to the following criteria:
Essential Critera: 50 percent which have had CPRF/CSP projects vs. 50 percent which have not. Sea-side vs. inland, including some very remote villages. Size of the village in terms of population. A mix of big, medium and small villages. Some which are close to resource development sites (e.g. mines, logging, oil palm)
and some which are not. Some villages of settlers and some villages of customary land owners.
Secondary Criteria: Geo-administrative distribution – i.e. a distribution of villages between wards. Villages in different language areas. Some villages which are fragmented in terms of language, religion, ethnic groups and
some which are more cohesive.
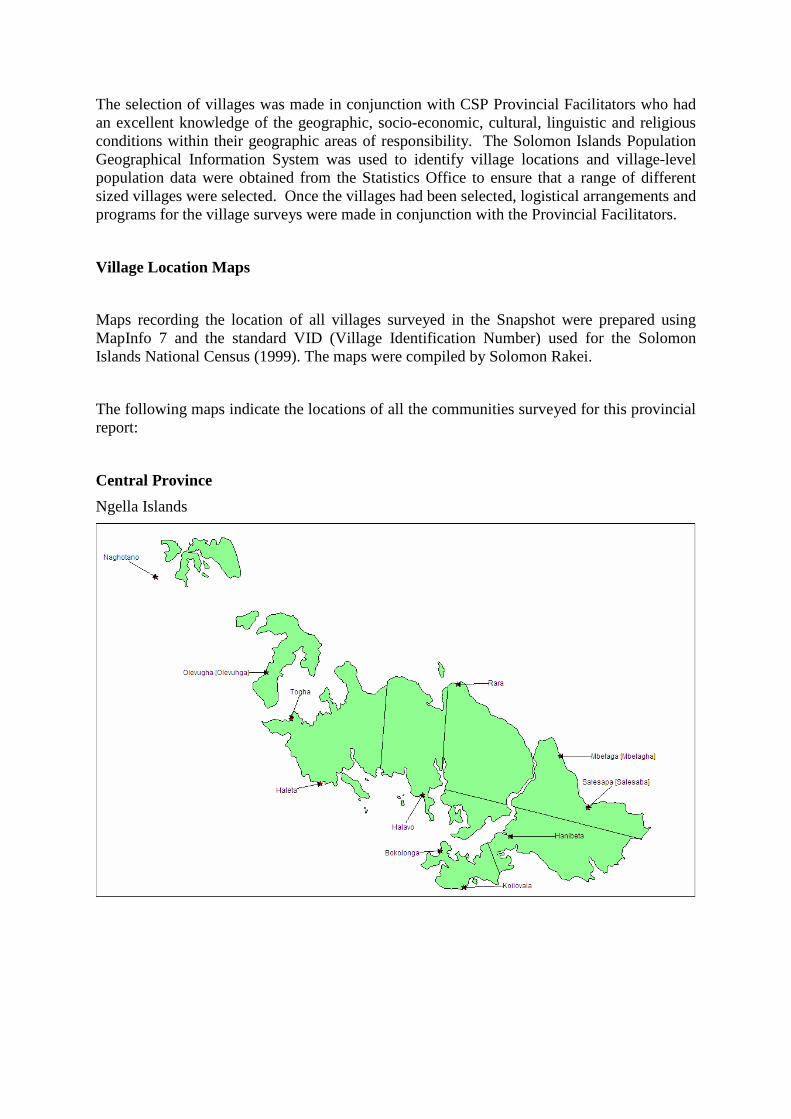
The selection of villages was made in conjunction with CSP Provincial Facilitators who hadan excellent knowledge of the geographic, socio-economic, cultural, linguistic and religiousconditions within their geographic areas of responsibility. The Solomon Islands PopulationGeographical Information System was used to identify village locations and village-levelpopulation data were obtained from the Statistics Office to ensure that a range of differentsized villages were selected. Once the villages had been selected, logistical arrangements andprograms for the village surveys were made in conjunction with the Provincial Facilitators.
Village Location Maps
Maps recording the location of all villages surveyed in the Snapshot were prepared usingMapInfo 7 and the standard VID (Village Identification Number) used for the SolomonIslands National Census (1999). The maps were compiled by Solomon Rakei.
The following maps indicate the locations of all the communities surveyed for this provincialreport:
Central Province
Ngella Islands
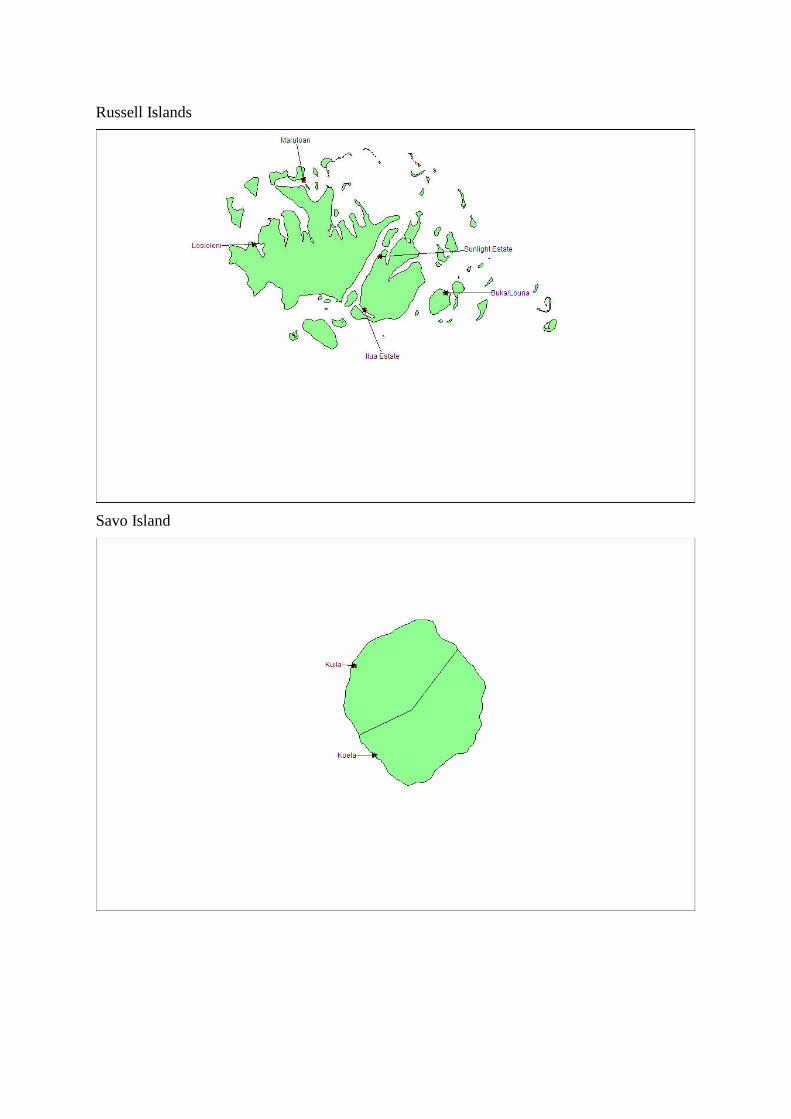
Russell Islands
Savo Island
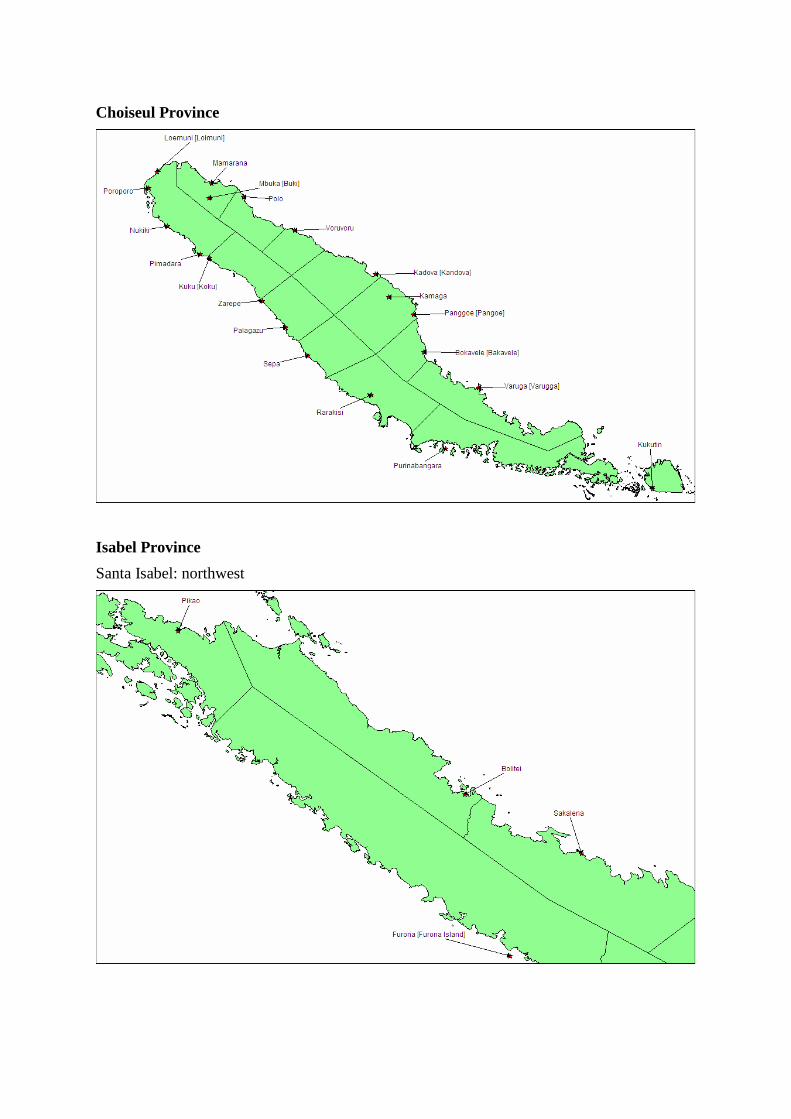
Choiseul Province
Isabel Province
Santa Isabel: northwest
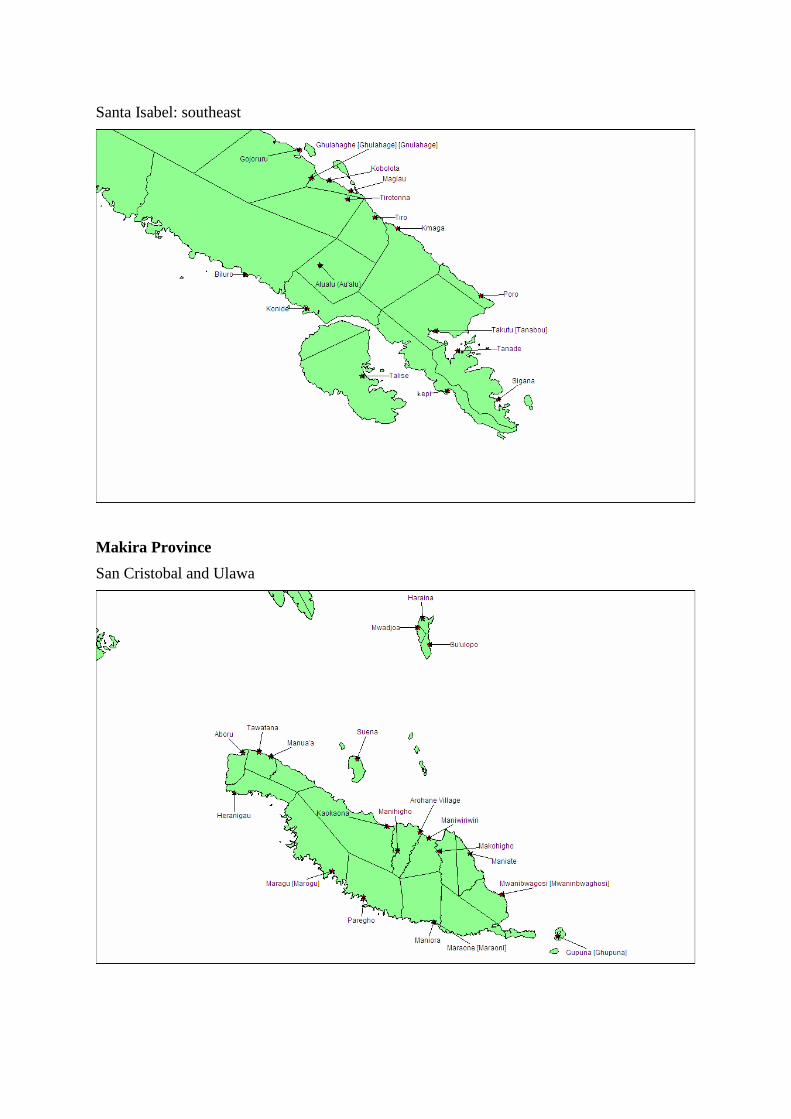
Santa Isabel: southeast
Makira Province
San Cristobal and Ulawa
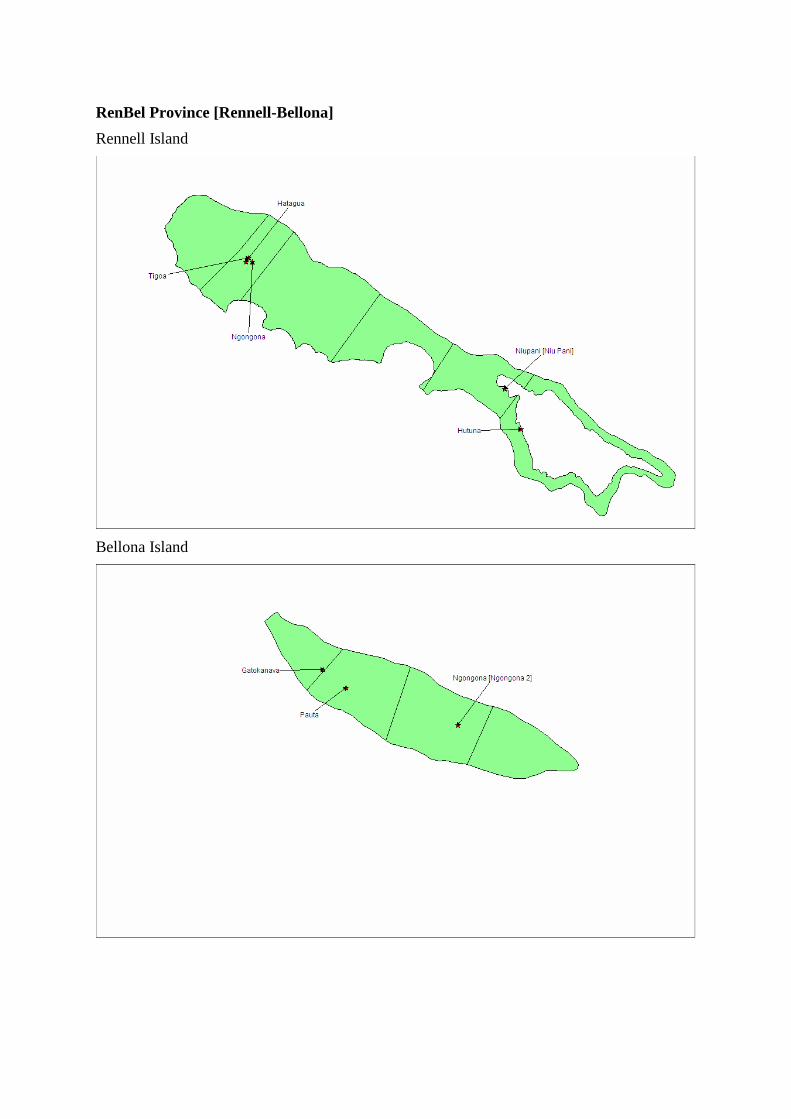
RenBel Province [Rennell-Bellona]
Rennell Island
Bellona Island
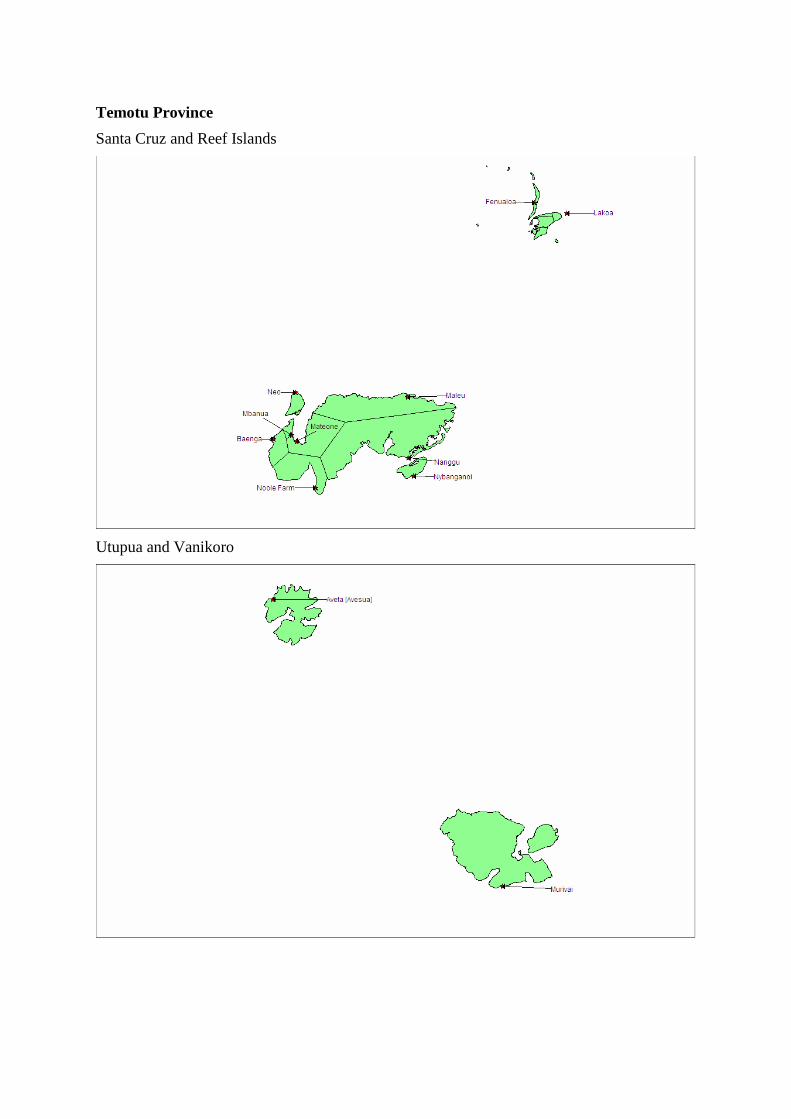
Temotu Province
Santa Cruz and Reef Islands
Utupua and Vanikoro
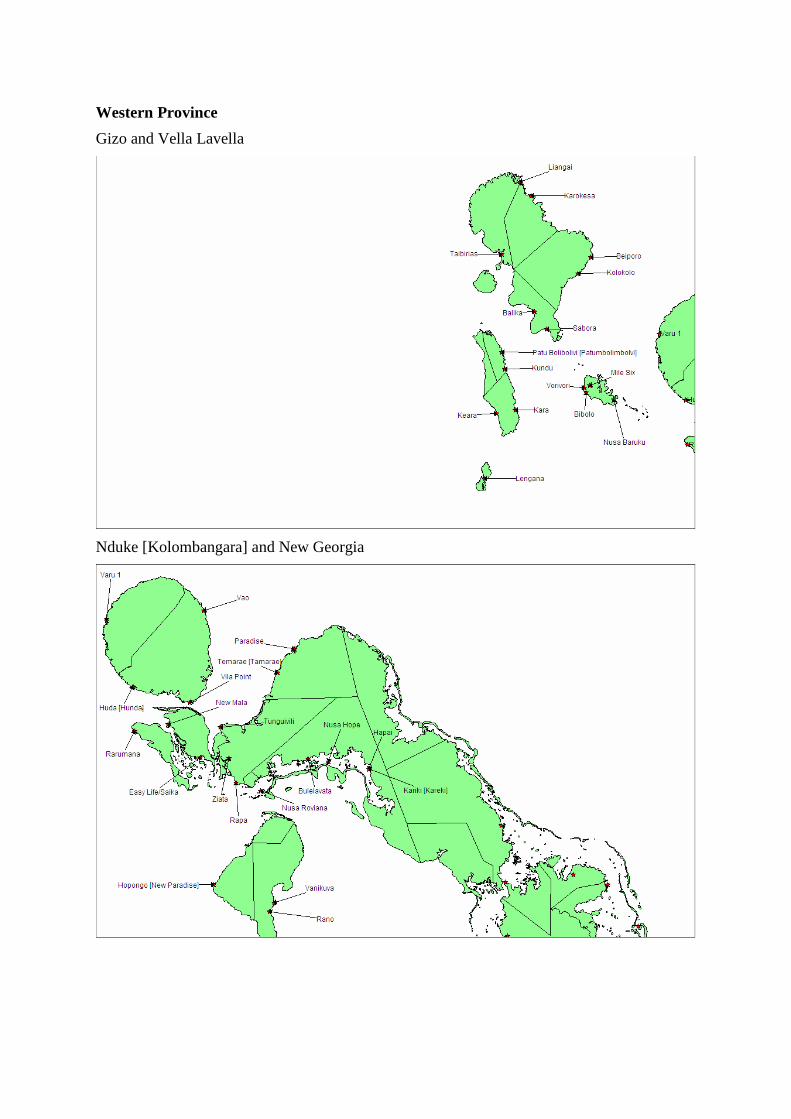
Western Province
Gizo and Vella Lavella
Nduke [Kolombangara] and New Georgia
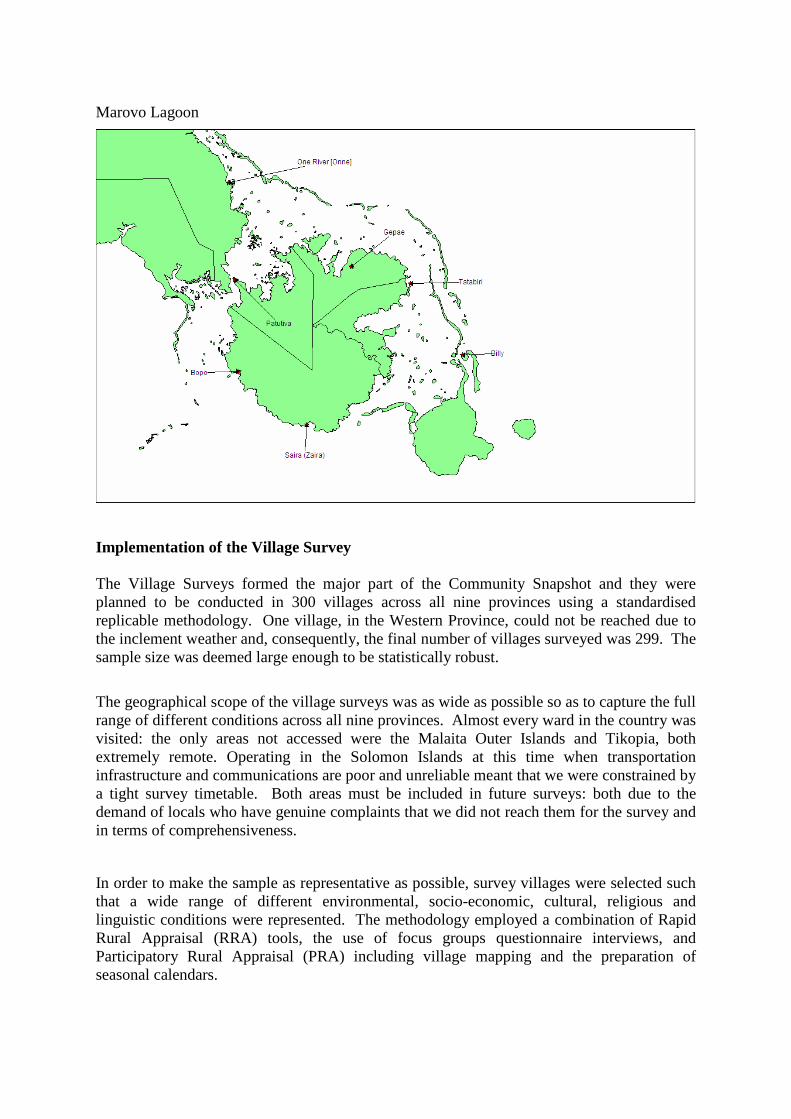
Marovo Lagoon
Implementation of the Village Survey
The Village Surveys formed the major part of the Community Snapshot and they wereplanned to be conducted in 300 villages across all nine provinces using a standardisedreplicable methodology. One village, in the Western Province, could not be reached due tothe inclement weather and, consequently, the final number of villages surveyed was 299. Thesample size was deemed large enough to be statistically robust.
The geographical scope of the village surveys was as wide as possible so as to capture the fullrange of different conditions across all nine provinces. Almost every ward in the country wasvisited: the only areas not accessed were the Malaita Outer Islands and Tikopia, bothextremely remote. Operating in the Solomon Islands at this time when transportationinfrastructure and communications are poor and unreliable meant that we were constrained bya tight survey timetable. Both areas must be included in future surveys: both due to thedemand of locals who have genuine complaints that we did not reach them for the survey andin terms of comprehensiveness.
In order to make the sample as representative as possible, survey villages were selected suchthat a wide range of different environmental, socio-economic, cultural, religious andlinguistic conditions were represented. The methodology employed a combination of RapidRural Appraisal (RRA) tools, the use of focus groups questionnaire interviews, andParticipatory Rural Appraisal (PRA) including village mapping and the preparation ofseasonal calendars.
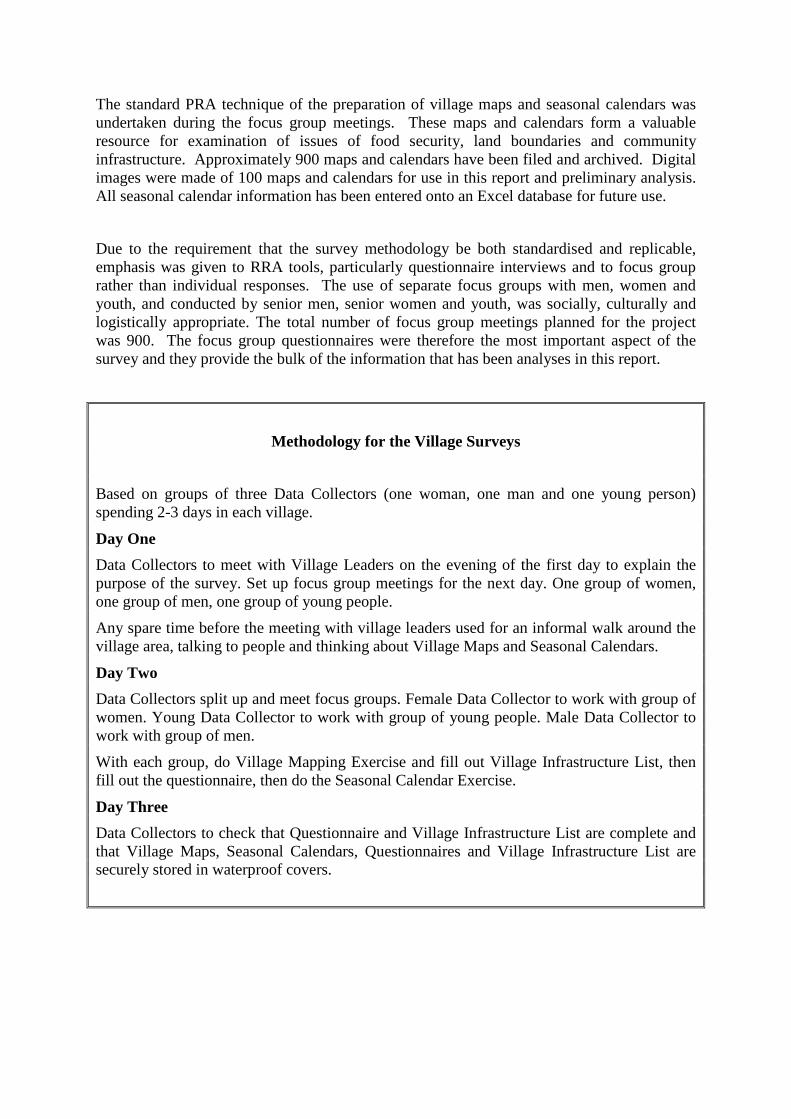
The standard PRA technique of the preparation of village maps and seasonal calendars wasundertaken during the focus group meetings. These maps and calendars form a valuableresource for examination of issues of food security, land boundaries and communityinfrastructure. Approximately 900 maps and calendars have been filed and archived. Digitalimages were made of 100 maps and calendars for use in this report and preliminary analysis.All seasonal calendar information has been entered onto an Excel database for future use.
Due to the requirement that the survey methodology be both standardised and replicable,emphasis was given to RRA tools, particularly questionnaire interviews and to focus grouprather than individual responses. The use of separate focus groups with men, women andyouth, and conducted by senior men, senior women and youth, was socially, culturally andlogistically appropriate. The total number of focus group meetings planned for the projectwas 900. The focus group questionnaires were therefore the most important aspect of thesurvey and they provide the bulk of the information that has been analyses in this report.
Methodology for the Village Surveys
Based on groups of three Data Collectors (one woman, one man and one young person)spending 2-3 days in each village.
Day One
Data Collectors to meet with Village Leaders on the evening of the first day to explain thepurpose of the survey. Set up focus group meetings for the next day. One group of women,one group of men, one group of young people.
Any spare time before the meeting with village leaders used for an informal walk around thevillage area, talking to people and thinking about Village Maps and Seasonal Calendars.
Day Two
Data Collectors split up and meet focus groups. Female Data Collector to work with group ofwomen. Young Data Collector to work with group of young people. Male Data Collector towork with group of men.
With each group, do Village Mapping Exercise and fill out Village Infrastructure List, thenfill out the questionnaire, then do the Seasonal Calendar Exercise.
Day Three
Data Collectors to check that Questionnaire and Village Infrastructure List are complete andthat Village Maps, Seasonal Calendars, Questionnaires and Village Infrastructure List aresecurely stored in waterproof covers.
Provincial Perspectives
The first report presented the results of the National, Guadalcanal and Malaita perspectives.As slightly over 50 percent of the national population is located in Guadalcanal and MalaitaProvinces, and many of the recent social problems have resulted from historicaldevelopments in those two provinces, it was necessary to present a first report emphasisingthe key indicators in this region.
The National perspective encompasses many of the issues in the outer provinces, but theindividual perspectives from Central, Choiseul, Isabel, Makira, RenBel [Rennell/Bellona],Temotu and Western Provinces are unique to those areas. They too need to be presentedindividually despite their size and distance from the main centres of social and political life inthe Solomon Islands.
This report is a presentation of the findings of the key indicators from those outer provinces.Data were collected in the same manner as the National, Guadalcanal and Malaitainterpretations and for that reason the background information on the Snapshot has beenpresented here.
In this report, every chart that had been presented in the main report is examined. Ananalysis of the data is followed by copies of the charts from each of the above outerprovinces. Following each analysis is a Provincial Signpost reporting the significance of thedata and the issues raised, to this is attached a copy of the National Signpost extracted fromthe main report. Copies of the maps of all the villages surveyed is also included here.
This appendix to the main reports of the Provincial Profiles and the Main Survey Report aredesigned to complement each other. For that reason, no additional material, such as thebibliography is repeated here.
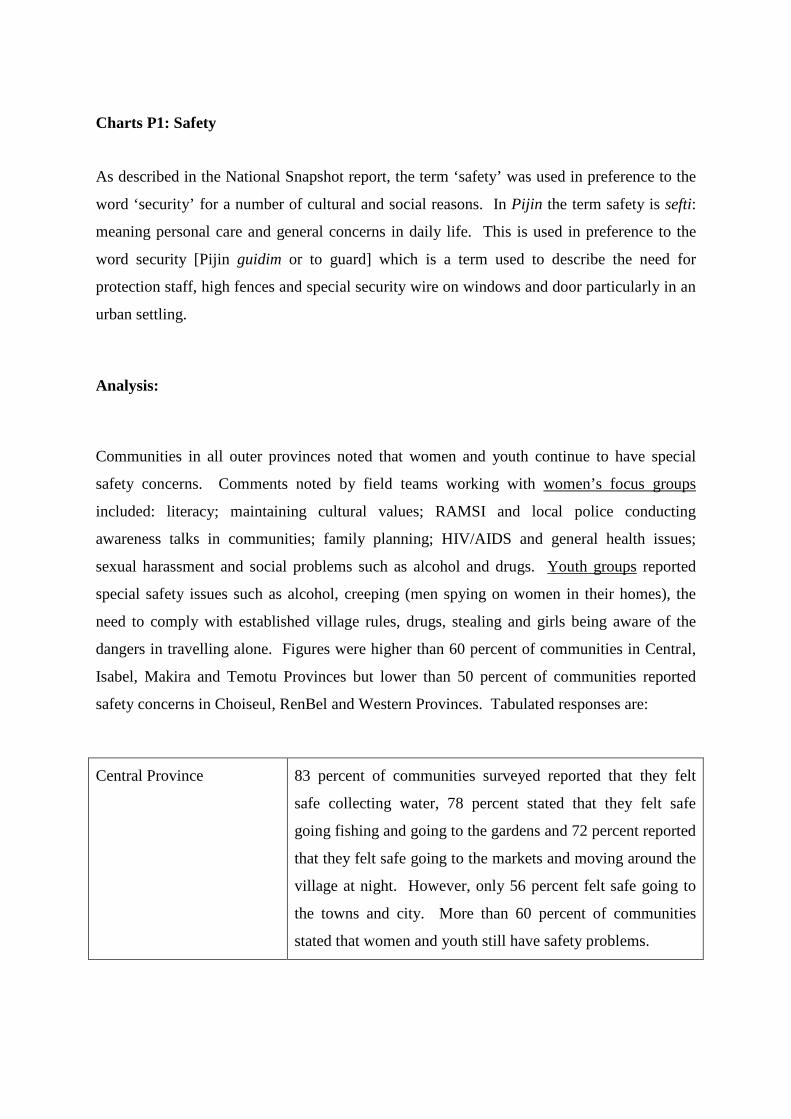
Charts P1: Safety
As described in the National Snapshot report, the term ‘safety’ was used in preference to the
word ‘security’ for a number of cultural and social reasons. In Pijin the term safety is sefti:
meaning personal care and general concerns in daily life. This is used in preference to the
word security [Pijin guidim or to guard] which is a term used to describe the need for
protection staff, high fences and special security wire on windows and door particularly in an
urban settling.
Analysis:
Communities in all outer provinces noted that women and youth continue to have special
safety concerns. Comments noted by field teams working with women’s focus groups
included: literacy; maintaining cultural values; RAMSI and local police conducting
awareness talks in communities; family planning; HIV/AIDS and general health issues;
sexual harassment and social problems such as alcohol and drugs. Youth groups reported
special safety issues such as alcohol, creeping (men spying on women in their homes), the
need to comply with established village rules, drugs, stealing and girls being aware of the
dangers in travelling alone. Figures were higher than 60 percent of communities in Central,
Isabel, Makira and Temotu Provinces but lower than 50 percent of communities reported
safety concerns in Choiseul, RenBel and Western Provinces. Tabulated responses are:
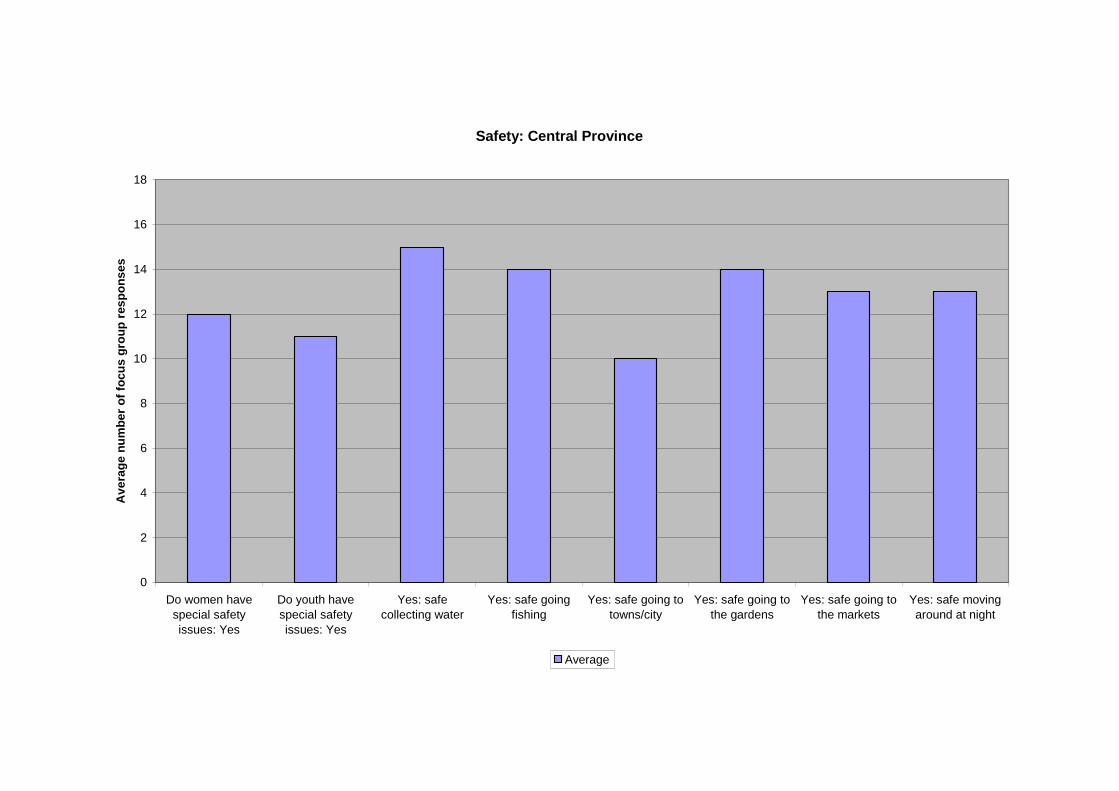
Central Province 83 percent of communities surveyed reported that they felt
safe collecting water, 78 percent stated that they felt safe
going fishing and going to the gardens and 72 percent reported
that they felt safe going to the markets and moving around the
village at night. However, only 56 percent felt safe going to
the towns and city. More than 60 percent of communities
stated that women and youth still have safety problems.
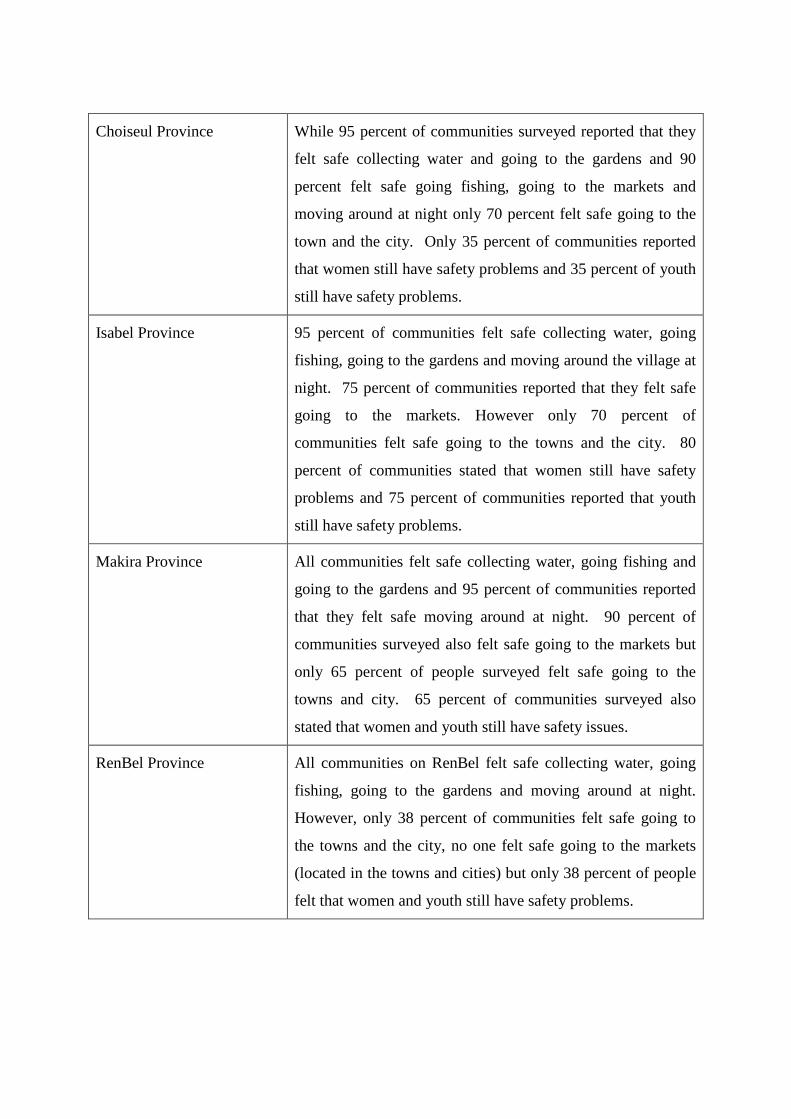
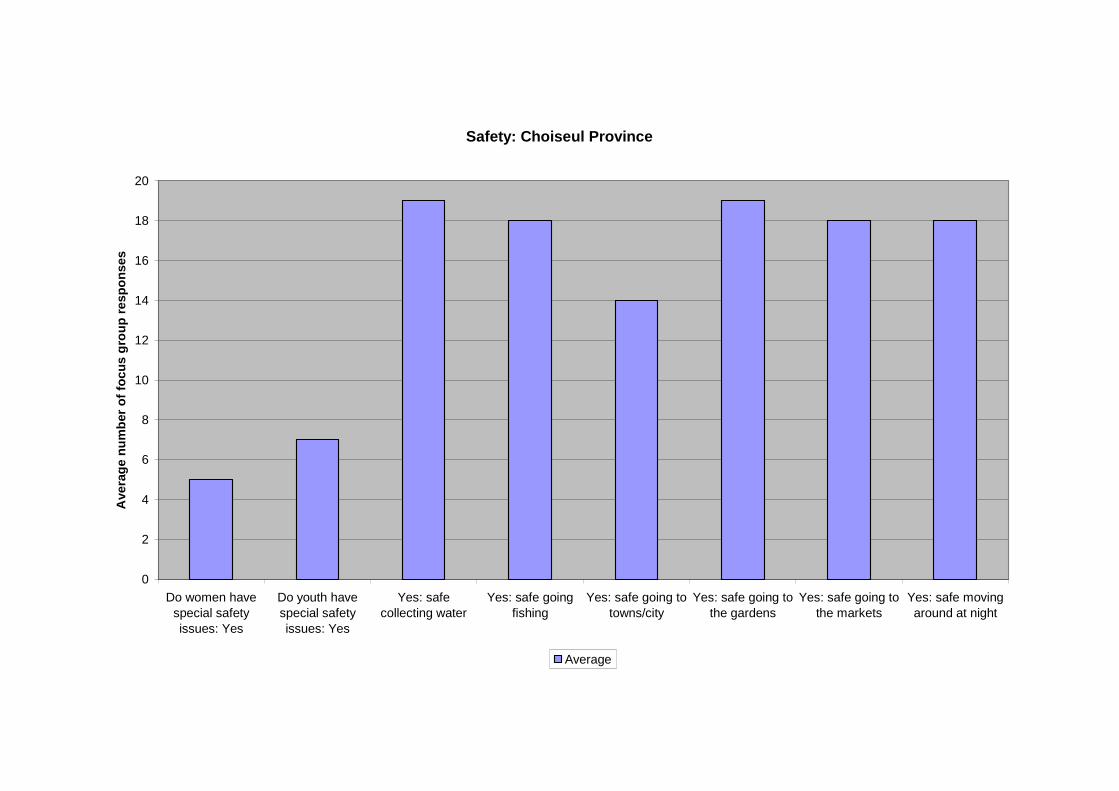
Choiseul Province While 95 percent of communities surveyed reported that they
felt safe collecting water and going to the gardens and 90
percent felt safe going fishing, going to the markets and
moving around at night only 70 percent felt safe going to the
town and the city. Only 35 percent of communities reported
that women still have safety problems and 35 percent of youth
still have safety problems.
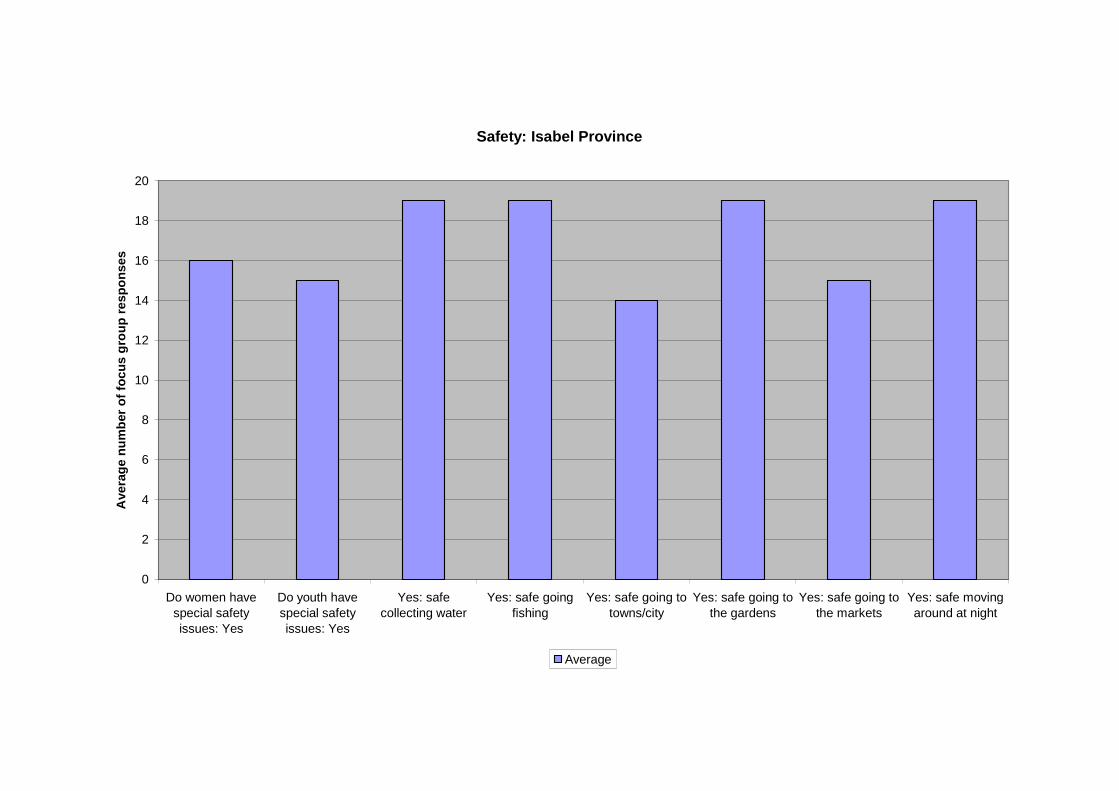
Isabel Province 95 percent of communities felt safe collecting water, going
fishing, going to the gardens and moving around the village at
night. 75 percent of communities reported that they felt safe
going to the markets. However only 70 percent of
communities felt safe going to the towns and the city. 80
percent of communities stated that women still have safety
problems and 75 percent of communities reported that youth
still have safety problems.
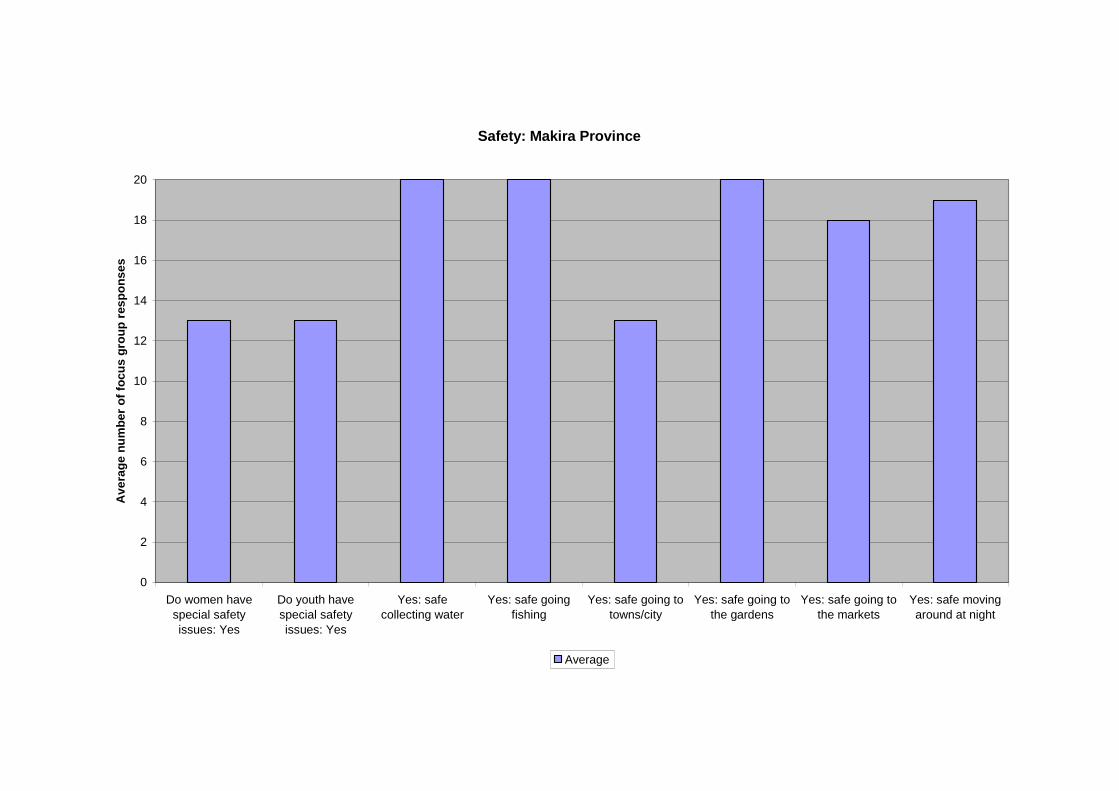
Makira Province All communities felt safe collecting water, going fishing and
going to the gardens and 95 percent of communities reported
that they felt safe moving around at night. 90 percent of
communities surveyed also felt safe going to the markets but
only 65 percent of people surveyed felt safe going to the
towns and city. 65 percent of communities surveyed also
stated that women and youth still have safety issues.
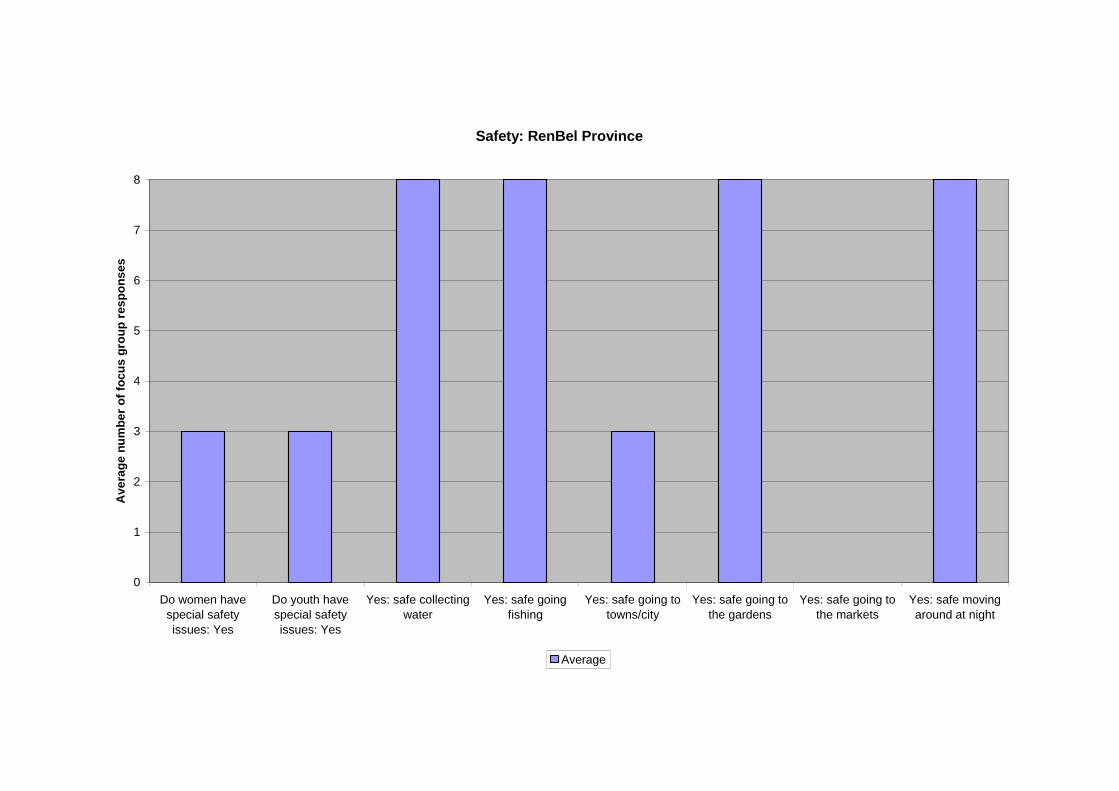
RenBel Province All communities on RenBel felt safe collecting water, going
fishing, going to the gardens and moving around at night.
However, only 38 percent of communities felt safe going to
the towns and the city, no one felt safe going to the markets
(located in the towns and cities) but only 38 percent of people
felt that women and youth still have safety problems.
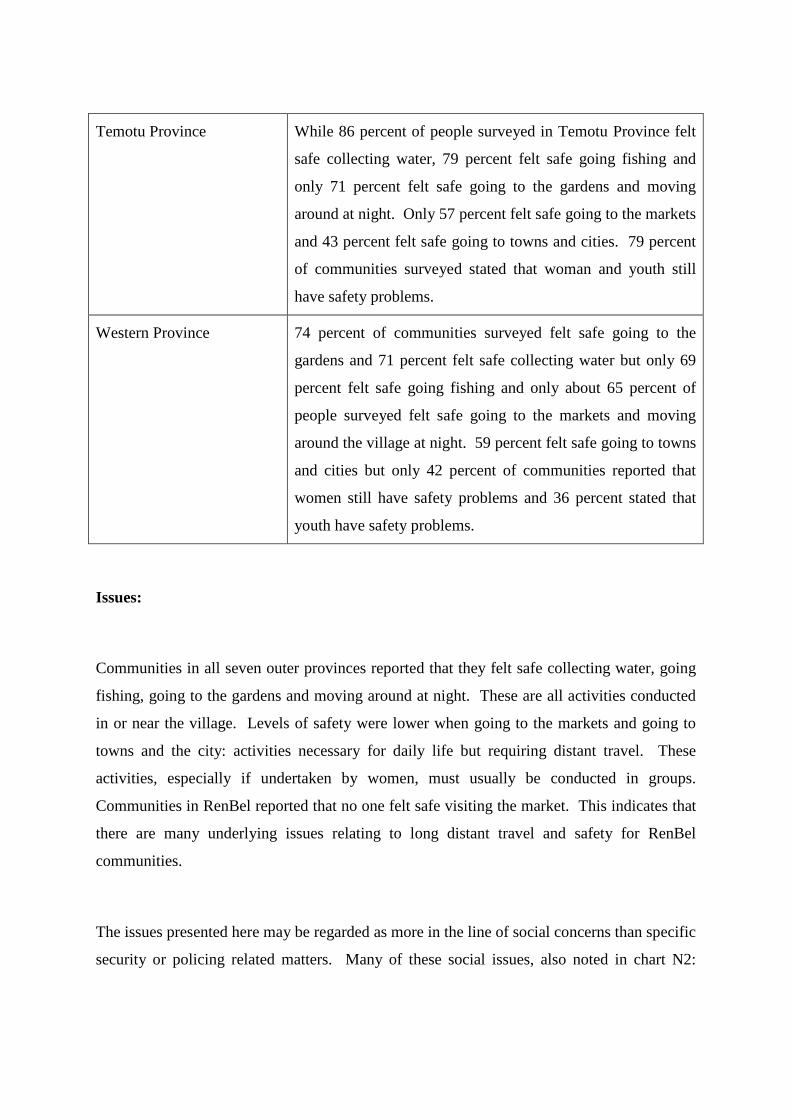
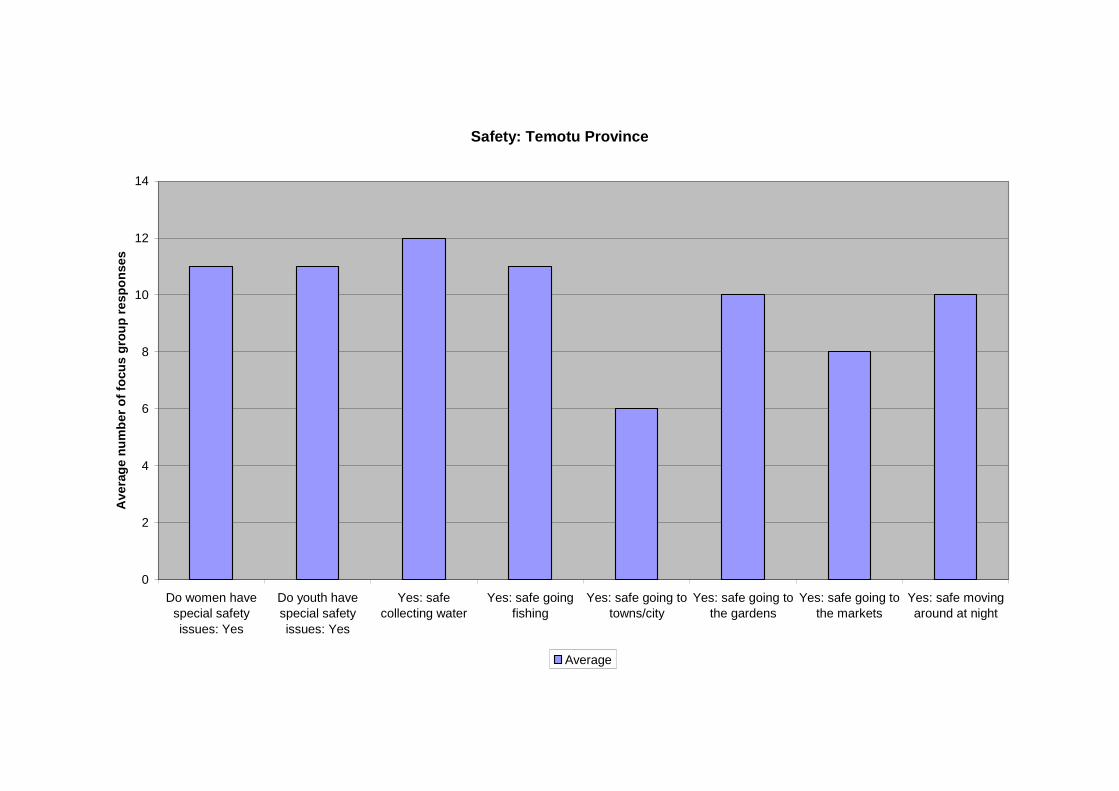
Temotu Province While 86 percent of people surveyed in Temotu Province felt
safe collecting water, 79 percent felt safe going fishing and
only 71 percent felt safe going to the gardens and moving
around at night. Only 57 percent felt safe going to the markets
and 43 percent felt safe going to towns and cities. 79 percent
of communities surveyed stated that woman and youth still
have safety problems.
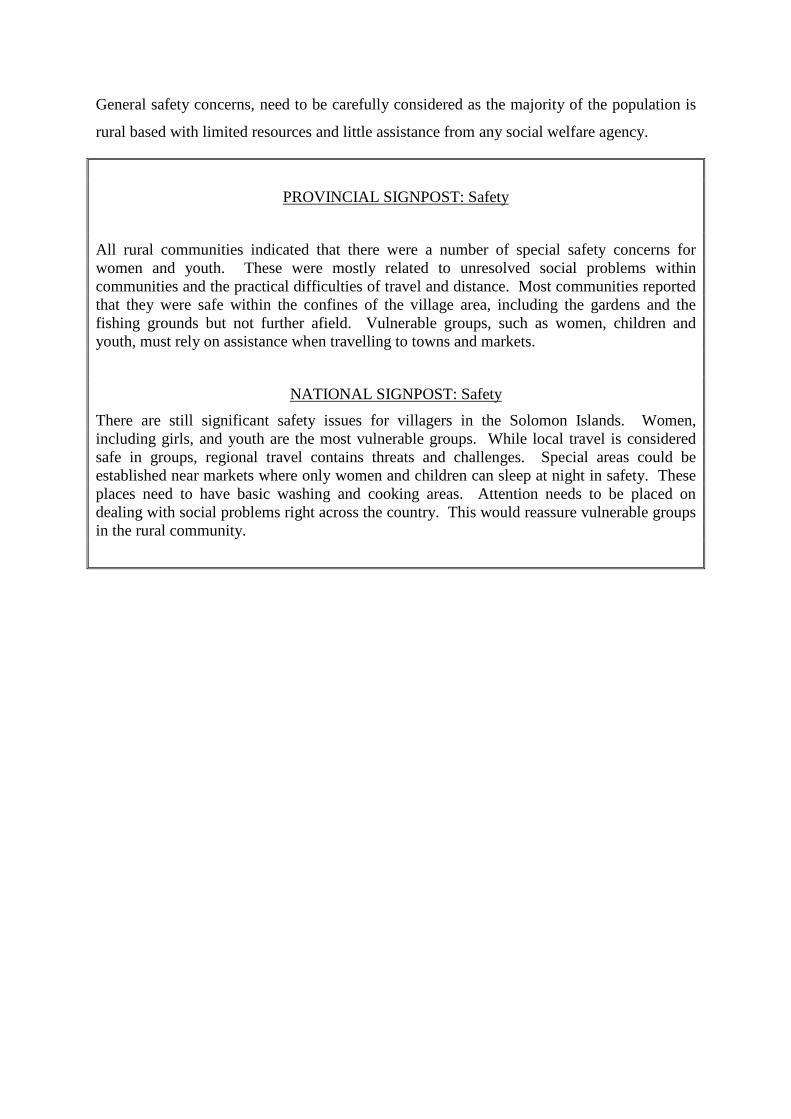
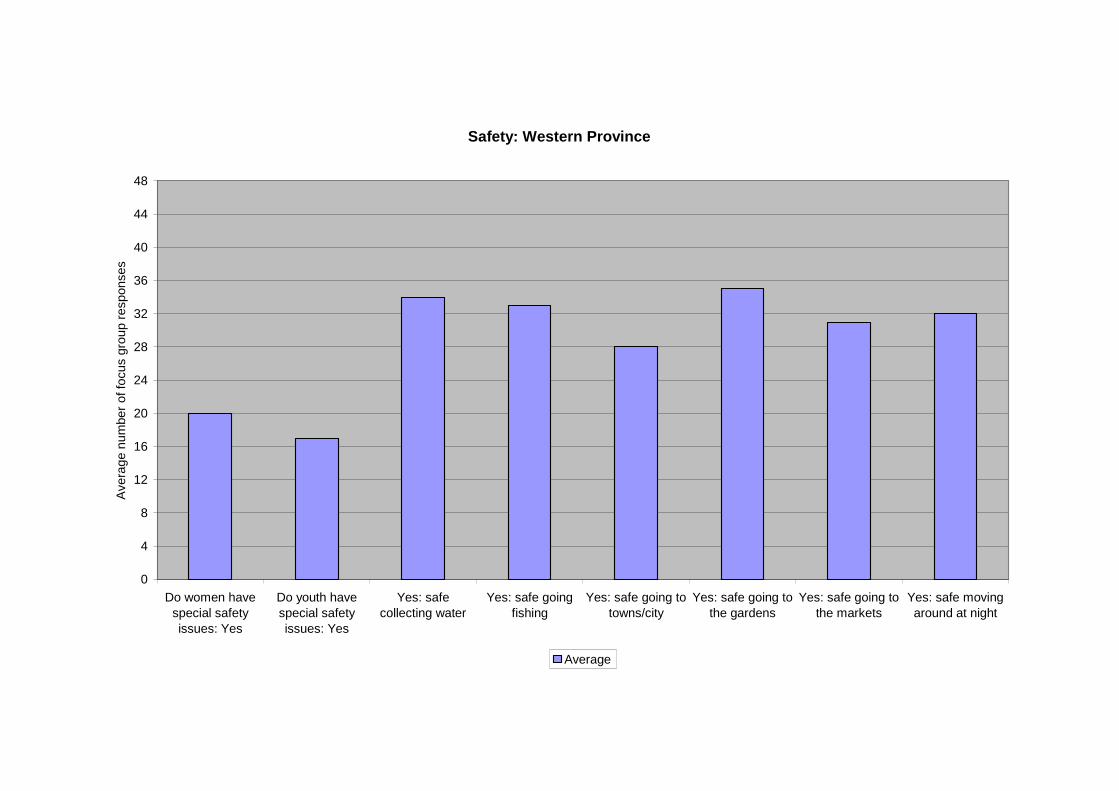
Western Province 74 percent of communities surveyed felt safe going to the
gardens and 71 percent felt safe collecting water but only 69
percent felt safe going fishing and only about 65 percent of
people surveyed felt safe going to the markets and moving
around the village at night. 59 percent felt safe going to towns
and cities but only 42 percent of communities reported that
women still have safety problems and 36 percent stated that
youth have safety problems.
Issues:
Communities in all seven outer provinces reported that they felt safe collecting water, going
fishing, going to the gardens and moving around at night. These are all activities conducted
in or near the village. Levels of safety were lower when going to the markets and going to
towns and the city: activities necessary for daily life but requiring distant travel. These
activities, especially if undertaken by women, must usually be conducted in groups.
Communities in RenBel reported that no one felt safe visiting the market. This indicates that
there are many underlying issues relating to long distant travel and safety for RenBel
communities.
The issues presented here may be regarded as more in the line of social concerns than specific
security or policing related matters. Many of these social issues, also noted in chart N2:
General safety concerns, need to be carefully considered as the majority of the population is
rural based with limited resources and little assistance from any social welfare agency.
PROVINCIAL SIGNPOST: Safety
All rural communities indicated that there were a number of special safety concerns forwomen and youth. These were mostly related to unresolved social problems withincommunities and the practical difficulties of travel and distance. Most communities reportedthat they were safe within the confines of the village area, including the gardens and thefishing grounds but not further afield. Vulnerable groups, such as women, children andyouth, must rely on assistance when travelling to towns and markets.
NATIONAL SIGNPOST: Safety
There are still significant safety issues for villagers in the Solomon Islands. Women,including girls, and youth are the most vulnerable groups. While local travel is consideredsafe in groups, regional travel contains threats and challenges. Special areas could beestablished near markets where only women and children can sleep at night in safety. Theseplaces need to have basic washing and cooking areas. Attention needs to be placed ondealing with social problems right across the country. This would reassure vulnerable groupsin the rural community.
Safety: Central Province
0
2
4
6
8
10
12
14
16
18
Do women have
special safety
issues: Yes
Do youth have
special safety
issues: Yes
Yes: safe
collecting water
Yes: safe going
fishing
Yes: safe going to
towns/city
Yes: safe going to
the gardens
Yes: safe going to
the markets
Yes: safe moving
around at night
Av
era
ge
nu
mb
er
of
foc
us
gro
up
res
po
ns
es
Average
Safety: Choiseul Province
0
2
4
6
8
10
12
14
16
18
20
Do women havespecial safetyissues: Yes
Do youth havespecial safetyissues: Yes
Yes: safecollecting water
Yes: safe goingfishing
Yes: safe going totowns/city
Yes: safe going tothe gardens
Yes: safe going tothe markets
Yes: safe movingaround at night
Ave
rag
en
um
ber
of
foc
us
gro
up
res
po
ns
es
Average
Safety: Isabel Province
0
2
4
6
8
10
12
14
16
18
20
Do women havespecial safetyissues: Yes
Do youth havespecial safetyissues: Yes
Yes: safecollecting water
Yes: safe goingfishing
Yes: safe going totowns/city
Yes: safe going tothe gardens
Yes: safe going tothe markets
Yes: safe movingaround at night
Ave
rag
en
um
ber
of
foc
us
gro
up
res
po
ns
es
Average
Safety: Makira Province
0
2
4
6
8
10
12
14
16
18
20
Do women have
special safety
issues: Yes
Do youth have
special safety
issues: Yes
Yes: safe
collecting water
Yes: safe going
fishing
Yes: safe going to
towns/city
Yes: safe going to
the gardens
Yes: safe going to
the markets
Yes: safe moving
around at night
Av
era
ge
nu
mb
er
of
foc
us
gro
up
res
po
ns
es
Average
Safety: RenBel Province
0
1
2
3
4
5
6
7
8
Do women have
special safety
issues: Yes
Do youth have
special safety
issues: Yes
Yes: safe collecting
water
Yes: safe going
fishing
Yes: safe going to
towns/city
Yes: safe going to
the gardens
Yes: safe going to
the markets
Yes: safe moving
around at night
Av
era
ge
nu
mb
er
of
foc
us
gro
up
res
po
ns
es
Average
Safety: Temotu Province
0
2
4
6
8
10
12
14
Do women havespecial safety
issues: Yes
Do youth havespecial safety
issues: Yes
Yes: safecollecting water
Yes: safe goingfishing
Yes: safe going totowns/city
Yes: safe going tothe gardens
Yes: safe going tothe markets
Yes: safe movingaround at night
Av
era
ge
nu
mb
er
of
focu
sg
rou
pre
sp
on
se
s
Average
Safety: Western Province
0
4
8
12
16
20
24
28
32
36
40
44
48
Do women havespecial safetyissues: Yes
Do youth havespecial safetyissues: Yes
Yes: safecollecting water
Yes: safe goingfishing
Yes: safe going totowns/city
Yes: safe going tothe gardens
Yes: safe going tothe markets
Yes: safe movingaround at night
Ave
rag
en
um
be
ro
ffo
cu
sgro
up
resp
on
se
s
Average
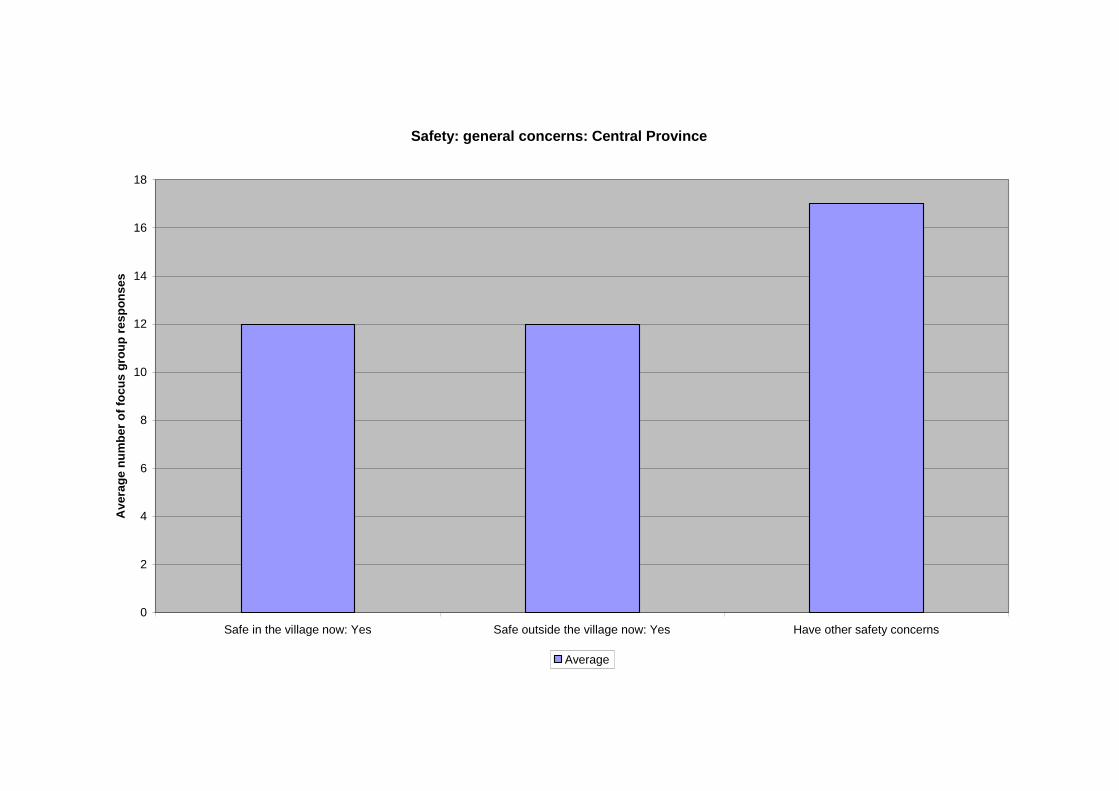
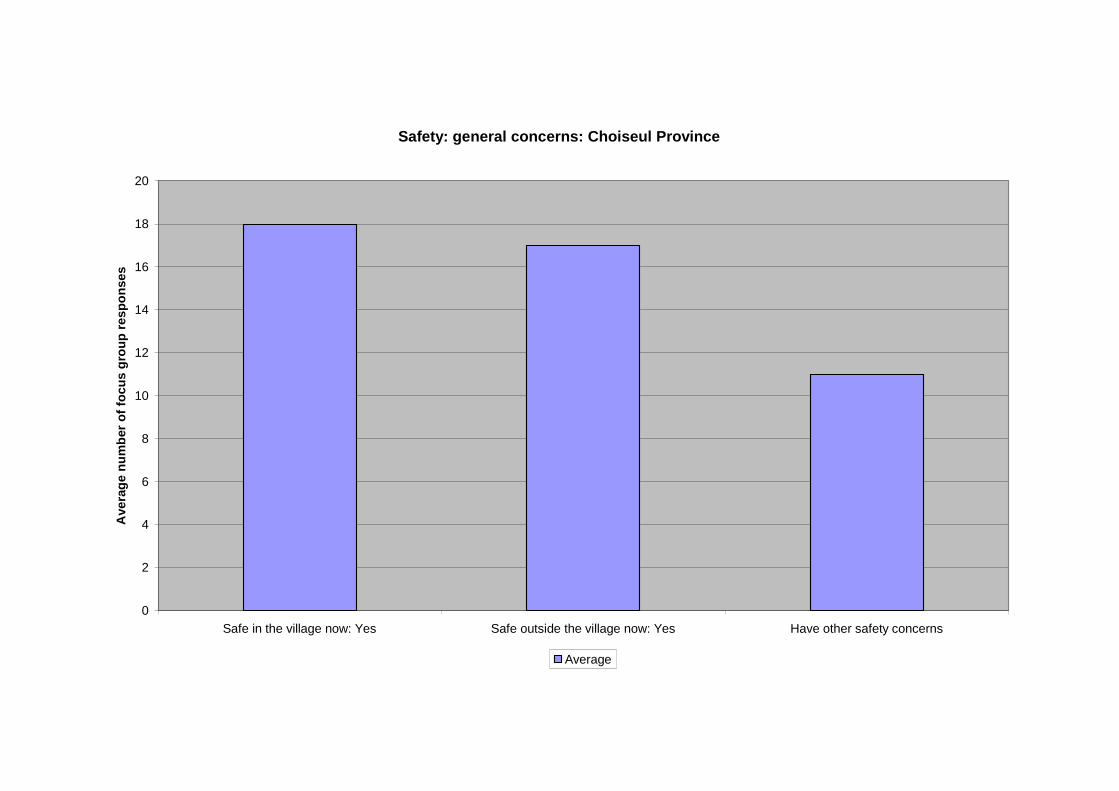
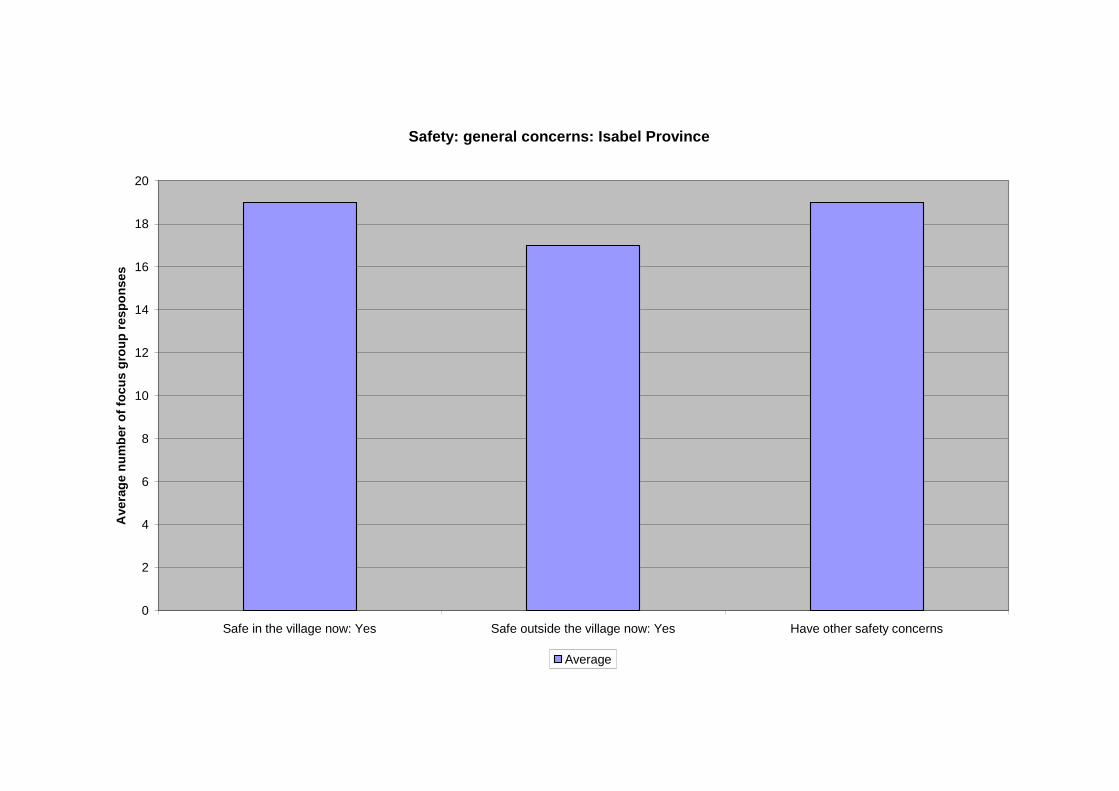
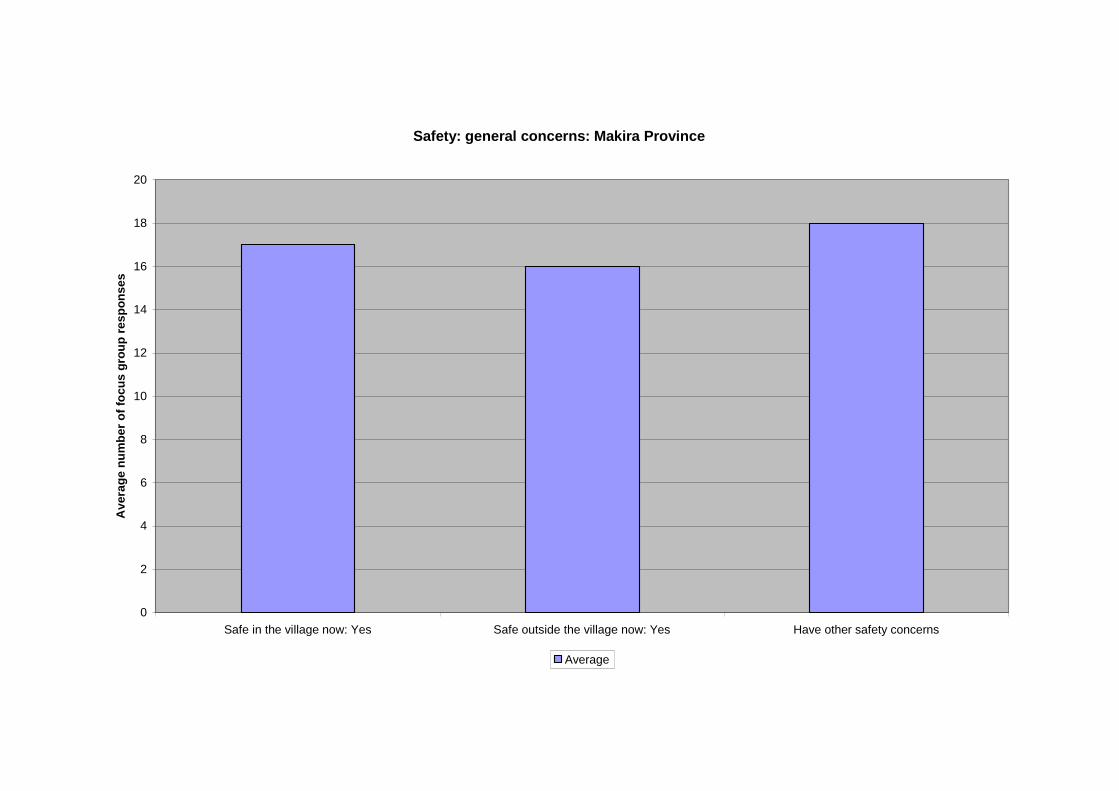
Charts P2: Safety: general concerns
Analysis:
In all communities in Choiseul, Isabel, Makira, and RenBel Provinces people reported that
they felt safe both inside and outside the villages now. Only in Central, Temotu and Western
Provinces where people could encounter groups of outsiders and squatters were there any
significant reports that people felt unsafe inside or outside the village. All communities,
except those in Choiseul and Western Province, reported very high levels of general safety
concerns.
The results presented in charts P1: Safety also show that the special safety issues described
by women and youth refer to current social problems in the local communities. There were
few references to policing, the presence of RAMSI and the need for law and order awareness
programs. The tabulated responses are:
Central Province 67 percent of communities surveyed stated that they felt safe
both inside and outside the village now but 94 percent
reported that there were general safety concerns in the
communities surveyed.
Choiseul Province 90 percent of communities surveyed reported being safe in the
village now, and 85 percent reported being safe outside the
village. Only 55 percent stated that there were other safety
concerns.
Isabel Province 95 percent of communities surveyed stated that they felt safe
inside the village now and 85 percent of people felt safe
outside the village now but 95 percent reported that they still
have other safety concerns.
Makira Province While 85 percent of communities surveyed reported that they
felt safe in the village now, 80 percent reported being safe
outside the village. 90 percent of people reported that they
still have other safety concerns.
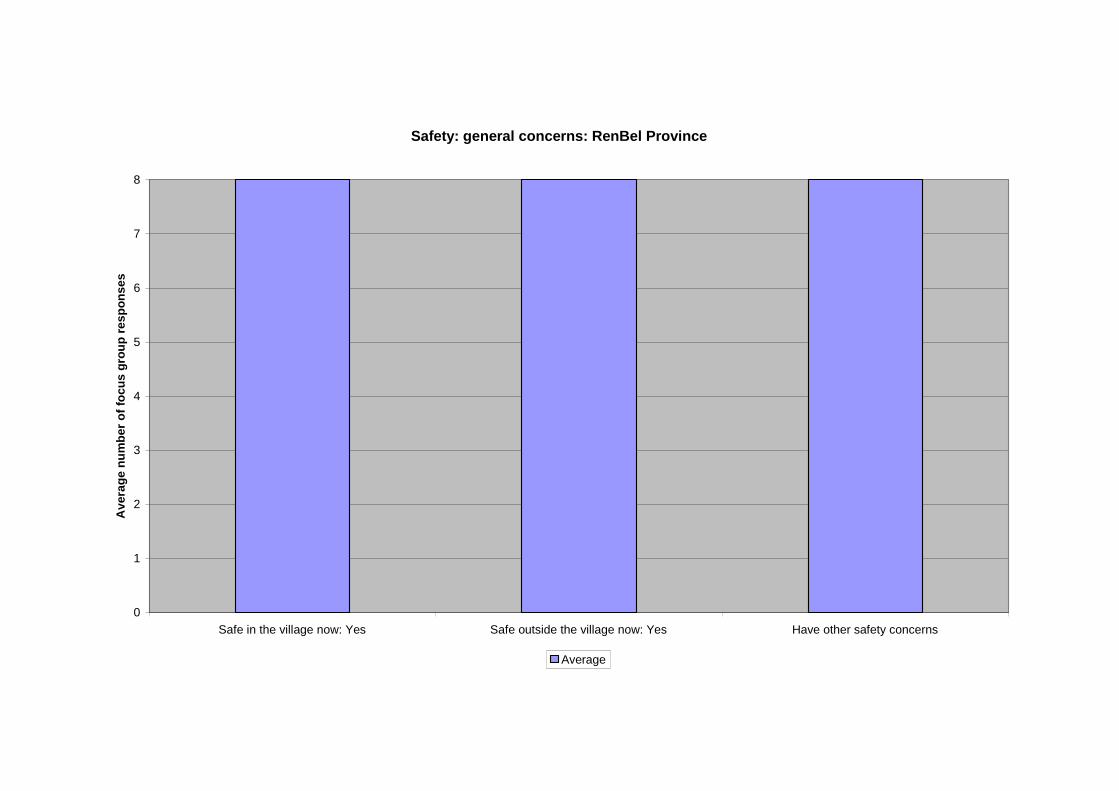
RenBel Province All communities in RenBel Province reported that they felt
safe within and outside the village now but all communities
reported that there were other safety concerns.
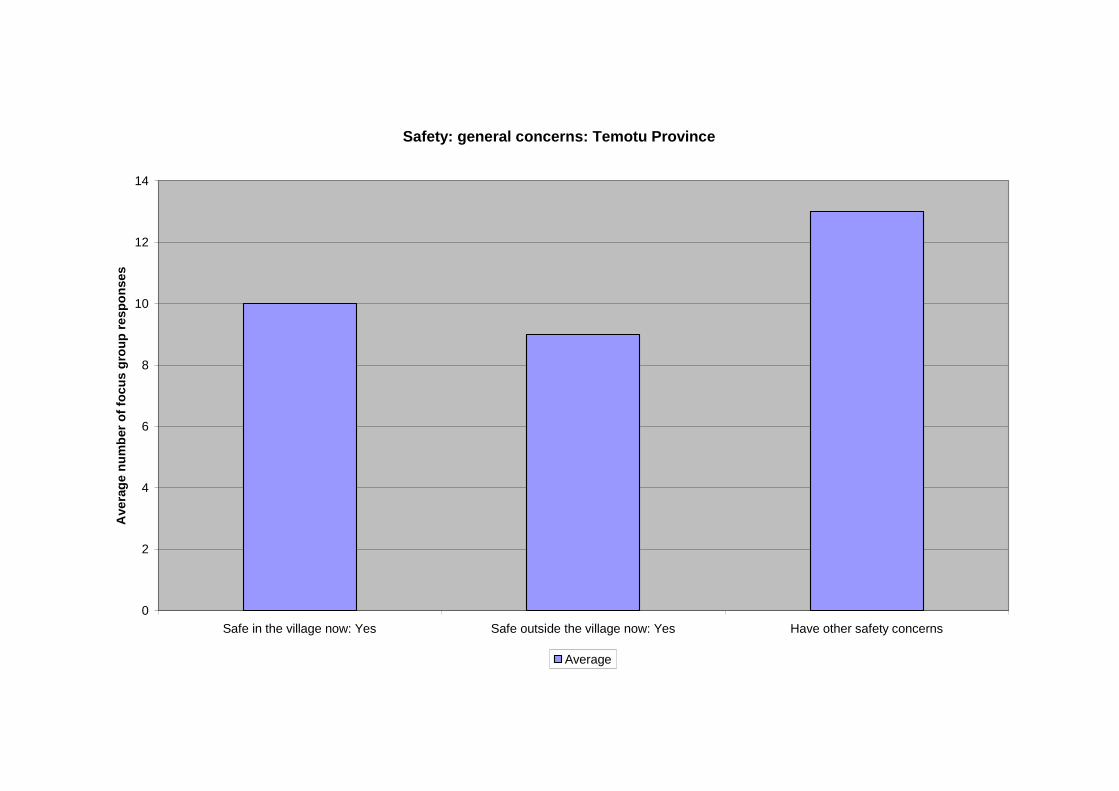
Temotu Province While 71 percent of communities surveyed felt safe inside the
village now, only 64 percent of communities reported being
safe outside the village. 93 percent of communities surveyed
in Temotu Province reported having other safety concerns.
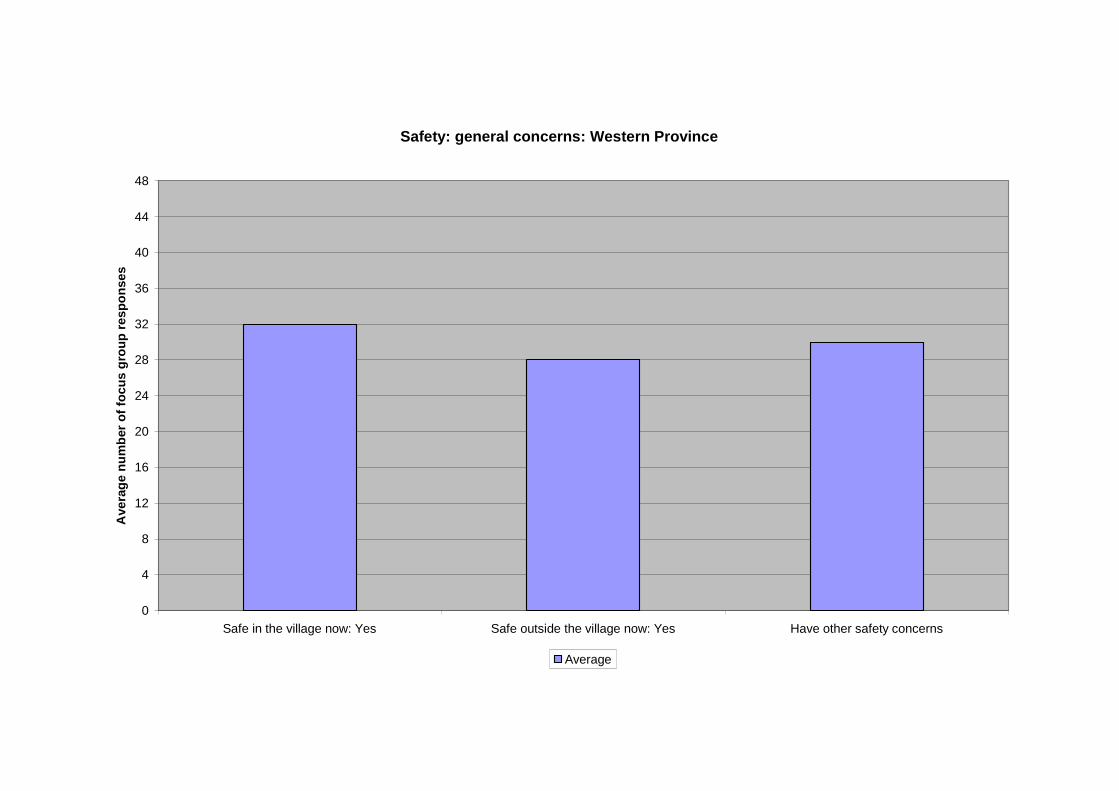
Western Province Only 67 percent of communities reported being safe inside
their community now and 59 percent reported being safe
outside the village. However, only 63 percent of communities
reported having other safety concerns.
Issues:
Significant social issues exist in rural communities that are not being addressed at present.
The lack of attention to these issues has meant that villagers still have general concerns about
personal safety in their homes and communities. The issues of general safety were
highlighted in the National Snapshot report and include: alcohol, the presence of outsiders
especially near logging camps, creeping (voyeurism), local land disputes, lack of access to
medical care especially for children, overpopulation and the lack of gardening land, financial
troubles and transportation difficulties. These concerns reflect the problems in daily life
faced by villagers who feel marginalized and neglected.
PROVINCIAL SIGNPOST: Safety: general concerns
Considerable attention needs to be placed on the delivery of a range of programs to ruralcommunities that may assist with the resolution of long standing social problems. Theproblem of safety in rural communities encompasses a wide range of social issues in theSolomon Islands.
SIGNPOST: Safety: general concerns
Villagers face a range of major and minor social problems in their daily life. These includethe lack of infrastructure, especially medical care and education for the young, alcoholconsumption, illegal drug use, teenage pregnancy, land disputes, and issues relating to theoverpopulation of rural areas and the resultant land stress and growing concerns over foodsecurity. This is symptomatic of years of neglect and not just a result of the recent civilunrest.
Safety: general concerns: Central Province
0
2
4
6
8
10
12
14
16
18
Safe in the village now: Yes Safe outside the village now: Yes Have other safety concerns
Av
era
ge
nu
mb
er
of
foc
us
gro
up
res
po
ns
es
Average
Safety: general concerns: Choiseul Province
0
2
4
6
8
10
12
14
16
18
20
Safe in the village now: Yes Safe outside the village now: Yes Have other safety concerns
Ave
rag
en
um
ber
of
foc
us
gro
up
res
po
ns
es
Average
Safety: general concerns: Isabel Province
0
2
4
6
8
10
12
14
16
18
20
Safe in the village now: Yes Safe outside the village now: Yes Have other safety concerns
Ave
rag
en
um
ber
of
foc
us
gro
up
res
po
ns
es
Average
Safety: general concerns: Makira Province
0
2
4
6
8
10
12
14
16
18
20
Safe in the village now: Yes Safe outside the village now: Yes Have other safety concerns
Av
era
ge
nu
mb
er
of
foc
us
gro
up
res
po
ns
es
Average
Safety: general concerns: RenBel Province
0
1
2
3
4
5
6
7
8
Safe in the village now: Yes Safe outside the village now: Yes Have other safety concerns
Av
era
ge
nu
mb
er
of
foc
us
gro
up
res
po
ns
es
Average
Safety: general concerns: Temotu Province
0
2
4
6
8
10
12
14
Safe in the village now: Yes Safe outside the village now: Yes Have other safety concerns
Ave
rag
en
um
ber
of
foc
us
gro
up
res
po
ns
es
Average
Safety: general concerns: Western Province
0
4
8
12
16
20
24
28
32
36
40
44
48
Safe in the village now: Yes Safe outside the village now: Yes Have other safety concerns
Ave
rag
en
um
ber
of
foc
us
gro
up
res
po
ns
es
Average
Charts P3: Conflict resolution
The National Snapshot report provided evidence that customary authority in villages is still
strong and needs to be used for effective law and order in rural areas. Until a sound system
of community policing is implemented that utilizes the authority and respects the dignity of
elders, social problems in rural communities will not be resolved.
Analysis:
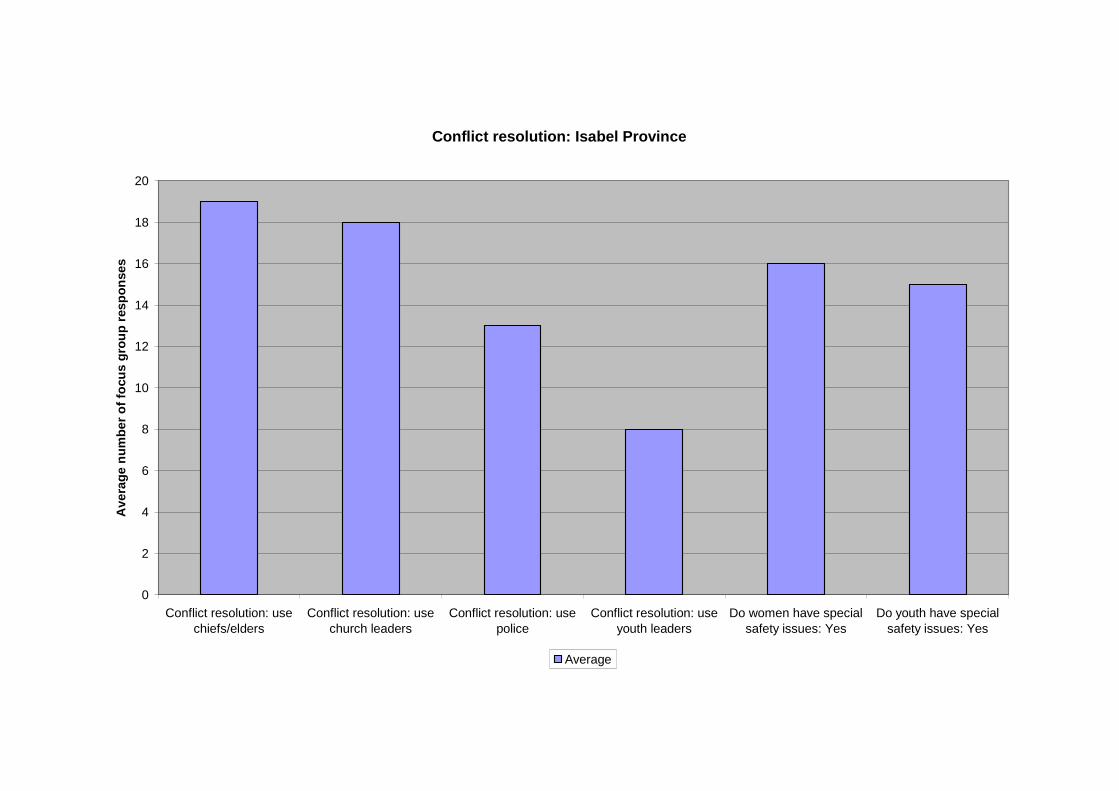
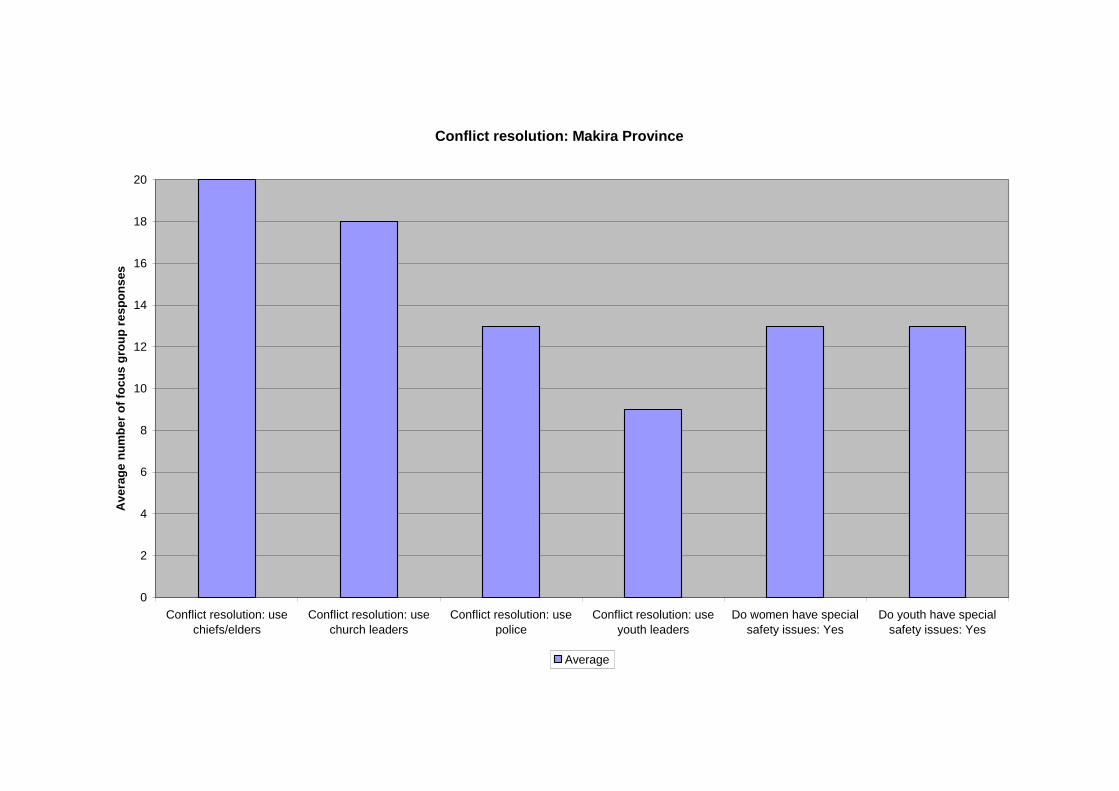
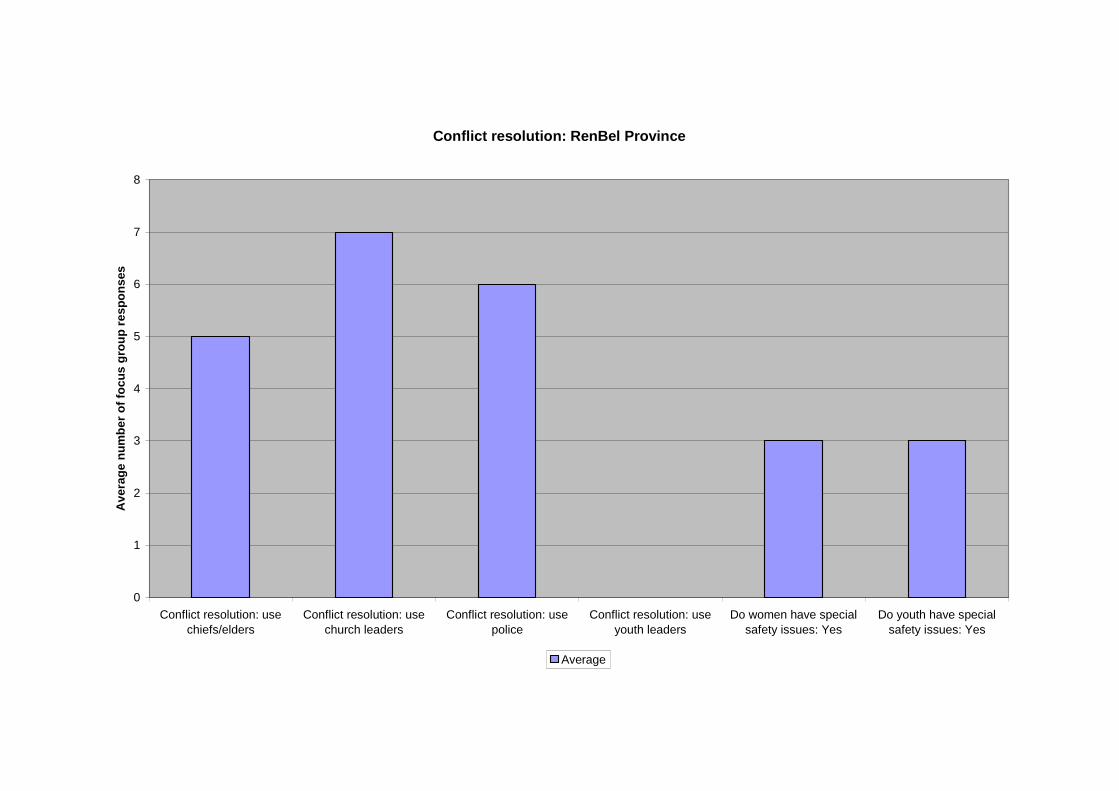
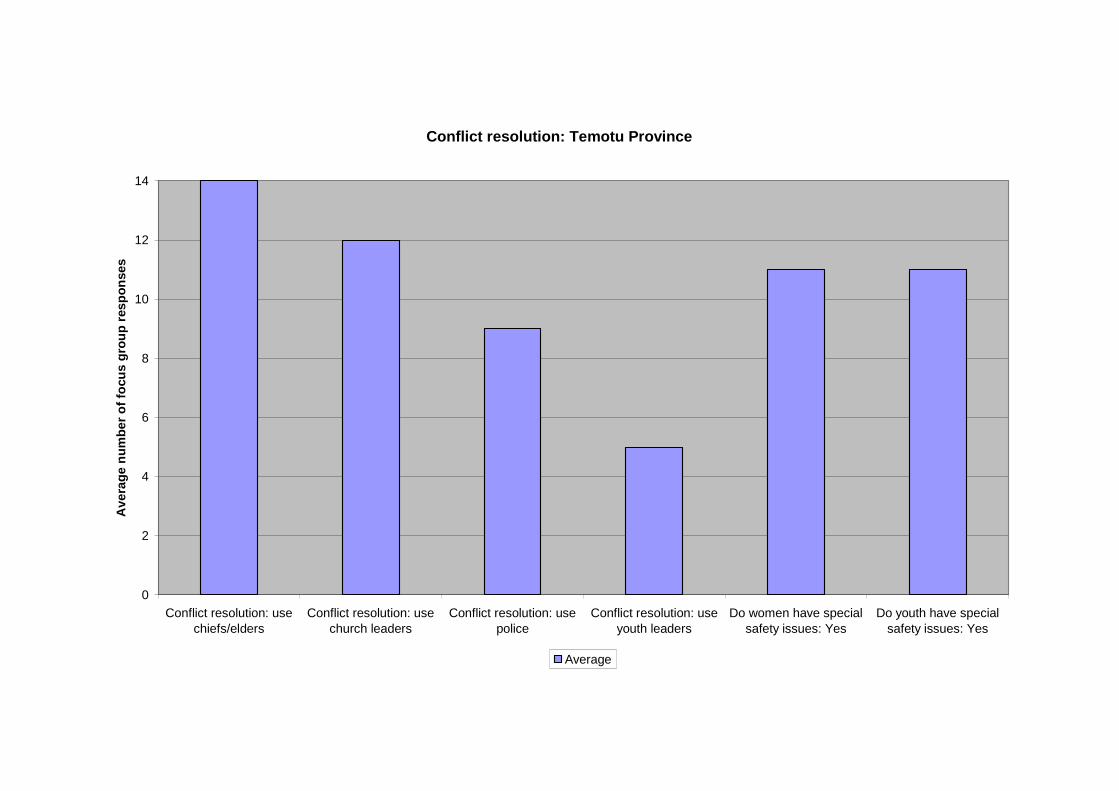
In all outer provinces, except RenBel Province, the chiefs and elders were the most important
people used when resolving local conflicts. On Rennell and Bellona Islands the leaders from
the Seventh Day Adventist Church and the SSEC (South Seas Evangelical Church) are the
more important figures. This means that the majority of communities continue to utilize the
services of customary authority in preference to external forms of law and order.
In all provinces, again except on Rennell and Bellona, the church leaders are the second most
important people in terms of conflict resolution. On Rennell and Bellona the police were
identified as more important than the chiefs and elders. Again, youth leaders were also used
to resolve local conflicts and it is important to note that they do have a formal place in village
conflict resolution. A breakdown of youth responses would probably show that youth use
peer groups in the first instance in time of conflict, especially among each other. The
tabulated responses are:
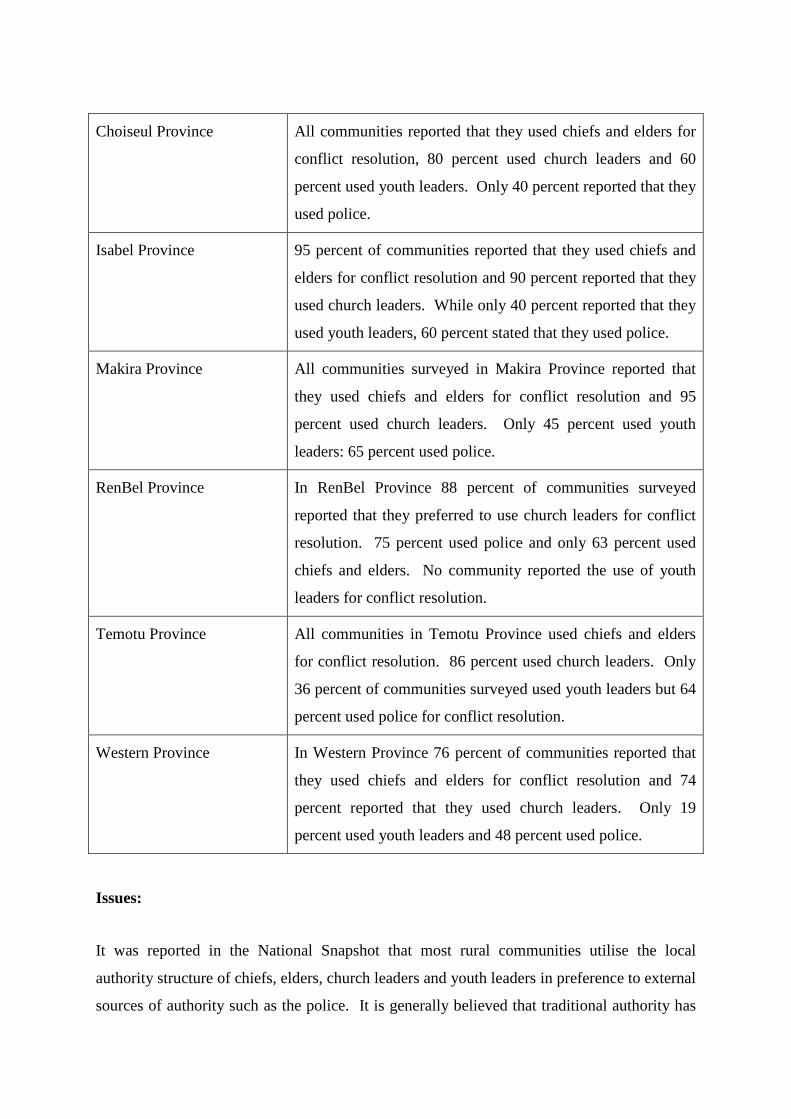
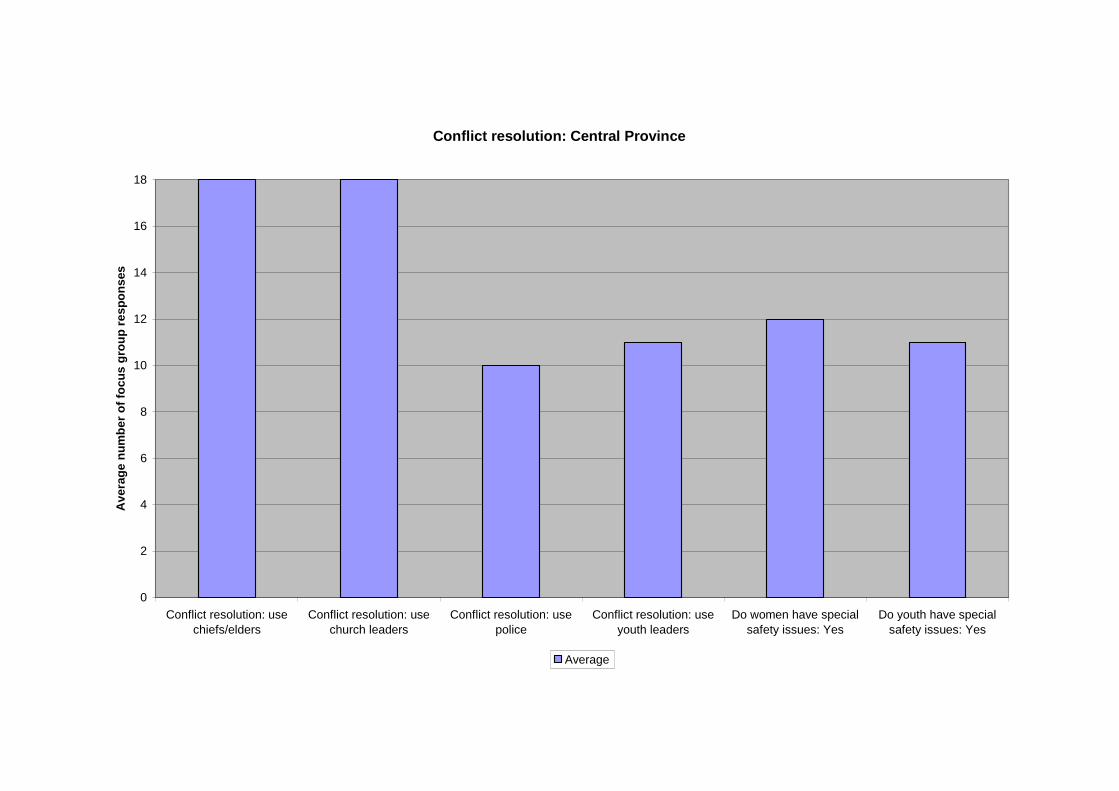
Central Province All communities in Central Province use chiefs, elders or
church leaders for conflict resolution within their village.
Only 56 percent reported using the police. 61 percent of
communities stated that youth leaders were used in situations
requiring conflict resolution.
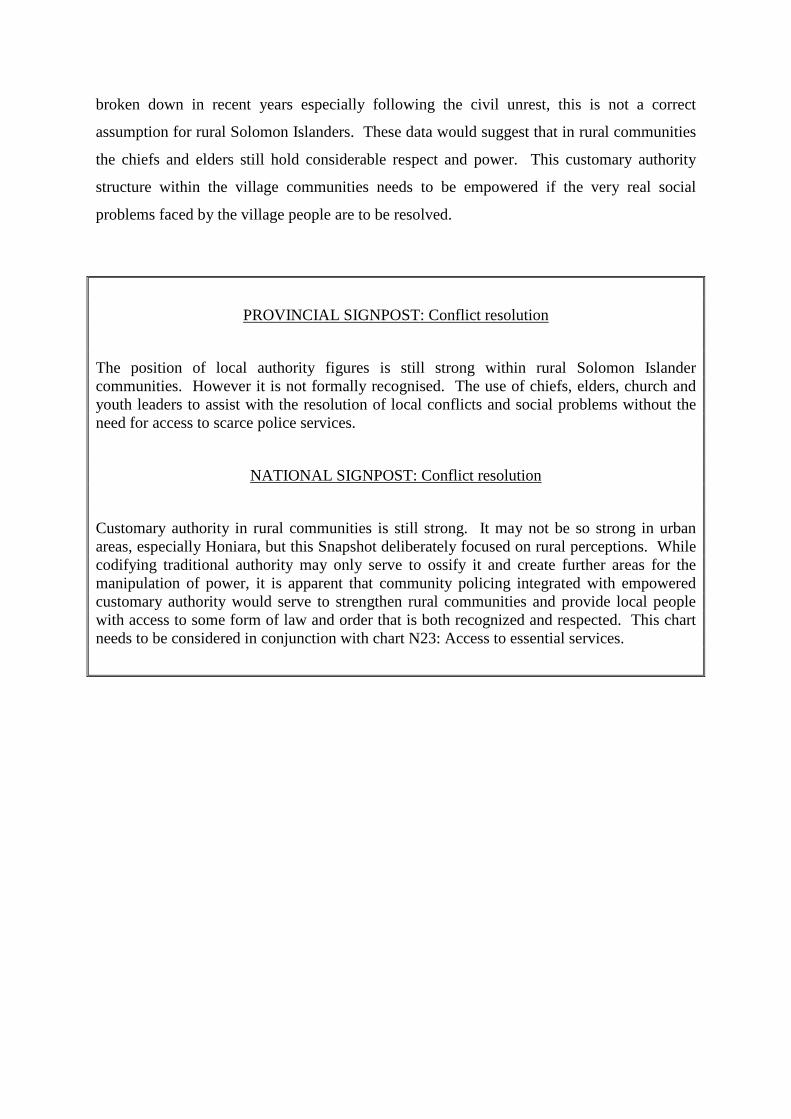
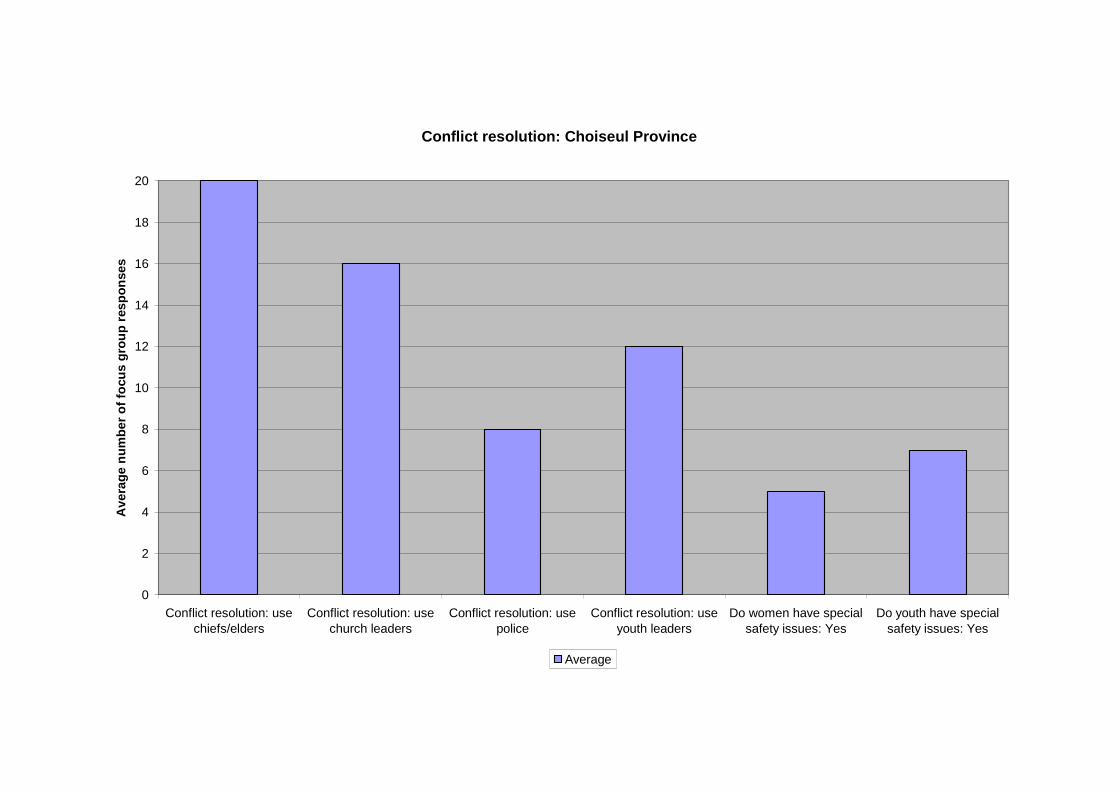
Choiseul Province All communities reported that they used chiefs and elders for
conflict resolution, 80 percent used church leaders and 60
percent used youth leaders. Only 40 percent reported that they
used police.
Isabel Province 95 percent of communities reported that they used chiefs and
elders for conflict resolution and 90 percent reported that they
used church leaders. While only 40 percent reported that they
used youth leaders, 60 percent stated that they used police.
Makira Province All communities surveyed in Makira Province reported that
they used chiefs and elders for conflict resolution and 95
percent used church leaders. Only 45 percent used youth
leaders: 65 percent used police.
RenBel Province In RenBel Province 88 percent of communities surveyed
reported that they preferred to use church leaders for conflict
resolution. 75 percent used police and only 63 percent used
chiefs and elders. No community reported the use of youth
leaders for conflict resolution.
Temotu Province All communities in Temotu Province used chiefs and elders
for conflict resolution. 86 percent used church leaders. Only
36 percent of communities surveyed used youth leaders but 64
percent used police for conflict resolution.
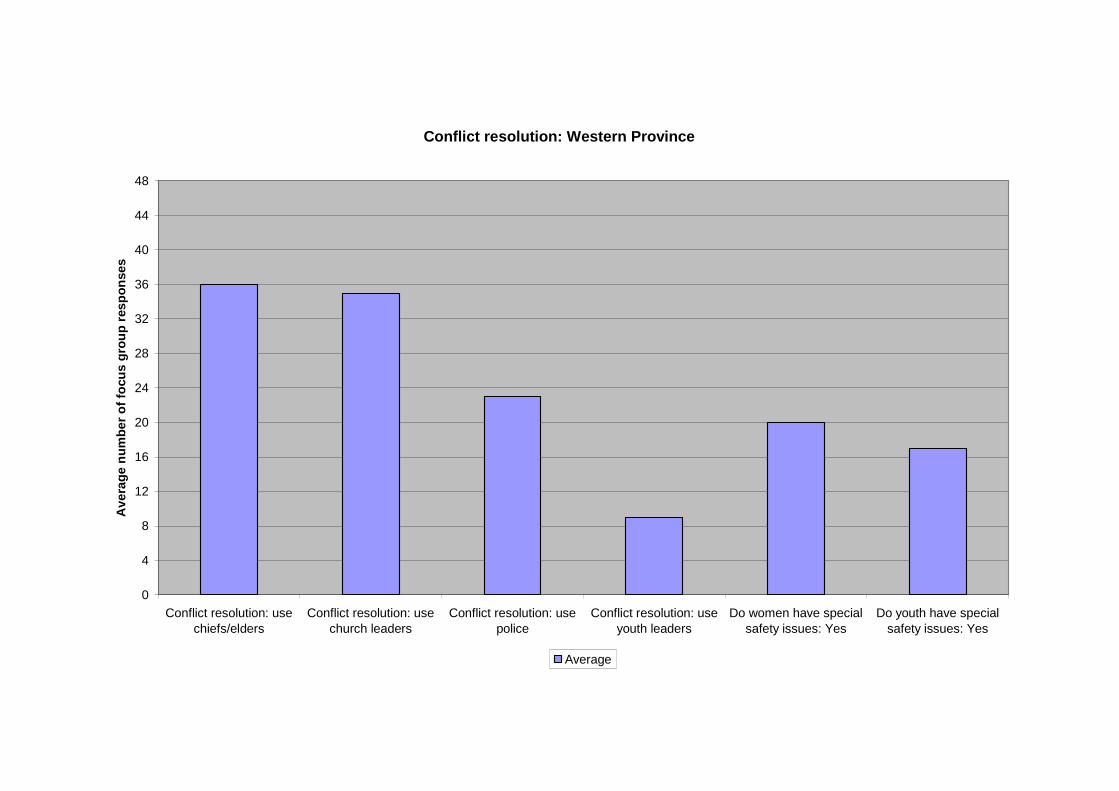
Western Province In Western Province 76 percent of communities reported that
they used chiefs and elders for conflict resolution and 74
percent reported that they used church leaders. Only 19
percent used youth leaders and 48 percent used police.
Issues:
It was reported in the National Snapshot that most rural communities utilise the local
authority structure of chiefs, elders, church leaders and youth leaders in preference to external
sources of authority such as the police. It is generally believed that traditional authority has
broken down in recent years especially following the civil unrest, this is not a correct
assumption for rural Solomon Islanders. These data would suggest that in rural communities
the chiefs and elders still hold considerable respect and power. This customary authority
structure within the village communities needs to be empowered if the very real social
problems faced by the village people are to be resolved.
PROVINCIAL SIGNPOST: Conflict resolution
The position of local authority figures is still strong within rural Solomon Islandercommunities. However it is not formally recognised. The use of chiefs, elders, church andyouth leaders to assist with the resolution of local conflicts and social problems without theneed for access to scarce police services.
NATIONAL SIGNPOST: Conflict resolution
Customary authority in rural communities is still strong. It may not be so strong in urbanareas, especially Honiara, but this Snapshot deliberately focused on rural perceptions. Whilecodifying traditional authority may only serve to ossify it and create further areas for themanipulation of power, it is apparent that community policing integrated with empoweredcustomary authority would serve to strengthen rural communities and provide local peoplewith access to some form of law and order that is both recognized and respected. This chartneeds to be considered in conjunction with chart N23: Access to essential services.
Conflict resolution: Central Province
0
2
4
6
8
10
12
14
16
18
Conflict resolution: use
chiefs/elders
Conflict resolution: use
church leaders
Conflict resolution: use
police
Conflict resolution: use
youth leaders
Do women have special
safety issues: Yes
Do youth have special
safety issues: Yes
Av
era
ge
nu
mb
er
of
foc
us
gro
up
res
po
ns
es
Average
Conflict resolution: Choiseul Province
0
2
4
6
8
10
12
14
16
18
20
Conflict resolution: usechiefs/elders
Conflict resolution: usechurch leaders
Conflict resolution: usepolice
Conflict resolution: useyouth leaders
Do women have specialsafety issues: Yes
Do youth have specialsafety issues: Yes
Av
era
ge
nu
mb
er
of
focu
sg
rou
pre
sp
on
se
s
Average
Conflict resolution: Isabel Province
0
2
4
6
8
10
12
14
16
18
20
Conflict resolution: usechiefs/elders
Conflict resolution: usechurch leaders
Conflict resolution: usepolice
Conflict resolution: useyouth leaders
Do women have specialsafety issues: Yes
Do youth have specialsafety issues: Yes
Av
era
ge
nu
mb
er
of
focu
sg
rou
pre
sp
on
se
s
Average
Conflict resolution: Makira Province
0
2
4
6
8
10
12
14
16
18
20
Conflict resolution: use
chiefs/elders
Conflict resolution: use
church leaders
Conflict resolution: use
police
Conflict resolution: use
youth leaders
Do women have special
safety issues: Yes
Do youth have special
safety issues: Yes
Av
era
ge
nu
mb
er
of
foc
us
gro
up
res
po
ns
es
Average
Conflict resolution: RenBel Province
0
1
2
3
4
5
6
7
8
Conflict resolution: use
chiefs/elders
Conflict resolution: use
church leaders
Conflict resolution: use
police
Conflict resolution: use
youth leaders
Do women have special
safety issues: Yes
Do youth have special
safety issues: Yes
Av
era
ge
nu
mb
er
of
foc
us
gro
up
res
po
ns
es
Average
Conflict resolution: Temotu Province
0
2
4
6
8
10
12
14
Conflict resolution: usechiefs/elders
Conflict resolution: usechurch leaders
Conflict resolution: usepolice
Conflict resolution: useyouth leaders
Do women have specialsafety issues: Yes
Do youth have specialsafety issues: Yes
Av
era
ge
nu
mb
er
of
focu
sg
rou
pre
sp
on
se
s
Average
Conflict resolution: Western Province
0
4
8
12
16
20
24
28
32
36
40
44
48
Conflict resolution: usechiefs/elders
Conflict resolution: usechurch leaders
Conflict resolution: usepolice
Conflict resolution: useyouth leaders
Do women have specialsafety issues: Yes
Do youth have specialsafety issues: Yes
Av
era
ge
nu
mb
er
of
focu
sg
rou
pre
sp
on
se
s
Average
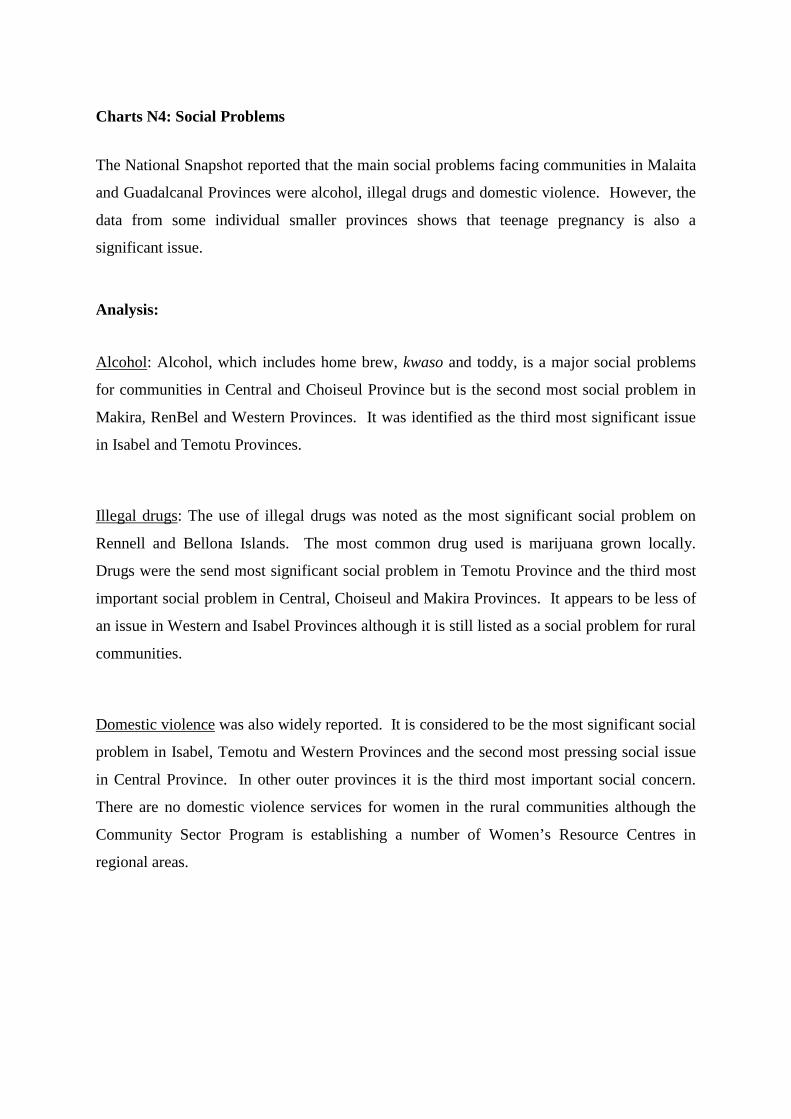
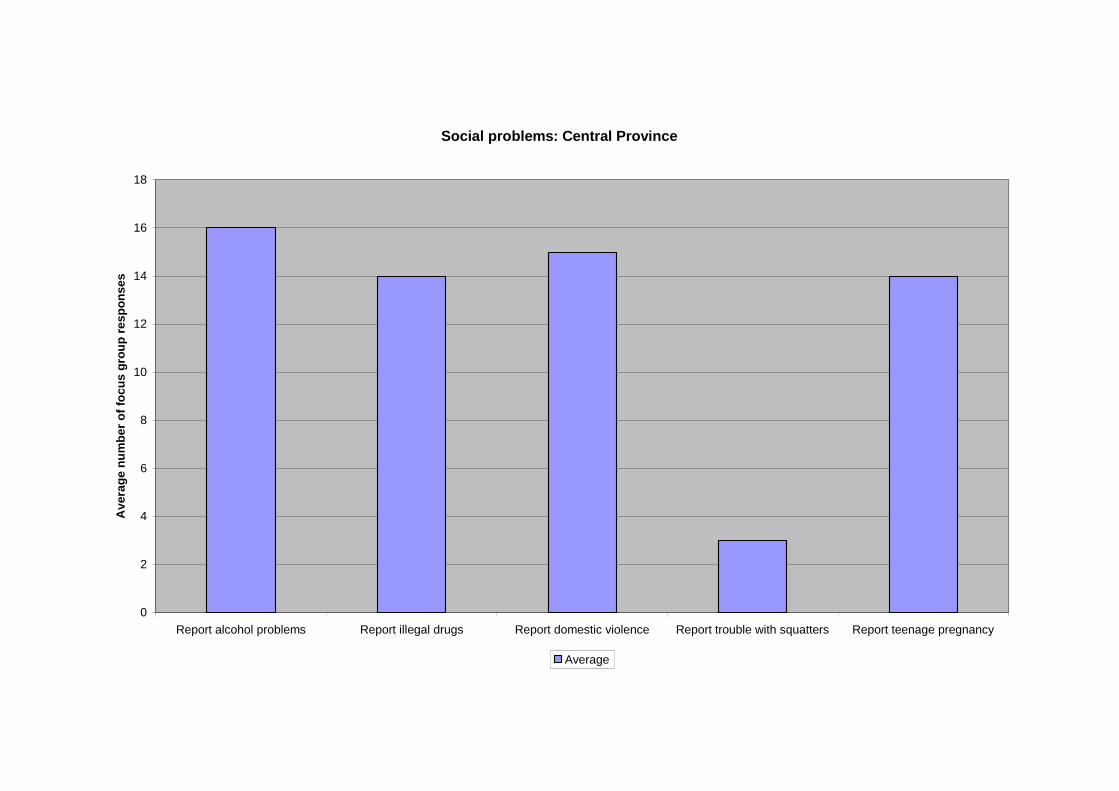
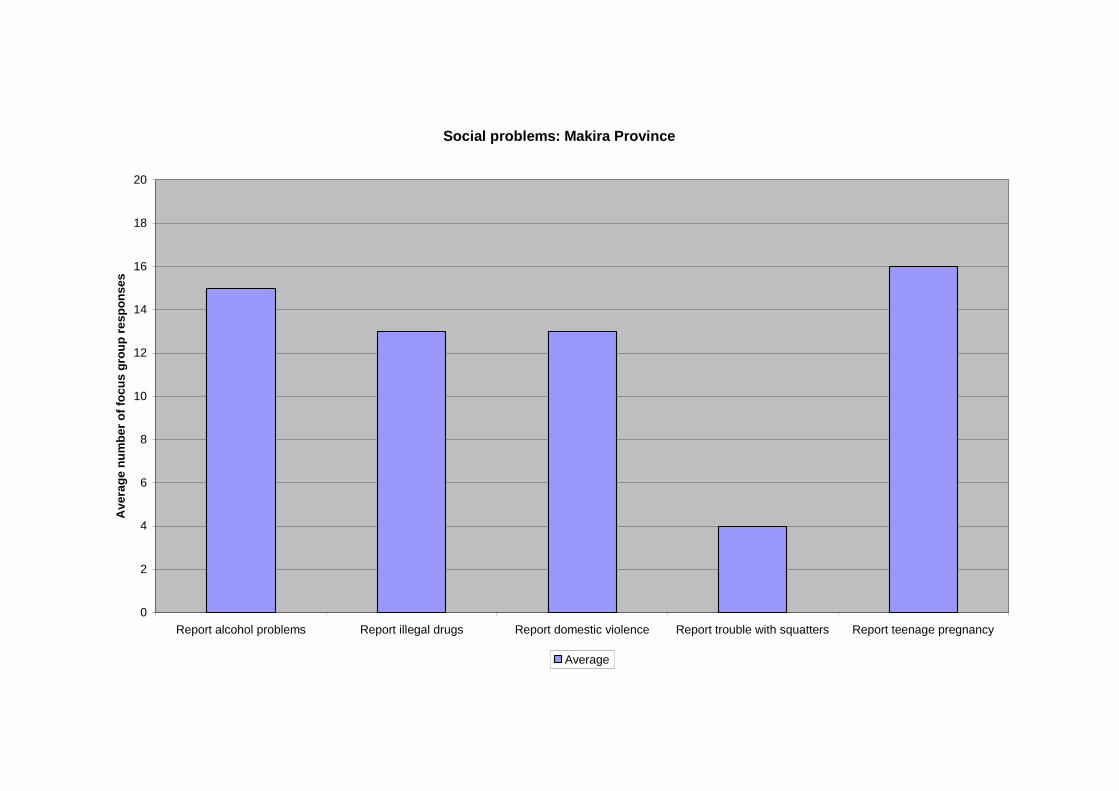
Charts N4: Social Problems
The National Snapshot reported that the main social problems facing communities in Malaita
and Guadalcanal Provinces were alcohol, illegal drugs and domestic violence. However, the
data from some individual smaller provinces shows that teenage pregnancy is also a
significant issue.
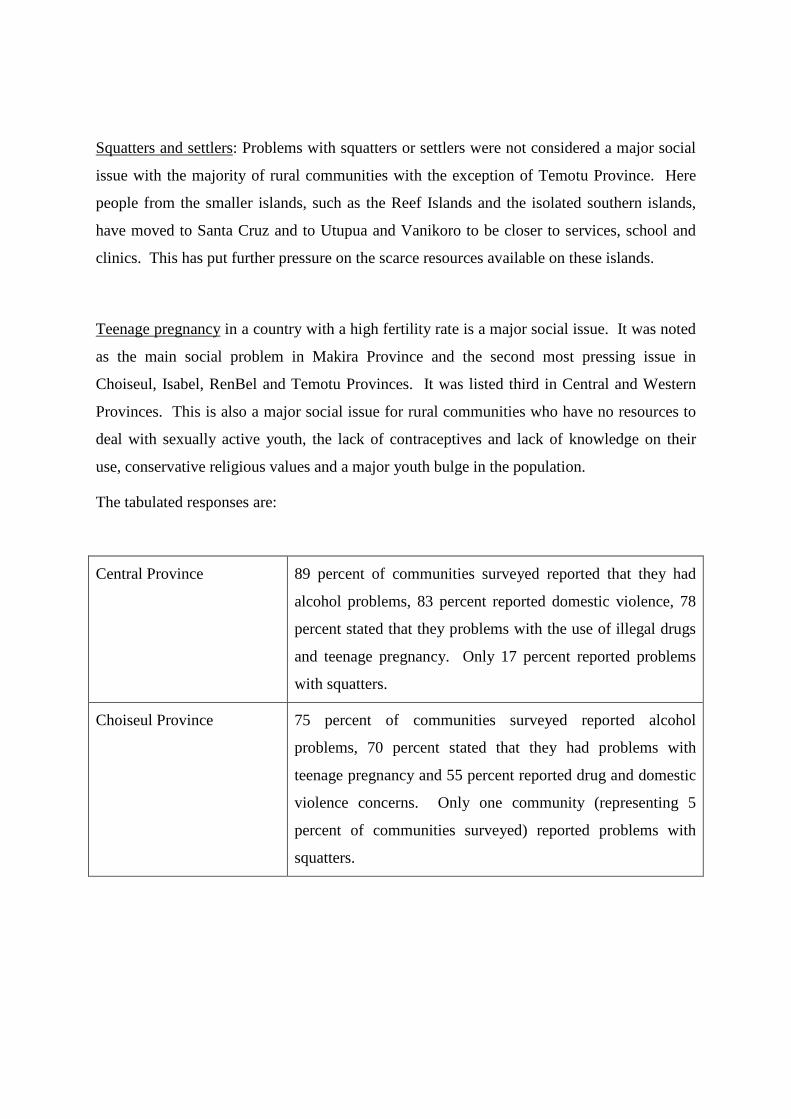
Analysis:
Alcohol: Alcohol, which includes home brew, kwaso and toddy, is a major social problems
for communities in Central and Choiseul Province but is the second most social problem in
Makira, RenBel and Western Provinces. It was identified as the third most significant issue
in Isabel and Temotu Provinces.
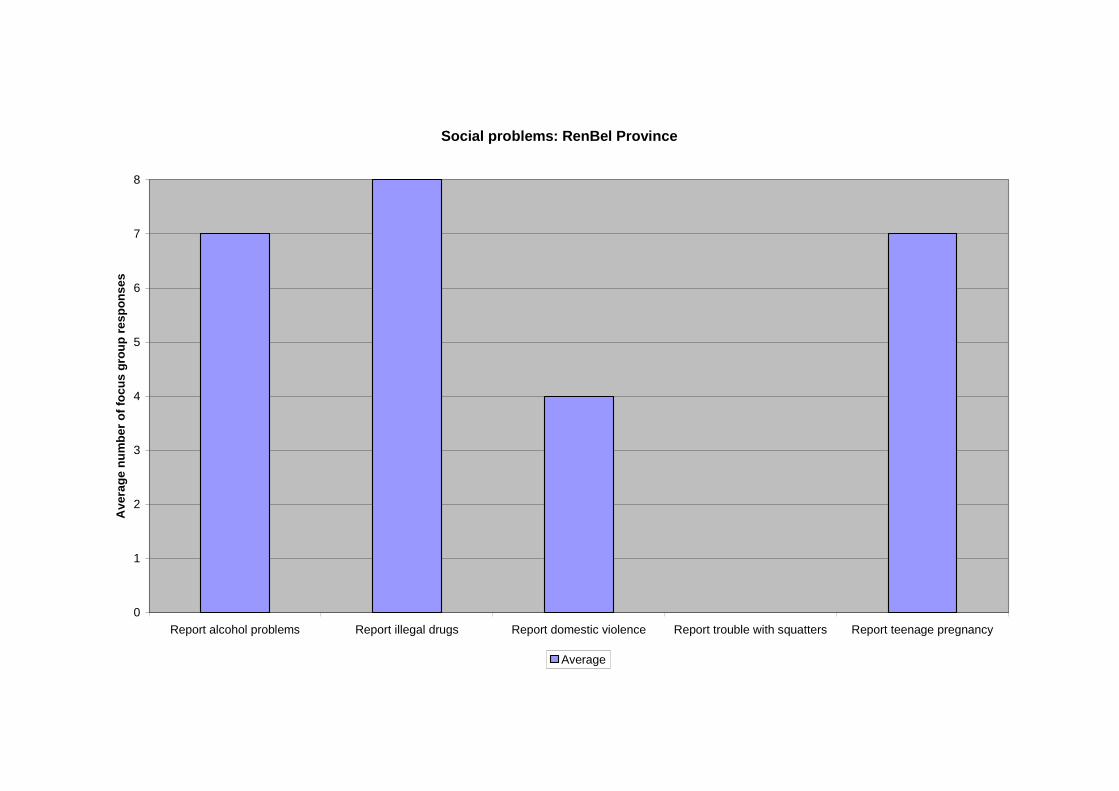
Illegal drugs: The use of illegal drugs was noted as the most significant social problem on
Rennell and Bellona Islands. The most common drug used is marijuana grown locally.
Drugs were the send most significant social problem in Temotu Province and the third most
important social problem in Central, Choiseul and Makira Provinces. It appears to be less of
an issue in Western and Isabel Provinces although it is still listed as a social problem for rural
communities.
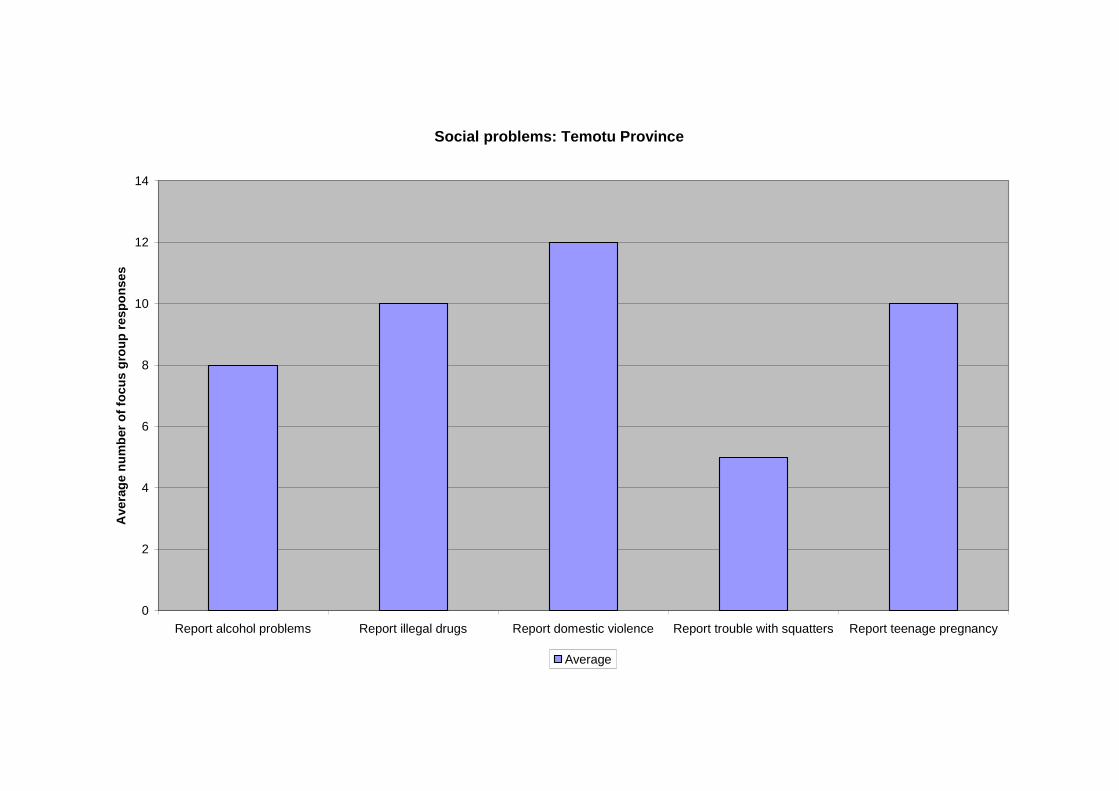
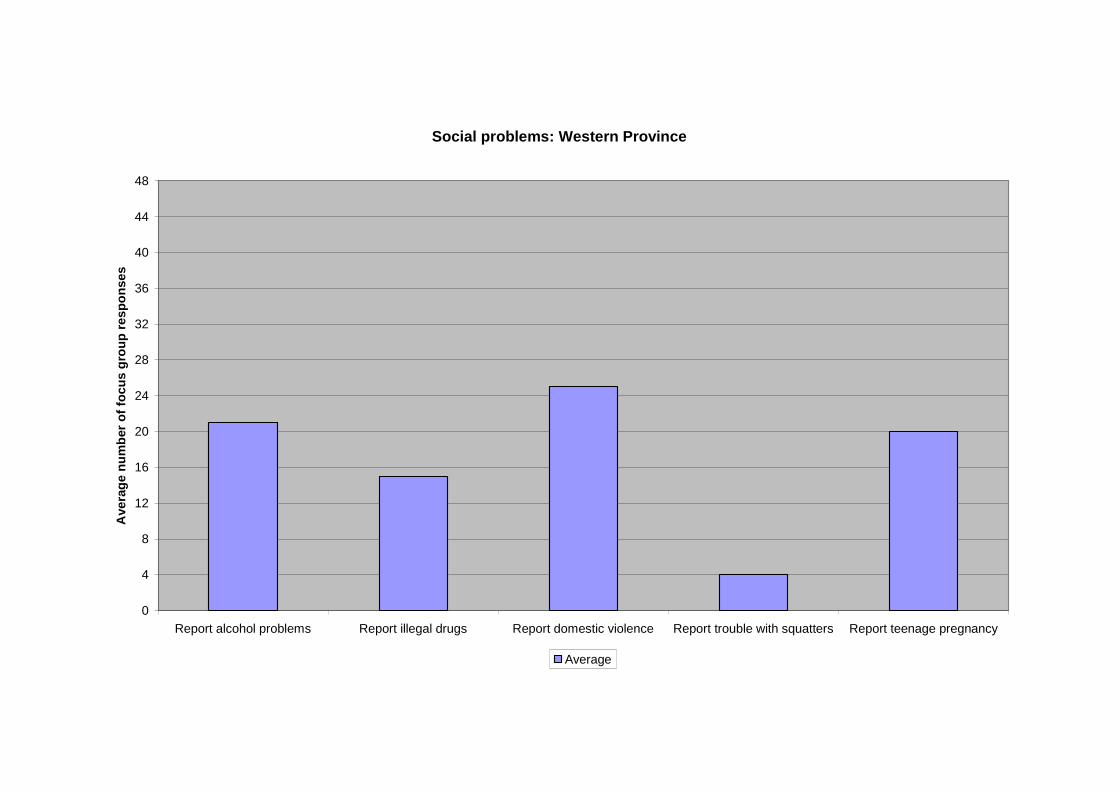
Domestic violence was also widely reported. It is considered to be the most significant social
problem in Isabel, Temotu and Western Provinces and the second most pressing social issue
in Central Province. In other outer provinces it is the third most important social concern.
There are no domestic violence services for women in the rural communities although the
Community Sector Program is establishing a number of Women’s Resource Centres in
regional areas.
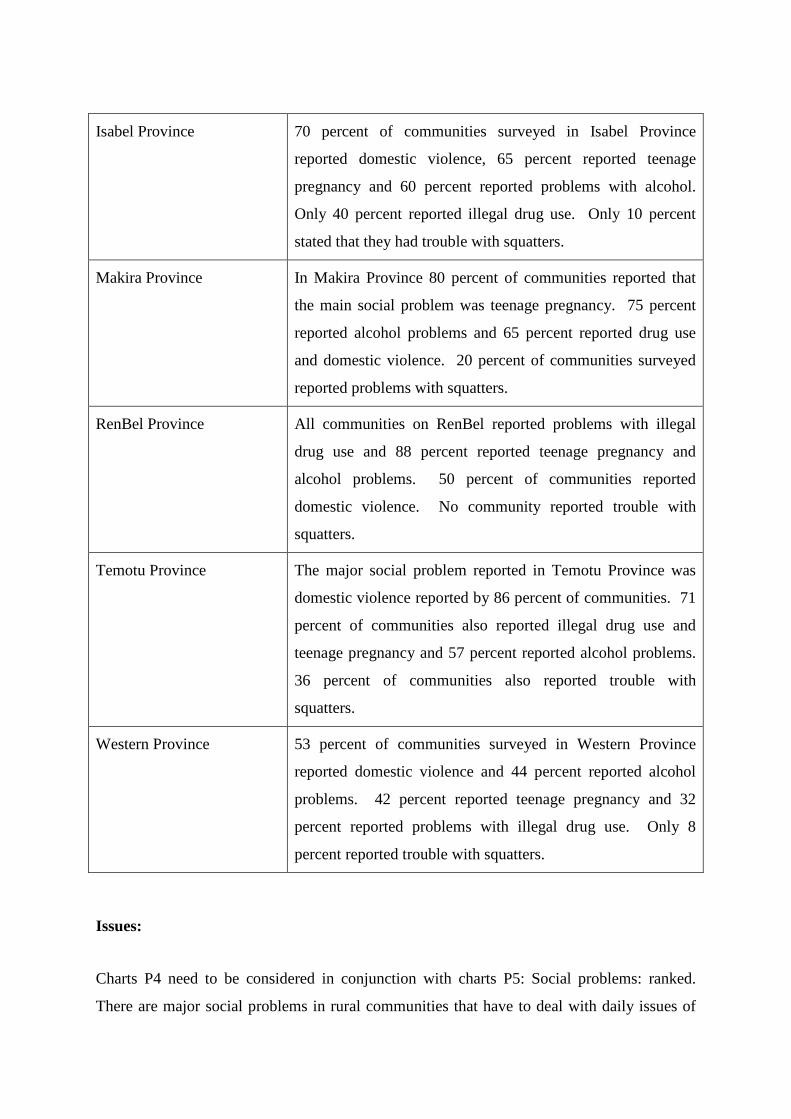
Squatters and settlers: Problems with squatters or settlers were not considered a major social
issue with the majority of rural communities with the exception of Temotu Province. Here
people from the smaller islands, such as the Reef Islands and the isolated southern islands,
have moved to Santa Cruz and to Utupua and Vanikoro to be closer to services, school and
clinics. This has put further pressure on the scarce resources available on these islands.
Teenage pregnancy in a country with a high fertility rate is a major social issue. It was noted
as the main social problem in Makira Province and the second most pressing issue in
Choiseul, Isabel, RenBel and Temotu Provinces. It was listed third in Central and Western
Provinces. This is also a major social issue for rural communities who have no resources to
deal with sexually active youth, the lack of contraceptives and lack of knowledge on their
use, conservative religious values and a major youth bulge in the population.
The tabulated responses are:
Central Province 89 percent of communities surveyed reported that they had
alcohol problems, 83 percent reported domestic violence, 78
percent stated that they problems with the use of illegal drugs
and teenage pregnancy. Only 17 percent reported problems
with squatters.
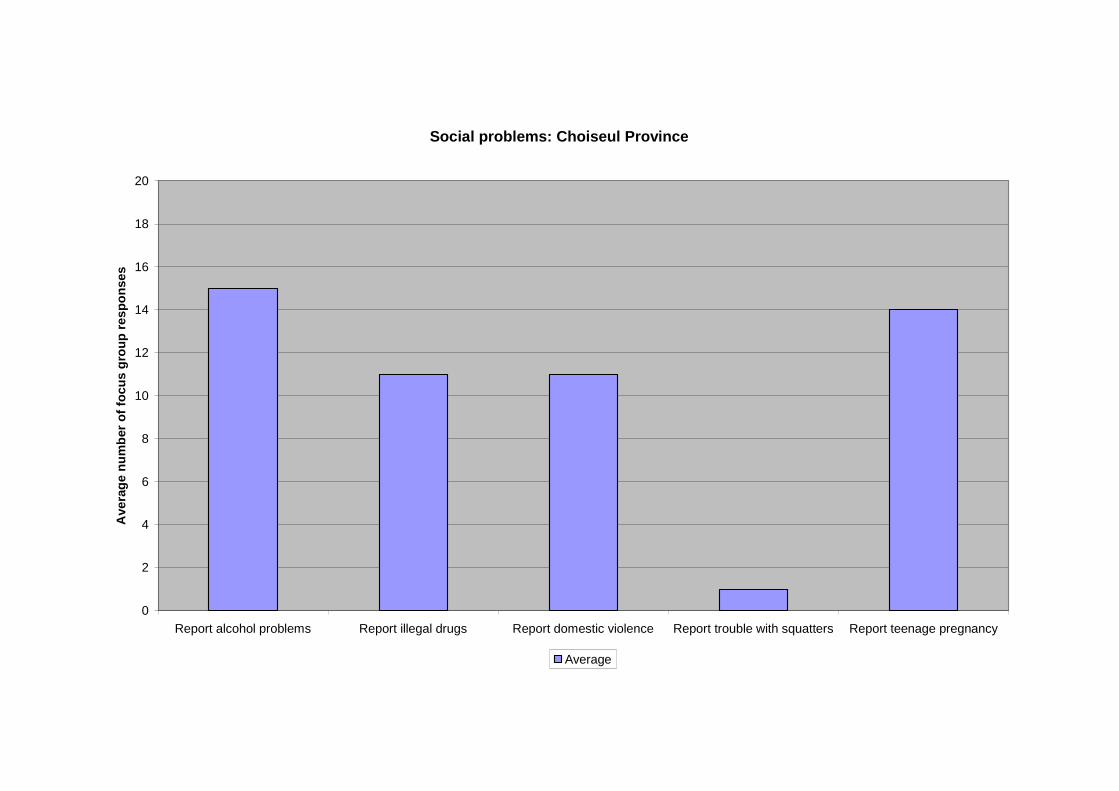
Choiseul Province 75 percent of communities surveyed reported alcohol
problems, 70 percent stated that they had problems with
teenage pregnancy and 55 percent reported drug and domestic
violence concerns. Only one community (representing 5
percent of communities surveyed) reported problems with
squatters.
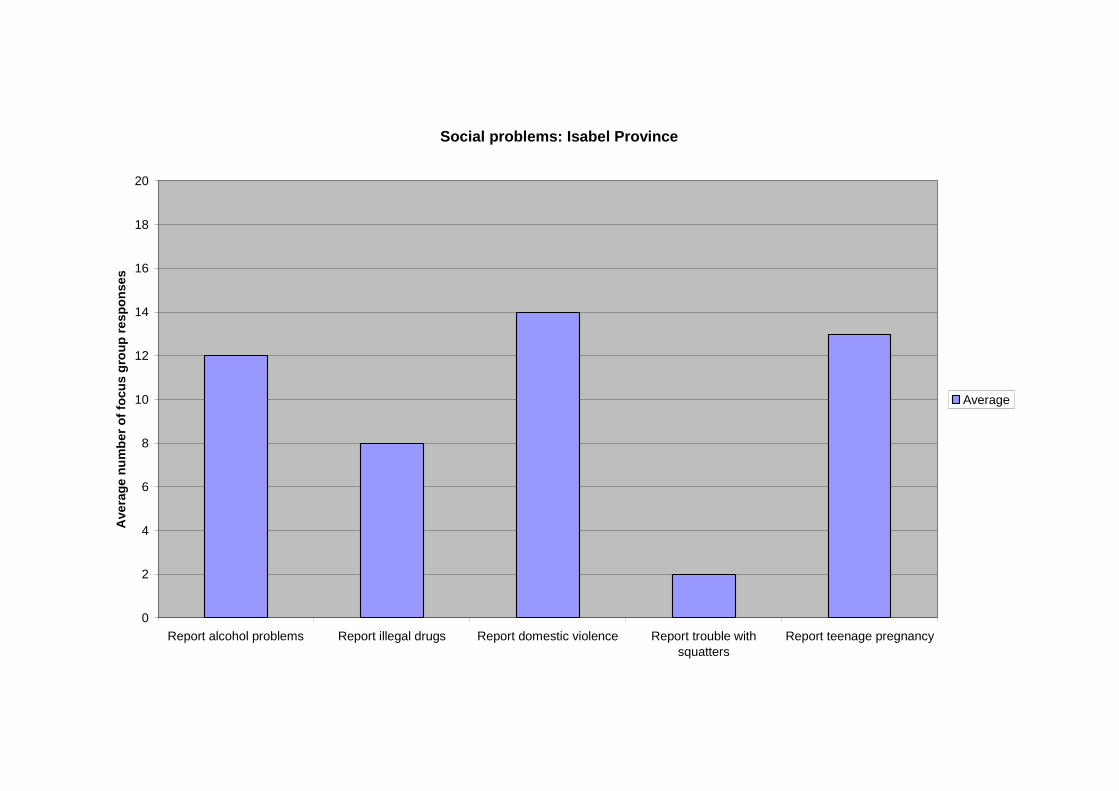
Isabel Province 70 percent of communities surveyed in Isabel Province
reported domestic violence, 65 percent reported teenage
pregnancy and 60 percent reported problems with alcohol.
Only 40 percent reported illegal drug use. Only 10 percent
stated that they had trouble with squatters.
Makira Province In Makira Province 80 percent of communities reported that
the main social problem was teenage pregnancy. 75 percent
reported alcohol problems and 65 percent reported drug use
and domestic violence. 20 percent of communities surveyed
reported problems with squatters.
RenBel Province All communities on RenBel reported problems with illegal
drug use and 88 percent reported teenage pregnancy and
alcohol problems. 50 percent of communities reported
domestic violence. No community reported trouble with
squatters.
Temotu Province The major social problem reported in Temotu Province was
domestic violence reported by 86 percent of communities. 71
percent of communities also reported illegal drug use and
teenage pregnancy and 57 percent reported alcohol problems.
36 percent of communities also reported trouble with
squatters.
Western Province 53 percent of communities surveyed in Western Province
reported domestic violence and 44 percent reported alcohol
problems. 42 percent reported teenage pregnancy and 32
percent reported problems with illegal drug use. Only 8
percent reported trouble with squatters.
Issues:
Charts P4 need to be considered in conjunction with charts P5: Social problems: ranked.
There are major social problems in rural communities that have to deal with daily issues of
alcohol and drug abuse, domestic violence and teenage pregnancy. The range of issues varies
within the provinces but all rural communities lack the resources, knowledge and power to be
able to effectively deal with these problems.
PROVINCIAL SIGNPOST: Social problems
Rural Solomon Islander communities are facing the same social issues that confront the moresophisticated urban communities in Honiara and in Australia. However, they have none ofthe resources or information needed to establish anti-substance abuse services, or servicesthat can combat domestic violence or mitigate against the high levels of teenage pregnancy.
NATIONAL SIGNPOST: Social problems
A conservative, rural Christian society like the Solomon Islands may find it hard to deal withthe major social dysfunction cause by alcohol, drugs, domestic violence and teenagepregnancy but they can weaken the fragile stability of village life unless treated.Communities face a range of major social problems such as alcohol abuse, most notablyhome brew and kwaso; illegal drugs that can be grown locally and sold throughout theislands; domestic violence which must be treated with respect for cultural norms and values;and teenage pregnancy. Villagers have little in the way of skills to deal with these issuesespecially if elders are also participants in alcohol abuse, domestic violence or have familieswith major social problems.
Social problems: Central Province
0
2
4
6
8
10
12
14
16
18
Report alcohol problems Report illegal drugs Report domestic violence Report trouble with squatters Report teenage pregnancy
Av
era
ge
nu
mb
er
of
foc
us
gro
up
res
po
ns
es
Average
Social problems: Choiseul Province
0
2
4
6
8
10
12
14
16
18
20
Report alcohol problems Report illegal drugs Report domestic violence Report trouble with squatters Report teenage pregnancy
Ave
rag
en
um
ber
of
foc
us
gro
up
res
po
ns
es
Average
Social problems: Isabel Province
0
2
4
6
8
10
12
14
16
18
20
Report alcohol problems Report illegal drugs Report domestic violence Report trouble withsquatters
Report teenage pregnancy
Ave
rag
en
um
be
ro
ffo
cu
sg
rou
pre
sp
on
se
s
Average
Social problems: Makira Province
0
2
4
6
8
10
12
14
16
18
20
Report alcohol problems Report illegal drugs Report domestic violence Report trouble with squatters Report teenage pregnancy
Av
era
ge
nu
mb
er
of
foc
us
gro
up
res
po
ns
es
Average
Social problems: RenBel Province
0
1
2
3
4
5
6
7
8
Report alcohol problems Report illegal drugs Report domestic violence Report trouble with squatters Report teenage pregnancy
Av
era
ge
nu
mb
er
of
foc
us
gro
up
res
po
ns
es
Average
Social problems: Temotu Province
0
2
4
6
8
10
12
14
Report alcohol problems Report illegal drugs Report domestic violence Report trouble with squatters Report teenage pregnancy
Ave
rag
en
um
ber
of
foc
us
gro
up
res
po
ns
es
Average
Social problems: Western Province
0
4
8
12
16
20
24
28
32
36
40
44
48
Report alcohol problems Report illegal drugs Report domestic violence Report trouble with squatters Report teenage pregnancy
Ave
rag
en
um
ber
of
foc
us
gro
up
res
po
ns
es
Average
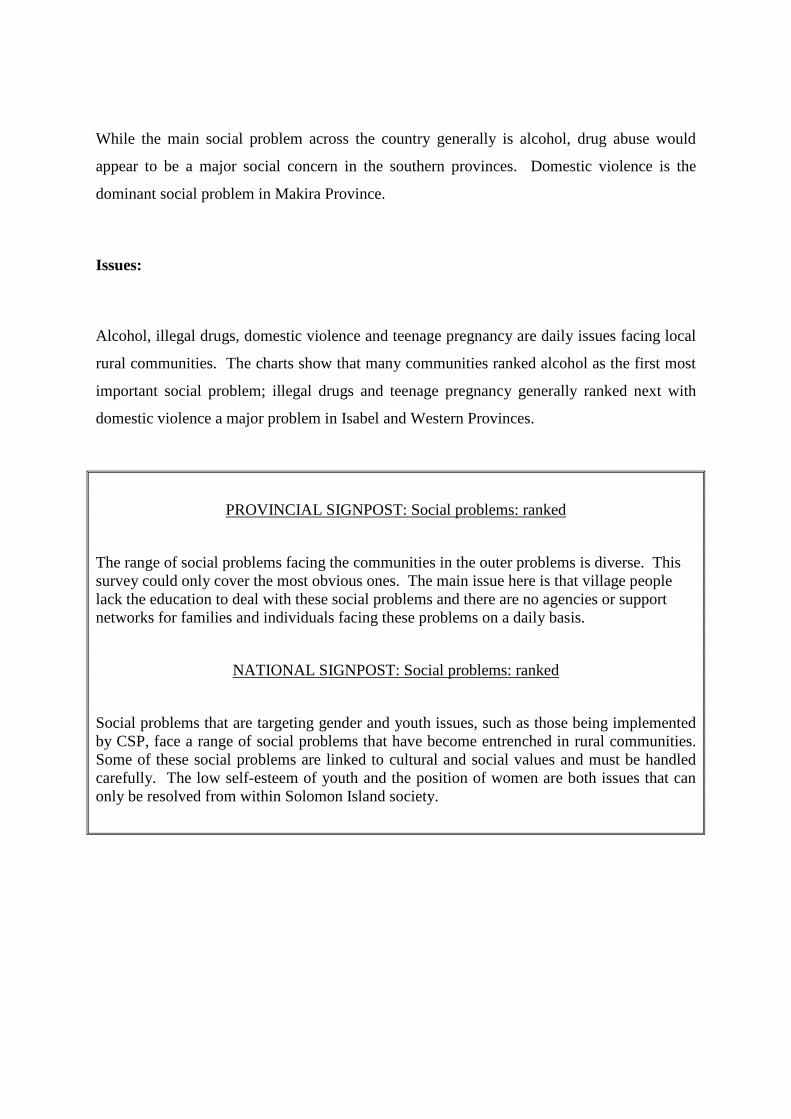
Charts P5: Social problems: ranked
Analysis:
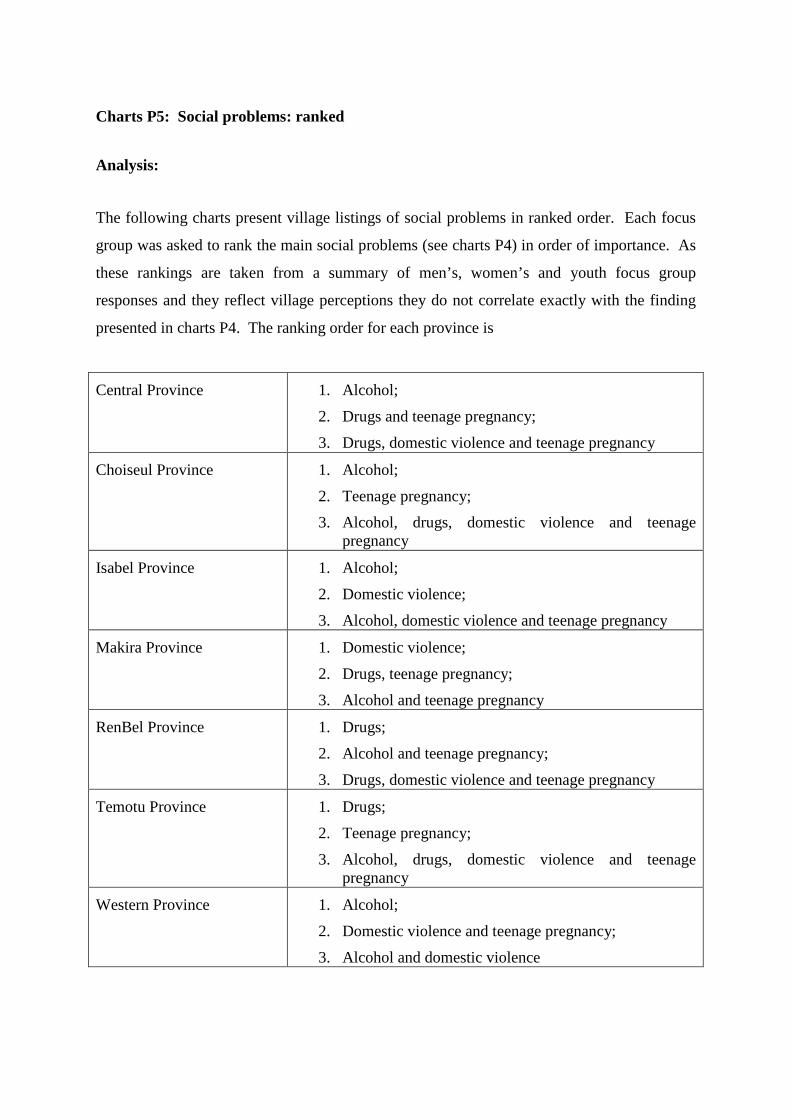
The following charts present village listings of social problems in ranked order. Each focus
group was asked to rank the main social problems (see charts P4) in order of importance. As
these rankings are taken from a summary of men’s, women’s and youth focus group
responses and they reflect village perceptions they do not correlate exactly with the finding
presented in charts P4. The ranking order for each province is
Central Province 1. Alcohol;
2. Drugs and teenage pregnancy;
3. Drugs, domestic violence and teenage pregnancy
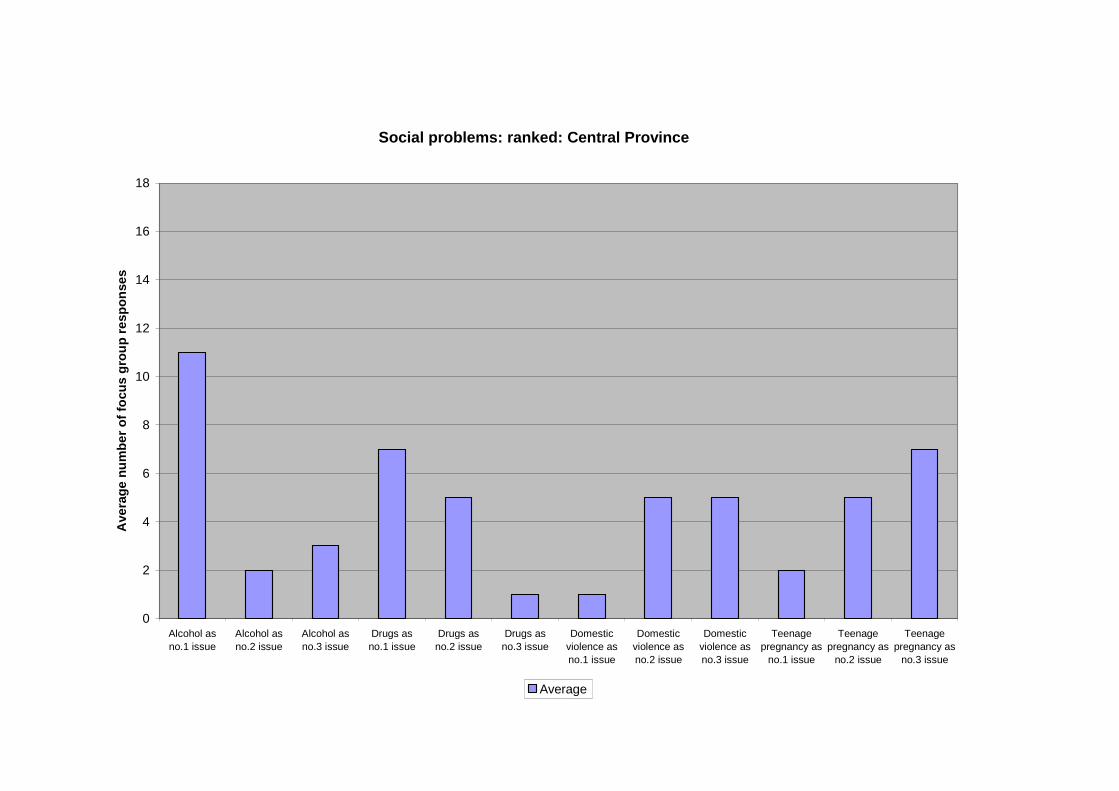
Choiseul Province 1. Alcohol;
2. Teenage pregnancy;
3. Alcohol, drugs, domestic violence and teenagepregnancy
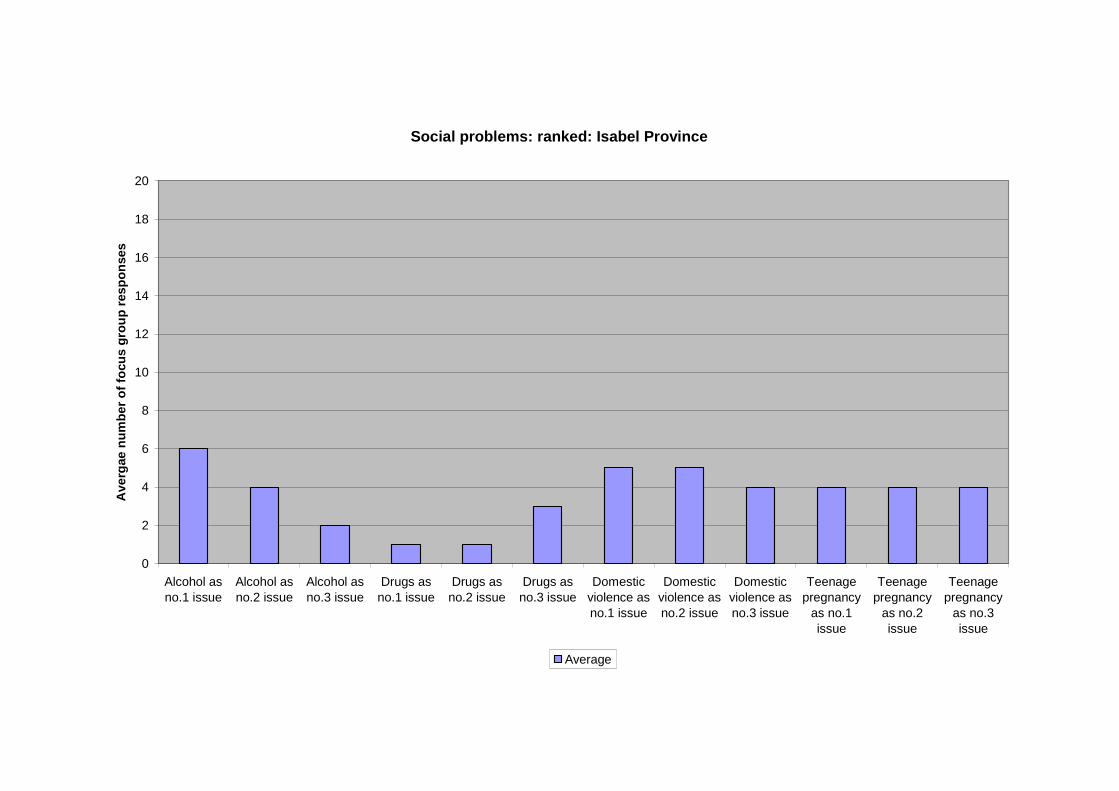
Isabel Province 1. Alcohol;
2. Domestic violence;
3. Alcohol, domestic violence and teenage pregnancy
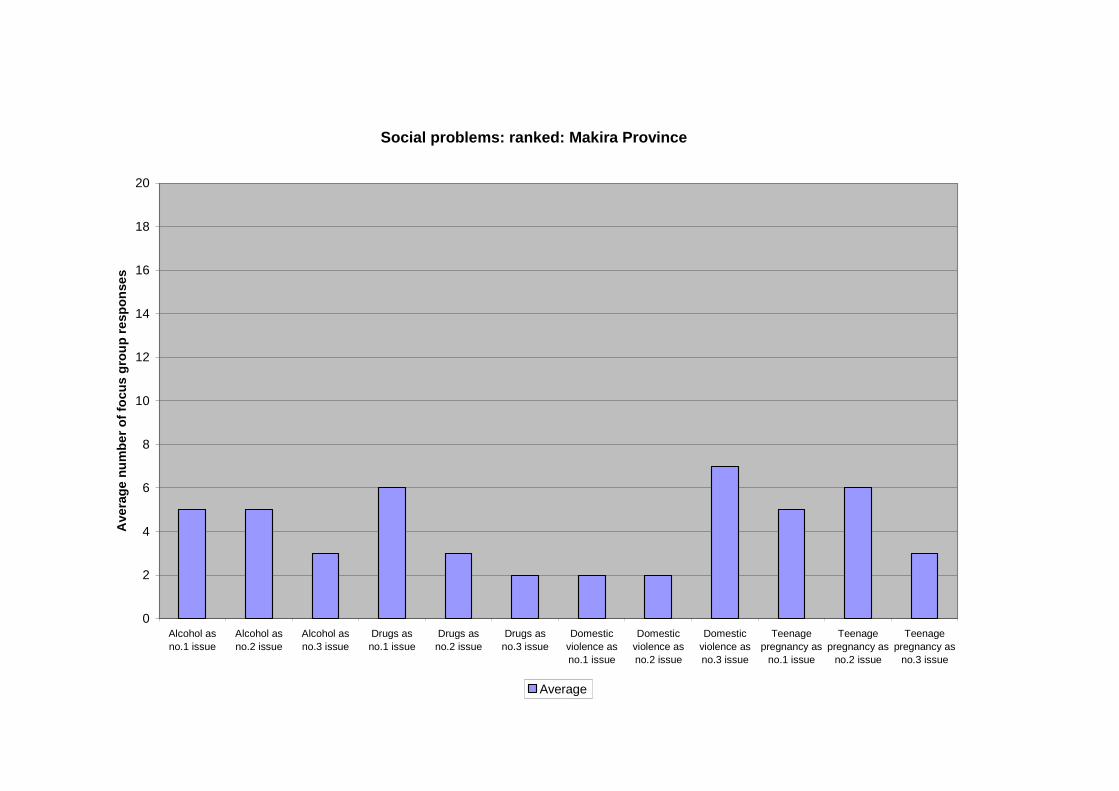
Makira Province 1. Domestic violence;
2. Drugs, teenage pregnancy;
3. Alcohol and teenage pregnancy
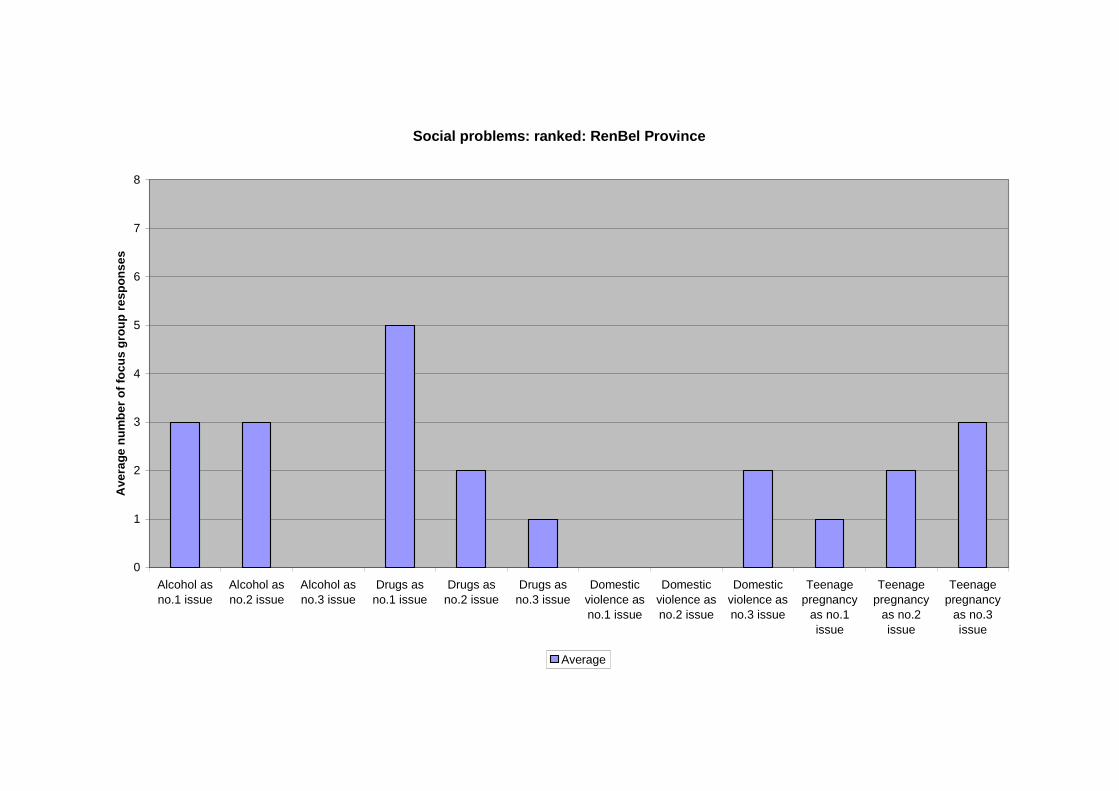
RenBel Province 1. Drugs;
2. Alcohol and teenage pregnancy;
3. Drugs, domestic violence and teenage pregnancy
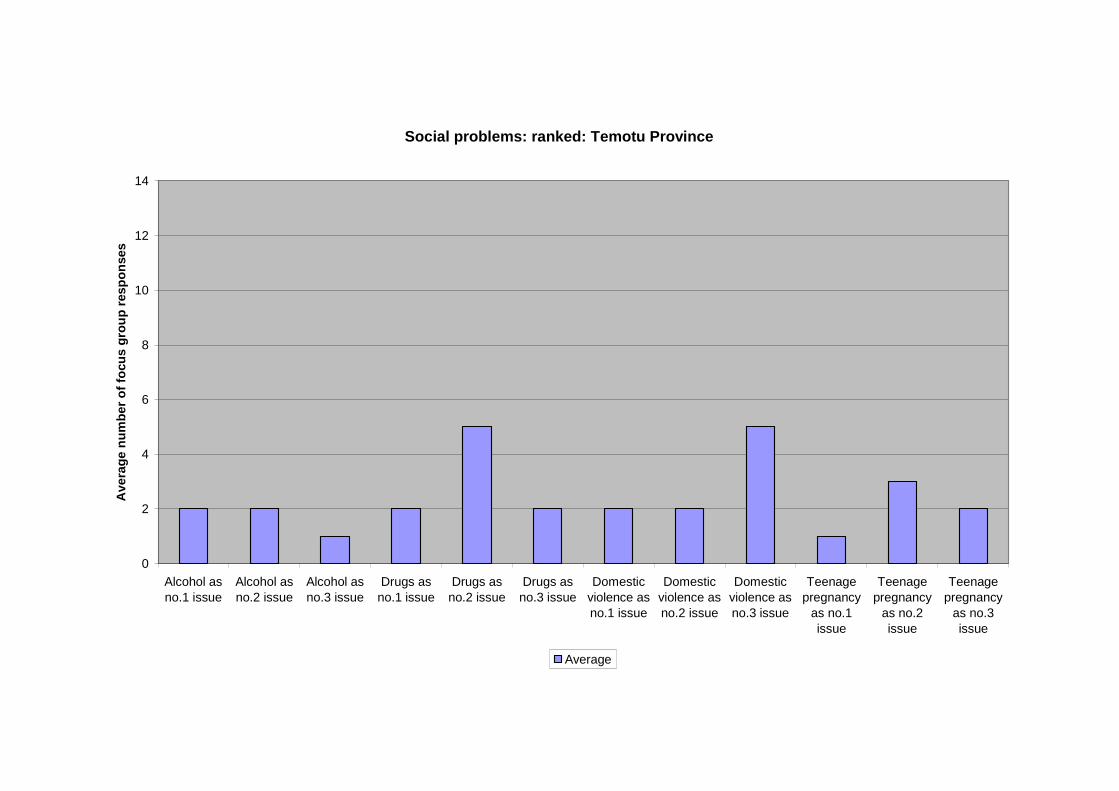
Temotu Province 1. Drugs;
2. Teenage pregnancy;
3. Alcohol, drugs, domestic violence and teenagepregnancy
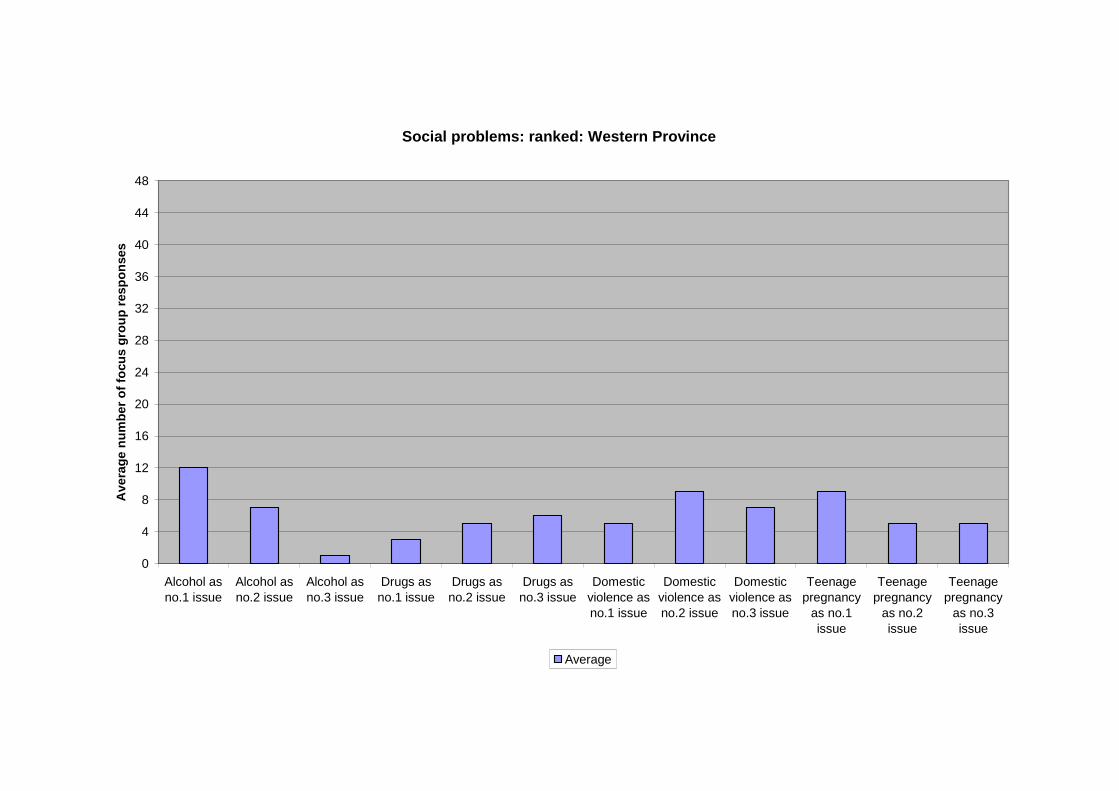
Western Province 1. Alcohol;
2. Domestic violence and teenage pregnancy;
3. Alcohol and domestic violence
While the main social problem across the country generally is alcohol, drug abuse would
appear to be a major social concern in the southern provinces. Domestic violence is the
dominant social problem in Makira Province.
Issues:
Alcohol, illegal drugs, domestic violence and teenage pregnancy are daily issues facing local
rural communities. The charts show that many communities ranked alcohol as the first most
important social problem; illegal drugs and teenage pregnancy generally ranked next with
domestic violence a major problem in Isabel and Western Provinces.
PROVINCIAL SIGNPOST: Social problems: ranked
The range of social problems facing the communities in the outer problems is diverse. Thissurvey could only cover the most obvious ones. The main issue here is that village peoplelack the education to deal with these social problems and there are no agencies or supportnetworks for families and individuals facing these problems on a daily basis.
NATIONAL SIGNPOST: Social problems: ranked
Social problems that are targeting gender and youth issues, such as those being implementedby CSP, face a range of social problems that have become entrenched in rural communities.Some of these social problems are linked to cultural and social values and must be handledcarefully. The low self-esteem of youth and the position of women are both issues that canonly be resolved from within Solomon Island society.
Social problems: ranked: Central Province
0
2
4
6
8
10
12
14
16
18
Alcohol as
no.1 issue
Alcohol as
no.2 issue
Alcohol as
no.3 issue
Drugs as
no.1 issue
Drugs as
no.2 issue
Drugs as
no.3 issue
Domestic
violence as
no.1 issue
Domestic
violence as
no.2 issue
Domestic
violence as
no.3 issue
Teenage
pregnancy as
no.1 issue
Teenage
pregnancy as
no.2 issue
Teenage
pregnancy as
no.3 issue
Ave
rag
en
um
be
ro
ffo
cu
sg
rou
pre
sp
on
se
s
Average

Social problems: ranked: Choiseul Province
0
2
4
6
8
10
12
14
16
18
20
Alcohol asno.1 issue
Alcohol asno.2 issue
Alcohol asno.3 issue
Drugs asno.1 issue
Drugs asno.2 issue
Drugs asno.3 issue
Domesticviolence asno.1 issue
Domesticviolence asno.2 issue
Domesticviolence asno.3 issue
Teenagepregnancy
as no.1issue
Teenagepregnancy
as no.2issue
Teenagepregnancy
as no.3issue
Av
era
ge
nu
mb
er
of
focu
sg
rou
pre
sp
on
se
s
Average
Social problems: ranked: Isabel Province
0
2
4
6
8
10
12
14
16
18
20
Alcohol asno.1 issue
Alcohol asno.2 issue
Alcohol asno.3 issue
Drugs asno.1 issue
Drugs asno.2 issue
Drugs asno.3 issue
Domesticviolence asno.1 issue
Domesticviolence asno.2 issue
Domesticviolence asno.3 issue
Teenagepregnancy
as no.1issue
Teenagepregnancy
as no.2issue
Teenagepregnancy
as no.3issue
Av
erg
ae
nu
mb
er
of
focu
sg
rou
pre
sp
on
se
s
Average
Social problems: ranked: Makira Province
0
2
4
6
8
10
12
14
16
18
20
Alcohol as
no.1 issue
Alcohol as
no.2 issue
Alcohol as
no.3 issue
Drugs as
no.1 issue
Drugs as
no.2 issue
Drugs as
no.3 issue
Domestic
violence as
no.1 issue
Domestic
violence as
no.2 issue
Domestic
violence as
no.3 issue
Teenage
pregnancy as
no.1 issue
Teenage
pregnancy as
no.2 issue
Teenage
pregnancy as
no.3 issue
Ave
rag
en
um
be
ro
ffo
cu
sg
rou
pre
sp
on
se
s
Average

Social problems: ranked: RenBel Province
0
1
2
3
4
5
6
7
8
Alcohol as
no.1 issue
Alcohol as
no.2 issue
Alcohol as
no.3 issue
Drugs as
no.1 issue
Drugs as
no.2 issue
Drugs as
no.3 issue
Domestic
violence as
no.1 issue
Domestic
violence as
no.2 issue
Domestic
violence as
no.3 issue
Teenage
pregnancy
as no.1
issue
Teenage
pregnancy
as no.2
issue
Teenage
pregnancy
as no.3
issue
Ave
rag
en
um
be
ro
ffo
cu
sg
rou
pre
sp
on
se
s
Average
Social problems: ranked: Temotu Province
0
2
4
6
8
10
12
14
Alcohol asno.1 issue
Alcohol asno.2 issue
Alcohol asno.3 issue
Drugs asno.1 issue
Drugs asno.2 issue
Drugs asno.3 issue
Domesticviolence asno.1 issue
Domesticviolence asno.2 issue
Domesticviolence asno.3 issue
Teenagepregnancy
as no.1issue
Teenagepregnancy
as no.2issue
Teenagepregnancy
as no.3issue
Av
era
ge
nu
mb
er
of
focu
sg
rou
pre
sp
on
se
s
Average
Social problems: ranked: Western Province
0
4
8
12
16
20
24
28
32
36
40
44
48
Alcohol asno.1 issue
Alcohol asno.2 issue
Alcohol asno.3 issue
Drugs asno.1 issue
Drugs asno.2 issue
Drugs asno.3 issue
Domesticviolence asno.1 issue
Domesticviolence asno.2 issue
Domesticviolence asno.3 issue
Teenagepregnancy
as no.1issue
Teenagepregnancy
as no.2issue
Teenagepregnancy
as no.3issue
Av
era
ge
nu
mb
er
of
focu
sg
rou
pre
sp
on
se
s
Average
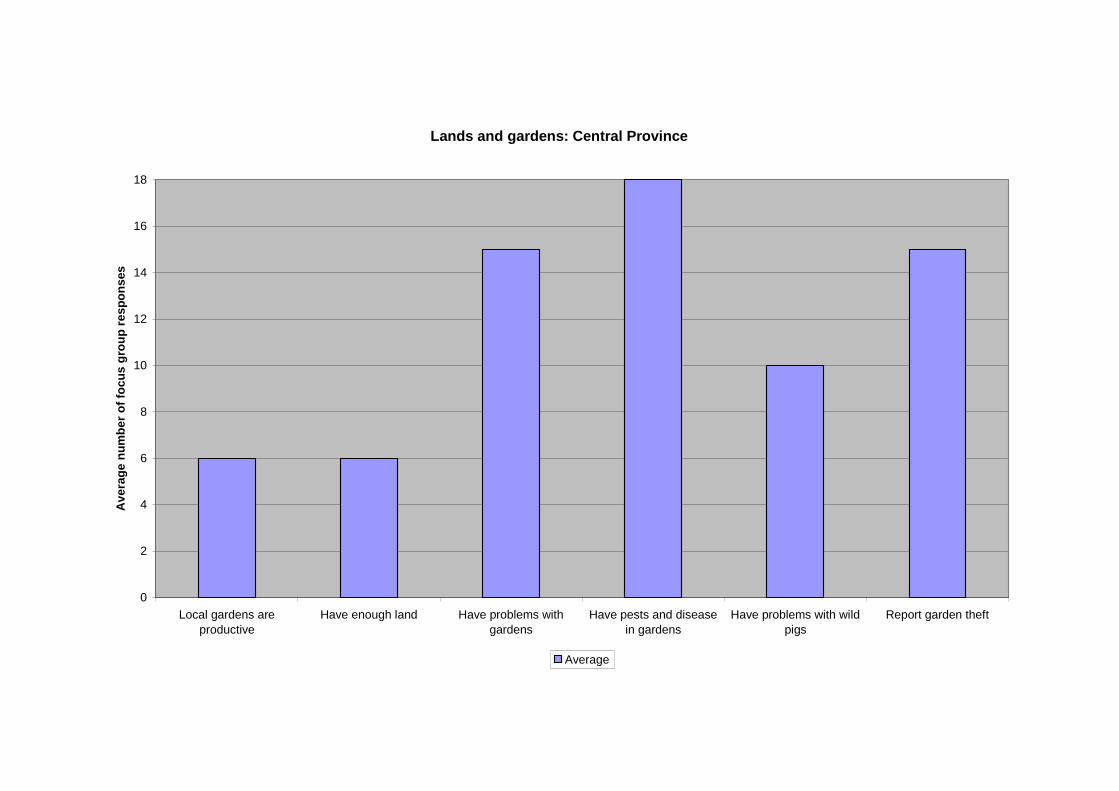
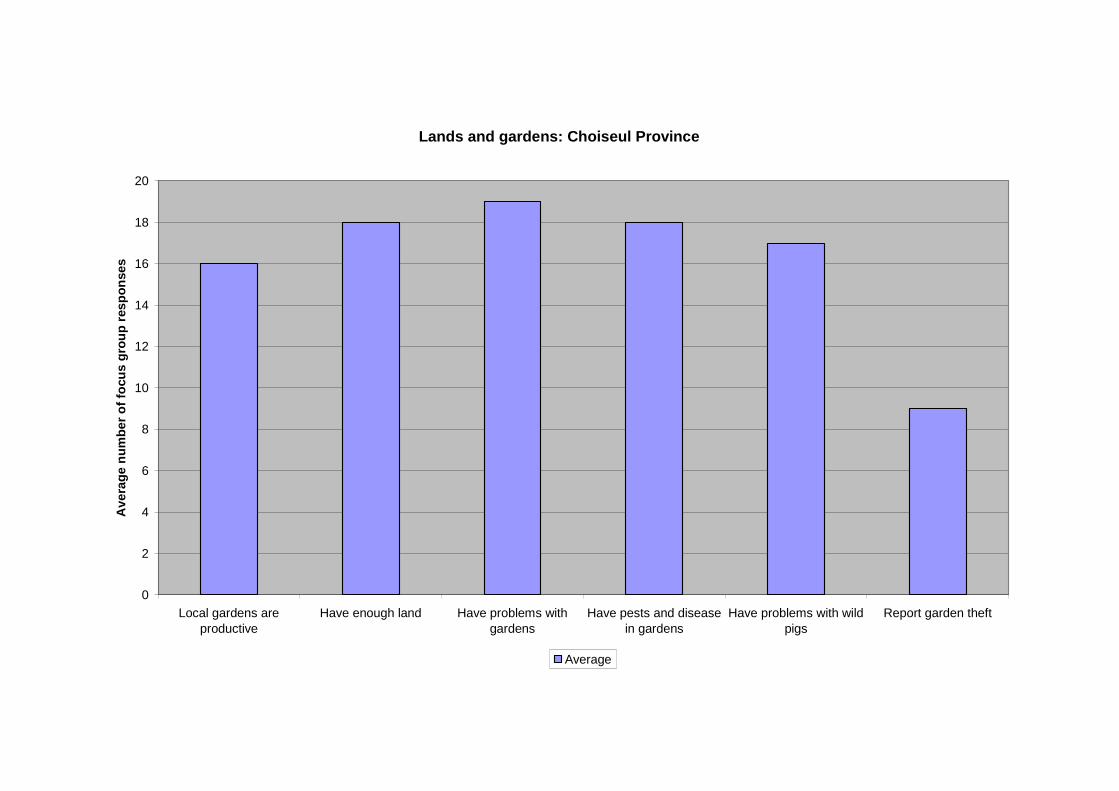
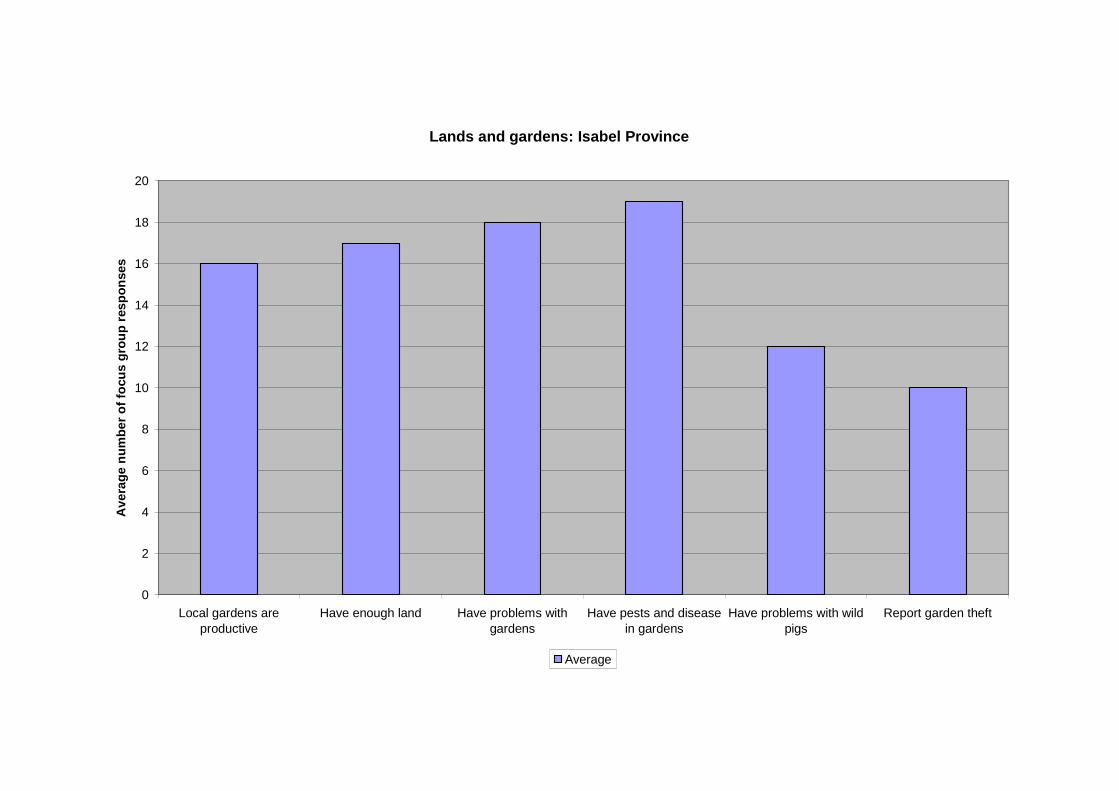
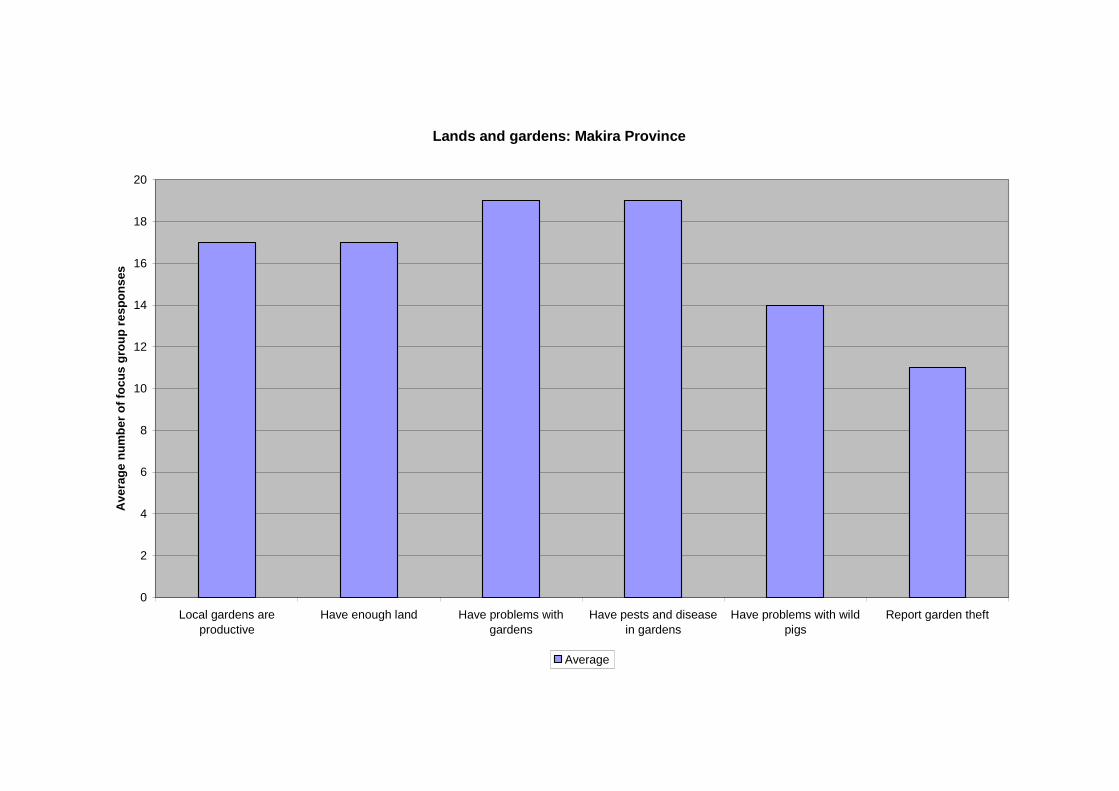
Charts P6: Lands and gardens
The National Snapshot report highlighted the growing problem with land pressure in the
Solomon Islands as a result of increasing rural populations, the declining yield of the gardens,
a shorter fallow period and increasing pests and diseases. All provinces report high levels of
problems in gardens, particularly associated with pests and diseases.
Analysis:
Only in Temotu do less than 60 percent of people report that they have problems with
gardens. However, all communities in Central, RenBel and Temotu Provinces state that they
have pests and diseases in their gardens and more than 80 percent of people in all provinces
other than Temotu report problems with their gardens. This should be viewed together with
the chart on Livelihoods and Agricultural Extension Services. All communities except those
on Central and Temotu Province state that they have productive gardens and enough land.
More than 50 percent of communities surveyed have problems with wild pigs except for the
communities on RenBel which has no problem with feral pigs and in Western where only 38
percent of communities surveyed have problems with pigs. However the number of
communities in all provinces that report garden theft is high: more than 50 percent except in
Choiseul Province. On RenBel where gardens are productive it is as high as 88 percent, but
on Temotu where gardens are not as productive it is even higher at 93 percent. The tabulated
responses are:
Central Province All communities surveyed in Central Province reported pests
and diseases in their gardens and 83 percent reported other
general garden problems and garden theft. 56 percent of
communities in Central Province have trouble with wild pigs
and only 33 percent of communities state that they have
enough land and that the gardens are productive.
Choiseul Province While 80 percent of gardens in Choiseul are productive and 90
percent of people surveyed report that they have enough land,
95 percent also stated that they have problems with gardens
and 90 percent have pests and diseases in the gardens. 85
percent have trouble with wild pigs but only 45 percent report
garden theft.
Isabel Province 80 percent of people surveyed stated that they have productive
gardens and 85 percent reported that they have enough land
but 90 percent reported problems with their gardens and 95
percent stated that they have pests and diseases in the gardens.
60 percent report trouble with wild pigs and 50 percent report
garden theft.
Makira Province 85 percent of communities reported that they have productive
gardens and enough land but 95 percent of communities
reported troubles with the gardens and pests and diseases. 70
percent of communities stated that they have trouble with wild
pigs and 55 percent report garden theft.
RenBel Province While all communities surveyed reported problems with
gardens and pests and diseases, 88 percent also reported that
the gardens were productive and that they had enough land. A
very high percentage of communities (88 percent) also report
garden theft.
Temotu Province All communities surveyed report pests and diseases and 93
percent, the highest for the outer provinces, report garden
theft. 57 percent of communities have problems with gardens
and trouble with wild pigs. 50 percent state that the gardens
are productive but only 36 percent report that they have
enough land.
Western Province 90 percent of communities report pests and diseases, 82
percent report problems with their gardens but 78 percent state
that they have enough land and 76 percent that they have
productive gardens. 53 percent report garden theft but only 38
percent state that they have trouble with wild pigs.
Issues:
These issues all illustrate potential land pressure in the Solomon Islands. Eighty five percent
of the population of the country is dependant on gardening land for daily survival and many
of these people also sell surplus produce for cash to pay for school fees, household items like
soap, kerosene and rice and for medical care. As reported in the National Snapshot report,
garden theft is a growing issue in all regional areas as people find it more difficult to maintain
jobs and gardens, some people find gardening tedious, hard work and most gardens are
unguarded and established along walking trails where theft is relatively easy. There is also
the issue of jealousy: some people steal from good gardens simply because they are jealous of
the garden owner’s ability to grow good crops.
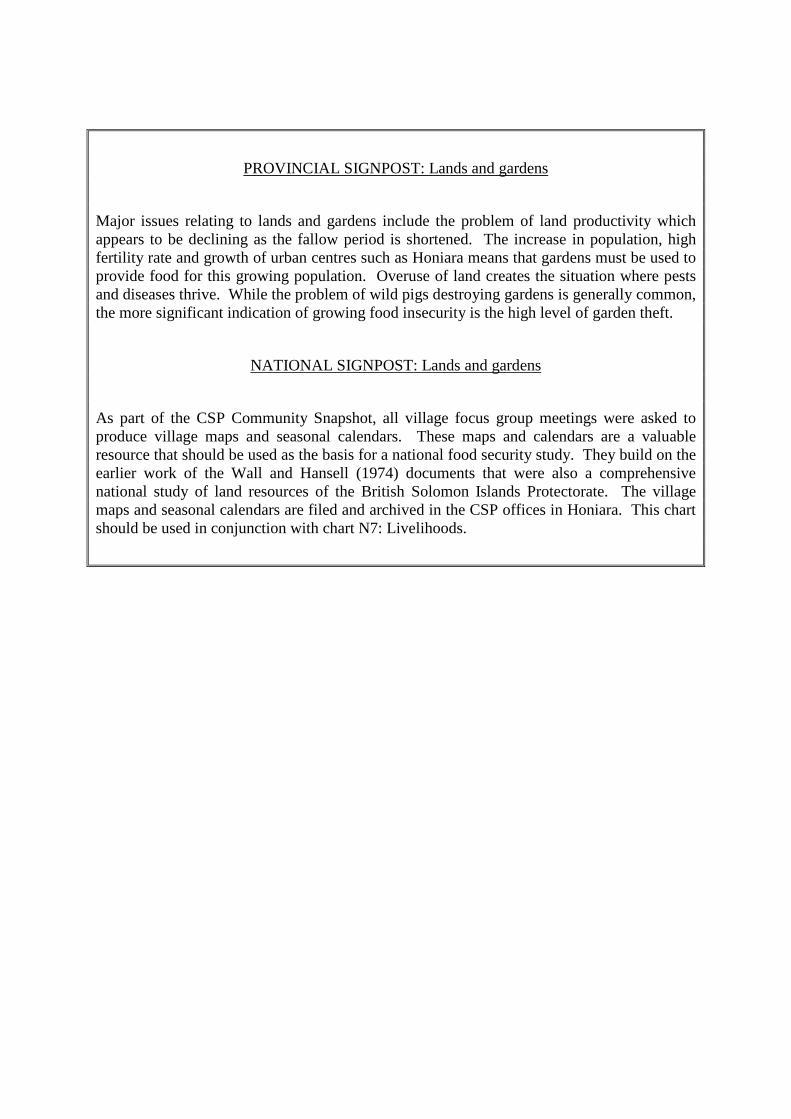
PROVINCIAL SIGNPOST: Lands and gardens
Major issues relating to lands and gardens include the problem of land productivity whichappears to be declining as the fallow period is shortened. The increase in population, highfertility rate and growth of urban centres such as Honiara means that gardens must be used toprovide food for this growing population. Overuse of land creates the situation where pestsand diseases thrive. While the problem of wild pigs destroying gardens is generally common,the more significant indication of growing food insecurity is the high level of garden theft.
NATIONAL SIGNPOST: Lands and gardens
As part of the CSP Community Snapshot, all village focus group meetings were asked toproduce village maps and seasonal calendars. These maps and calendars are a valuableresource that should be used as the basis for a national food security study. They build on theearlier work of the Wall and Hansell (1974) documents that were also a comprehensivenational study of land resources of the British Solomon Islands Protectorate. The villagemaps and seasonal calendars are filed and archived in the CSP offices in Honiara. This chartshould be used in conjunction with chart N7: Livelihoods.
Lands and gardens: Central Province
0
2
4
6
8
10
12
14
16
18
Local gardens are
productive
Have enough land Have problems with
gardens
Have pests and disease
in gardens
Have problems with wild
pigs
Report garden theft
Av
era
ge
nu
mb
er
of
foc
us
gro
up
res
po
ns
es
Average
Lands and gardens: Choiseul Province
0
2
4
6
8
10
12
14
16
18
20
Local gardens areproductive
Have enough land Have problems withgardens
Have pests and diseasein gardens
Have problems with wildpigs
Report garden theft
Av
era
ge
nu
mb
er
of
focu
sg
rou
pre
sp
on
se
s
Average
Lands and gardens: Isabel Province
0
2
4
6
8
10
12
14
16
18
20
Local gardens areproductive
Have enough land Have problems withgardens
Have pests and diseasein gardens
Have problems with wildpigs
Report garden theft
Av
era
ge
nu
mb
er
of
focu
sg
rou
pre
sp
on
se
s
Average
Lands and gardens: Makira Province
0
2
4
6
8
10
12
14
16
18
20
Local gardens are
productive
Have enough land Have problems with
gardens
Have pests and disease
in gardens
Have problems with wild
pigs
Report garden theft
Av
era
ge
nu
mb
er
of
foc
us
gro
up
res
po
ns
es
Average
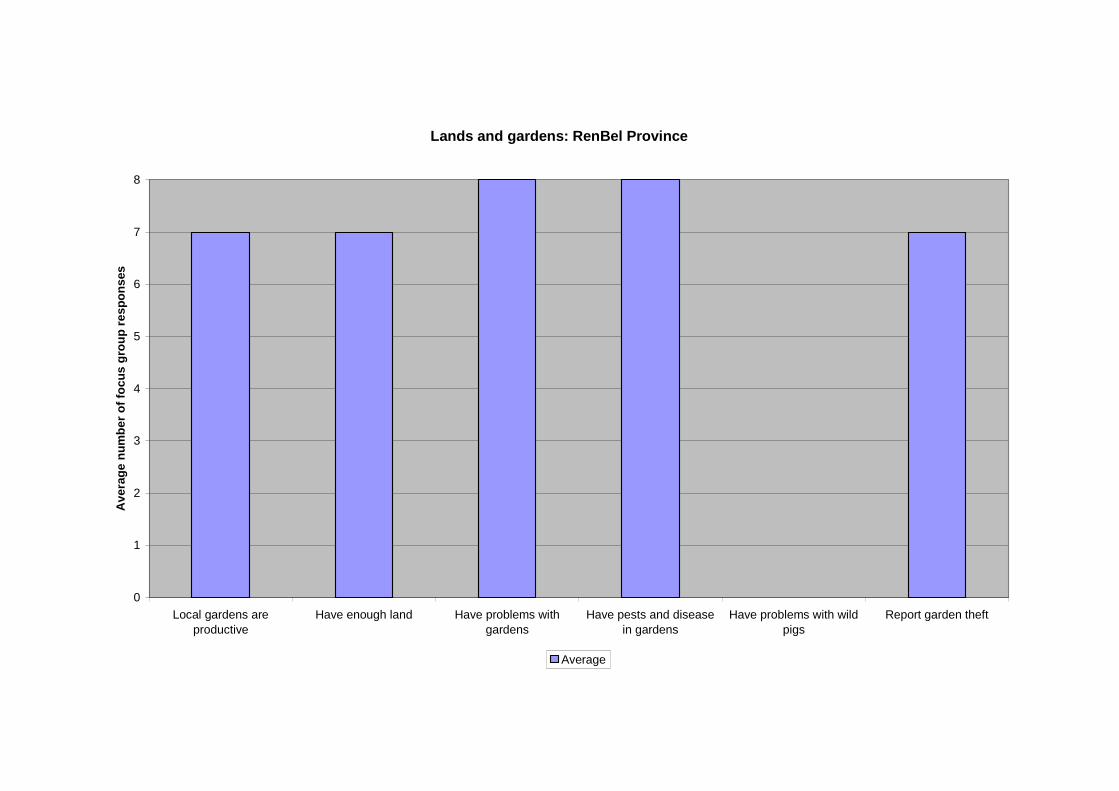
Lands and gardens: RenBel Province
0
1
2
3
4
5
6
7
8
Local gardens are
productive
Have enough land Have problems with
gardens
Have pests and disease
in gardens
Have problems with wild
pigs
Report garden theft
Av
era
ge
nu
mb
er
of
foc
us
gro
up
res
po
ns
es
Average
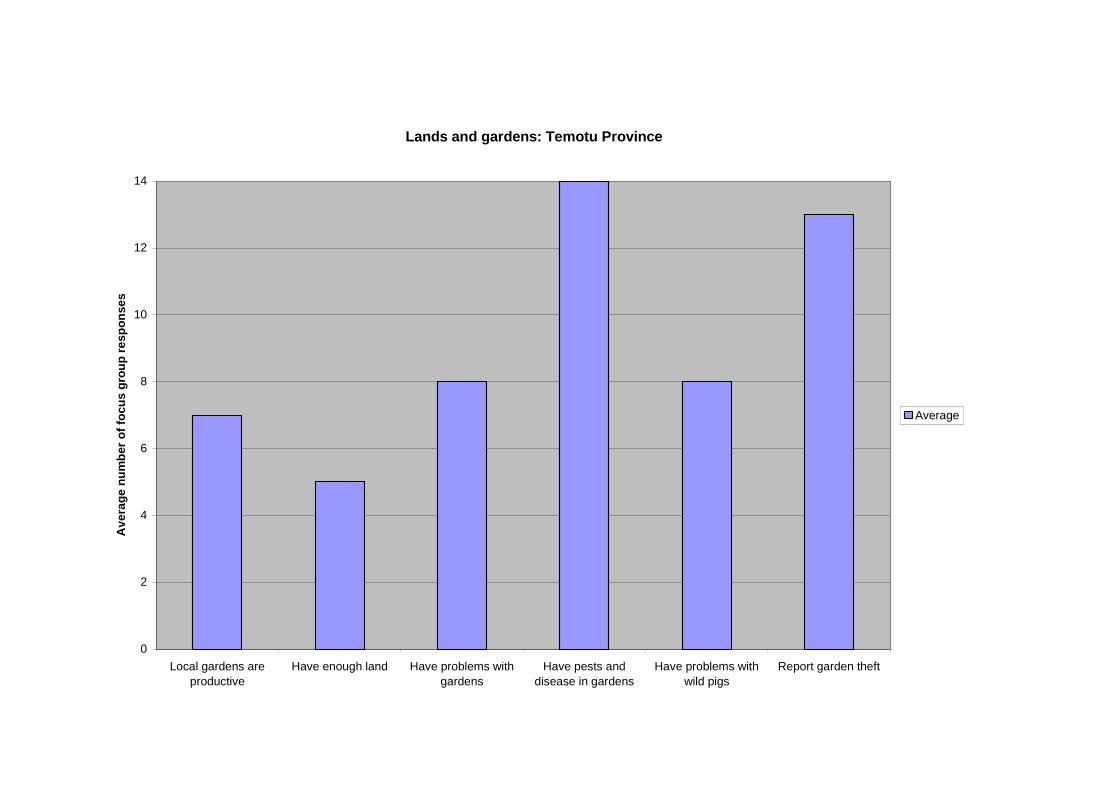
Lands and gardens: Temotu Province
0
2
4
6
8
10
12
14
Local gardens are
productive
Have enough land Have problems with
gardens
Have pests and
disease in gardens
Have problems with
wild pigs
Report garden theft
Av
era
ge
nu
mb
er
of
focu
sg
rou
pre
sp
on
se
s
Average

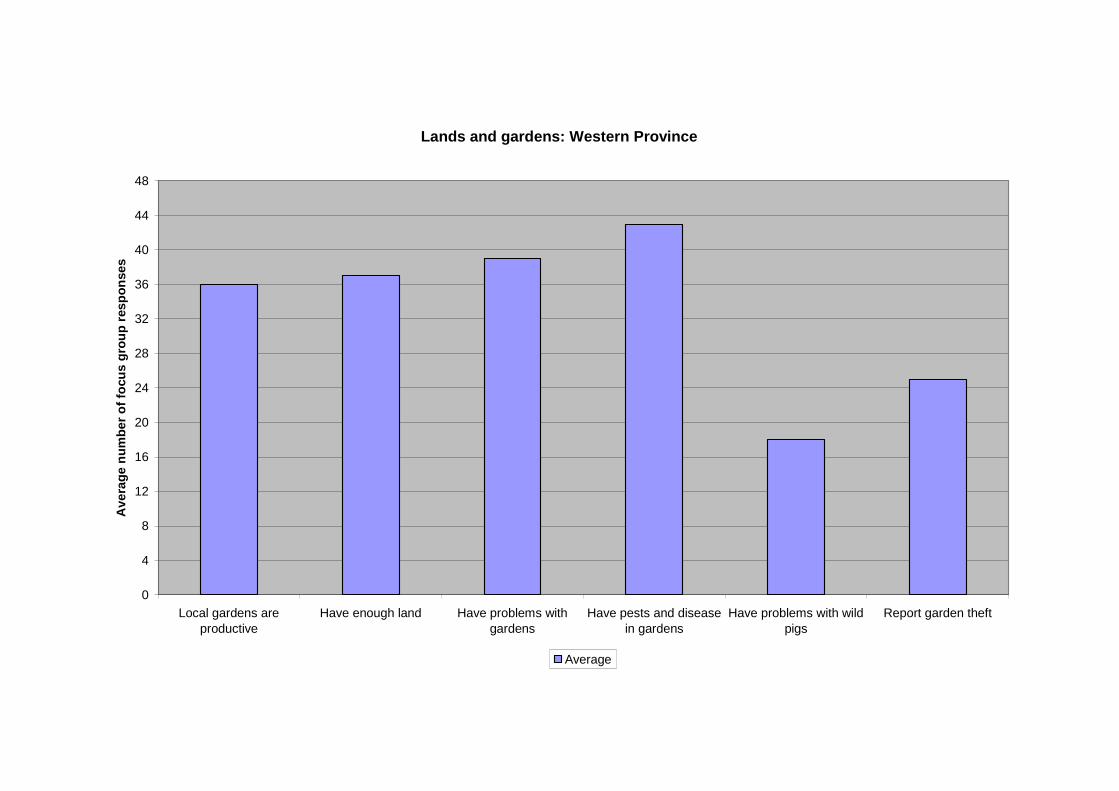
Lands and gardens: Western Province
0
4
8
12
16
20
24
28
32
36
40
44
48
Local gardens areproductive
Have enough land Have problems withgardens
Have pests and diseasein gardens
Have problems with wildpigs
Report garden theft
Av
era
ge
nu
mb
er
of
focu
sg
rou
pre
sp
on
se
s
Average
Charts P7: Livelihoods
The range of commodities produced by communities across the Solomon Islands is varied
and villagers obtain income from a wide range of sources. However, the most important
source of income is market foods grown in local gardens. The key to long term economic
security is diversity and regular supply of produce. At the moment rural communities,
especially those on the outer islands, are handicapped by isolation, poor communication and
transport and the lack of information from overseas and local markets.
Analysis:
The ten most important sources of income for village communities in the Solomon Islands
were: market foods; fish; betel nut; tobacco; contract labour; copra; basket making; weaving;
cocoa and trochus. Market foods, such as coconuts, cassava, sweet potato, bananas, tropical
fruit, beans, taro, pana, cabbage and spinach are the dominant produce grown in the villages
surveyed.
The sources of income from each province depends on many local factors, the most important
are productivity of land, transport to markets and infrastructure such as roads, market places
and wharves. In Central Province the five most important sources of income are: market
foods; betel nut, fish and tobacco; bêche-de-mer and trochus, and contract labour and copra.
In Choiseul Province the main products are market foods; fish; betel nut, copra and trochus;
timber and contract labour. In Isabel Province the five most important income sources are:
market foods; betel nut; fish; tobacco and contract labour, copra and trochus. In Makira
Province the five sources of income are: market foods; fish and copra; betel nut and tobacco;
basket making followed by contract labour and cocoa. In RenBel Province market foods,
fish, basket making and weaving are the main sources of income followed by contract labour
and carving; bêche-de-mer and trochus and then tobacco and timber. In Temotu Province
communities earn income primarily from fish as market foods and tobacco are secondary
sources of income; betel nut and weaving are third, followed by copra and then contract
labour, basket weaving and bêche-de-mer. In Western Province communities earn income
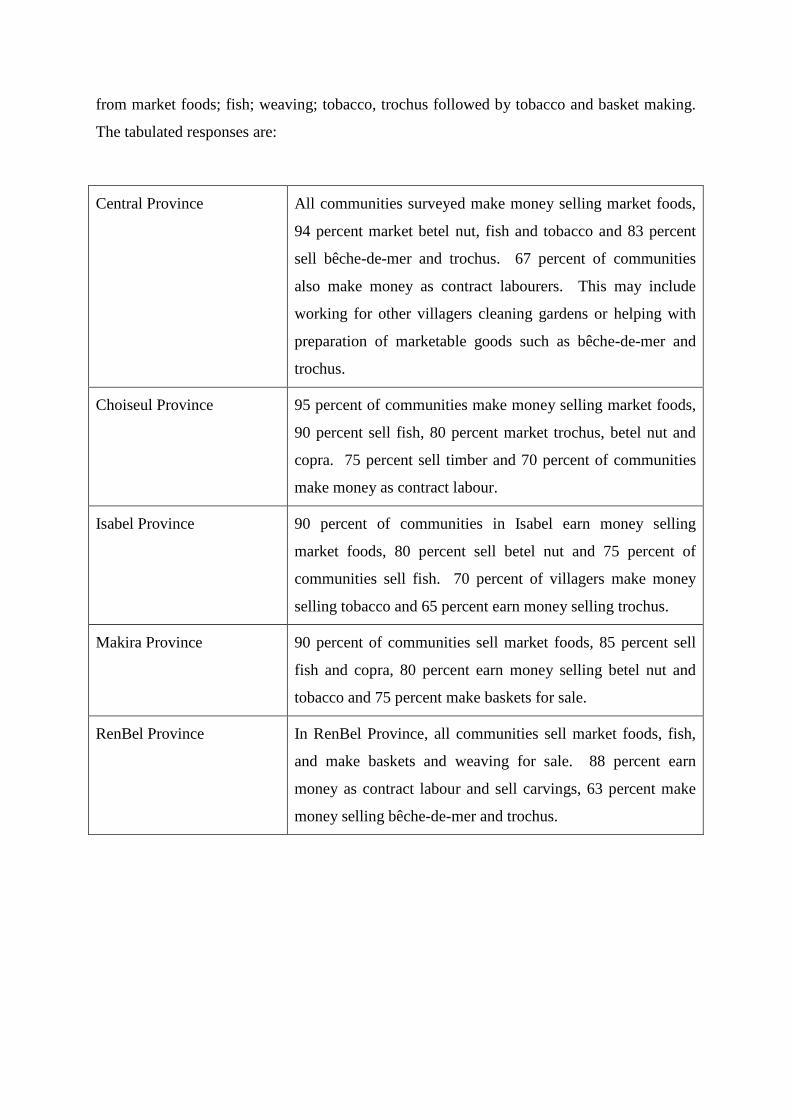
from market foods; fish; weaving; tobacco, trochus followed by tobacco and basket making.
The tabulated responses are:
Central Province All communities surveyed make money selling market foods,
94 percent market betel nut, fish and tobacco and 83 percent
sell bêche-de-mer and trochus. 67 percent of communities
also make money as contract labourers. This may include
working for other villagers cleaning gardens or helping with
preparation of marketable goods such as bêche-de-mer and
trochus.
Choiseul Province 95 percent of communities make money selling market foods,
90 percent sell fish, 80 percent market trochus, betel nut and
copra. 75 percent sell timber and 70 percent of communities
make money as contract labour.
Isabel Province 90 percent of communities in Isabel earn money selling
market foods, 80 percent sell betel nut and 75 percent of
communities sell fish. 70 percent of villagers make money
selling tobacco and 65 percent earn money selling trochus.
Makira Province 90 percent of communities sell market foods, 85 percent sell
fish and copra, 80 percent earn money selling betel nut and
tobacco and 75 percent make baskets for sale.
RenBel Province In RenBel Province, all communities sell market foods, fish,
and make baskets and weaving for sale. 88 percent earn
money as contract labour and sell carvings, 63 percent make
money selling bêche-de-mer and trochus.
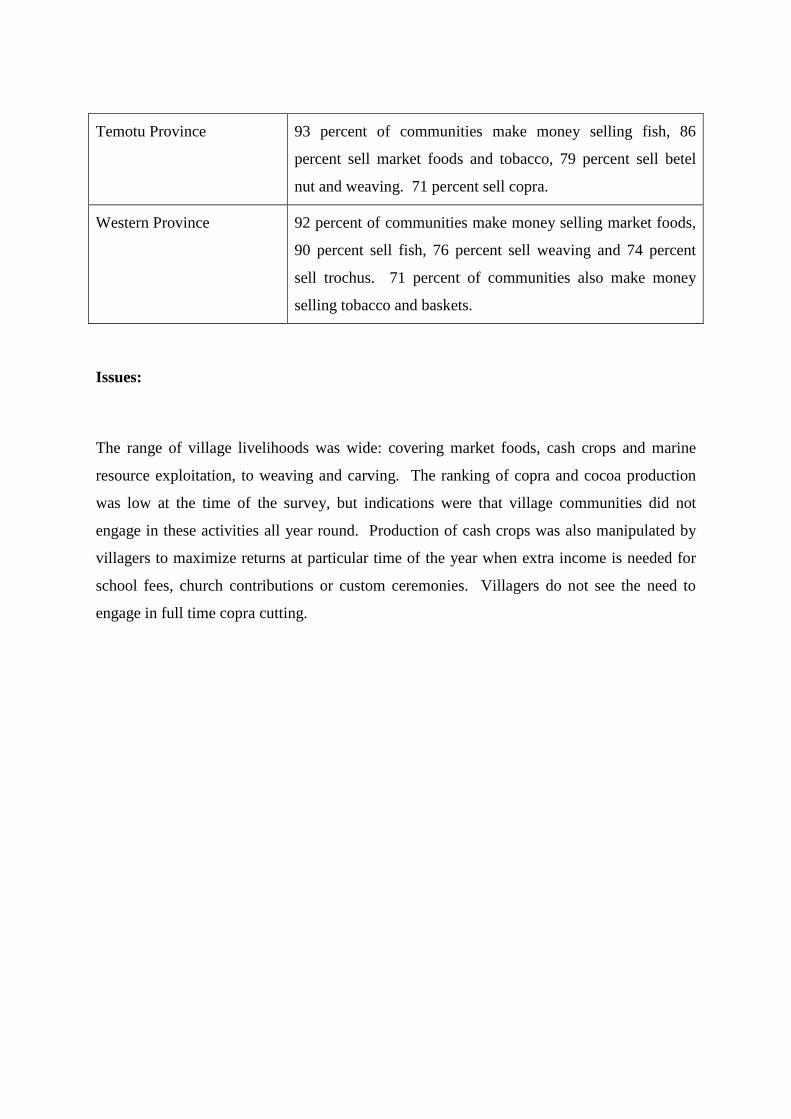
Temotu Province 93 percent of communities make money selling fish, 86
percent sell market foods and tobacco, 79 percent sell betel
nut and weaving. 71 percent sell copra.
Western Province 92 percent of communities make money selling market foods,
90 percent sell fish, 76 percent sell weaving and 74 percent
sell trochus. 71 percent of communities also make money
selling tobacco and baskets.
Issues:
The range of village livelihoods was wide: covering market foods, cash crops and marine
resource exploitation, to weaving and carving. The ranking of copra and cocoa production
was low at the time of the survey, but indications were that village communities did not
engage in these activities all year round. Production of cash crops was also manipulated by
villagers to maximize returns at particular time of the year when extra income is needed for
school fees, church contributions or custom ceremonies. Villagers do not see the need to
engage in full time copra cutting.
PROVINCIAL SIGNPOST: Livelihoods
The range of income sources for rural communities is varied but the main item is still marketfoods. These are subject to problems in transportation, price changes in times of glut or poorquality, the impact of climate and as indicated in previous charts, problems with pests anddiseases and garden theft. Commercial products such as copra and cocoa, trochus and bêche-de-mer are also subject to market forces, transportation and pests and diseases. Other minoritems that could be valuable sources of income such as spices, timber, contract labour,tobacco and clothing are only noted by some communities.
NATIONAL SIGNPOST: Livelihoods
It is apparent that village livelihoods are sophisticated and well managed by communitiesexcept in the incidence of natural disasters such as droughts or floods. However, as the vastbulk of communities are growing the same crops for domestic sale they all compete with eachother for access to a small market. The grower is usually the immediate seller: this meansalso that people generally do not trust middle men sellers and buyers, even in the copra andcocoa industry.
Fish must be sold on the same day as regular and reliable supplies of refrigeration do notexist. Most fish is sold by the fisher or his family. Betel nut, the third most important sourceof income, is a high demand crop that can be transported easily. The fact that betel nut ismoved around the islands means that regular transportation networks must exist. Followingthe betel nut trail would help in establishing better distribution channels for other marketproduce and fish.
Concentrating on oil palm for villagers along the Guadalcanal Plains and on copra and cocoaproduction in certain areas would mean that villagers would result in monocultureagricultural production systems with its associated problems with pests and disease, as wellas expose villagers to the price fluctuations of external commodity markets.
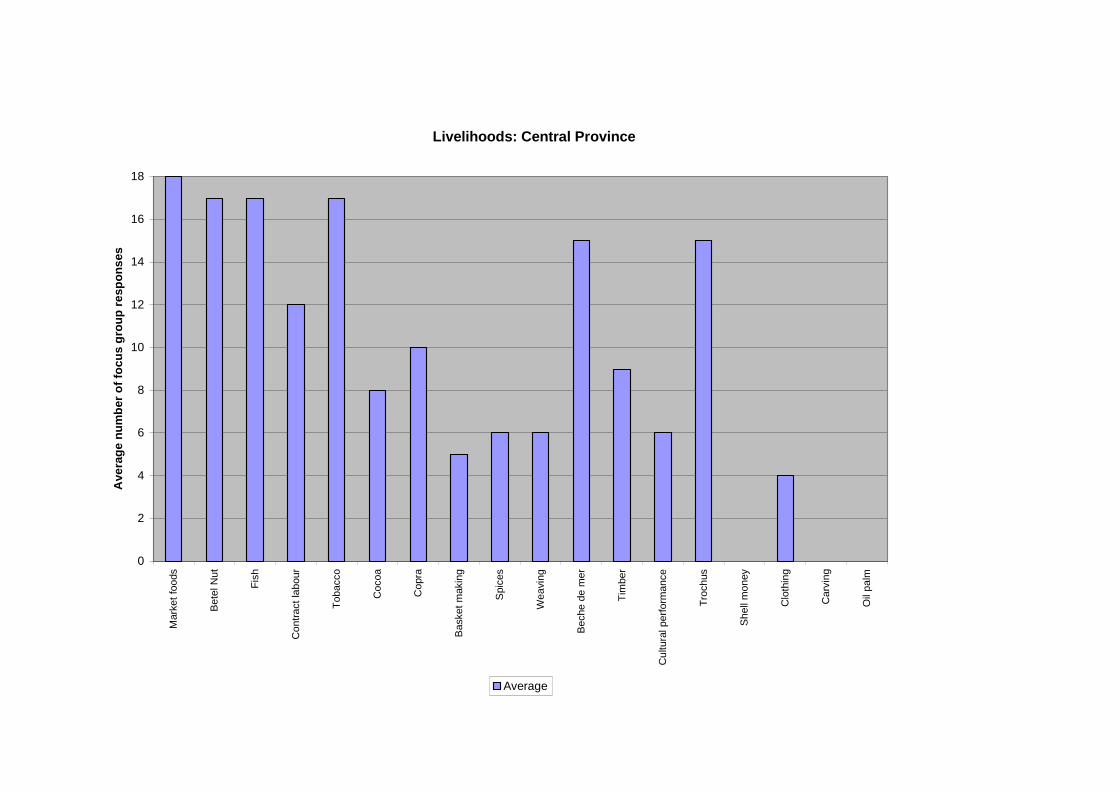
Livelihoods: Central Province
0
2
4
6
8
10
12
14
16
18M
ark
et
foo
ds
Be
telN
ut
Fis
h
Co
ntr
act
lab
ou
r
Tob
acco
Co
co
a
Co
pra
Ba
ske
tm
akin
g
Spic
es
We
avi
ng
Be
che
de
me
r
Tim
be
r
Cu
ltura
lp
erf
orm
an
ce
Tro
ch
us
Sh
ell
mo
ney
Clo
thin
g
Ca
rvin
g
Oil
pa
lm
Ave
rag
en
um
ber
of
focu
sg
rou
pre
sp
on
ses
Average
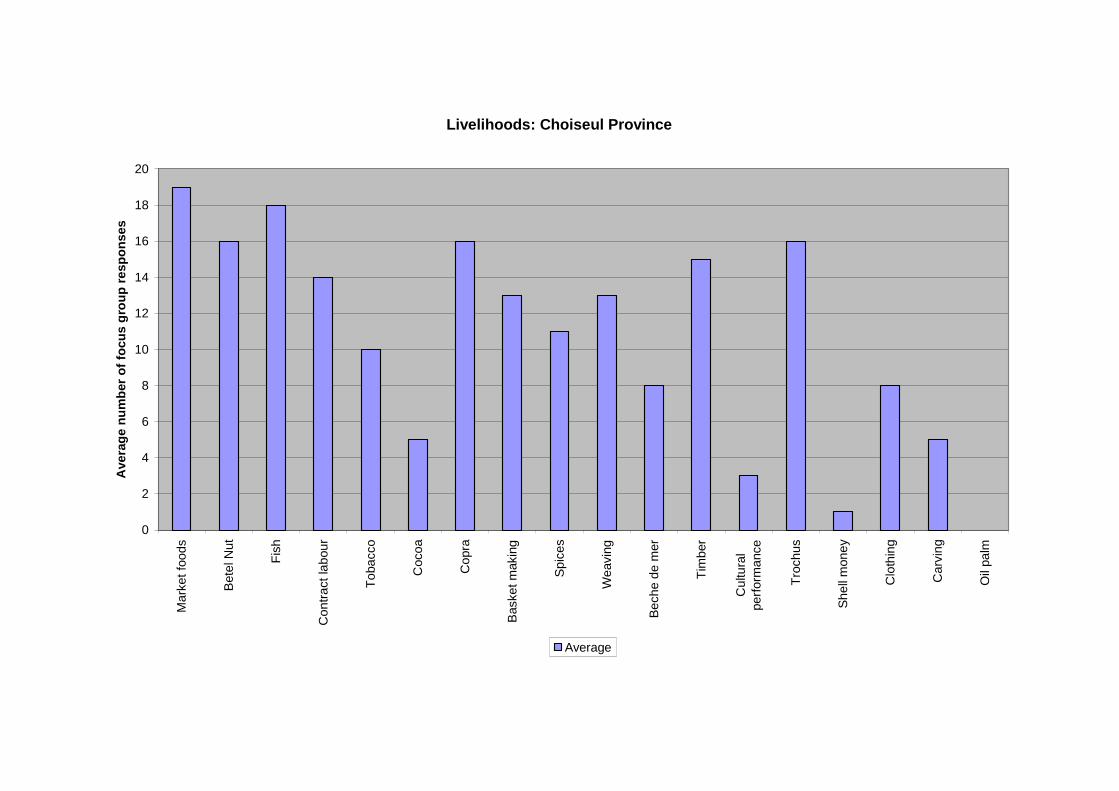
Livelihoods: Choiseul Province
0
2
4
6
8
10
12
14
16
18
20M
ark
et
foo
ds
Bete
lNu
t
Fis
h
Co
ntr
act
lab
ou
r
To
ba
cco
Coco
a
Co
pra
Baske
tm
akin
g
Sp
ice
s
We
avin
g
Be
ch
ed
em
er
Tim
ber
Cu
ltura
l
pe
rform
ance
Tro
ch
us
Sh
ell
mon
ey
Clo
thin
g
Ca
rvin
g
Oil
pa
lm
Ave
rag
en
um
ber
of
foc
us
gro
up
res
po
ns
es
Average
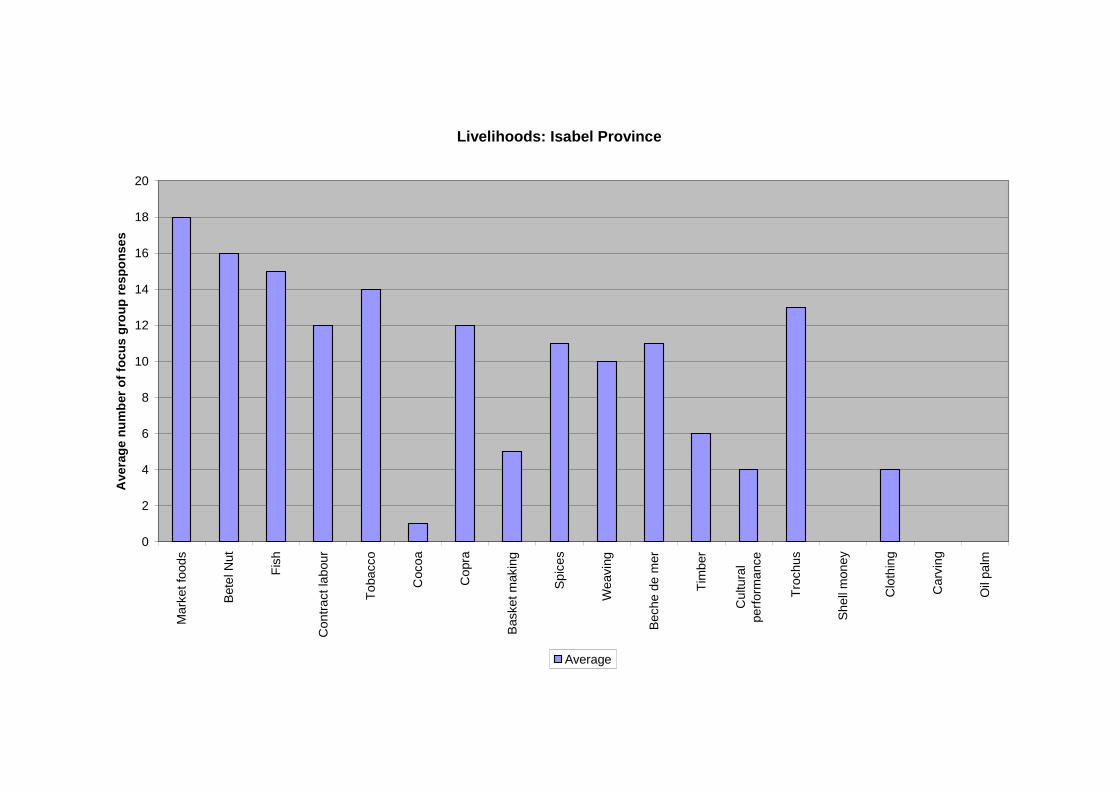
Livelihoods: Isabel Province
0
2
4
6
8
10
12
14
16
18
20M
ark
et
foo
ds
Bete
lNu
t
Fis
h
Co
ntr
act
lab
ou
r
To
ba
cco
Coco
a
Co
pra
Baske
tm
akin
g
Sp
ice
s
We
avin
g
Be
ch
ed
em
er
Tim
ber
Cu
ltura
l
pe
rform
ance
Tro
ch
us
Sh
ell
mon
ey
Clo
thin
g
Ca
rvin
g
Oil
pa
lm
Ave
rag
en
um
ber
of
foc
us
gro
up
res
po
ns
es
Average
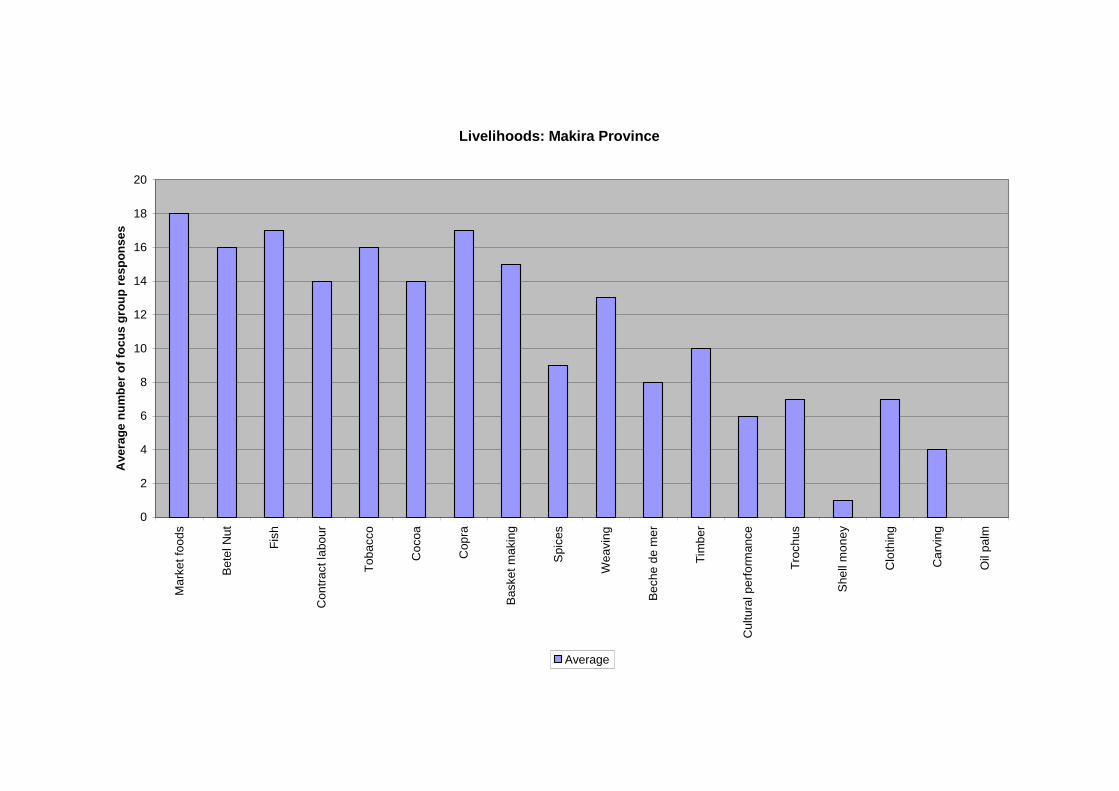
Livelihoods: Makira Province
0
2
4
6
8
10
12
14
16
18
20M
ark
et
foo
ds
Be
telN
ut
Fis
h
Co
ntr
actla
bo
ur
To
ba
cco
Co
co
a
Cop
ra
Ba
ske
tm
akin
g
Sp
ice
s
We
avin
g
Be
ch
ed
em
er
Tim
be
r
Cu
ltu
ralp
erf
orm
an
ce
Tro
ch
us
Sh
ell
mo
ne
y
Clo
thin
g
Ca
rvin
g
Oil
pa
lm
Ave
rag
en
um
be
ro
ffo
cu
sg
rou
pre
sp
on
se
s
Average
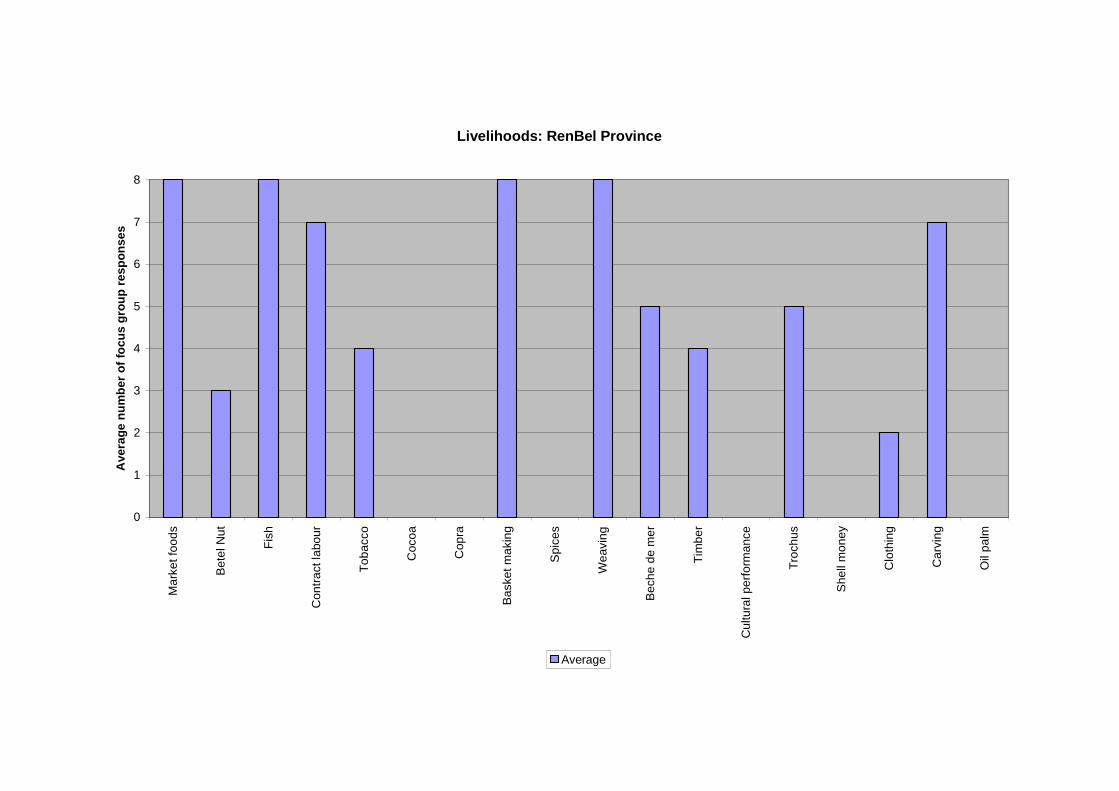
Livelihoods: RenBel Province
0
1
2
3
4
5
6
7
8M
ark
et
foo
ds
Be
telN
ut
Fis
h
Co
ntr
actla
bo
ur
To
ba
cco
Co
co
a
Cop
ra
Ba
ske
tm
akin
g
Sp
ice
s
We
avin
g
Be
ch
ed
em
er
Tim
be
r
Cu
ltu
ralp
erf
orm
an
ce
Tro
ch
us
Sh
ell
mo
ne
y
Clo
thin
g
Ca
rvin
g
Oil
pa
lm
Ave
rag
en
um
be
ro
ffo
cu
sg
rou
pre
sp
on
se
s
Average
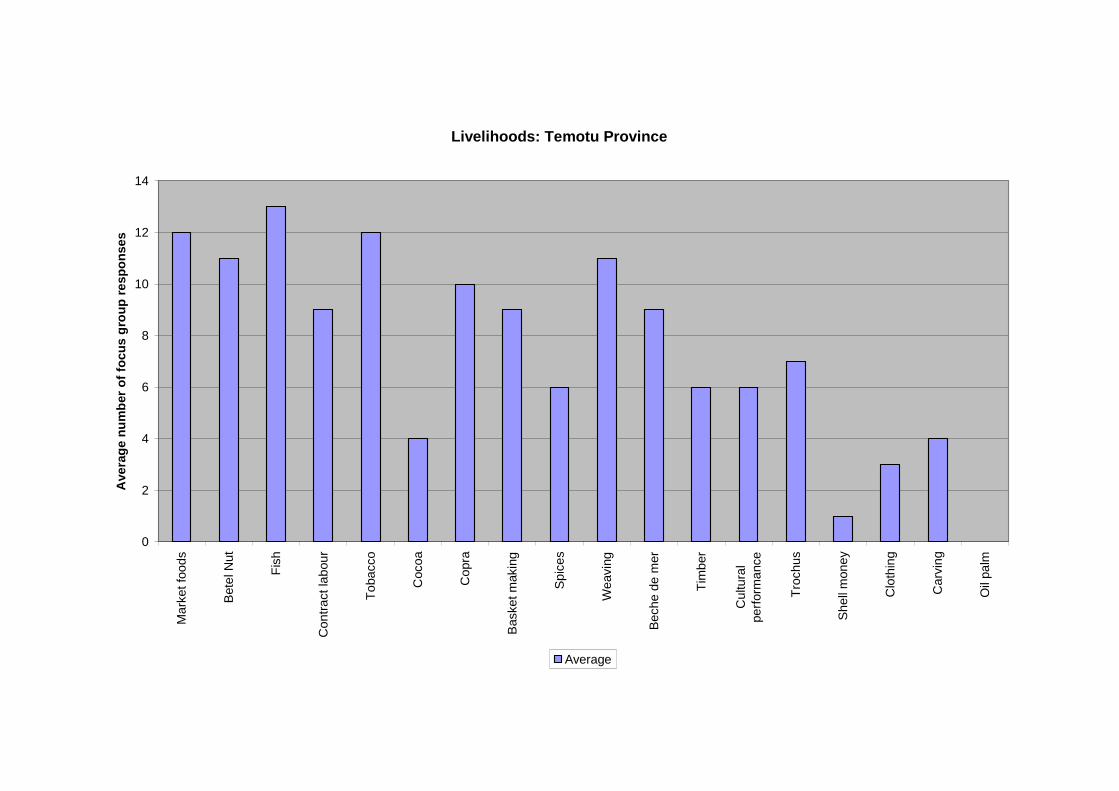
Livelihoods: Temotu Province
0
2
4
6
8
10
12
14M
ark
et
foo
ds
Bete
lNu
t
Fis
h
Co
ntr
act
lab
ou
r
To
ba
cco
Coco
a
Co
pra
Baske
tm
akin
g
Sp
ice
s
We
avin
g
Be
ch
ed
em
er
Tim
ber
Cu
ltura
l
pe
rform
ance
Tro
ch
us
Sh
ell
mon
ey
Clo
thin
g
Ca
rvin
g
Oil
pa
lm
Ave
rag
en
um
ber
of
foc
us
gro
up
res
po
ns
es
Average
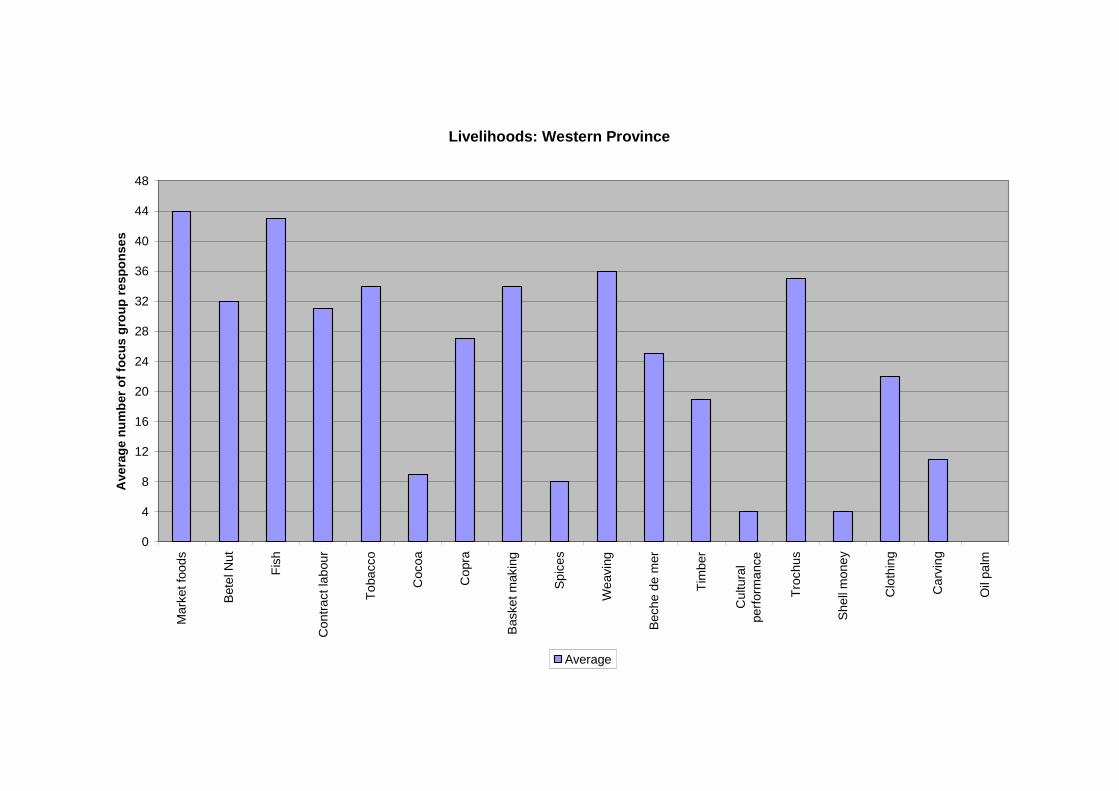
Livelihoods: Western Province
0
4
8
12
16
20
24
28
32
36
40
44
48M
ark
et
foo
ds
Bete
lNu
t
Fis
h
Co
ntr
act
lab
ou
r
To
ba
cco
Coco
a
Co
pra
Baske
tm
akin
g
Sp
ice
s
We
avin
g
Be
ch
ed
em
er
Tim
ber
Cu
ltura
l
pe
rform
ance
Tro
ch
us
Sh
ell
mon
ey
Clo
thin
g
Ca
rvin
g
Oil
pa
lm
Ave
rag
en
um
ber
of
foc
us
gro
up
res
po
ns
es
Average
Charts P8: Time taken to gardens and market
Analysis:
In nearly all provinces surveyed, people in rural communities took under 1 hour to reach their
gardens and under 2 hours to reach the market. However, in all provinces except for the
small islands of Rennell and Bellona some areas around the Western Province, more than 20
percent of people still took between 1 and 2 hours to reach the gardens. Distance to markets
was greater. More than 20 percent of people in rural communities too between 2 to 4 hours
to reach the market except for those in Makira and RenBel Provinces. The tabulated
responses are:
Central Province 56 percent of communities surveyed in the Central Province
reported that it takes under 1 hour to reach the gardens and
under 2 hours to reach the markets. However for 33 percent
of the communities it takes between 1 to 2 hours to reach the
gardens and between 2 to 4 hours to reach the markets.
Choiseul Province 55 percent of communities surveyed reported that it takes
under 1 hour to the gardens and 70 percent take under 2 hours
to reach the markets. However, 35 percent of people replied
that it takes between 1 to 2 hours to reach the gardens and 20
percent take 2 to 4 to reach the markets.
Isabel Province 60 percent of people in Isabel Province reported that it takes
under 1 hour to reach the gardens but 25 percent stated that it
takes between 1 and 2 hours to reach the garden areas. 50
percent reported it takes under 2 hours to reach the markets.
25 percent stated it takes between 2 and 4 hours.
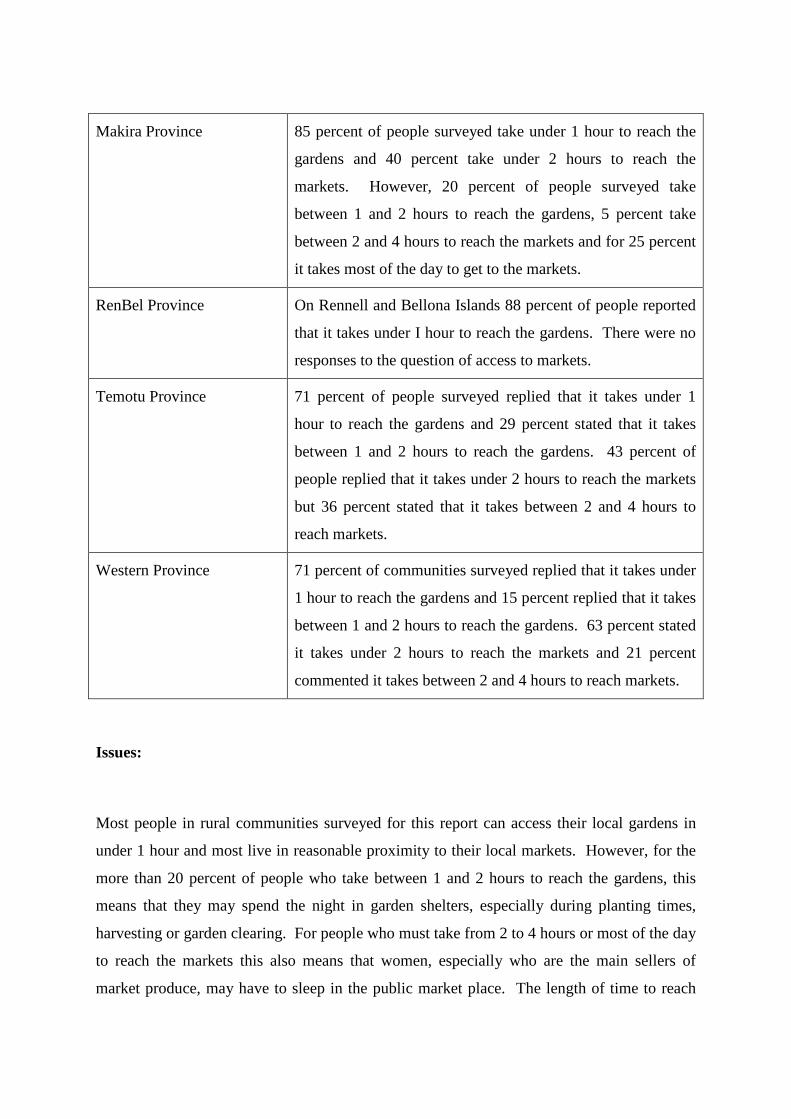
Makira Province 85 percent of people surveyed take under 1 hour to reach the
gardens and 40 percent take under 2 hours to reach the
markets. However, 20 percent of people surveyed take
between 1 and 2 hours to reach the gardens, 5 percent take
between 2 and 4 hours to reach the markets and for 25 percent
it takes most of the day to get to the markets.
RenBel Province On Rennell and Bellona Islands 88 percent of people reported
that it takes under I hour to reach the gardens. There were no
responses to the question of access to markets.
Temotu Province 71 percent of people surveyed replied that it takes under 1
hour to reach the gardens and 29 percent stated that it takes
between 1 and 2 hours to reach the gardens. 43 percent of
people replied that it takes under 2 hours to reach the markets
but 36 percent stated that it takes between 2 and 4 hours to
reach markets.
Western Province 71 percent of communities surveyed replied that it takes under
1 hour to reach the gardens and 15 percent replied that it takes
between 1 and 2 hours to reach the gardens. 63 percent stated
it takes under 2 hours to reach the markets and 21 percent
commented it takes between 2 and 4 hours to reach markets.
Issues:
Most people in rural communities surveyed for this report can access their local gardens in
under 1 hour and most live in reasonable proximity to their local markets. However, for the
more than 20 percent of people who take between 1 and 2 hours to reach the gardens, this
means that they may spend the night in garden shelters, especially during planting times,
harvesting or garden clearing. For people who must take from 2 to 4 hours or most of the day
to reach the markets this also means that women, especially who are the main sellers of
market produce, may have to sleep in the public market place. The length of time to reach
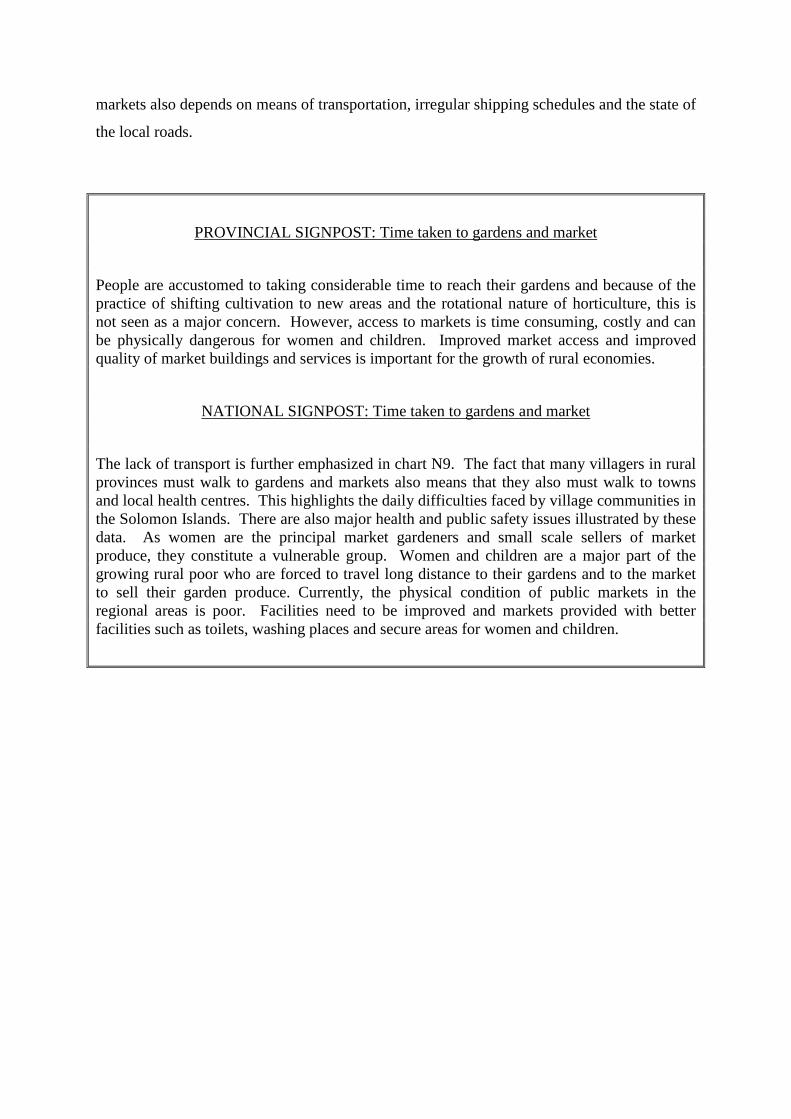
markets also depends on means of transportation, irregular shipping schedules and the state of
the local roads.
PROVINCIAL SIGNPOST: Time taken to gardens and market
People are accustomed to taking considerable time to reach their gardens and because of thepractice of shifting cultivation to new areas and the rotational nature of horticulture, this isnot seen as a major concern. However, access to markets is time consuming, costly and canbe physically dangerous for women and children. Improved market access and improvedquality of market buildings and services is important for the growth of rural economies.
NATIONAL SIGNPOST: Time taken to gardens and market
The lack of transport is further emphasized in chart N9. The fact that many villagers in ruralprovinces must walk to gardens and markets also means that they also must walk to townsand local health centres. This highlights the daily difficulties faced by village communities inthe Solomon Islands. There are also major health and public safety issues illustrated by thesedata. As women are the principal market gardeners and small scale sellers of marketproduce, they constitute a vulnerable group. Women and children are a major part of thegrowing rural poor who are forced to travel long distance to their gardens and to the marketto sell their garden produce. Currently, the physical condition of public markets in theregional areas is poor. Facilities need to be improved and markets provided with betterfacilities such as toilets, washing places and secure areas for women and children.
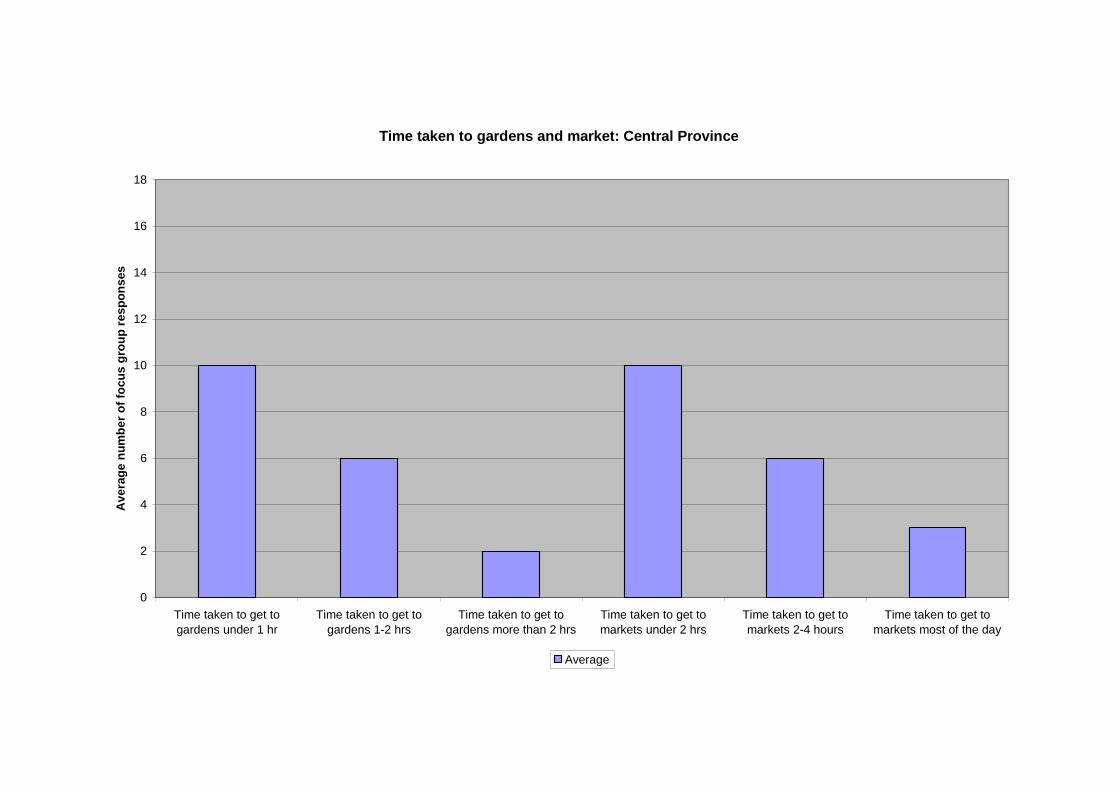
Time taken to gardens and market: Central Province
0
2
4
6
8
10
12
14
16
18
Time taken to get to
gardens under 1 hr
Time taken to get to
gardens 1-2 hrs
Time taken to get to
gardens more than 2 hrs
Time taken to get to
markets under 2 hrs
Time taken to get to
markets 2-4 hours
Time taken to get to
markets most of the day
Av
era
ge
nu
mb
er
of
foc
us
gro
up
res
po
ns
es
Average
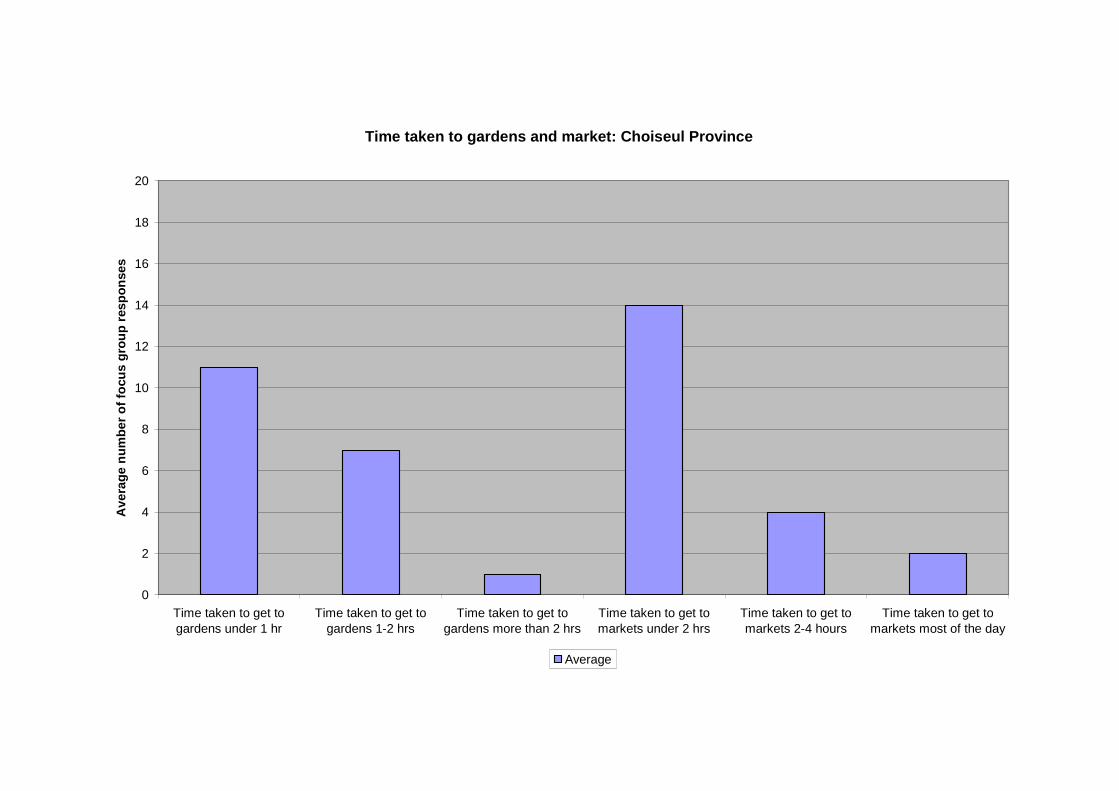
Time taken to gardens and market: Choiseul Province
0
2
4
6
8
10
12
14
16
18
20
Time taken to get togardens under 1 hr
Time taken to get togardens 1-2 hrs
Time taken to get togardens more than 2 hrs
Time taken to get tomarkets under 2 hrs
Time taken to get tomarkets 2-4 hours
Time taken to get tomarkets most of the day
Av
era
ge
nu
mb
er
of
focu
sg
rou
pre
sp
on
se
s
Average
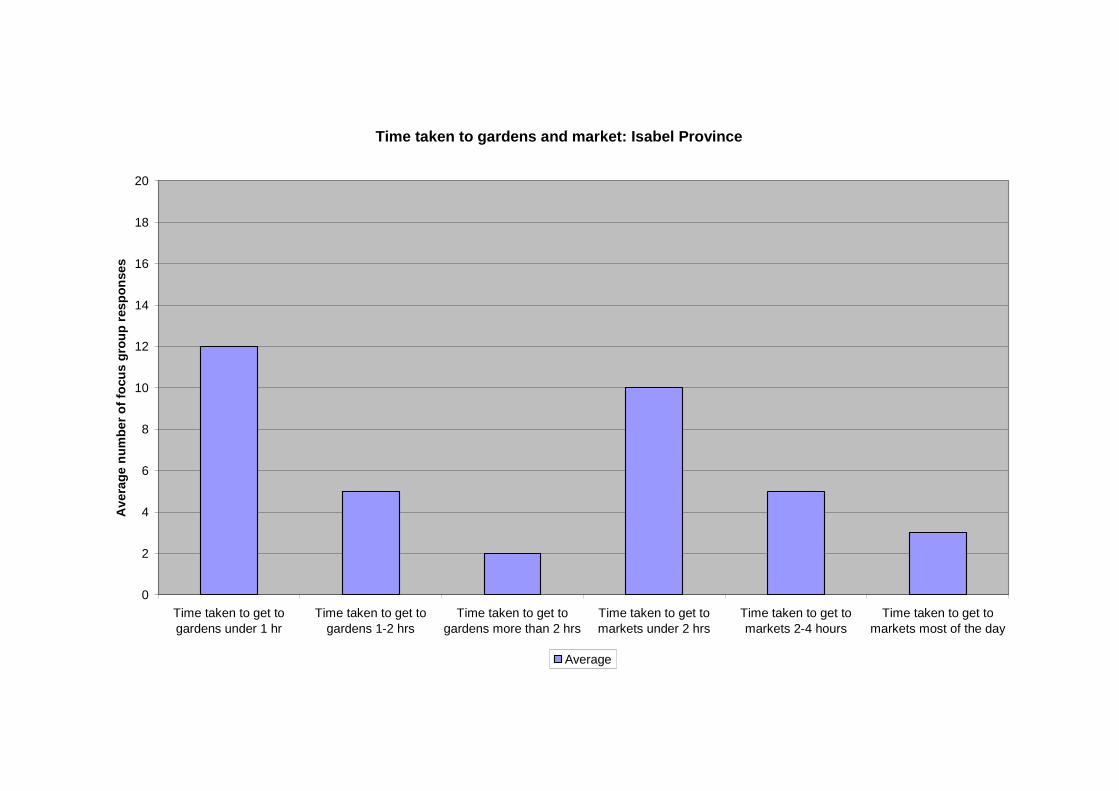
Time taken to gardens and market: Isabel Province
0
2
4
6
8
10
12
14
16
18
20
Time taken to get togardens under 1 hr
Time taken to get togardens 1-2 hrs
Time taken to get togardens more than 2 hrs
Time taken to get tomarkets under 2 hrs
Time taken to get tomarkets 2-4 hours
Time taken to get tomarkets most of the day
Av
era
ge
nu
mb
er
of
focu
sg
rou
pre
sp
on
se
s
Average
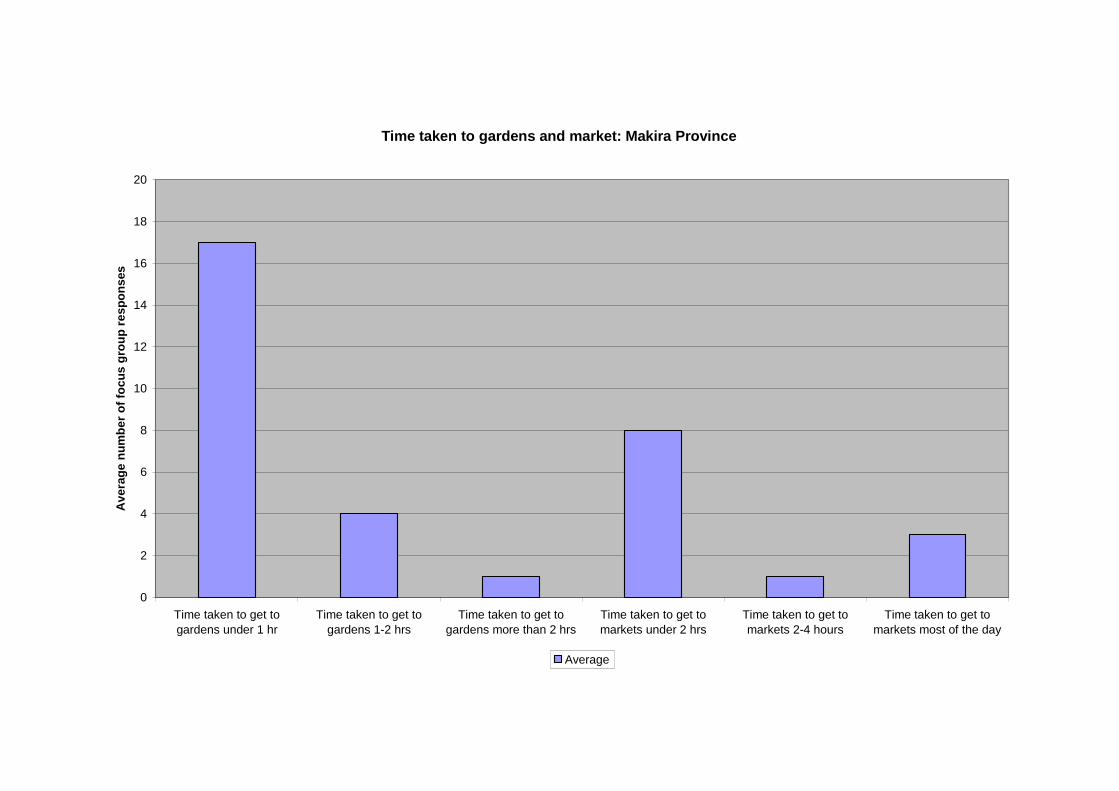
Time taken to gardens and market: Makira Province
0
2
4
6
8
10
12
14
16
18
20
Time taken to get to
gardens under 1 hr
Time taken to get to
gardens 1-2 hrs
Time taken to get to
gardens more than 2 hrs
Time taken to get to
markets under 2 hrs
Time taken to get to
markets 2-4 hours
Time taken to get to
markets most of the day
Av
era
ge
nu
mb
er
of
foc
us
gro
up
res
po
ns
es
Average
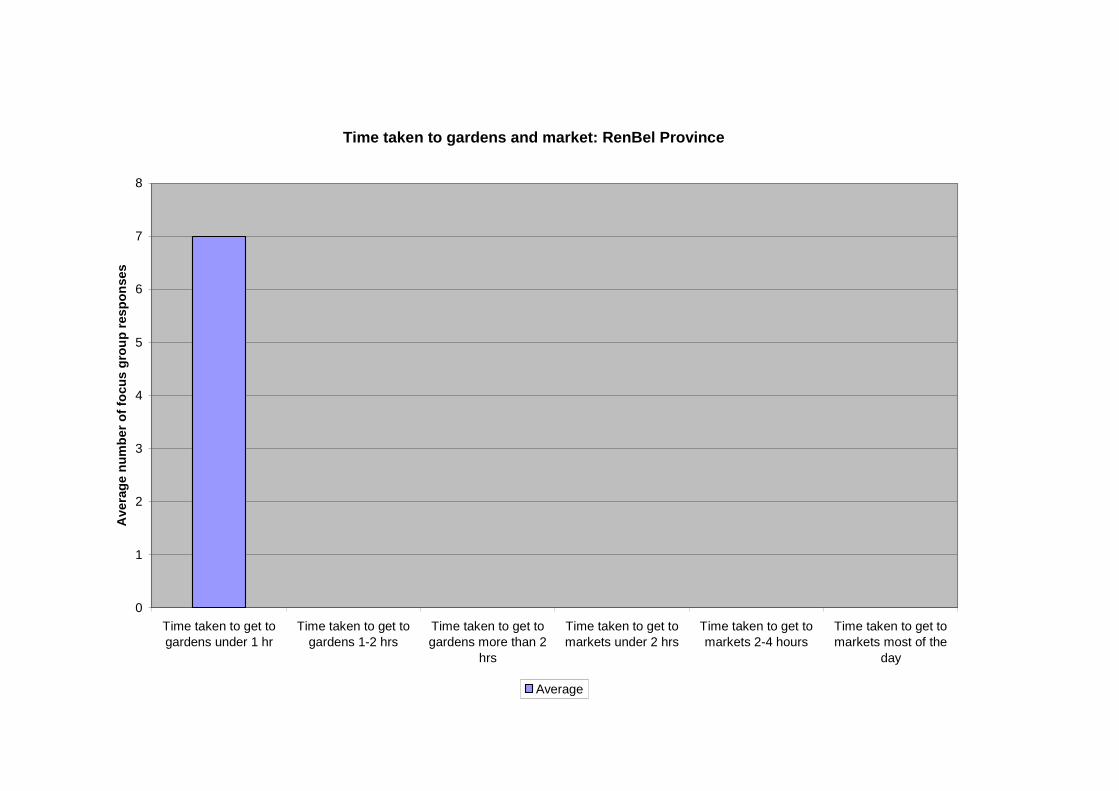
Time taken to gardens and market: RenBel Province
0
1
2
3
4
5
6
7
8
Time taken to get togardens under 1 hr
Time taken to get togardens 1-2 hrs
Time taken to get togardens more than 2
hrs
Time taken to get tomarkets under 2 hrs
Time taken to get tomarkets 2-4 hours
Time taken to get tomarkets most of the
day
Ave
rag
en
um
be
ro
ffo
cu
sg
rou
pre
sp
on
ses
Average

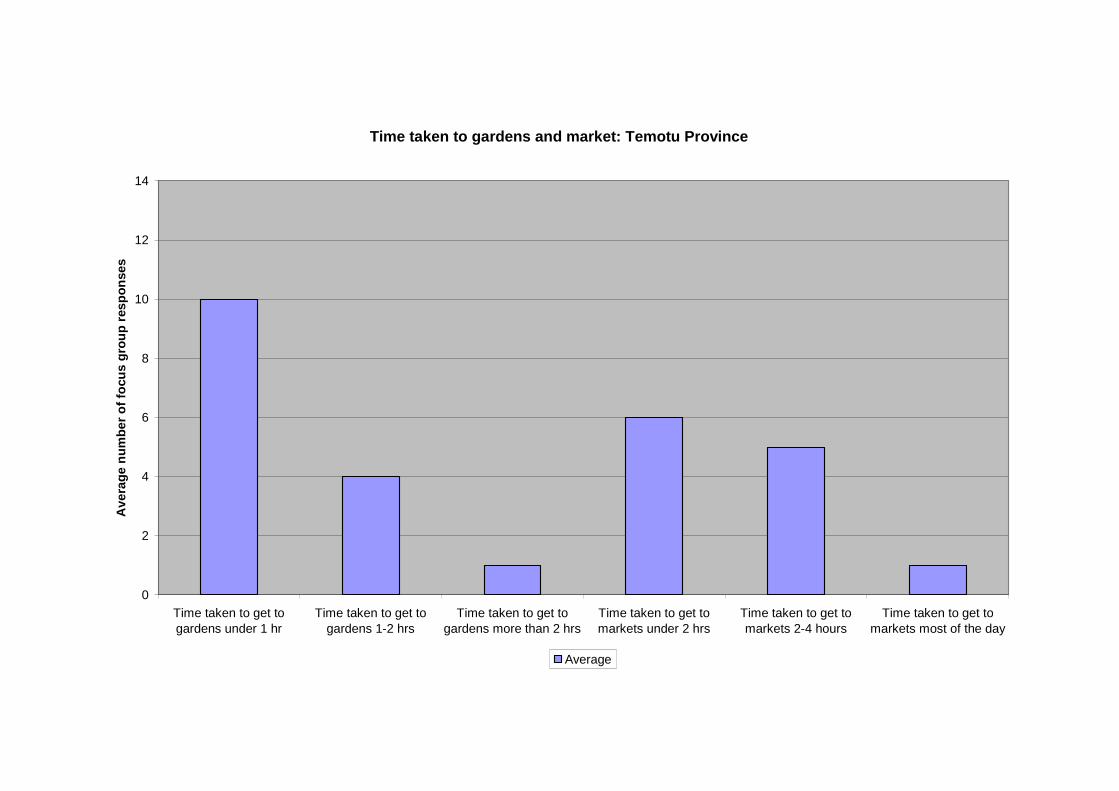
Time taken to gardens and market: Temotu Province
0
2
4
6
8
10
12
14
Time taken to get togardens under 1 hr
Time taken to get togardens 1-2 hrs
Time taken to get togardens more than 2 hrs
Time taken to get tomarkets under 2 hrs
Time taken to get tomarkets 2-4 hours
Time taken to get tomarkets most of the day
Av
era
ge
nu
mb
er
of
focu
sg
rou
pre
sp
on
se
s
Average
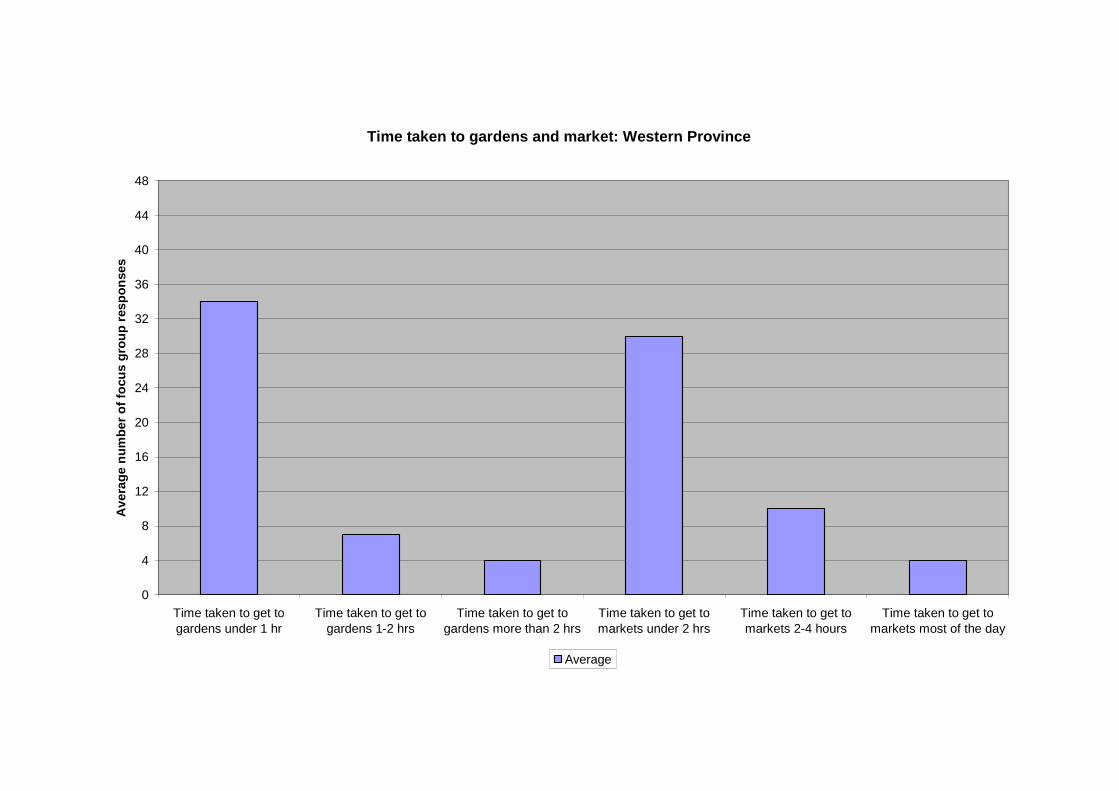
Time taken to gardens and market: Western Province
0
4
8
12
16
20
24
28
32
36
40
44
48
Time taken to get togardens under 1 hr
Time taken to get togardens 1-2 hrs
Time taken to get togardens more than 2 hrs
Time taken to get tomarkets under 2 hrs
Time taken to get tomarkets 2-4 hours
Time taken to get tomarkets most of the day
Av
era
ge
nu
mb
er
of
focu
sg
rou
pre
sp
on
se
s
Average
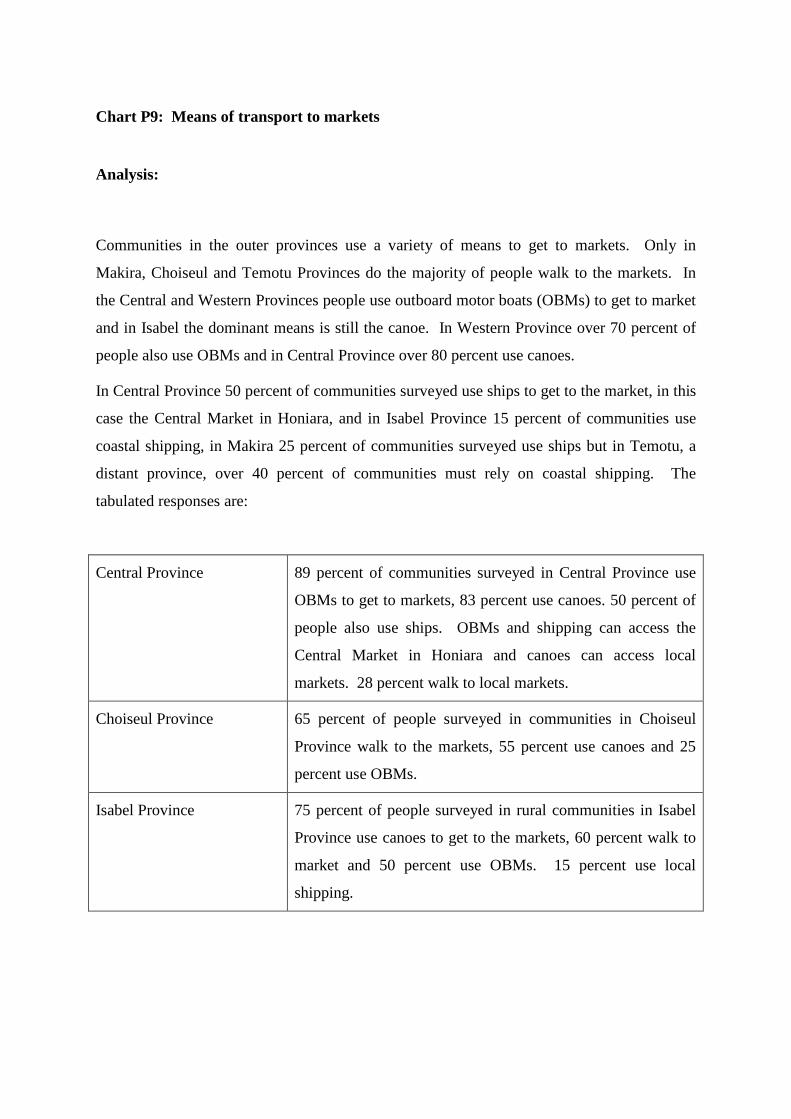
Chart P9: Means of transport to markets
Analysis:
Communities in the outer provinces use a variety of means to get to markets. Only in
Makira, Choiseul and Temotu Provinces do the majority of people walk to the markets. In
the Central and Western Provinces people use outboard motor boats (OBMs) to get to market
and in Isabel the dominant means is still the canoe. In Western Province over 70 percent of
people also use OBMs and in Central Province over 80 percent use canoes.
In Central Province 50 percent of communities surveyed use ships to get to the market, in this
case the Central Market in Honiara, and in Isabel Province 15 percent of communities use
coastal shipping, in Makira 25 percent of communities surveyed use ships but in Temotu, a
distant province, over 40 percent of communities must rely on coastal shipping. The
tabulated responses are:
Central Province 89 percent of communities surveyed in Central Province use
OBMs to get to markets, 83 percent use canoes. 50 percent of
people also use ships. OBMs and shipping can access the
Central Market in Honiara and canoes can access local
markets. 28 percent walk to local markets.
Choiseul Province 65 percent of people surveyed in communities in Choiseul
Province walk to the markets, 55 percent use canoes and 25
percent use OBMs.
Isabel Province 75 percent of people surveyed in rural communities in Isabel
Province use canoes to get to the markets, 60 percent walk to
market and 50 percent use OBMs. 15 percent use local
shipping.
Makira Province 70 percent of people surveyed in rural Makira Province walk
to markets, 25 percent use OBMs and ships and 20 percent use
canoes.
RenBel Province No RenBel market data
Temotu Province 64 percent of people in Temotu Province walk to markets, 50
percent use canoes, 43 percent use shipping and 29 percent
use OBMs
Western Province Survey findings are that 74 percent of people in rural
communities in Western Province use OBMs to get to
markets, 71 percent use canoes, 38 percent walk, only 2
percent use cars to access markets and 13 percent trucks.
Issues:
The existing transportation infrastructure in the Solomon Islands is still poor. Roads are
slowly being improved but shipping remains costly and dangerous. Produce is especially
vulnerable to shipping breakdowns and schedule delays. For most communities in the outer
provinces the main forms of transportation to markets continues to be walking, OBMs or
canoes.
PROVINCIAL SIGNPOST: Means of transport to markets
Transportation networks are slowly being improved but roads and bridges are only slowlybeing improved. Access to marine transportation is still difficult and expensive for localpeople. Boats are often overloaded and dangerous. Schedules are subject to change andgoods can be easily spoiled. Access to local markets is by walking, canoes or OBMs.
NATIONAL SIGNPOST: Means of transport to markets
The main transport infrastructure in the Solomon Islands is in need of improvement. Roads,bridges and wharves are generally in poor condition right across the country. Much of themain road infrastructure on Guadalcanal to the east and west of Honiara was allowed to fallinto disrepair during the recent civil unrest and is only slowly being rebuilt. Access tomarkets is essential for most villagers, not only so that they can buy domestic essentials likesoap, rice, kerosene and petrol, but also because the sale of garden-produce is the onlyreliable source of cash for most rural communities. Major road construction, maintenance,and repair programs should be prioritized.
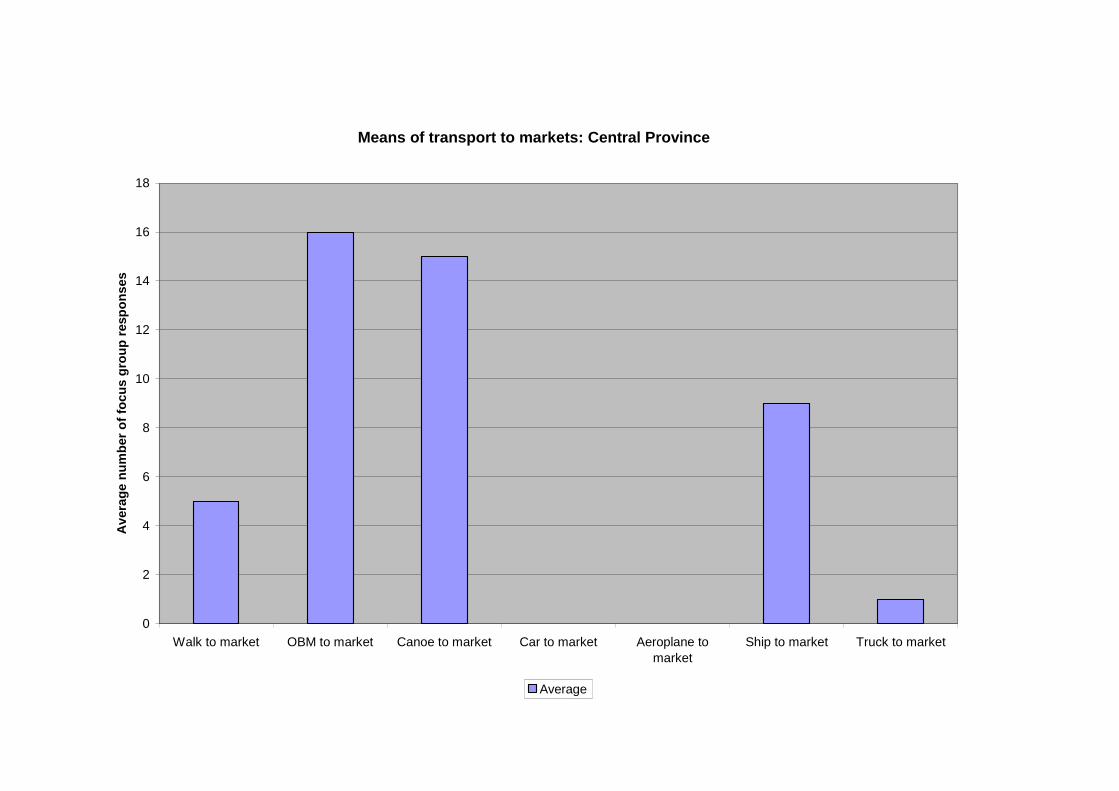
Means of transport to markets: Central Province
0
2
4
6
8
10
12
14
16
18
Walk to market OBM to market Canoe to market Car to market Aeroplane tomarket
Ship to market Truck to market
Av
era
ge
nu
mb
er
of
foc
us
gro
up
resp
on
ses
Average

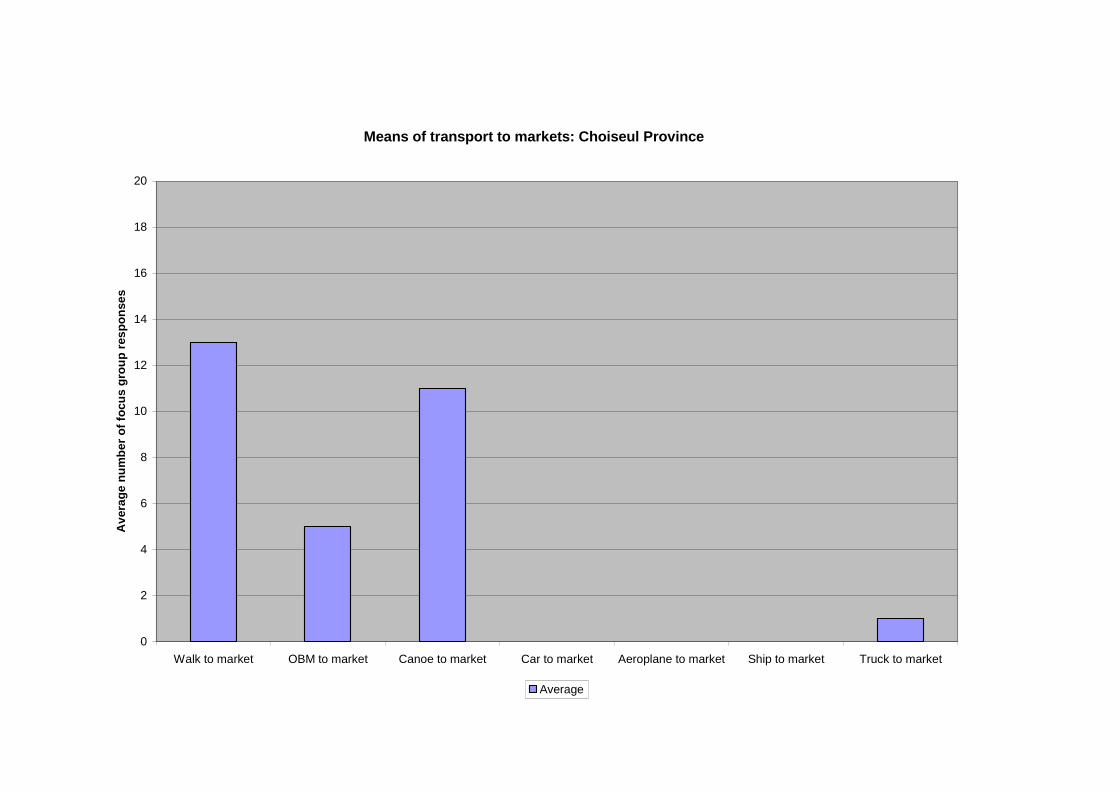
Means of transport to markets: Choiseul Province
0
2
4
6
8
10
12
14
16
18
20
Walk to market OBM to market Canoe to market Car to market Aeroplane to market Ship to market Truck to market
Av
era
ge
nu
mb
er
of
focu
sg
rou
pre
sp
on
se
s
Average

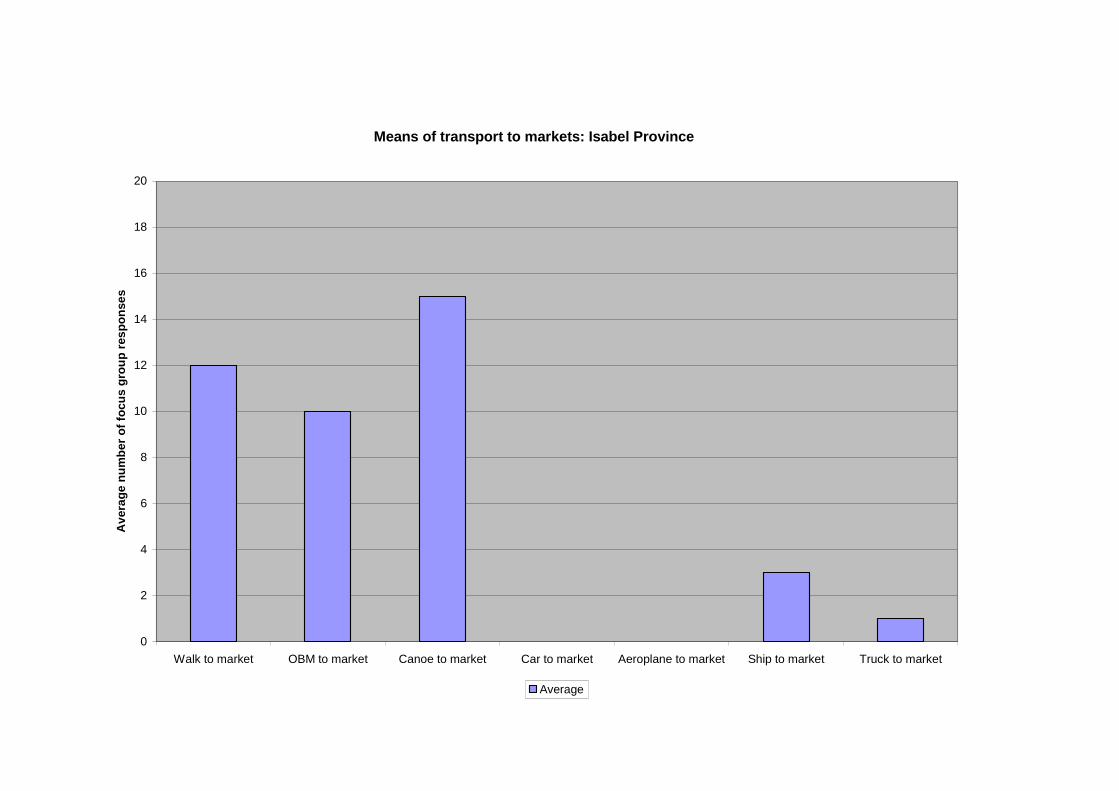
Means of transport to markets: Isabel Province
0
2
4
6
8
10
12
14
16
18
20
Walk to market OBM to market Canoe to market Car to market Aeroplane to market Ship to market Truck to market
Av
era
ge
nu
mb
er
of
focu
sg
rou
pre
sp
on
se
s
Average

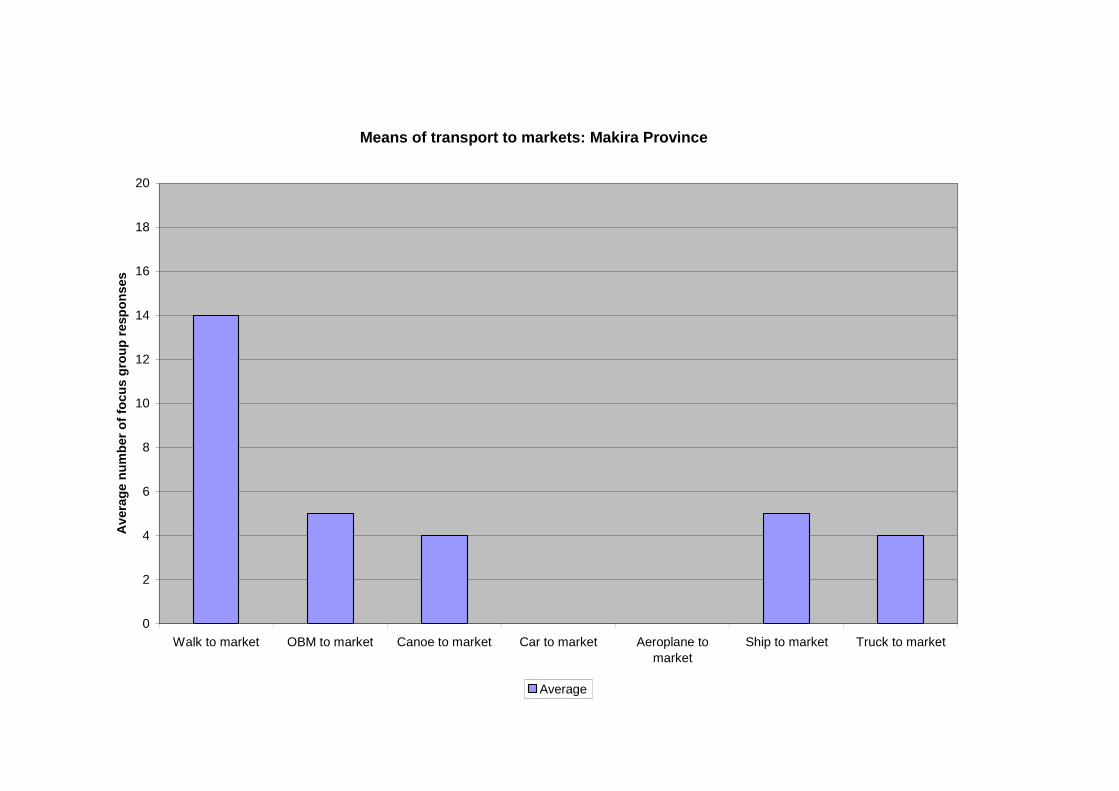
Means of transport to markets: Makira Province
0
2
4
6
8
10
12
14
16
18
20
Walk to market OBM to market Canoe to market Car to market Aeroplane tomarket
Ship to market Truck to market
Av
era
ge
nu
mb
er
of
foc
us
gro
up
resp
on
ses
Average

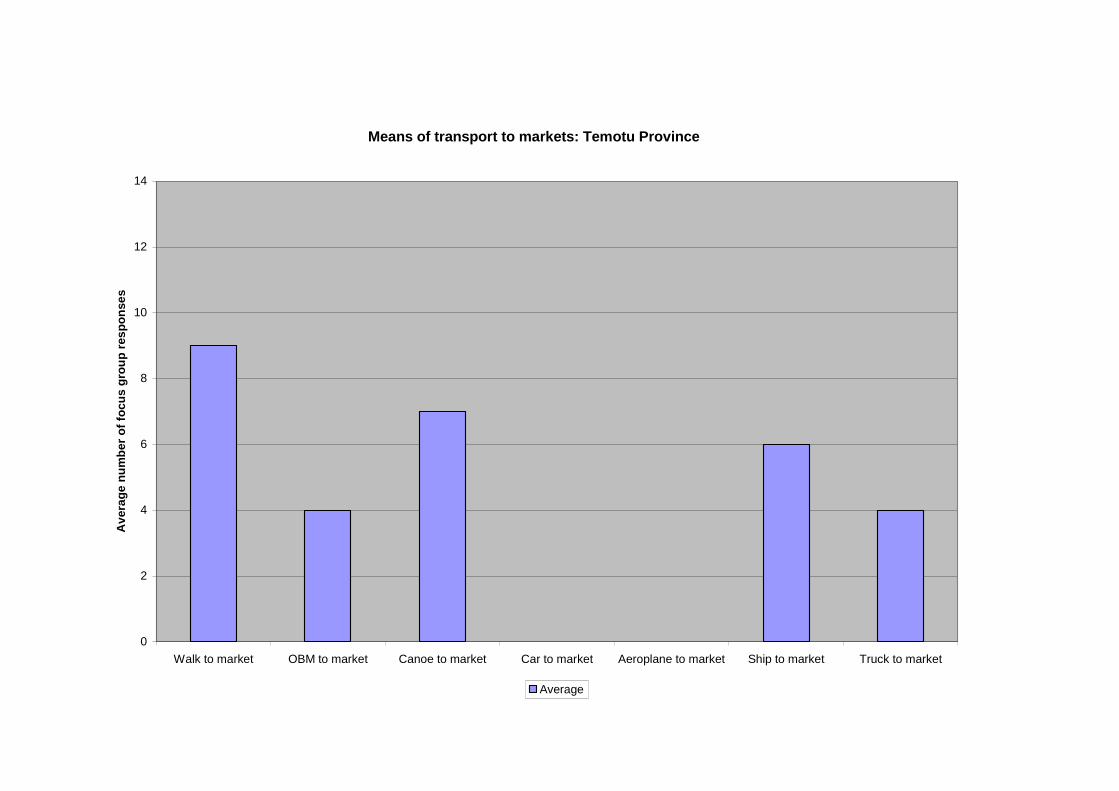
Means of transport to markets: Temotu Province
0
2
4
6
8
10
12
14
Walk to market OBM to market Canoe to market Car to market Aeroplane to market Ship to market Truck to market
Av
era
ge
nu
mb
er
of
focu
sg
rou
pre
sp
on
se
s
Average

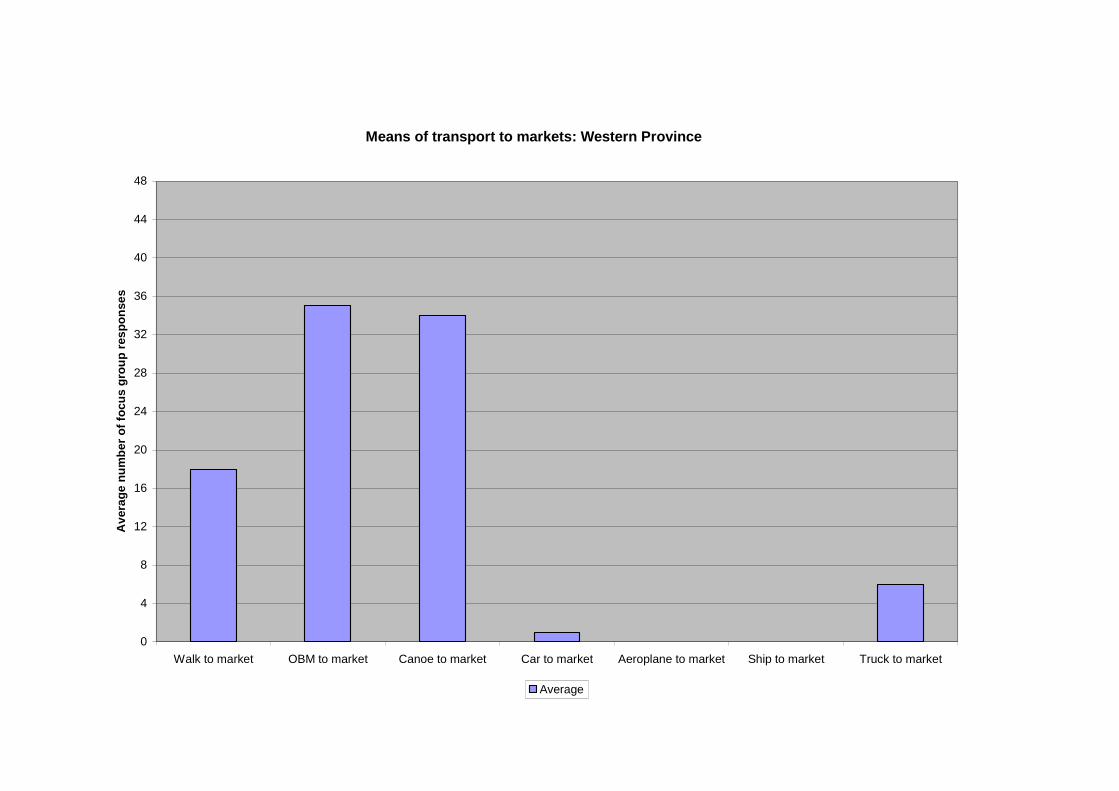
Means of transport to markets: Western Province
0
4
8
12
16
20
24
28
32
36
40
44
48
Walk to market OBM to market Canoe to market Car to market Aeroplane to market Ship to market Truck to market
Av
era
ge
nu
mb
er
of
focu
sg
rou
pre
sp
on
se
s
Average
Charts P10: Royalties
As noted in the National Snapshot this question was designed to extract information on the
sources of income for rural communities. The economic structure of rural communities is
diverse: a mixture of subsistence economy and cash economy. This chart should be
examined in conjunction with Charts P7: Livelihoods.
Analysis:
All communities surveyed received money from family and friends (wantoks) from outside
the village. These remittances and gifts are extremely important for rural communities with
little cash flow. They must still pay for school fees, church contributions and the purchases
of all store goods with cash. The figure was highest in RenBel Province where 100 percent
of communities reported receiving money from wantoks. The figure is generally higher than
70 percent of communities surveyed but in Western Province only 67 percent of communities
and on Makira only 60 percent received money from outside the village. In Central, Isabel,
Temotu and Western Provinces a small number of communities reported that they received
royalties from commercial mining but on Choiseul, Makira and Western Province over 40
percent of communities surveyed received money from commercial logging. Commercial
plantation developments were noted in all provinces except the RenBel. Only some
communities in Central, Isabel, Temotu and Western Provinces report receiving royalties
from commercial fishing. An accurate understanding of the meaning of ‘royalties’, its legal
definition, and payments are to be distributed among community members is also essential.
The data show that people often misunderstand the nature of royalty payments and the term is
often confused with the Pijin term ‘kompensesin [compensation]’ which has a broad range of
meaning in the Solomon Islands from payments for the rights to use land, reparations for
damage and injury, to entry fees for access to private beaches near Honiara. The tabulated
responses are:
Central Province 72 percent of communities in Central Province receive cash
from wantoks outside the village. While 22 percent of
communities reported the presence of commercial logging and
plantation developments, only 13 percent stated they received
royalty payments. 22 percent received payments from fishing
operations, 11 percent from tourism developments and 17
percent from logging. 11 percent also stated they receive
payments from mining operations.
Choiseul Province 85 percent of communities surveyed receive money from
wantoks outside the village. 55 percent receive royalty
payments and this 55 percent receive them from logging
operations. 50 percent of communities surveyed reported the
presence of commercial logging development and 30 percent
reported commercial plantations.
Isabel Province 85 percent of communities received cash from wantoks
outside the village. Only 20 percent reported the presence of
commercial logging and 15 percent the presence of
commercial plantations. 20 percent stated they receive
royalties, 25 percent of communities receive them from
fishing and logging, 20 percent from tourism and also from
mining.
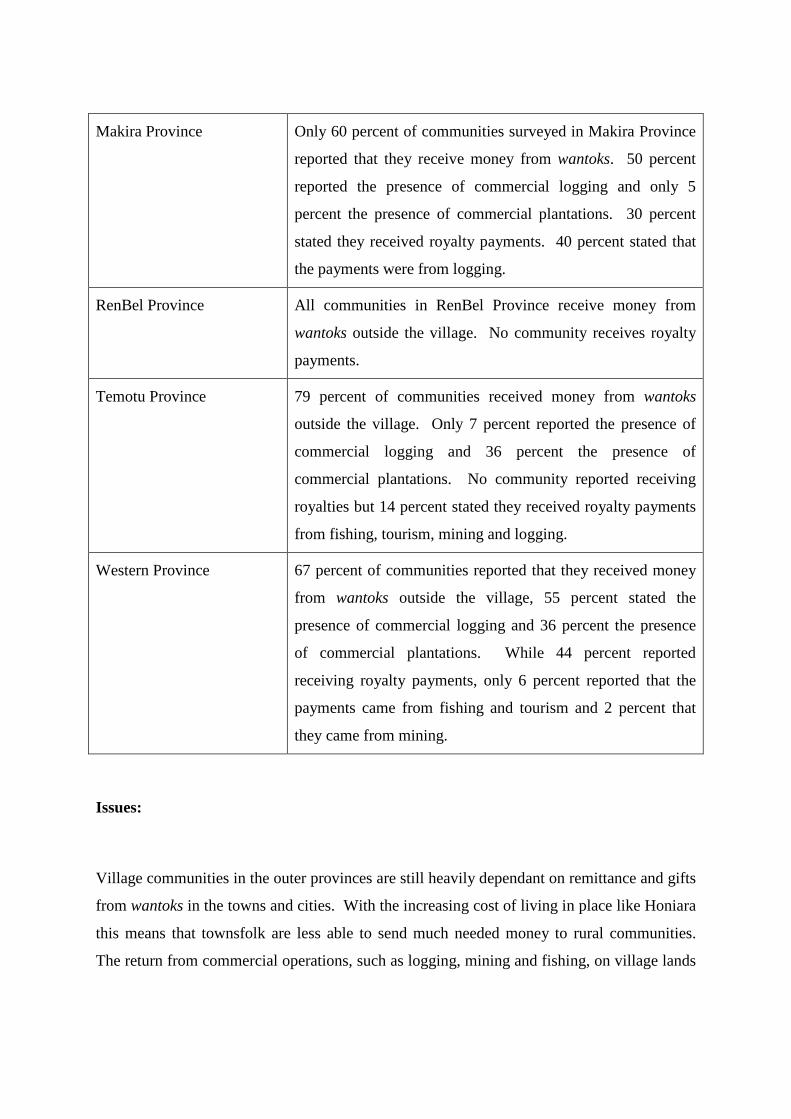
Makira Province Only 60 percent of communities surveyed in Makira Province
reported that they receive money from wantoks. 50 percent
reported the presence of commercial logging and only 5
percent the presence of commercial plantations. 30 percent
stated they received royalty payments. 40 percent stated that
the payments were from logging.
RenBel Province All communities in RenBel Province receive money from
wantoks outside the village. No community receives royalty
payments.
Temotu Province 79 percent of communities received money from wantoks
outside the village. Only 7 percent reported the presence of
commercial logging and 36 percent the presence of
commercial plantations. No community reported receiving
royalties but 14 percent stated they received royalty payments
from fishing, tourism, mining and logging.
Western Province 67 percent of communities reported that they received money
from wantoks outside the village, 55 percent stated the
presence of commercial logging and 36 percent the presence
of commercial plantations. While 44 percent reported
receiving royalty payments, only 6 percent reported that the
payments came from fishing and tourism and 2 percent that
they came from mining.
Issues:
Village communities in the outer provinces are still heavily dependant on remittance and gifts
from wantoks in the towns and cities. With the increasing cost of living in place like Honiara
this means that townsfolk are less able to send much needed money to rural communities.
The return from commercial operations, such as logging, mining and fishing, on village lands
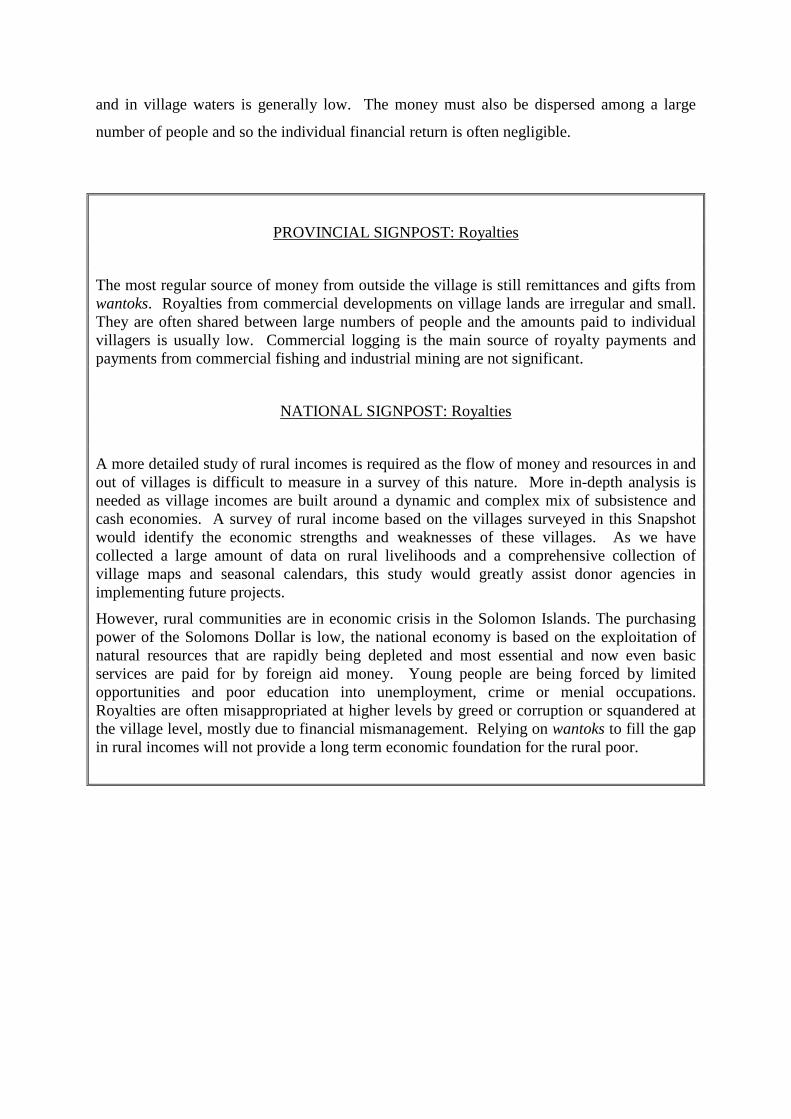
and in village waters is generally low. The money must also be dispersed among a large
number of people and so the individual financial return is often negligible.
PROVINCIAL SIGNPOST: Royalties
The most regular source of money from outside the village is still remittances and gifts fromwantoks. Royalties from commercial developments on village lands are irregular and small.They are often shared between large numbers of people and the amounts paid to individualvillagers is usually low. Commercial logging is the main source of royalty payments andpayments from commercial fishing and industrial mining are not significant.
NATIONAL SIGNPOST: Royalties
A more detailed study of rural incomes is required as the flow of money and resources in andout of villages is difficult to measure in a survey of this nature. More in-depth analysis isneeded as village incomes are built around a dynamic and complex mix of subsistence andcash economies. A survey of rural income based on the villages surveyed in this Snapshotwould identify the economic strengths and weaknesses of these villages. As we havecollected a large amount of data on rural livelihoods and a comprehensive collection ofvillage maps and seasonal calendars, this study would greatly assist donor agencies inimplementing future projects.
However, rural communities are in economic crisis in the Solomon Islands. The purchasingpower of the Solomons Dollar is low, the national economy is based on the exploitation ofnatural resources that are rapidly being depleted and most essential and now even basicservices are paid for by foreign aid money. Young people are being forced by limitedopportunities and poor education into unemployment, crime or menial occupations.Royalties are often misappropriated at higher levels by greed or corruption or squandered atthe village level, mostly due to financial mismanagement. Relying on wantoks to fill the gapin rural incomes will not provide a long term economic foundation for the rural poor.
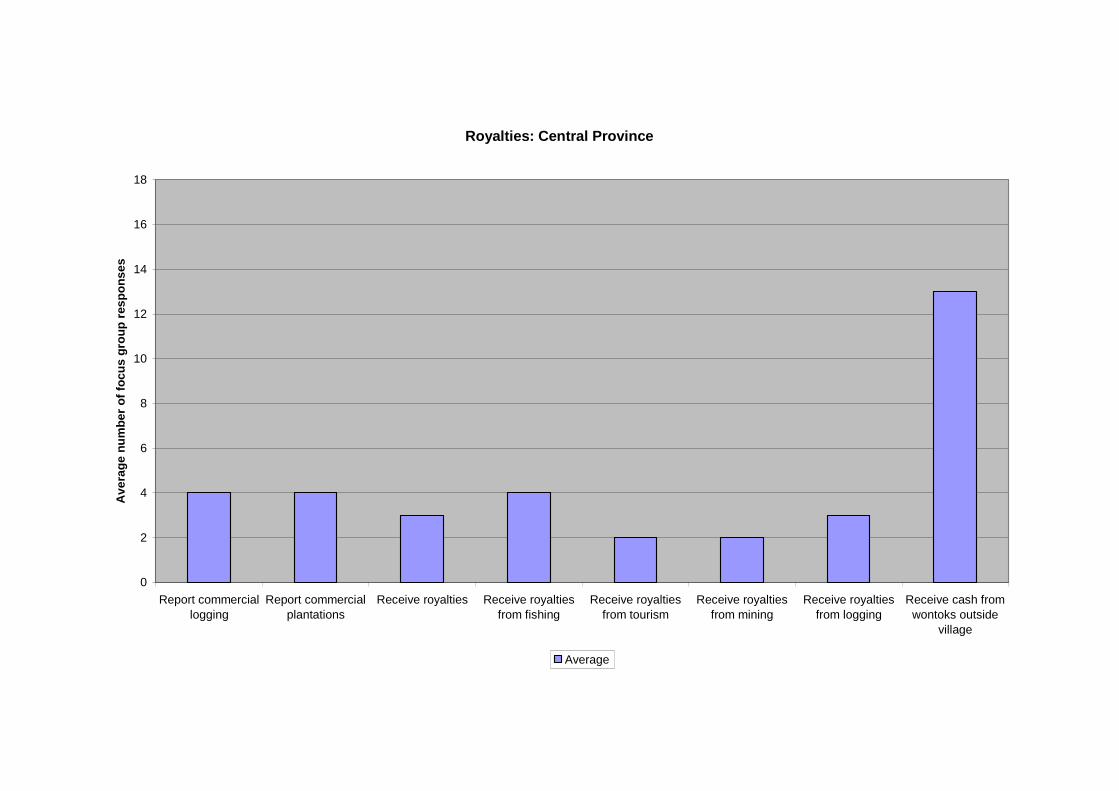
Royalties: Central Province
0
2
4
6
8
10
12
14
16
18
Report commercial
logging
Report commercial
plantations
Receive royalties Receive royalties
from fishing
Receive royalties
from tourism
Receive royalties
from mining
Receive royalties
from logging
Receive cash from
wontoks outside
village
Av
era
ge
nu
mb
er
of
foc
us
gro
up
res
po
ns
es
Average
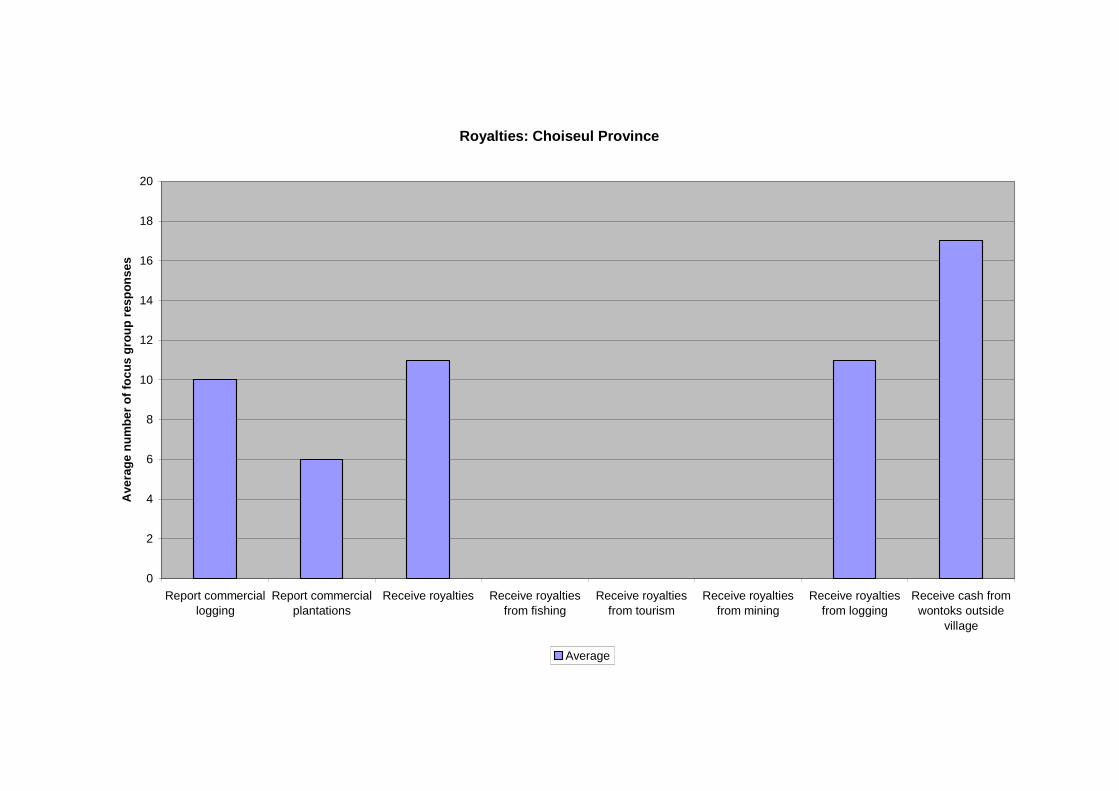
Royalties: Choiseul Province
0
2
4
6
8
10
12
14
16
18
20
Report commercial
logging
Report commercial
plantations
Receive royalties Receive royalties
from fishing
Receive royalties
from tourism
Receive royalties
from mining
Receive royalties
from logging
Receive cash from
wontoks outside
village
Ave
rag
en
um
be
ro
ffo
cu
sg
rou
pre
sp
on
se
s
Average
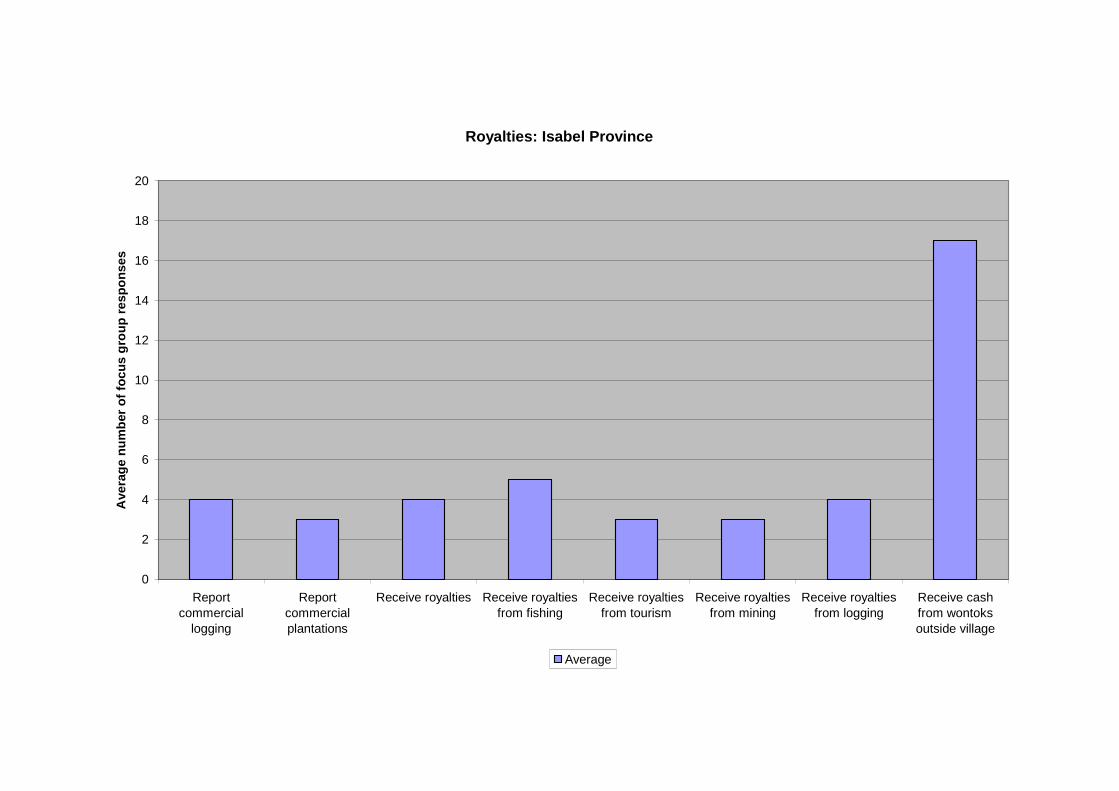
Royalties: Isabel Province
0
2
4
6
8
10
12
14
16
18
20
Reportcommercial
logging
Reportcommercialplantations
Receive royalties Receive royaltiesfrom fishing
Receive royaltiesfrom tourism
Receive royaltiesfrom mining
Receive royaltiesfrom logging
Receive cashfrom wontoksoutside village
Ave
rag
en
um
ber
of
foc
us
gro
up
res
po
ns
es
Average
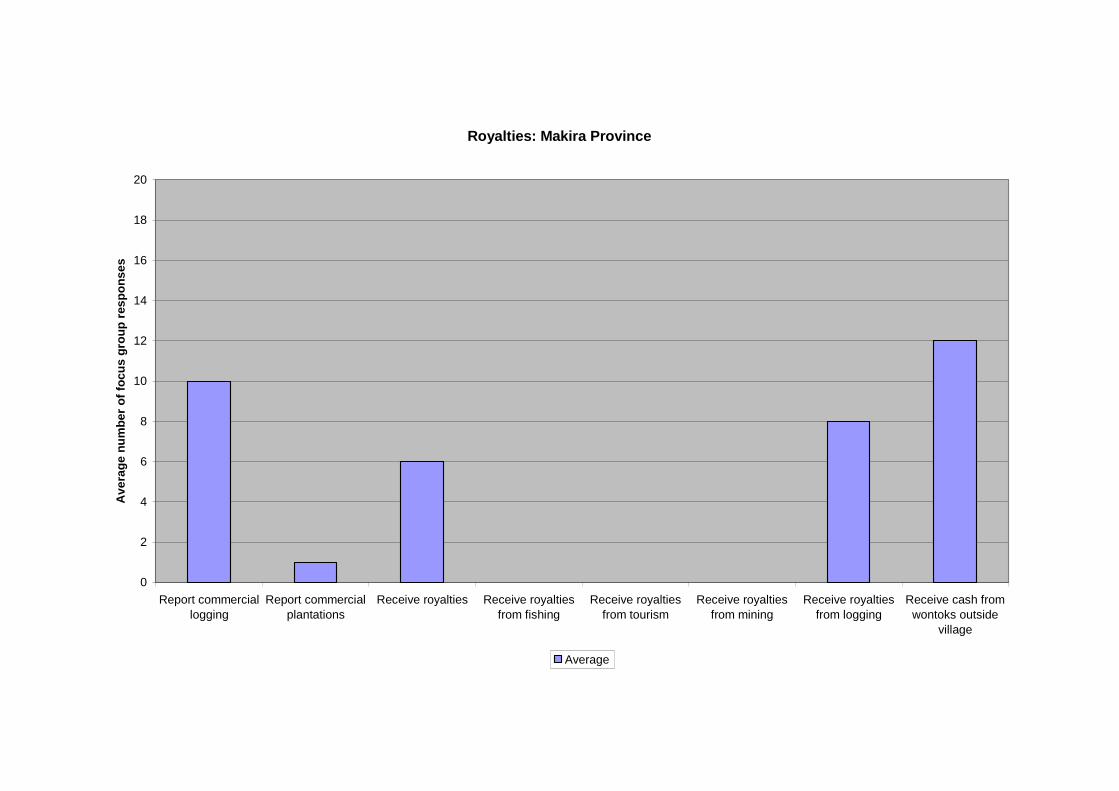
Royalties: Makira Province
0
2
4
6
8
10
12
14
16
18
20
Report commercial
logging
Report commercial
plantations
Receive royalties Receive royalties
from fishing
Receive royalties
from tourism
Receive royalties
from mining
Receive royalties
from logging
Receive cash from
wontoks outside
village
Av
era
ge
nu
mb
er
of
foc
us
gro
up
res
po
ns
es
Average
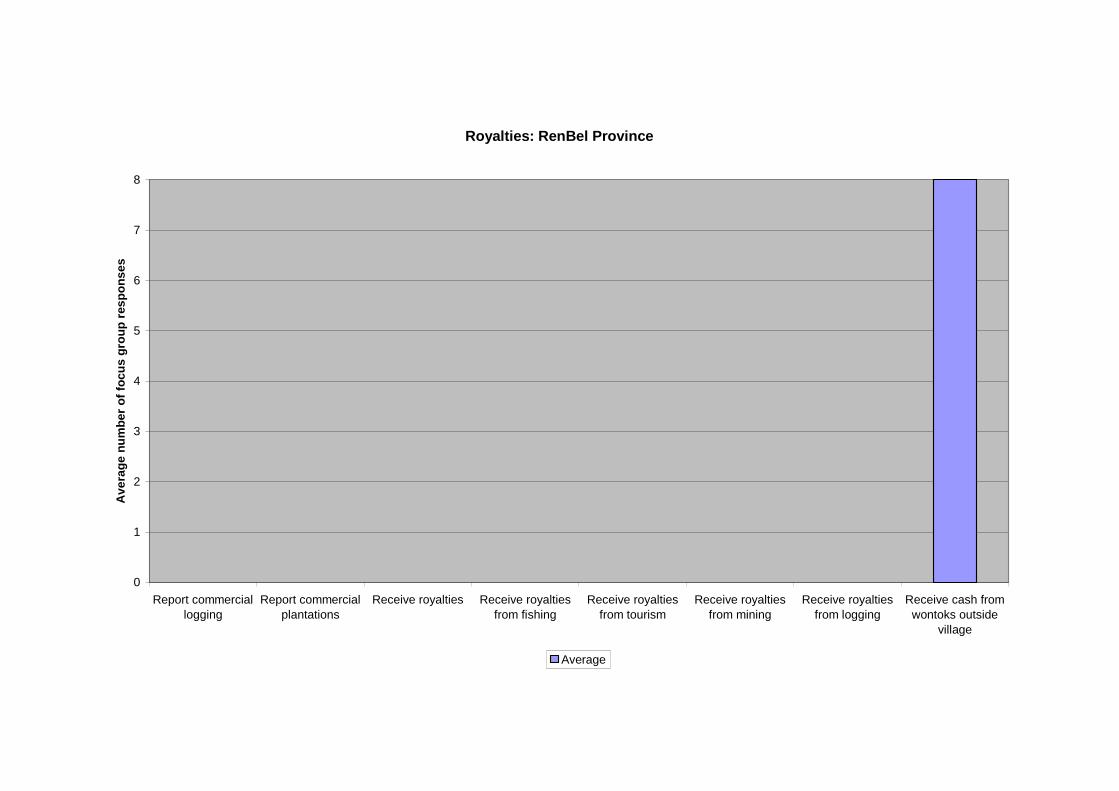
Royalties: RenBel Province
0
1
2
3
4
5
6
7
8
Report commercial
logging
Report commercial
plantations
Receive royalties Receive royalties
from fishing
Receive royalties
from tourism
Receive royalties
from mining
Receive royalties
from logging
Receive cash from
wontoks outside
village
Av
era
ge
nu
mb
er
of
foc
us
gro
up
res
po
ns
es
Average
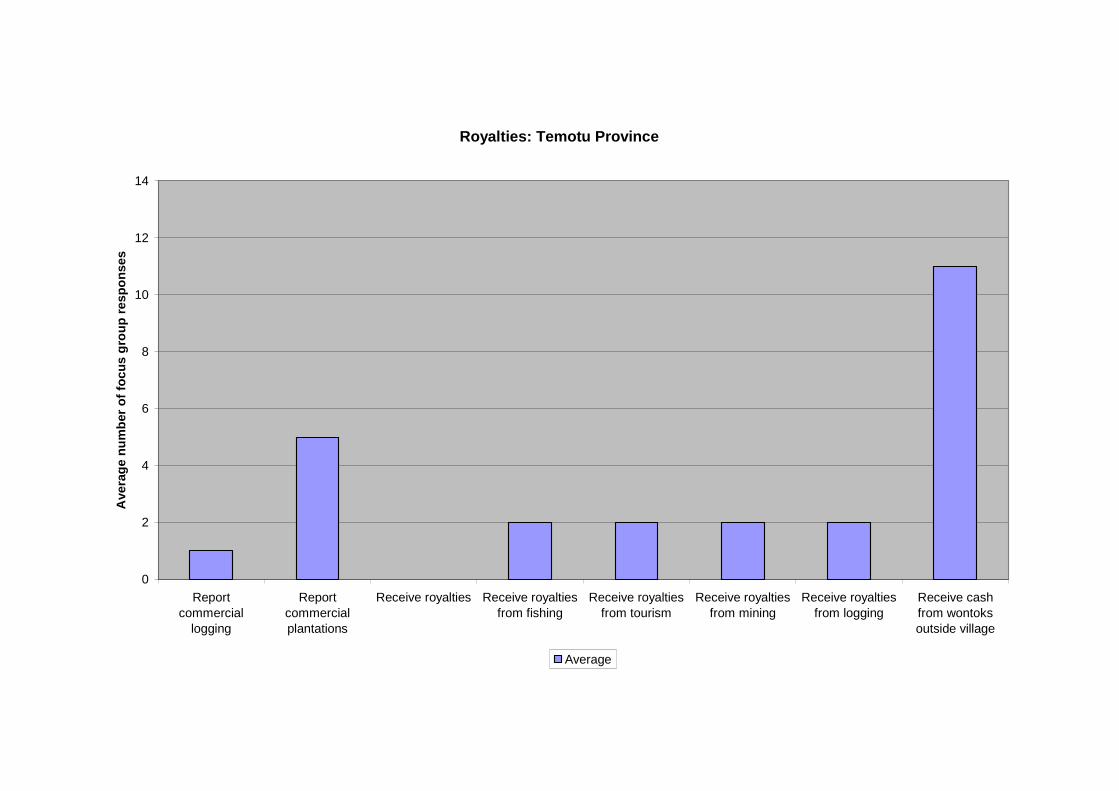
Royalties: Temotu Province
0
2
4
6
8
10
12
14
Reportcommercial
logging
Reportcommercialplantations
Receive royalties Receive royaltiesfrom fishing
Receive royaltiesfrom tourism
Receive royaltiesfrom mining
Receive royaltiesfrom logging
Receive cashfrom wontoksoutside village
Ave
rag
en
um
ber
of
foc
us
gro
up
res
po
ns
es
Average
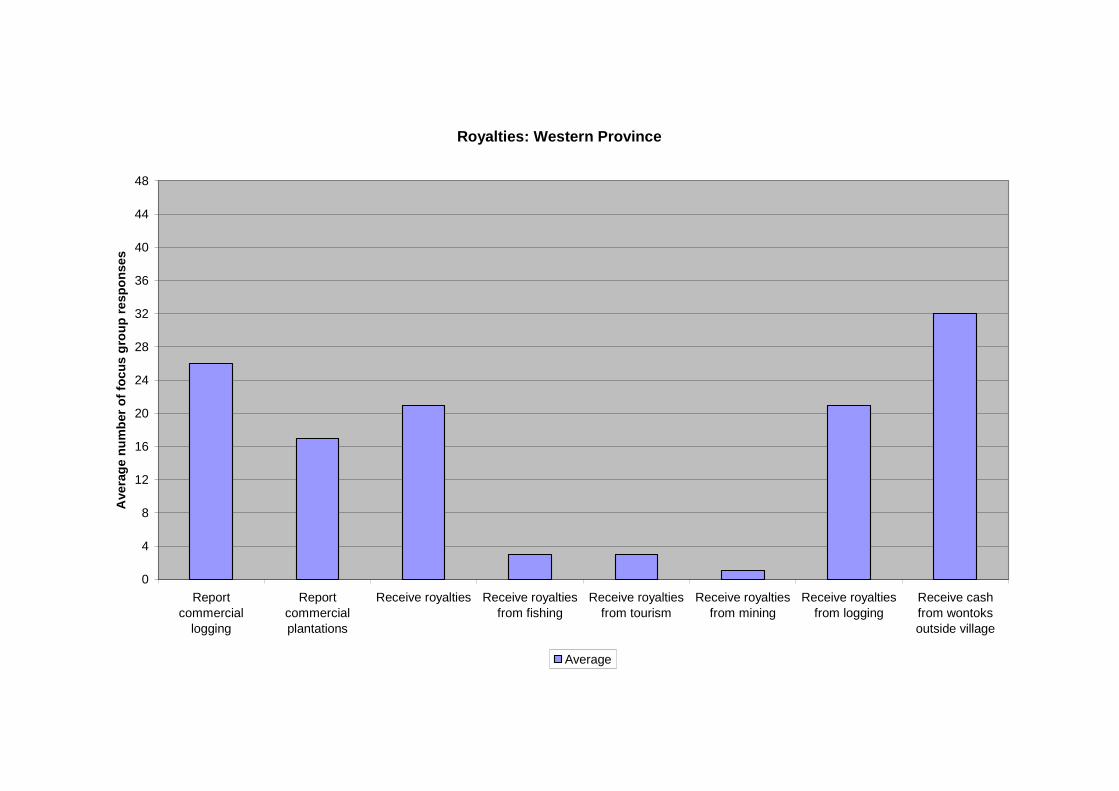
Royalties: Western Province
0
4
8
12
16
20
24
28
32
36
40
44
48
Reportcommercial
logging
Reportcommercialplantations
Receive royalties Receive royaltiesfrom fishing
Receive royaltiesfrom tourism
Receive royaltiesfrom mining
Receive royaltiesfrom logging
Receive cashfrom wontoksoutside village
Ave
rag
en
um
ber
of
foc
us
gro
up
res
po
ns
es
Average
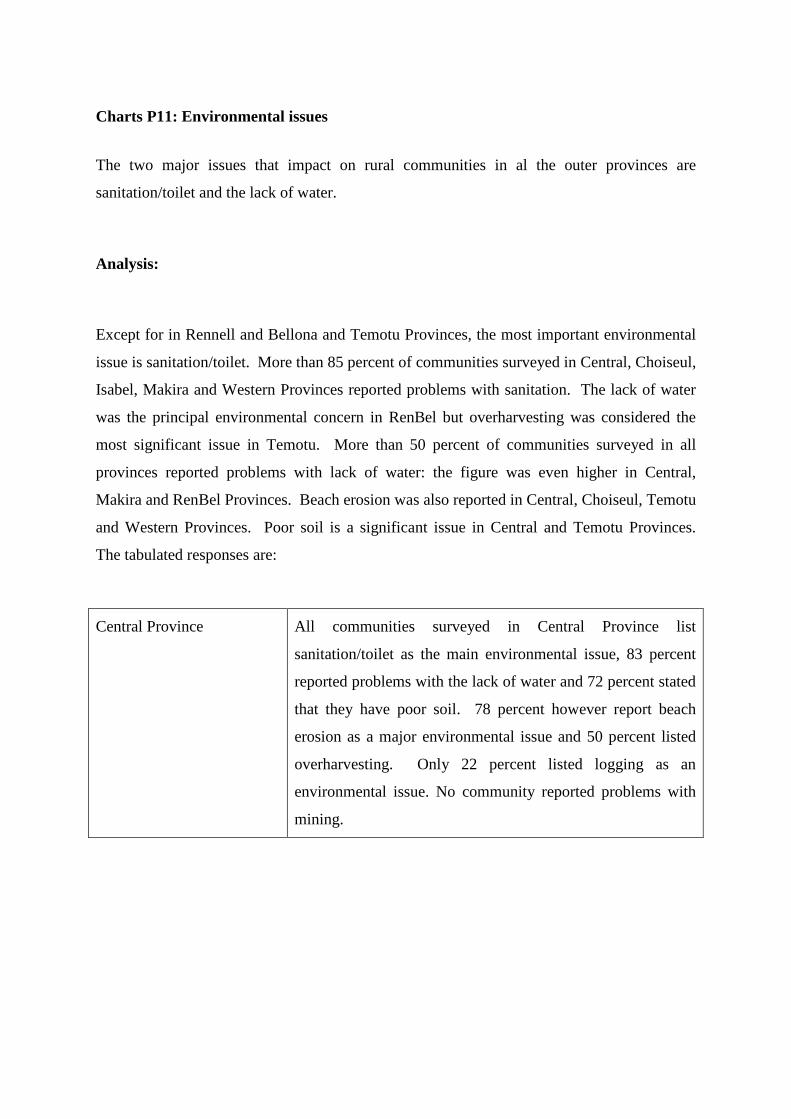
Charts P11: Environmental issues
The two major issues that impact on rural communities in al the outer provinces are
sanitation/toilet and the lack of water.
Analysis:
Except for in Rennell and Bellona and Temotu Provinces, the most important environmental
issue is sanitation/toilet. More than 85 percent of communities surveyed in Central, Choiseul,
Isabel, Makira and Western Provinces reported problems with sanitation. The lack of water
was the principal environmental concern in RenBel but overharvesting was considered the
most significant issue in Temotu. More than 50 percent of communities surveyed in all
provinces reported problems with lack of water: the figure was even higher in Central,
Makira and RenBel Provinces. Beach erosion was also reported in Central, Choiseul, Temotu
and Western Provinces. Poor soil is a significant issue in Central and Temotu Provinces.
The tabulated responses are:
Central Province All communities surveyed in Central Province list
sanitation/toilet as the main environmental issue, 83 percent
reported problems with the lack of water and 72 percent stated
that they have poor soil. 78 percent however report beach
erosion as a major environmental issue and 50 percent listed
overharvesting. Only 22 percent listed logging as an
environmental issue. No community reported problems with
mining.
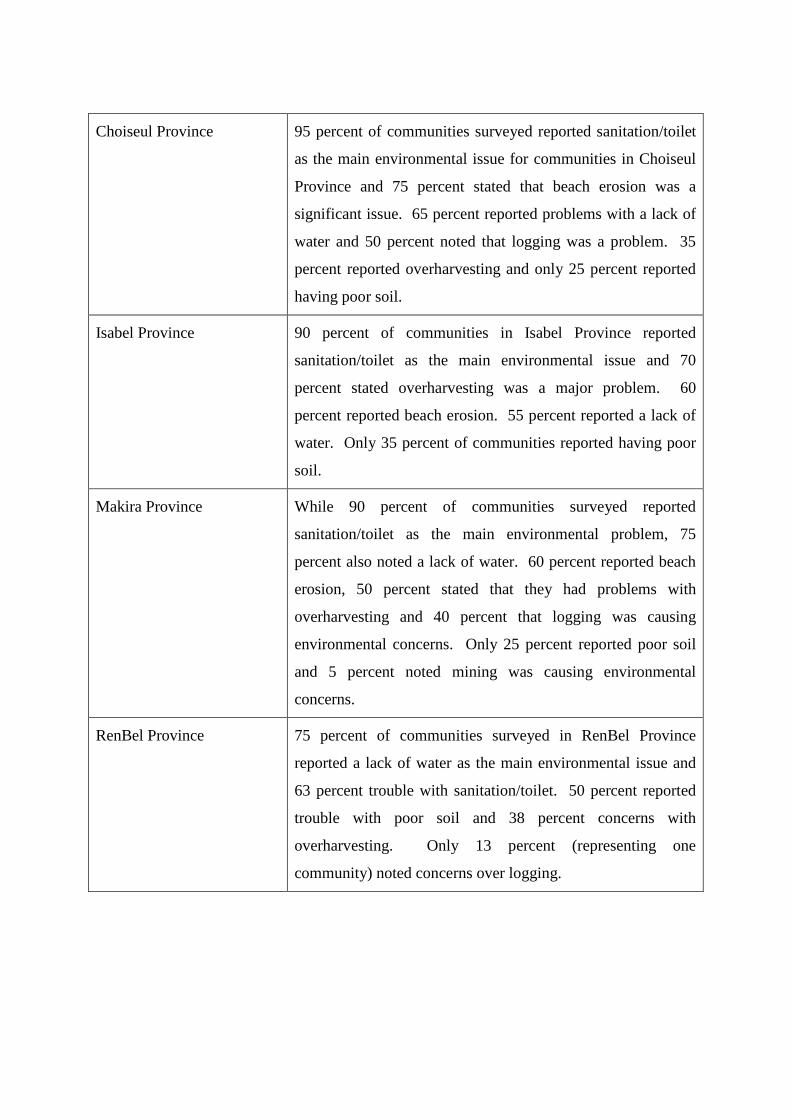
Choiseul Province 95 percent of communities surveyed reported sanitation/toilet
as the main environmental issue for communities in Choiseul
Province and 75 percent stated that beach erosion was a
significant issue. 65 percent reported problems with a lack of
water and 50 percent noted that logging was a problem. 35
percent reported overharvesting and only 25 percent reported
having poor soil.
Isabel Province 90 percent of communities in Isabel Province reported
sanitation/toilet as the main environmental issue and 70
percent stated overharvesting was a major problem. 60
percent reported beach erosion. 55 percent reported a lack of
water. Only 35 percent of communities reported having poor
soil.
Makira Province While 90 percent of communities surveyed reported
sanitation/toilet as the main environmental problem, 75
percent also noted a lack of water. 60 percent reported beach
erosion, 50 percent stated that they had problems with
overharvesting and 40 percent that logging was causing
environmental concerns. Only 25 percent reported poor soil
and 5 percent noted mining was causing environmental
concerns.
RenBel Province 75 percent of communities surveyed in RenBel Province
reported a lack of water as the main environmental issue and
63 percent trouble with sanitation/toilet. 50 percent reported
trouble with poor soil and 38 percent concerns with
overharvesting. Only 13 percent (representing one
community) noted concerns over logging.
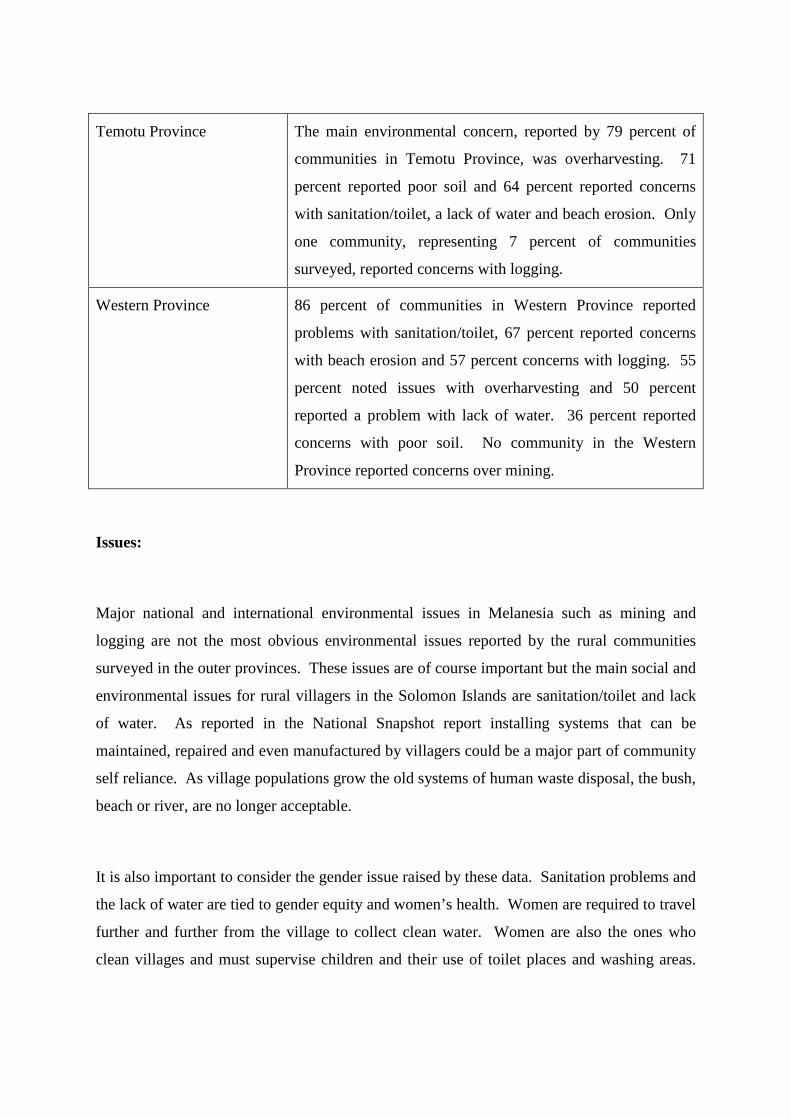
Temotu Province The main environmental concern, reported by 79 percent of
communities in Temotu Province, was overharvesting. 71
percent reported poor soil and 64 percent reported concerns
with sanitation/toilet, a lack of water and beach erosion. Only
one community, representing 7 percent of communities
surveyed, reported concerns with logging.
Western Province 86 percent of communities in Western Province reported
problems with sanitation/toilet, 67 percent reported concerns
with beach erosion and 57 percent concerns with logging. 55
percent noted issues with overharvesting and 50 percent
reported a problem with lack of water. 36 percent reported
concerns with poor soil. No community in the Western
Province reported concerns over mining.
Issues:
Major national and international environmental issues in Melanesia such as mining and
logging are not the most obvious environmental issues reported by the rural communities
surveyed in the outer provinces. These issues are of course important but the main social and
environmental issues for rural villagers in the Solomon Islands are sanitation/toilet and lack
of water. As reported in the National Snapshot report installing systems that can be
maintained, repaired and even manufactured by villagers could be a major part of community
self reliance. As village populations grow the old systems of human waste disposal, the bush,
beach or river, are no longer acceptable.
It is also important to consider the gender issue raised by these data. Sanitation problems and
the lack of water are tied to gender equity and women’s health. Women are required to travel
further and further from the village to collect clean water. Women are also the ones who
clean villages and must supervise children and their use of toilet places and washing areas.
Until men realize that keeping the village clean is part of community responsibility rather
than women’s duty, little progress will be made.
PROVINCIAL SIGNPOST: Environmental issues
Environmental issues are closely related to questions of gender and the role of women. Themajor environmental issues facing villages in the Solomon Islands are sanitation/toilet andlack of water. Other issues such as overharvesting, beach erosion and poor soil, which aresignificant, can only be solved at a provincial or national level. Sanitation and water are localvillage issues.
NATIONAL SIGNPOST: Environmental issues
Agencies like CSP with its extensive network of provincial offices can implement manyvaluable small-scale village projects related to sanitation/toilet and the lack of potable water.Donor agencies have made valuable attempts in the past with the provision of toilet systemsbut these have been too sophisticated to install, too complex to operate or require full timemaintenance staff. Responsibility for village wide systems cannot be enforced if people arenot paid or are not provided with the knowledge or equipment to operate sanitation and watersystems. These are also major gender issues in the resolution of local environmental issues.Women will be the main beneficiaries of these systems but selling their importance to menwill be a difficult task
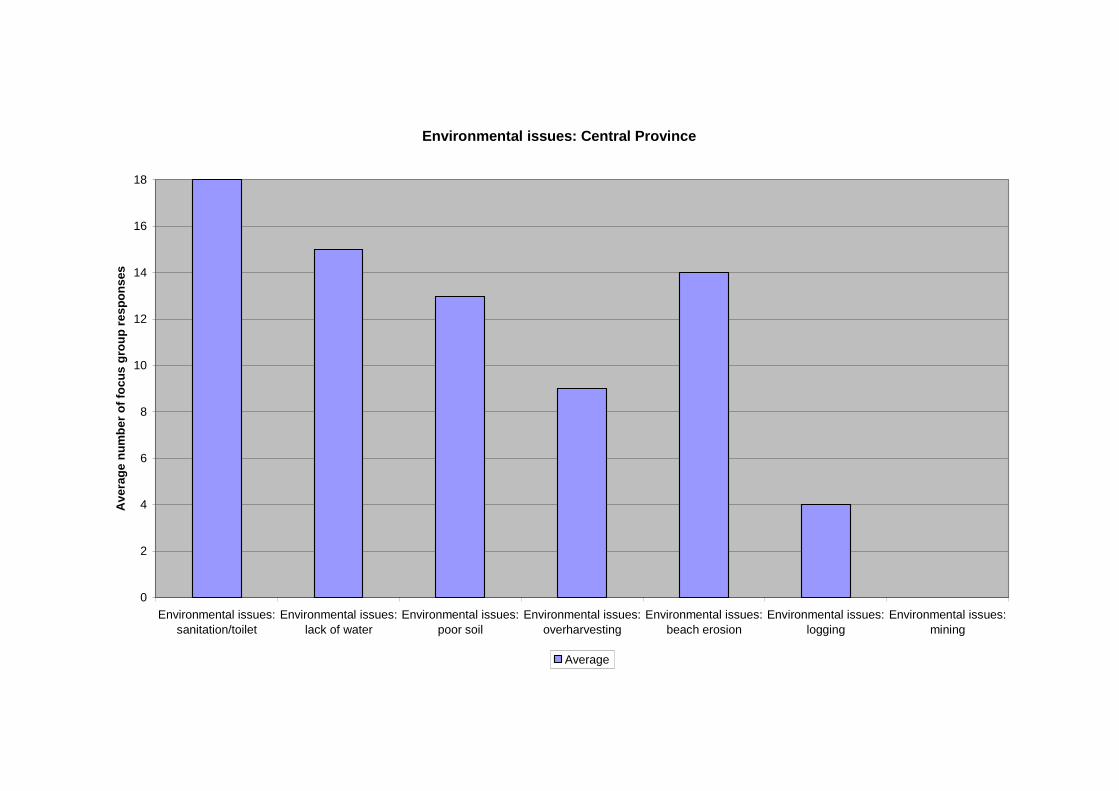
Environmental issues: Central Province
0
2
4
6
8
10
12
14
16
18
Environmental issues:
sanitation/toilet
Environmental issues:
lack of water
Environmental issues:
poor soil
Environmental issues:
overharvesting
Environmental issues:
beach erosion
Environmental issues:
logging
Environmental issues:
mining
Av
era
ge
nu
mb
er
of
foc
us
gro
up
res
po
ns
es
Average
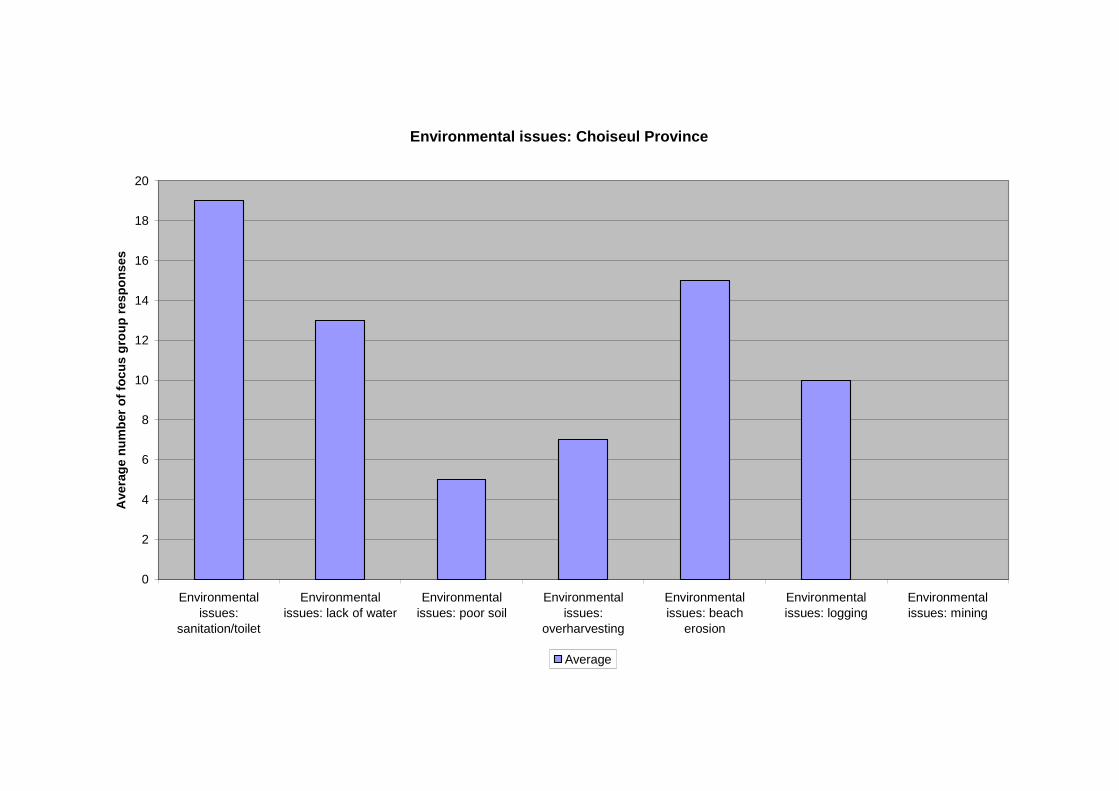
Environmental issues: Choiseul Province
0
2
4
6
8
10
12
14
16
18
20
Environmentalissues:
sanitation/toilet
Environmentalissues: lack of water
Environmentalissues: poor soil
Environmentalissues:
overharvesting
Environmentalissues: beach
erosion
Environmentalissues: logging
Environmentalissues: mining
Ave
rag
en
um
ber
of
foc
us
gro
up
res
po
ns
es
Average
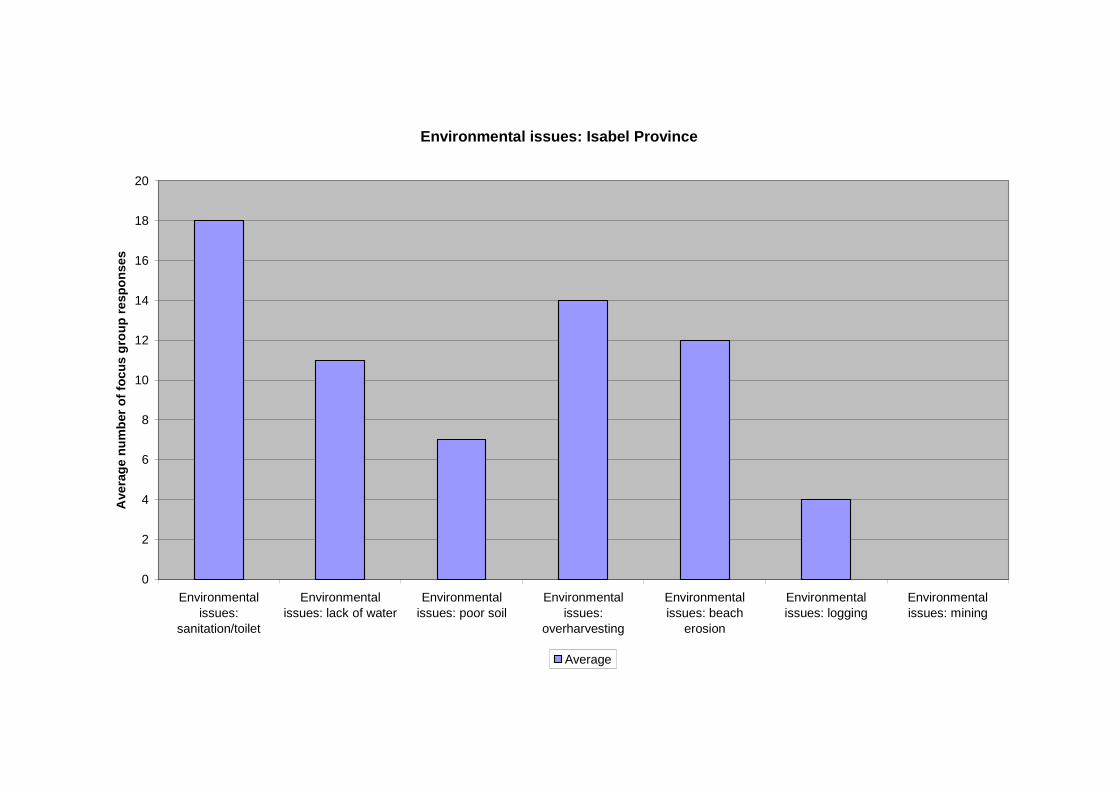
Environmental issues: Isabel Province
0
2
4
6
8
10
12
14
16
18
20
Environmentalissues:
sanitation/toilet
Environmentalissues: lack of water
Environmentalissues: poor soil
Environmentalissues:
overharvesting
Environmentalissues: beach
erosion
Environmentalissues: logging
Environmentalissues: mining
Ave
rag
en
um
ber
of
foc
us
gro
up
res
po
ns
es
Average
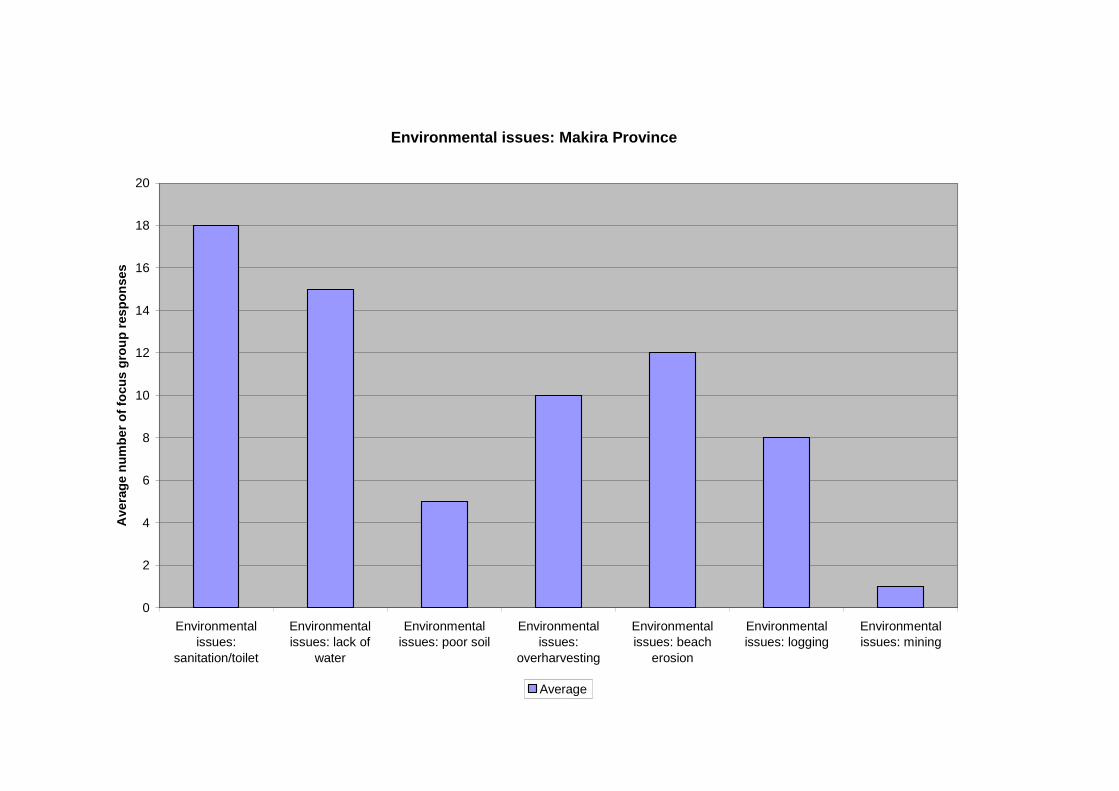
Environmental issues: Makira Province
0
2
4
6
8
10
12
14
16
18
20
Environmentalissues:
sanitation/toilet
Environmentalissues: lack of
water
Environmentalissues: poor soil
Environmentalissues:
overharvesting
Environmentalissues: beach
erosion
Environmentalissues: logging
Environmentalissues: mining
Ave
rag
en
um
be
ro
ffo
cu
sg
rou
pre
sp
on
ses
Average

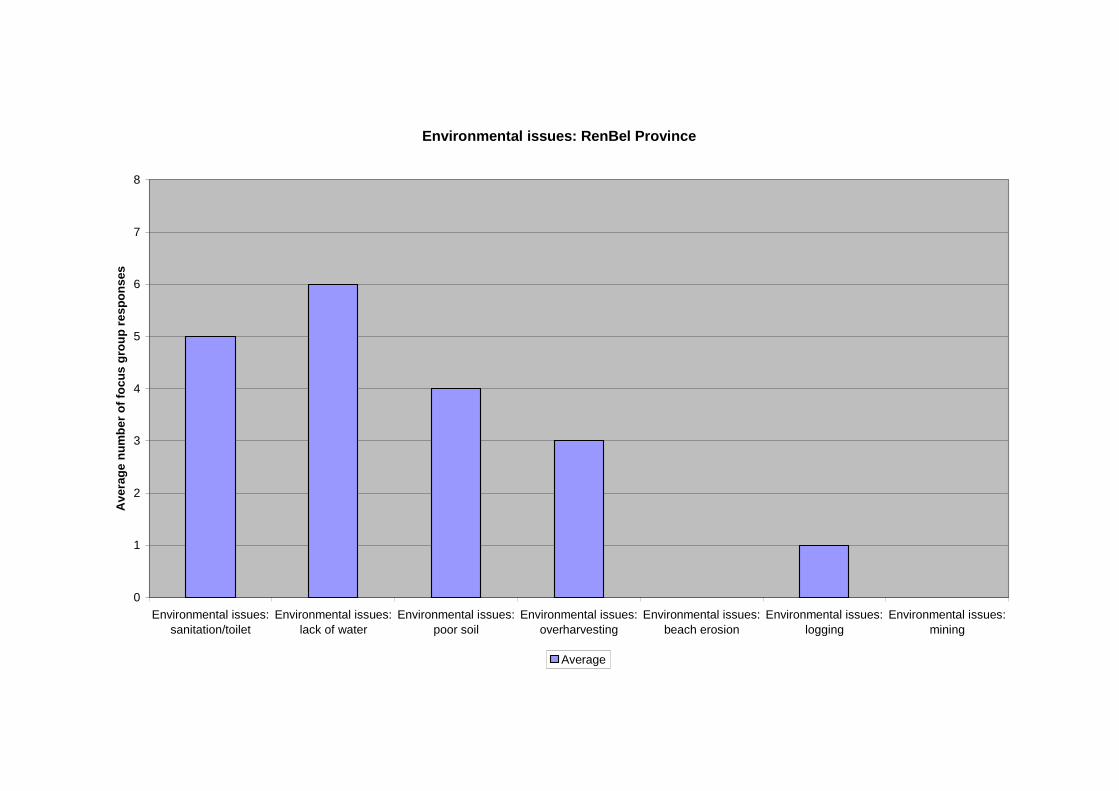
Environmental issues: RenBel Province
0
1
2
3
4
5
6
7
8
Environmental issues:
sanitation/toilet
Environmental issues:
lack of water
Environmental issues:
poor soil
Environmental issues:
overharvesting
Environmental issues:
beach erosion
Environmental issues:
logging
Environmental issues:
mining
Av
era
ge
nu
mb
er
of
foc
us
gro
up
res
po
ns
es
Average
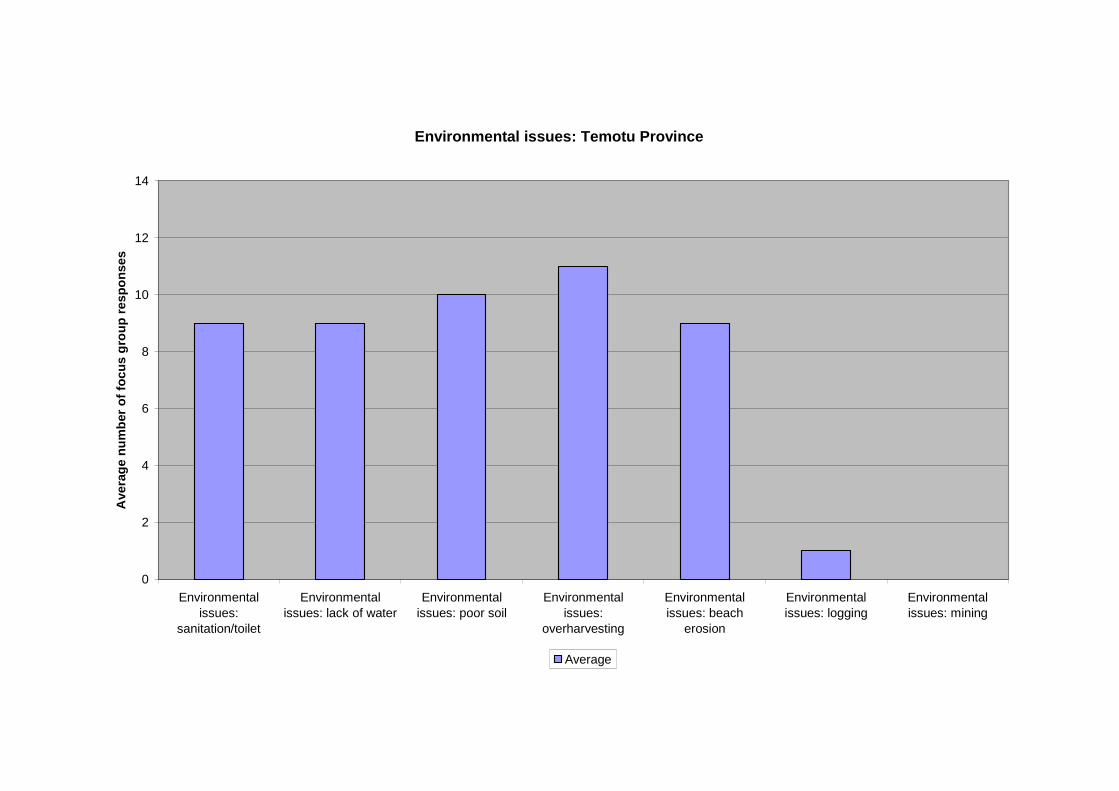
Environmental issues: Temotu Province
0
2
4
6
8
10
12
14
Environmentalissues:
sanitation/toilet
Environmentalissues: lack of water
Environmentalissues: poor soil
Environmentalissues:
overharvesting
Environmentalissues: beach
erosion
Environmentalissues: logging
Environmentalissues: mining
Ave
rag
en
um
ber
of
foc
us
gro
up
res
po
ns
es
Average
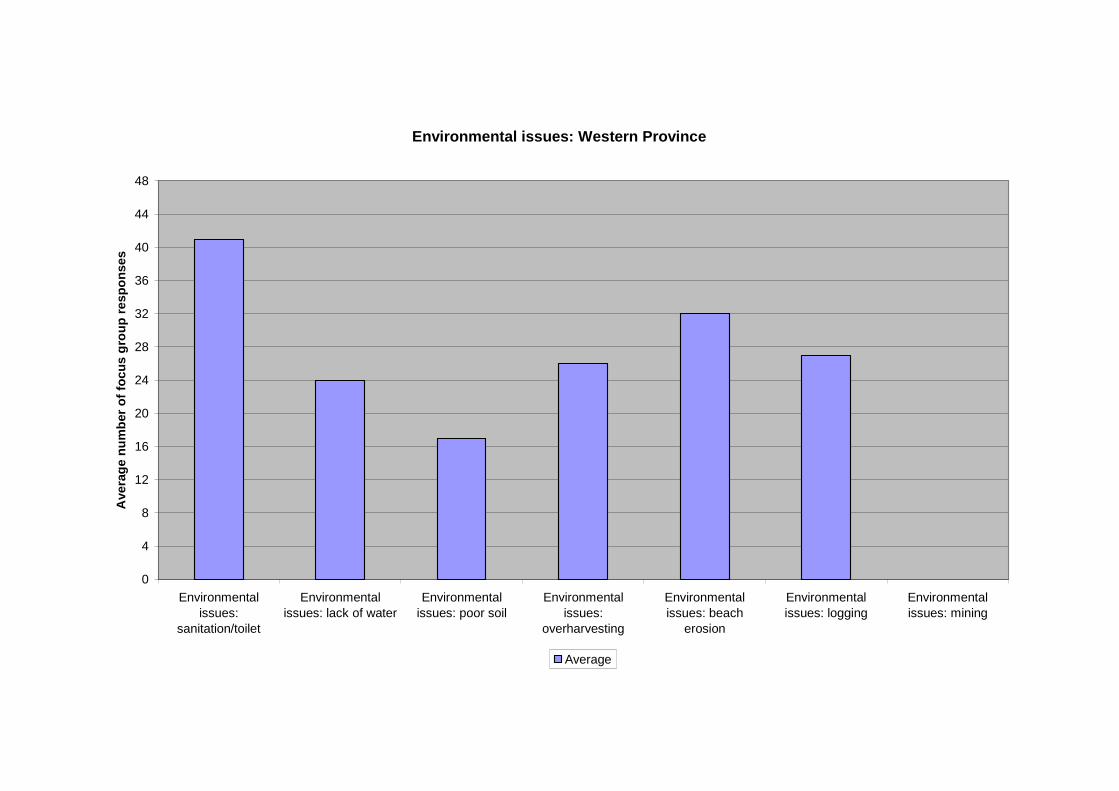
Environmental issues: Western Province
0
4
8
12
16
20
24
28
32
36
40
44
48
Environmentalissues:
sanitation/toilet
Environmentalissues: lack of water
Environmentalissues: poor soil
Environmentalissues:
overharvesting
Environmentalissues: beach
erosion
Environmentalissues: logging
Environmentalissues: mining
Ave
rag
en
um
ber
of
foc
us
gro
up
res
po
ns
es
Average
Charts P12: Agricultural extension services
As reported in the National Snapshot, despite problems with the productivity of gardens, the
reported increase in incidences of pests and diseases and a decreasing fallow period, the
agricultural extension service is not working.
Analysis:
In all provinces except Temotu and Western Province, more than 80 percent of communities
surveyed reported that they had not seen an agricultural extension officer since the year 2000.
In Temotu 64 percent of communities surveyed stated that they had not seen n officer since
2000 and in Western Province 71 percent of communities reported no contact with the
agricultural extension service. Tabulated responses are:
Central Province 89 percent of communities have not seen an agricultural
extension officer since 2000.
Choiseul Province 90 percent of communities have not seen an agricultural
extension officer.
Isabel Province 80 percent of communities have not seen an extension officer
since 2000, 15 percent stated that they have seen an
agricultural extension officer since then.
Makira Province While 80 percent of communities in Makira reported that they
have also not seen an extension officer since 2000, 20 percent
reported that they had seen one since then.
RenBel Province All communities in RenBel reported that they had not seen an
extension officer since 2000.
Temotu Province While 64 percent of communities stated that they had not seen
an agricultural extension officer since 2000, 36 percent
reported that they had seen one.
Western Province In Western Province 71 percent of communities reported that
they had not seen an agricultural extension officer sine 2000
but 23 percent stated that they had.
Issues:
People in rural communities had a wide range of problems with local gardens, with marketing
produce and with access to information on new crops and changing consumer tastes. Major
issues noted were poor soil, declining garden productivity, over-harvesting of natural
resources, pests and disease, a decreasing fallow period, and the problems inherent in a
growing population with a failing transportation infrastructure. None of these issues is being
addressed at present.
PROVINCIAL SIGNPOST: Agricultural extension services
The number of communities that report no contact with agricultural extension servicesdespite the growing problems with gardens, marketing and declining garden productivity isevidence that the service is failing the rural people of the outer provinces of the SolomonIslands.
NATIONAL SIGNPOST: Agricultural extension services
The agriculture extension service is not operating. It would therefore be little point inexpending resources dedicated to the CSP Livelihoods Program to shore up a non-existentnational government service that will not deliver the needed answers in time.

Agricultural extension services: Central Province
0
2
4
6
8
10
12
14
16
18
Have seen an extension officer post 2000 Have not seen an extension officer
Av
era
ge
nu
mb
er
of
foc
us
gro
up
res
po
ns
es
Average
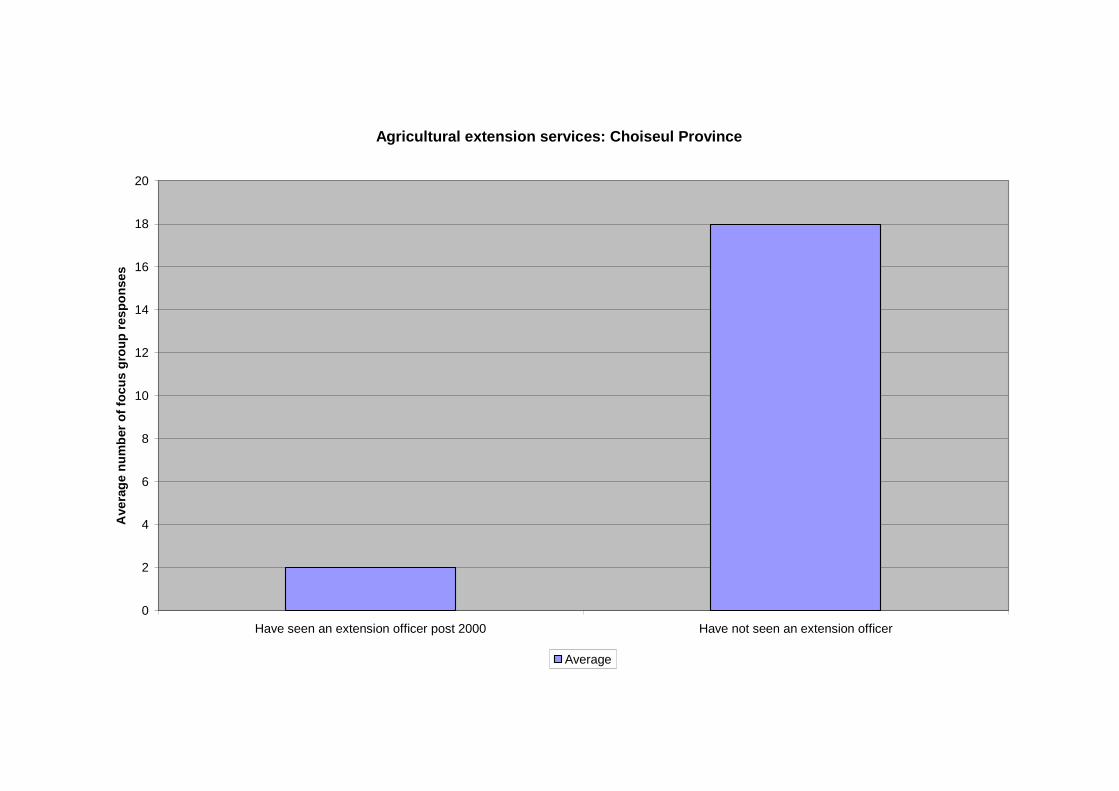
Agricultural extension services: Choiseul Province
0
2
4
6
8
10
12
14
16
18
20
Have seen an extension officer post 2000 Have not seen an extension officer
Ave
rag
en
um
ber
of
foc
us
gro
up
res
po
ns
es
Average
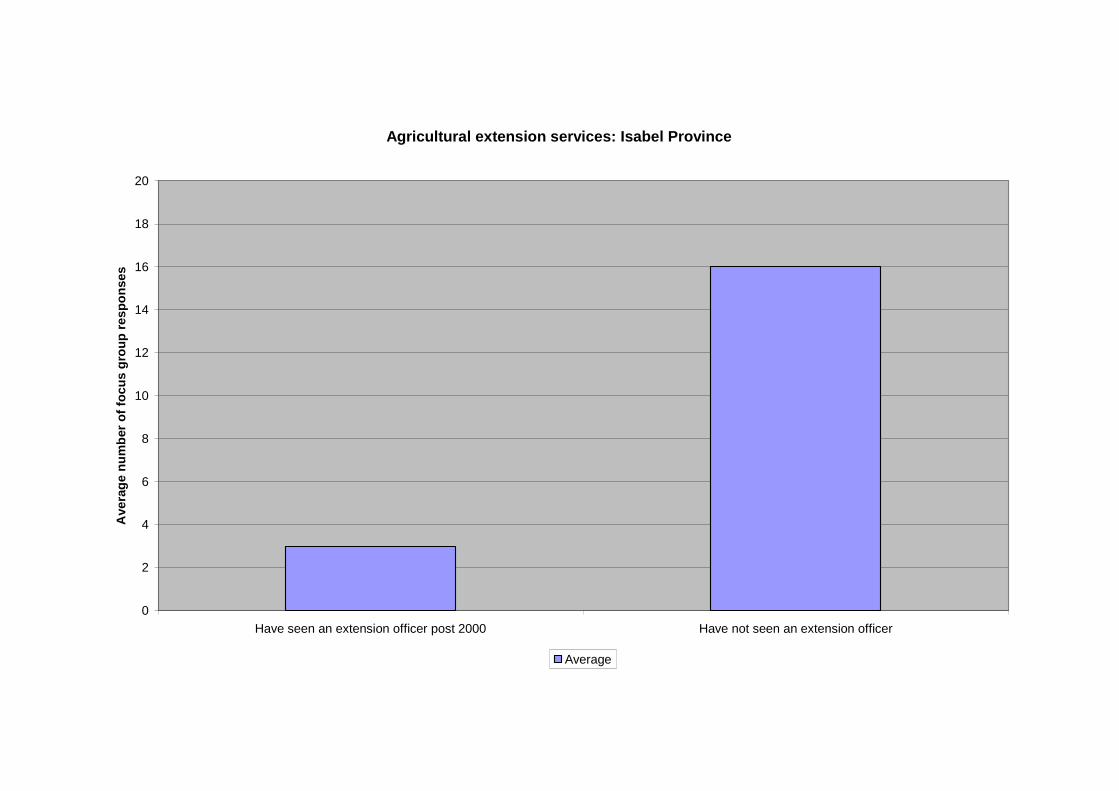
Agricultural extension services: Isabel Province
0
2
4
6
8
10
12
14
16
18
20
Have seen an extension officer post 2000 Have not seen an extension officer
Ave
rag
en
um
ber
of
foc
us
gro
up
res
po
ns
es
Average
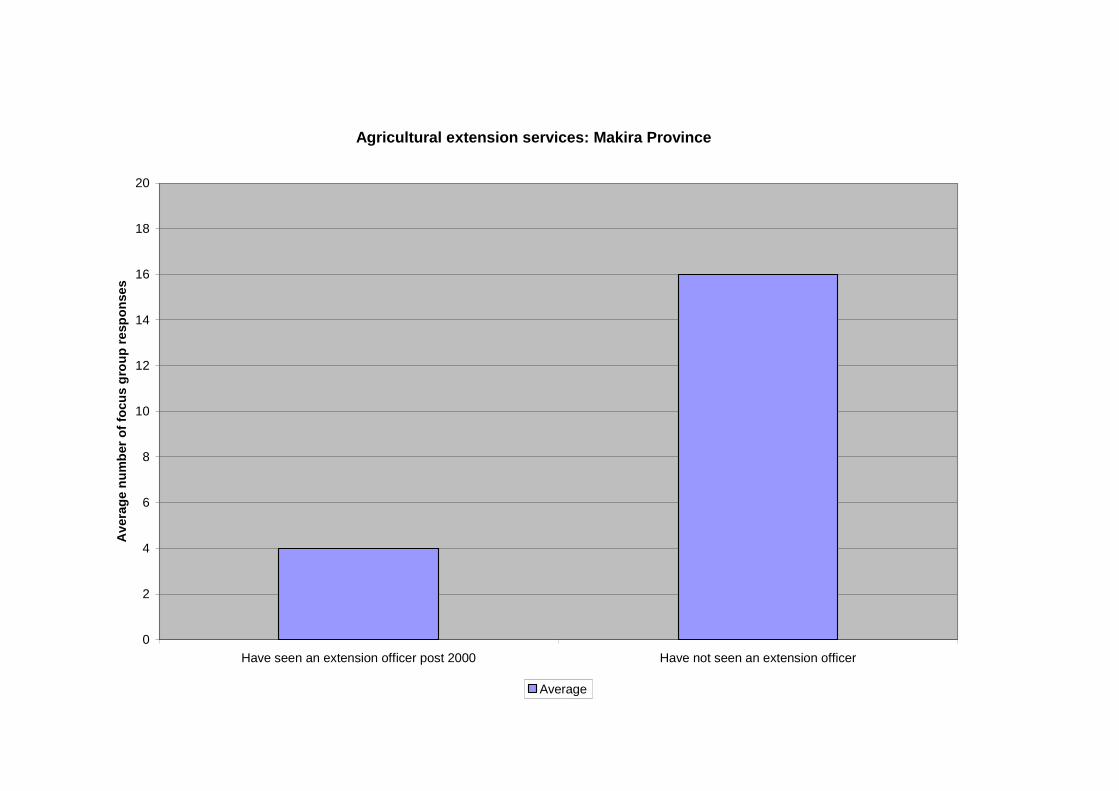
Agricultural extension services: Makira Province
0
2
4
6
8
10
12
14
16
18
20
Have seen an extension officer post 2000 Have not seen an extension officer
Av
era
ge
nu
mb
er
of
focu
sg
rou
pre
sp
on
se
s
Average

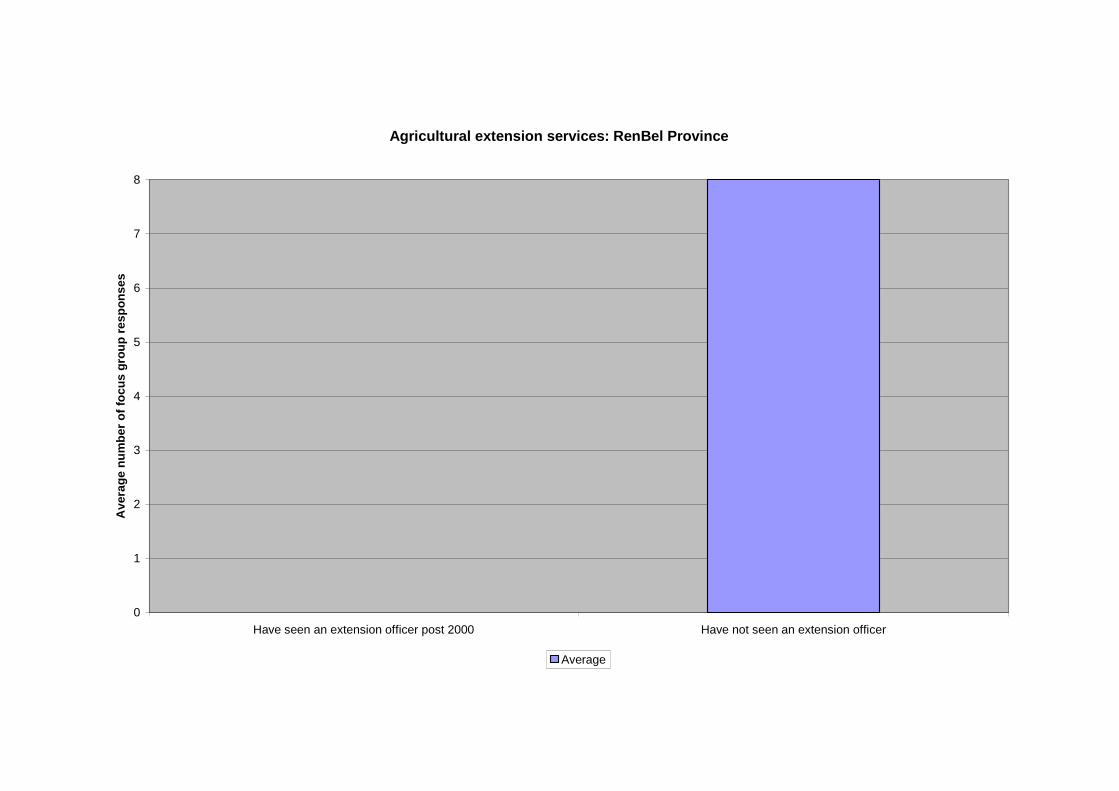
Agricultural extension services: RenBel Province
0
1
2
3
4
5
6
7
8
Have seen an extension officer post 2000 Have not seen an extension officer
Av
era
ge
nu
mb
er
of
foc
us
gro
up
res
po
ns
es
Average
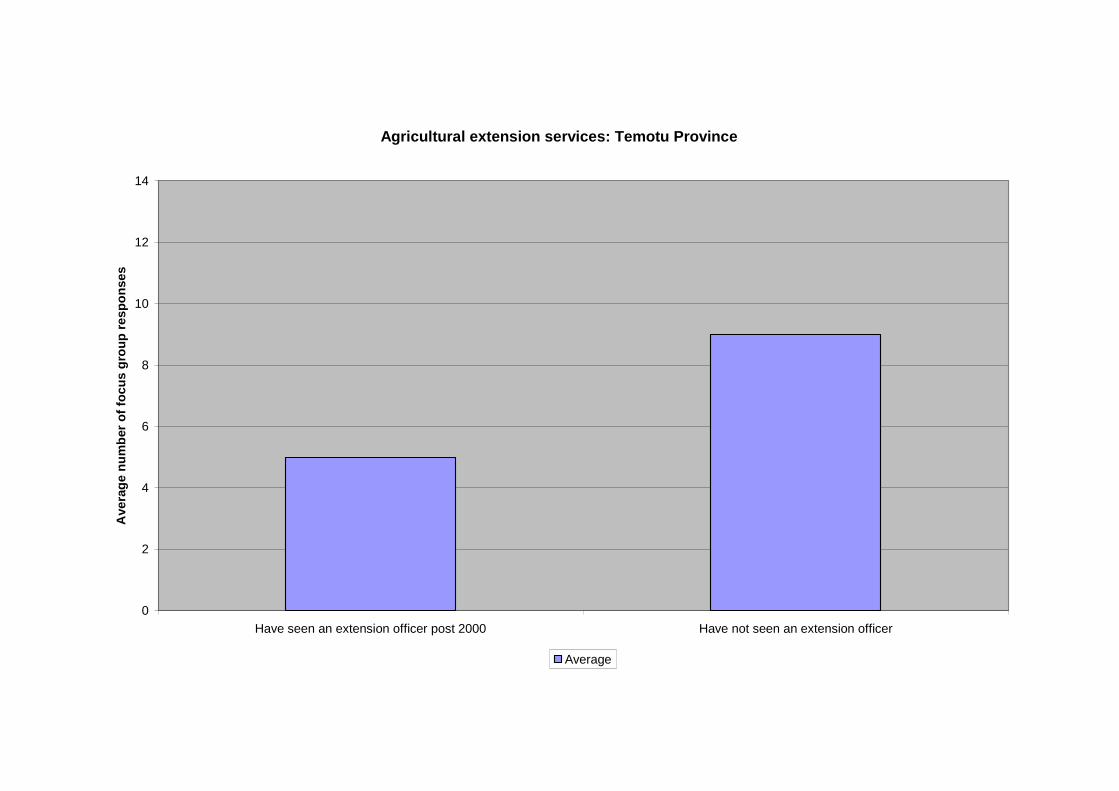
Agricultural extension services: Temotu Province
0
2
4
6
8
10
12
14
Have seen an extension officer post 2000 Have not seen an extension officer
Ave
rag
en
um
ber
of
foc
us
gro
up
res
po
ns
es
Average
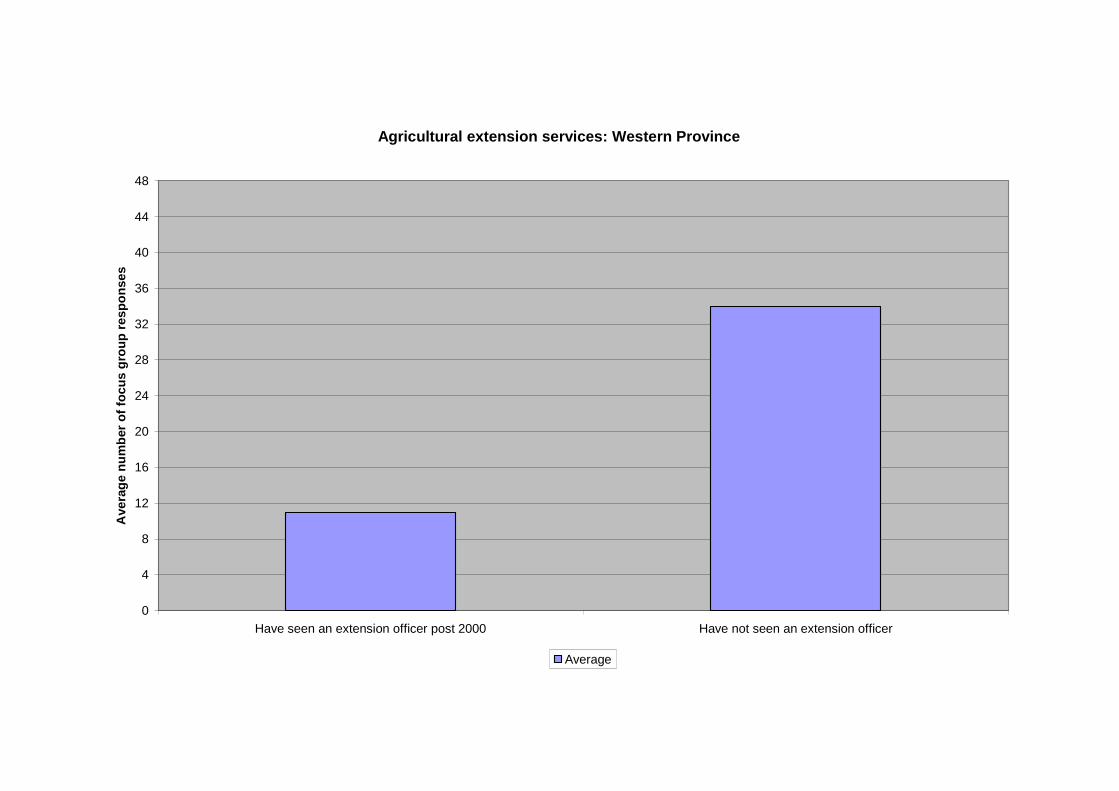
Agricultural extension services: Western Province
0
4
8
12
16
20
24
28
32
36
40
44
48
Have seen an extension officer post 2000 Have not seen an extension officer
Ave
rag
en
um
ber
of
foc
us
gro
up
res
po
ns
es
Average
Chart P13: Village groups
Analysis:
In all provinces, except for Makira, the most important village groups are constructed around
the Christian churches. On Makira the most numerous social organisations are women’s
groups. In Central Province only 6 percent of communities surveyed reported the presence of
women’s groups: the lowest of all the outer provinces. More than 50 percent of communities
in the provinces, some even higher for example on Isabel, Makira, RenBel and Temotu,
reported the presence of youth groups. The tabulated responses are:
Central Province While 94 percent of communities have church groups only 6
percent have women’s groups and 22 percent have youth
groups.
Choiseul Province 85 percent of communities have church groups, 55 percent
have women’s groups and 50 percent have youth groups.
Isabel Province 95 percent have church groups and 85 percent have both
women’s groups and youth groups.
Makira Province In Makira 95 percent of communities surveyed have women’s
groups and 75 percent have youth groups. Only 75 percent
have church groups.
RenBel Province All communities in RenBel Province have church groups but
only 63 percent have women’s and youth groups.
Temotu Province In Temotu Province all communities surveyed have church
groups but only 50 percent have women’s groups and 71
percent have youth groups.
Western Province In Western Province, 74 percent of communities have church
groups. 50 percent have women’s groups but only 50 percent
have youth groups.
Issues:
Women’s and youth groups are often organised by the local churches. However, some od
exist independently. These organized village groups provide aid agencies with a platform for
strengthening their work in rural areas. These groups are structured and, while they may
have internal political and personality issues that cannot be resolved by outsiders, they may
also be the means for empowering the weakest groups in the villages.
PROVINCIAL SIGNPOST: Village groups
The use of the existing village groups often structured around the churches are importantvehicles for access into the community. They are often well organised and effective and theiruse can be seen as respecting established protocols, status and order.
NATIONAL SIGNPOST: Village groups
It is important that the weakest groups in the village are strengthened by donor assistancefirst. It is also apparent that women and youth do have a formal and structured place in thevillages and that this can be used to the advantage of both the aid agency and the community
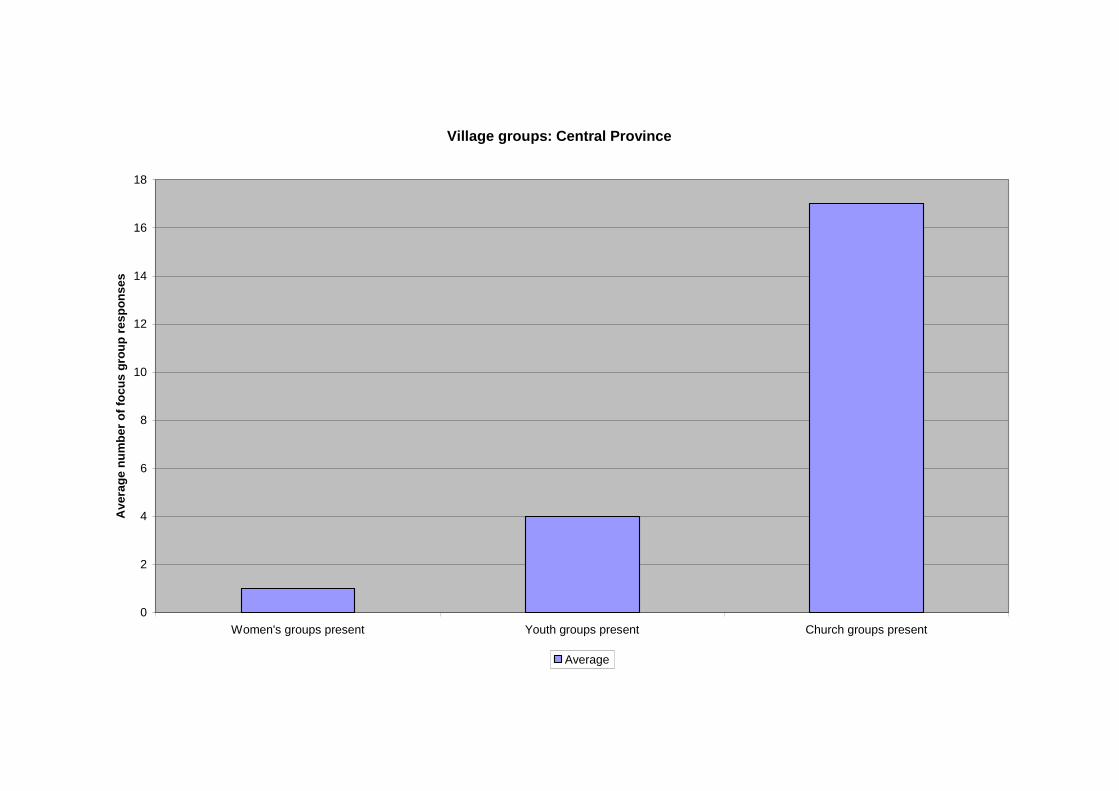
Village groups: Central Province
0
2
4
6
8
10
12
14
16
18
Women's groups present Youth groups present Church groups present
Av
era
ge
nu
mb
er
of
foc
us
gro
up
res
po
ns
es
Average
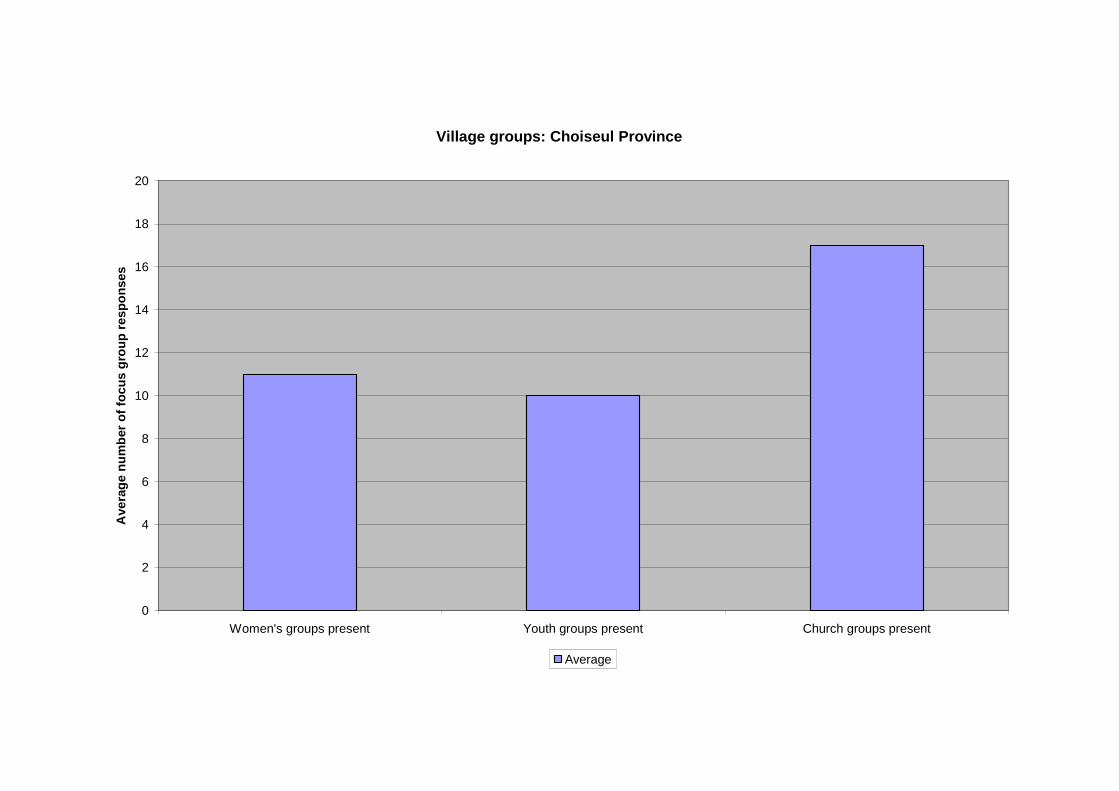
Village groups: Choiseul Province
0
2
4
6
8
10
12
14
16
18
20
Women's groups present Youth groups present Church groups present
Ave
rag
en
um
ber
of
foc
us
gro
up
res
po
ns
es
Average
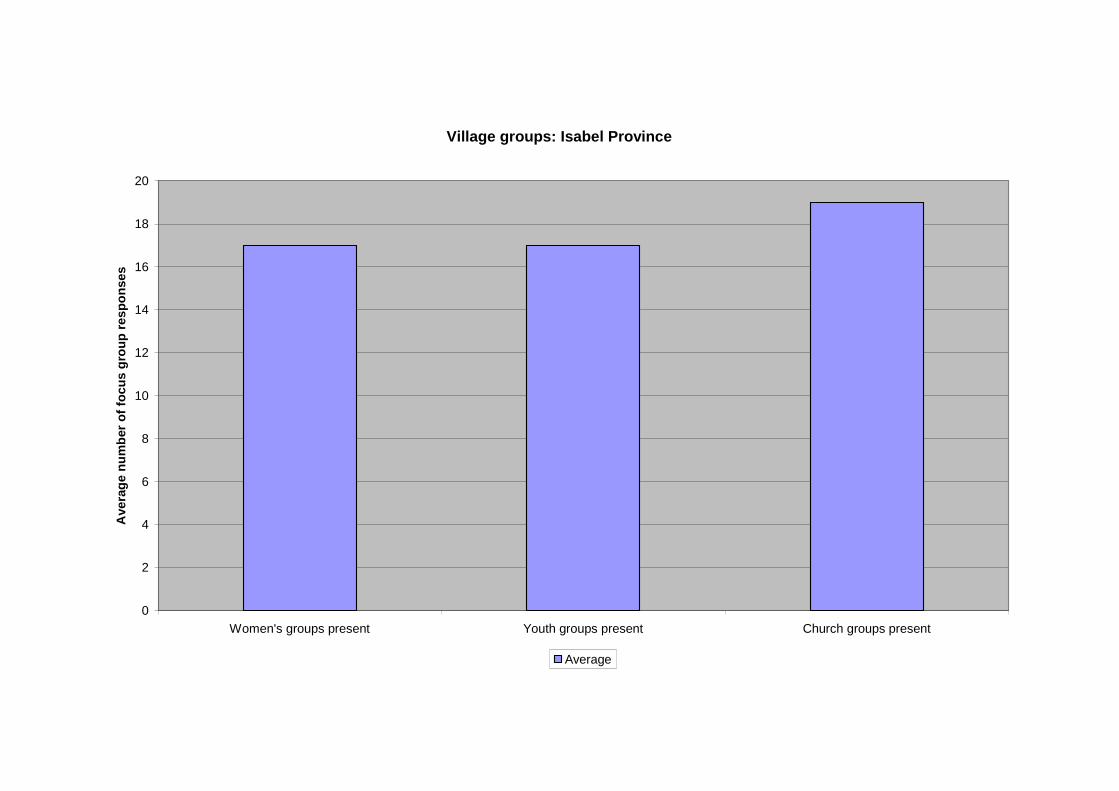
Village groups: Isabel Province
0
2
4
6
8
10
12
14
16
18
20
Women's groups present Youth groups present Church groups present
Ave
rag
en
um
ber
of
foc
us
gro
up
res
po
ns
es
Average
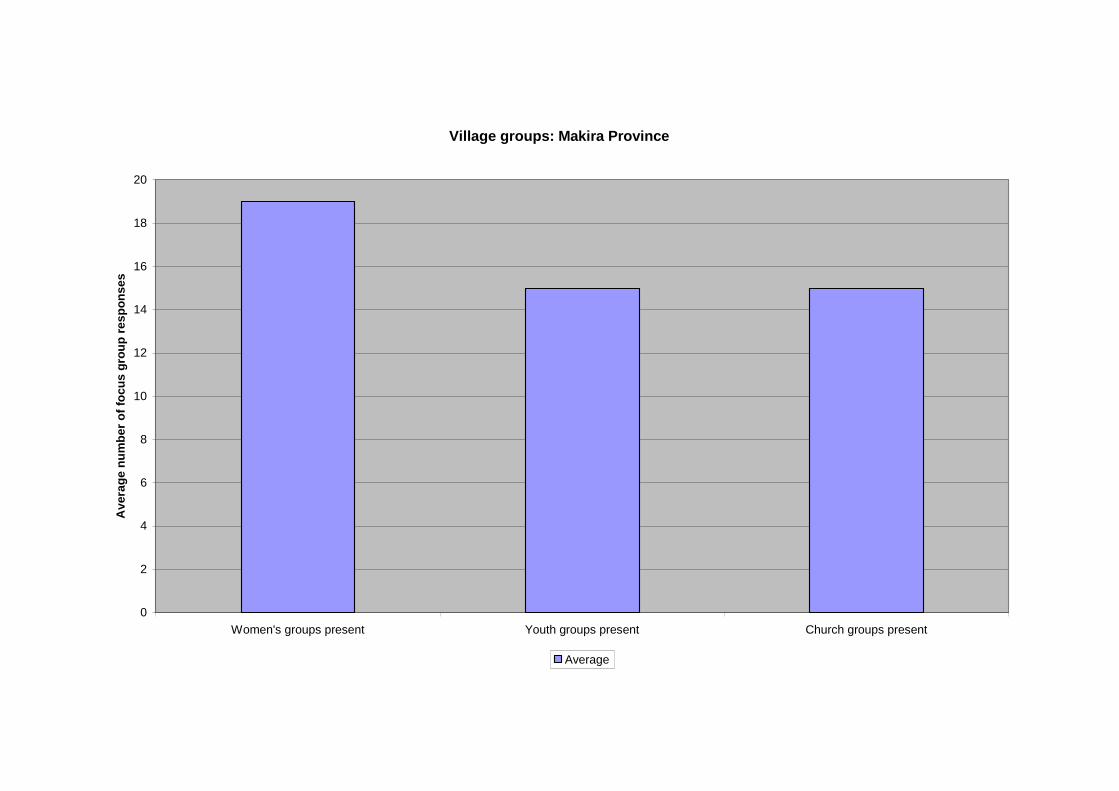
Village groups: Makira Province
0
2
4
6
8
10
12
14
16
18
20
Women's groups present Youth groups present Church groups present
Av
era
ge
nu
mb
er
of
foc
us
gro
up
res
po
ns
es
Average
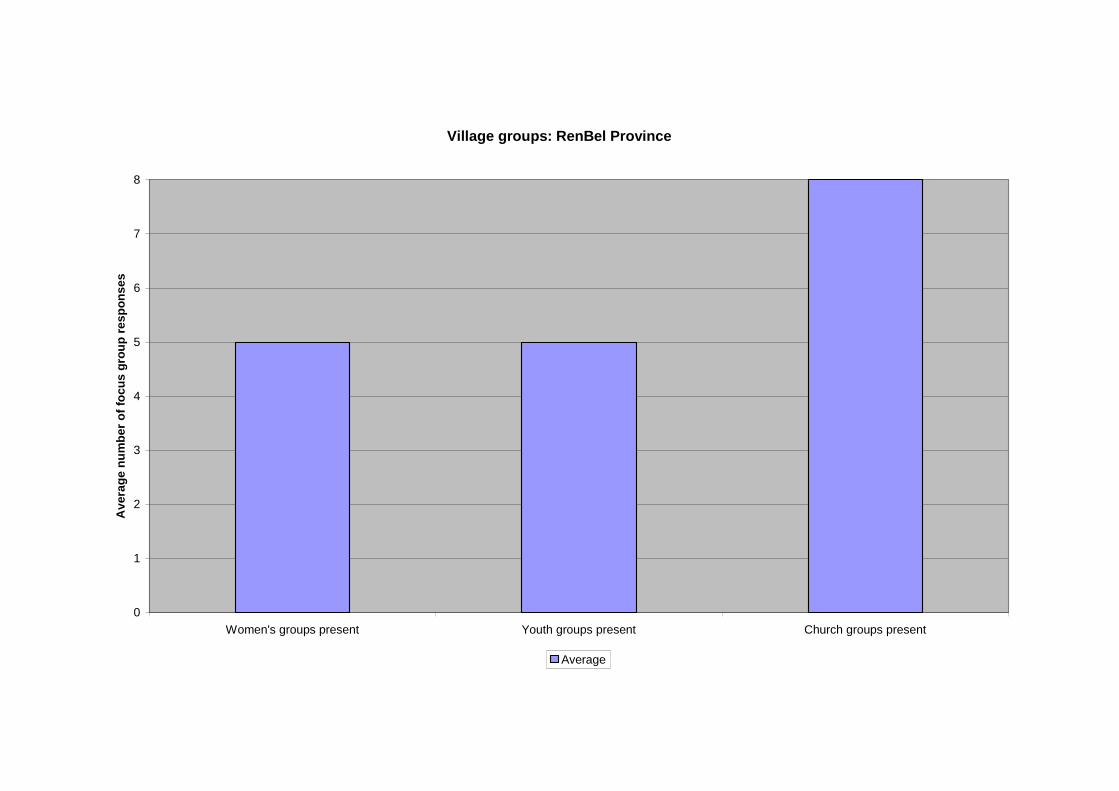
Village groups: RenBel Province
0
1
2
3
4
5
6
7
8
Women's groups present Youth groups present Church groups present
Av
era
ge
nu
mb
er
of
foc
us
gro
up
res
po
ns
es
Average
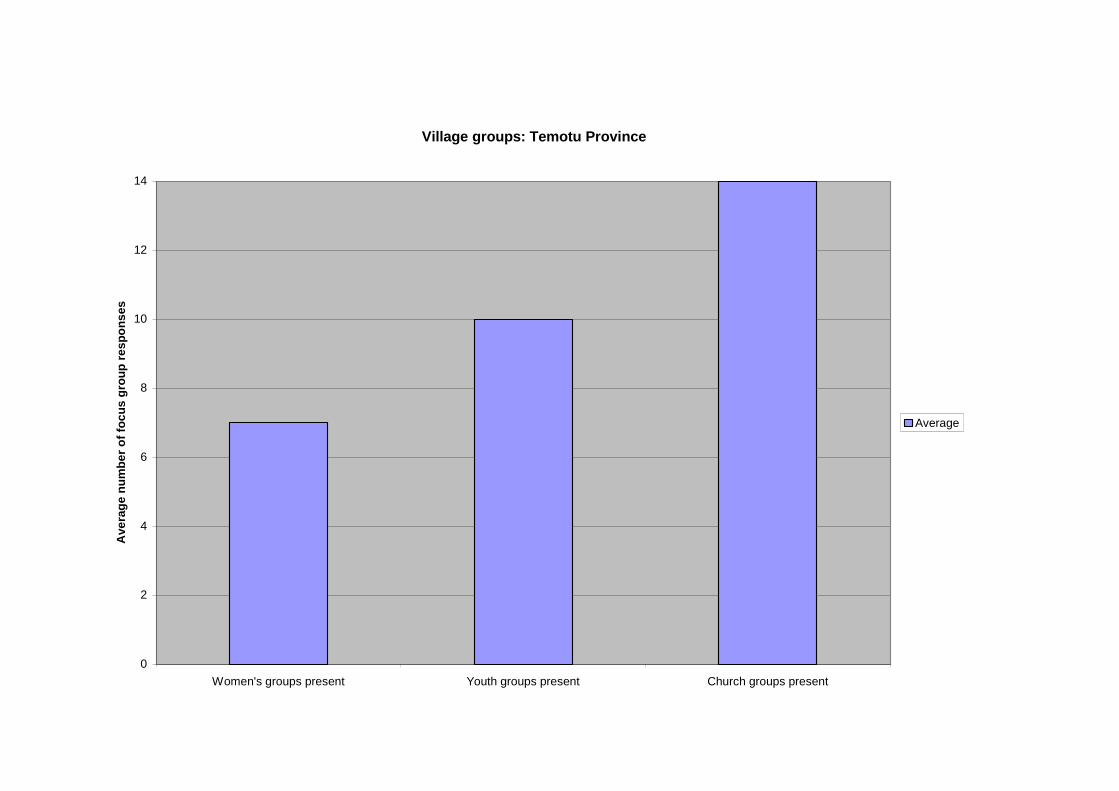
Village groups: Temotu Province
0
2
4
6
8
10
12
14
Women's groups present Youth groups present Church groups present
Ave
rag
en
um
be
ro
ffo
cu
sg
rou
pre
sp
on
ses
Average

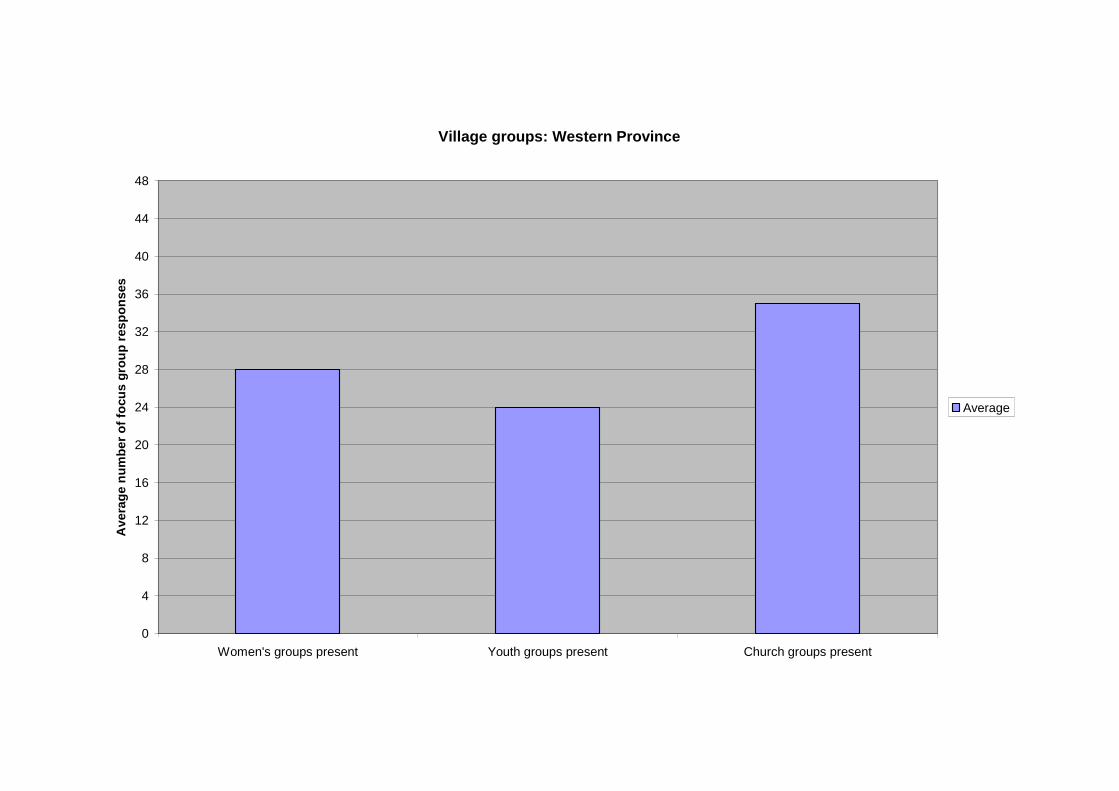
Village groups: Western Province
0
4
8
12
16
20
24
28
32
36
40
44
48
Women's groups present Youth groups present Church groups present
Av
era
ge
nu
mb
er
of
focu
sg
rou
pre
sp
on
ses
Average
Charts P14: Village committee funds
The power and influence of the churches is again evident in these charts.
Analysis:
While few villages had local credit unions, the highest being 21 percent of communities
surveyed in Temotu Province, all communities had some school committee, village
committee, church committee and youth committee funds. More than 90 percent of
communities in Choiseul had church committee funds. This was followed by 85 percent of
communities in Isabel, 79 percent in Temotu, 57 percent in Western Province and 50 percent
in RenBel Province. On Makira only one community (5 percent of communities surveyed)
reported that it had church committee funds. Makira Province reported the lowest level of
committee funding of all provinces surveyed. Tabulated responses are:
Central Province 56 percent of communities surveyed reported that they have
school and village committee funds and 50 percent stated that
they have church and youth group funds. There were no
operational village credit unions.
Choiseul Province 90 percent of communities surveyed have church group funds,
80 percent have school committee funds and 65 percent have
youth group funds. Only 60 percent have village committee
funds. 10 percent of communities (representing 2
communities surveyed) have village credit unions.
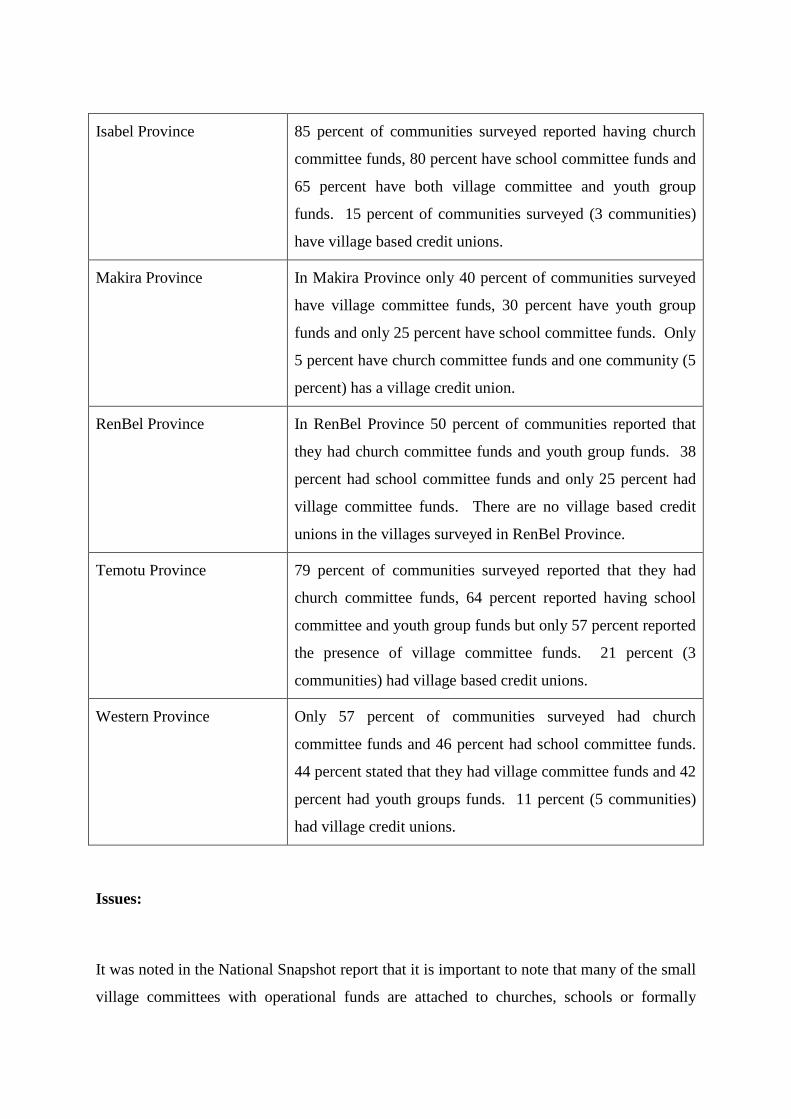
Isabel Province 85 percent of communities surveyed reported having church
committee funds, 80 percent have school committee funds and
65 percent have both village committee and youth group
funds. 15 percent of communities surveyed (3 communities)
have village based credit unions.
Makira Province In Makira Province only 40 percent of communities surveyed
have village committee funds, 30 percent have youth group
funds and only 25 percent have school committee funds. Only
5 percent have church committee funds and one community (5
percent) has a village credit union.
RenBel Province In RenBel Province 50 percent of communities reported that
they had church committee funds and youth group funds. 38
percent had school committee funds and only 25 percent had
village committee funds. There are no village based credit
unions in the villages surveyed in RenBel Province.
Temotu Province 79 percent of communities surveyed reported that they had
church committee funds, 64 percent reported having school
committee and youth group funds but only 57 percent reported
the presence of village committee funds. 21 percent (3
communities) had village based credit unions.
Western Province Only 57 percent of communities surveyed had church
committee funds and 46 percent had school committee funds.
44 percent stated that they had village committee funds and 42
percent had youth groups funds. 11 percent (5 communities)
had village credit unions.
Issues:
It was noted in the National Snapshot report that it is important to note that many of the small
village committees with operational funds are attached to churches, schools or formally

constituted village groups. These groups and their affiliations can be utilized for community
development work. The nature and extent of the groups and their funds needs further
examination. Rural communities have limited access to banking services and they are wary
of informal credit unions that may fold abruptly.
PROVINCIAL SIGNPOST: Village committee funds
There are a number of types of village groups that can be used as points of entry into the ruralcommunities by agencies such as CSP. Many have small operations funding sources butneed to be strengthened. Financial management skills are not strong among village peopleand simple accounting and reporting programs could be effective especially with women andyouth groups,
NATIONAL SIGNPOST: Village committee funds
As this chart also illustrates, villages are organized into defined structures, usually affiliatedwith the local churches. These groups are clearly gender specific, except that the definitionof youth is anyone unmarried between the ages of 14 and 29. Women and youth haveseparate committees, often with small operational accounts. With some measure of controland training, these groups and funds can be used for community development purposes. Thedevelopment of more village credit unions may be used as an indication of growing localeconomic confidence but unless financial management is strengthened the rural poor willalways be susceptible to illegal or corrupt operators
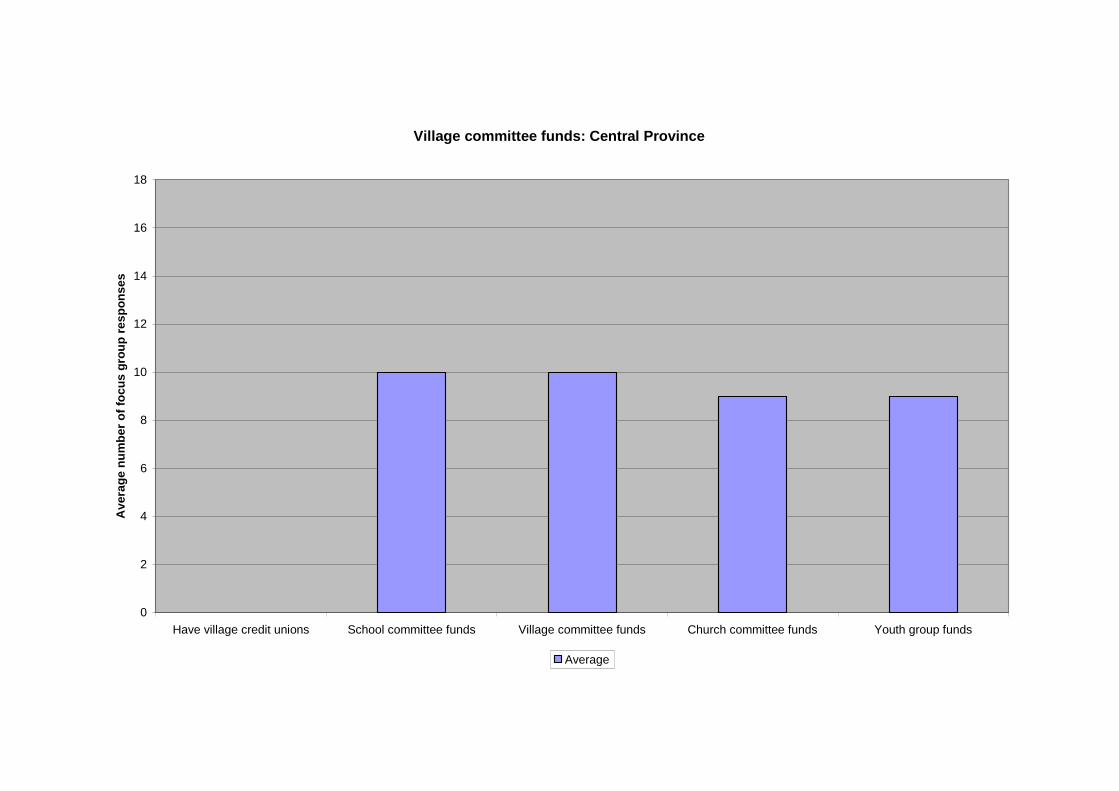
Village committee funds: Central Province
0
2
4
6
8
10
12
14
16
18
Have village credit unions School committee funds Village committee funds Church committee funds Youth group funds
Av
era
ge
nu
mb
er
of
foc
us
gro
up
res
po
ns
es
Average
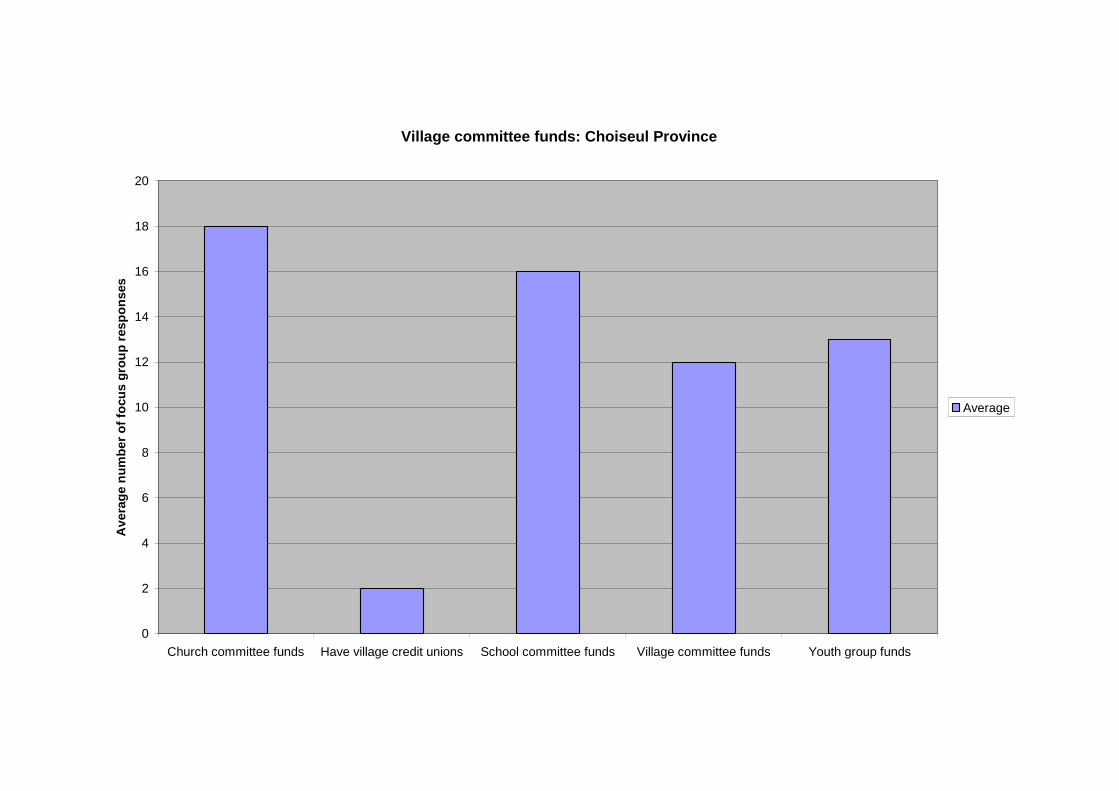
Village committee funds: Choiseul Province
0
2
4
6
8
10
12
14
16
18
20
Church committee funds Have village credit unions School committee funds Village committee funds Youth group funds
Av
era
ge
nu
mb
er
of
focu
sg
rou
pre
sp
on
ses
Average
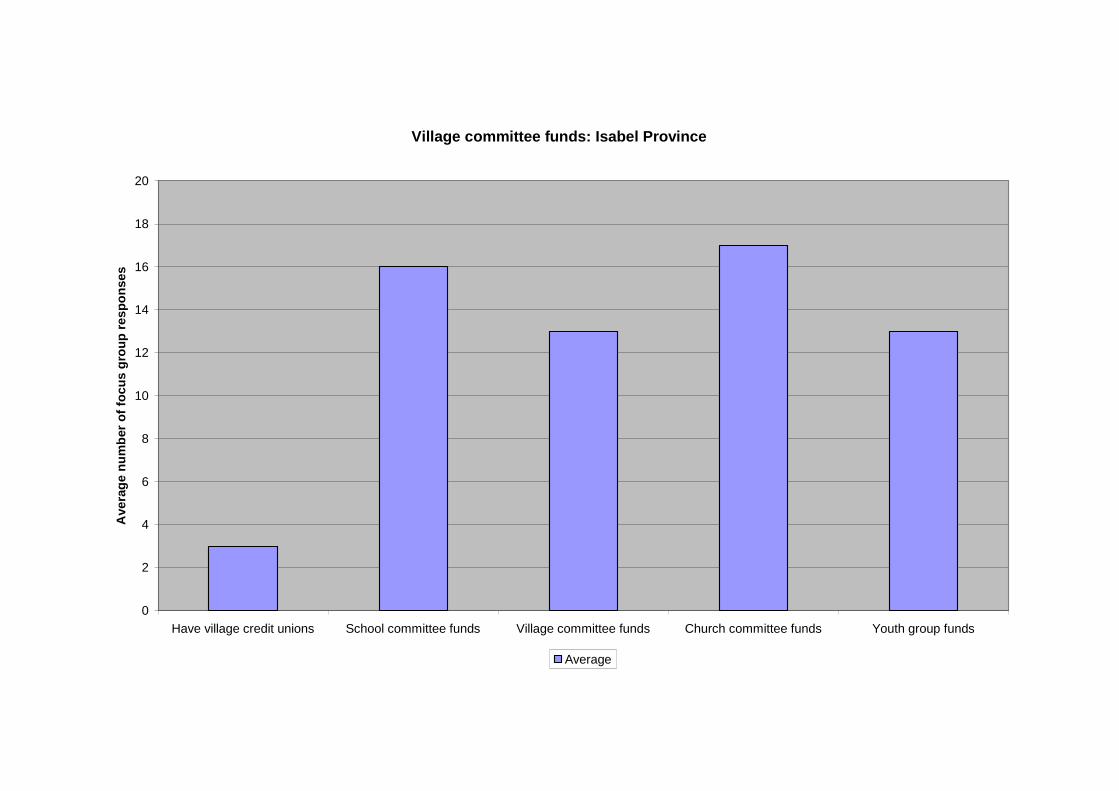
Village committee funds: Isabel Province
0
2
4
6
8
10
12
14
16
18
20
Have village credit unions School committee funds Village committee funds Church committee funds Youth group funds
Ave
rag
en
um
ber
of
foc
us
gro
up
res
po
ns
es
Average
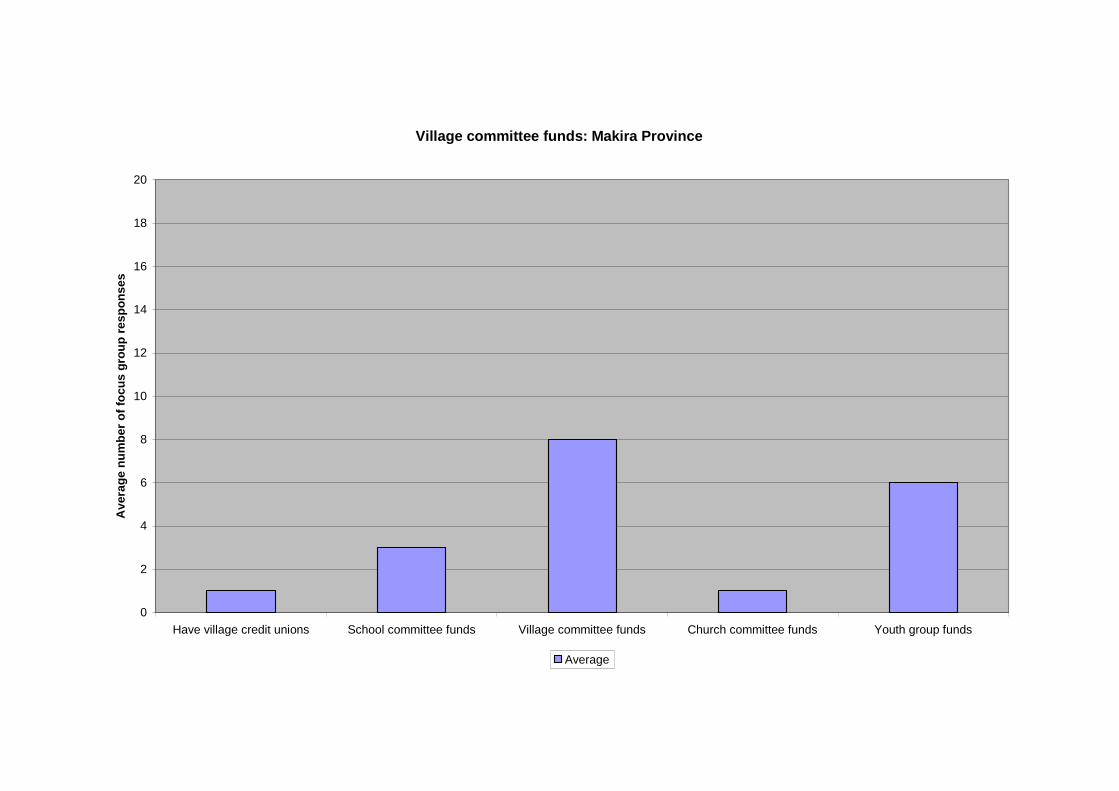
Village committee funds: Makira Province
0
2
4
6
8
10
12
14
16
18
20
Have village credit unions School committee funds Village committee funds Church committee funds Youth group funds
Av
era
ge
nu
mb
er
of
foc
us
gro
up
res
po
ns
es
Average
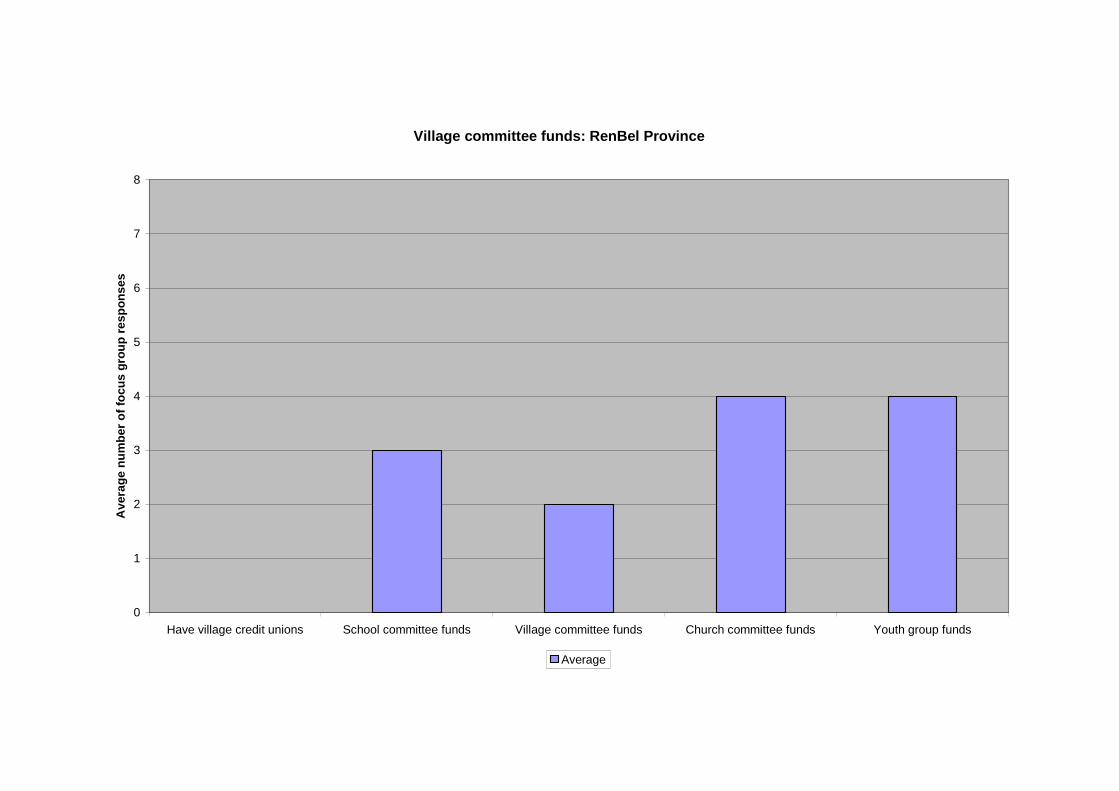
Village committee funds: RenBel Province
0
1
2
3
4
5
6
7
8
Have village credit unions School committee funds Village committee funds Church committee funds Youth group funds
Av
era
ge
nu
mb
er
of
foc
us
gro
up
res
po
ns
es
Average
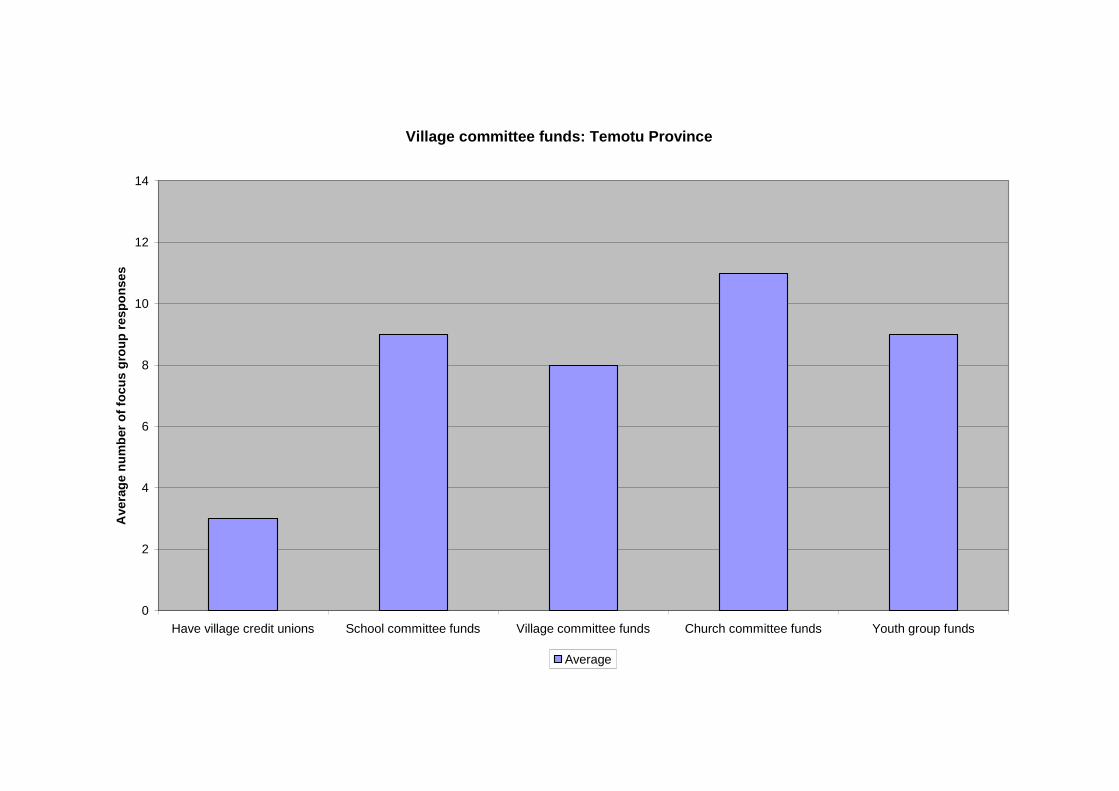
Village committee funds: Temotu Province
0
2
4
6
8
10
12
14
Have village credit unions School committee funds Village committee funds Church committee funds Youth group funds
Ave
rag
en
um
ber
of
foc
us
gro
up
res
po
ns
es
Average
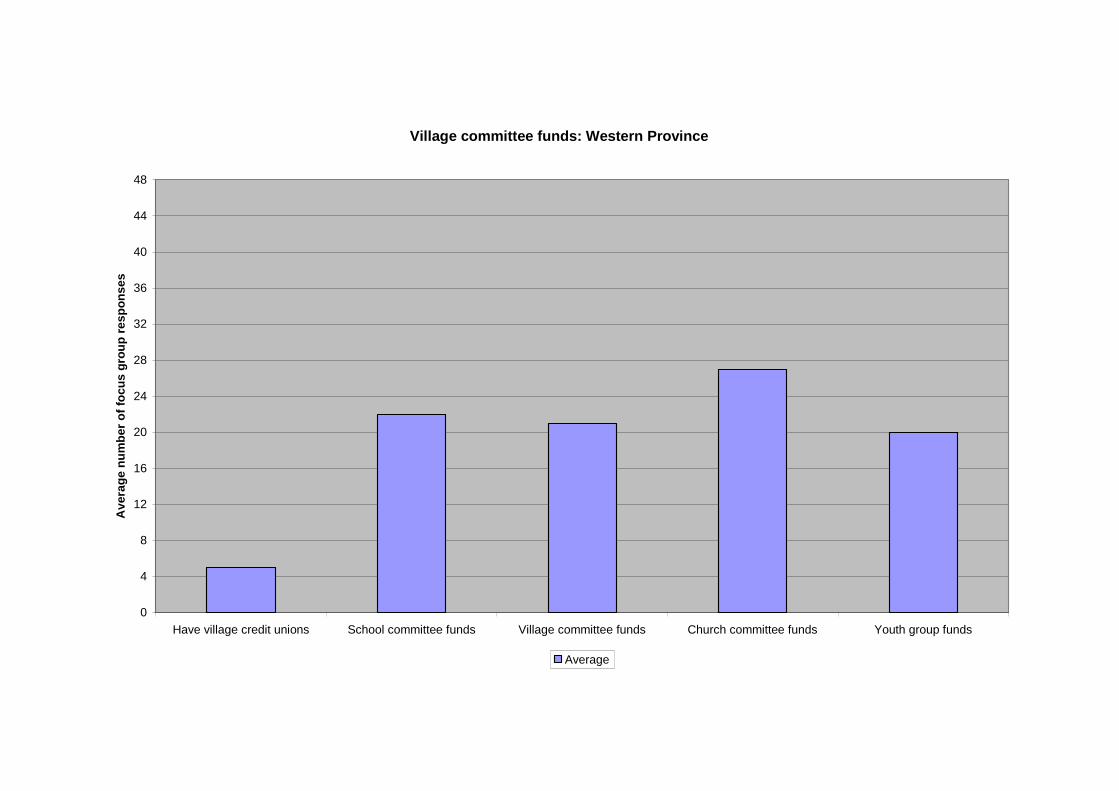
Village committee funds: Western Province
0
4
8
12
16
20
24
28
32
36
40
44
48
Have village credit unions School committee funds Village committee funds Church committee funds Youth group funds
Av
era
ge
nu
mb
er
of
foc
us
gro
up
res
po
ns
es
Average
Charts P15: Village communication services
The range of communication channels for village people to connect with local, national and
international news and current events is extremely limited.
Analysis:
More than 90 percent of communities surveyed reported that the only means for
communication with outside the area is via transistor radios. These can pick up national radio
stations but there is no communication between the village and major centres of assistance in
times of emergency such as during the recent tsumani in Western Province. Only in Choiseul
Province are more than 50 percent of communities connected with 2 way radio. There are
limited postal and newspaper services and generally not more than 10 percent of communities
have access to PFNet. PFNet (Pipol Fastaem) is a rural networking project that has
established a rural communications systems and email networking using the HF (High
Frequency) band. It has been funded by a number of international donors, notably UNDP,
the Government of Japan, New Zealand Aid and AusAID. There are currently about 24
PFNet stations across the country: two are privately owned. More stations are pending.
The tabulated responses are:
Central Province All communities surveyed in Central Province have transistor
radios and 28 percent have two way radios but no community
surveyed had a PFNet centre or could access postal services,
receive newspapers or had television.
Choiseul Province All communities surveyed in Choiseul had transistor radios,
and 65 percent had access to two way radios. 10 percent (2
communities) have access to PFNet and one community (5
percent of those surveyed) has television and 10 percent have
access to postal services.
Isabel Province 90 percent of communities have transistor radios and 35
percent have access to two way radio. 15 percent have access
to newspapers and one (5 percent of those surveyed) has
access to a PFNet centre.
Makira Province All communities in Makira have transistor radios and 45
percent have access to two way radio. Only one community
(representing 5 percent of those surveyed) has access to a
PFNet centre.
RenBel Province All communities have transistor radios. 25 percent have
access to two way radio and 13 percent (one community) has
access to a PFNet centre.
Temotu Province 93 percent of communities have transistor radios. 36 percent
can access a two way radio and 7 percent (one community)
can access postal service, receive newspapers and a PFNet
centre.
Western Province 90 percent of communities have transistor radios. 44 percent
can access a two way radio and 11 percent can receive
newspapers. 2 communities (4 percent of those surveyed)
have televisions, 2 percent can access postal services and 2
percent (1 community surveyed) has PFNet.
Issues:
Access to village communication services remains poor. Private transistor radios are used to
receive news, information and service messages. They also provide entertainment and music.
Official communication, via the police, health clinic or local school, is provided through the
Two-way radio system. The PFNet is another communication system that needs to be
expanded.
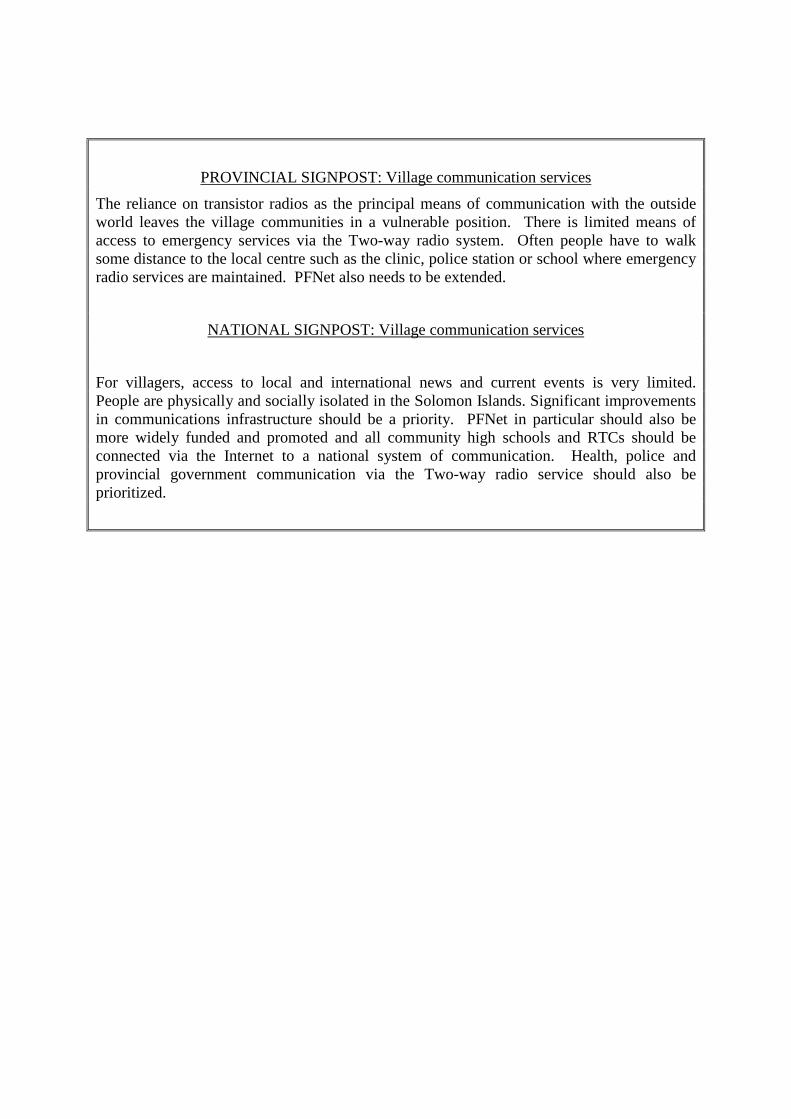
PROVINCIAL SIGNPOST: Village communication services
The reliance on transistor radios as the principal means of communication with the outsideworld leaves the village communities in a vulnerable position. There is limited means ofaccess to emergency services via the Two-way radio system. Often people have to walksome distance to the local centre such as the clinic, police station or school where emergencyradio services are maintained. PFNet also needs to be extended.
NATIONAL SIGNPOST: Village communication services
For villagers, access to local and international news and current events is very limited.People are physically and socially isolated in the Solomon Islands. Significant improvementsin communications infrastructure should be a priority. PFNet in particular should also bemore widely funded and promoted and all community high schools and RTCs should beconnected via the Internet to a national system of communication. Health, police andprovincial government communication via the Two-way radio service should also beprioritized.
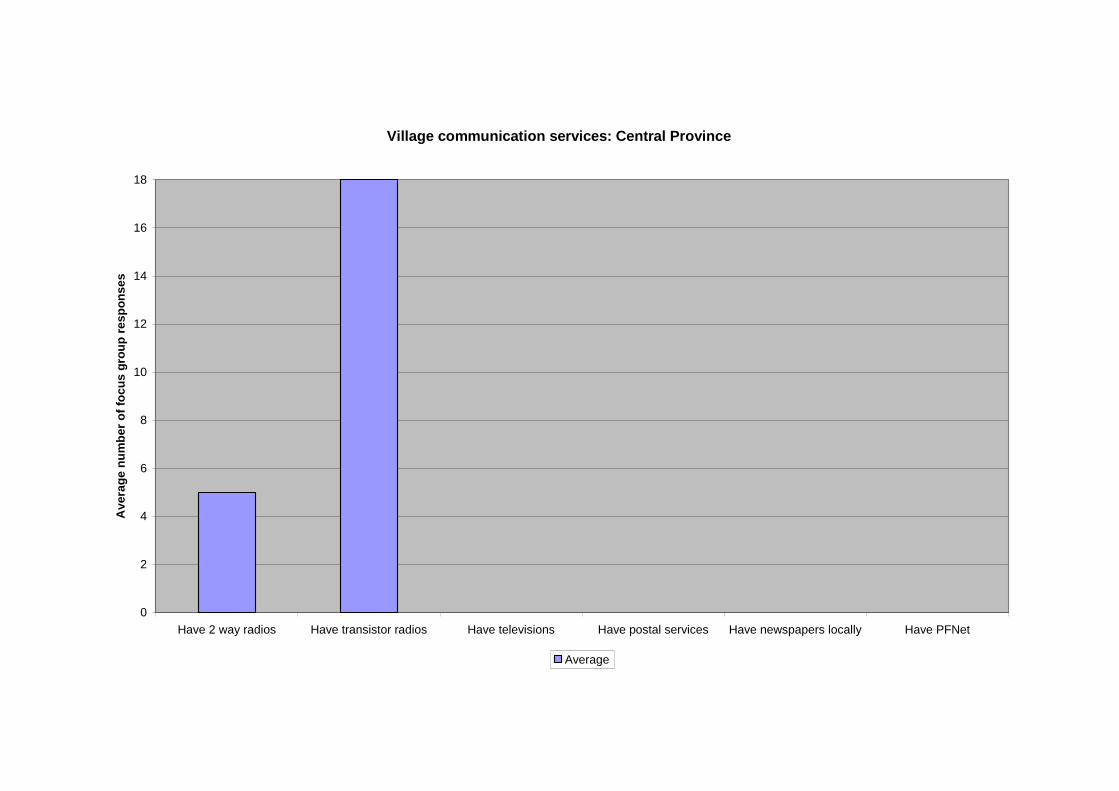
Village communication services: Central Province
0
2
4
6
8
10
12
14
16
18
Have 2 way radios Have transistor radios Have televisions Have postal services Have newspapers locally Have PFNet
Av
era
ge
nu
mb
er
of
foc
us
gro
up
res
po
ns
es
Average
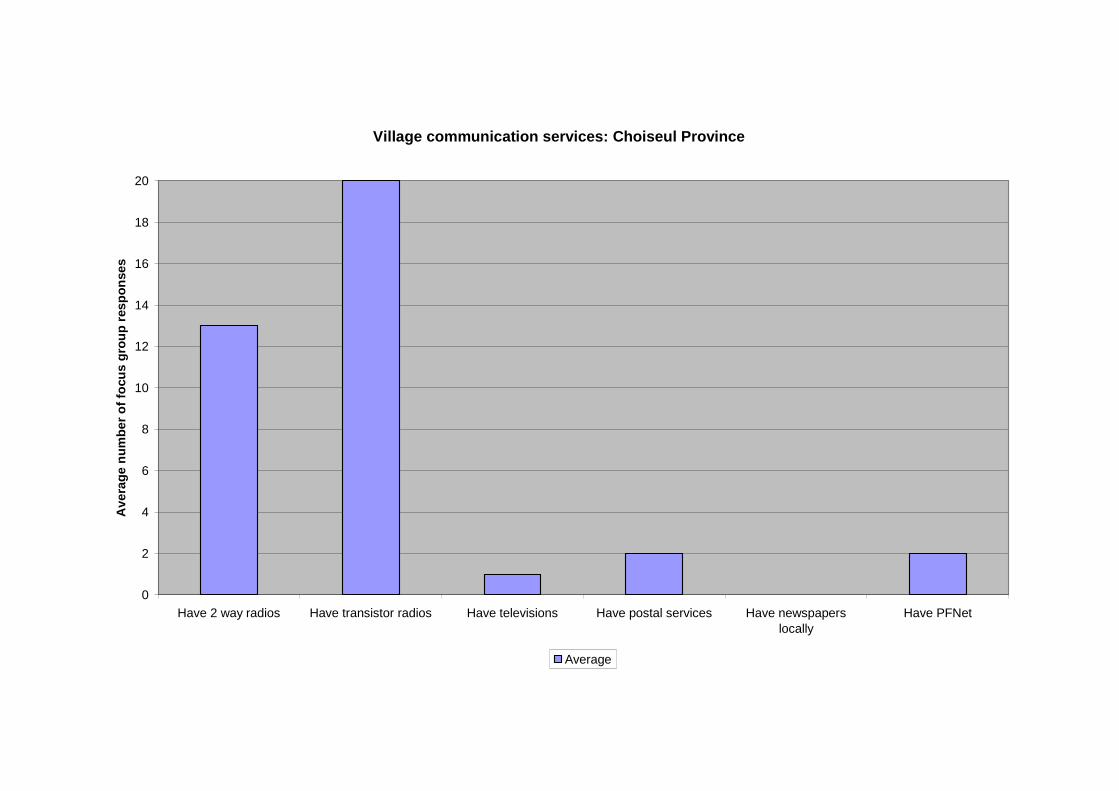
Village communication services: Choiseul Province
0
2
4
6
8
10
12
14
16
18
20
Have 2 way radios Have transistor radios Have televisions Have postal services Have newspaperslocally
Have PFNet
Av
era
ge
nu
mb
er
of
focu
sg
rou
pre
sp
on
se
s
Average
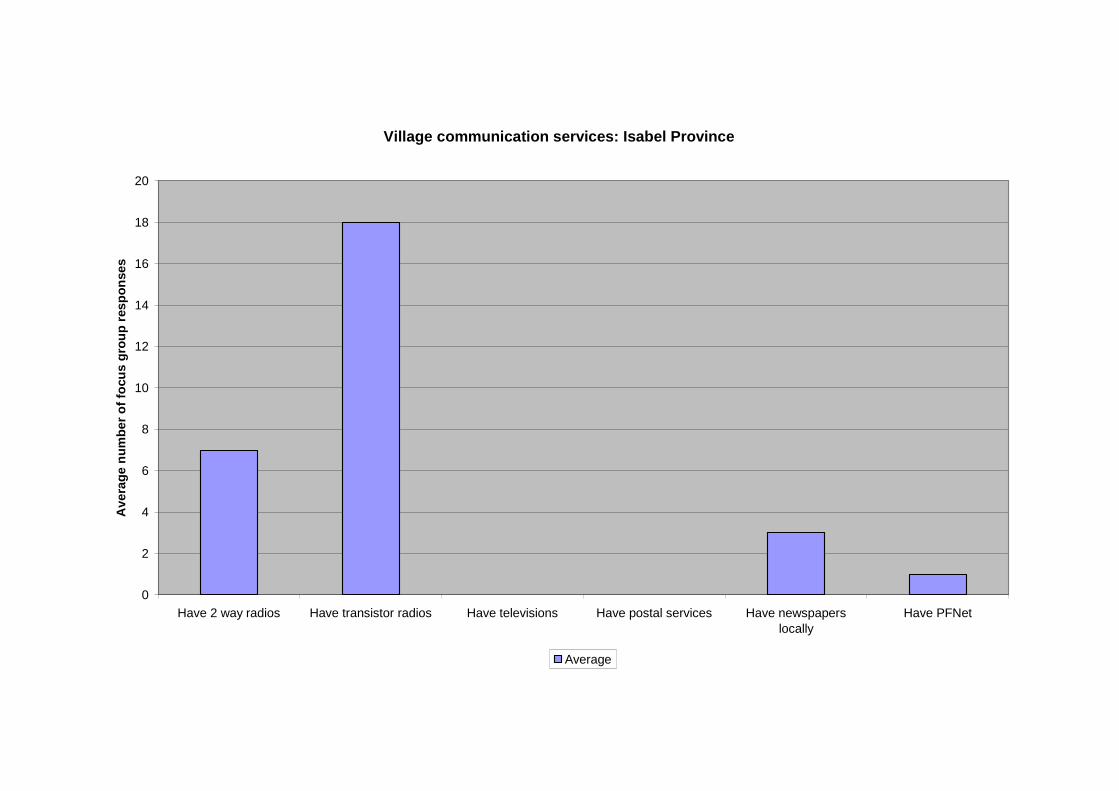
Village communication services: Isabel Province
0
2
4
6
8
10
12
14
16
18
20
Have 2 way radios Have transistor radios Have televisions Have postal services Have newspaperslocally
Have PFNet
Av
era
ge
nu
mb
er
of
focu
sg
rou
pre
sp
on
se
s
Average
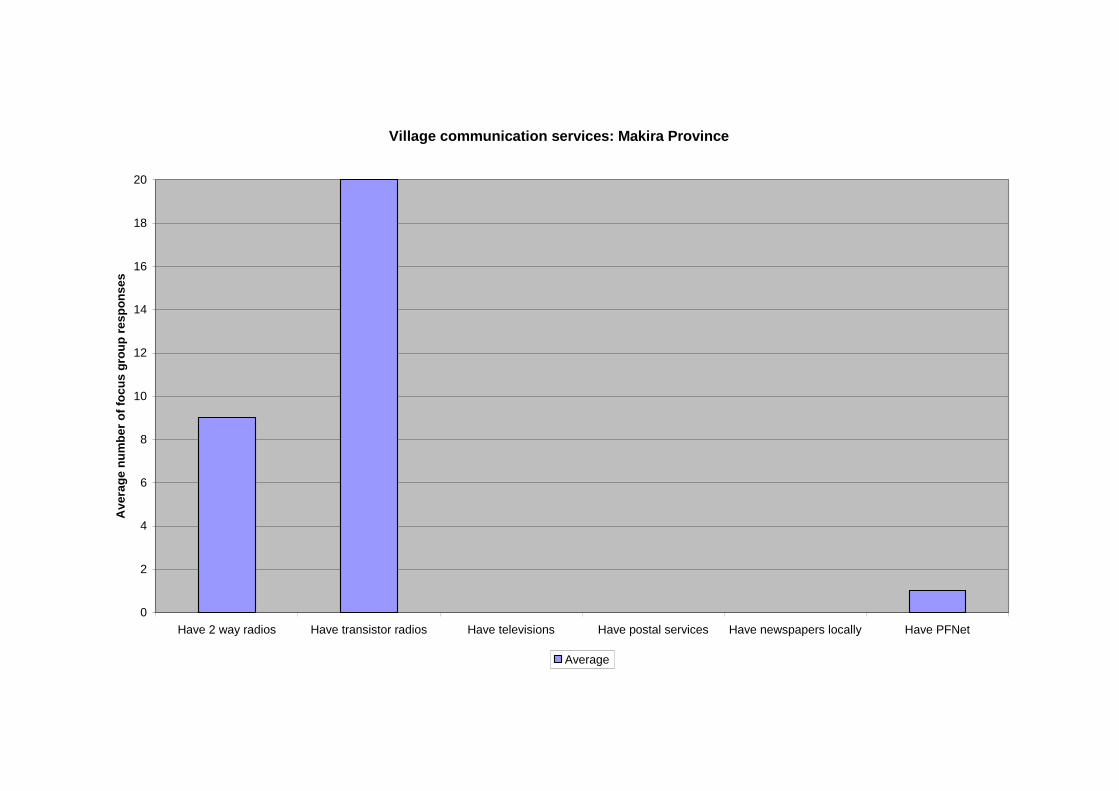
Village communication services: Makira Province
0
2
4
6
8
10
12
14
16
18
20
Have 2 way radios Have transistor radios Have televisions Have postal services Have newspapers locally Have PFNet
Av
era
ge
nu
mb
er
of
foc
us
gro
up
res
po
ns
es
Average
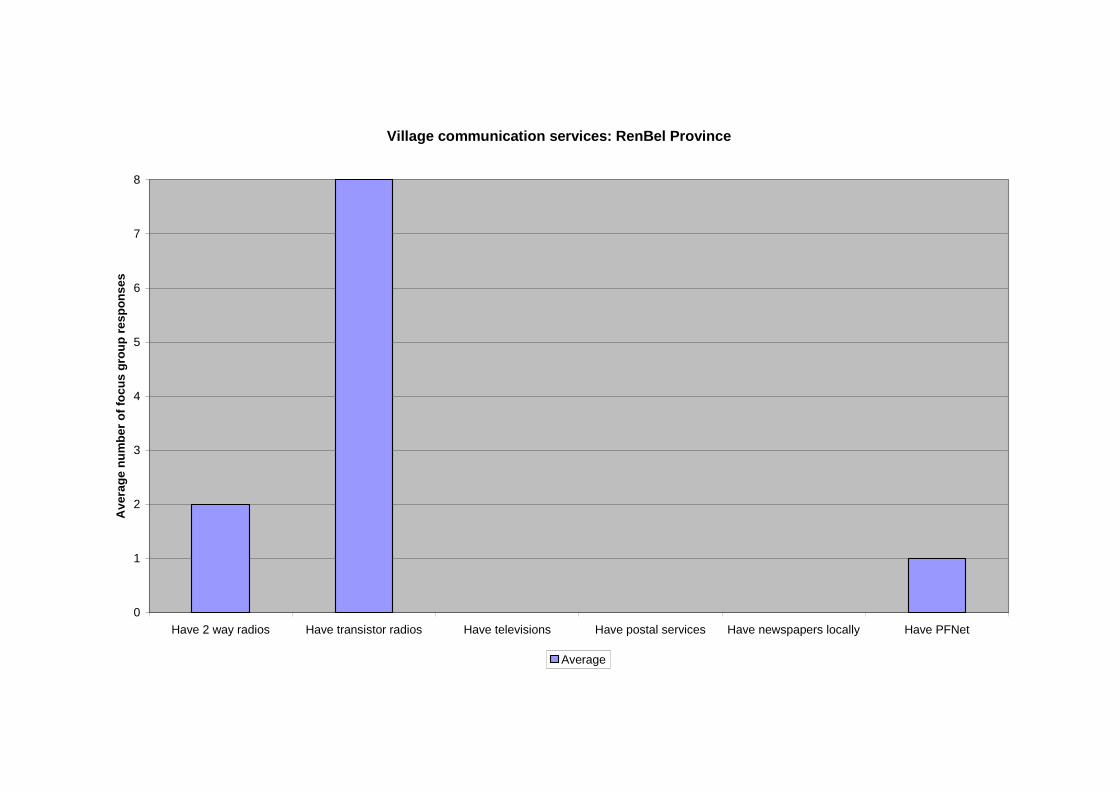
Village communication services: RenBel Province
0
1
2
3
4
5
6
7
8
Have 2 way radios Have transistor radios Have televisions Have postal services Have newspapers locally Have PFNet
Av
era
ge
nu
mb
er
of
foc
us
gro
up
res
po
ns
es
Average
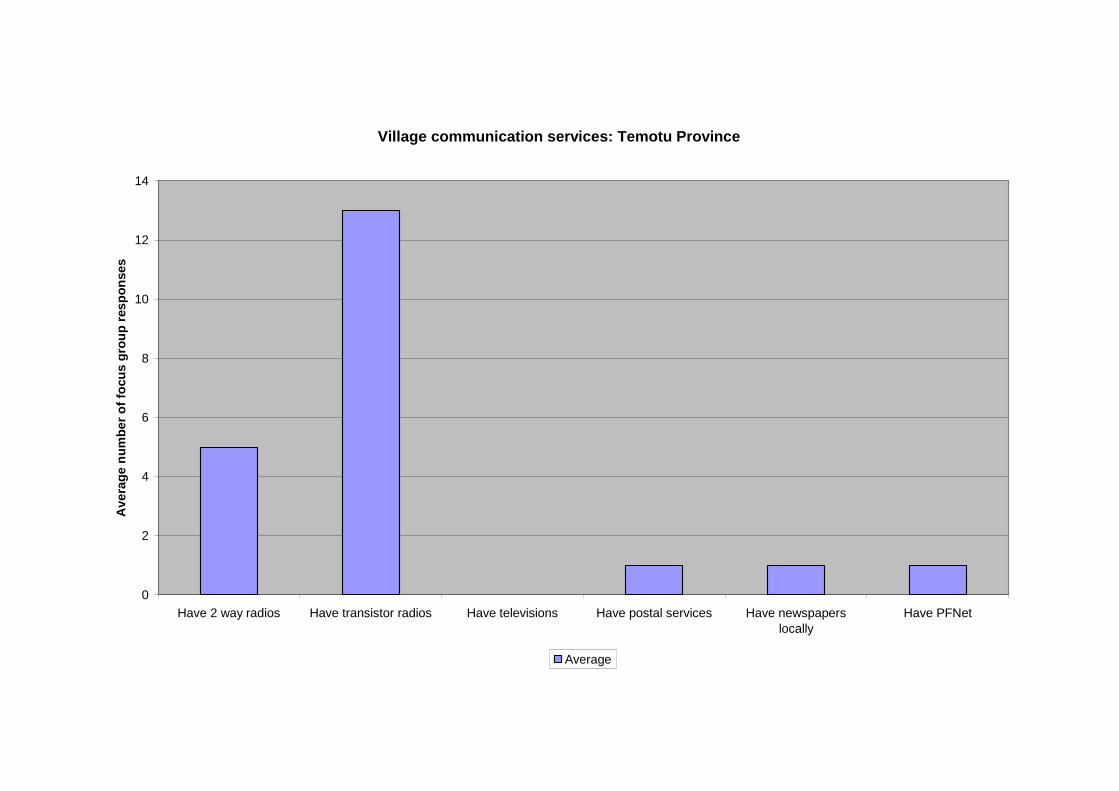
Village communication services: Temotu Province
0
2
4
6
8
10
12
14
Have 2 way radios Have transistor radios Have televisions Have postal services Have newspaperslocally
Have PFNet
Av
era
ge
nu
mb
er
of
focu
sg
rou
pre
sp
on
se
s
Average
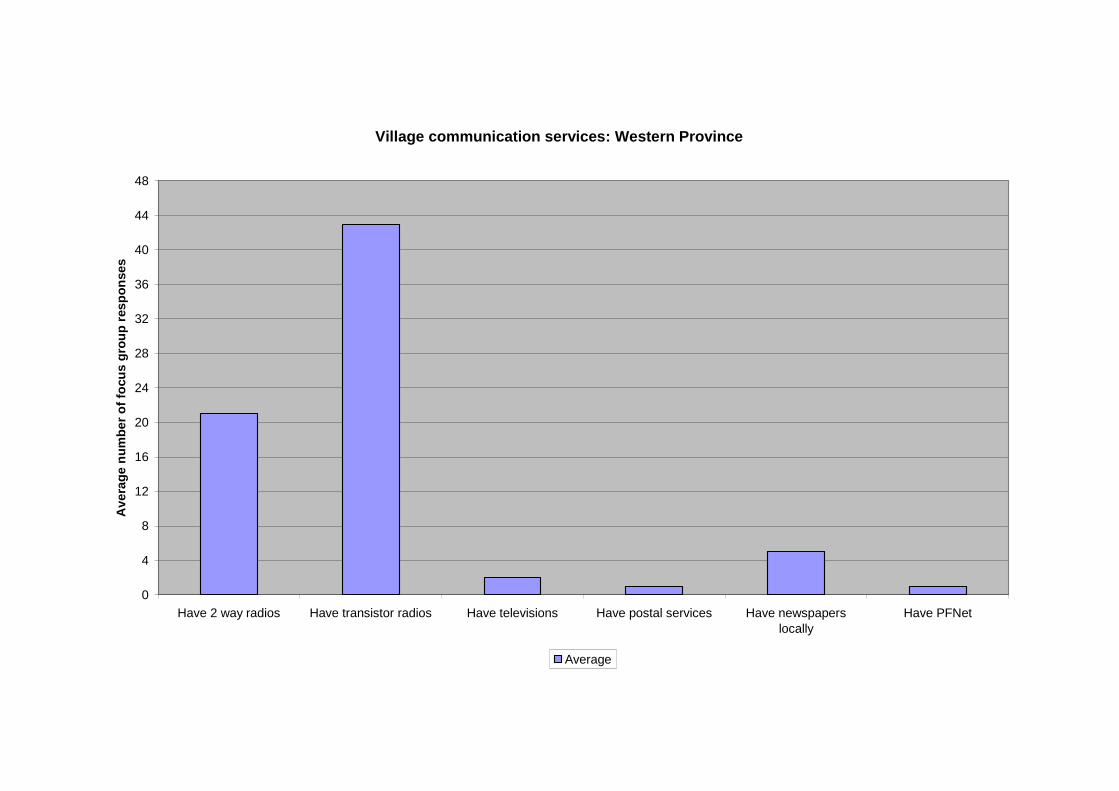
Village communication services: Western Province
0
4
8
12
16
20
24
28
32
36
40
44
48
Have 2 way radios Have transistor radios Have televisions Have postal services Have newspaperslocally
Have PFNet
Av
era
ge
nu
mb
er
of
focu
sg
rou
pre
sp
on
se
s
Average
Chart P16: Functioning and Non-functioning Infrastructure
As noted in the National Snapshot report, focus groups were asked six questions on
functioning and non-functioning infrastructure in villages and communities. The responses
are in addition to the data collected by survey teams who also were instructed to note the
number of permanent, semi-permanent and local material dwellings in each village along
with the number of church buildings, schools, health services, copra driers and cocoa
fermentaries.
Analysis:
Educational infrastructure: Rural communities in the outer provinces had limited access to
kindergardens: the highest was in Makira Province where 60 percent of communities
surveyed reported access to kindergardens, the lowest was in Central Province where only 22
percent of communities surveyed reported being able to access kindergardens. The
percentage of non-functioning kindergardens was low; this is also reflected in the national
data. While in Choiseul Province 15 percent of communities surveyed reported that their
kindergardens were not functioning but in RenBel and Temotu Province all kindergardens
were working.
Access to primary schools for people in rural communities also varied. 65 percent of
communities surveyed in Choiseul Province, 64 percent in Temotu and 60 percent in Makira
Province reported access to functioning primary schools. However, in Isabel Province only
40 percent of communities surveyed and in Western Province only 38 percent of
communities had access to a functioning primary school. In Central Province 7 percent of
primary schools in surveyed communities were also not functioning.
Access to community high schools is poor. The highest figure from surveyed communities
was in Central Province where only 22 percent of communities had access to a functioning
community high school; the lowest figures were from Temotu Province were only 7 percent
of communities reported being able to access a functioning community high school. In
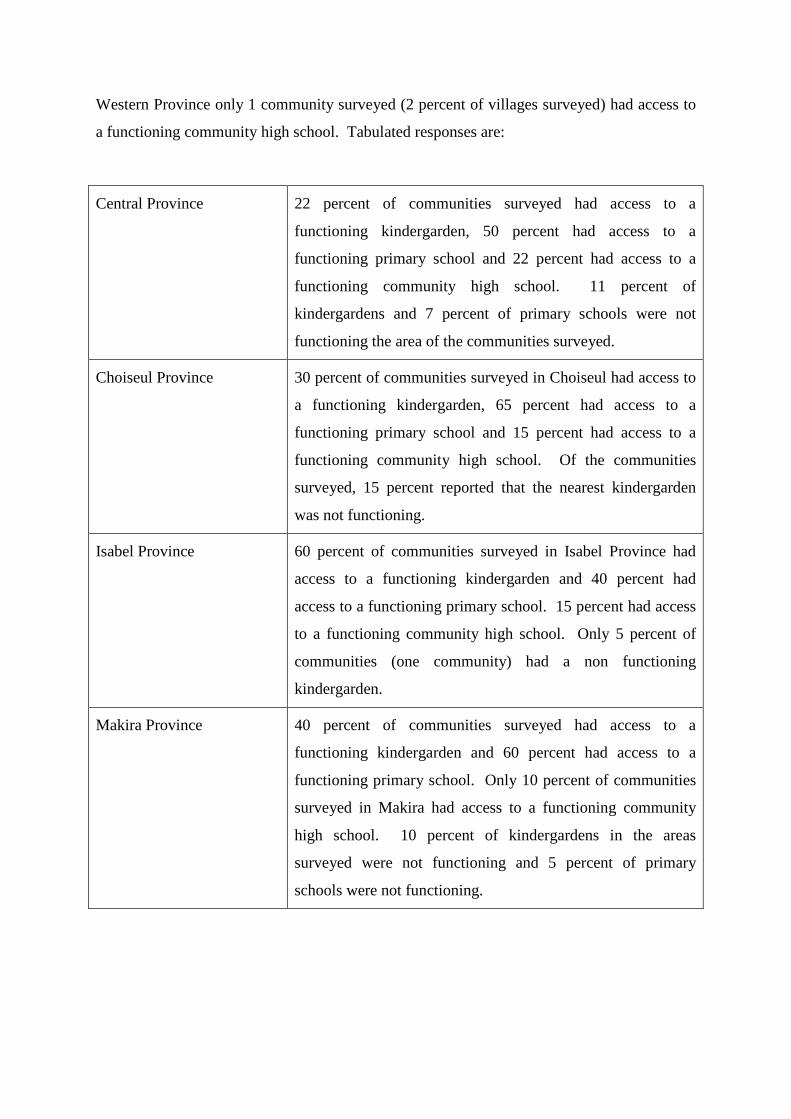
Western Province only 1 community surveyed (2 percent of villages surveyed) had access to
a functioning community high school. Tabulated responses are:
Central Province 22 percent of communities surveyed had access to a
functioning kindergarden, 50 percent had access to a
functioning primary school and 22 percent had access to a
functioning community high school. 11 percent of
kindergardens and 7 percent of primary schools were not
functioning the area of the communities surveyed.
Choiseul Province 30 percent of communities surveyed in Choiseul had access to
a functioning kindergarden, 65 percent had access to a
functioning primary school and 15 percent had access to a
functioning community high school. Of the communities
surveyed, 15 percent reported that the nearest kindergarden
was not functioning.
Isabel Province 60 percent of communities surveyed in Isabel Province had
access to a functioning kindergarden and 40 percent had
access to a functioning primary school. 15 percent had access
to a functioning community high school. Only 5 percent of
communities (one community) had a non functioning
kindergarden.
Makira Province 40 percent of communities surveyed had access to a
functioning kindergarden and 60 percent had access to a
functioning primary school. Only 10 percent of communities
surveyed in Makira had access to a functioning community
high school. 10 percent of kindergardens in the areas
surveyed were not functioning and 5 percent of primary
schools were not functioning.
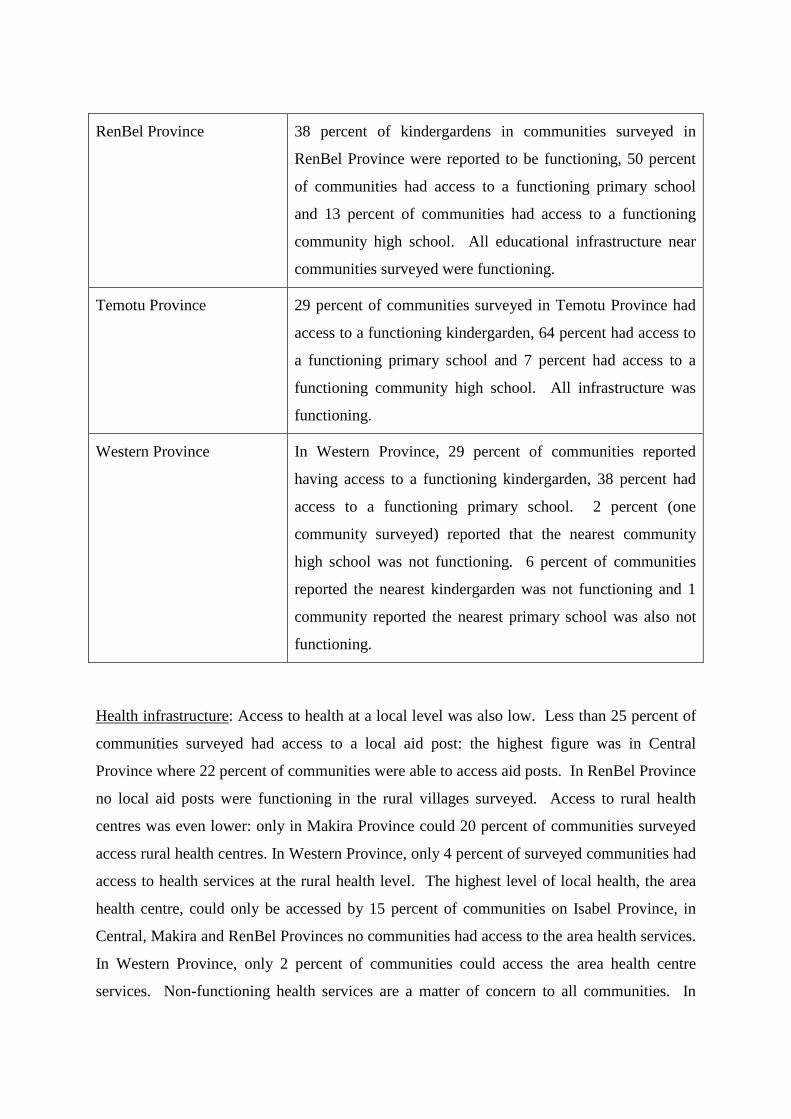
RenBel Province 38 percent of kindergardens in communities surveyed in
RenBel Province were reported to be functioning, 50 percent
of communities had access to a functioning primary school
and 13 percent of communities had access to a functioning
community high school. All educational infrastructure near
communities surveyed were functioning.
Temotu Province 29 percent of communities surveyed in Temotu Province had
access to a functioning kindergarden, 64 percent had access to
a functioning primary school and 7 percent had access to a
functioning community high school. All infrastructure was
functioning.
Western Province In Western Province, 29 percent of communities reported
having access to a functioning kindergarden, 38 percent had
access to a functioning primary school. 2 percent (one
community surveyed) reported that the nearest community
high school was not functioning. 6 percent of communities
reported the nearest kindergarden was not functioning and 1
community reported the nearest primary school was also not
functioning.
Health infrastructure: Access to health at a local level was also low. Less than 25 percent of
communities surveyed had access to a local aid post: the highest figure was in Central
Province where 22 percent of communities were able to access aid posts. In RenBel Province
no local aid posts were functioning in the rural villages surveyed. Access to rural health
centres was even lower: only in Makira Province could 20 percent of communities surveyed
access rural health centres. In Western Province, only 4 percent of surveyed communities had
access to health services at the rural health level. The highest level of local health, the area
health centre, could only be accessed by 15 percent of communities on Isabel Province, in
Central, Makira and RenBel Provinces no communities had access to the area health services.
In Western Province, only 2 percent of communities could access the area health centre
services. Non-functioning health services are a matter of concern to all communities. In
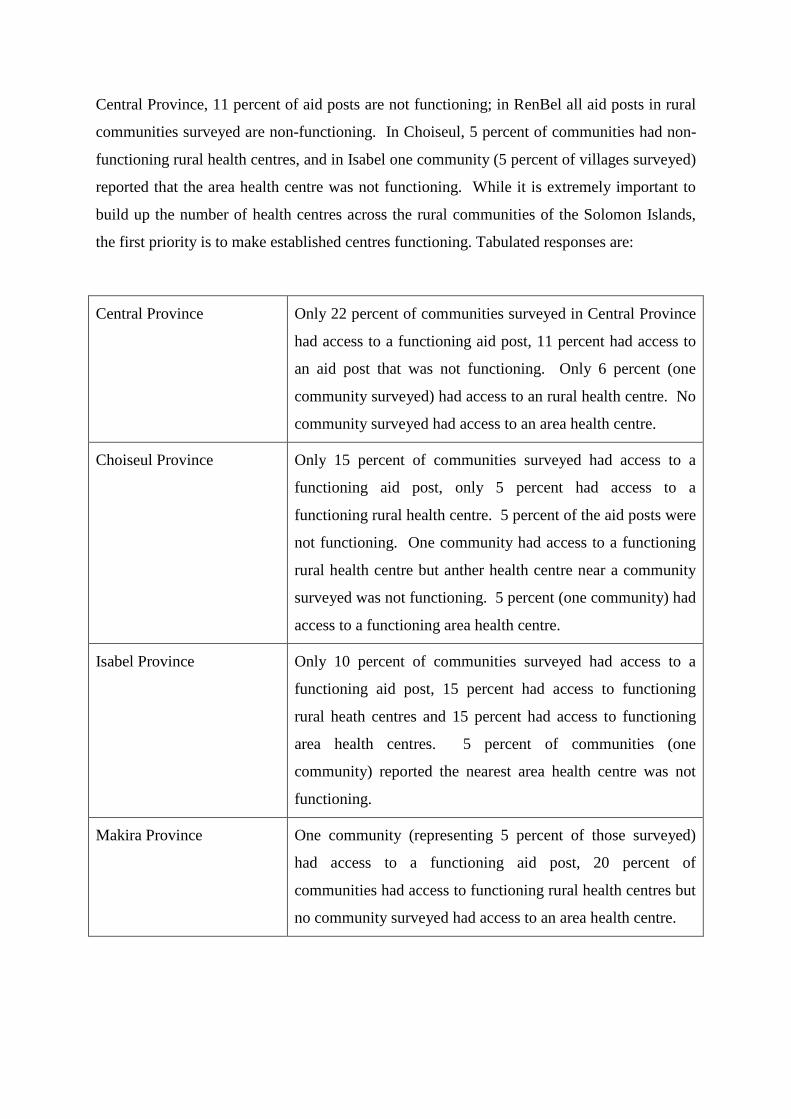
Central Province, 11 percent of aid posts are not functioning; in RenBel all aid posts in rural
communities surveyed are non-functioning. In Choiseul, 5 percent of communities had non-
functioning rural health centres, and in Isabel one community (5 percent of villages surveyed)
reported that the area health centre was not functioning. While it is extremely important to
build up the number of health centres across the rural communities of the Solomon Islands,
the first priority is to make established centres functioning. Tabulated responses are:
Central Province Only 22 percent of communities surveyed in Central Province
had access to a functioning aid post, 11 percent had access to
an aid post that was not functioning. Only 6 percent (one
community surveyed) had access to an rural health centre. No
community surveyed had access to an area health centre.
Choiseul Province Only 15 percent of communities surveyed had access to a
functioning aid post, only 5 percent had access to a
functioning rural health centre. 5 percent of the aid posts were
not functioning. One community had access to a functioning
rural health centre but anther health centre near a community
surveyed was not functioning. 5 percent (one community) had
access to a functioning area health centre.
Isabel Province Only 10 percent of communities surveyed had access to a
functioning aid post, 15 percent had access to functioning
rural heath centres and 15 percent had access to functioning
area health centres. 5 percent of communities (one
community) reported the nearest area health centre was not
functioning.
Makira Province One community (representing 5 percent of those surveyed)
had access to a functioning aid post, 20 percent of
communities had access to functioning rural health centres but
no community surveyed had access to an area health centre.
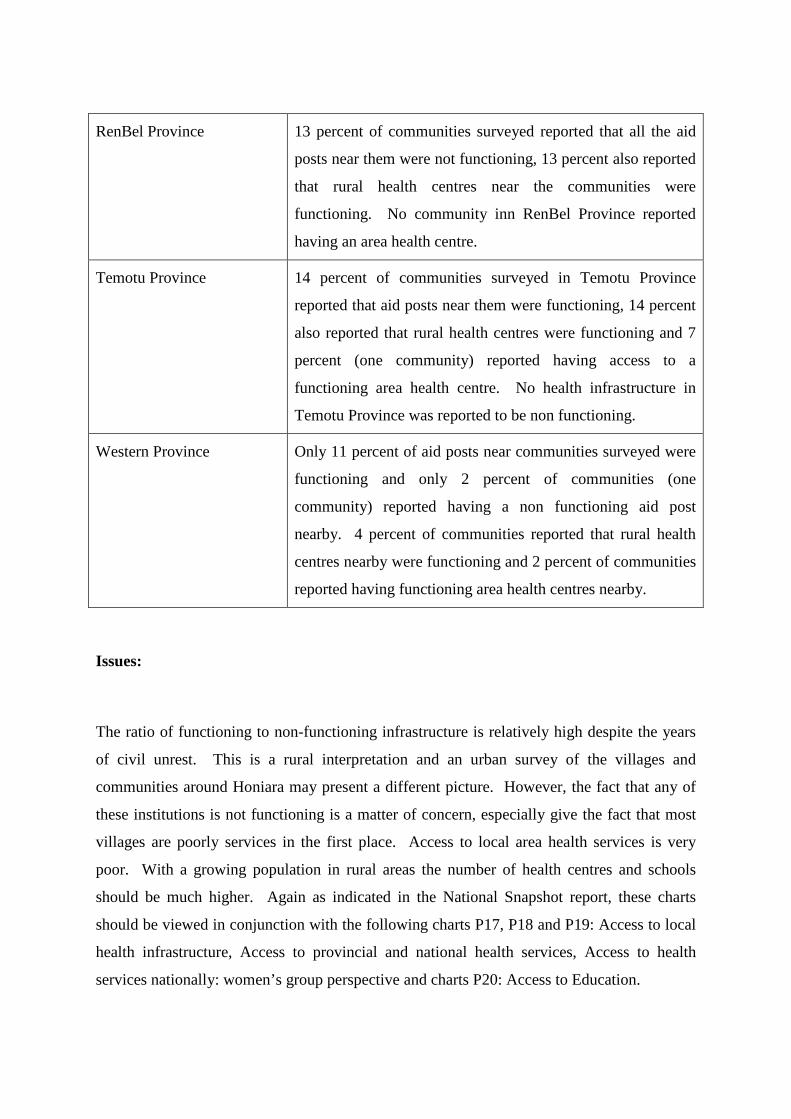
RenBel Province 13 percent of communities surveyed reported that all the aid
posts near them were not functioning, 13 percent also reported
that rural health centres near the communities were
functioning. No community inn RenBel Province reported
having an area health centre.
Temotu Province 14 percent of communities surveyed in Temotu Province
reported that aid posts near them were functioning, 14 percent
also reported that rural health centres were functioning and 7
percent (one community) reported having access to a
functioning area health centre. No health infrastructure in
Temotu Province was reported to be non functioning.
Western Province Only 11 percent of aid posts near communities surveyed were
functioning and only 2 percent of communities (one
community) reported having a non functioning aid post
nearby. 4 percent of communities reported that rural health
centres nearby were functioning and 2 percent of communities
reported having functioning area health centres nearby.
Issues:
The ratio of functioning to non-functioning infrastructure is relatively high despite the years
of civil unrest. This is a rural interpretation and an urban survey of the villages and
communities around Honiara may present a different picture. However, the fact that any of
these institutions is not functioning is a matter of concern, especially give the fact that most
villages are poorly services in the first place. Access to local area health services is very
poor. With a growing population in rural areas the number of health centres and schools
should be much higher. Again as indicated in the National Snapshot report, these charts
should be viewed in conjunction with the following charts P17, P18 and P19: Access to local
health infrastructure, Access to provincial and national health services, Access to health
services nationally: women’s group perspective and charts P20: Access to Education.
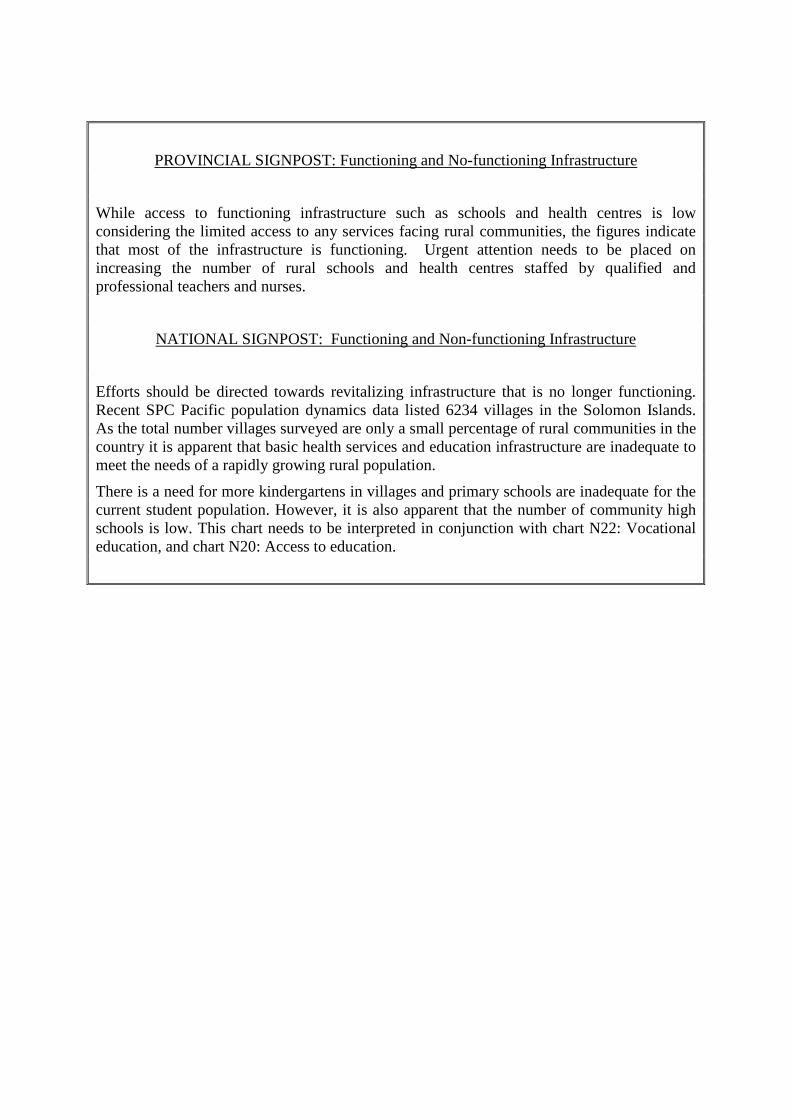
PROVINCIAL SIGNPOST: Functioning and No-functioning Infrastructure
While access to functioning infrastructure such as schools and health centres is lowconsidering the limited access to any services facing rural communities, the figures indicatethat most of the infrastructure is functioning. Urgent attention needs to be placed onincreasing the number of rural schools and health centres staffed by qualified andprofessional teachers and nurses.
NATIONAL SIGNPOST: Functioning and Non-functioning Infrastructure
Efforts should be directed towards revitalizing infrastructure that is no longer functioning.Recent SPC Pacific population dynamics data listed 6234 villages in the Solomon Islands.As the total number villages surveyed are only a small percentage of rural communities in thecountry it is apparent that basic health services and education infrastructure are inadequate tomeet the needs of a rapidly growing rural population.
There is a need for more kindergartens in villages and primary schools are inadequate for thecurrent student population. However, it is also apparent that the number of community highschools is low. This chart needs to be interpreted in conjunction with chart N22: Vocationaleducation, and chart N20: Access to education.
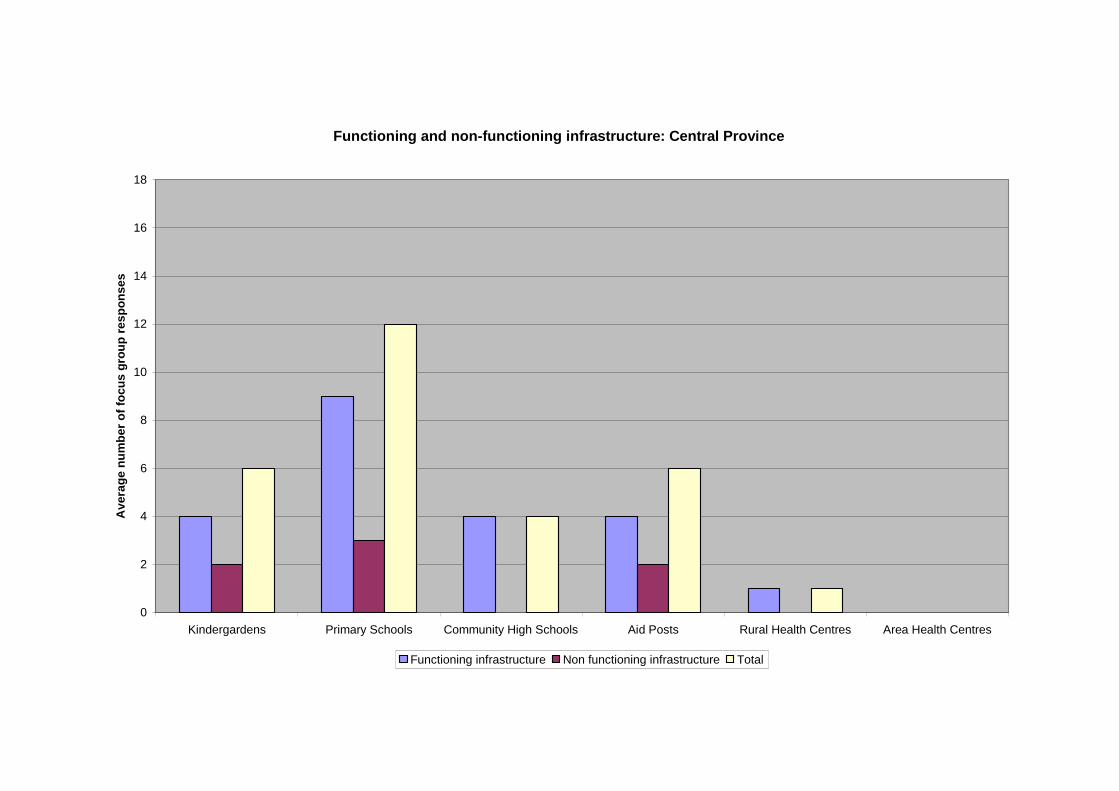
Functioning and non-functioning infrastructure: Central Province
0
2
4
6
8
10
12
14
16
18
Kindergardens Primary Schools Community High Schools Aid Posts Rural Health Centres Area Health Centres
Av
era
ge
nu
mb
er
of
foc
us
gro
up
res
po
ns
es
Functioning infrastructure Non functioning infrastructure Total
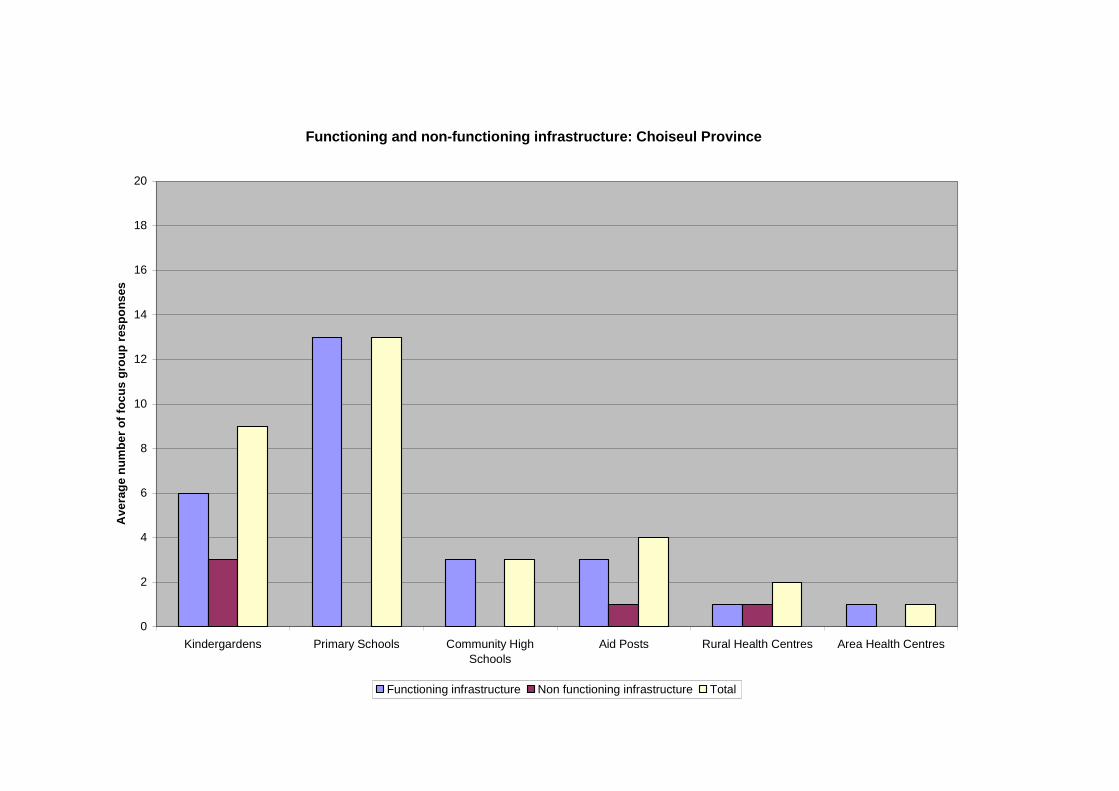
Functioning and non-functioning infrastructure: Choiseul Province
0
2
4
6
8
10
12
14
16
18
20
Kindergardens Primary Schools Community High
Schools
Aid Posts Rural Health Centres Area Health Centres
Ave
rag
en
um
be
ro
ffo
cu
sg
rou
pre
sp
on
ses
Functioning infrastructure Non functioning infrastructure Total

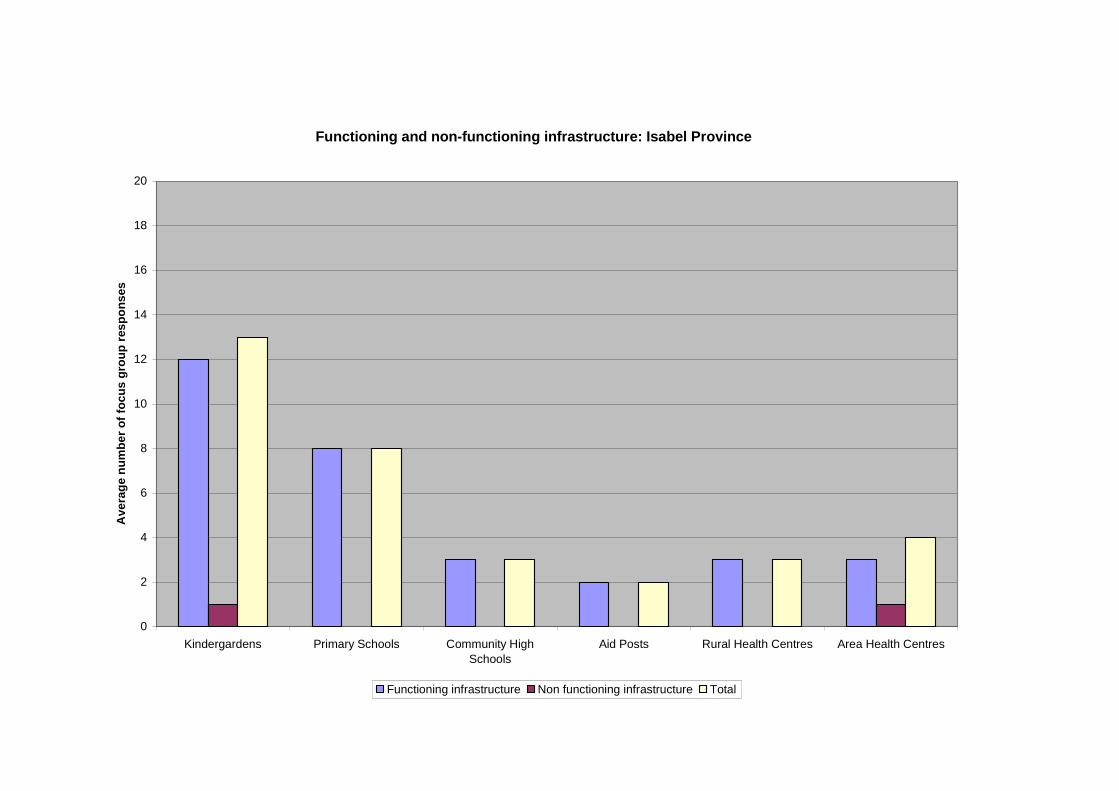
Functioning and non-functioning infrastructure: Isabel Province
0
2
4
6
8
10
12
14
16
18
20
Kindergardens Primary Schools Community High
Schools
Aid Posts Rural Health Centres Area Health Centres
Ave
rag
en
um
be
ro
ffo
cu
sg
rou
pre
sp
on
ses
Functioning infrastructure Non functioning infrastructure Total

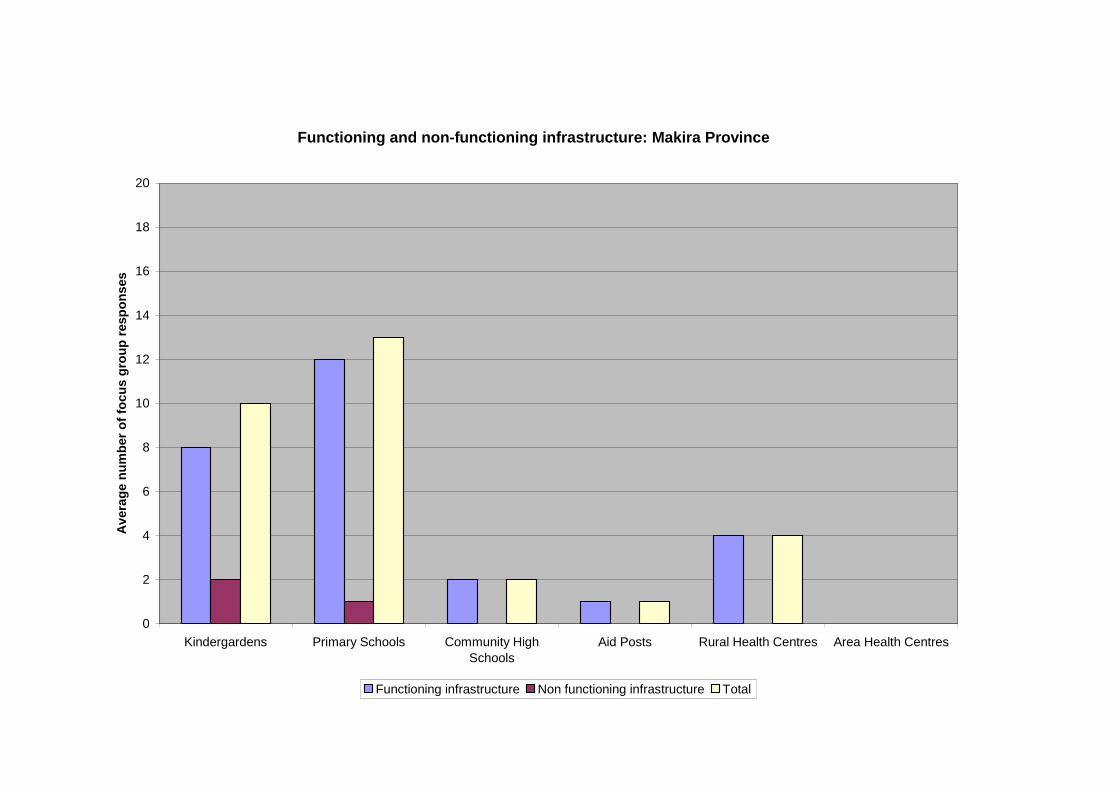
Functioning and non-functioning infrastructure: Makira Province
0
2
4
6
8
10
12
14
16
18
20
Kindergardens Primary Schools Community HighSchools
Aid Posts Rural Health Centres Area Health Centres
Av
era
ge
nu
mb
er
of
foc
us
gro
up
resp
on
ses
Functioning infrastructure Non functioning infrastructure Total

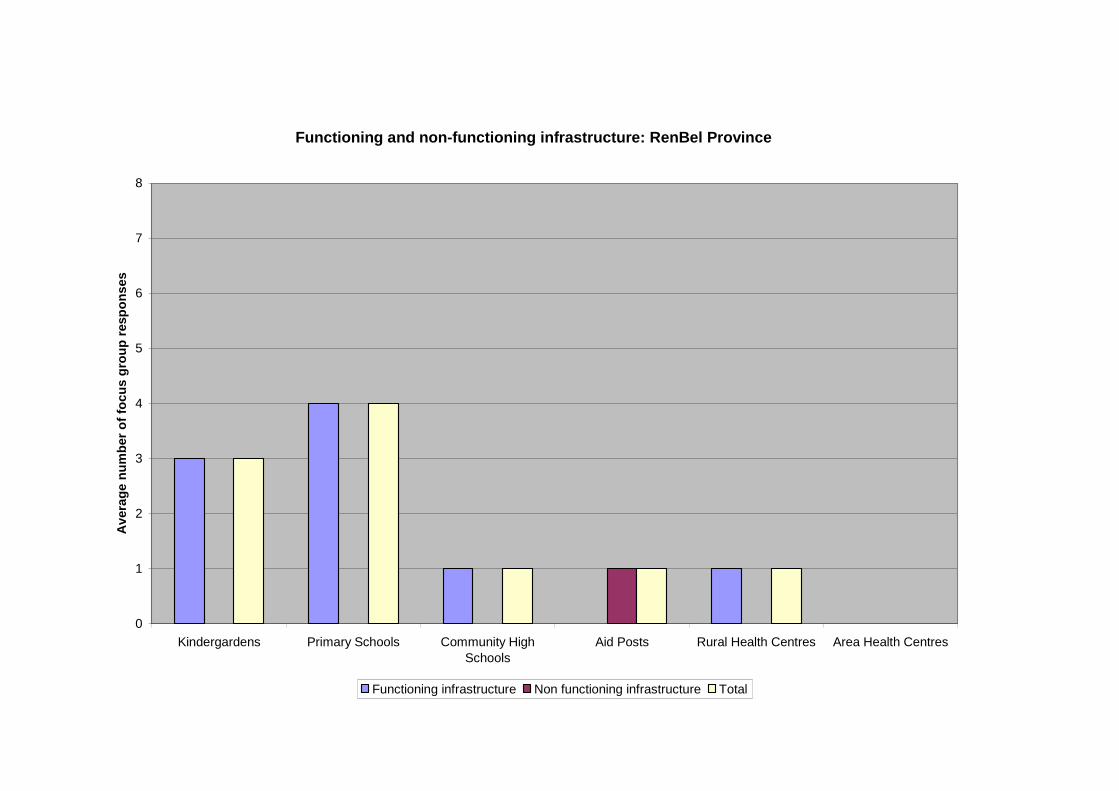
Functioning and non-functioning infrastructure: RenBel Province
0
1
2
3
4
5
6
7
8
Kindergardens Primary Schools Community HighSchools
Aid Posts Rural Health Centres Area Health Centres
Av
era
ge
nu
mb
er
of
foc
us
gro
up
resp
on
ses
Functioning infrastructure Non functioning infrastructure Total

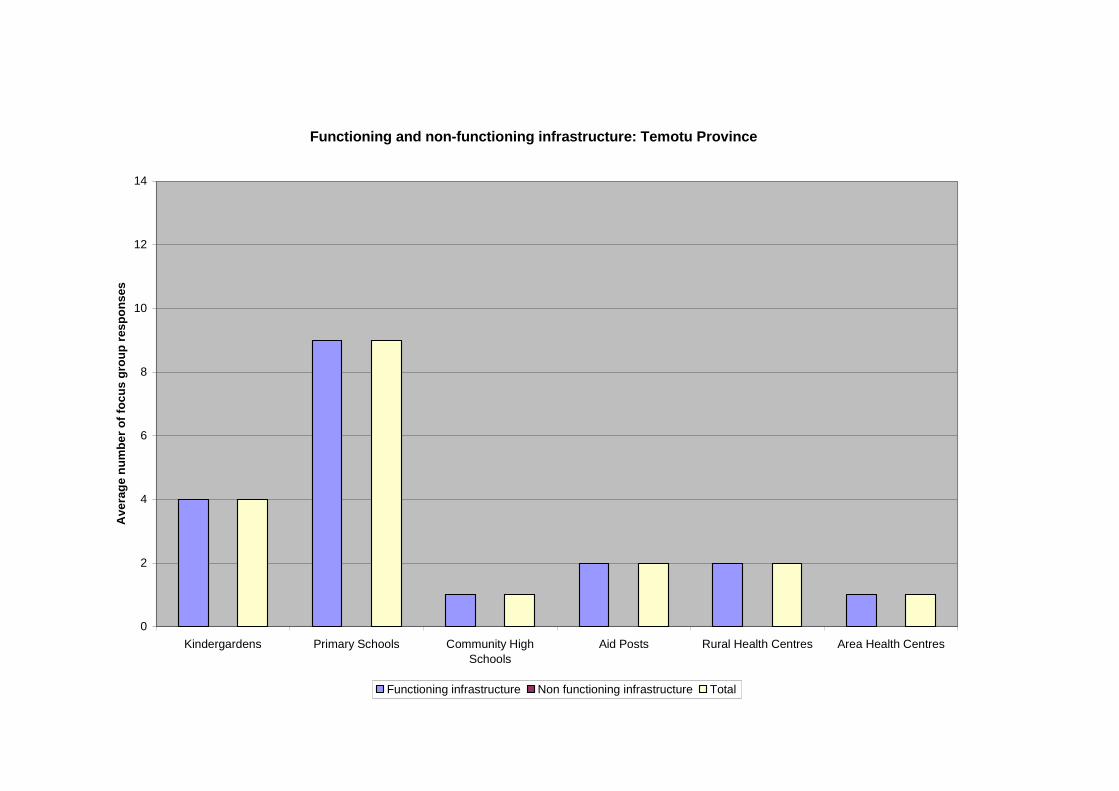
Functioning and non-functioning infrastructure: Temotu Province
0
2
4
6
8
10
12
14
Kindergardens Primary Schools Community High
Schools
Aid Posts Rural Health Centres Area Health Centres
Ave
rag
en
um
be
ro
ffo
cu
sg
rou
pre
sp
on
ses
Functioning infrastructure Non functioning infrastructure Total

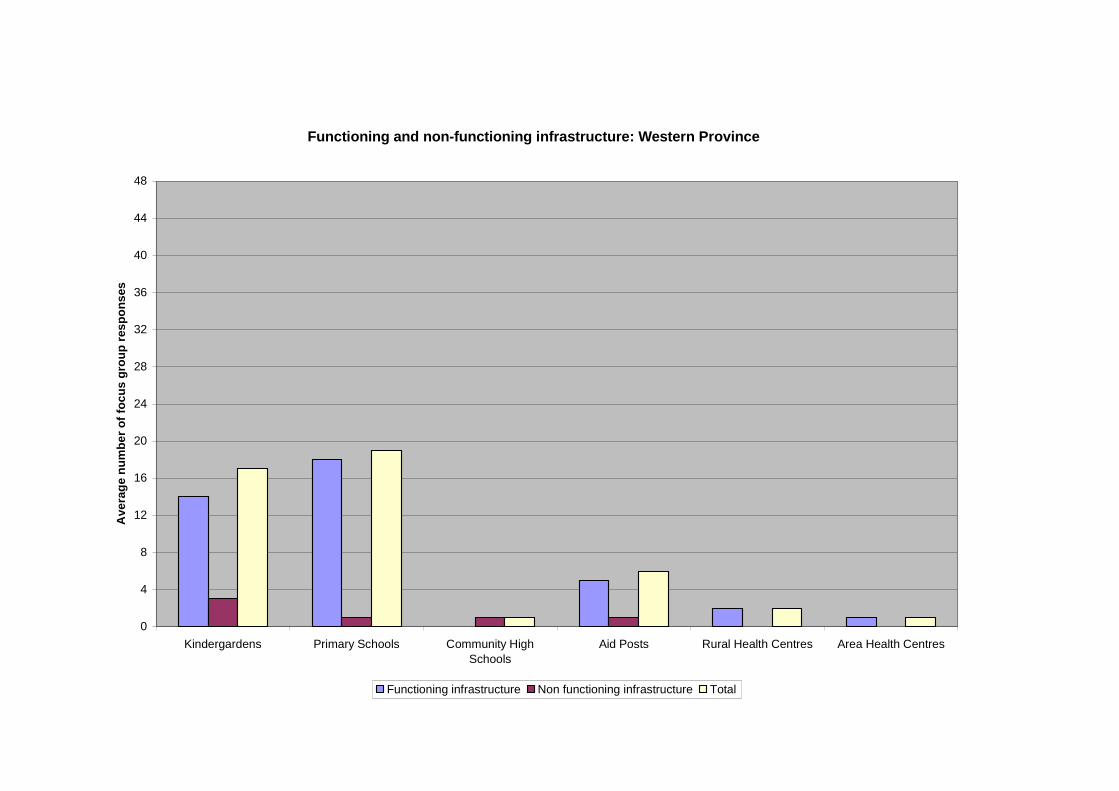
Functioning and non-functioning infrastructure: Western Province
0
4
8
12
16
20
24
28
32
36
40
44
48
Kindergardens Primary Schools Community High
Schools
Aid Posts Rural Health Centres Area Health Centres
Ave
rag
en
um
be
ro
ffo
cu
sg
rou
pre
sp
on
ses
Functioning infrastructure Non functioning infrastructure Total

Charts P17: Access to local health services
For communities with few health services in their region, access was also a limiting factor.
This makes primary health care extremely difficult for rural communities.
Analysis:
Aid post: While many communities in Central, Choiseul and Western Provinces that could
access an aid post did so within under two hours, communities surveyed in Isabel, Makira,
RenBel and Temotu Provinces had very limited access to aid posts near their communities.
Given that many aid posts are also poorly equipped; this also means that most villagers have
limited access to primary health care.
Rural health centre: While more than half the communities surveyed in Central, Makira,
RenBel and Western Provinces that had a rural health centre nearby could access a rural
health centre in under two hours, the communities of Choiseul, Isabel, and Temotu Provinces
surveyed for this report could not access a rural health centre in under two hours. It needs to
be remembered that access for rural populations is also mostly on foot.
Area health centre: Access to area health services is also limited. In Central Province, 61
percent of the communities surveyed could only reach an area health centre between 2 and 4
hours. In the other provinces the figure is less than 35 percent of communities surveyed.
The tabulated responses are:
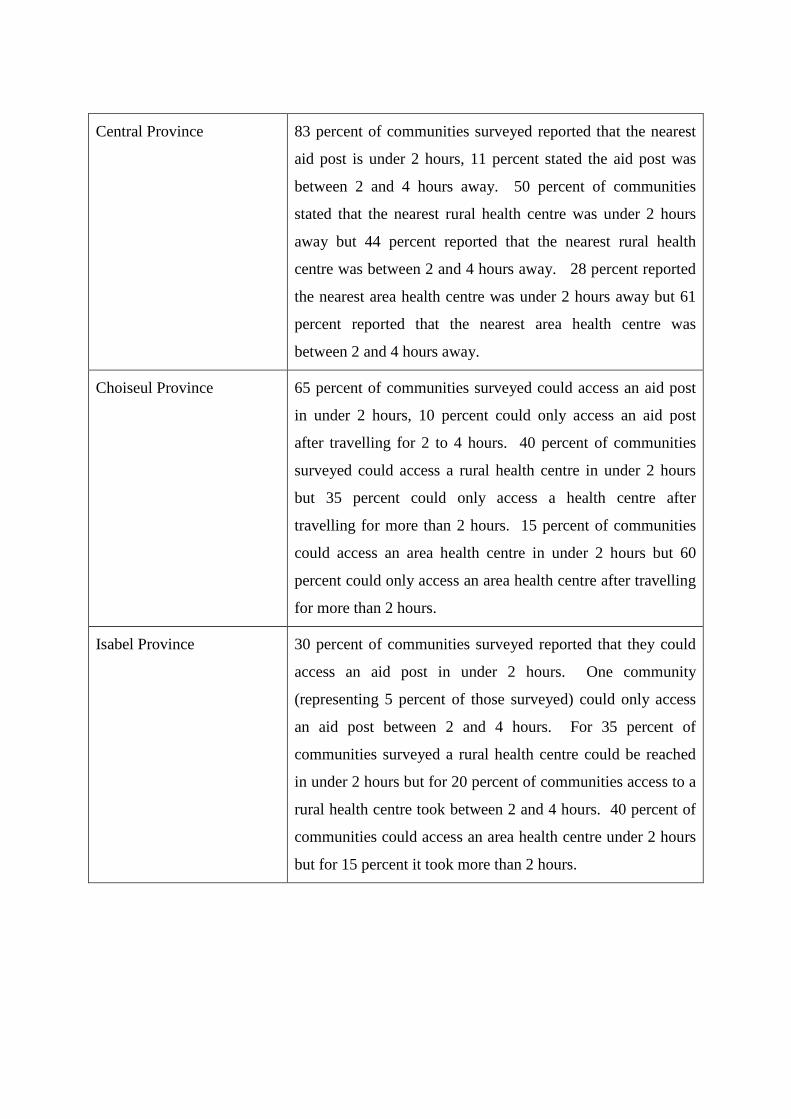
Central Province 83 percent of communities surveyed reported that the nearest
aid post is under 2 hours, 11 percent stated the aid post was
between 2 and 4 hours away. 50 percent of communities
stated that the nearest rural health centre was under 2 hours
away but 44 percent reported that the nearest rural health
centre was between 2 and 4 hours away. 28 percent reported
the nearest area health centre was under 2 hours away but 61
percent reported that the nearest area health centre was
between 2 and 4 hours away.
Choiseul Province 65 percent of communities surveyed could access an aid post
in under 2 hours, 10 percent could only access an aid post
after travelling for 2 to 4 hours. 40 percent of communities
surveyed could access a rural health centre in under 2 hours
but 35 percent could only access a health centre after
travelling for more than 2 hours. 15 percent of communities
could access an area health centre in under 2 hours but 60
percent could only access an area health centre after travelling
for more than 2 hours.
Isabel Province 30 percent of communities surveyed reported that they could
access an aid post in under 2 hours. One community
(representing 5 percent of those surveyed) could only access
an aid post between 2 and 4 hours. For 35 percent of
communities surveyed a rural health centre could be reached
in under 2 hours but for 20 percent of communities access to a
rural health centre took between 2 and 4 hours. 40 percent of
communities could access an area health centre under 2 hours
but for 15 percent it took more than 2 hours.
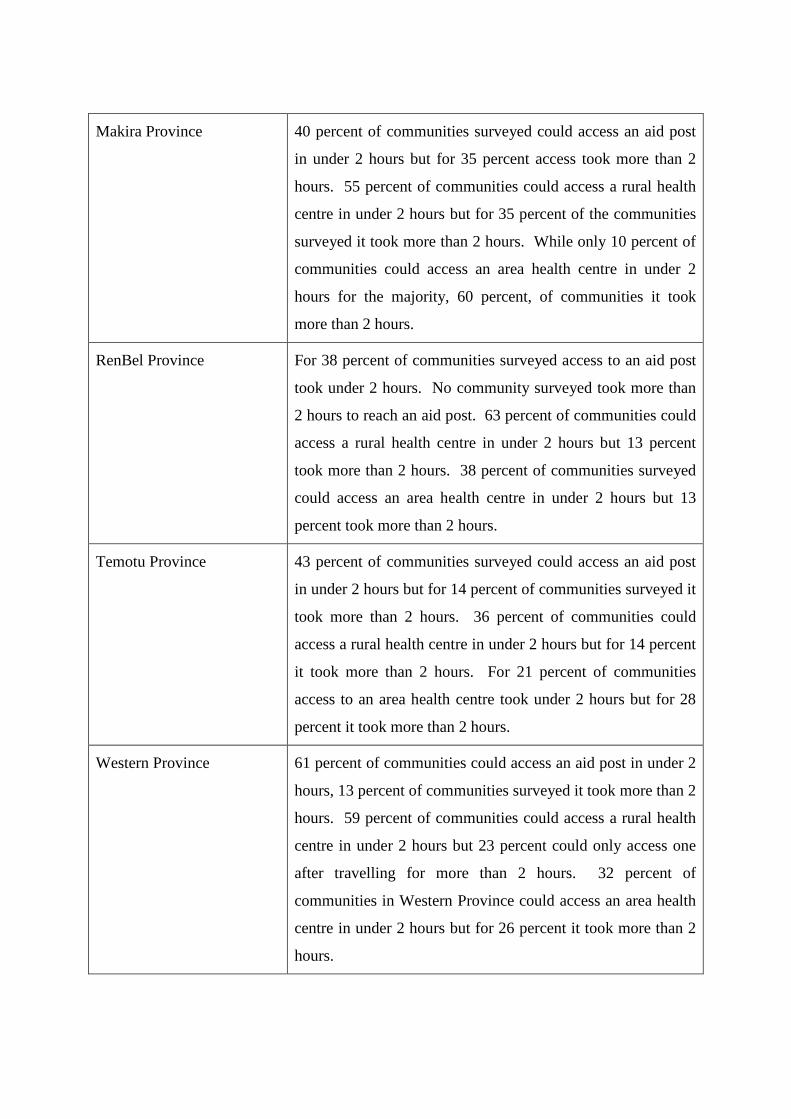
Makira Province 40 percent of communities surveyed could access an aid post
in under 2 hours but for 35 percent access took more than 2
hours. 55 percent of communities could access a rural health
centre in under 2 hours but for 35 percent of the communities
surveyed it took more than 2 hours. While only 10 percent of
communities could access an area health centre in under 2
hours for the majority, 60 percent, of communities it took
more than 2 hours.
RenBel Province For 38 percent of communities surveyed access to an aid post
took under 2 hours. No community surveyed took more than
2 hours to reach an aid post. 63 percent of communities could
access a rural health centre in under 2 hours but 13 percent
took more than 2 hours. 38 percent of communities surveyed
could access an area health centre in under 2 hours but 13
percent took more than 2 hours.
Temotu Province 43 percent of communities surveyed could access an aid post
in under 2 hours but for 14 percent of communities surveyed it
took more than 2 hours. 36 percent of communities could
access a rural health centre in under 2 hours but for 14 percent
it took more than 2 hours. For 21 percent of communities
access to an area health centre took under 2 hours but for 28
percent it took more than 2 hours.
Western Province 61 percent of communities could access an aid post in under 2
hours, 13 percent of communities surveyed it took more than 2
hours. 59 percent of communities could access a rural health
centre in under 2 hours but 23 percent could only access one
after travelling for more than 2 hours. 32 percent of
communities in Western Province could access an area health
centre in under 2 hours but for 26 percent it took more than 2
hours.
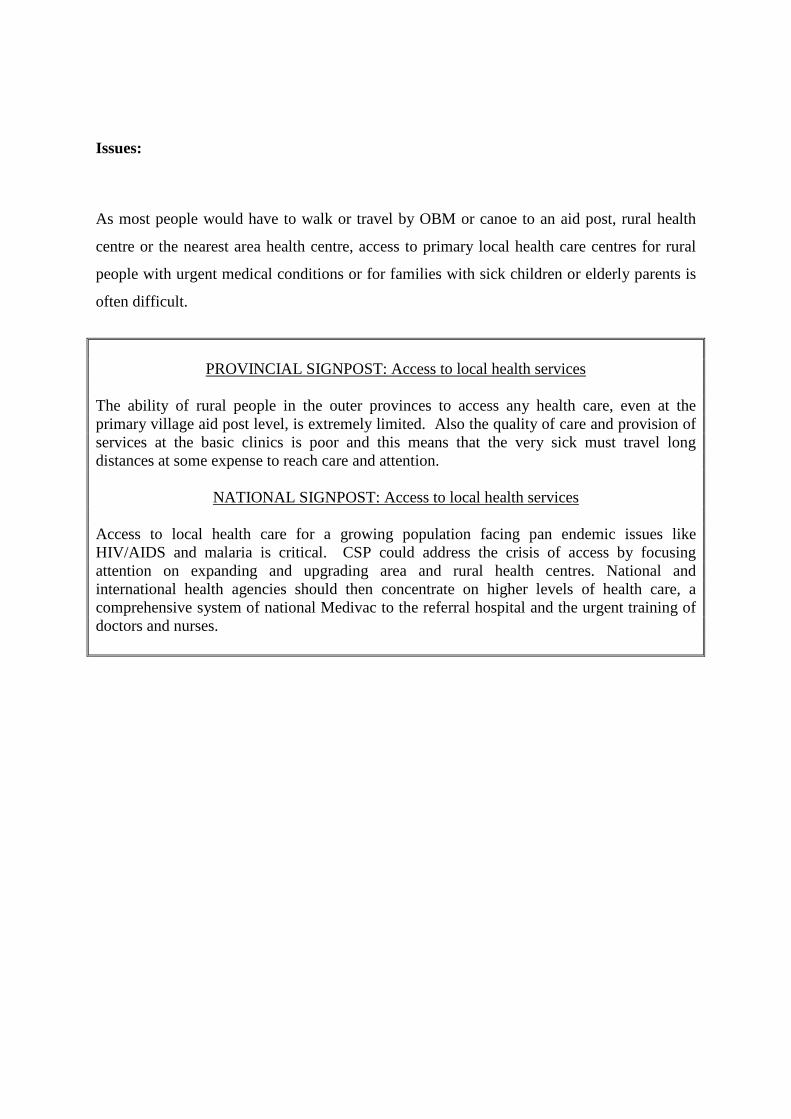
Issues:
As most people would have to walk or travel by OBM or canoe to an aid post, rural health
centre or the nearest area health centre, access to primary local health care centres for rural
people with urgent medical conditions or for families with sick children or elderly parents is
often difficult.
PROVINCIAL SIGNPOST: Access to local health services
The ability of rural people in the outer provinces to access any health care, even at theprimary village aid post level, is extremely limited. Also the quality of care and provision ofservices at the basic clinics is poor and this means that the very sick must travel longdistances at some expense to reach care and attention.
NATIONAL SIGNPOST: Access to local health services
Access to local health care for a growing population facing pan endemic issues likeHIV/AIDS and malaria is critical. CSP could address the crisis of access by focusingattention on expanding and upgrading area and rural health centres. National andinternational health agencies should then concentrate on higher levels of health care, acomprehensive system of national Medivac to the referral hospital and the urgent training ofdoctors and nurses.
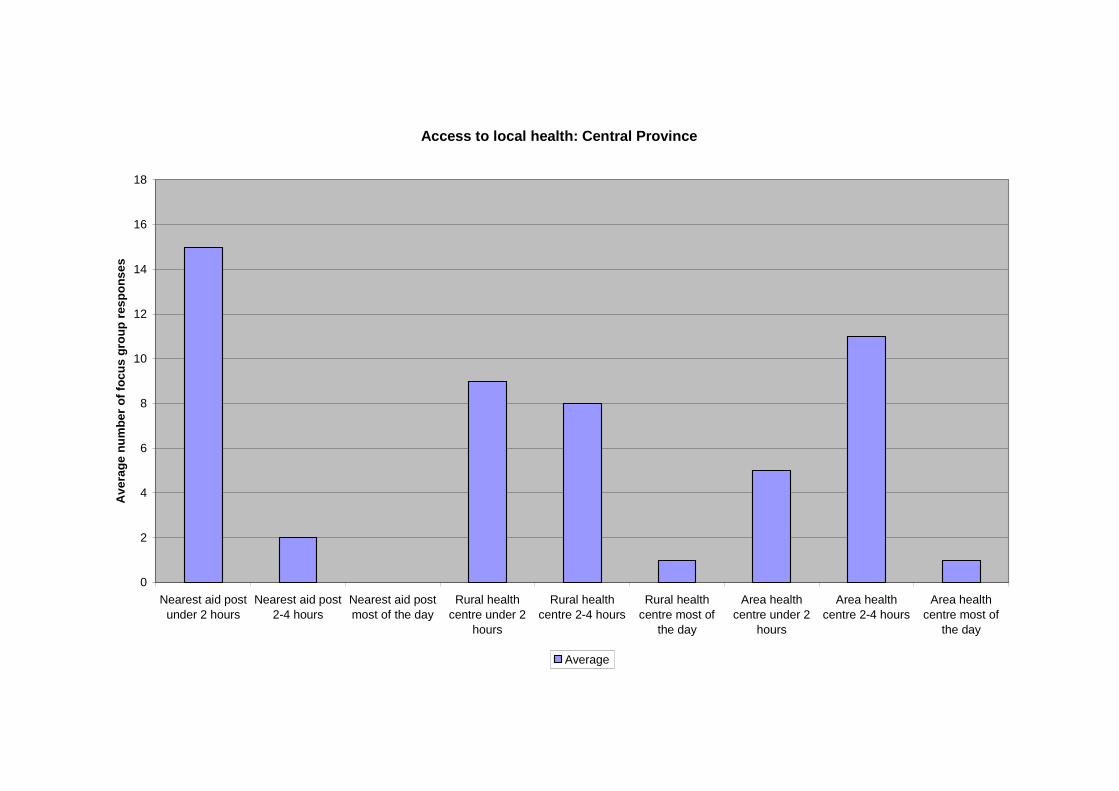
Access to local health: Central Province
0
2
4
6
8
10
12
14
16
18
Nearest aid post
under 2 hours
Nearest aid post
2-4 hours
Nearest aid post
most of the day
Rural health
centre under 2
hours
Rural health
centre 2-4 hours
Rural health
centre most of
the day
Area health
centre under 2
hours
Area health
centre 2-4 hours
Area health
centre most of
the day
Av
era
ge
nu
mb
er
of
foc
us
gro
up
res
po
ns
es
Average
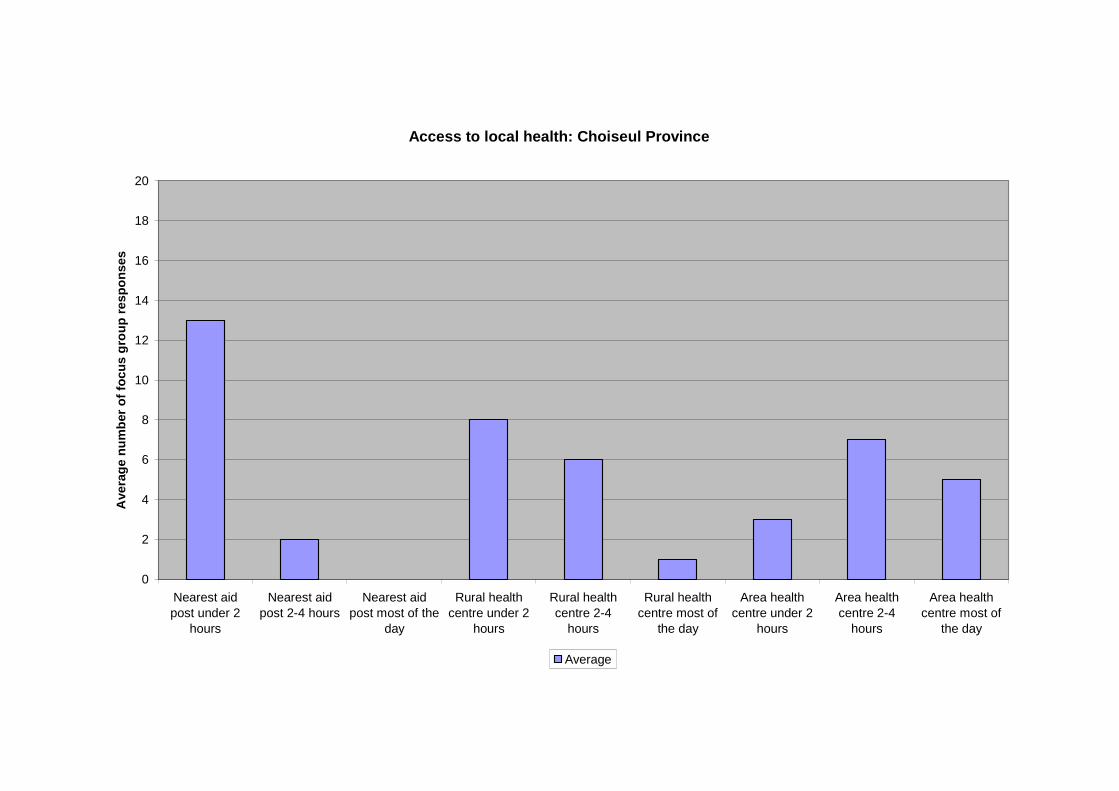
Access to local health: Choiseul Province
0
2
4
6
8
10
12
14
16
18
20
Nearest aidpost under 2
hours
Nearest aidpost 2-4 hours
Nearest aidpost most of the
day
Rural healthcentre under 2
hours
Rural healthcentre 2-4
hours
Rural healthcentre most of
the day
Area healthcentre under 2
hours
Area healthcentre 2-4
hours
Area healthcentre most of
the day
Ave
rag
en
um
ber
of
foc
us
gro
up
res
po
ns
es
Average
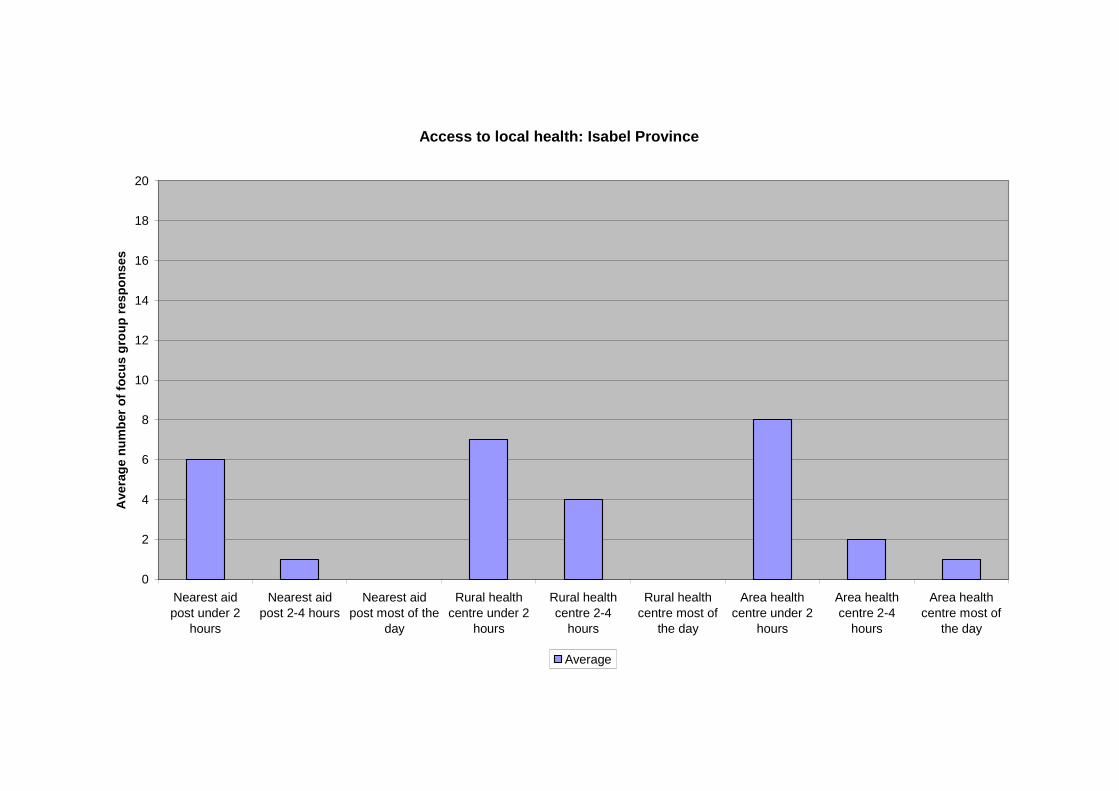
Access to local health: Isabel Province
0
2
4
6
8
10
12
14
16
18
20
Nearest aidpost under 2
hours
Nearest aidpost 2-4 hours
Nearest aidpost most of the
day
Rural healthcentre under 2
hours
Rural healthcentre 2-4
hours
Rural healthcentre most of
the day
Area healthcentre under 2
hours
Area healthcentre 2-4
hours
Area healthcentre most of
the day
Ave
rag
en
um
ber
of
foc
us
gro
up
res
po
ns
es
Average
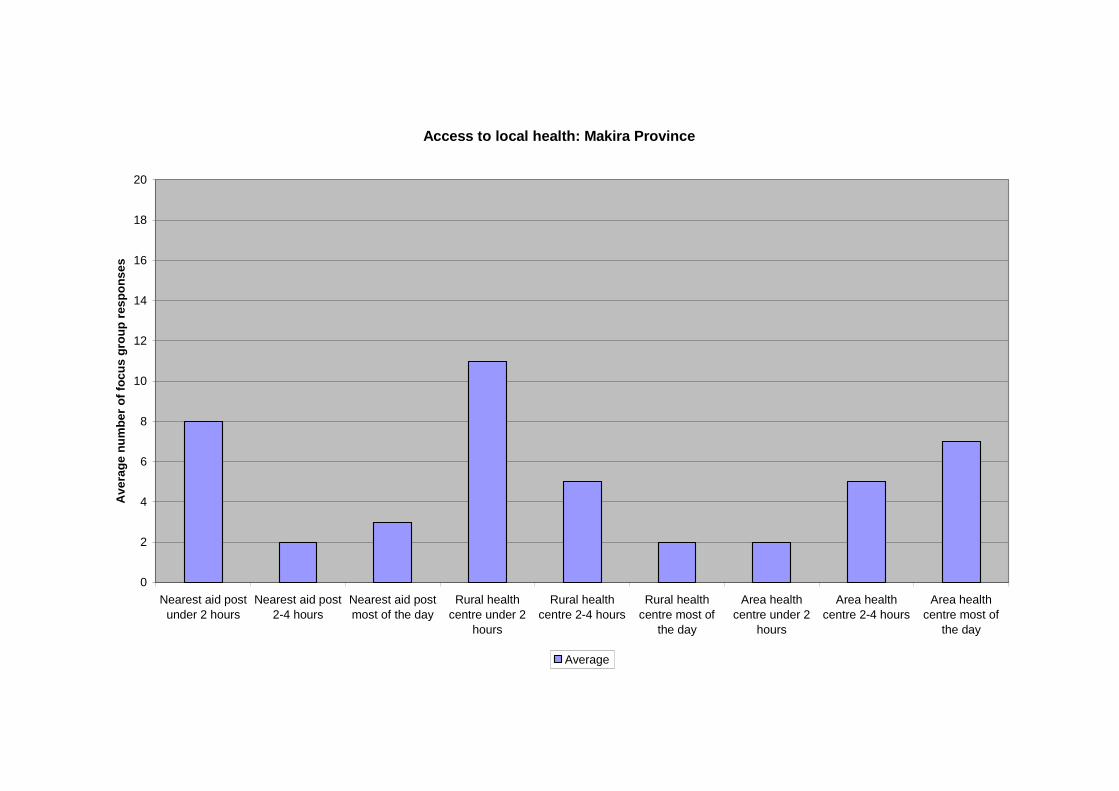
Access to local health: Makira Province
0
2
4
6
8
10
12
14
16
18
20
Nearest aid post
under 2 hours
Nearest aid post
2-4 hours
Nearest aid post
most of the day
Rural health
centre under 2
hours
Rural health
centre 2-4 hours
Rural health
centre most of
the day
Area health
centre under 2
hours
Area health
centre 2-4 hours
Area health
centre most of
the day
Av
era
ge
nu
mb
er
of
foc
us
gro
up
res
po
ns
es
Average
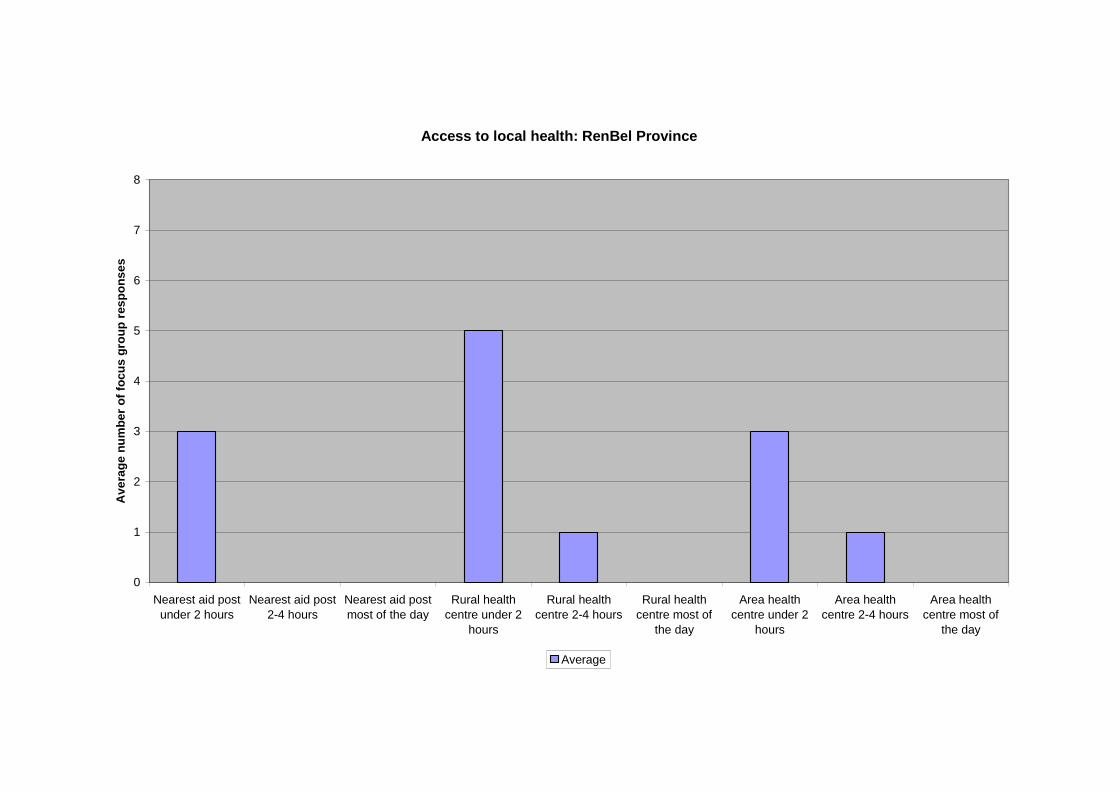
Access to local health: RenBel Province
0
1
2
3
4
5
6
7
8
Nearest aid post
under 2 hours
Nearest aid post
2-4 hours
Nearest aid post
most of the day
Rural health
centre under 2
hours
Rural health
centre 2-4 hours
Rural health
centre most of
the day
Area health
centre under 2
hours
Area health
centre 2-4 hours
Area health
centre most of
the day
Av
era
ge
nu
mb
er
of
foc
us
gro
up
res
po
ns
es
Average
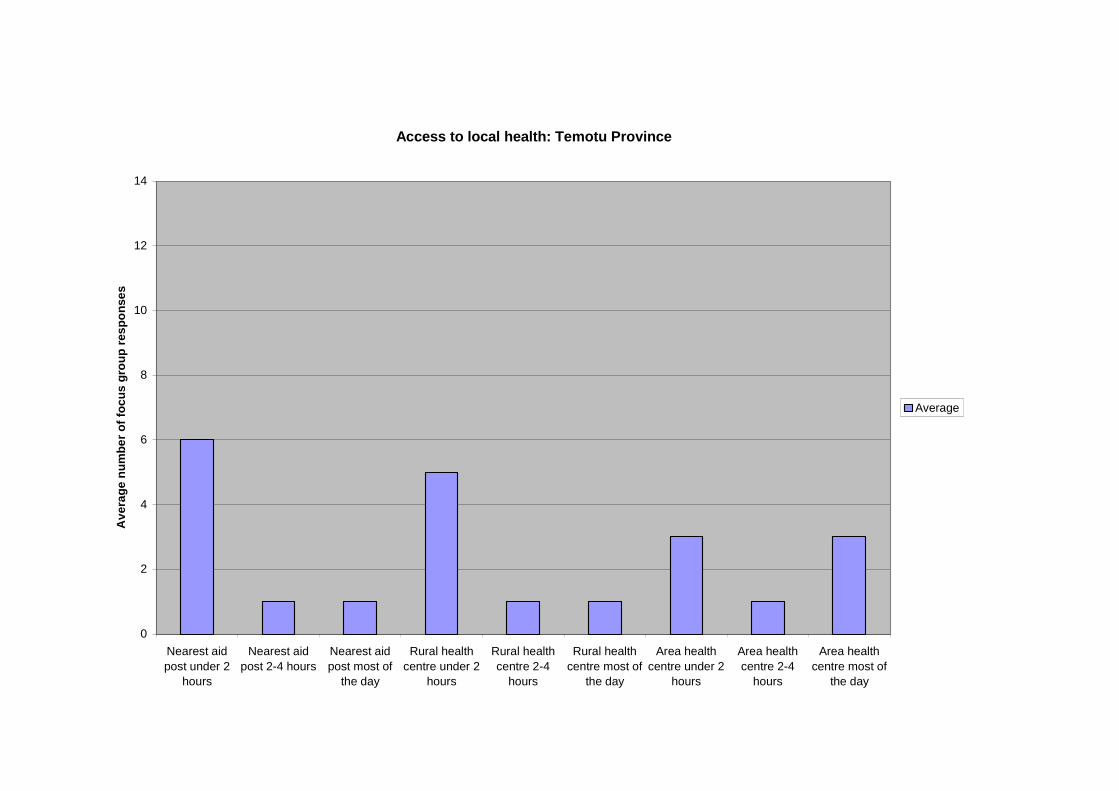
Access to local health: Temotu Province
0
2
4
6
8
10
12
14
Nearest aid
post under 2
hours
Nearest aid
post 2-4 hours
Nearest aid
post most of
the day
Rural health
centre under 2
hours
Rural health
centre 2-4
hours
Rural health
centre most of
the day
Area health
centre under 2
hours
Area health
centre 2-4
hours
Area health
centre most of
the day
Av
era
ge
nu
mb
er
of
foc
us
gro
up
res
po
nse
s
Average

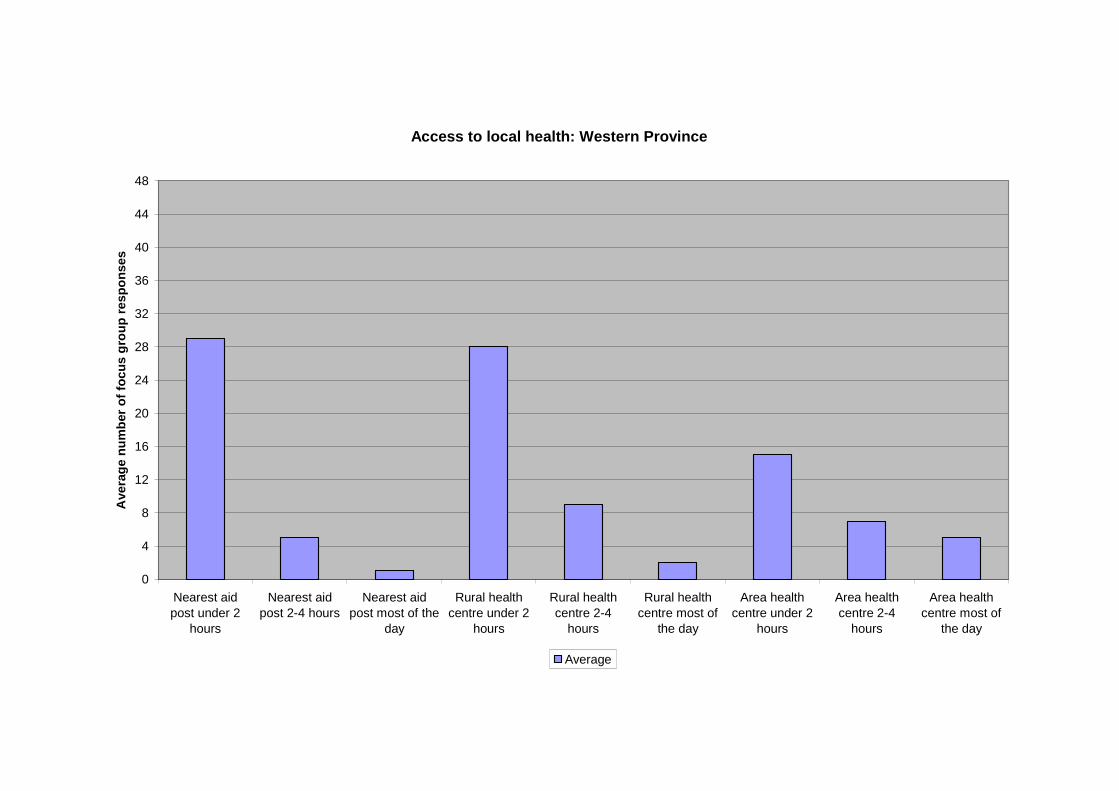
Access to local health: Western Province
0
4
8
12
16
20
24
28
32
36
40
44
48
Nearest aidpost under 2
hours
Nearest aidpost 2-4 hours
Nearest aidpost most of the
day
Rural healthcentre under 2
hours
Rural healthcentre 2-4
hours
Rural healthcentre most of
the day
Area healthcentre under 2
hours
Area healthcentre 2-4
hours
Area healthcentre most of
the day
Ave
rag
en
um
ber
of
foc
us
gro
up
res
po
ns
es
Average
Charts P18: Access to provincial and national health service
The previous charts illustrated the difficulties faced by rural communities in the Solomon
Islands in reaching local health. These charts are designed to illustrate the problems faced by
communities trying to access higher levels of health care at the provincial and the national
level.. For the majority of the villages surveyed access to provincial and national health care
is extremely difficult. Access for sick patients or families who had to provide general
services like clean clothes and food meant long hours of walking or expensive inter-island
transport. Most patients have to utilise the services of relatives to assist in daily care and this
means carers must pay for travel and accommodation at regional centres or in Honiara.
Analysis:
Mini hospitals: For the rural people in the majority of provinces except for the small islands
of Rennell and Bellona, access to mini hospitals takes between 2 and 4 hours or most of the
day. It is only from the mini hospital that they really ill can be referred to the main hospital
in Honiara. The only other way of access the services of the general hospital is for the sick or
elderly to travel to Honiara privately and attend the outpatients clinic. The tabulated
responses are:
Central Province Only 17 percent of communities reported being able to access
a mini hospital in under 2 hours. For 56 percent of
communities surveyed access took between 2 and 4 hours and
for 28 percent of communities surveyed access took most of
the day.
Choiseul Province 15 percent of communities could access a mini hospital in
under 2 hours, 30 percent could access a mini hospital
between 2 and 4 hours but 55 percent could only access one
after travelling for most of the day.

Isabel Province 25 percent of communities surveyed in Isabel Province could
access a mini hospital in under 2 hours, 25 percent could
access one after travelling for 2 to 4 hours but 40 percent
could only access a mini hospital after travelling for most of
the day.
Makira Province No community in Makira Province could access a mini
hospital in under 2 hours, 10 percent could access one
between 2 and 4 hours but 60 percent could only access a mini
hospital after travelling for most of the day.
RenBel Province 38 percent of communities surveyed in RenBel Province could
access a mini hospital in under 2 hours, no community
surveyed could access one in 2 to 4 hours but for 13 percent of
communities access took most of the day.
Temotu Province 7 percent of communities (one community surveyed) could
access a mini hospital in under 2 hours, 14 percent could
access a mini hospital between 2 and 4 hours and only 29
percent could access one even after travelling for most of the
day.
Western Province 21 percent of communities surveyed could access a mini
hospital in under 2 hours. Only 1 percent could access a mini
hospital between 2 and 4 hours but 15 percent could access
one after travelling for most of the day.
Referral hospital: Access to the only referral hospital, the General or No 9 Hospital in
Honiara followed a similar pattern. For the majority of villages surveyed, the referral
hospital was most of the day away the only exceptions are on RenBel Province where people
reported that they could not access the main referral hospital at all and in Western Province,
which is connected to Honiara by a fast ferry service and regular air transport that reaches the
outer areas especially those near tourist developments in Marovo Lagoon, access to the
referral hospital for approximately 50 percent of communities surveyed took up to 4 hours.
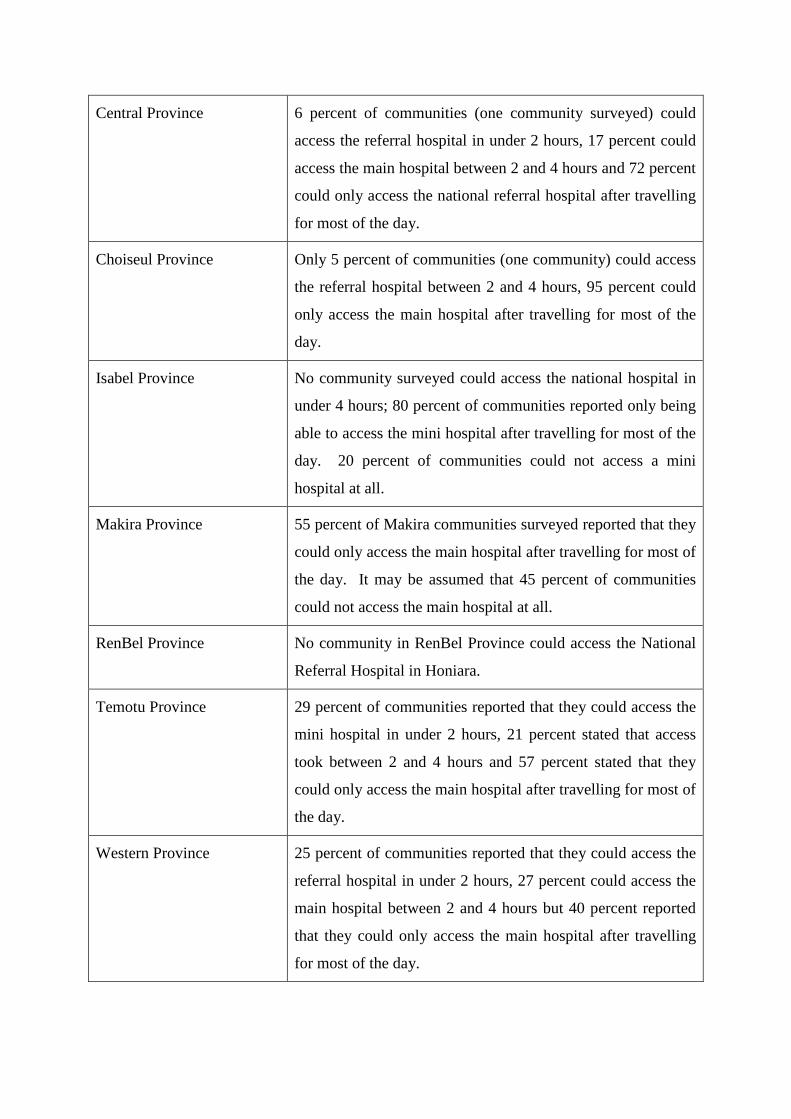
Central Province 6 percent of communities (one community surveyed) could
access the referral hospital in under 2 hours, 17 percent could
access the main hospital between 2 and 4 hours and 72 percent
could only access the national referral hospital after travelling
for most of the day.
Choiseul Province Only 5 percent of communities (one community) could access
the referral hospital between 2 and 4 hours, 95 percent could
only access the main hospital after travelling for most of the
day.
Isabel Province No community surveyed could access the national hospital in
under 4 hours; 80 percent of communities reported only being
able to access the mini hospital after travelling for most of the
day. 20 percent of communities could not access a mini
hospital at all.
Makira Province 55 percent of Makira communities surveyed reported that they
could only access the main hospital after travelling for most of
the day. It may be assumed that 45 percent of communities
could not access the main hospital at all.
RenBel Province No community in RenBel Province could access the National
Referral Hospital in Honiara.
Temotu Province 29 percent of communities reported that they could access the
mini hospital in under 2 hours, 21 percent stated that access
took between 2 and 4 hours and 57 percent stated that they
could only access the main hospital after travelling for most of
the day.
Western Province 25 percent of communities reported that they could access the
referral hospital in under 2 hours, 27 percent could access the
main hospital between 2 and 4 hours but 40 percent reported
that they could only access the main hospital after travelling
for most of the day.
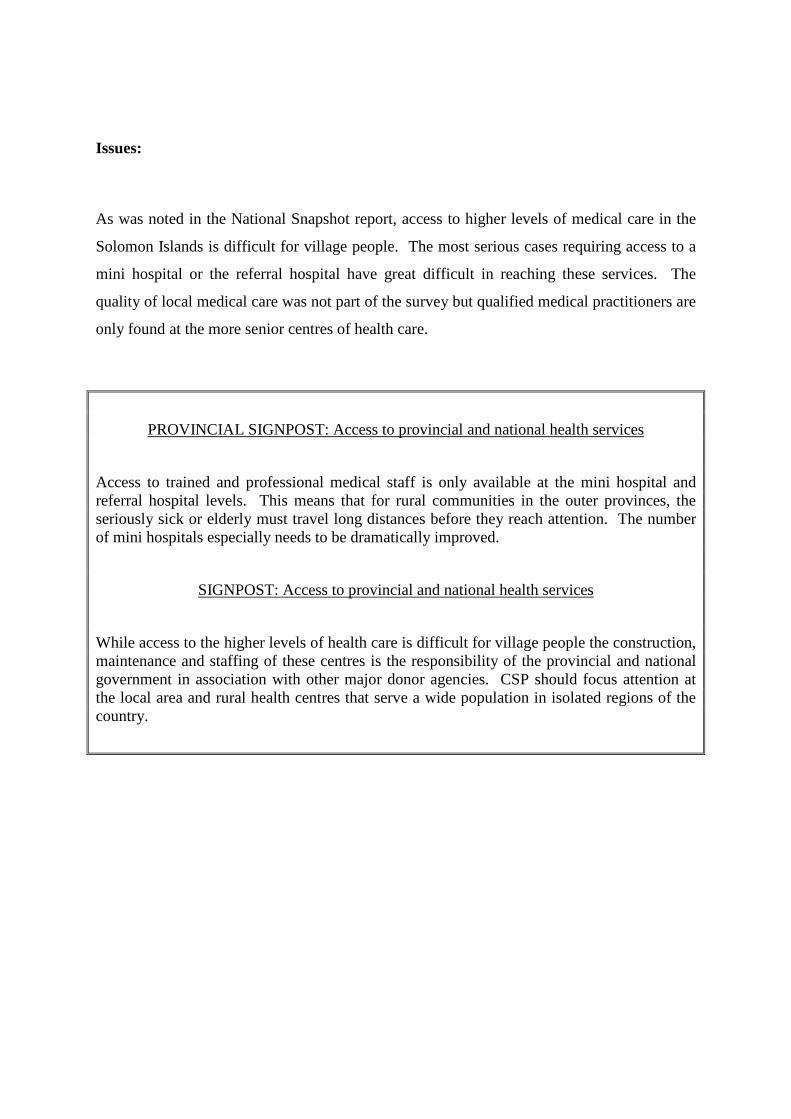
Issues:
As was noted in the National Snapshot report, access to higher levels of medical care in the
Solomon Islands is difficult for village people. The most serious cases requiring access to a
mini hospital or the referral hospital have great difficult in reaching these services. The
quality of local medical care was not part of the survey but qualified medical practitioners are
only found at the more senior centres of health care.
PROVINCIAL SIGNPOST: Access to provincial and national health services
Access to trained and professional medical staff is only available at the mini hospital andreferral hospital levels. This means that for rural communities in the outer provinces, theseriously sick or elderly must travel long distances before they reach attention. The numberof mini hospitals especially needs to be dramatically improved.
SIGNPOST: Access to provincial and national health services
While access to the higher levels of health care is difficult for village people the construction,maintenance and staffing of these centres is the responsibility of the provincial and nationalgovernment in association with other major donor agencies. CSP should focus attention atthe local area and rural health centres that serve a wide population in isolated regions of thecountry.
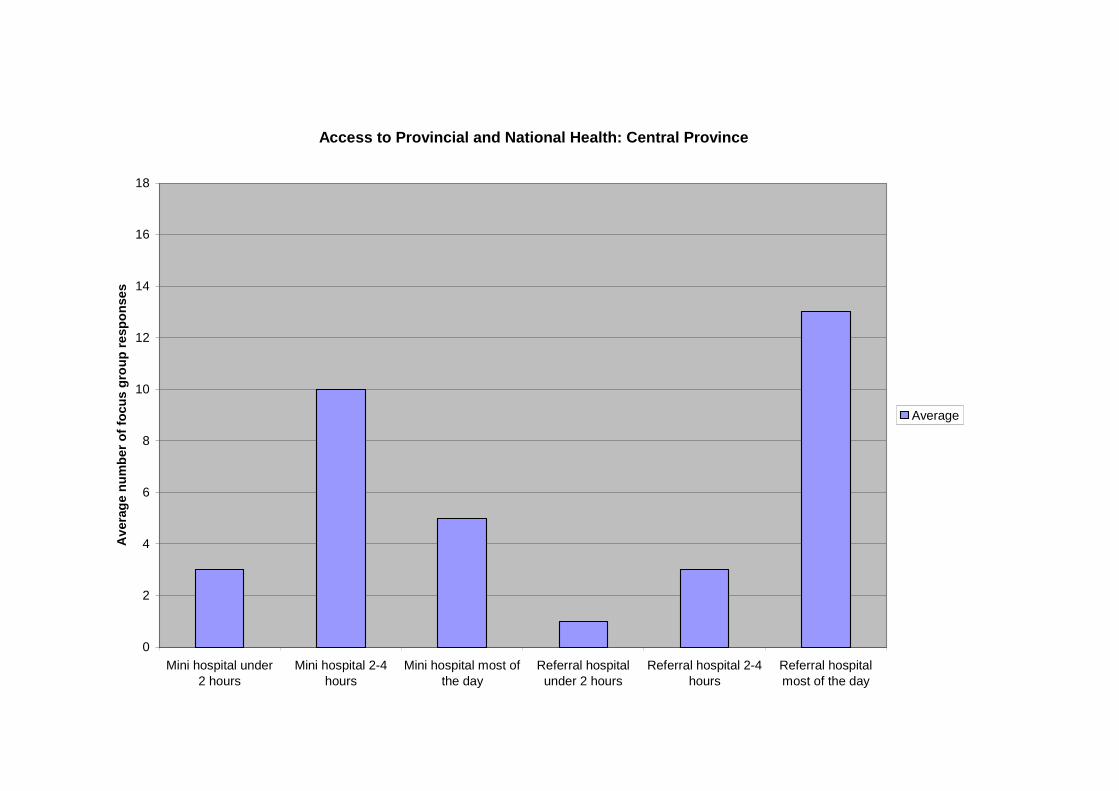
Access to Provincial and National Health: Central Province
0
2
4
6
8
10
12
14
16
18
Mini hospital under2 hours
Mini hospital 2-4hours
Mini hospital most ofthe day
Referral hospitalunder 2 hours
Referral hospital 2-4hours
Referral hospitalmost of the day
Av
era
ge
nu
mb
er
of
focu
sg
rou
pre
sp
on
se
s
Average

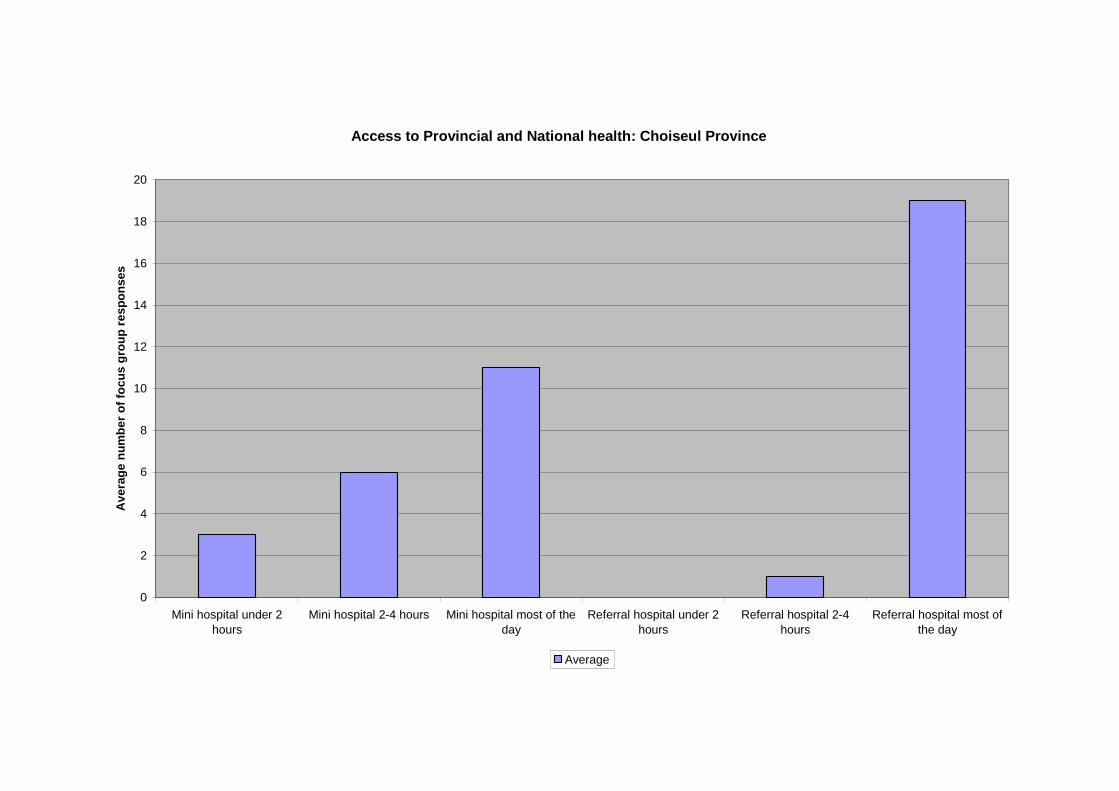
Access to Provincial and National health: Choiseul Province
0
2
4
6
8
10
12
14
16
18
20
Mini hospital under 2
hours
Mini hospital 2-4 hours Mini hospital most of the
day
Referral hospital under 2
hours
Referral hospital 2-4
hours
Referral hospital most of
the day
Av
era
ge
nu
mb
er
of
foc
us
gro
up
res
po
ns
es
Average
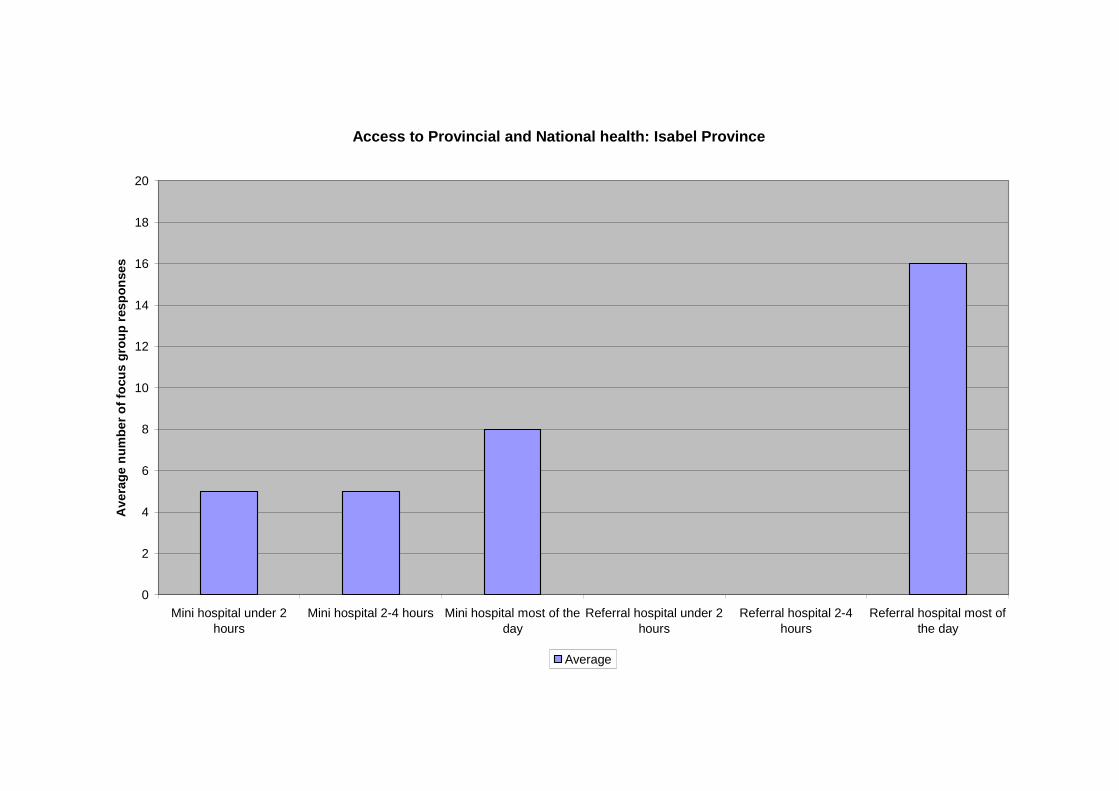
Access to Provincial and National health: Isabel Province
0
2
4
6
8
10
12
14
16
18
20
Mini hospital under 2hours
Mini hospital 2-4 hours Mini hospital most of theday
Referral hospital under 2hours
Referral hospital 2-4hours
Referral hospital most ofthe day
Av
era
ge
nu
mb
er
of
focu
sg
rou
pre
sp
on
se
s
Average
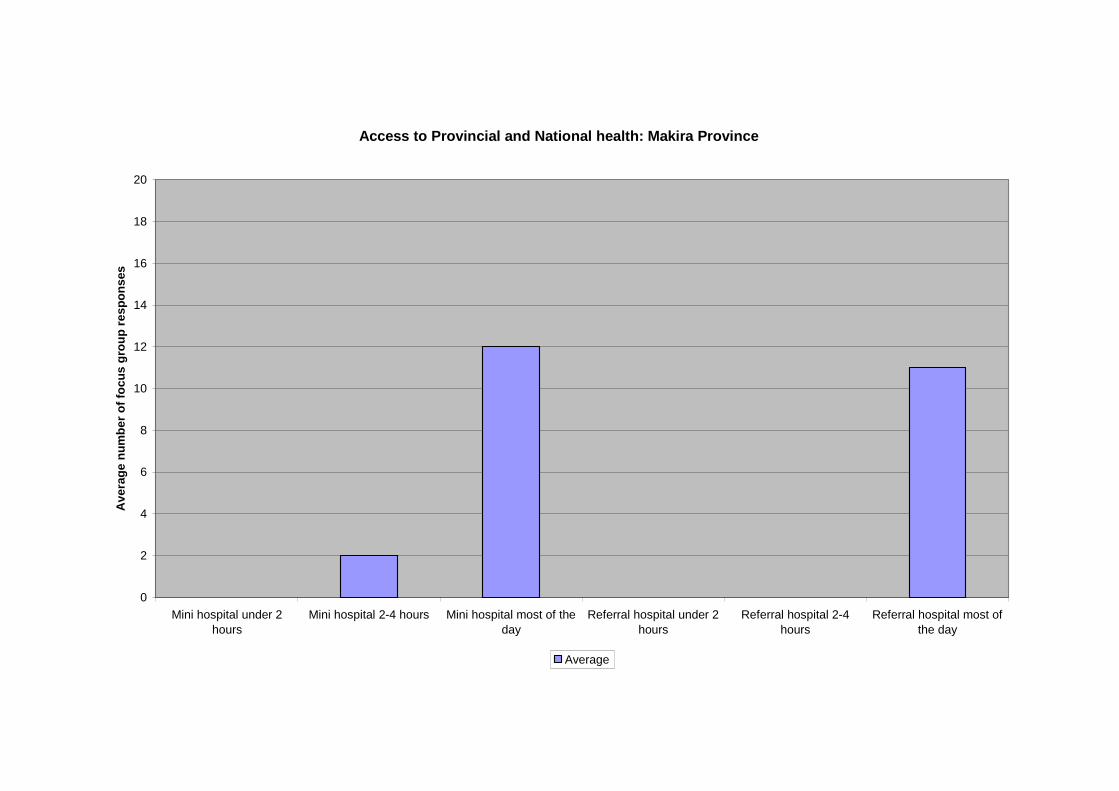
Access to Provincial and National health: Makira Province
0
2
4
6
8
10
12
14
16
18
20
Mini hospital under 2
hours
Mini hospital 2-4 hours Mini hospital most of the
day
Referral hospital under 2
hours
Referral hospital 2-4
hours
Referral hospital most of
the day
Av
era
ge
nu
mb
er
of
foc
us
gro
up
res
po
ns
es
Average
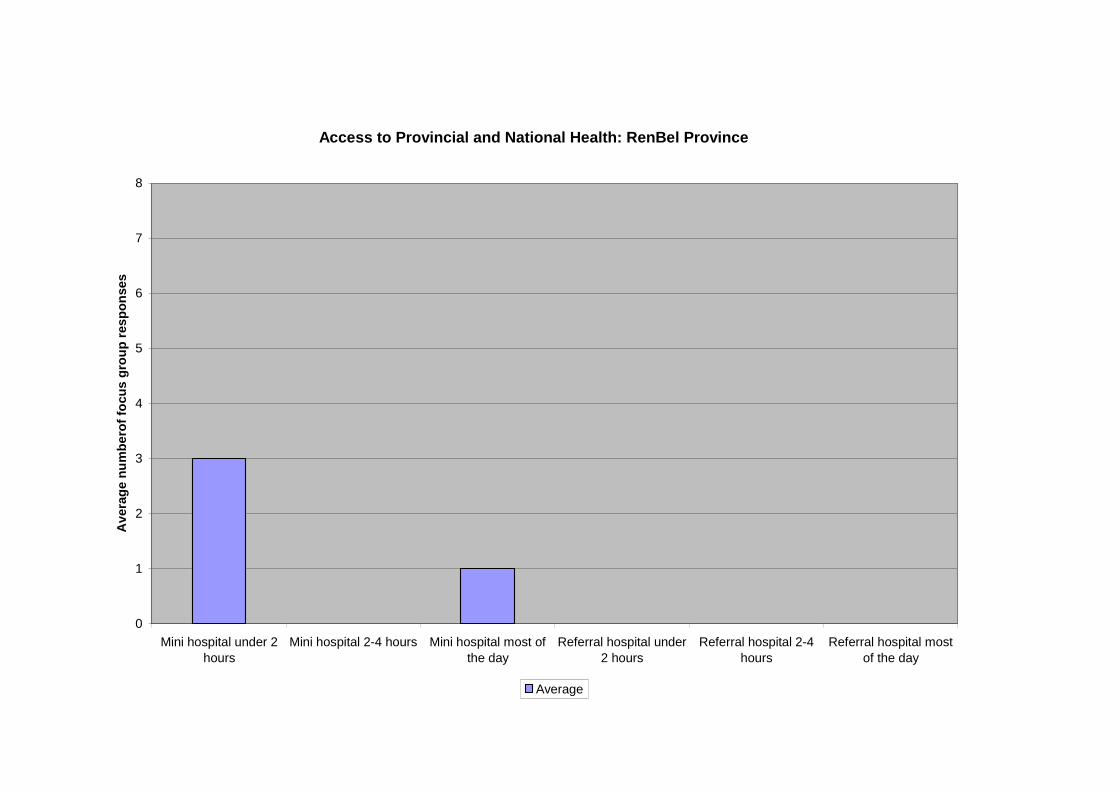
Access to Provincial and National Health: RenBel Province
0
1
2
3
4
5
6
7
8
Mini hospital under 2hours
Mini hospital 2-4 hours Mini hospital most ofthe day
Referral hospital under2 hours
Referral hospital 2-4hours
Referral hospital mostof the day
Av
era
ge
nu
mb
ero
ffo
cu
sg
rou
pre
sp
on
ses
Average

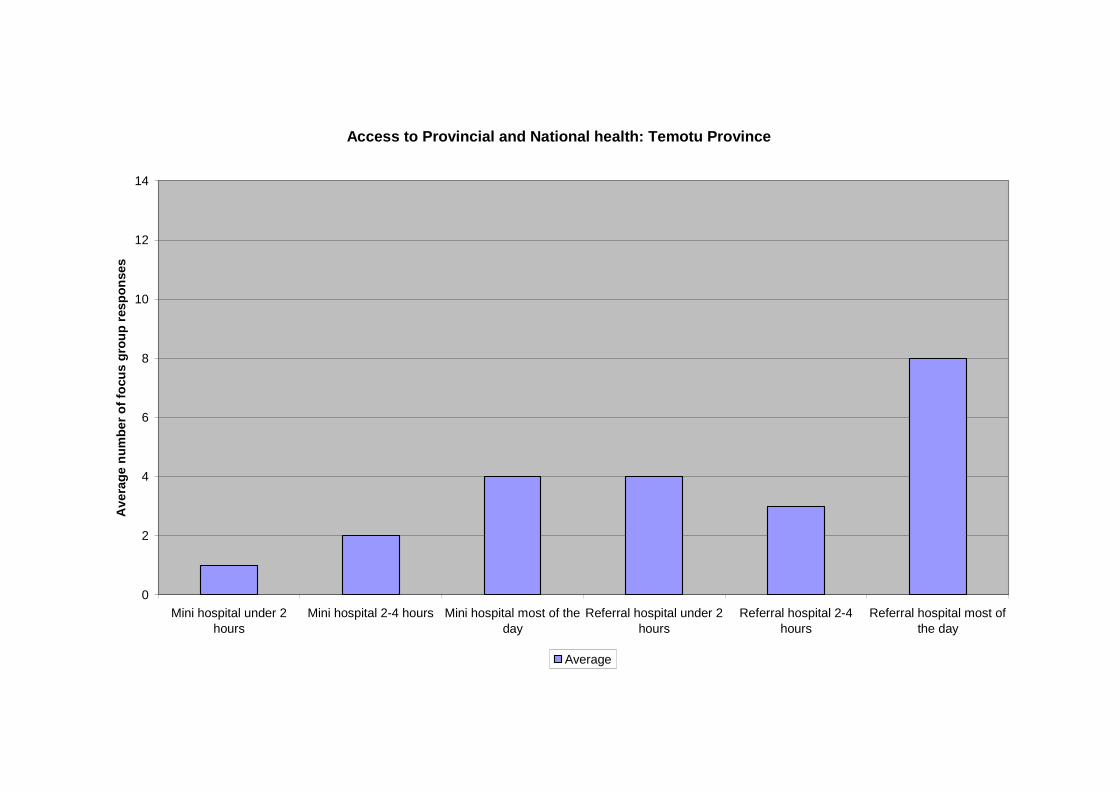
Access to Provincial and National health: Temotu Province
0
2
4
6
8
10
12
14
Mini hospital under 2hours
Mini hospital 2-4 hours Mini hospital most of theday
Referral hospital under 2hours
Referral hospital 2-4hours
Referral hospital most ofthe day
Av
era
ge
nu
mb
er
of
focu
sg
rou
pre
sp
on
se
s
Average
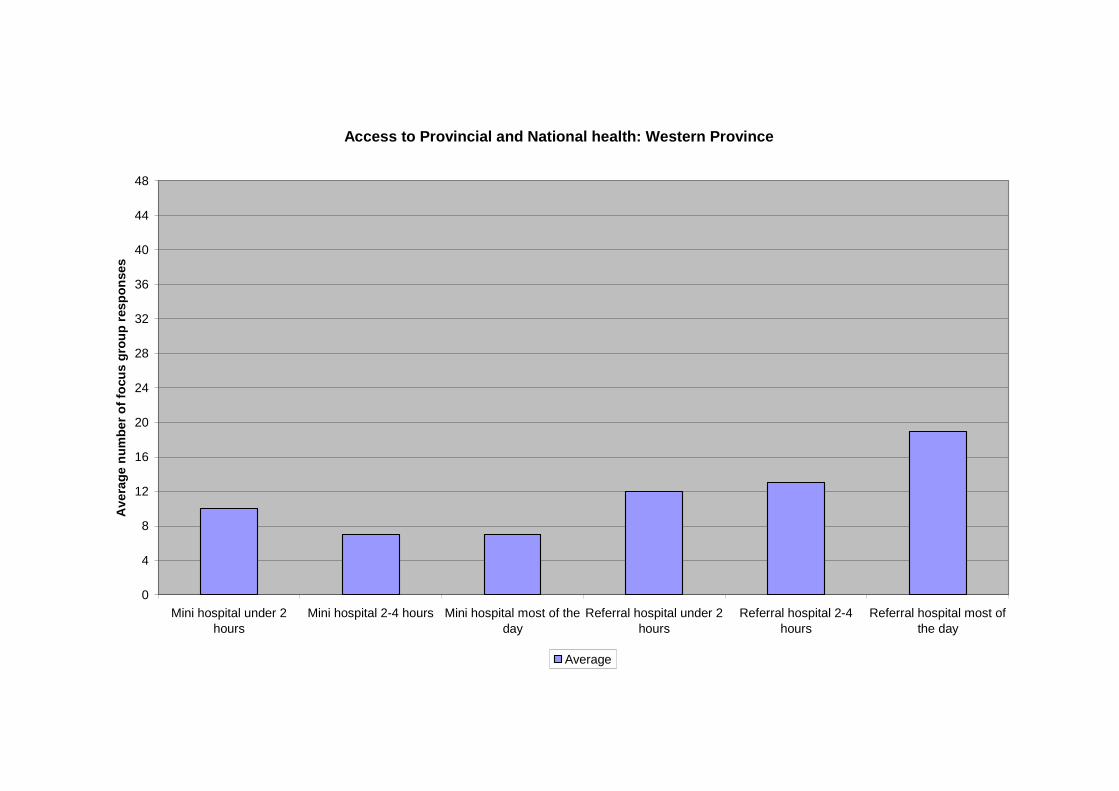
Access to Provincial and National health: Western Province
0
4
8
12
16
20
24
28
32
36
40
44
48
Mini hospital under 2hours
Mini hospital 2-4 hours Mini hospital most of theday
Referral hospital under 2hours
Referral hospital 2-4hours
Referral hospital most ofthe day
Av
era
ge
nu
mb
er
of
focu
sg
rou
pre
sp
on
se
s
Average
Chart P19: Access to health services: outer provinces: women’s groups perspective
Analysis:
As chart P18 shows, access to increasingly more sophisticated medical care, beyond rural and
area health centres, declines markedly with distance and the time taken to reach medical care.
Access under 2 hours: Access to aid posts for women in the surveyed communities of the
outer provinces is limited. Only in Central Province do women from the major of the villages
surveyed have access to aid posts in under 2 hours. In Isabel, 50 percent of responses from
women’s groups in communities surveyed stated that they could access area health under 2
hours. In Western Province, 25 percent of women’s groups in communities surveyed could
access area health centres in under 2 hours.
Between 2 and 4 hours: For most communities surveyed, except for those in Isabel and
Western Provinces, access to area health centres is between 2 and 4 hours and most of the
day. People living in the communities that can access higher levels of medical care between
2 and 4 hours must walk to health clinics and this makes the issue of access serious especially
if the patient is very young or very elderly.
Most of the day: Higher levels of health care, such as mini hospitals and the referral hospital
beyond the area health centre, can only be accessed after travelling for most of the day. The
fact that most mini hospitals are located in provincial centres means that this trend should be
expected. As the only referral hospital is located in Honiara this response can also be
expected for communities surveyed in the outer provinces. Tabulated responses are:
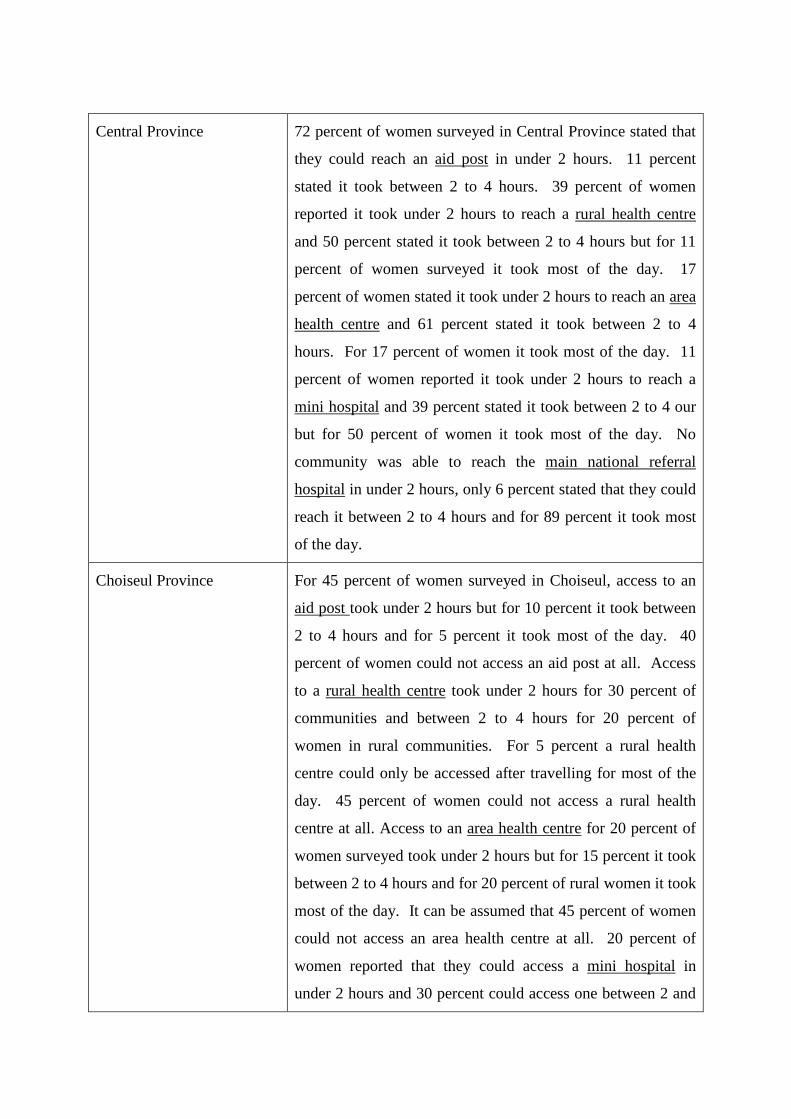
Central Province 72 percent of women surveyed in Central Province stated that
they could reach an aid post in under 2 hours. 11 percent
stated it took between 2 to 4 hours. 39 percent of women
reported it took under 2 hours to reach a rural health centre
and 50 percent stated it took between 2 to 4 hours but for 11
percent of women surveyed it took most of the day. 17
percent of women stated it took under 2 hours to reach an area
health centre and 61 percent stated it took between 2 to 4
hours. For 17 percent of women it took most of the day. 11
percent of women reported it took under 2 hours to reach a
mini hospital and 39 percent stated it took between 2 to 4 our
but for 50 percent of women it took most of the day. No
community was able to reach the main national referral
hospital in under 2 hours, only 6 percent stated that they could
reach it between 2 to 4 hours and for 89 percent it took most
of the day.
Choiseul Province For 45 percent of women surveyed in Choiseul, access to an
aid post took under 2 hours but for 10 percent it took between
2 to 4 hours and for 5 percent it took most of the day. 40
percent of women could not access an aid post at all. Access
to a rural health centre took under 2 hours for 30 percent of
communities and between 2 to 4 hours for 20 percent of
women in rural communities. For 5 percent a rural health
centre could only be accessed after travelling for most of the
day. 45 percent of women could not access a rural health
centre at all. Access to an area health centre for 20 percent of
women surveyed took under 2 hours but for 15 percent it took
between 2 to 4 hours and for 20 percent of rural women it took
most of the day. It can be assumed that 45 percent of women
could not access an area health centre at all. 20 percent of
women reported that they could access a mini hospital in
under 2 hours and 30 percent could access one between 2 and
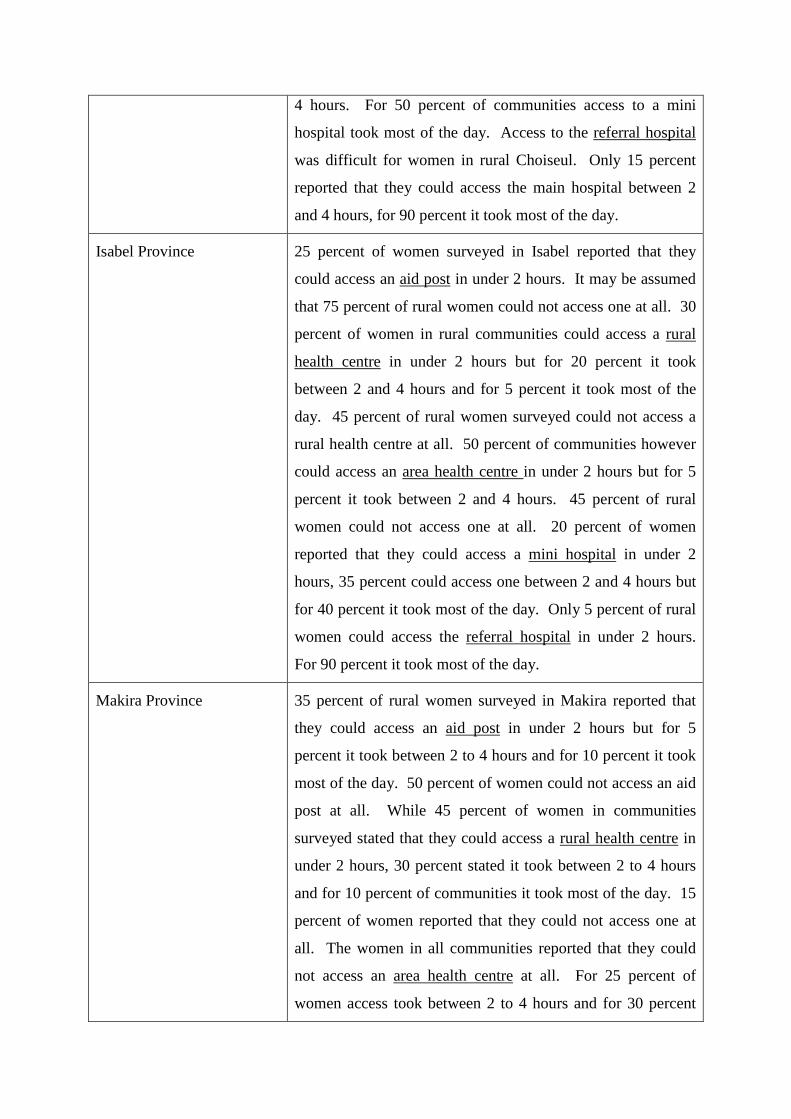
4 hours. For 50 percent of communities access to a mini
hospital took most of the day. Access to the referral hospital
was difficult for women in rural Choiseul. Only 15 percent
reported that they could access the main hospital between 2
and 4 hours, for 90 percent it took most of the day.
Isabel Province 25 percent of women surveyed in Isabel reported that they
could access an aid post in under 2 hours. It may be assumed
that 75 percent of rural women could not access one at all. 30
percent of women in rural communities could access a rural
health centre in under 2 hours but for 20 percent it took
between 2 and 4 hours and for 5 percent it took most of the
day. 45 percent of rural women surveyed could not access a
rural health centre at all. 50 percent of communities however
could access an area health centre in under 2 hours but for 5
percent it took between 2 and 4 hours. 45 percent of rural
women could not access one at all. 20 percent of women
reported that they could access a mini hospital in under 2
hours, 35 percent could access one between 2 and 4 hours but
for 40 percent it took most of the day. Only 5 percent of rural
women could access the referral hospital in under 2 hours.
For 90 percent it took most of the day.
Makira Province 35 percent of rural women surveyed in Makira reported that
they could access an aid post in under 2 hours but for 5
percent it took between 2 to 4 hours and for 10 percent it took
most of the day. 50 percent of women could not access an aid
post at all. While 45 percent of women in communities
surveyed stated that they could access a rural health centre in
under 2 hours, 30 percent stated it took between 2 to 4 hours
and for 10 percent of communities it took most of the day. 15
percent of women reported that they could not access one at
all. The women in all communities reported that they could
not access an area health centre at all. For 25 percent of
women access took between 2 to 4 hours and for 30 percent
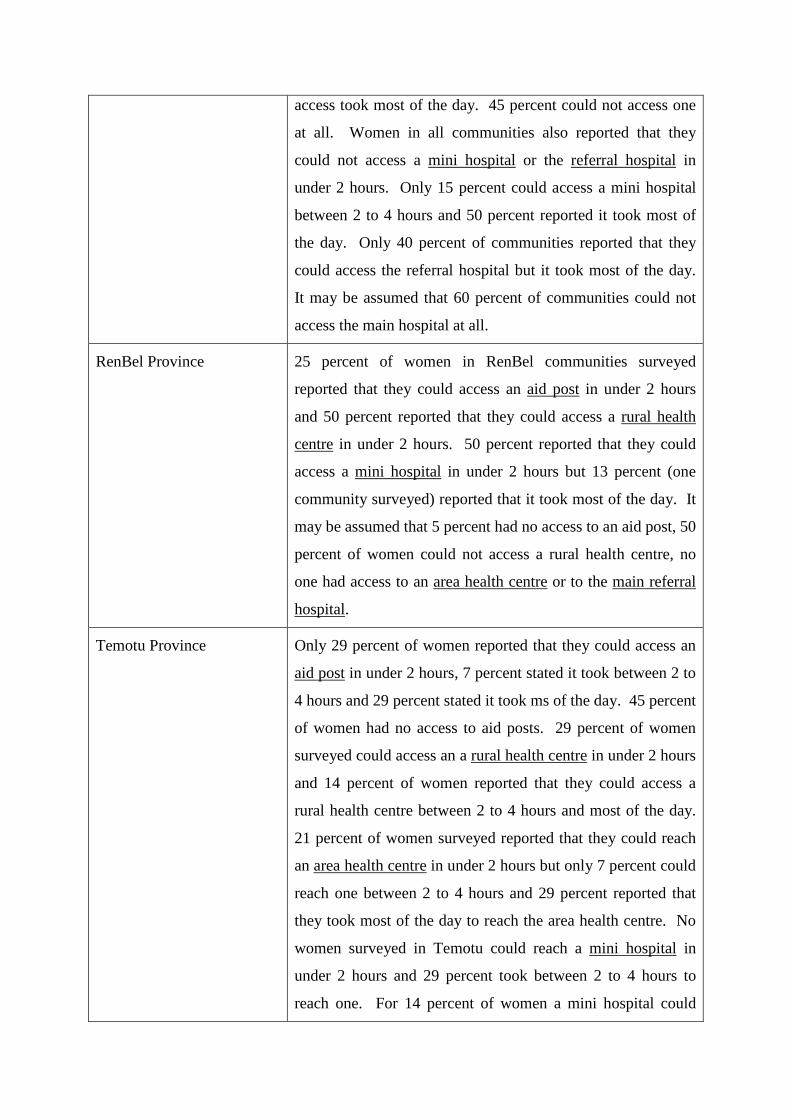
access took most of the day. 45 percent could not access one
at all. Women in all communities also reported that they
could not access a mini hospital or the referral hospital in
under 2 hours. Only 15 percent could access a mini hospital
between 2 to 4 hours and 50 percent reported it took most of
the day. Only 40 percent of communities reported that they
could access the referral hospital but it took most of the day.
It may be assumed that 60 percent of communities could not
access the main hospital at all.
RenBel Province 25 percent of women in RenBel communities surveyed
reported that they could access an aid post in under 2 hours
and 50 percent reported that they could access a rural health
centre in under 2 hours. 50 percent reported that they could
access a mini hospital in under 2 hours but 13 percent (one
community surveyed) reported that it took most of the day. It
may be assumed that 5 percent had no access to an aid post, 50
percent of women could not access a rural health centre, no
one had access to an area health centre or to the main referral
hospital.
Temotu Province Only 29 percent of women reported that they could access an
aid post in under 2 hours, 7 percent stated it took between 2 to
4 hours and 29 percent stated it took ms of the day. 45 percent
of women had no access to aid posts. 29 percent of women
surveyed could access an a rural health centre in under 2 hours
and 14 percent of women reported that they could access a
rural health centre between 2 to 4 hours and most of the day.
21 percent of women surveyed reported that they could reach
an area health centre in under 2 hours but only 7 percent could
reach one between 2 to 4 hours and 29 percent reported that
they took most of the day to reach the area health centre. No
women surveyed in Temotu could reach a mini hospital in
under 2 hours and 29 percent took between 2 to 4 hours to
reach one. For 14 percent of women a mini hospital could
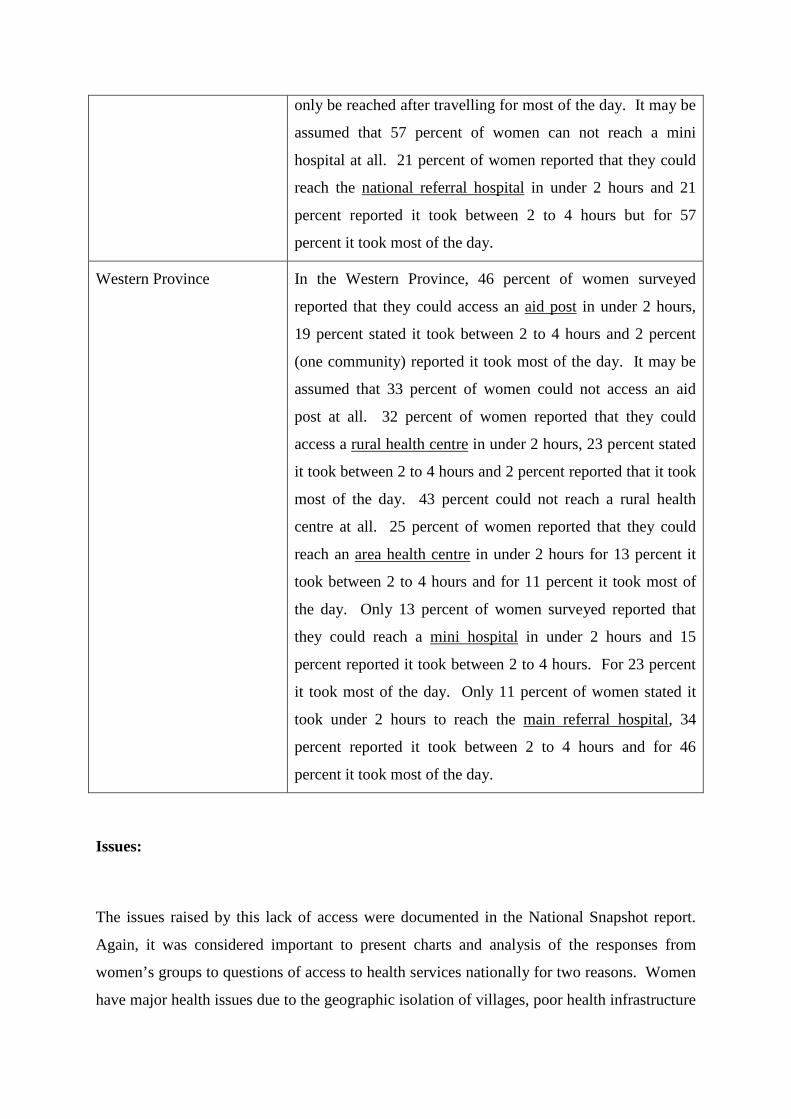
only be reached after travelling for most of the day. It may be
assumed that 57 percent of women can not reach a mini
hospital at all. 21 percent of women reported that they could
reach the national referral hospital in under 2 hours and 21
percent reported it took between 2 to 4 hours but for 57
percent it took most of the day.
Western Province In the Western Province, 46 percent of women surveyed
reported that they could access an aid post in under 2 hours,
19 percent stated it took between 2 to 4 hours and 2 percent
(one community) reported it took most of the day. It may be
assumed that 33 percent of women could not access an aid
post at all. 32 percent of women reported that they could
access a rural health centre in under 2 hours, 23 percent stated
it took between 2 to 4 hours and 2 percent reported that it took
most of the day. 43 percent could not reach a rural health
centre at all. 25 percent of women reported that they could
reach an area health centre in under 2 hours for 13 percent it
took between 2 to 4 hours and for 11 percent it took most of
the day. Only 13 percent of women surveyed reported that
they could reach a mini hospital in under 2 hours and 15
percent reported it took between 2 to 4 hours. For 23 percent
it took most of the day. Only 11 percent of women stated it
took under 2 hours to reach the main referral hospital, 34
percent reported it took between 2 to 4 hours and for 46
percent it took most of the day.
Issues:
The issues raised by this lack of access were documented in the National Snapshot report.
Again, it was considered important to present charts and analysis of the responses from
women’s groups to questions of access to health services nationally for two reasons. Women
have major health issues due to the geographic isolation of villages, poor health infrastructure
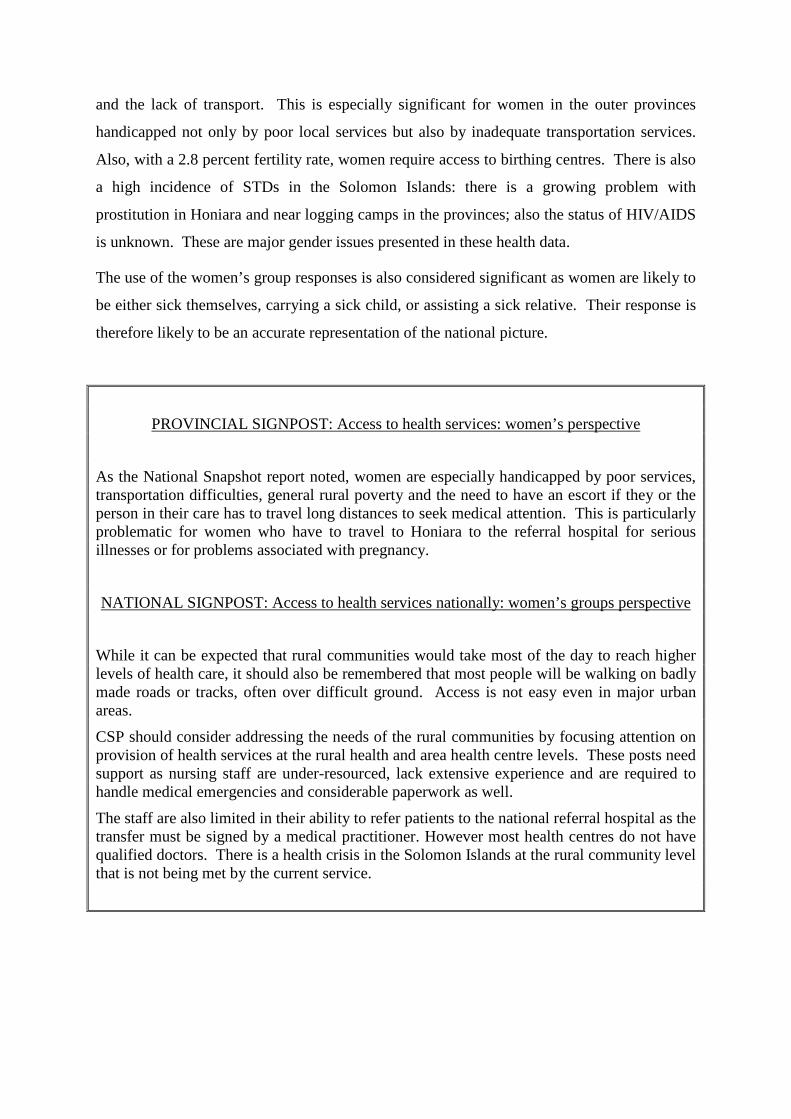
and the lack of transport. This is especially significant for women in the outer provinces
handicapped not only by poor local services but also by inadequate transportation services.
Also, with a 2.8 percent fertility rate, women require access to birthing centres. There is also
a high incidence of STDs in the Solomon Islands: there is a growing problem with
prostitution in Honiara and near logging camps in the provinces; also the status of HIV/AIDS
is unknown. These are major gender issues presented in these health data.
The use of the women’s group responses is also considered significant as women are likely to
be either sick themselves, carrying a sick child, or assisting a sick relative. Their response is
therefore likely to be an accurate representation of the national picture.
PROVINCIAL SIGNPOST: Access to health services: women’s perspective
As the National Snapshot report noted, women are especially handicapped by poor services,transportation difficulties, general rural poverty and the need to have an escort if they or theperson in their care has to travel long distances to seek medical attention. This is particularlyproblematic for women who have to travel to Honiara to the referral hospital for seriousillnesses or for problems associated with pregnancy.
NATIONAL SIGNPOST: Access to health services nationally: women’s groups perspective
While it can be expected that rural communities would take most of the day to reach higherlevels of health care, it should also be remembered that most people will be walking on badlymade roads or tracks, often over difficult ground. Access is not easy even in major urbanareas.
CSP should consider addressing the needs of the rural communities by focusing attention onprovision of health services at the rural health and area health centre levels. These posts needsupport as nursing staff are under-resourced, lack extensive experience and are required tohandle medical emergencies and considerable paperwork as well.
The staff are also limited in their ability to refer patients to the national referral hospital as thetransfer must be signed by a medical practitioner. However most health centres do not havequalified doctors. There is a health crisis in the Solomon Islands at the rural community levelthat is not being met by the current service.
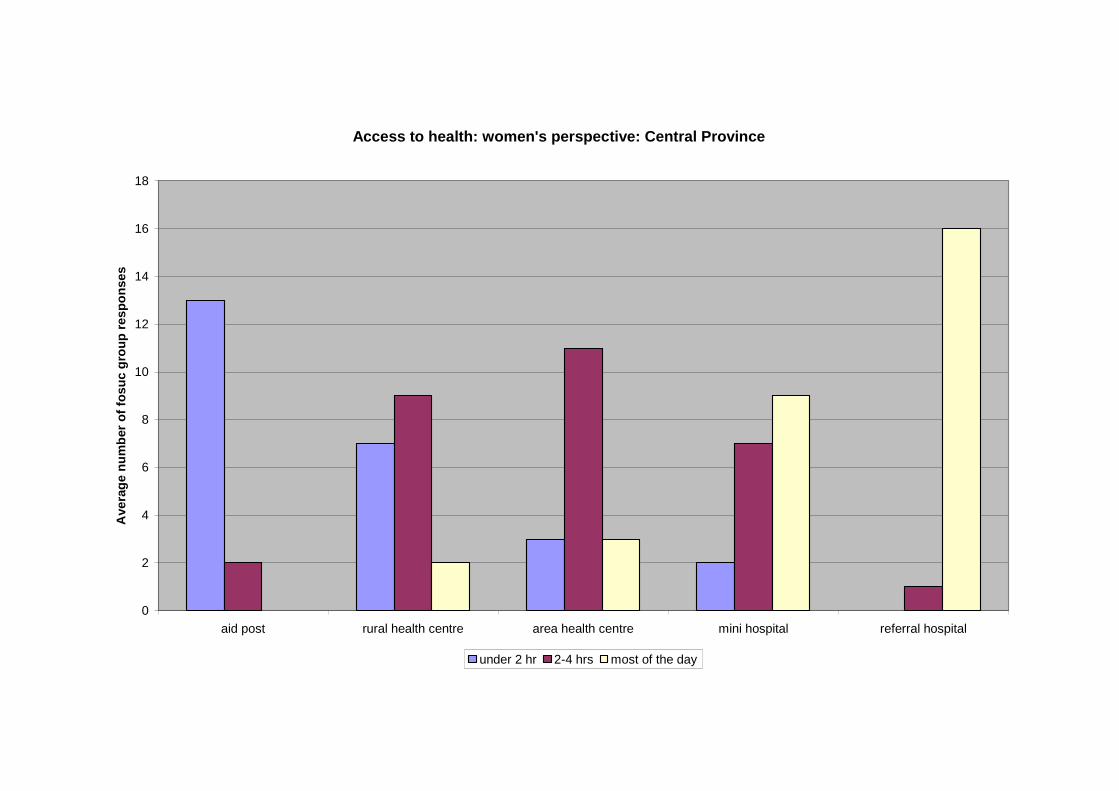
Access to health: women's perspective: Central Province
0
2
4
6
8
10
12
14
16
18
aid post rural health centre area health centre mini hospital referral hospital
Ave
rag
en
um
ber
of
fos
uc
gro
up
res
po
ns
es
under 2 hr 2-4 hrs most of the day
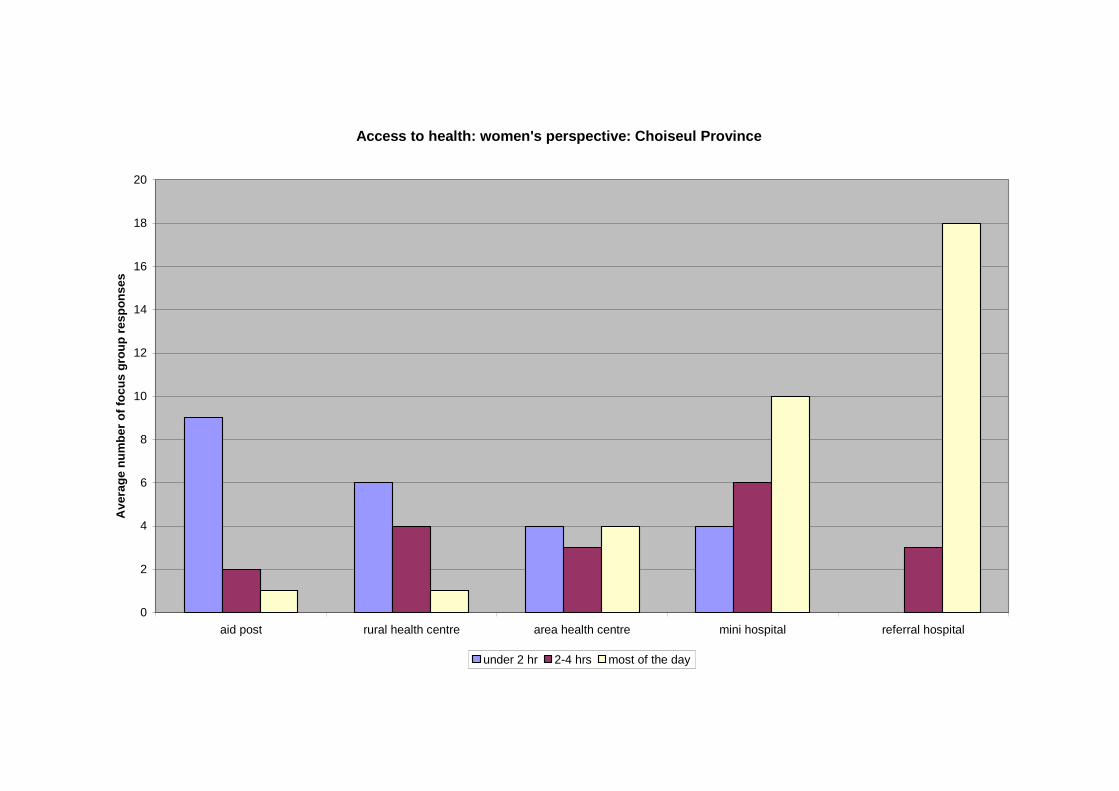
Access to health: women's perspective: Choiseul Province
0
2
4
6
8
10
12
14
16
18
20
aid post rural health centre area health centre mini hospital referral hospital
Av
era
ge
nu
mb
er
of
foc
us
gro
up
res
po
ns
es
under 2 hr 2-4 hrs most of the day
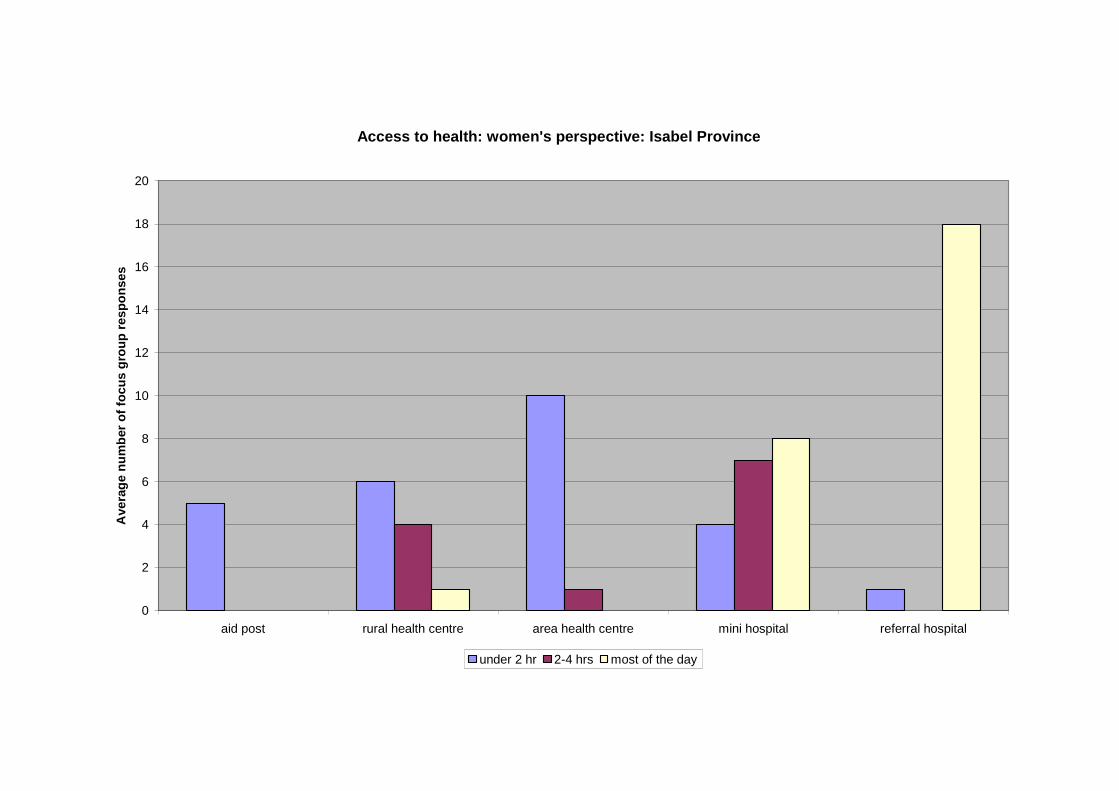
Access to health: women's perspective: Isabel Province
0
2
4
6
8
10
12
14
16
18
20
aid post rural health centre area health centre mini hospital referral hospital
Ave
rag
en
um
ber
of
foc
us
gro
up
res
po
ns
es
under 2 hr 2-4 hrs most of the day
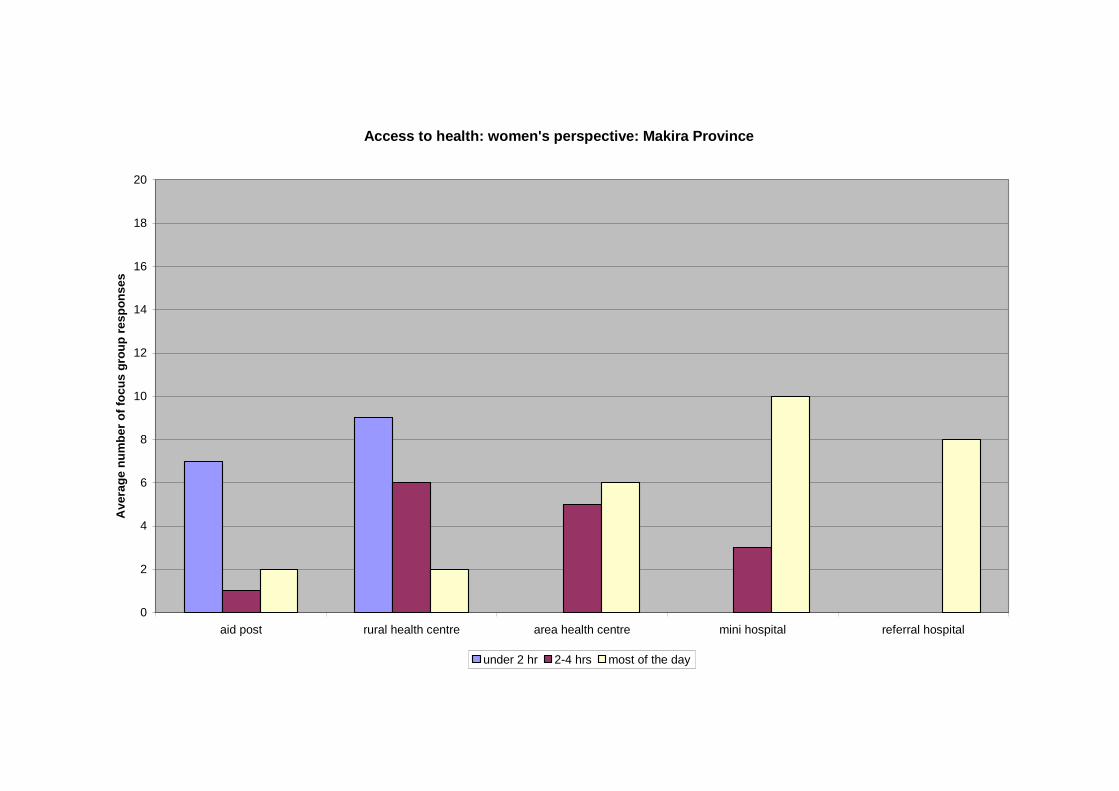
Access to health: women's perspective: Makira Province
0
2
4
6
8
10
12
14
16
18
20
aid post rural health centre area health centre mini hospital referral hospital
Av
era
ge
nu
mb
er
of
foc
us
gro
up
res
po
ns
es
under 2 hr 2-4 hrs most of the day
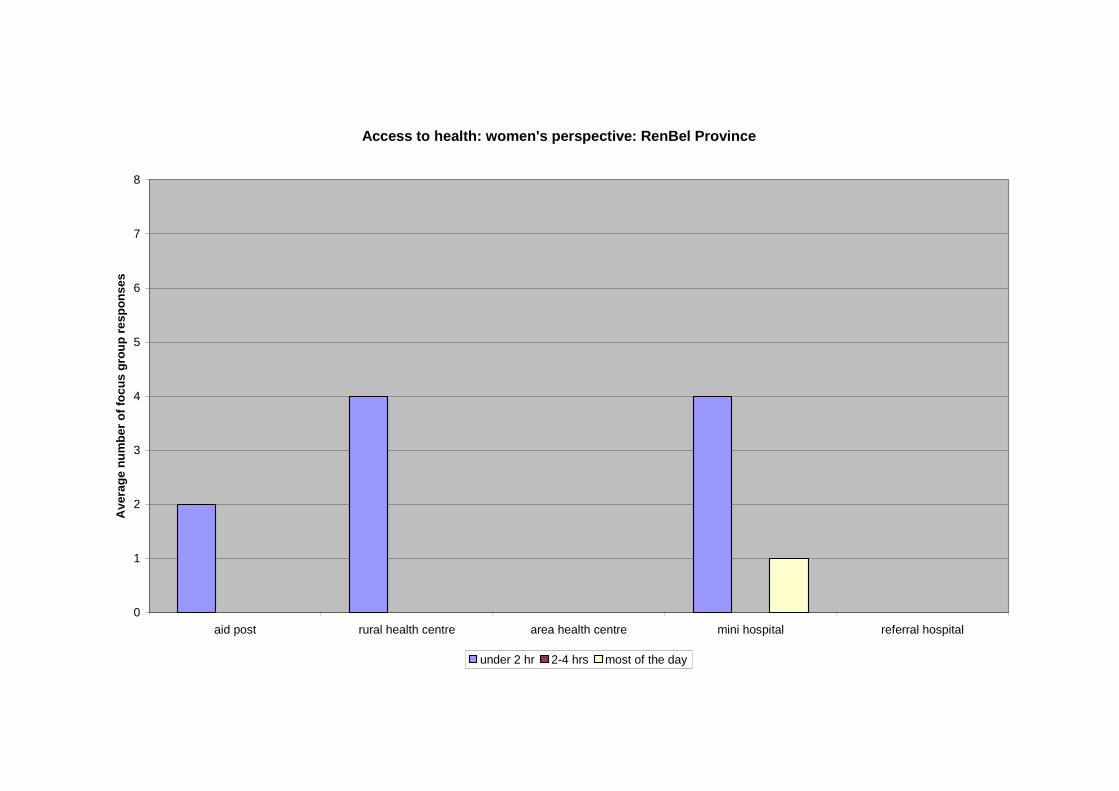
Access to health: women's perspective: RenBel Province
0
1
2
3
4
5
6
7
8
aid post rural health centre area health centre mini hospital referral hospital
Av
era
ge
nu
mb
er
of
foc
us
gro
up
res
po
ns
es
under 2 hr 2-4 hrs most of the day
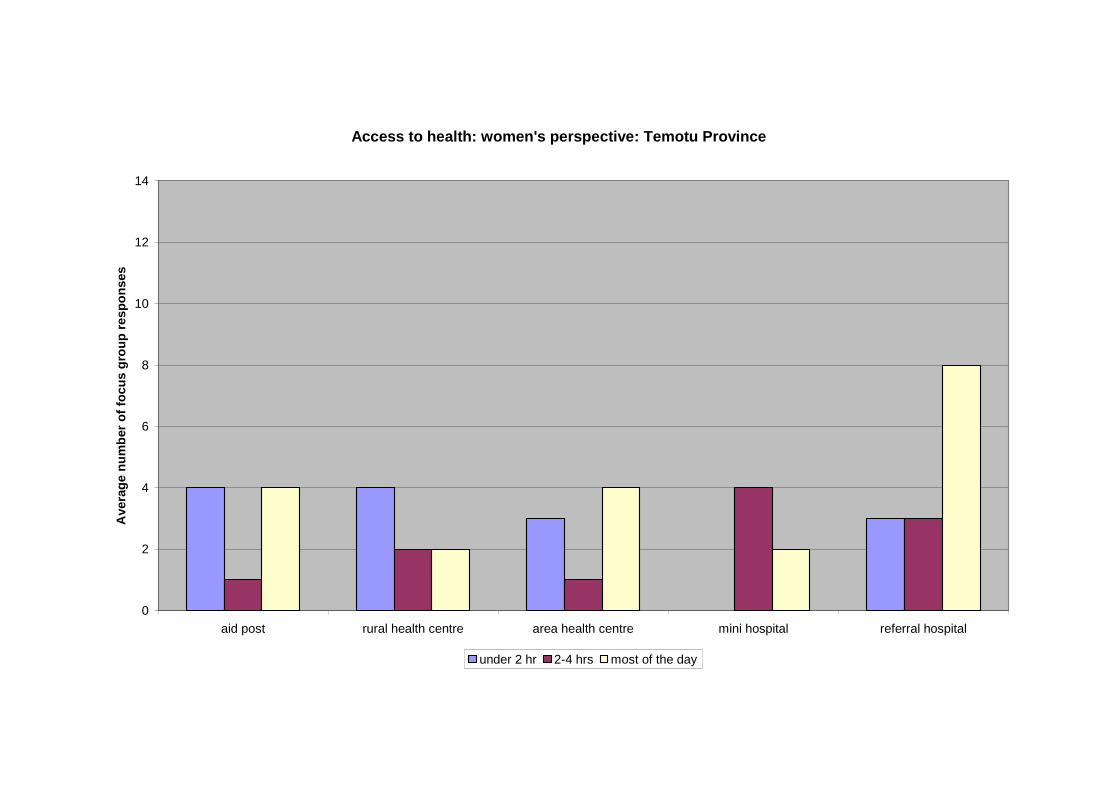
Access to health: women's perspective: Temotu Province
0
2
4
6
8
10
12
14
aid post rural health centre area health centre mini hospital referral hospital
Ave
rag
en
um
ber
of
foc
us
gro
up
res
po
ns
es
under 2 hr 2-4 hrs most of the day
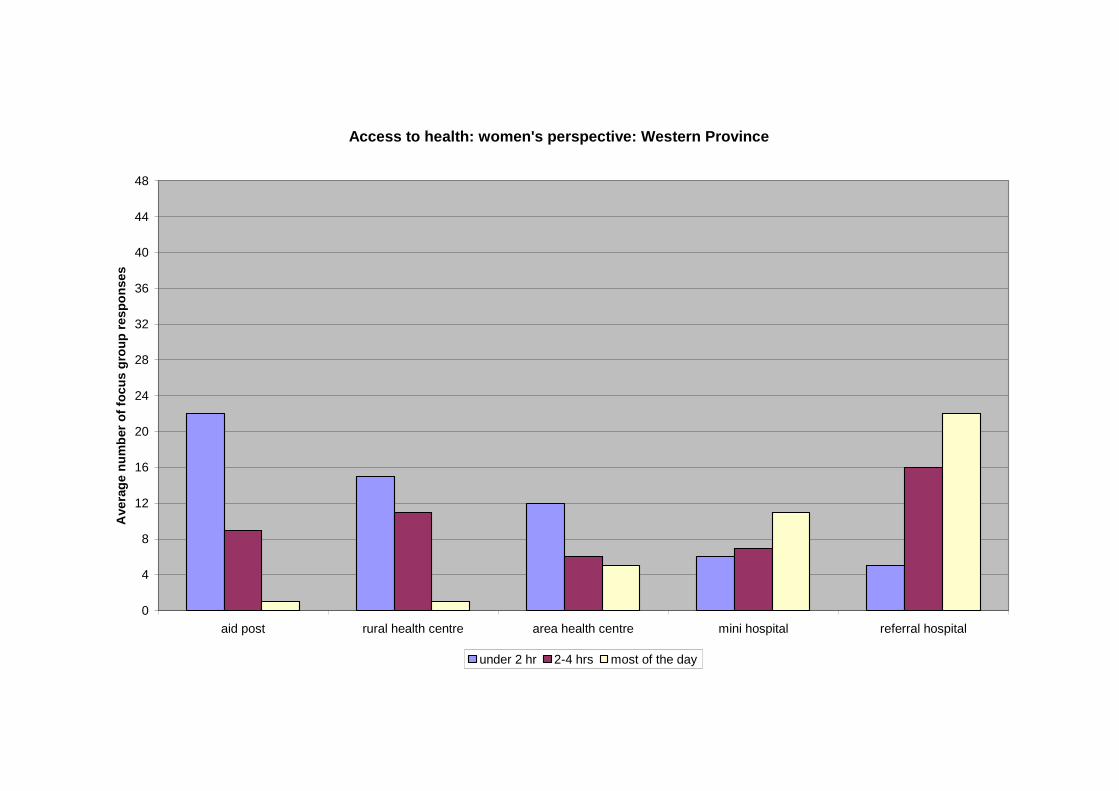
Access to health: women's perspective: Western Province
0
4
8
12
16
20
24
28
32
36
40
44
48
aid post rural health centre area health centre mini hospital referral hospital
Ave
rag
en
um
ber
of
foc
us
gro
up
res
po
ns
es
under 2 hr 2-4 hrs most of the day
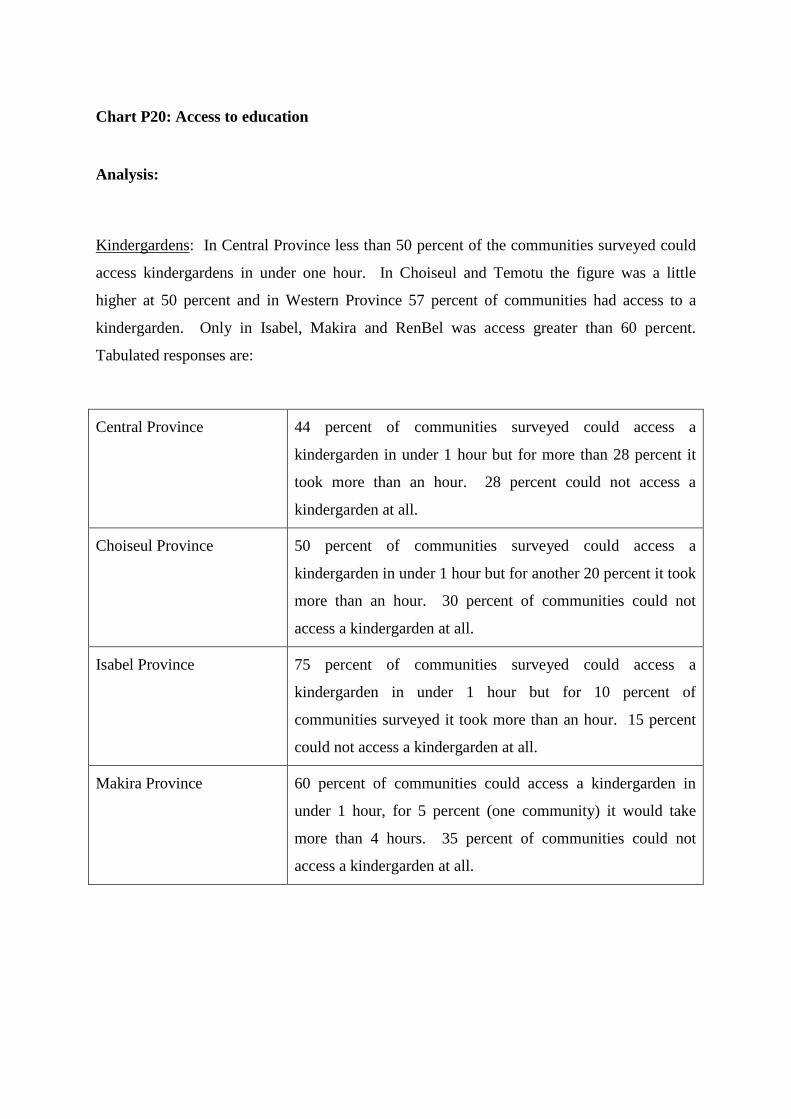
Chart P20: Access to education
Analysis:
Kindergardens: In Central Province less than 50 percent of the communities surveyed could
access kindergardens in under one hour. In Choiseul and Temotu the figure was a little
higher at 50 percent and in Western Province 57 percent of communities had access to a
kindergarden. Only in Isabel, Makira and RenBel was access greater than 60 percent.
Tabulated responses are:
Central Province 44 percent of communities surveyed could access a
kindergarden in under 1 hour but for more than 28 percent it
took more than an hour. 28 percent could not access a
kindergarden at all.
Choiseul Province 50 percent of communities surveyed could access a
kindergarden in under 1 hour but for another 20 percent it took
more than an hour. 30 percent of communities could not
access a kindergarden at all.
Isabel Province 75 percent of communities surveyed could access a
kindergarden in under 1 hour but for 10 percent of
communities surveyed it took more than an hour. 15 percent
could not access a kindergarden at all.
Makira Province 60 percent of communities could access a kindergarden in
under 1 hour, for 5 percent (one community) it would take
more than 4 hours. 35 percent of communities could not
access a kindergarden at all.
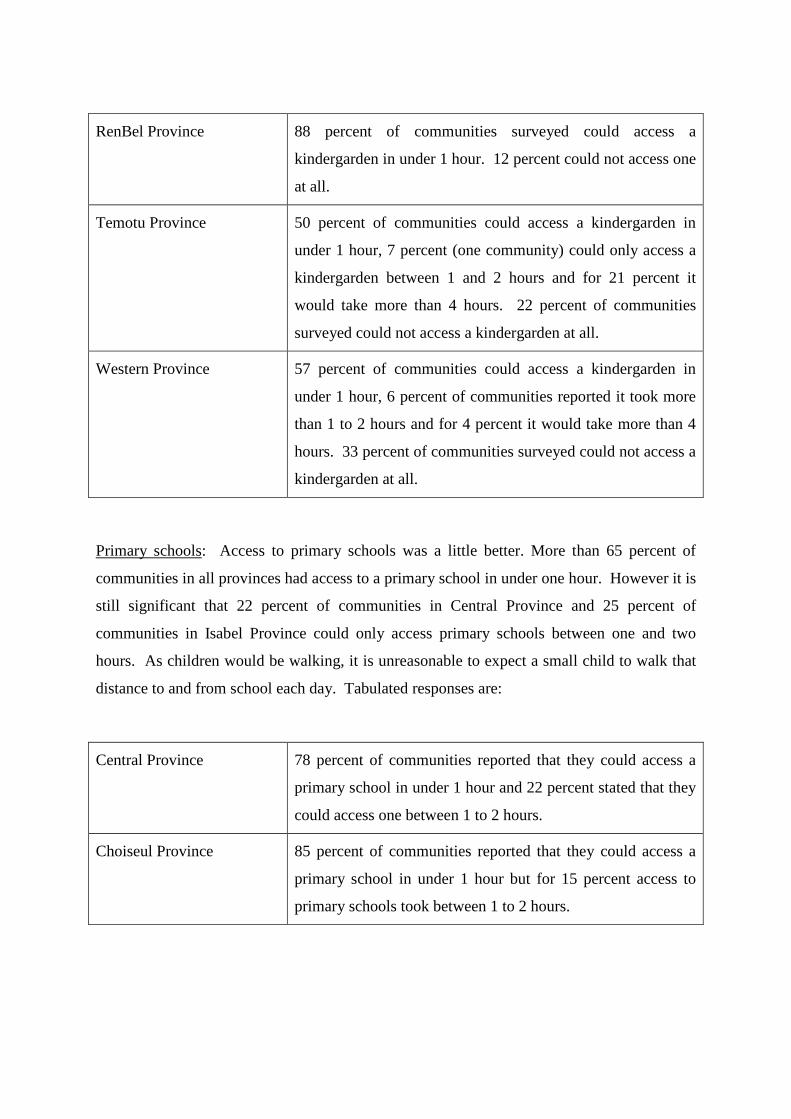
RenBel Province 88 percent of communities surveyed could access a
kindergarden in under 1 hour. 12 percent could not access one
at all.
Temotu Province 50 percent of communities could access a kindergarden in
under 1 hour, 7 percent (one community) could only access a
kindergarden between 1 and 2 hours and for 21 percent it
would take more than 4 hours. 22 percent of communities
surveyed could not access a kindergarden at all.
Western Province 57 percent of communities could access a kindergarden in
under 1 hour, 6 percent of communities reported it took more
than 1 to 2 hours and for 4 percent it would take more than 4
hours. 33 percent of communities surveyed could not access a
kindergarden at all.
Primary schools: Access to primary schools was a little better. More than 65 percent of
communities in all provinces had access to a primary school in under one hour. However it is
still significant that 22 percent of communities in Central Province and 25 percent of
communities in Isabel Province could only access primary schools between one and two
hours. As children would be walking, it is unreasonable to expect a small child to walk that
distance to and from school each day. Tabulated responses are:
Central Province 78 percent of communities reported that they could access a
primary school in under 1 hour and 22 percent stated that they
could access one between 1 to 2 hours.
Choiseul Province 85 percent of communities reported that they could access a
primary school in under 1 hour but for 15 percent access to
primary schools took between 1 to 2 hours.
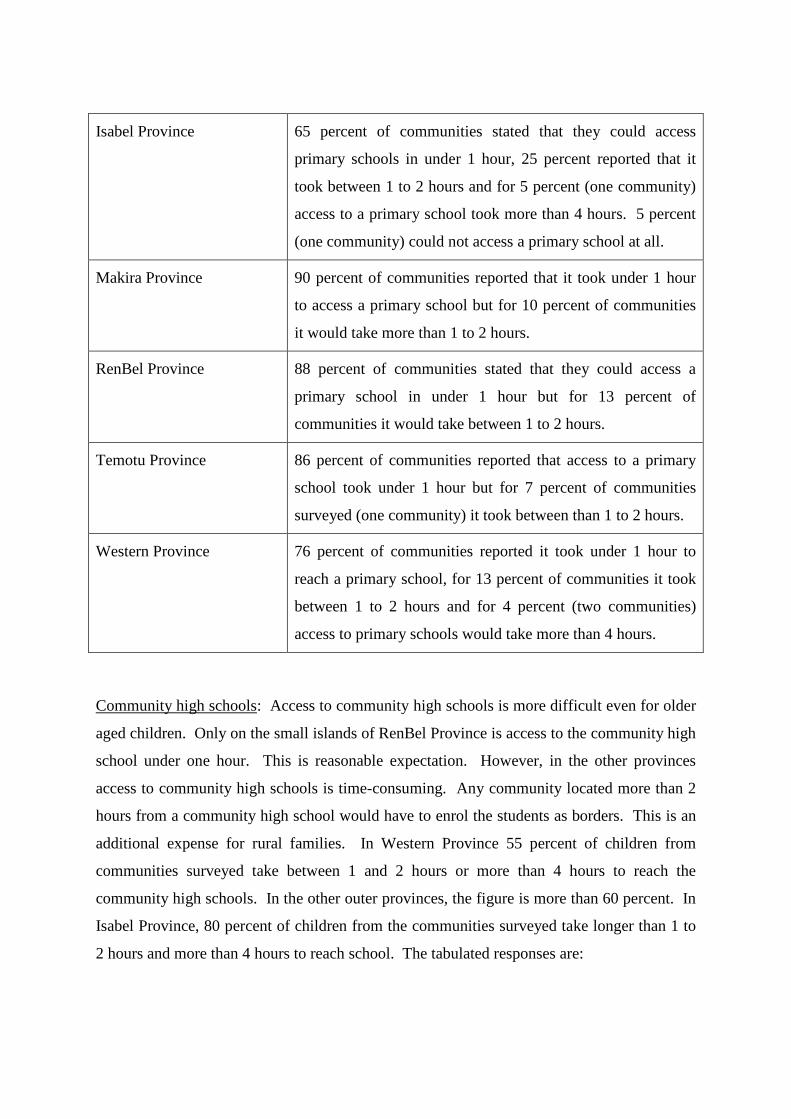
Isabel Province 65 percent of communities stated that they could access
primary schools in under 1 hour, 25 percent reported that it
took between 1 to 2 hours and for 5 percent (one community)
access to a primary school took more than 4 hours. 5 percent
(one community) could not access a primary school at all.
Makira Province 90 percent of communities reported that it took under 1 hour
to access a primary school but for 10 percent of communities
it would take more than 1 to 2 hours.
RenBel Province 88 percent of communities stated that they could access a
primary school in under 1 hour but for 13 percent of
communities it would take between 1 to 2 hours.
Temotu Province 86 percent of communities reported that access to a primary
school took under 1 hour but for 7 percent of communities
surveyed (one community) it took between than 1 to 2 hours.
Western Province 76 percent of communities reported it took under 1 hour to
reach a primary school, for 13 percent of communities it took
between 1 to 2 hours and for 4 percent (two communities)
access to primary schools would take more than 4 hours.
Community high schools: Access to community high schools is more difficult even for older
aged children. Only on the small islands of RenBel Province is access to the community high
school under one hour. This is reasonable expectation. However, in the other provinces
access to community high schools is time-consuming. Any community located more than 2
hours from a community high school would have to enrol the students as borders. This is an
additional expense for rural families. In Western Province 55 percent of children from
communities surveyed take between 1 and 2 hours or more than 4 hours to reach the
community high schools. In the other outer provinces, the figure is more than 60 percent. In
Isabel Province, 80 percent of children from the communities surveyed take longer than 1 to
2 hours and more than 4 hours to reach school. The tabulated responses are:
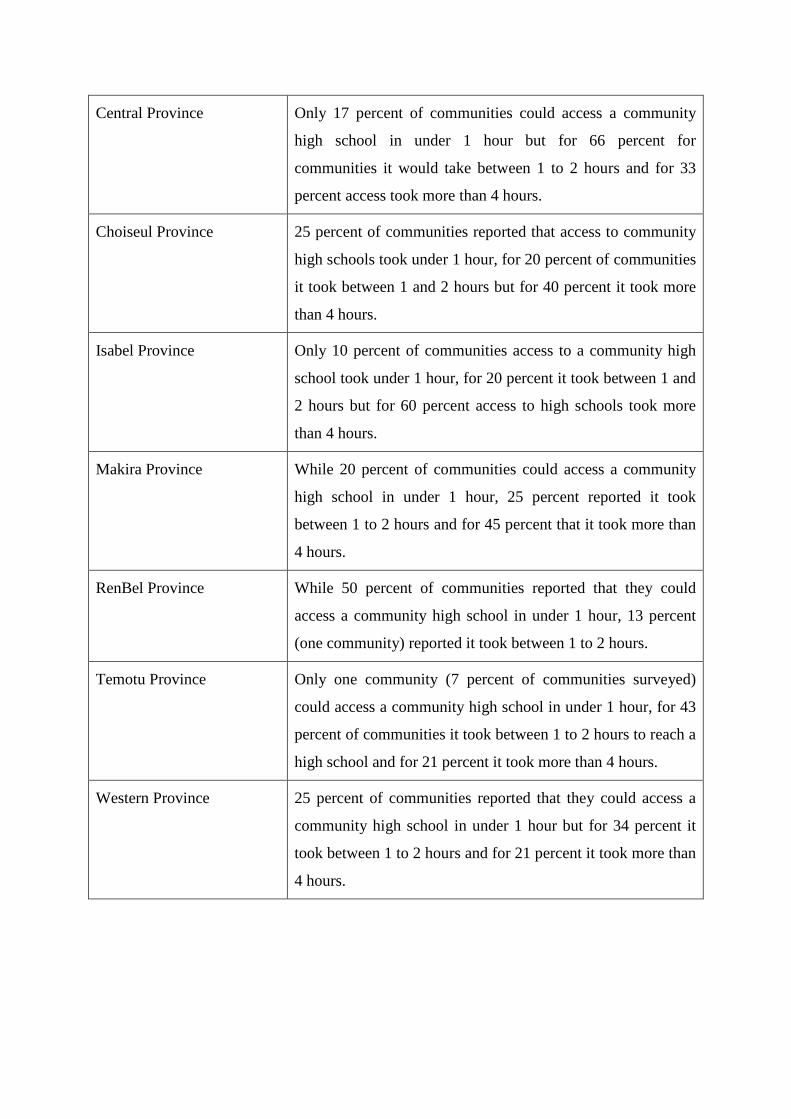
Central Province Only 17 percent of communities could access a community
high school in under 1 hour but for 66 percent for
communities it would take between 1 to 2 hours and for 33
percent access took more than 4 hours.
Choiseul Province 25 percent of communities reported that access to community
high schools took under 1 hour, for 20 percent of communities
it took between 1 and 2 hours but for 40 percent it took more
than 4 hours.
Isabel Province Only 10 percent of communities access to a community high
school took under 1 hour, for 20 percent it took between 1 and
2 hours but for 60 percent access to high schools took more
than 4 hours.
Makira Province While 20 percent of communities could access a community
high school in under 1 hour, 25 percent reported it took
between 1 to 2 hours and for 45 percent that it took more than
4 hours.
RenBel Province While 50 percent of communities reported that they could
access a community high school in under 1 hour, 13 percent
(one community) reported it took between 1 to 2 hours.
Temotu Province Only one community (7 percent of communities surveyed)
could access a community high school in under 1 hour, for 43
percent of communities it took between 1 to 2 hours to reach a
high school and for 21 percent it took more than 4 hours.
Western Province 25 percent of communities reported that they could access a
community high school in under 1 hour but for 34 percent it
took between 1 to 2 hours and for 21 percent it took more than
4 hours.
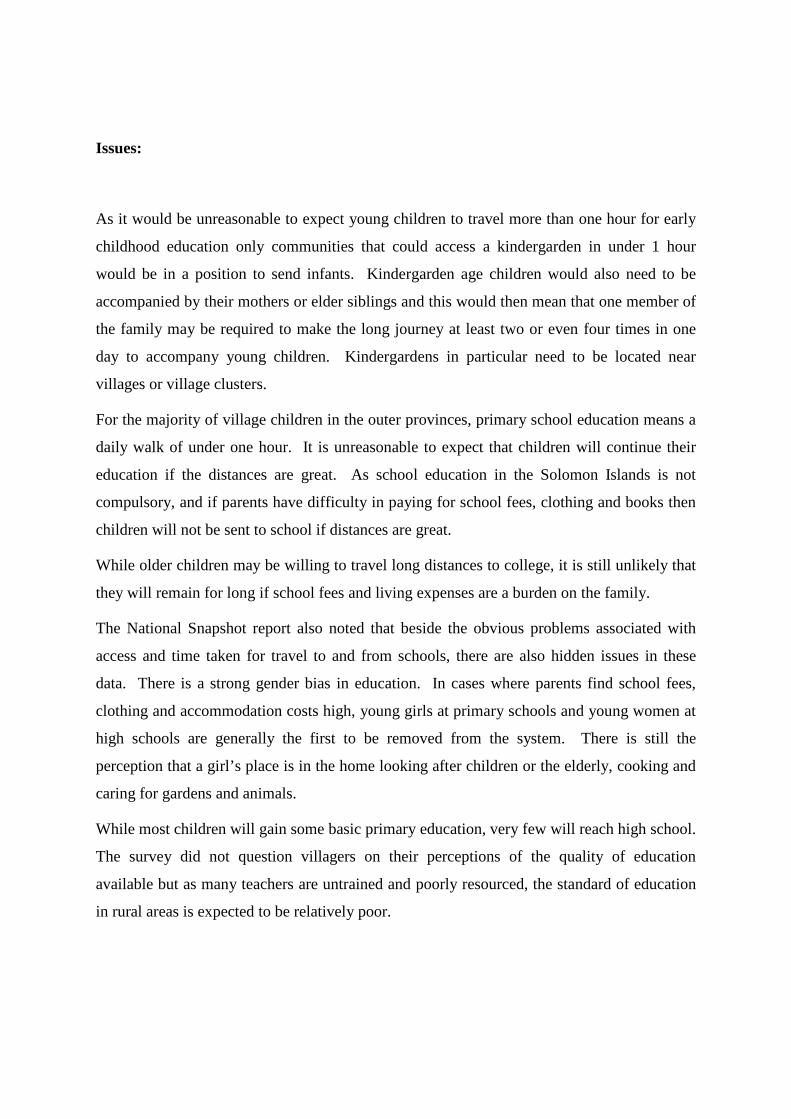
Issues:
As it would be unreasonable to expect young children to travel more than one hour for early
childhood education only communities that could access a kindergarden in under 1 hour
would be in a position to send infants. Kindergarden age children would also need to be
accompanied by their mothers or elder siblings and this would then mean that one member of
the family may be required to make the long journey at least two or even four times in one
day to accompany young children. Kindergardens in particular need to be located near
villages or village clusters.
For the majority of village children in the outer provinces, primary school education means a
daily walk of under one hour. It is unreasonable to expect that children will continue their
education if the distances are great. As school education in the Solomon Islands is not
compulsory, and if parents have difficulty in paying for school fees, clothing and books then
children will not be sent to school if distances are great.
While older children may be willing to travel long distances to college, it is still unlikely that
they will remain for long if school fees and living expenses are a burden on the family.
The National Snapshot report also noted that beside the obvious problems associated with
access and time taken for travel to and from schools, there are also hidden issues in these
data. There is a strong gender bias in education. In cases where parents find school fees,
clothing and accommodation costs high, young girls at primary schools and young women at
high schools are generally the first to be removed from the system. There is still the
perception that a girl’s place is in the home looking after children or the elderly, cooking and
caring for gardens and animals.
While most children will gain some basic primary education, very few will reach high school.
The survey did not question villagers on their perceptions of the quality of education
available but as many teachers are untrained and poorly resourced, the standard of education
in rural areas is expected to be relatively poor.
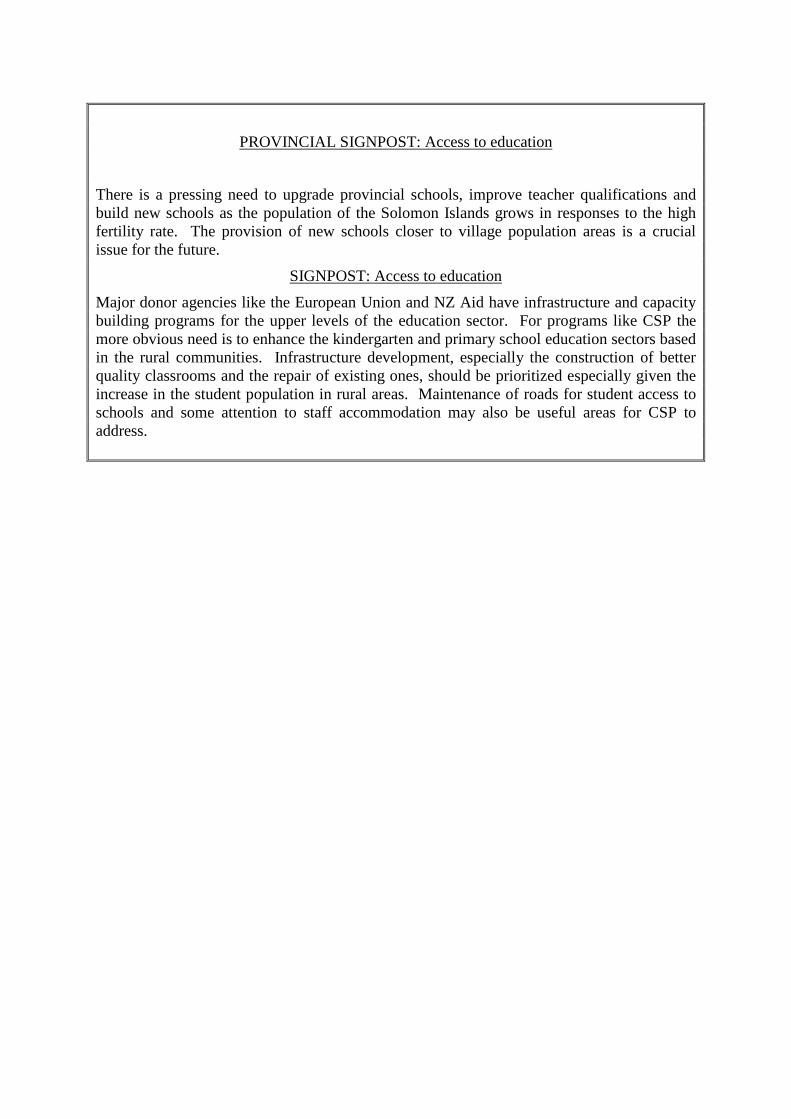
PROVINCIAL SIGNPOST: Access to education
There is a pressing need to upgrade provincial schools, improve teacher qualifications andbuild new schools as the population of the Solomon Islands grows in responses to the highfertility rate. The provision of new schools closer to village population areas is a crucialissue for the future.
SIGNPOST: Access to education
Major donor agencies like the European Union and NZ Aid have infrastructure and capacitybuilding programs for the upper levels of the education sector. For programs like CSP themore obvious need is to enhance the kindergarten and primary school education sectors basedin the rural communities. Infrastructure development, especially the construction of betterquality classrooms and the repair of existing ones, should be prioritized especially given theincrease in the student population in rural areas. Maintenance of roads for student access toschools and some attention to staff accommodation may also be useful areas for CSP toaddress.
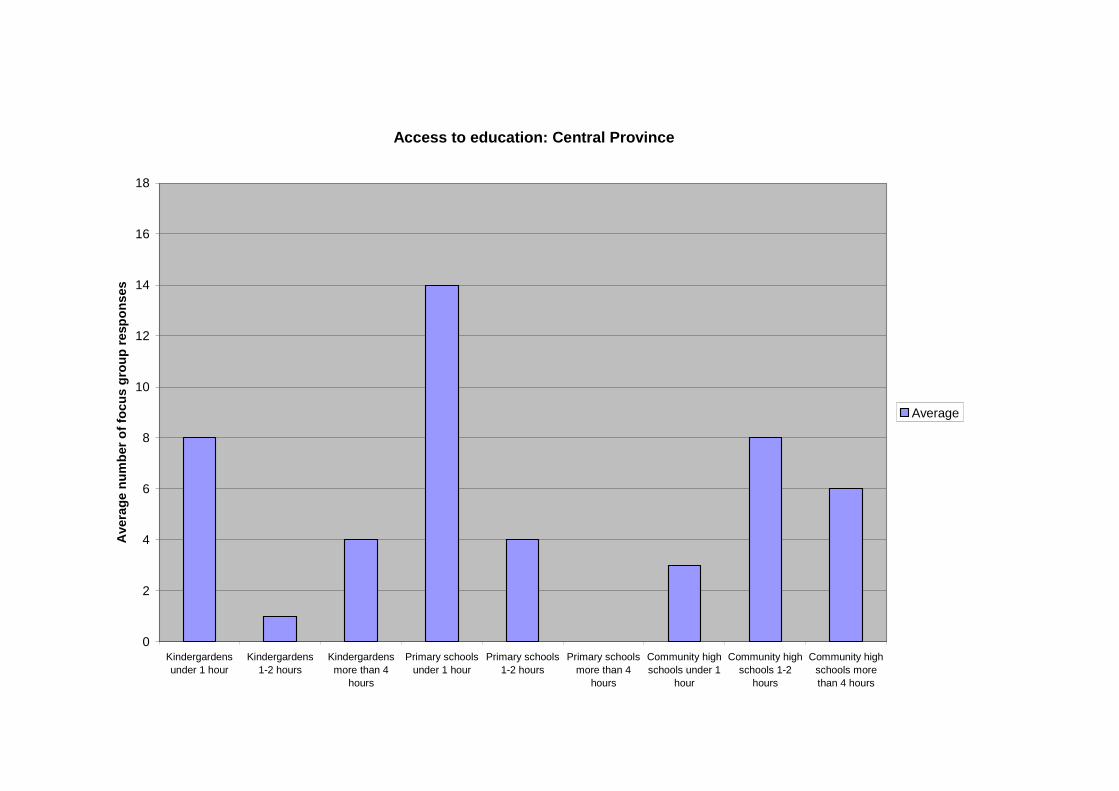
Access to education: Central Province
0
2
4
6
8
10
12
14
16
18
Kindergardens
under 1 hour
Kindergardens
1-2 hours
Kindergardens
more than 4
hours
Primary schools
under 1 hour
Primary schools
1-2 hours
Primary schools
more than 4
hours
Community high
schools under 1
hour
Community high
schools 1-2
hours
Community high
schools more
than 4 hours
Avera
ge
nu
mb
er
of
foc
us
gro
up
resp
on
ses
Average

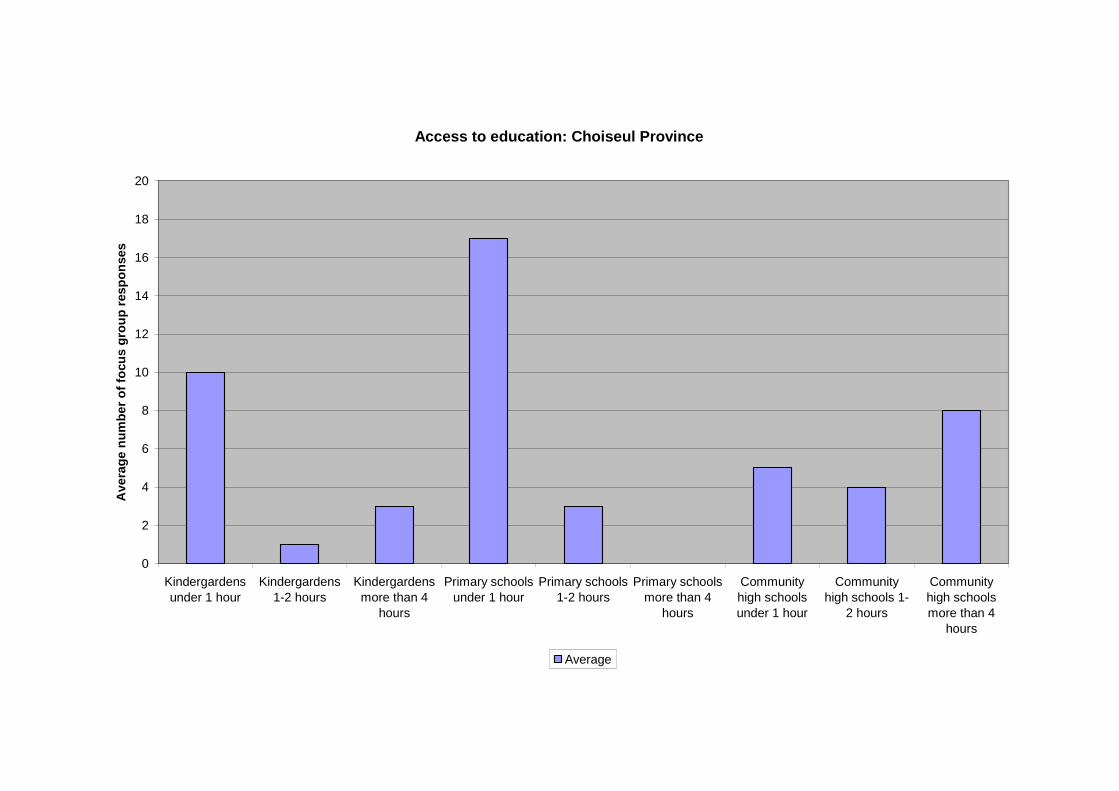
Access to education: Choiseul Province
0
2
4
6
8
10
12
14
16
18
20
Kindergardensunder 1 hour
Kindergardens1-2 hours
Kindergardensmore than 4
hours
Primary schoolsunder 1 hour
Primary schools1-2 hours
Primary schoolsmore than 4
hours
Communityhigh schoolsunder 1 hour
Communityhigh schools 1-
2 hours
Communityhigh schoolsmore than 4
hours
Av
era
ge
nu
mb
er
of
focu
sg
rou
pre
sp
on
se
s
Average
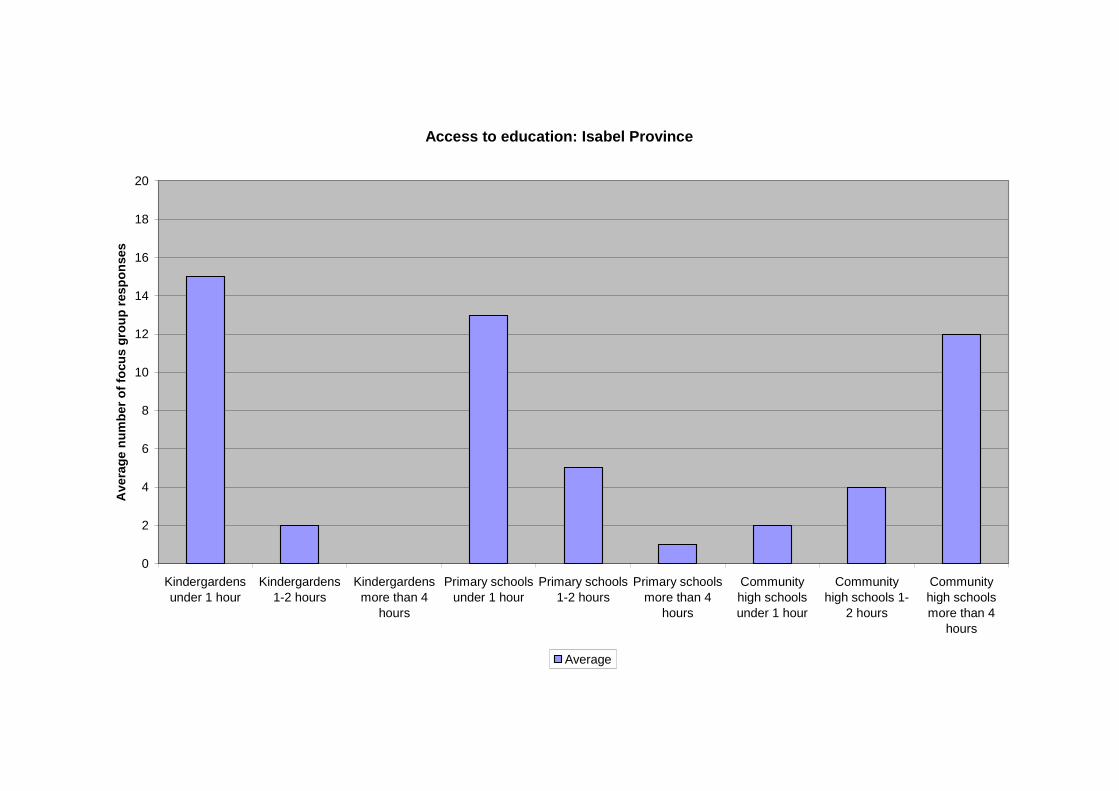
Access to education: Isabel Province
0
2
4
6
8
10
12
14
16
18
20
Kindergardensunder 1 hour
Kindergardens1-2 hours
Kindergardensmore than 4
hours
Primary schoolsunder 1 hour
Primary schools1-2 hours
Primary schoolsmore than 4
hours
Communityhigh schoolsunder 1 hour
Communityhigh schools 1-
2 hours
Communityhigh schoolsmore than 4
hours
Av
era
ge
nu
mb
er
of
focu
sg
rou
pre
sp
on
se
s
Average
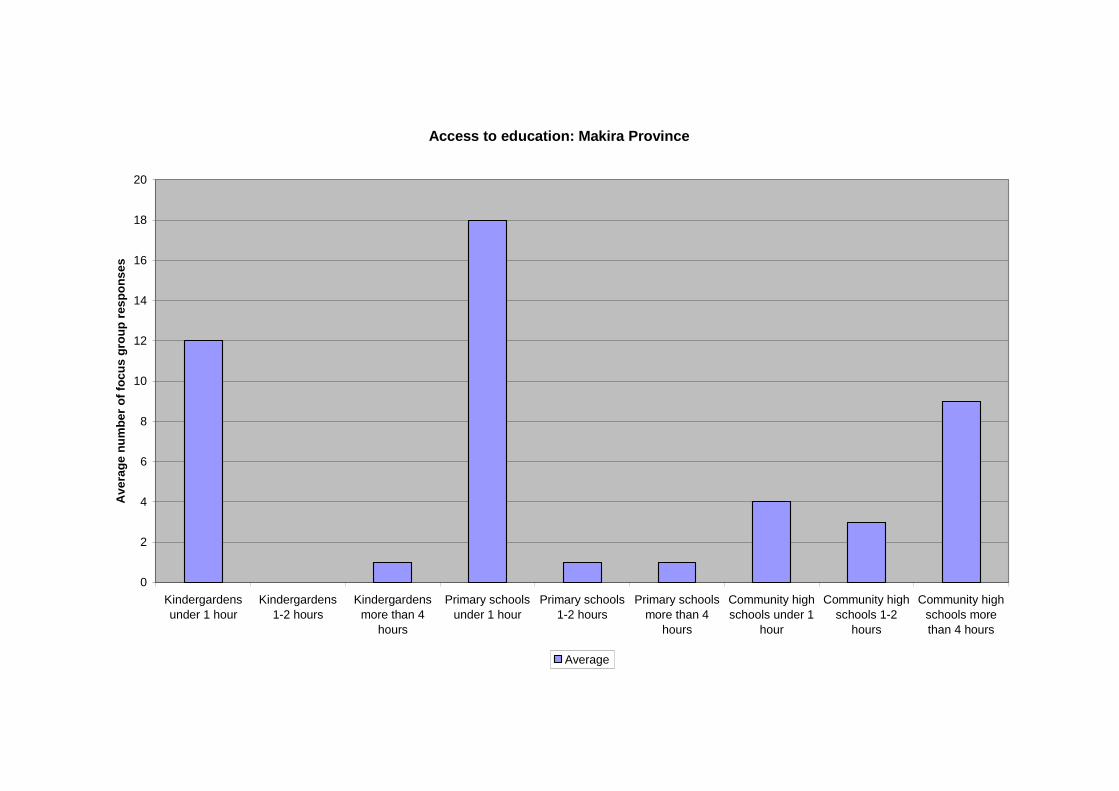
Access to education: Makira Province
0
2
4
6
8
10
12
14
16
18
20
Kindergardens
under 1 hour
Kindergardens
1-2 hours
Kindergardens
more than 4
hours
Primary schools
under 1 hour
Primary schools
1-2 hours
Primary schools
more than 4
hours
Community high
schools under 1
hour
Community high
schools 1-2
hours
Community high
schools more
than 4 hours
Av
era
ge
nu
mb
er
of
foc
us
gro
up
res
po
ns
es
Average
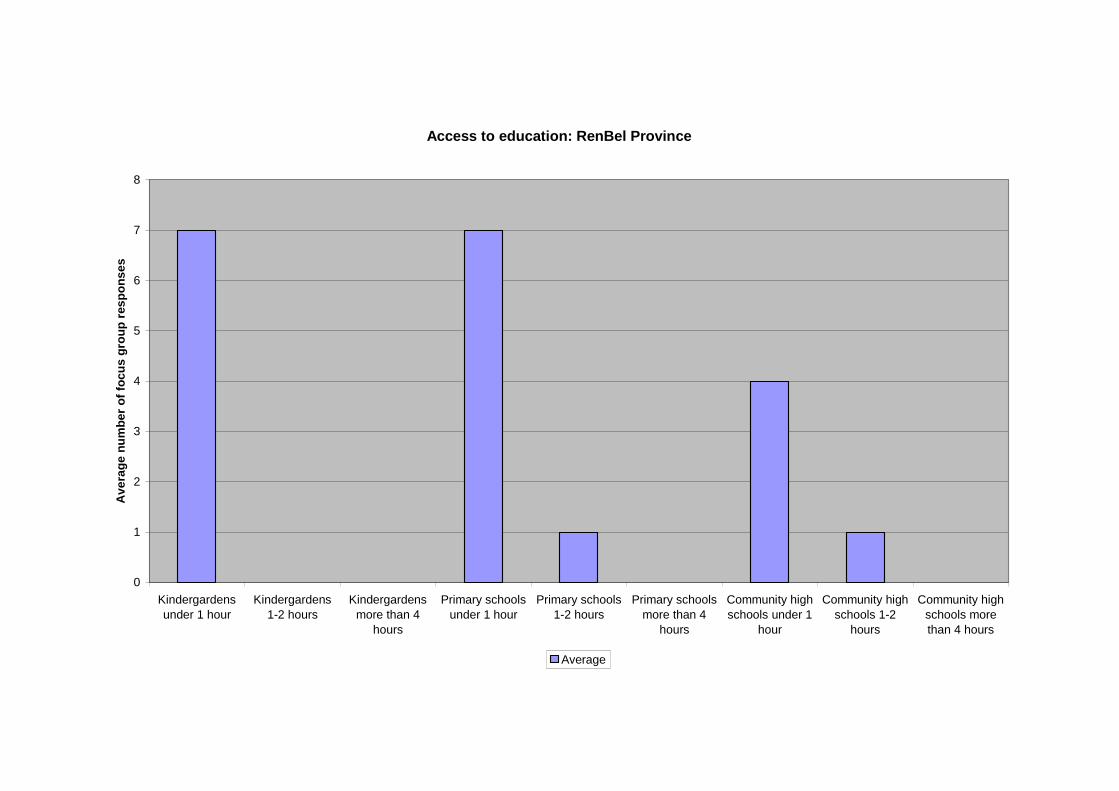
Access to education: RenBel Province
0
1
2
3
4
5
6
7
8
Kindergardens
under 1 hour
Kindergardens
1-2 hours
Kindergardens
more than 4
hours
Primary schools
under 1 hour
Primary schools
1-2 hours
Primary schools
more than 4
hours
Community high
schools under 1
hour
Community high
schools 1-2
hours
Community high
schools more
than 4 hours
Av
era
ge
nu
mb
er
of
foc
us
gro
up
res
po
ns
es
Average
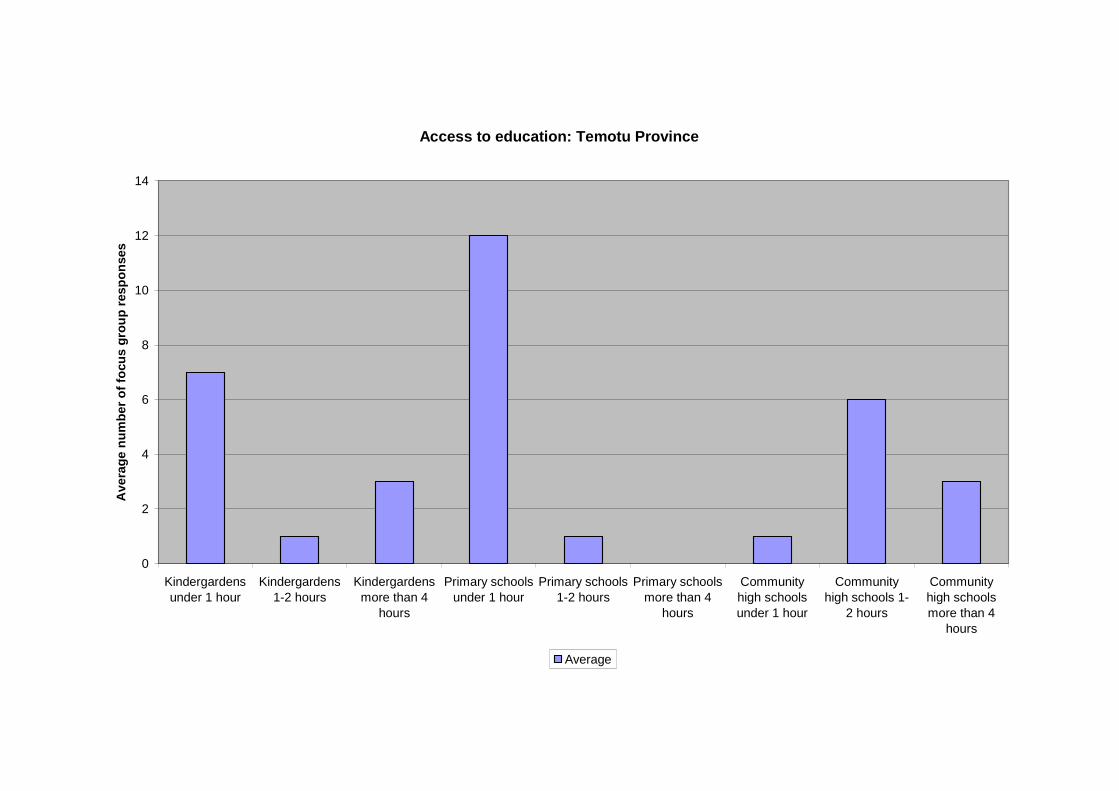
Access to education: Temotu Province
0
2
4
6
8
10
12
14
Kindergardensunder 1 hour
Kindergardens1-2 hours
Kindergardensmore than 4
hours
Primary schoolsunder 1 hour
Primary schools1-2 hours
Primary schoolsmore than 4
hours
Communityhigh schoolsunder 1 hour
Communityhigh schools 1-
2 hours
Communityhigh schoolsmore than 4
hours
Av
era
ge
nu
mb
er
of
focu
sg
rou
pre
sp
on
se
s
Average
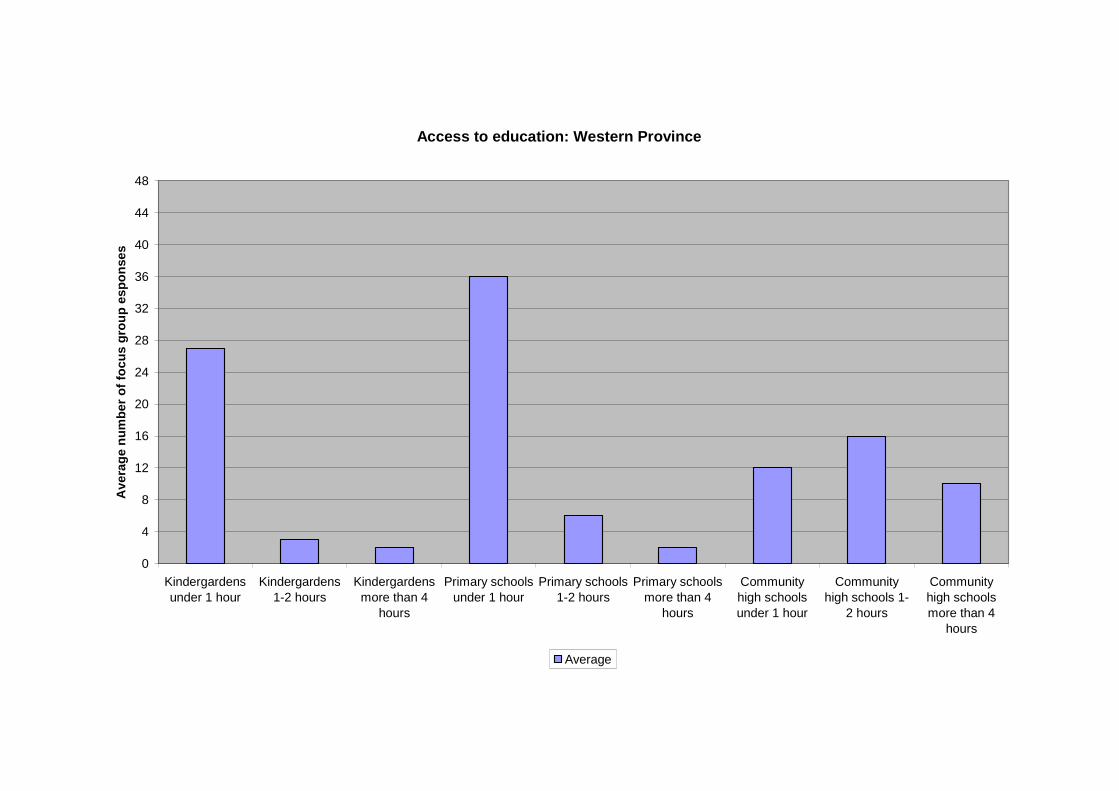
Access to education: Western Province
0
4
8
12
16
20
24
28
32
36
40
44
48
Kindergardensunder 1 hour
Kindergardens1-2 hours
Kindergardensmore than 4
hours
Primary schoolsunder 1 hour
Primary schools1-2 hours
Primary schoolsmore than 4
hours
Communityhigh schoolsunder 1 hour
Communityhigh schools 1-
2 hours
Communityhigh schoolsmore than 4
hours
Av
era
ge
nu
mb
er
of
foc
us
gro
up
es
po
nse
s
Average
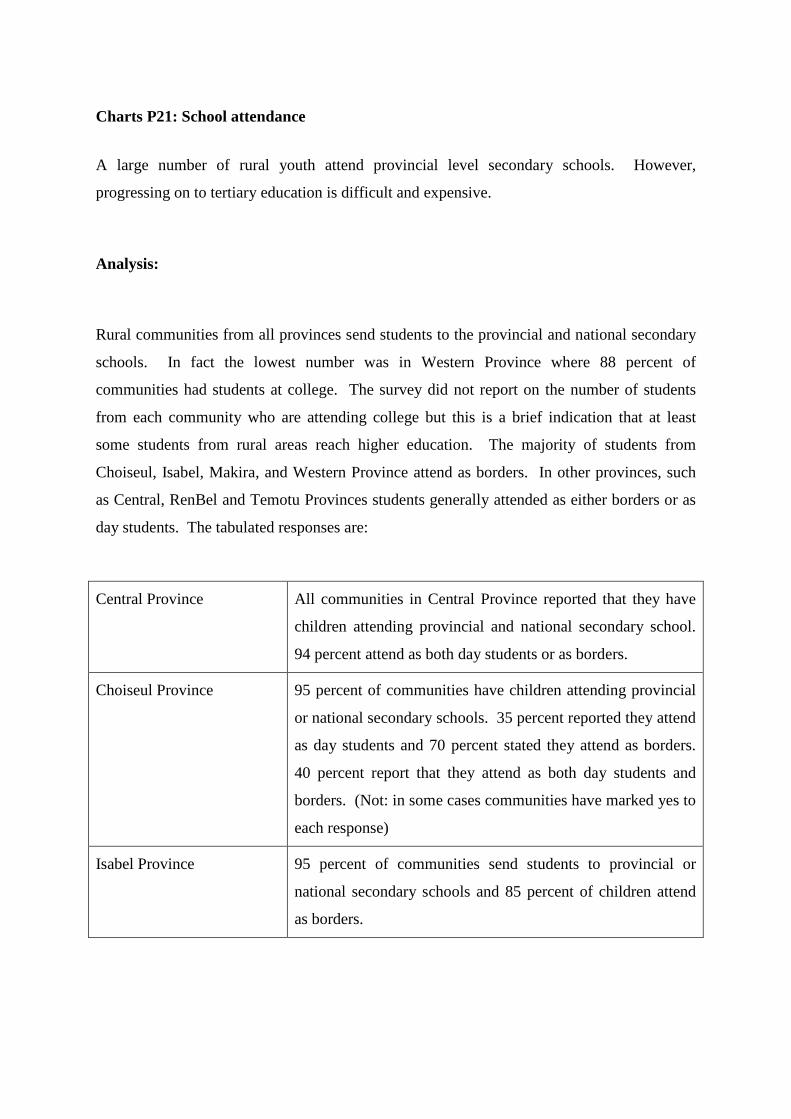
Charts P21: School attendance
A large number of rural youth attend provincial level secondary schools. However,
progressing on to tertiary education is difficult and expensive.
Analysis:
Rural communities from all provinces send students to the provincial and national secondary
schools. In fact the lowest number was in Western Province where 88 percent of
communities had students at college. The survey did not report on the number of students
from each community who are attending college but this is a brief indication that at least
some students from rural areas reach higher education. The majority of students from
Choiseul, Isabel, Makira, and Western Province attend as borders. In other provinces, such
as Central, RenBel and Temotu Provinces students generally attended as either borders or as
day students. The tabulated responses are:
Central Province All communities in Central Province reported that they have
children attending provincial and national secondary school.
94 percent attend as both day students or as borders.
Choiseul Province 95 percent of communities have children attending provincial
or national secondary schools. 35 percent reported they attend
as day students and 70 percent stated they attend as borders.
40 percent report that they attend as both day students and
borders. (Not: in some cases communities have marked yes to
each response)
Isabel Province 95 percent of communities send students to provincial or
national secondary schools and 85 percent of children attend
as borders.
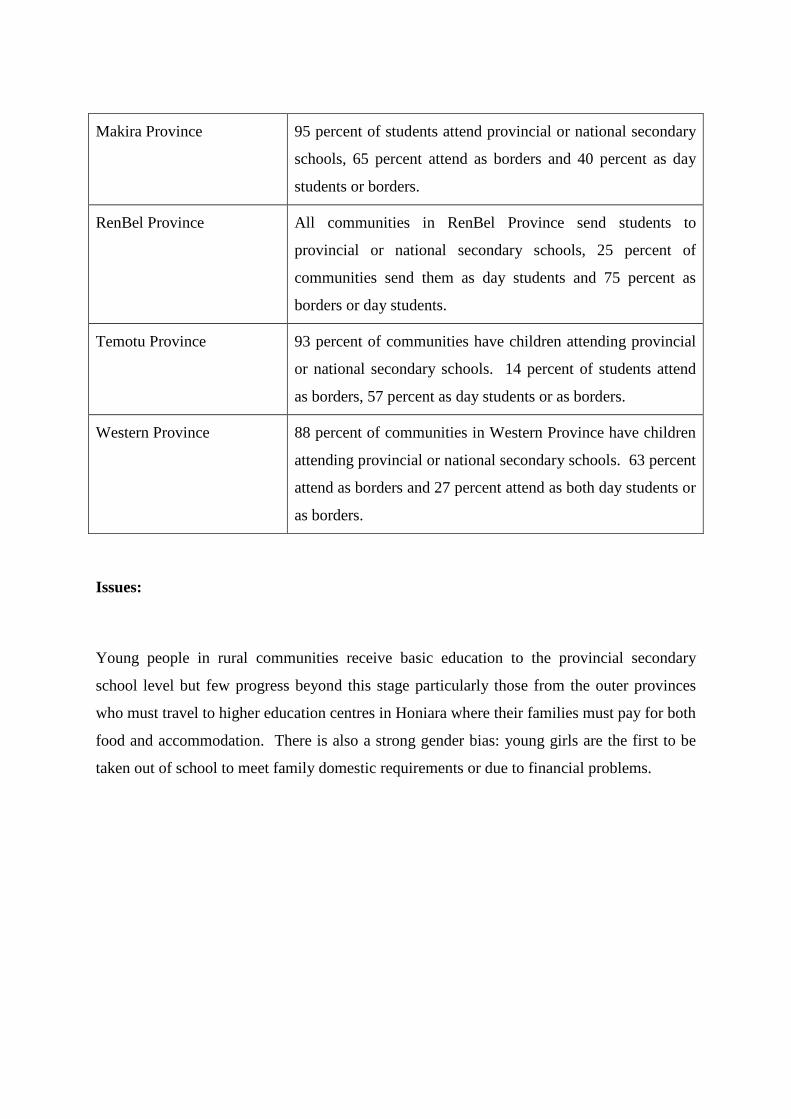
Makira Province 95 percent of students attend provincial or national secondary
schools, 65 percent attend as borders and 40 percent as day
students or borders.
RenBel Province All communities in RenBel Province send students to
provincial or national secondary schools, 25 percent of
communities send them as day students and 75 percent as
borders or day students.
Temotu Province 93 percent of communities have children attending provincial
or national secondary schools. 14 percent of students attend
as borders, 57 percent as day students or as borders.
Western Province 88 percent of communities in Western Province have children
attending provincial or national secondary schools. 63 percent
attend as borders and 27 percent attend as both day students or
as borders.
Issues:
Young people in rural communities receive basic education to the provincial secondary
school level but few progress beyond this stage particularly those from the outer provinces
who must travel to higher education centres in Honiara where their families must pay for both
food and accommodation. There is also a strong gender bias: young girls are the first to be
taken out of school to meet family domestic requirements or due to financial problems.

PROVINCIAL SIGNPOST: School attendance
Students from the outer provinces have a strong need for quality education at the high schoollevel. While the number of communities that do send their children to high school is high, noindication of the numbers of students sent to high school education was obtained. The surveydid not ask questions about the more obvious gender bias in education.
NATIONAL SIGNPOST: School attendance
With an obvious youth bulge in the Solomon Islands there needs to be a concerted effort toincrease the number of secondary schools in the provinces. However, until greateropportunities are opened up for students leaving school and looking for employment, thesituation for youth will not improve. More RTCs need to be established and the upgrading ofthe Solomon Islands College of Higher Education (SICHE) into a national tertiary institutionis long overdue.
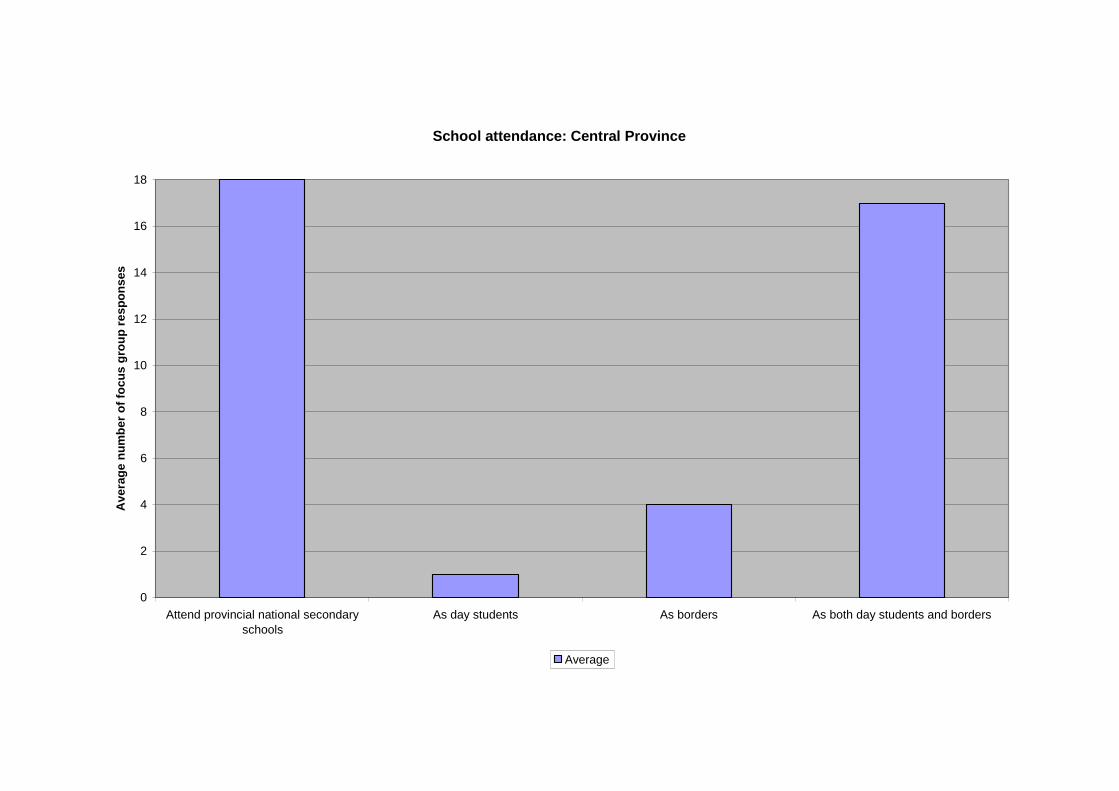
School attendance: Central Province
0
2
4
6
8
10
12
14
16
18
Attend provincial national secondary
schools
As day students As borders As both day students and borders
Av
era
ge
nu
mb
er
of
foc
us
gro
up
res
po
ns
es
Average
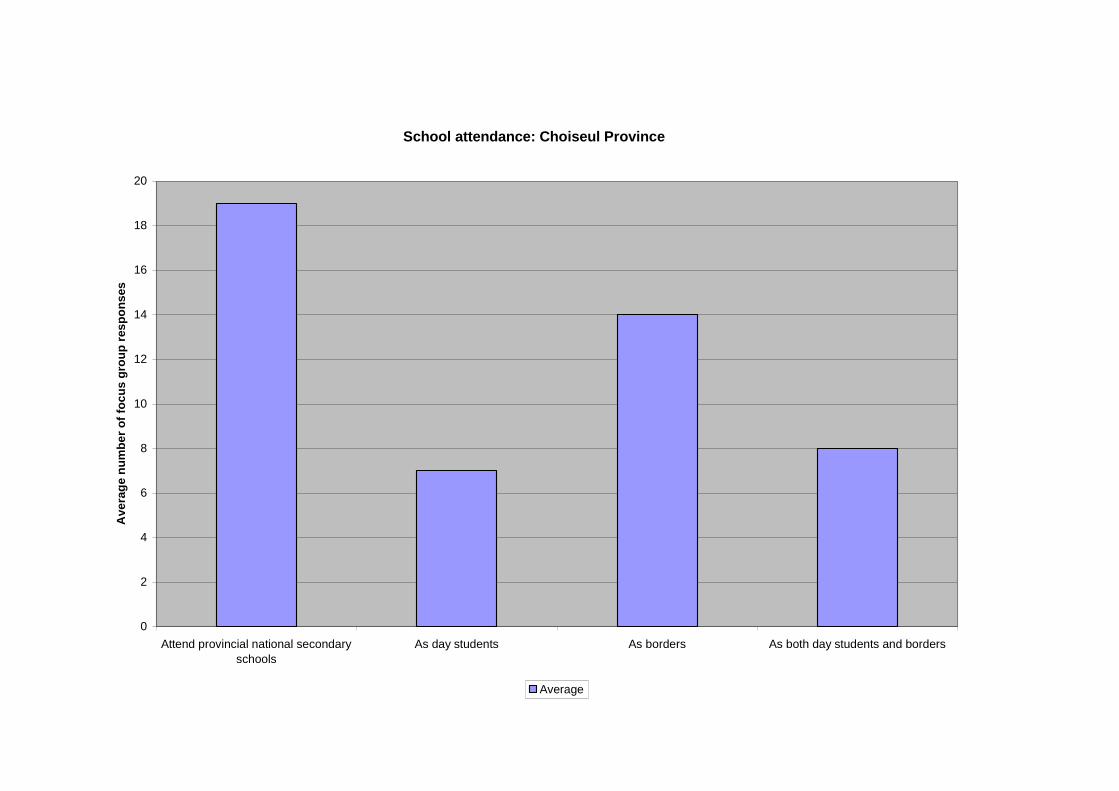
School attendance: Choiseul Province
0
2
4
6
8
10
12
14
16
18
20
Attend provincial national secondary
schools
As day students As borders As both day students and borders
Ave
rag
en
um
be
ro
ffo
cu
sg
rou
pre
sp
on
ses
Average

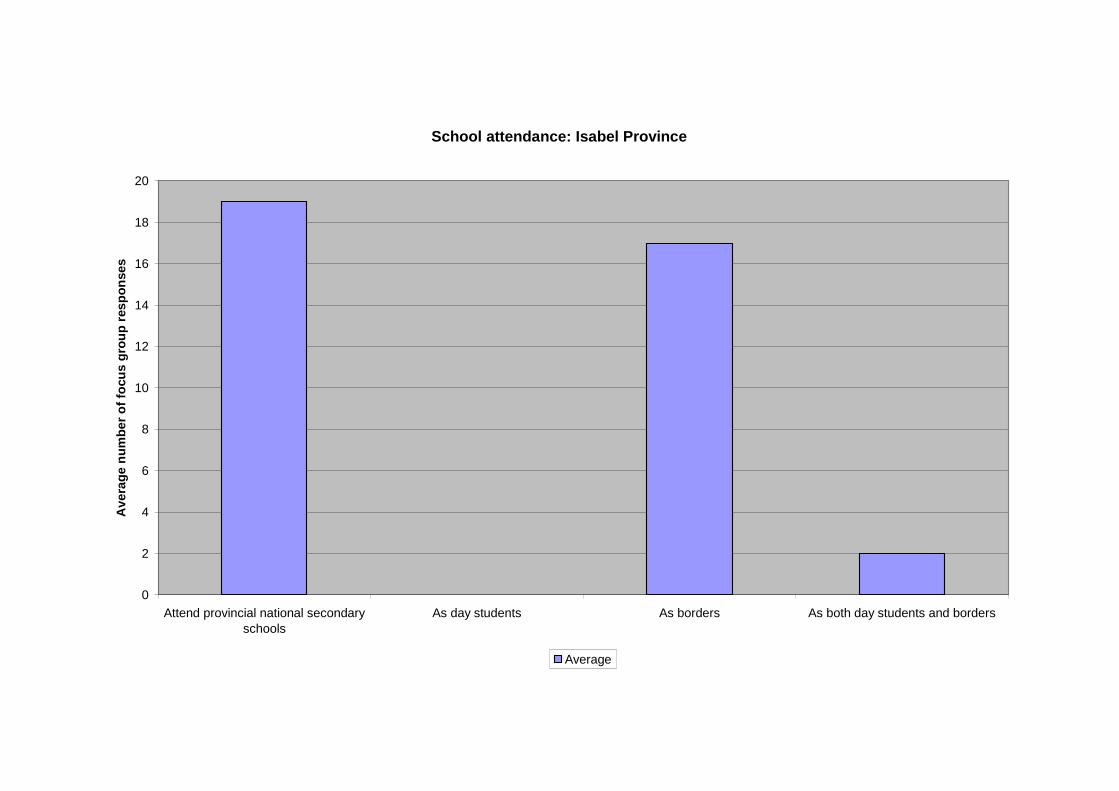
School attendance: Isabel Province
0
2
4
6
8
10
12
14
16
18
20
Attend provincial national secondaryschools
As day students As borders As both day students and borders
Av
era
ge
nu
mb
er
of
focu
sg
rou
pre
sp
on
se
s
Average
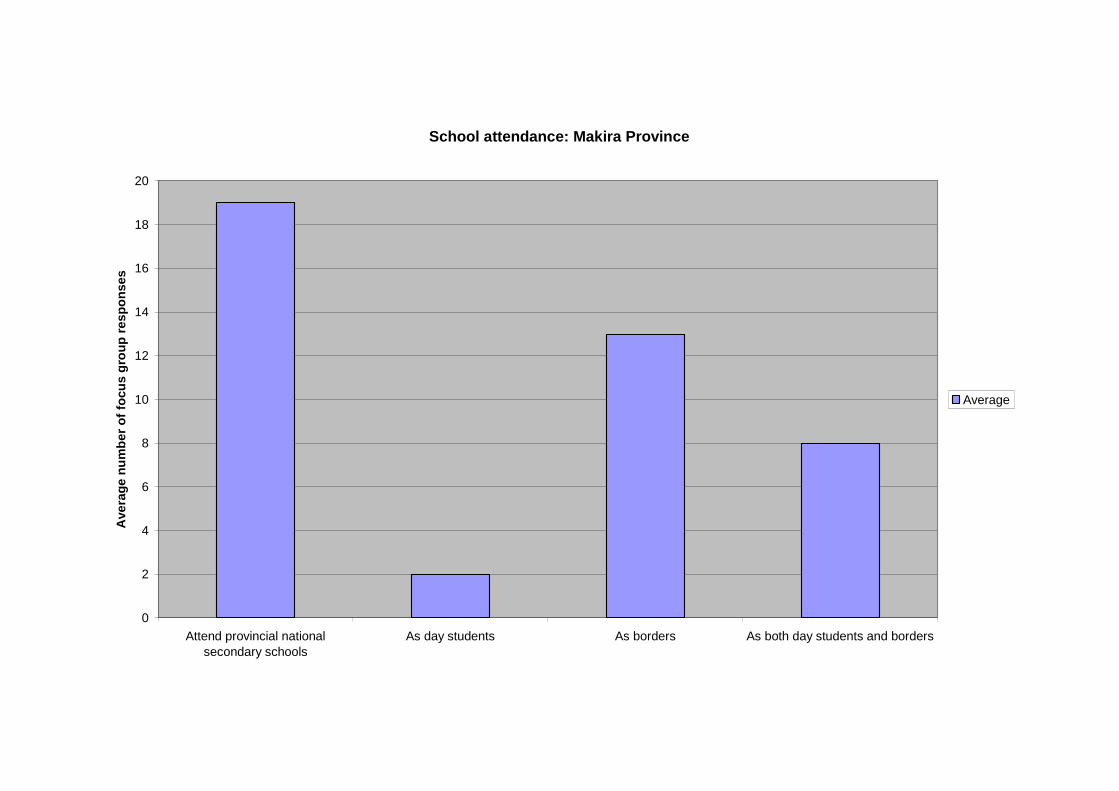
School attendance: Makira Province
0
2
4
6
8
10
12
14
16
18
20
Attend provincial nationalsecondary schools
As day students As borders As both day students and borders
Ave
rag
en
um
be
ro
ffo
cu
sg
rou
pre
sp
on
se
s
Average
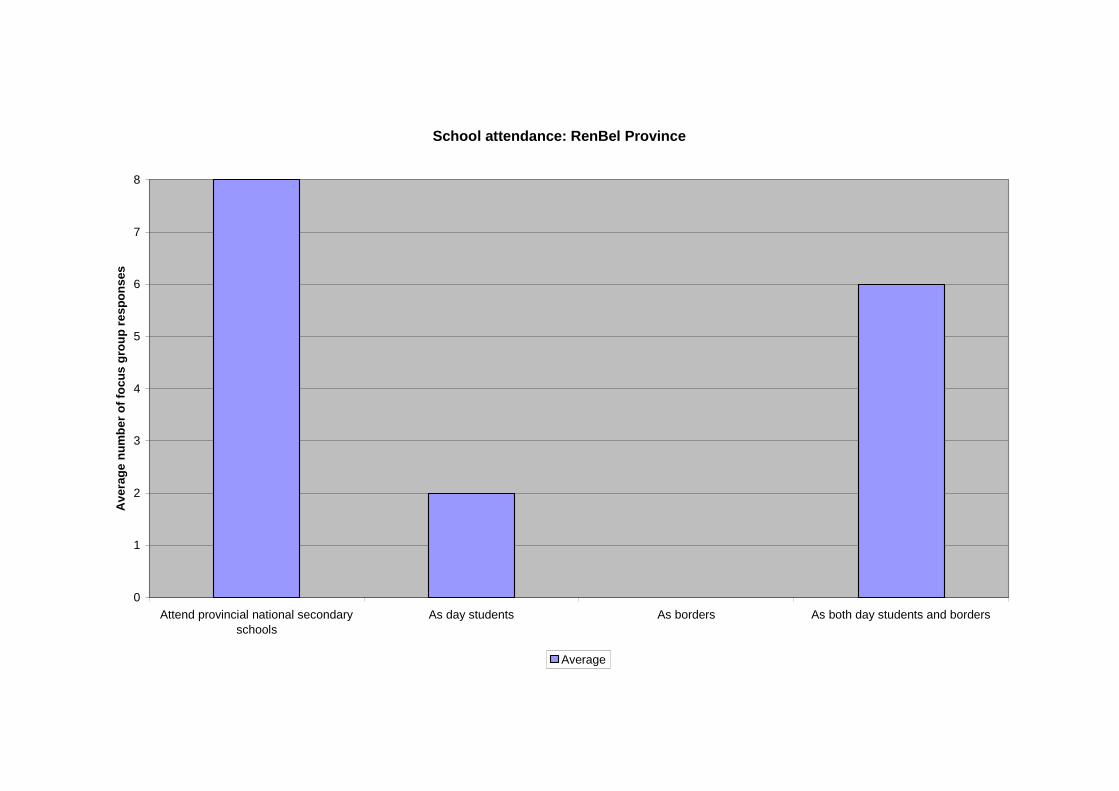
School attendance: RenBel Province
0
1
2
3
4
5
6
7
8
Attend provincial national secondary
schools
As day students As borders As both day students and borders
Av
era
ge
nu
mb
er
of
foc
us
gro
up
res
po
ns
es
Average
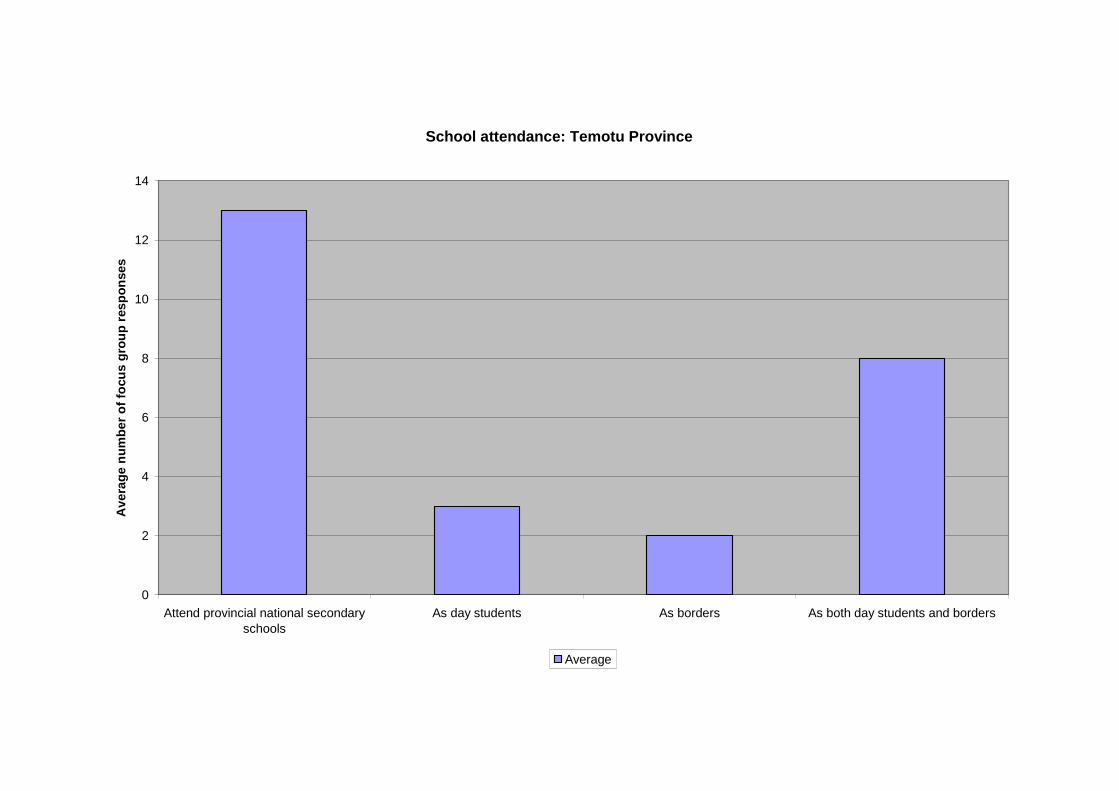
School attendance: Temotu Province
0
2
4
6
8
10
12
14
Attend provincial national secondaryschools
As day students As borders As both day students and borders
Av
era
ge
nu
mb
er
of
focu
sg
rou
pre
sp
on
se
s
Average
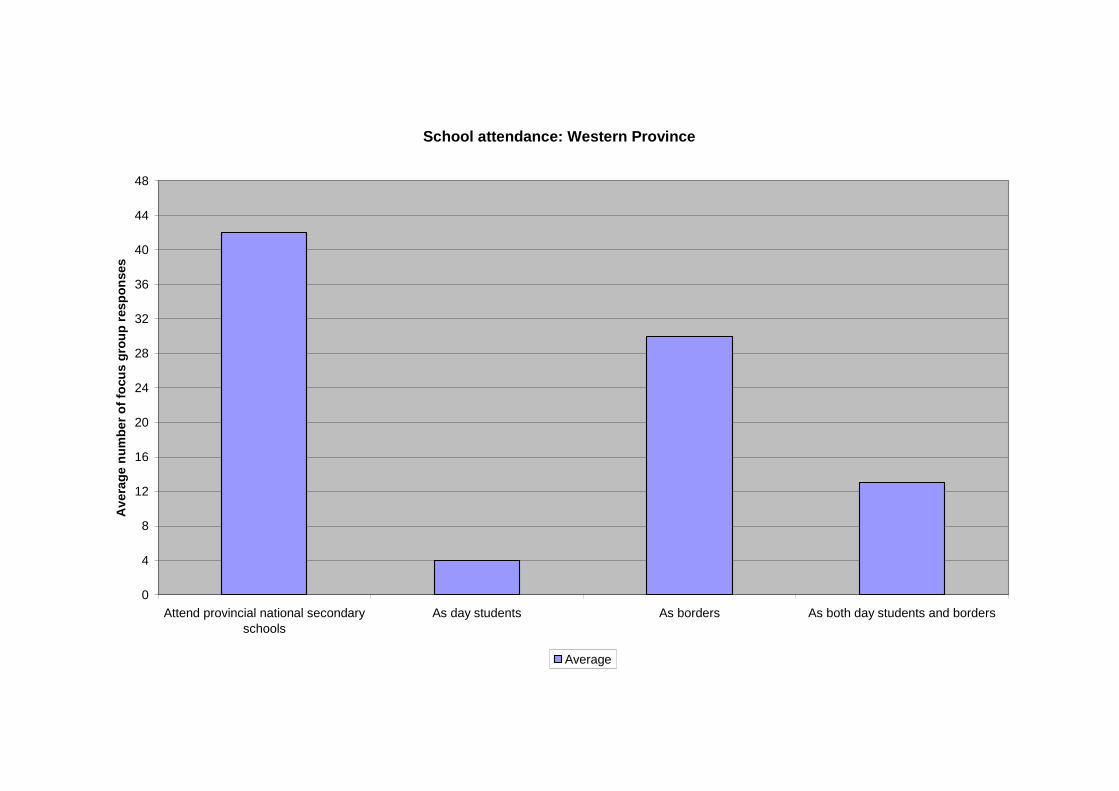
School attendance: Western Province
0
4
8
12
16
20
24
28
32
36
40
44
48
Attend provincial national secondaryschools
As day students As borders As both day students and borders
Av
era
ge
nu
mb
er
of
focu
sg
rou
pre
sp
on
se
s
Average
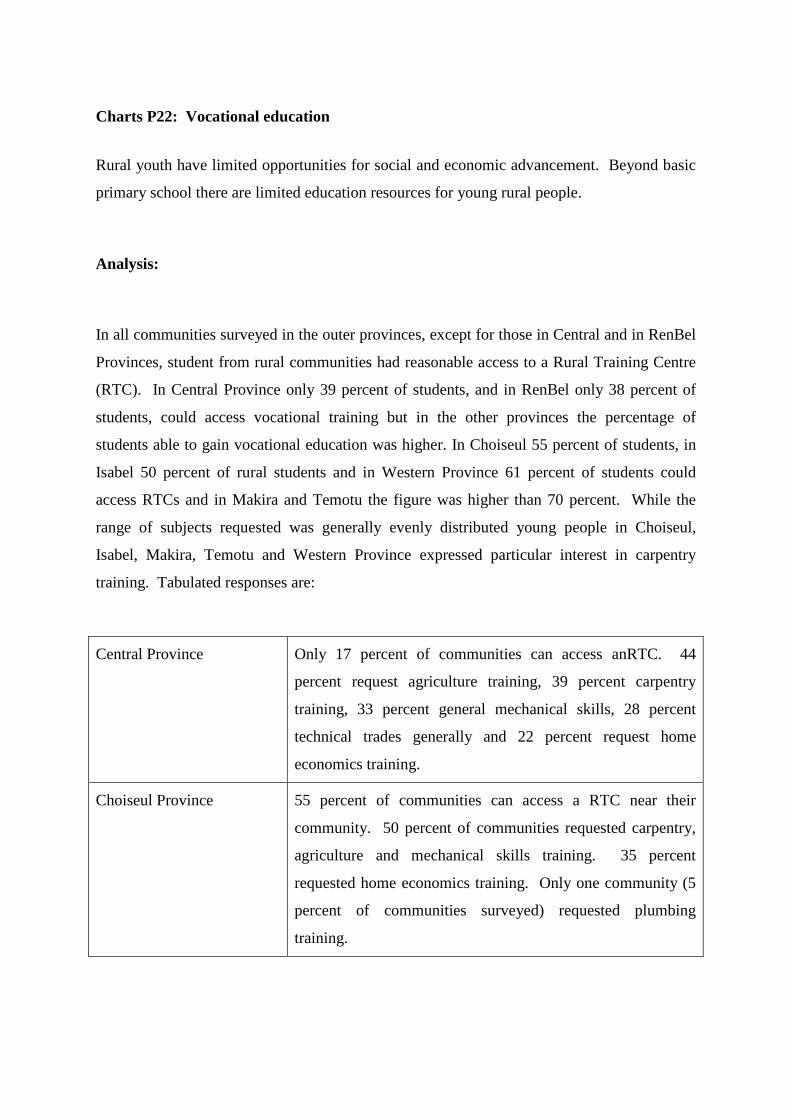
Charts P22: Vocational education
Rural youth have limited opportunities for social and economic advancement. Beyond basic
primary school there are limited education resources for young rural people.
Analysis:
In all communities surveyed in the outer provinces, except for those in Central and in RenBel
Provinces, student from rural communities had reasonable access to a Rural Training Centre
(RTC). In Central Province only 39 percent of students, and in RenBel only 38 percent of
students, could access vocational training but in the other provinces the percentage of
students able to gain vocational education was higher. In Choiseul 55 percent of students, in
Isabel 50 percent of rural students and in Western Province 61 percent of students could
access RTCs and in Makira and Temotu the figure was higher than 70 percent. While the
range of subjects requested was generally evenly distributed young people in Choiseul,
Isabel, Makira, Temotu and Western Province expressed particular interest in carpentry
training. Tabulated responses are:
Central Province Only 17 percent of communities can access anRTC. 44
percent request agriculture training, 39 percent carpentry
training, 33 percent general mechanical skills, 28 percent
technical trades generally and 22 percent request home
economics training.
Choiseul Province 55 percent of communities can access a RTC near their
community. 50 percent of communities requested carpentry,
agriculture and mechanical skills training. 35 percent
requested home economics training. Only one community (5
percent of communities surveyed) requested plumbing
training.
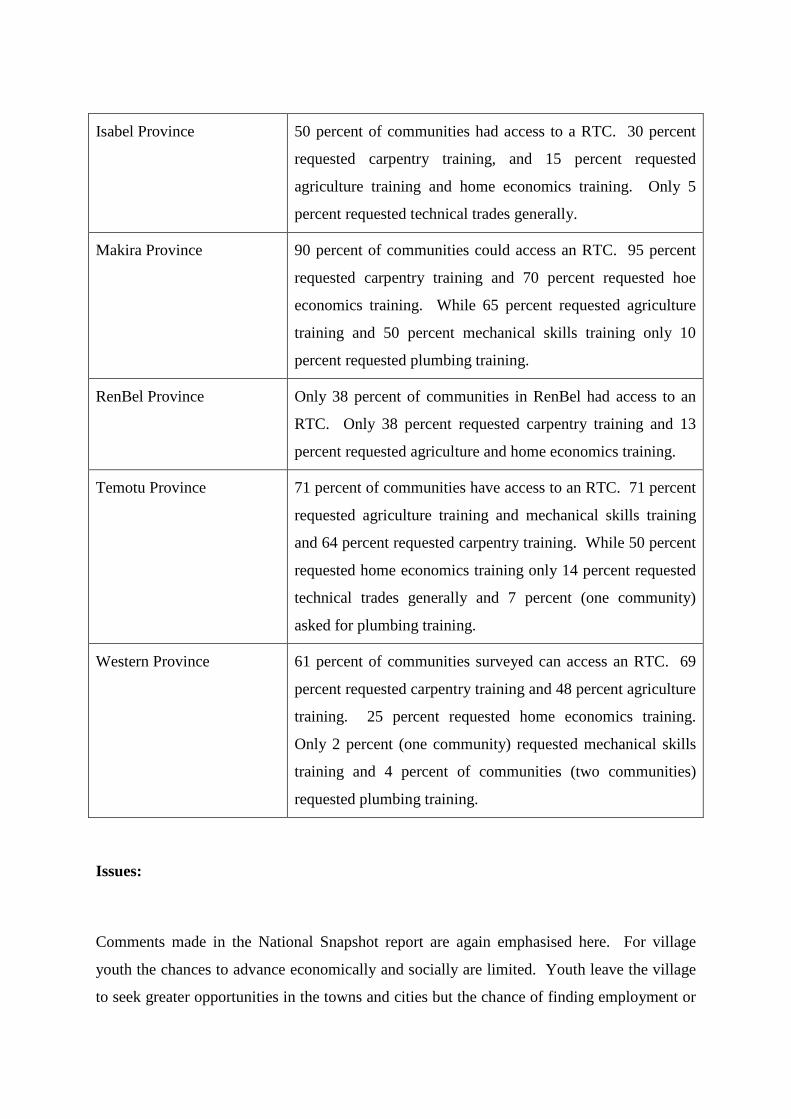
Isabel Province 50 percent of communities had access to a RTC. 30 percent
requested carpentry training, and 15 percent requested
agriculture training and home economics training. Only 5
percent requested technical trades generally.
Makira Province 90 percent of communities could access an RTC. 95 percent
requested carpentry training and 70 percent requested hoe
economics training. While 65 percent requested agriculture
training and 50 percent mechanical skills training only 10
percent requested plumbing training.
RenBel Province Only 38 percent of communities in RenBel had access to an
RTC. Only 38 percent requested carpentry training and 13
percent requested agriculture and home economics training.
Temotu Province 71 percent of communities have access to an RTC. 71 percent
requested agriculture training and mechanical skills training
and 64 percent requested carpentry training. While 50 percent
requested home economics training only 14 percent requested
technical trades generally and 7 percent (one community)
asked for plumbing training.
Western Province 61 percent of communities surveyed can access an RTC. 69
percent requested carpentry training and 48 percent agriculture
training. 25 percent requested home economics training.
Only 2 percent (one community) requested mechanical skills
training and 4 percent of communities (two communities)
requested plumbing training.
Issues:
Comments made in the National Snapshot report are again emphasised here. For village
youth the chances to advance economically and socially are limited. Youth leave the village
to seek greater opportunities in the towns and cities but the chance of finding employment or
better education is often poor. Upgrading the quality and structure of the Rural Training
Centres is vital for the Solomon Islands. RTCs need to be established in all constituencies
and the conditions of training, teaching and accommodation need to be enhanced. Many
RTCs are poorly run and in bad condition. This is also an opportunity to work with the
churches who currently run about 20 of the 41 RTCs in operation.
PROVINCIAL SIGNPOST: Vocational education
There is limited opportunity for rural youth to gain advancement especially as the number ofyoung people being pushed out of the education system is growing. RTCs are a good facilitythat can be utilised to train rural youth in practical skills that can be used in the home villageor to gain employment in the region or the towns and cities. However, not enough attentionis being placed on the need to upgrade the RTCs, strengthen the quality of the teaching or toestablish standards and qualifications that can be useful for students.
NATIONAL SIGNPOST: Vocational education
Considerable attention needs to be focused on the Rural Training Centres and their position inthe formal education system. They are low in status and youth seeking higher qualityeducation will naturally prefer national secondary schools. However the RTCs are the onlyfacilities available to students ‘pushed out’ of the educational system at the end of primaryschool and community high school. Instead of putting more money into tertiary educationwith little real return for the community, more attention needs to be placed on practicalvillage based skills enhancement and training. This is also an excellent opportunity forworking with the churches who have strong links into the communities and with theestablished women’s and youth groups in villages.
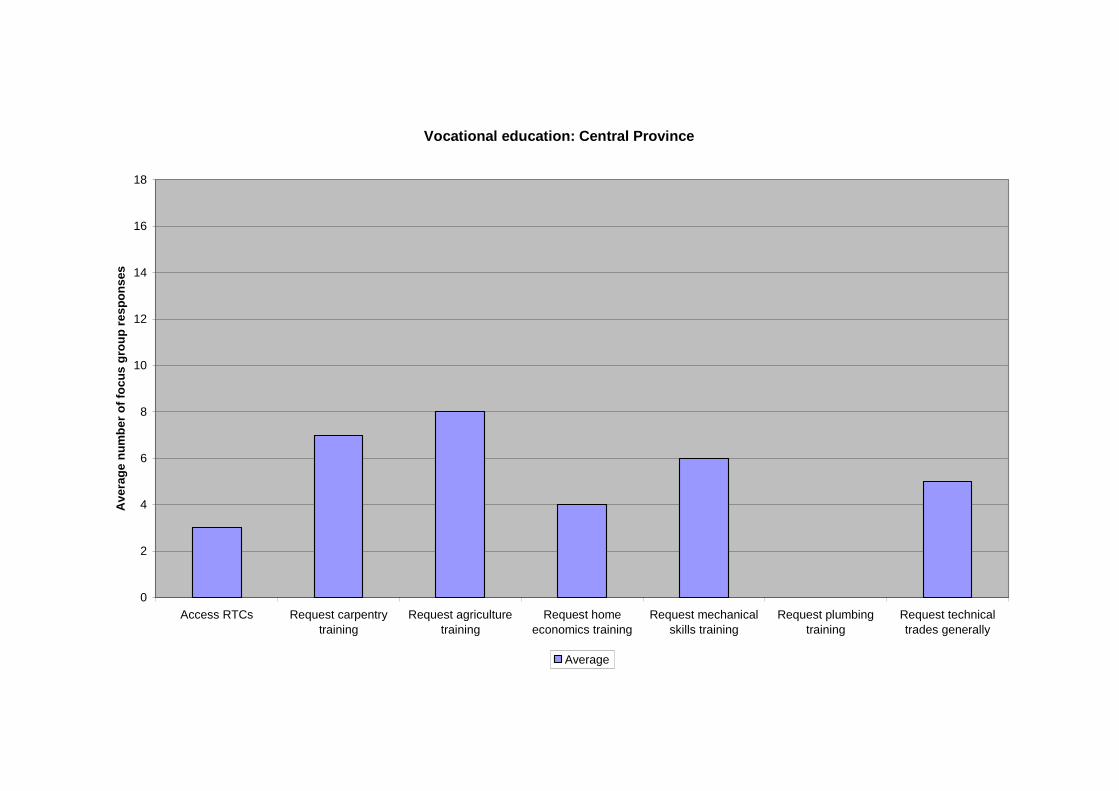
Vocational education: Central Province
0
2
4
6
8
10
12
14
16
18
Access RTCs Request carpentry
training
Request agriculture
training
Request home
economics training
Request mechanical
skills training
Request plumbing
training
Request technical
trades generally
Av
era
ge
nu
mb
er
of
foc
us
gro
up
res
po
ns
es
Average
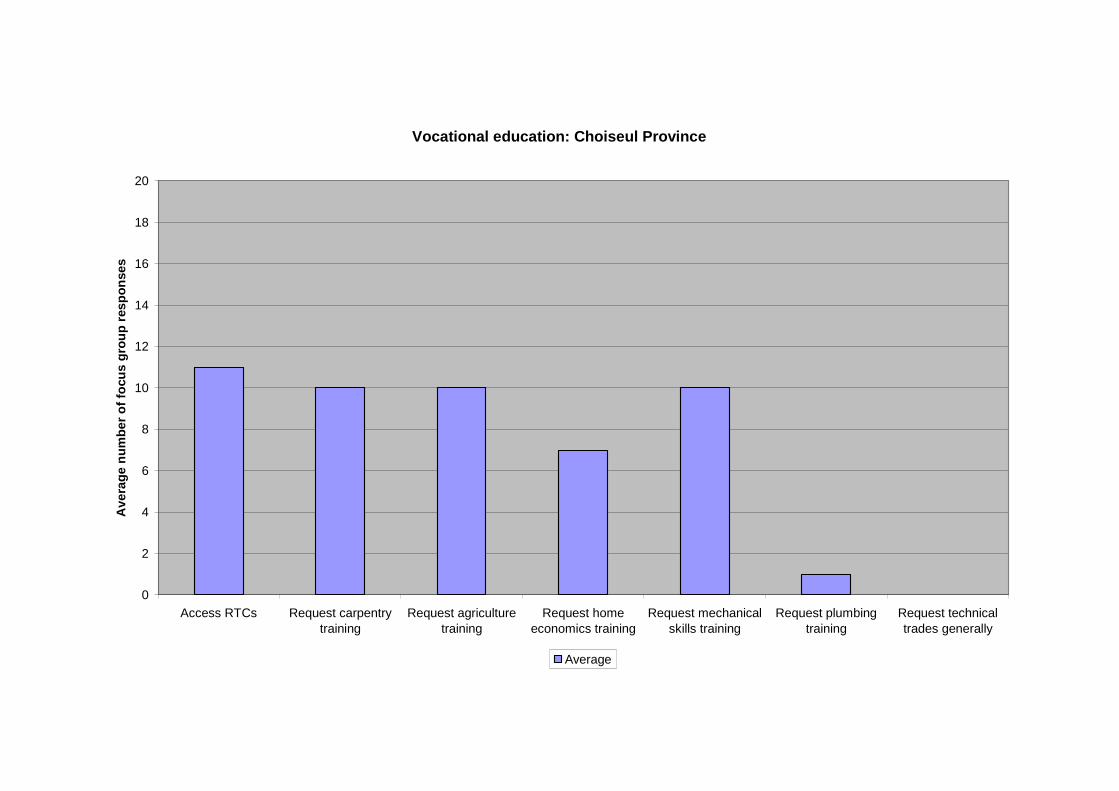
Vocational education: Choiseul Province
0
2
4
6
8
10
12
14
16
18
20
Access RTCs Request carpentrytraining
Request agriculturetraining
Request homeeconomics training
Request mechanicalskills training
Request plumbingtraining
Request technicaltrades generally
Av
era
ge
nu
mb
er
of
focu
sg
rou
pre
sp
on
se
s
Average
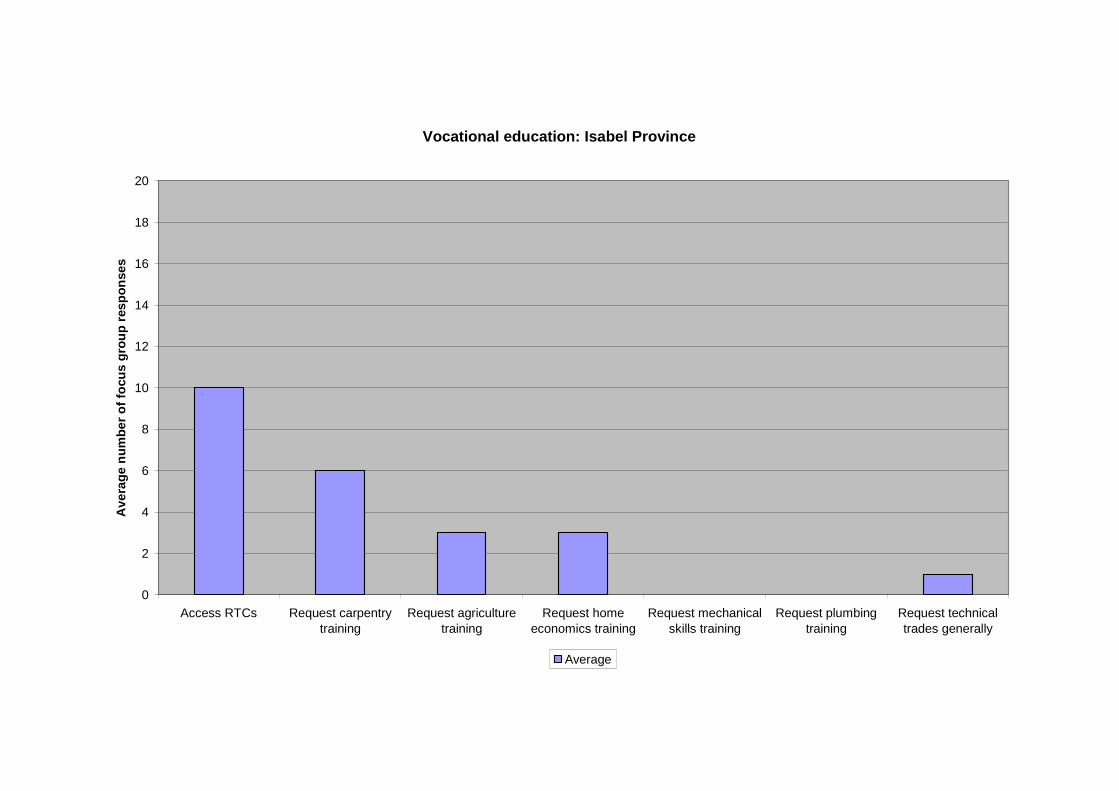
Vocational education: Isabel Province
0
2
4
6
8
10
12
14
16
18
20
Access RTCs Request carpentrytraining
Request agriculturetraining
Request homeeconomics training
Request mechanicalskills training
Request plumbingtraining
Request technicaltrades generally
Av
era
ge
nu
mb
er
of
focu
sg
rou
pre
sp
on
se
s
Average
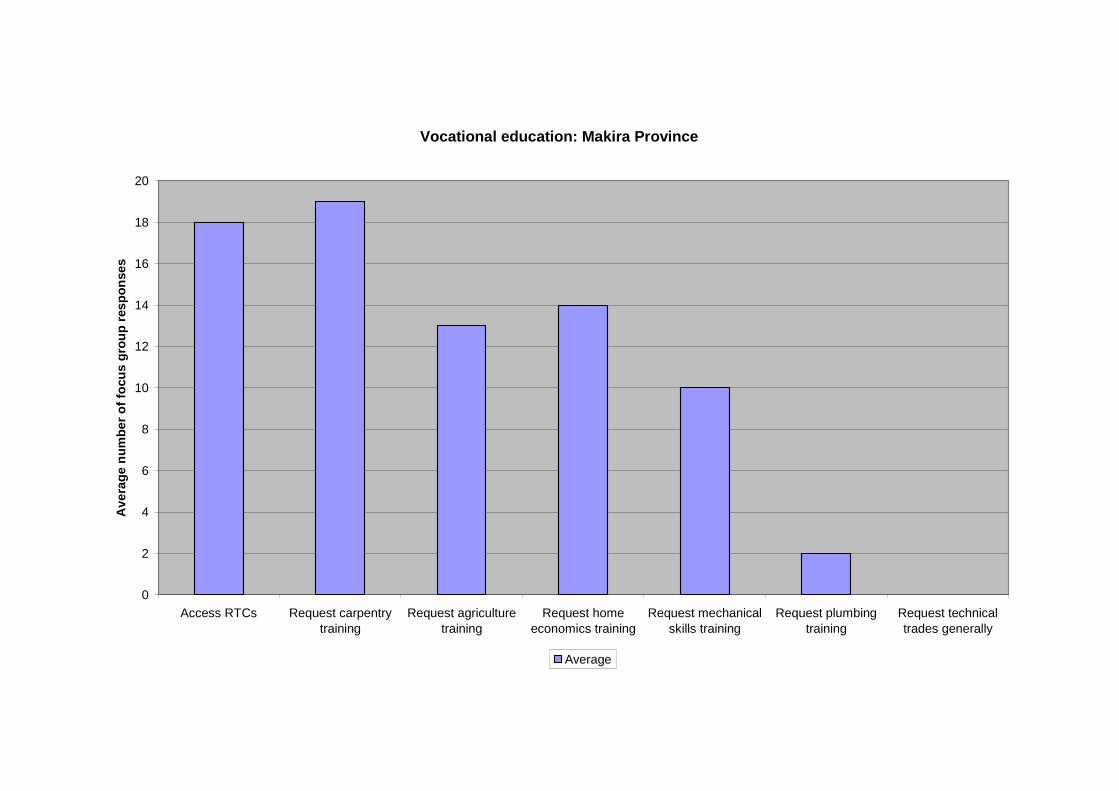
Vocational education: Makira Province
0
2
4
6
8
10
12
14
16
18
20
Access RTCs Request carpentrytraining
Request agriculturetraining
Request homeeconomics training
Request mechanicalskills training
Request plumbingtraining
Request technicaltrades generally
Av
era
ge
nu
mb
er
of
focu
sg
rou
pre
sp
on
se
s
Average
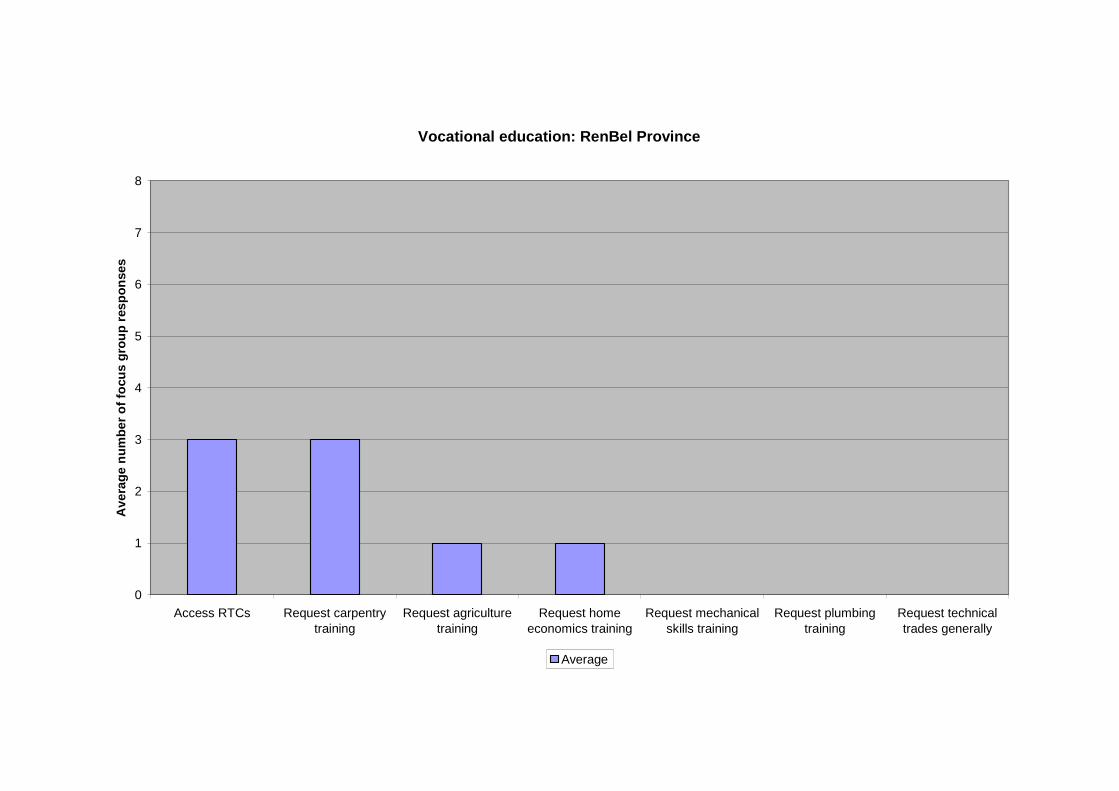
Vocational education: RenBel Province
0
1
2
3
4
5
6
7
8
Access RTCs Request carpentrytraining
Request agriculturetraining
Request homeeconomics training
Request mechanicalskills training
Request plumbingtraining
Request technicaltrades generally
Av
era
ge
nu
mb
er
of
focu
sg
rou
pre
sp
on
se
s
Average
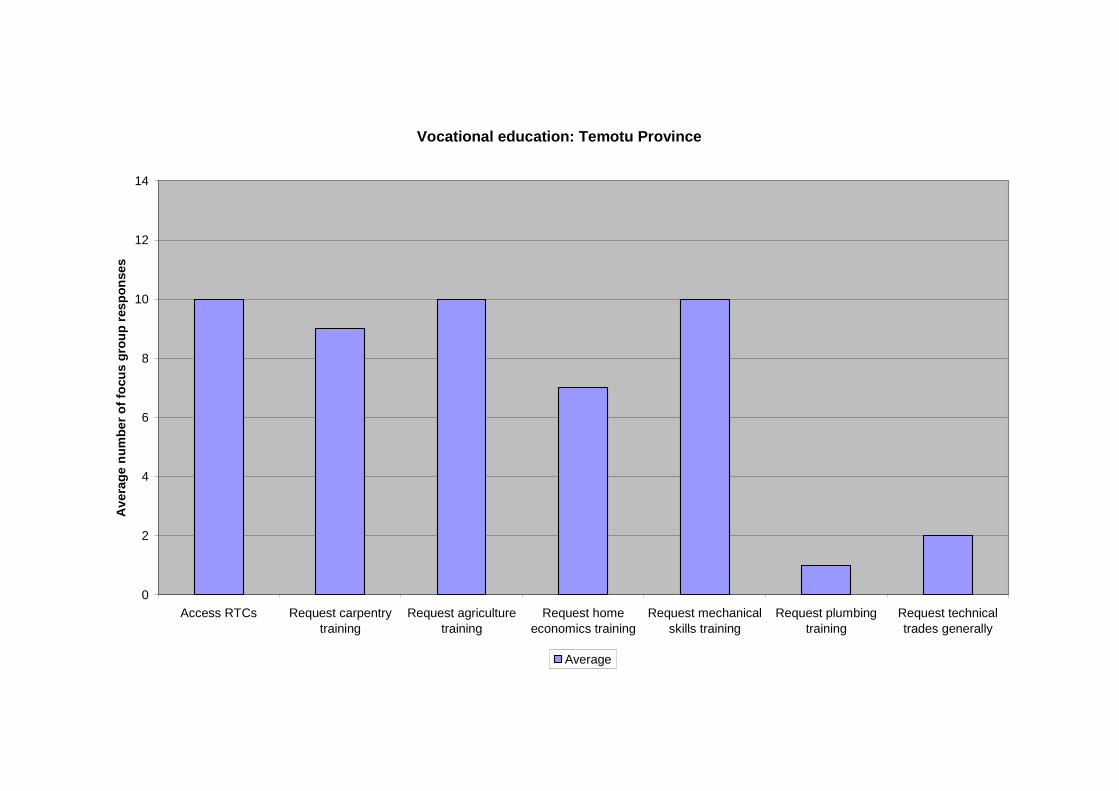
Vocational education: Temotu Province
0
2
4
6
8
10
12
14
Access RTCs Request carpentrytraining
Request agriculturetraining
Request homeeconomics training
Request mechanicalskills training
Request plumbingtraining
Request technicaltrades generally
Av
era
ge
nu
mb
er
of
focu
sg
rou
pre
sp
on
se
s
Average
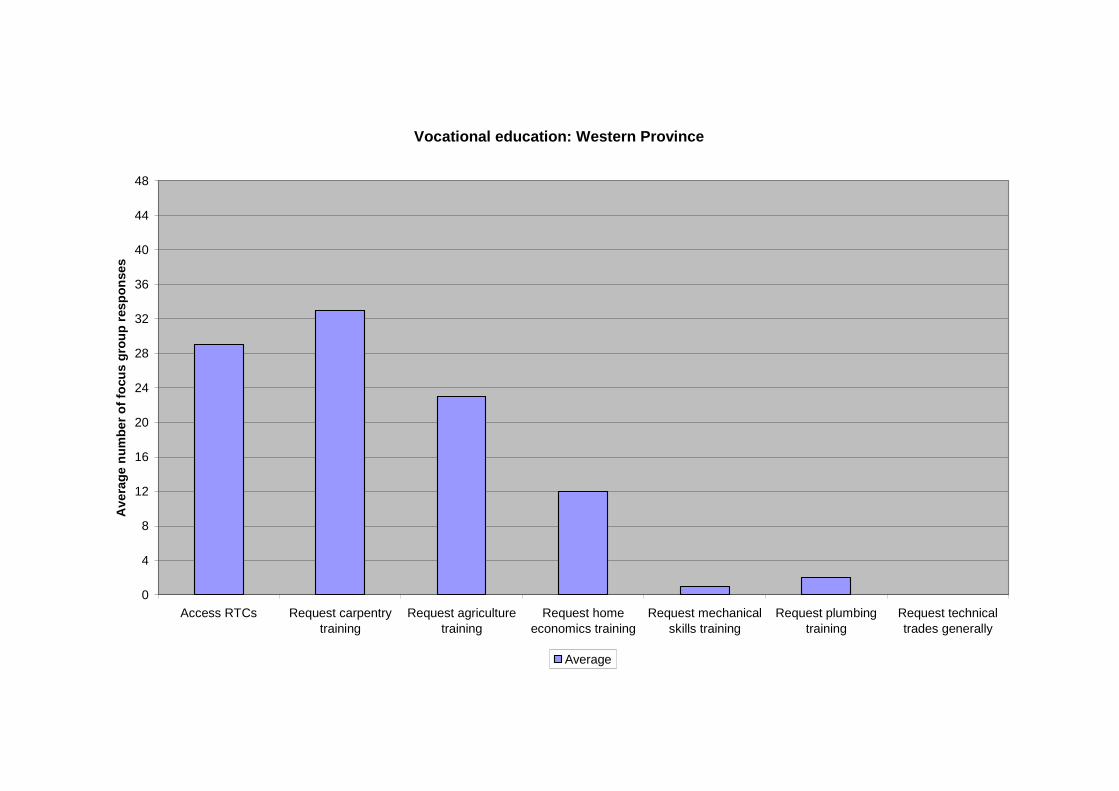
Vocational education: Western Province
0
4
8
12
16
20
24
28
32
36
40
44
48
Access RTCs Request carpentrytraining
Request agriculturetraining
Request homeeconomics training
Request mechanicalskills training
Request plumbingtraining
Request technicaltrades generally
Av
era
ge
nu
mb
er
of
focu
sg
rou
pre
sp
on
se
s
Average
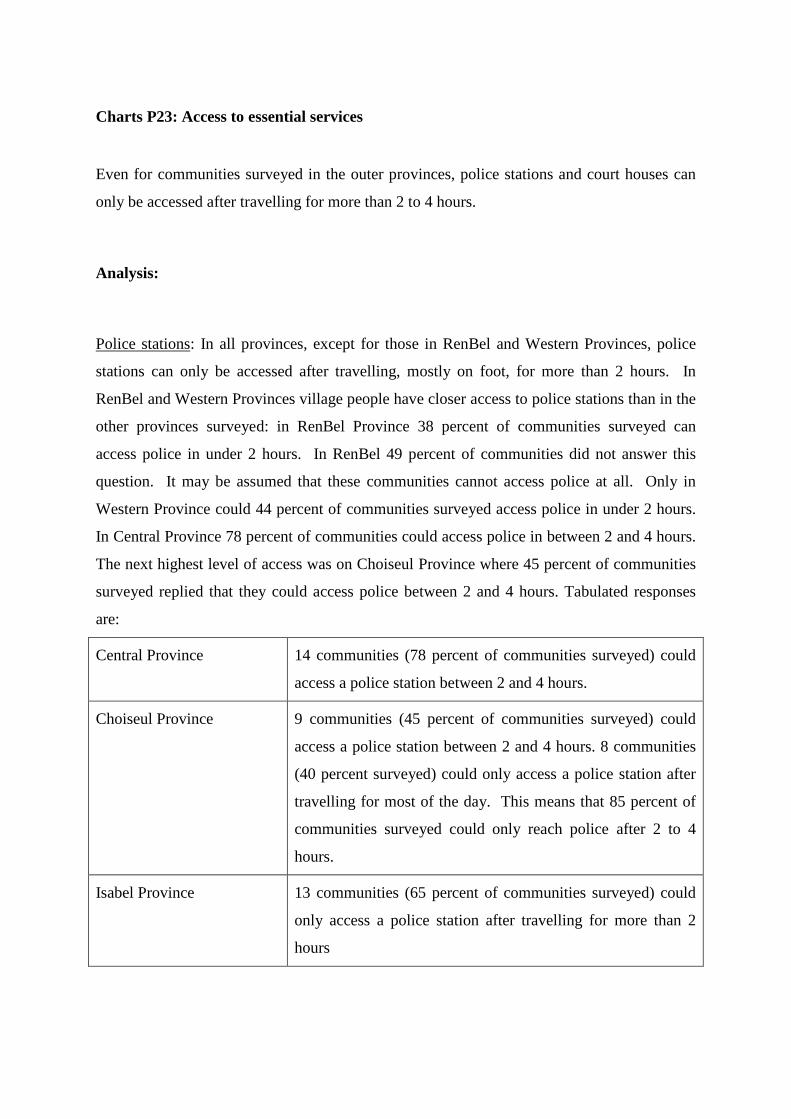
Charts P23: Access to essential services
Even for communities surveyed in the outer provinces, police stations and court houses can
only be accessed after travelling for more than 2 to 4 hours.
Analysis:
Police stations: In all provinces, except for those in RenBel and Western Provinces, police
stations can only be accessed after travelling, mostly on foot, for more than 2 hours. In
RenBel and Western Provinces village people have closer access to police stations than in the
other provinces surveyed: in RenBel Province 38 percent of communities surveyed can
access police in under 2 hours. In RenBel 49 percent of communities did not answer this
question. It may be assumed that these communities cannot access police at all. Only in
Western Province could 44 percent of communities surveyed access police in under 2 hours.
In Central Province 78 percent of communities could access police in between 2 and 4 hours.
The next highest level of access was on Choiseul Province where 45 percent of communities
surveyed replied that they could access police between 2 and 4 hours. Tabulated responses
are:
Central Province 14 communities (78 percent of communities surveyed) could
access a police station between 2 and 4 hours.
Choiseul Province 9 communities (45 percent of communities surveyed) could
access a police station between 2 and 4 hours. 8 communities
(40 percent surveyed) could only access a police station after
travelling for most of the day. This means that 85 percent of
communities surveyed could only reach police after 2 to 4
hours.
Isabel Province 13 communities (65 percent of communities surveyed) could
only access a police station after travelling for more than 2
hours
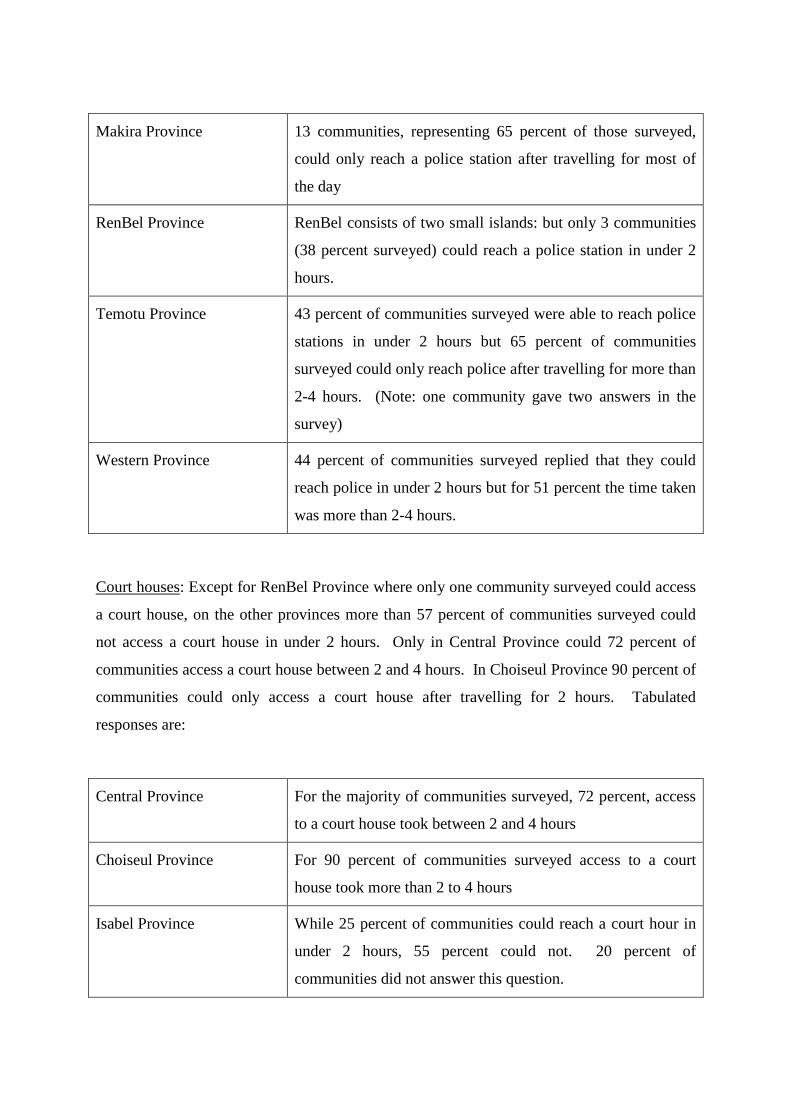
Makira Province 13 communities, representing 65 percent of those surveyed,
could only reach a police station after travelling for most of
the day
RenBel Province RenBel consists of two small islands: but only 3 communities
(38 percent surveyed) could reach a police station in under 2
hours.
Temotu Province 43 percent of communities surveyed were able to reach police
stations in under 2 hours but 65 percent of communities
surveyed could only reach police after travelling for more than
2-4 hours. (Note: one community gave two answers in the
survey)
Western Province 44 percent of communities surveyed replied that they could
reach police in under 2 hours but for 51 percent the time taken
was more than 2-4 hours.
Court houses: Except for RenBel Province where only one community surveyed could access
a court house, on the other provinces more than 57 percent of communities surveyed could
not access a court house in under 2 hours. Only in Central Province could 72 percent of
communities access a court house between 2 and 4 hours. In Choiseul Province 90 percent of
communities could only access a court house after travelling for 2 hours. Tabulated
responses are:
Central Province For the majority of communities surveyed, 72 percent, access
to a court house took between 2 and 4 hours
Choiseul Province For 90 percent of communities surveyed access to a court
house took more than 2 to 4 hours
Isabel Province While 25 percent of communities could reach a court hour in
under 2 hours, 55 percent could not. 20 percent of
communities did not answer this question.
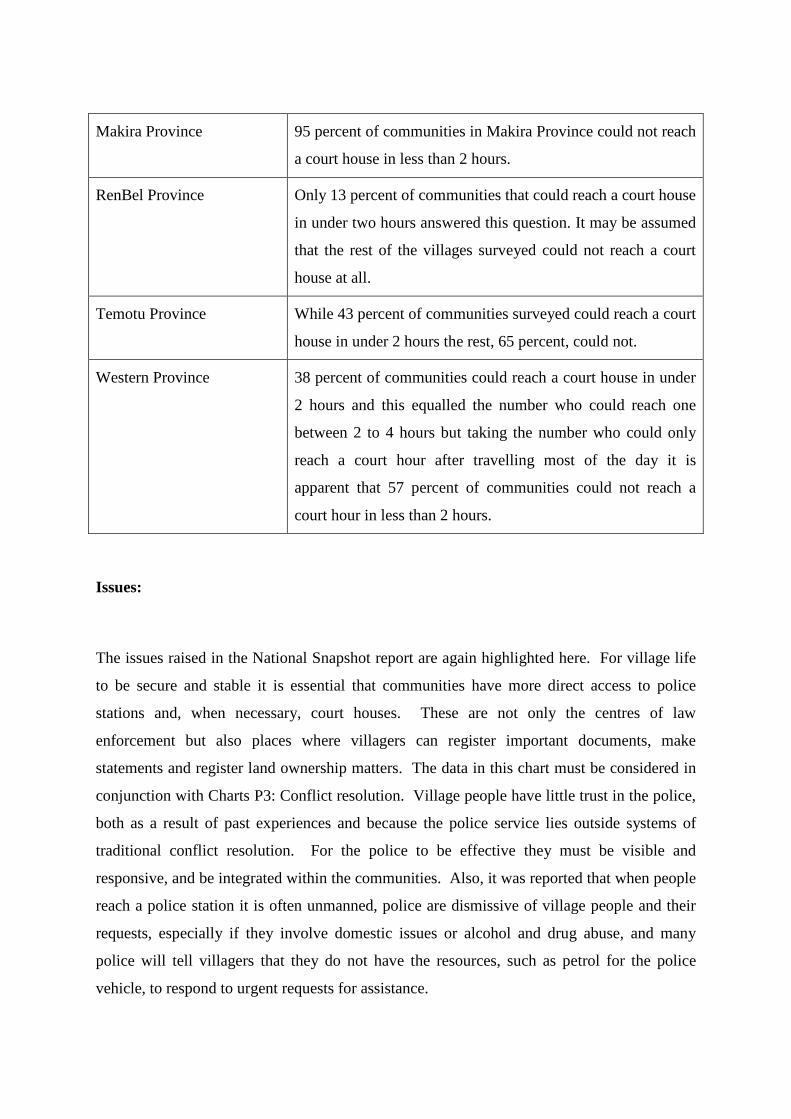
Makira Province 95 percent of communities in Makira Province could not reach
a court house in less than 2 hours.
RenBel Province Only 13 percent of communities that could reach a court house
in under two hours answered this question. It may be assumed
that the rest of the villages surveyed could not reach a court
house at all.
Temotu Province While 43 percent of communities surveyed could reach a court
house in under 2 hours the rest, 65 percent, could not.
Western Province 38 percent of communities could reach a court house in under
2 hours and this equalled the number who could reach one
between 2 to 4 hours but taking the number who could only
reach a court hour after travelling most of the day it is
apparent that 57 percent of communities could not reach a
court hour in less than 2 hours.
Issues:
The issues raised in the National Snapshot report are again highlighted here. For village life
to be secure and stable it is essential that communities have more direct access to police
stations and, when necessary, court houses. These are not only the centres of law
enforcement but also places where villagers can register important documents, make
statements and register land ownership matters. The data in this chart must be considered in
conjunction with Charts P3: Conflict resolution. Village people have little trust in the police,
both as a result of past experiences and because the police service lies outside systems of
traditional conflict resolution. For the police to be effective they must be visible and
responsive, and be integrated within the communities. Also, it was reported that when people
reach a police station it is often unmanned, police are dismissive of village people and their
requests, especially if they involve domestic issues or alcohol and drug abuse, and many
police will tell villagers that they do not have the resources, such as petrol for the police
vehicle, to respond to urgent requests for assistance.
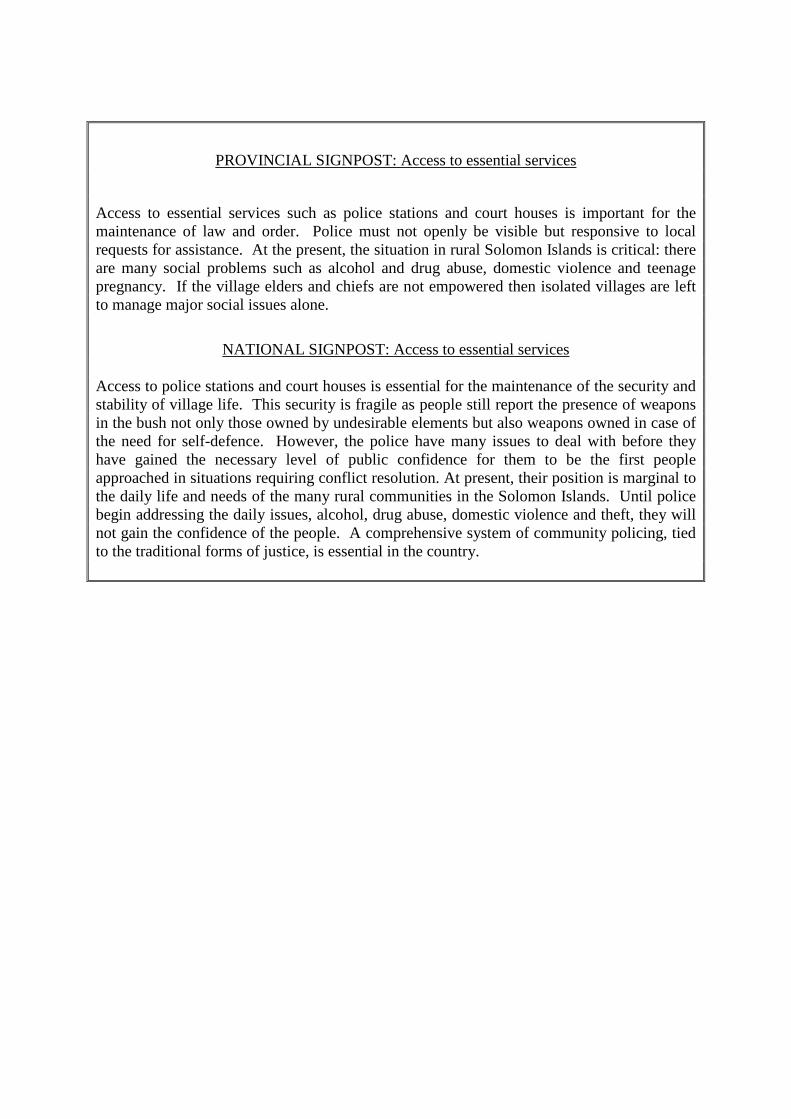
PROVINCIAL SIGNPOST: Access to essential services
Access to essential services such as police stations and court houses is important for themaintenance of law and order. Police must not openly be visible but responsive to localrequests for assistance. At the present, the situation in rural Solomon Islands is critical: thereare many social problems such as alcohol and drug abuse, domestic violence and teenagepregnancy. If the village elders and chiefs are not empowered then isolated villages are leftto manage major social issues alone.
NATIONAL SIGNPOST: Access to essential services
Access to police stations and court houses is essential for the maintenance of the security andstability of village life. This security is fragile as people still report the presence of weaponsin the bush not only those owned by undesirable elements but also weapons owned in case ofthe need for self-defence. However, the police have many issues to deal with before theyhave gained the necessary level of public confidence for them to be the first peopleapproached in situations requiring conflict resolution. At present, their position is marginal tothe daily life and needs of the many rural communities in the Solomon Islands. Until policebegin addressing the daily issues, alcohol, drug abuse, domestic violence and theft, they willnot gain the confidence of the people. A comprehensive system of community policing, tiedto the traditional forms of justice, is essential in the country.
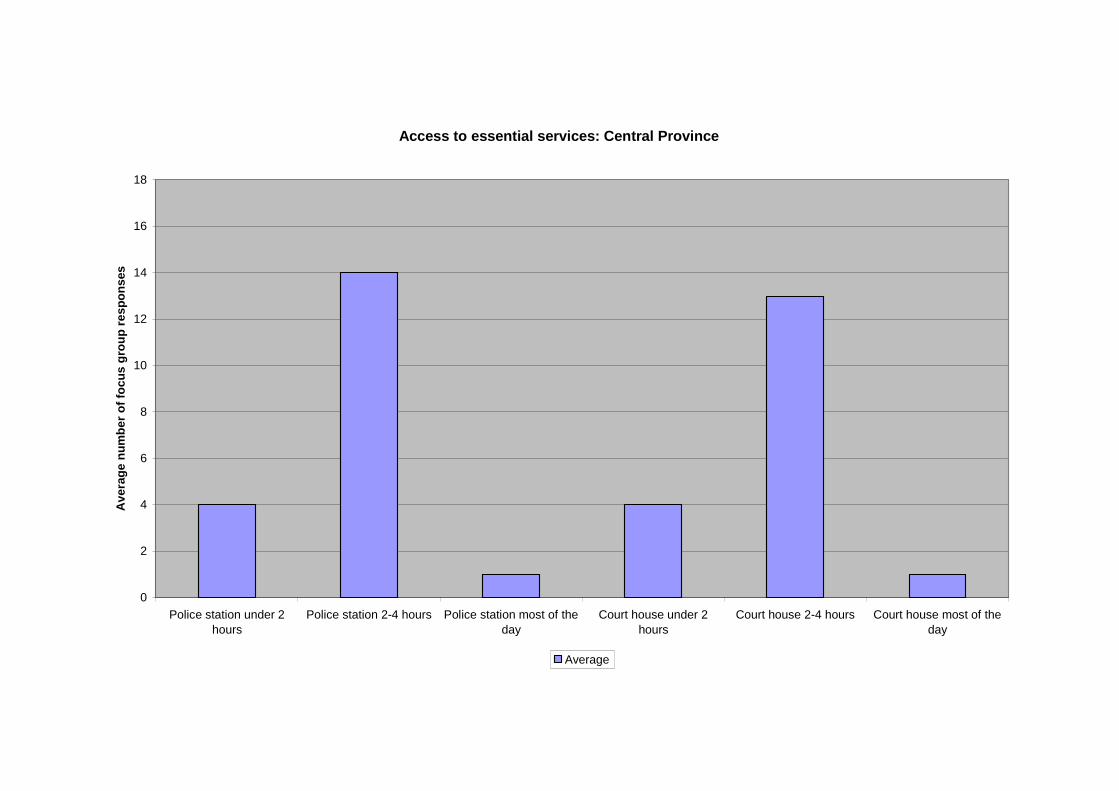
Access to essential services: Central Province
0
2
4
6
8
10
12
14
16
18
Police station under 2
hours
Police station 2-4 hours Police station most of the
day
Court house under 2
hours
Court house 2-4 hours Court house most of the
day
Av
era
ge
nu
mb
er
of
foc
us
gro
up
res
po
ns
es
Average
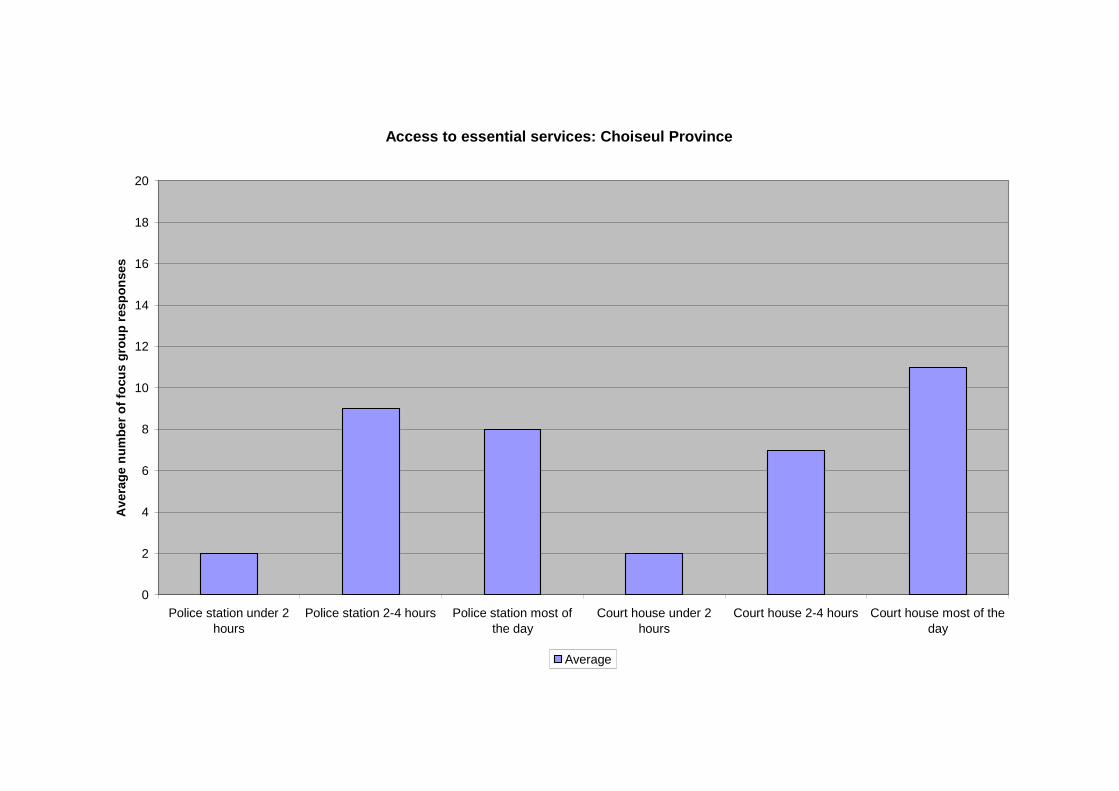
Access to essential services: Choiseul Province
0
2
4
6
8
10
12
14
16
18
20
Police station under 2hours
Police station 2-4 hours Police station most ofthe day
Court house under 2hours
Court house 2-4 hours Court house most of theday
Av
era
ge
nu
mb
er
of
focu
sg
rou
pre
sp
on
se
s
Average
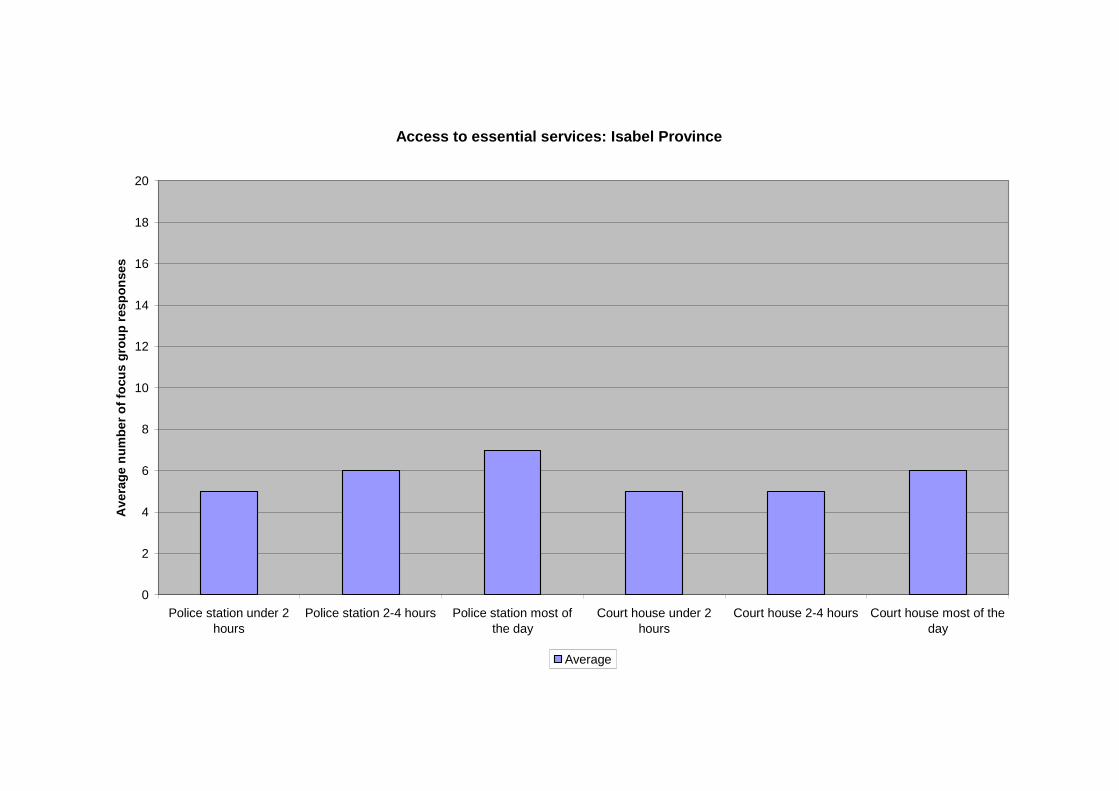
Access to essential services: Isabel Province
0
2
4
6
8
10
12
14
16
18
20
Police station under 2hours
Police station 2-4 hours Police station most ofthe day
Court house under 2hours
Court house 2-4 hours Court house most of theday
Av
era
ge
nu
mb
er
of
focu
sg
rou
pre
sp
on
se
s
Average
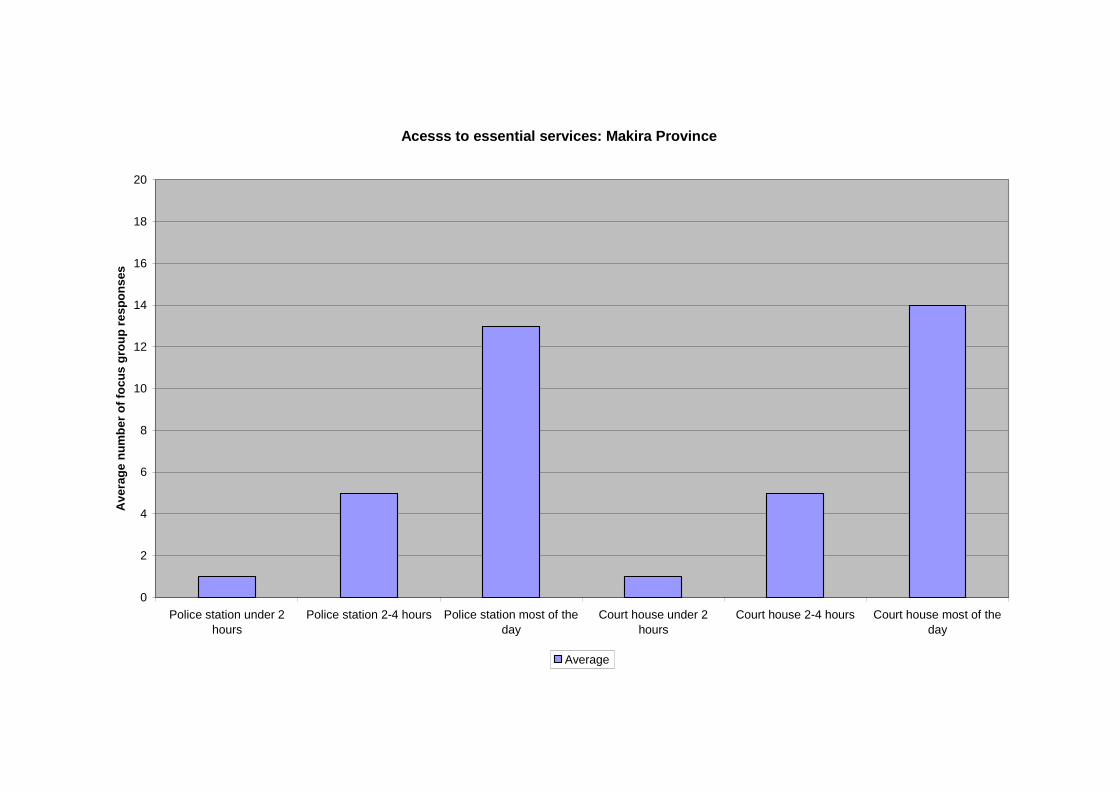
Acesss to essential services: Makira Province
0
2
4
6
8
10
12
14
16
18
20
Police station under 2
hours
Police station 2-4 hours Police station most of the
day
Court house under 2
hours
Court house 2-4 hours Court house most of the
day
Av
era
ge
nu
mb
er
of
foc
us
gro
up
res
po
ns
es
Average
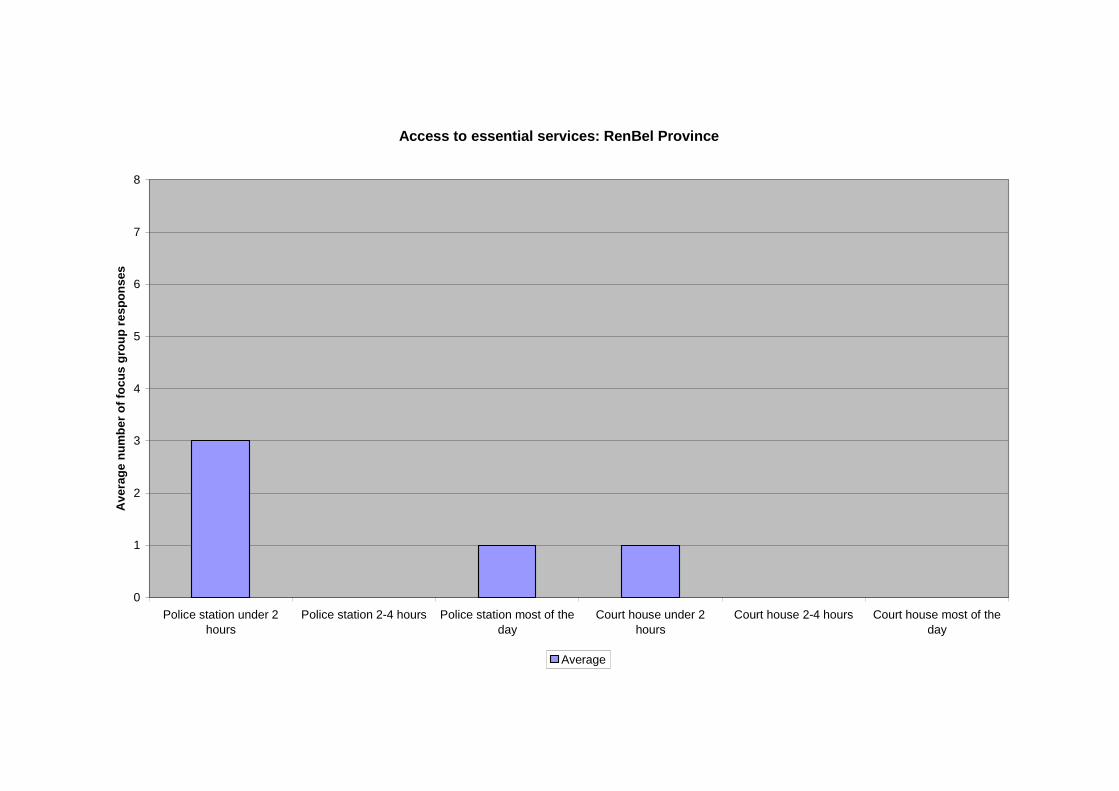
Access to essential services: RenBel Province
0
1
2
3
4
5
6
7
8
Police station under 2
hours
Police station 2-4 hours Police station most of the
day
Court house under 2
hours
Court house 2-4 hours Court house most of the
day
Av
era
ge
nu
mb
er
of
foc
us
gro
up
res
po
ns
es
Average
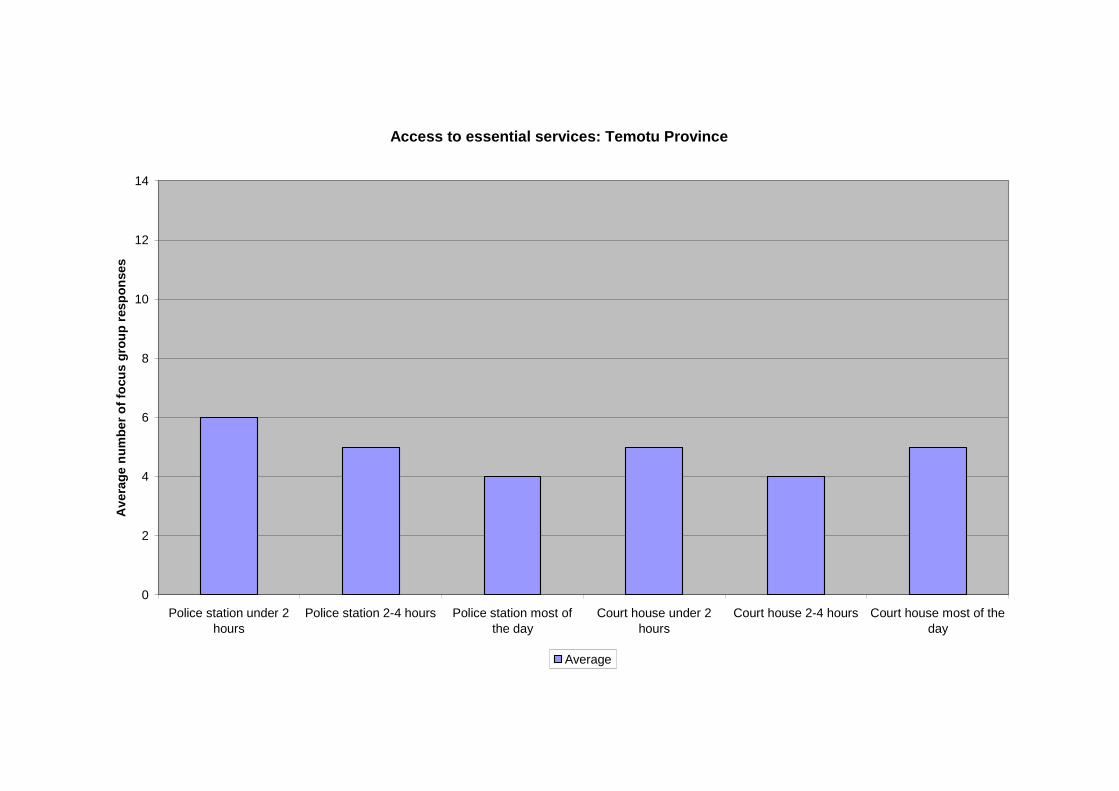
Access to essential services: Temotu Province
0
2
4
6
8
10
12
14
Police station under 2hours
Police station 2-4 hours Police station most ofthe day
Court house under 2hours
Court house 2-4 hours Court house most of theday
Av
era
ge
nu
mb
er
of
focu
sg
rou
pre
sp
on
se
s
Average
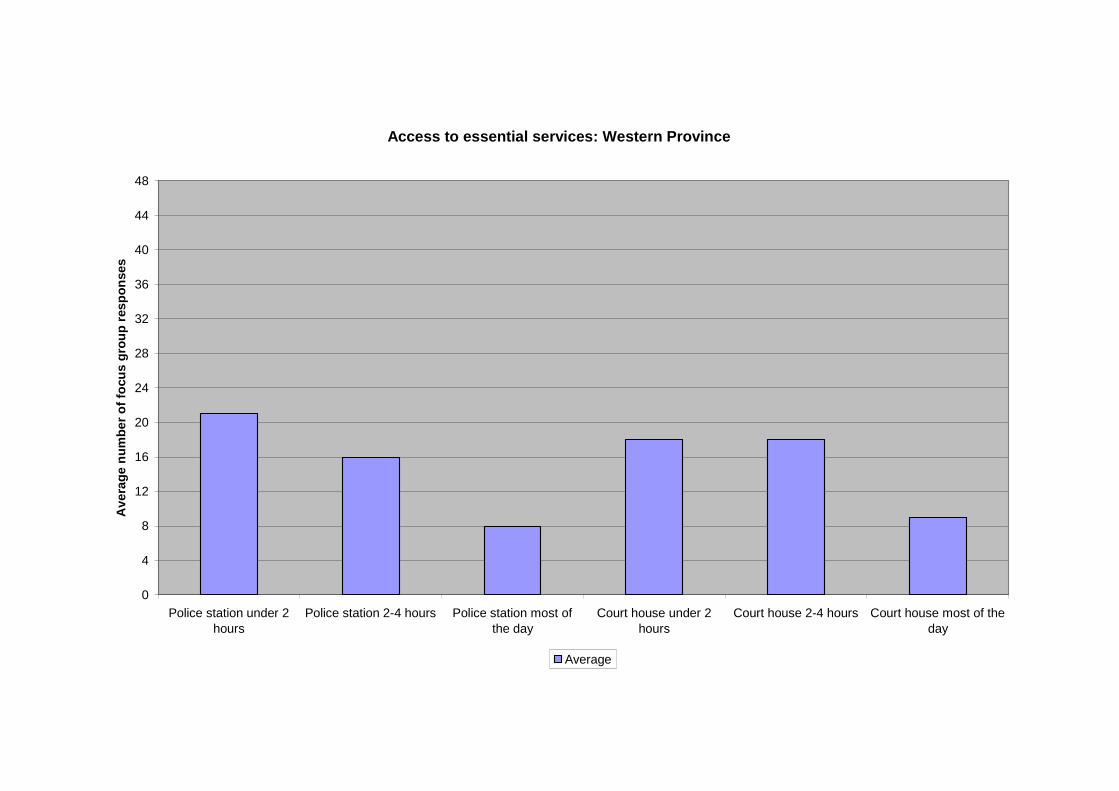
Access to essential services: Western Province
0
4
8
12
16
20
24
28
32
36
40
44
48
Police station under 2hours
Police station 2-4 hours Police station most ofthe day
Court house under 2hours
Court house 2-4 hours Court house most of theday
Av
era
ge
nu
mb
er
of
focu
sg
rou
pre
sp
on
se
s
Average
Charts P24: Decisions about land
Decisions about use of land in the Solomon Islands are complex as cultural considerations of
Melanesian, Polynesian and Micronesian groups must be taken into account at the national,
provincial and local levels..
Analysis:
Considerations of land ownership patterns are essential to understanding the nature of
decision-making about the use of land in all outer provinces surveyed for this report. Central,
Isabel and Makira Provinces have predominantly matrilineal land descent. However, it
should also be noted that 40 percent of land on Makira is inherited through patrilineal descent
patterns. In Choiseul, which also has a sizable Gilbertese (Kiribati) community, and the
Polynesian communities of RenBel and Temotu Provinces, the land is passed on through
patrilineal descent. However, even in areas where women inherit the land through the female
line, decisions about land use are made any the men with the exception of he Western
Province where the majority of decisions about land are made by landowners as a group. In
other communities surveyed, decisions about land made by women, landowners and clans or
tribes were also identified. Focus groups did not have to choose only one group: in many
cases all groups, men, women, landowners, land and tribes, family. Only occasionally did
people report that the community could make land use decisions. This indicates the
complexity of the issues and the need for attention and meaningful inclusive discussion in
any program that requires the use of community land for on-going work. The tabulated
responses are:
Central Province All land is matrilineal but 94 percent of communities stated
that men made the decisions about land use. However, it
should also be noted that 83 percent of focus group responses
reported that women made land use decisions. This was equal
to the 83 percent of responses that stated that landowner and
tribal or clan groups made land use decisions.
Choiseul Province Only 10 percent of land is matrilineal; 90 percent is
patrilineal. 85 percent of communities replied that men made
land use decisions, only 50 percent stated that women could
make decisions about land but 95 percent of decisions were
made by landowners and 90 percent of communities stated
that tribes and clan made decisions about lands.
Isabel Province All land is matrilineal. However, 95 percent of communities
stated that men made the decisions about land use, 80 percent
also stated that landowners (which could include the women)
also made decisions about land. 65 percent stated that the
tribe or clan could also make decisions about land use.
Makira Province While 65 percent of land is matrilineal, 40 percent is
patrilineal. 85 percent of communities surveyed replied that
men made decisions about land use, 75 percent stated that
landowners could make those decisions and 55 percent stated
that the tribes or clans could make land use decisions.
RenBel Province All land is patrilineal. 88 percent of communities stated that
the men made the land use decisions, only 13 percent
(representing one community) stated that women had any say
in land use, but 75 percent also stated that landowners could
make land use decisions and 63 percent that families could
make decisions.
Temotu Province 36 percent of communities surveyed said that land was
matrilineal; 79 percent that it was patrilineal. (Note: one
community answered yes to both questions). 93 percent of
communities responses stated that land use decisions were
made by landowners.
Western Province 76 percent of land is matrilineal; 19 percent of land is
patrilineal. 80 percent of communities surveyed stated that
land use decisions were made by the landowners and 71
percent stated they were made by the tribe or the clan.
Issues:
A number of responses were made to this question. For example, landowners could also
identify as ‘tribes’ and ‘clans’ or ‘family’ but less frequently identified themselves as
‘community’. Landowners, tribes, clan and family are a more identifiable cohesive and
related unit: community implies a wider range of people who may not necessarily be related.
The data support the understanding that men, even in areas of matrilineal land ownership,
make the majority of decisions about land.
While land may be inherited through patrilineal or matrilineal descent, it is apparent that most
decisions about the use of land are still made by men.
PROVINCIAL SIGNPOST: Decisions about land
Ownership of land and decisions about the use of that land made rest with different groupswithin a community. While decisions about land use may reside with men’s groups inmatrilineal or patrilineal land ownership areas, it is essential that other groups in thecommunity, especially women, landowners, tribal or clan groups or families, be consulted inany decisions about use of local land for community development projects.
NATIONAL SIGNPOST: Decisions about land
Any development issue in the Solomon Islands must take into account the complexities oflandownership. There is no uniform pattern of land ownership and no common patterns inthe way decisions are made about land use except that, in a communal society, all membershave some rights to land that have to be respected. Any project must therefore allow time forthe complexities to be worked through in discussion not only with men, but also with womenand youth. Unless issues of land use and landownership are resolved in Honiara, there willcontinue to be arguments, discord and conflict among various cultural groups. This willbecome increasingly evident as land pressures and populations increase
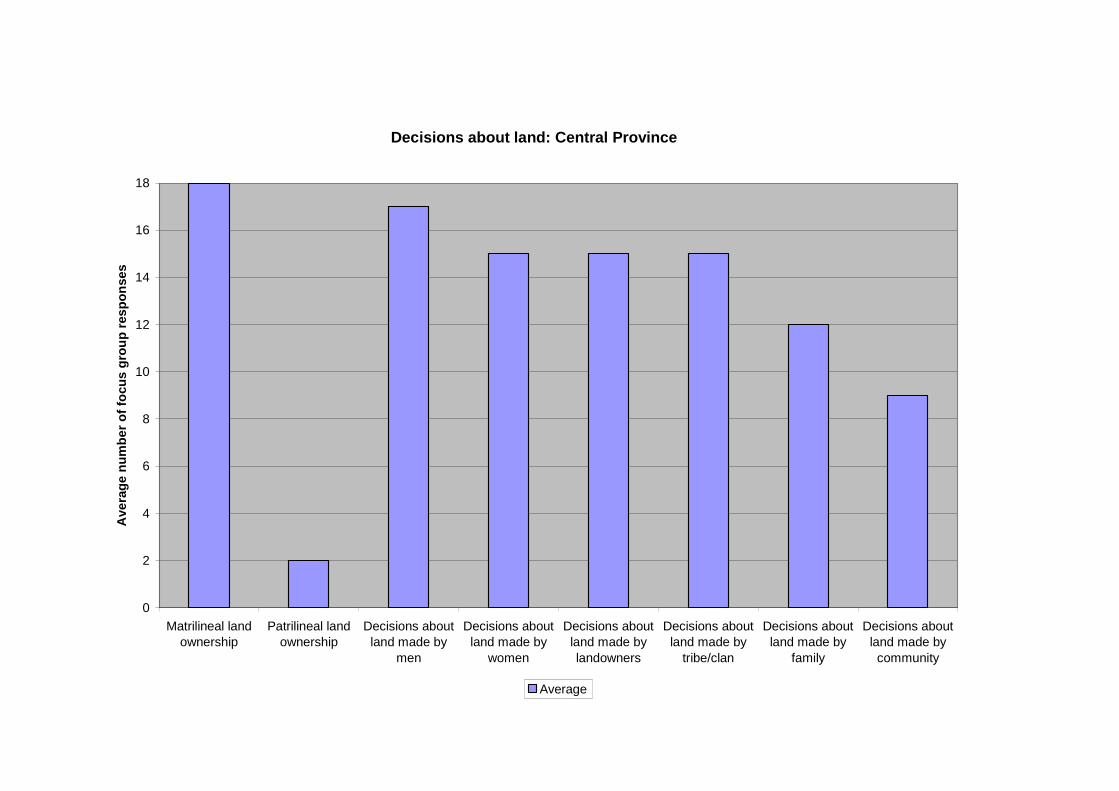
Decisions about land: Central Province
0
2
4
6
8
10
12
14
16
18
Matrilineal landownership
Patrilineal landownership
Decisions aboutland made by
men
Decisions aboutland made by
women
Decisions aboutland made bylandowners
Decisions aboutland made by
tribe/clan
Decisions aboutland made by
family
Decisions aboutland made by
community
Ave
rag
en
um
be
ro
ffo
cu
sg
rou
pre
sp
on
ses
Average

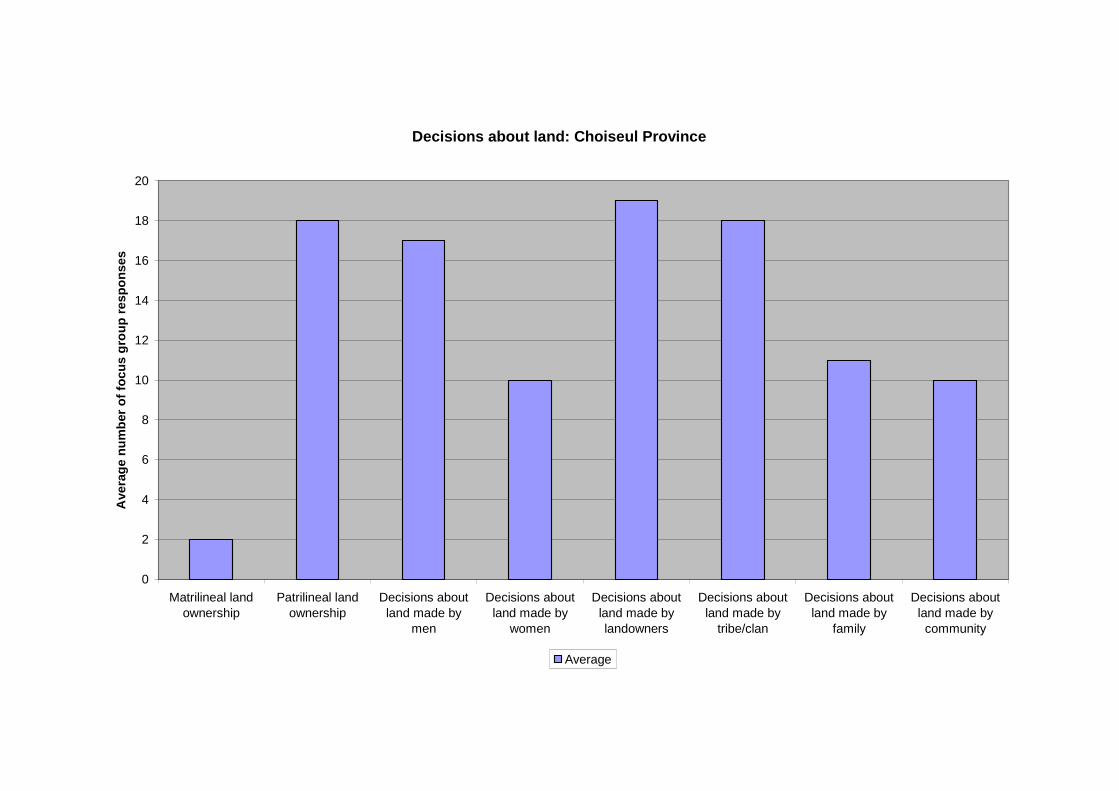
Decisions about land: Choiseul Province
0
2
4
6
8
10
12
14
16
18
20
Matrilineal landownership
Patrilineal landownership
Decisions aboutland made by
men
Decisions aboutland made by
women
Decisions aboutland made bylandowners
Decisions aboutland made by
tribe/clan
Decisions aboutland made by
family
Decisions aboutland made by
community
Ave
rag
en
um
ber
of
foc
us
gro
up
res
po
ns
es
Average
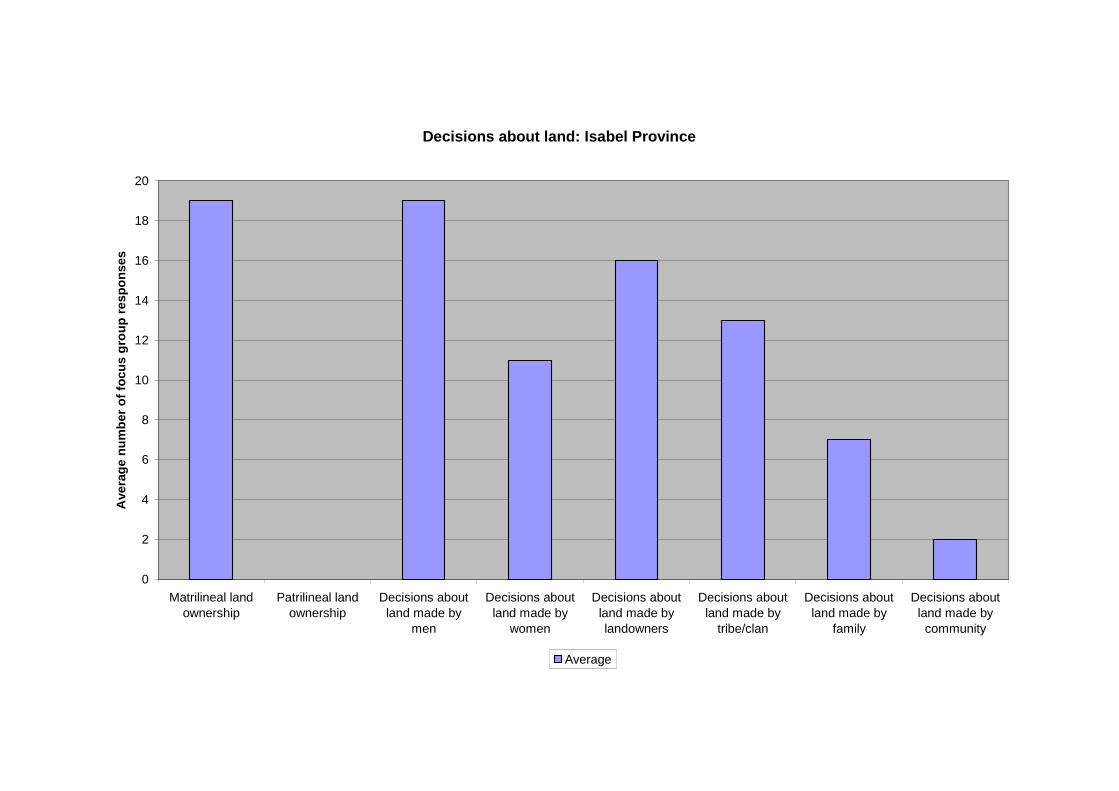
Decisions about land: Isabel Province
0
2
4
6
8
10
12
14
16
18
20
Matrilineal landownership
Patrilineal landownership
Decisions aboutland made by
men
Decisions aboutland made by
women
Decisions aboutland made bylandowners
Decisions aboutland made by
tribe/clan
Decisions aboutland made by
family
Decisions aboutland made by
community
Ave
rag
en
um
ber
of
foc
us
gro
up
res
po
ns
es
Average
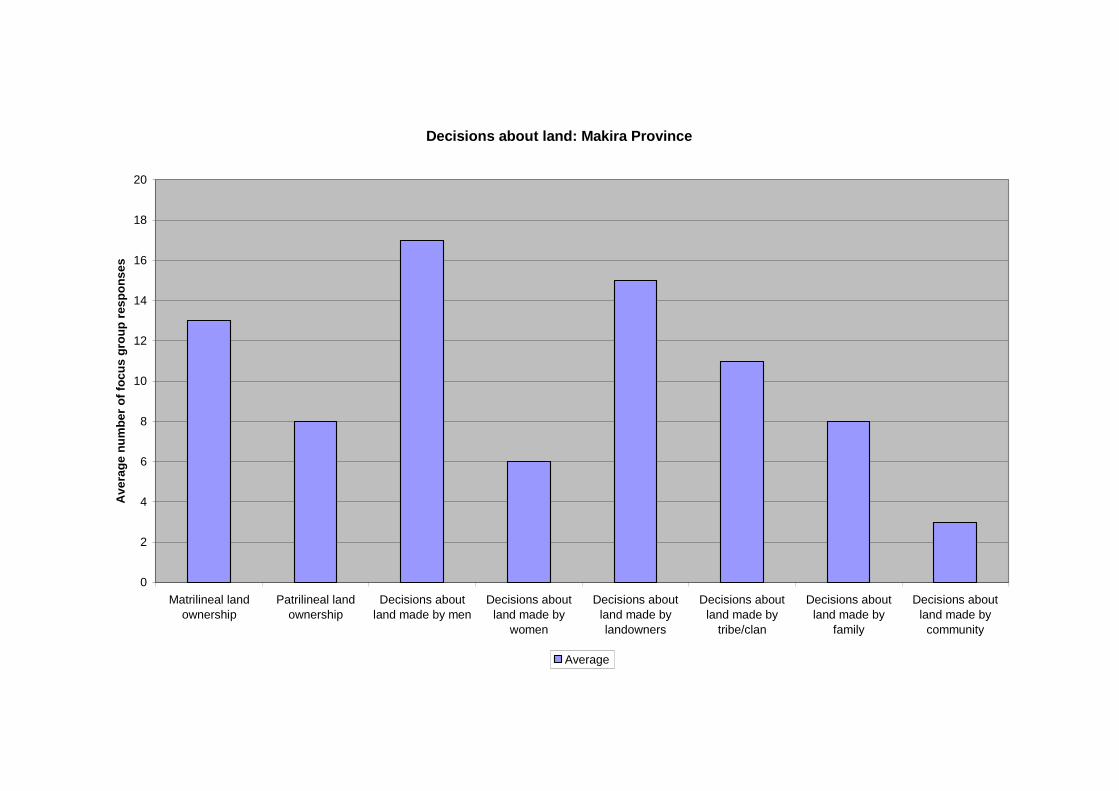
Decisions about land: Makira Province
0
2
4
6
8
10
12
14
16
18
20
Matrilineal land
ownership
Patrilineal land
ownership
Decisions about
land made by men
Decisions about
land made by
women
Decisions about
land made by
landowners
Decisions about
land made by
tribe/clan
Decisions about
land made by
family
Decisions about
land made by
community
Av
era
ge
nu
mb
er
of
foc
us
gro
up
res
po
ns
es
Average
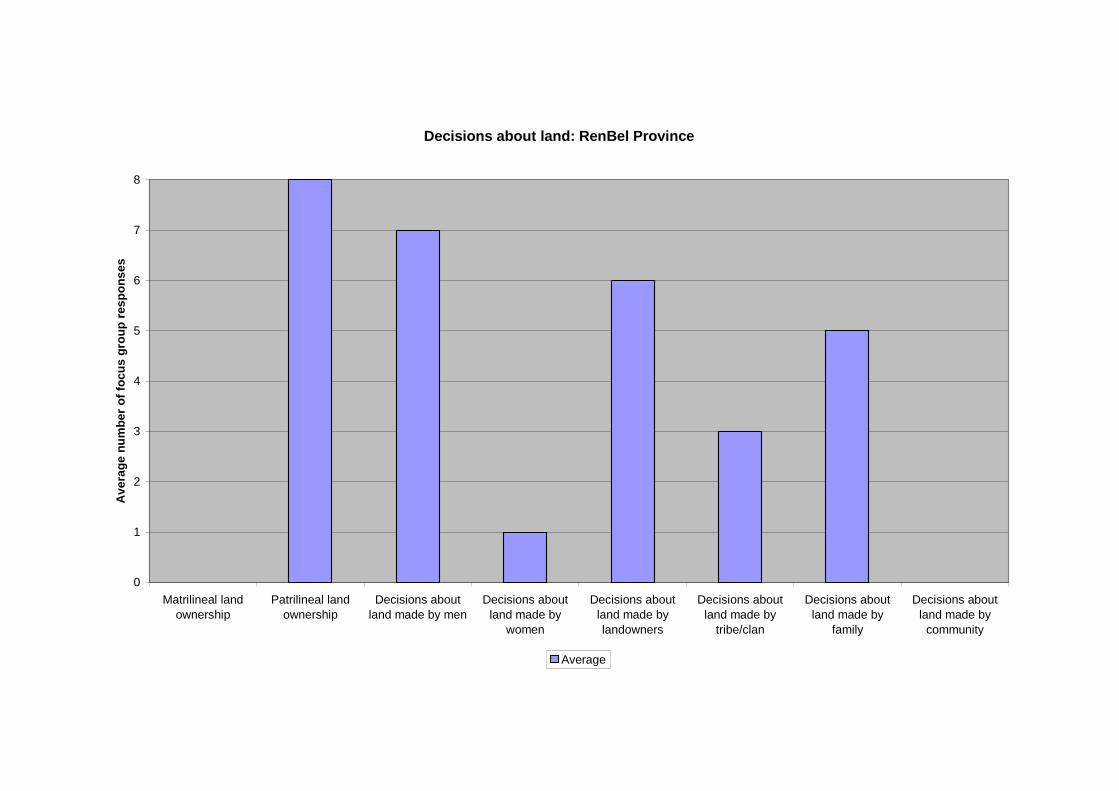
Decisions about land: RenBel Province
0
1
2
3
4
5
6
7
8
Matrilineal land
ownership
Patrilineal land
ownership
Decisions about
land made by men
Decisions about
land made by
women
Decisions about
land made by
landowners
Decisions about
land made by
tribe/clan
Decisions about
land made by
family
Decisions about
land made by
community
Av
era
ge
nu
mb
er
of
foc
us
gro
up
res
po
ns
es
Average
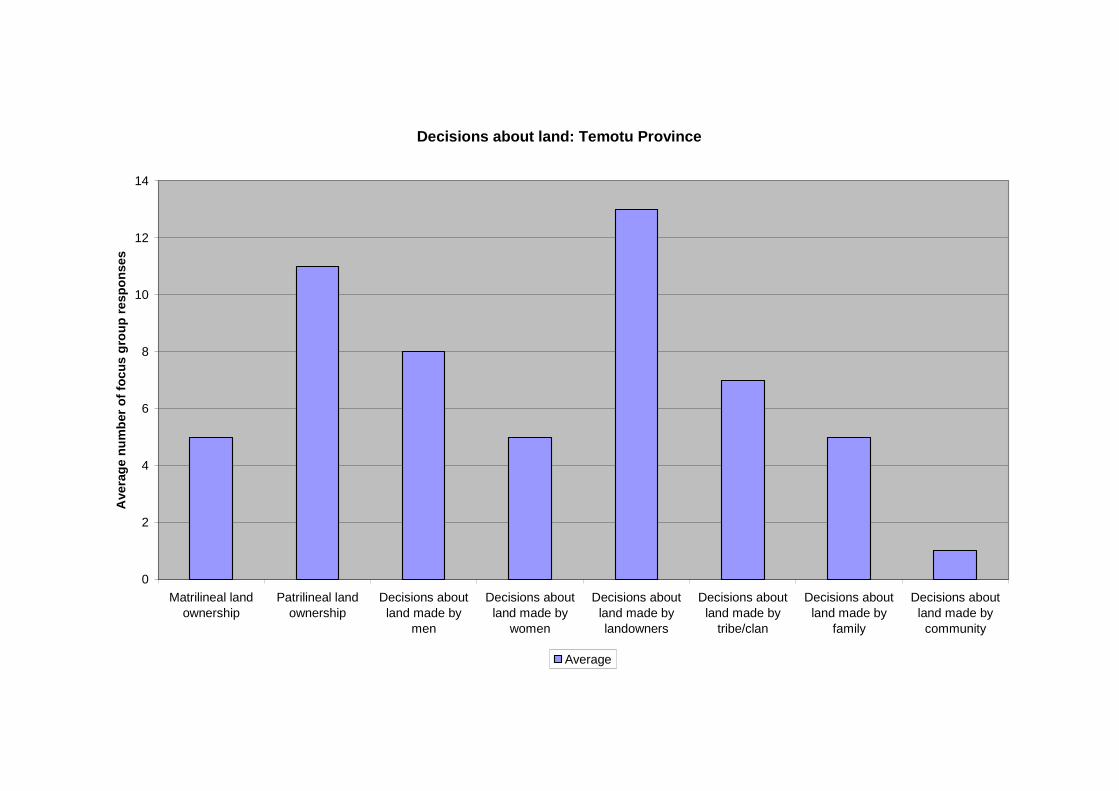
Decisions about land: Temotu Province
0
2
4
6
8
10
12
14
Matrilineal landownership
Patrilineal landownership
Decisions aboutland made by
men
Decisions aboutland made by
women
Decisions aboutland made bylandowners
Decisions aboutland made by
tribe/clan
Decisions aboutland made by
family
Decisions aboutland made by
community
Ave
rag
en
um
ber
of
foc
us
gro
up
res
po
ns
es
Average
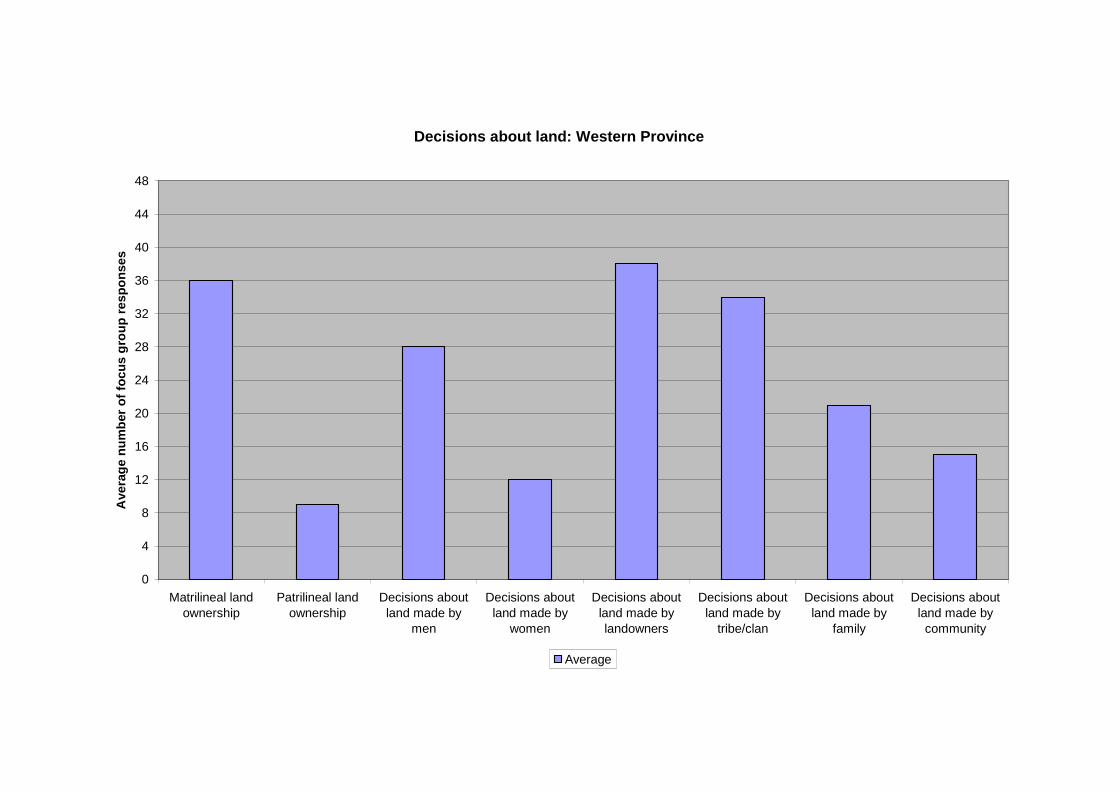
Decisions about land: Western Province
0
4
8
12
16
20
24
28
32
36
40
44
48
Matrilineal landownership
Patrilineal landownership
Decisions aboutland made by
men
Decisions aboutland made by
women
Decisions aboutland made bylandowners
Decisions aboutland made by
tribe/clan
Decisions aboutland made by
family
Decisions aboutland made by
community
Ave
rag
en
um
ber
of
foc
us
gro
up
res
po
ns
es
Average
Charts P25: Say in village affairs
It follows that if men have a major part in decisions about land use, then in societies with
strongly defined gender roles, either Melanesian, Polynesian or Micronesian, men have a
dominant place in village affairs. However, women and youth can also play a significant role
in the management of the village and should be empowered to make more decisions.
Analysis:
In more than 90 percent communities surveyed in the outer provinces, except for in Temotu
Province, village people stated that men have a dominant say in the village affairs. In
Temotu, only 64 percent of people stated that men have a say in the affairs of the village, 43
percent stated that women also participate in village affairs. However, in the other 6
provinces it should be noted that women did have a significant say in village affairs as did
youth but it depends strongly on the issue under discussion. In more than 70 percent of
communities surveyed, or nearly all communities in RenBel Province, it was the nature of the
issue that governed who had say in village affairs. The nature of the issues was not explored
as the aim of this survey was to gauge village perceptions and ways in which communities
could be accessed by agencies such as CSP. The tabulated responses are:
Central Province 94 percent of communities stated that men have the say in
village affairs and 61 percent that women have a say. Only 56
percent agreed that youth have a say but 89 percent of
communities stated that it depends on the issue under
discussion.
Choiseul Province 95 percent of communities surveyed stated that men have a
say in village affairs, 75 percent that women have a say and 65
percent that youth have a say but 90 percent of communities
surveyed replied that it depends on the issue.
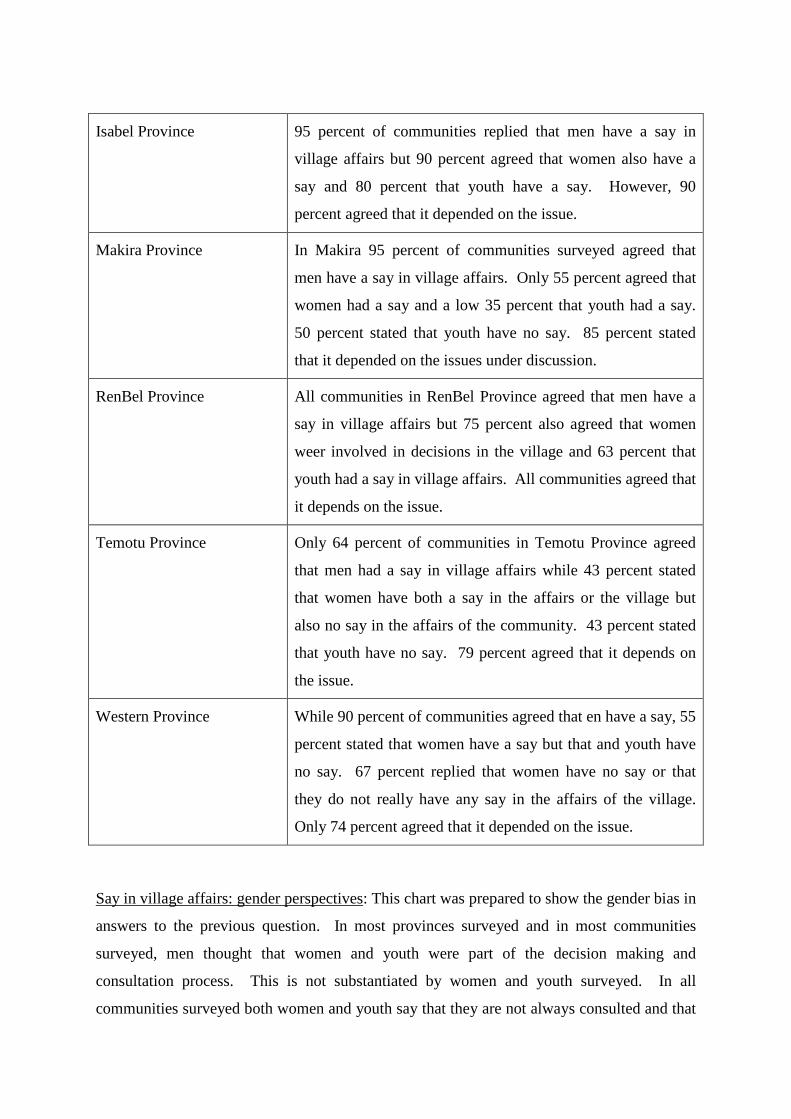
Isabel Province 95 percent of communities replied that men have a say in
village affairs but 90 percent agreed that women also have a
say and 80 percent that youth have a say. However, 90
percent agreed that it depended on the issue.
Makira Province In Makira 95 percent of communities surveyed agreed that
men have a say in village affairs. Only 55 percent agreed that
women had a say and a low 35 percent that youth had a say.
50 percent stated that youth have no say. 85 percent stated
that it depended on the issues under discussion.
RenBel Province All communities in RenBel Province agreed that men have a
say in village affairs but 75 percent also agreed that women
weer involved in decisions in the village and 63 percent that
youth had a say in village affairs. All communities agreed that
it depends on the issue.
Temotu Province Only 64 percent of communities in Temotu Province agreed
that men had a say in village affairs while 43 percent stated
that women have both a say in the affairs or the village but
also no say in the affairs of the community. 43 percent stated
that youth have no say. 79 percent agreed that it depends on
the issue.
Western Province While 90 percent of communities agreed that en have a say, 55
percent stated that women have a say but that and youth have
no say. 67 percent replied that women have no say or that
they do not really have any say in the affairs of the village.
Only 74 percent agreed that it depended on the issue.
Say in village affairs: gender perspectives: This chart was prepared to show the gender bias in
answers to the previous question. In most provinces surveyed and in most communities
surveyed, men thought that women and youth were part of the decision making and
consultation process. This is not substantiated by women and youth surveyed. In all
communities surveyed both women and youth say that they are not always consulted and that
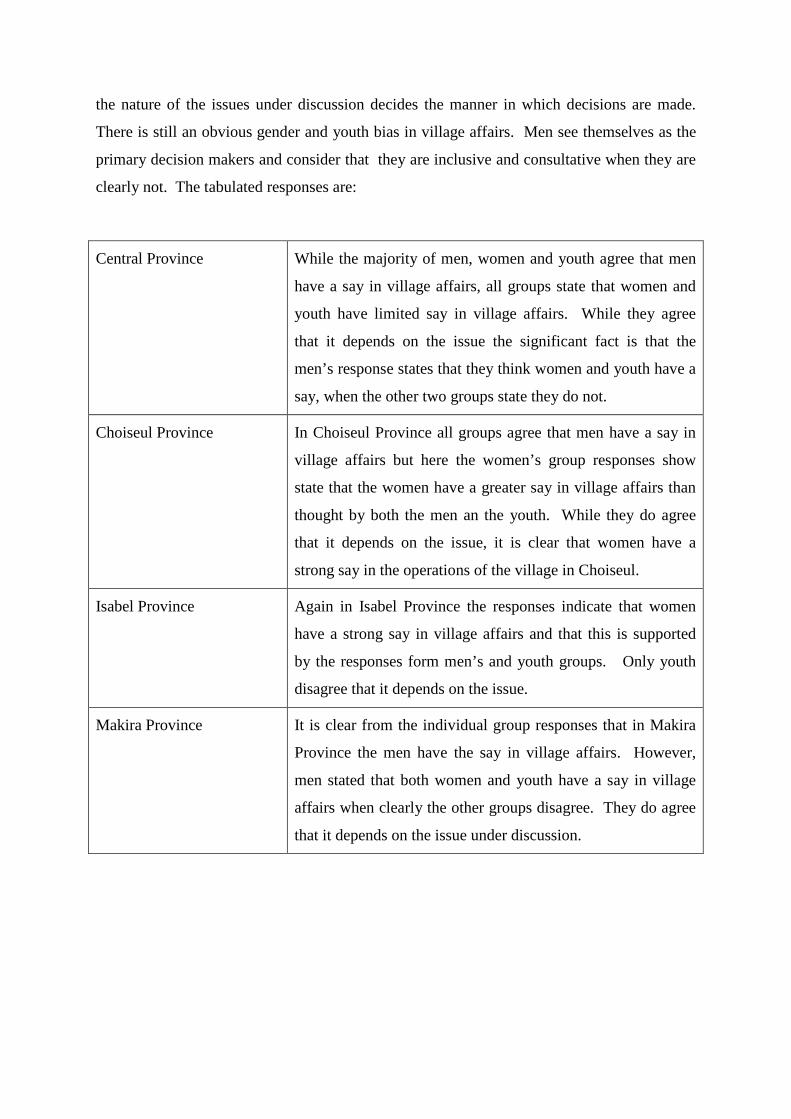
the nature of the issues under discussion decides the manner in which decisions are made.
There is still an obvious gender and youth bias in village affairs. Men see themselves as the
primary decision makers and consider that they are inclusive and consultative when they are
clearly not. The tabulated responses are:
Central Province While the majority of men, women and youth agree that men
have a say in village affairs, all groups state that women and
youth have limited say in village affairs. While they agree
that it depends on the issue the significant fact is that the
men’s response states that they think women and youth have a
say, when the other two groups state they do not.
Choiseul Province In Choiseul Province all groups agree that men have a say in
village affairs but here the women’s group responses show
state that the women have a greater say in village affairs than
thought by both the men an the youth. While they do agree
that it depends on the issue, it is clear that women have a
strong say in the operations of the village in Choiseul.
Isabel Province Again in Isabel Province the responses indicate that women
have a strong say in village affairs and that this is supported
by the responses form men’s and youth groups. Only youth
disagree that it depends on the issue.
Makira Province It is clear from the individual group responses that in Makira
Province the men have the say in village affairs. However,
men stated that both women and youth have a say in village
affairs when clearly the other groups disagree. They do agree
that it depends on the issue under discussion.
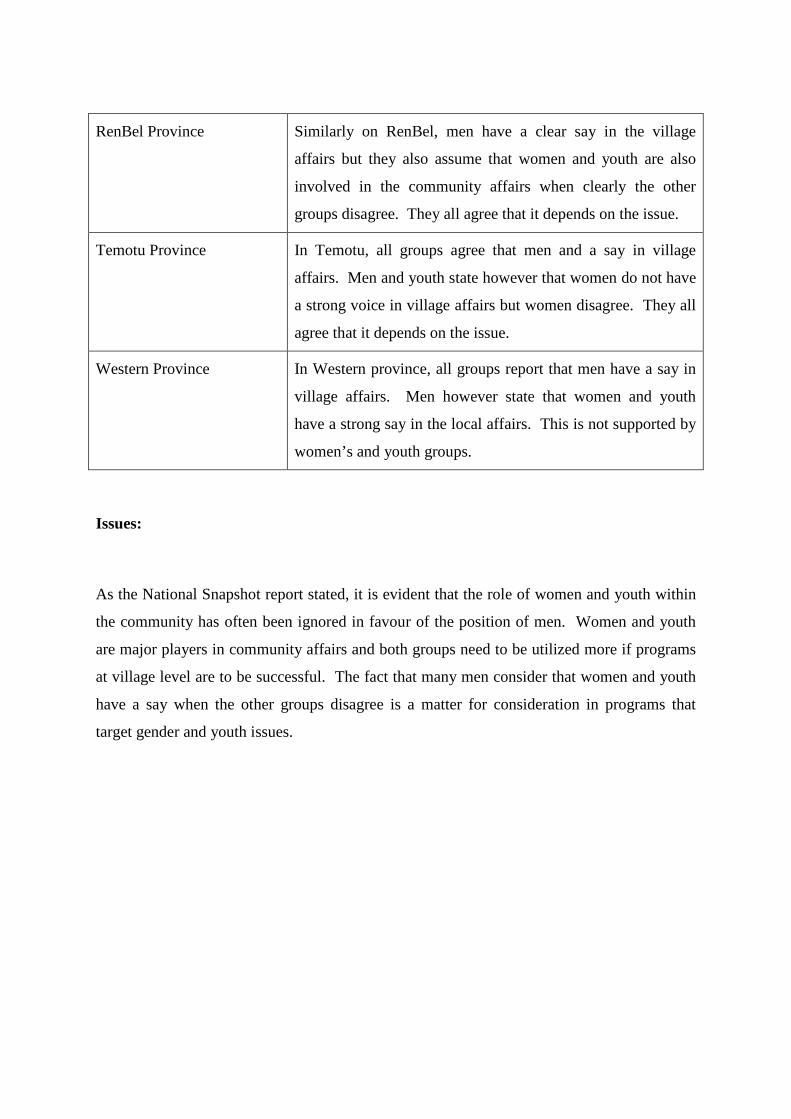
RenBel Province Similarly on RenBel, men have a clear say in the village
affairs but they also assume that women and youth are also
involved in the community affairs when clearly the other
groups disagree. They all agree that it depends on the issue.
Temotu Province In Temotu, all groups agree that men and a say in village
affairs. Men and youth state however that women do not have
a strong voice in village affairs but women disagree. They all
agree that it depends on the issue.
Western Province In Western province, all groups report that men have a say in
village affairs. Men however state that women and youth
have a strong say in the local affairs. This is not supported by
women’s and youth groups.
Issues:
As the National Snapshot report stated, it is evident that the role of women and youth within
the community has often been ignored in favour of the position of men. Women and youth
are major players in community affairs and both groups need to be utilized more if programs
at village level are to be successful. The fact that many men consider that women and youth
have a say when the other groups disagree is a matter for consideration in programs that
target gender and youth issues.
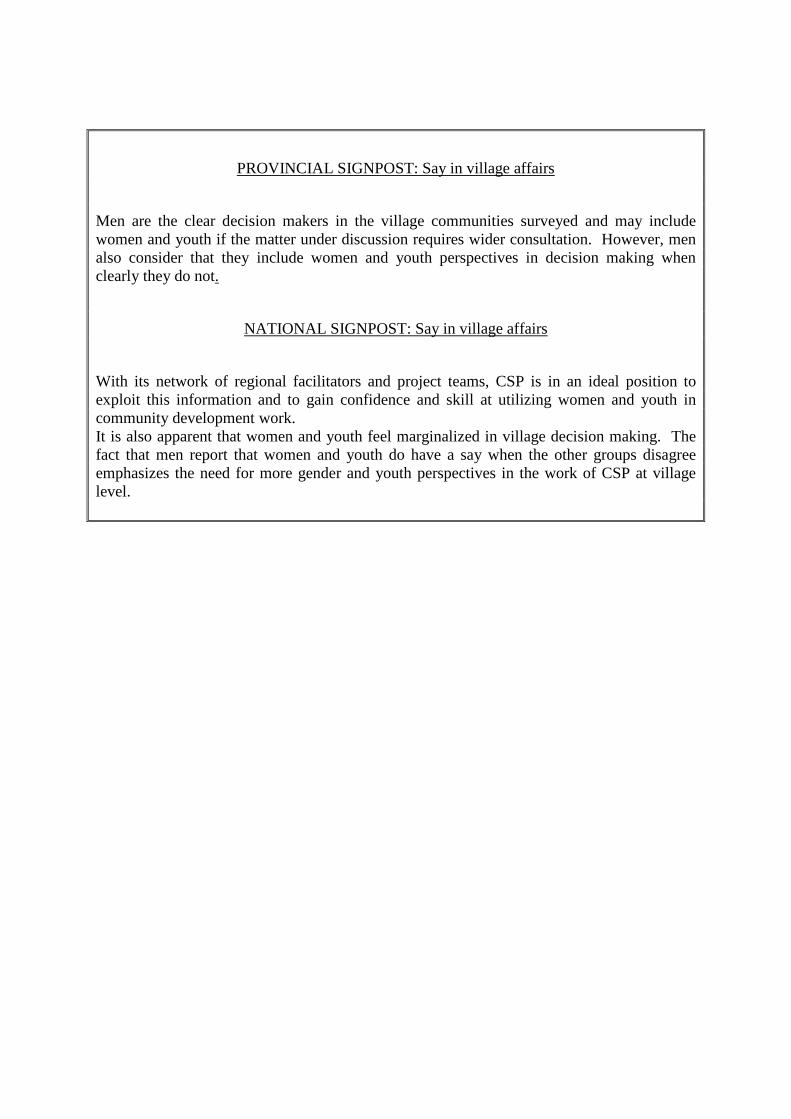
PROVINCIAL SIGNPOST: Say in village affairs
Men are the clear decision makers in the village communities surveyed and may includewomen and youth if the matter under discussion requires wider consultation. However, menalso consider that they include women and youth perspectives in decision making whenclearly they do not.
NATIONAL SIGNPOST: Say in village affairs
With its network of regional facilitators and project teams, CSP is in an ideal position toexploit this information and to gain confidence and skill at utilizing women and youth incommunity development work.It is also apparent that women and youth feel marginalized in village decision making. Thefact that men report that women and youth do have a say when the other groups disagreeemphasizes the need for more gender and youth perspectives in the work of CSP at villagelevel.
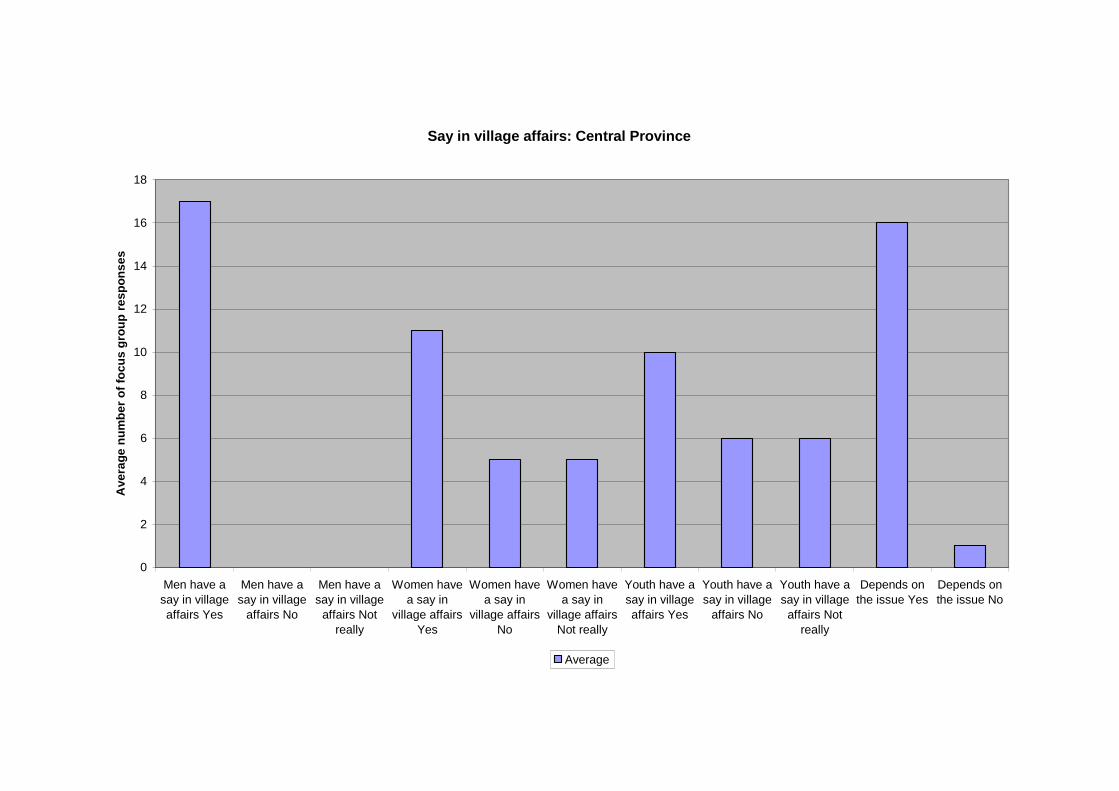
Say in village affairs: Central Province
0
2
4
6
8
10
12
14
16
18
Men have a
say in village
affairs Yes
Men have a
say in village
affairs No
Men have a
say in village
affairs Not
really
Women have
a say in
village affairs
Yes
Women have
a say in
village affairs
No
Women have
a say in
village affairs
Not really
Youth have a
say in village
affairs Yes
Youth have a
say in village
affairs No
Youth have a
say in village
affairs Not
really
Depends on
the issue Yes
Depends on
the issue No
Ave
rag
en
um
be
ro
ffo
cu
sg
rou
pre
sp
on
se
s
Average
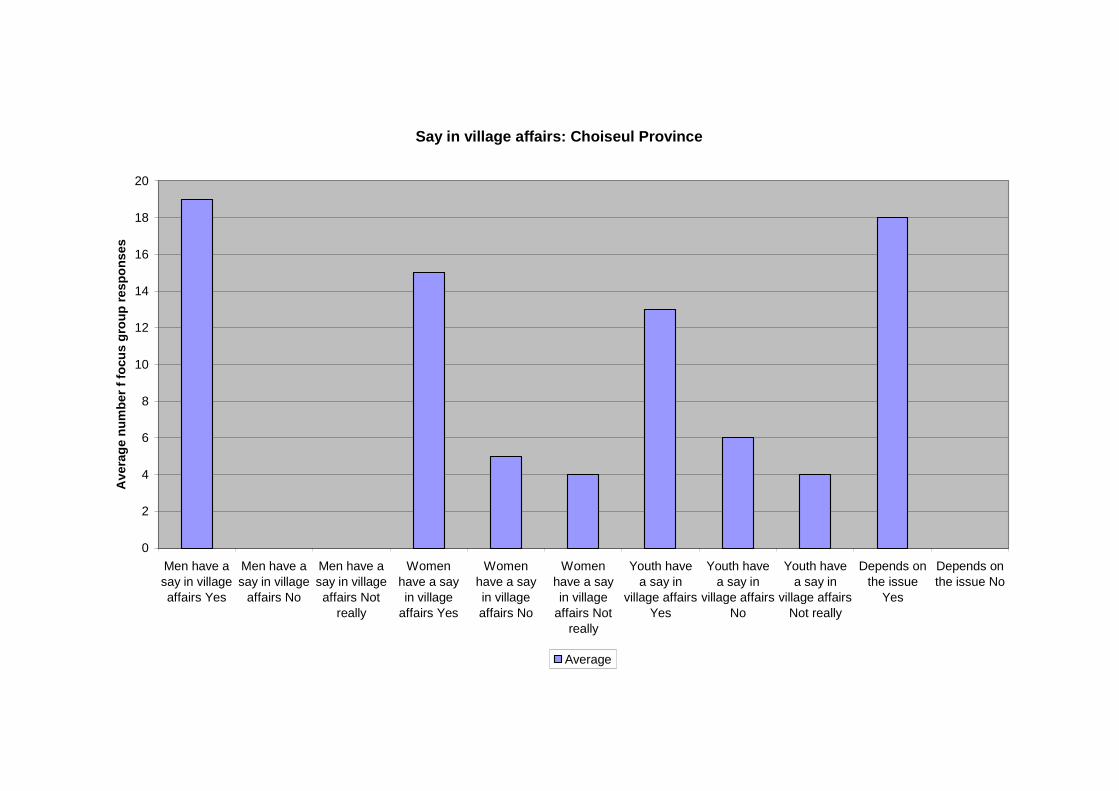
Say in village affairs: Choiseul Province
0
2
4
6
8
10
12
14
16
18
20
Men have asay in villageaffairs Yes
Men have asay in village
affairs No
Men have asay in villageaffairs Not
really
Womenhave a sayin village
affairs Yes
Womenhave a sayin villageaffairs No
Womenhave a sayin village
affairs Notreally
Youth havea say in
village affairsYes
Youth havea say in
village affairsNo
Youth havea say in
village affairsNot really
Depends onthe issue
Yes
Depends onthe issue No
Av
era
ge
nu
mb
er
ffo
cu
sg
rou
pre
sp
on
se
s
Average
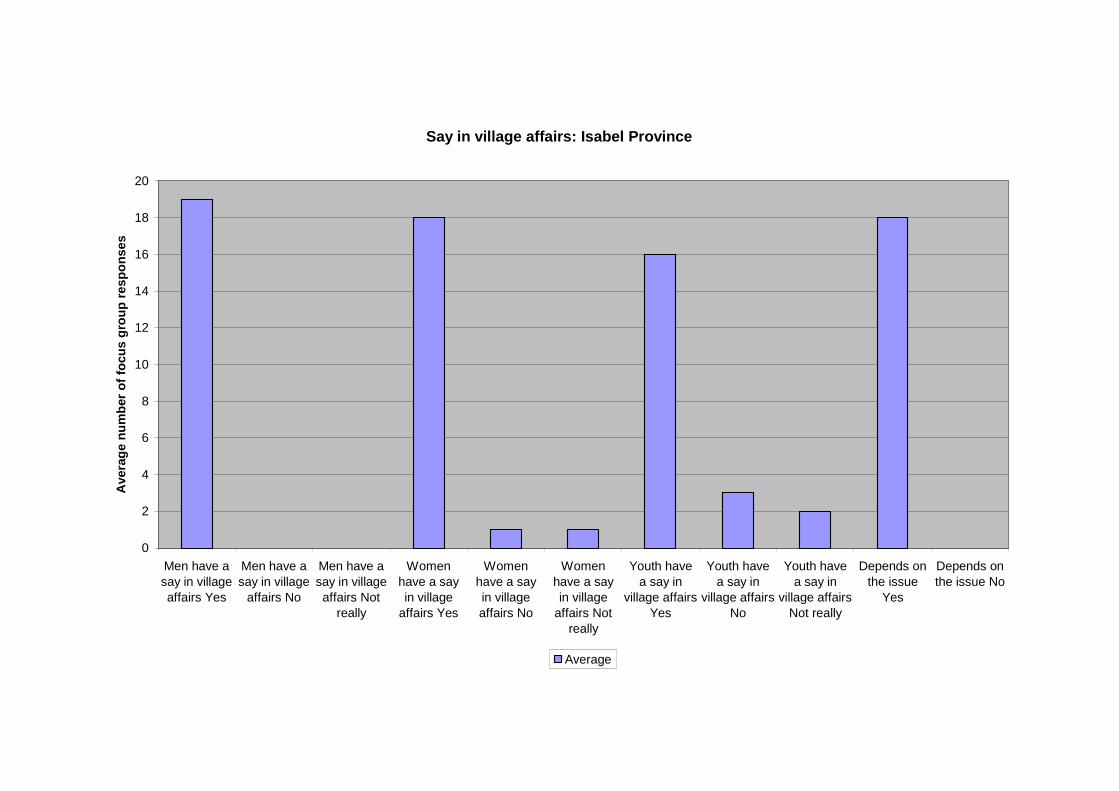
Say in village affairs: Isabel Province
0
2
4
6
8
10
12
14
16
18
20
Men have asay in villageaffairs Yes
Men have asay in village
affairs No
Men have asay in villageaffairs Not
really
Womenhave a sayin village
affairs Yes
Womenhave a sayin villageaffairs No
Womenhave a sayin village
affairs Notreally
Youth havea say in
village affairsYes
Youth havea say in
village affairsNo
Youth havea say in
village affairsNot really
Depends onthe issue
Yes
Depends onthe issue No
Ave
rag
en
um
ber
of
foc
us
gro
up
res
po
ns
es
Average
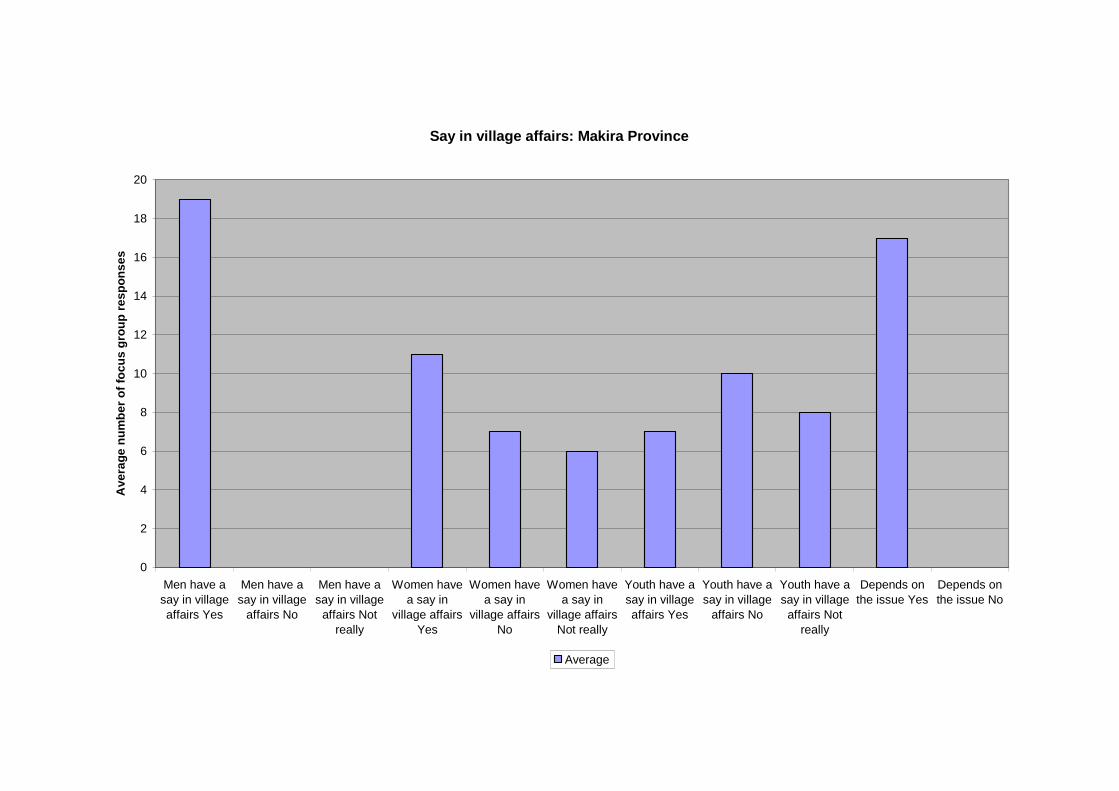
Say in village affairs: Makira Province
0
2
4
6
8
10
12
14
16
18
20
Men have a
say in village
affairs Yes
Men have a
say in village
affairs No
Men have a
say in village
affairs Not
really
Women have
a say in
village affairs
Yes
Women have
a say in
village affairs
No
Women have
a say in
village affairs
Not really
Youth have a
say in village
affairs Yes
Youth have a
say in village
affairs No
Youth have a
say in village
affairs Not
really
Depends on
the issue Yes
Depends on
the issue No
Ave
rag
en
um
be
ro
ffo
cu
sg
rou
pre
sp
on
se
s
Average
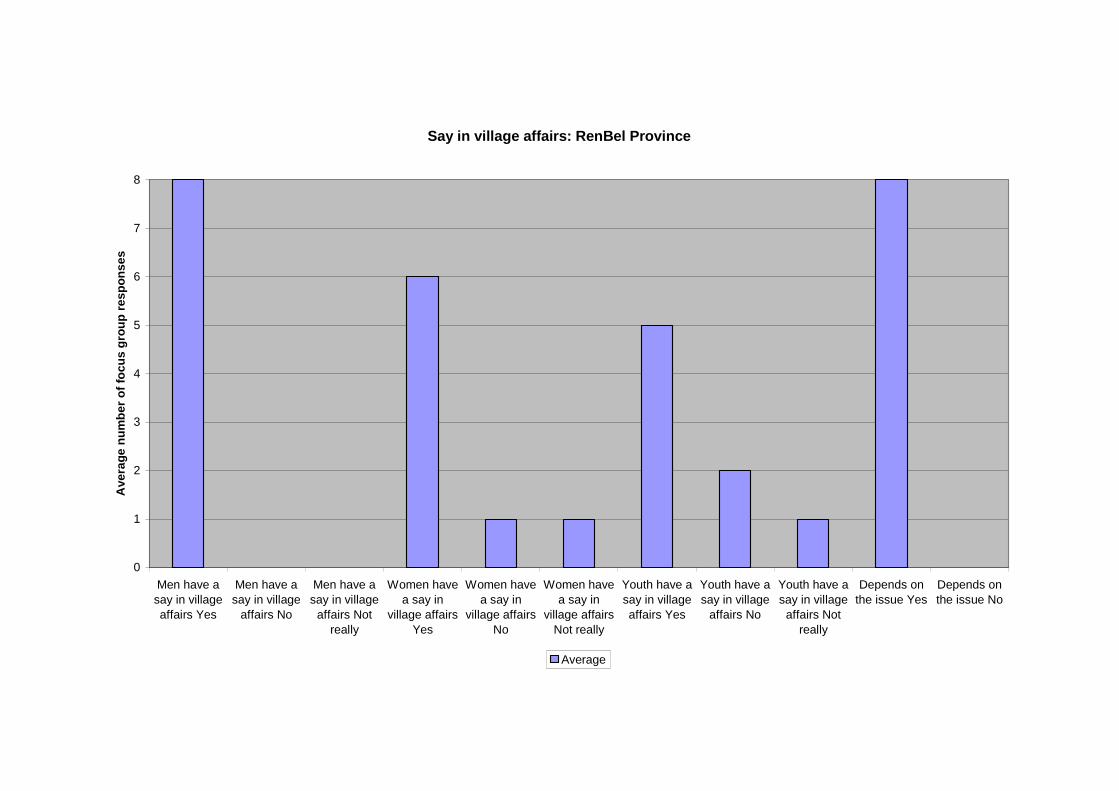
Say in village affairs: RenBel Province
0
1
2
3
4
5
6
7
8
Men have a
say in village
affairs Yes
Men have a
say in village
affairs No
Men have a
say in village
affairs Not
really
Women have
a say in
village affairs
Yes
Women have
a say in
village affairs
No
Women have
a say in
village affairs
Not really
Youth have a
say in village
affairs Yes
Youth have a
say in village
affairs No
Youth have a
say in village
affairs Not
really
Depends on
the issue Yes
Depends on
the issue No
Ave
rag
en
um
be
ro
ffo
cu
sg
rou
pre
sp
on
se
s
Average
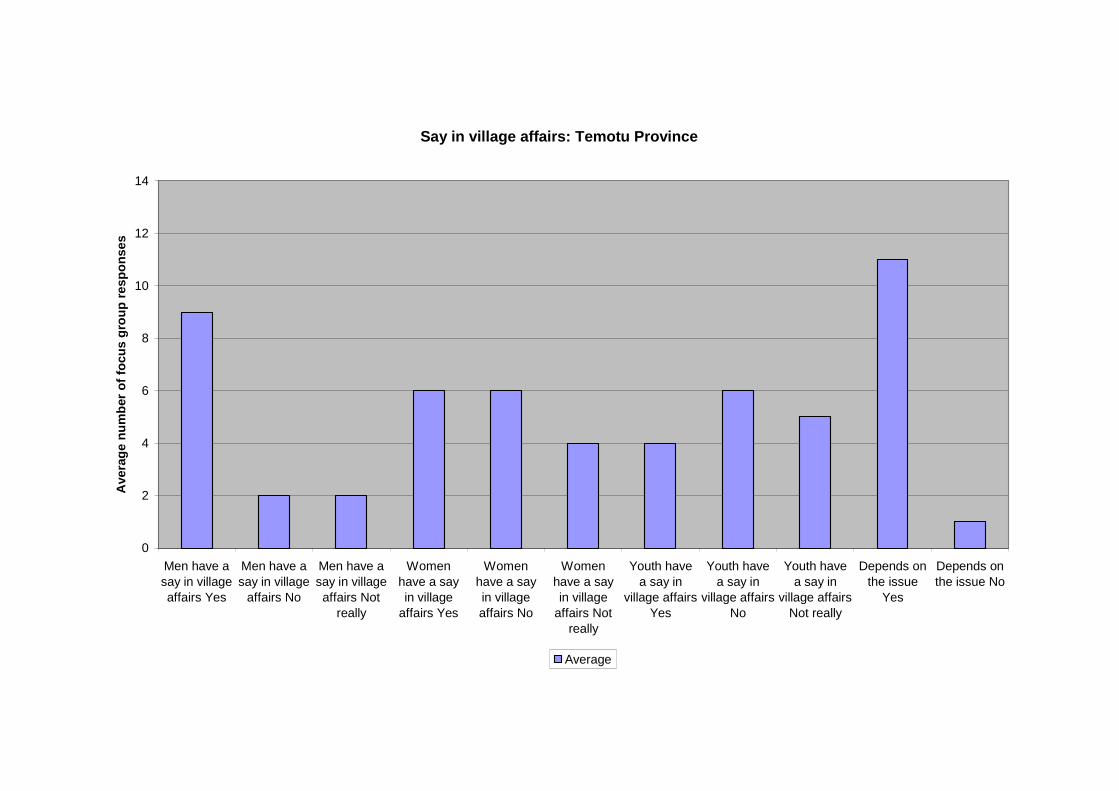
Say in village affairs: Temotu Province
0
2
4
6
8
10
12
14
Men have asay in villageaffairs Yes
Men have asay in village
affairs No
Men have asay in villageaffairs Not
really
Womenhave a sayin village
affairs Yes
Womenhave a sayin villageaffairs No
Womenhave a sayin village
affairs Notreally
Youth havea say in
village affairsYes
Youth havea say in
village affairsNo
Youth havea say in
village affairsNot really
Depends onthe issue
Yes
Depends onthe issue No
Ave
rag
en
um
ber
of
foc
us
gro
up
res
po
ns
es
Average
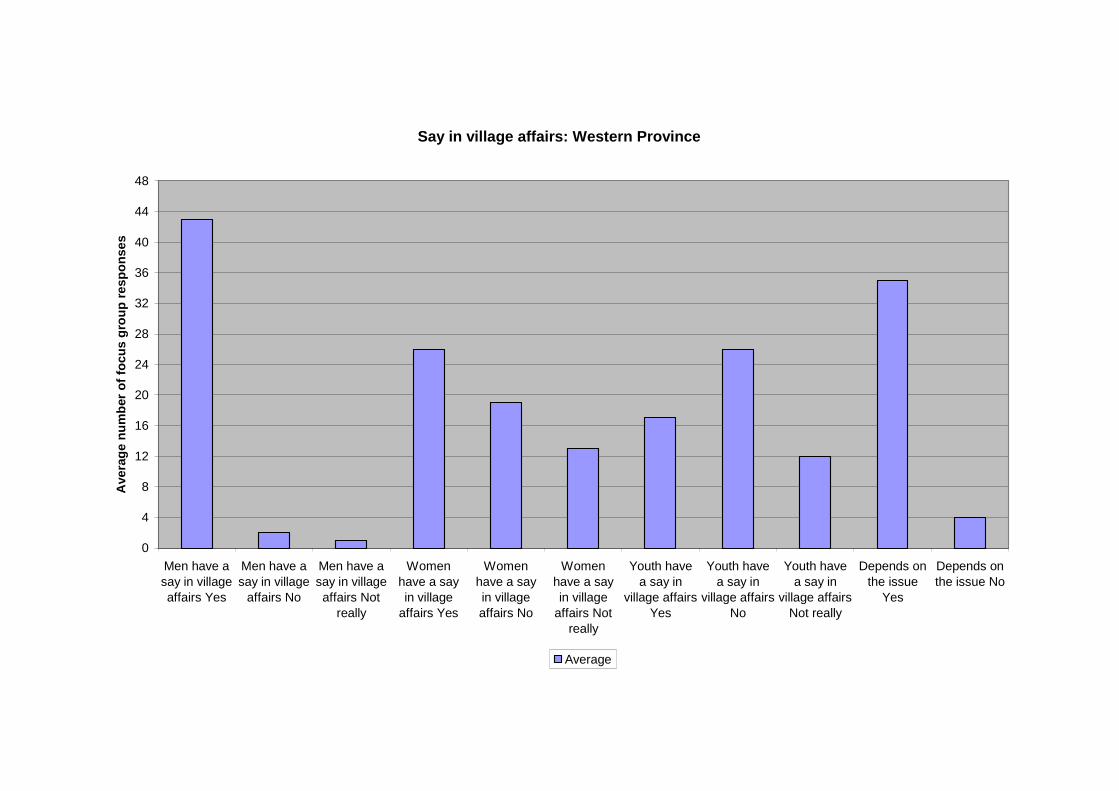
Say in village affairs: Western Province
0
4
8
12
16
20
24
28
32
36
40
44
48
Men have asay in villageaffairs Yes
Men have asay in village
affairs No
Men have asay in villageaffairs Not
really
Womenhave a sayin village
affairs Yes
Womenhave a sayin villageaffairs No
Womenhave a sayin village
affairs Notreally
Youth havea say in
village affairsYes
Youth havea say in
village affairsNo
Youth havea say in
village affairsNot really
Depends onthe issue
Yes
Depends onthe issue No
Ave
rag
en
um
ber
of
foc
us
gro
up
res
po
ns
es
Average
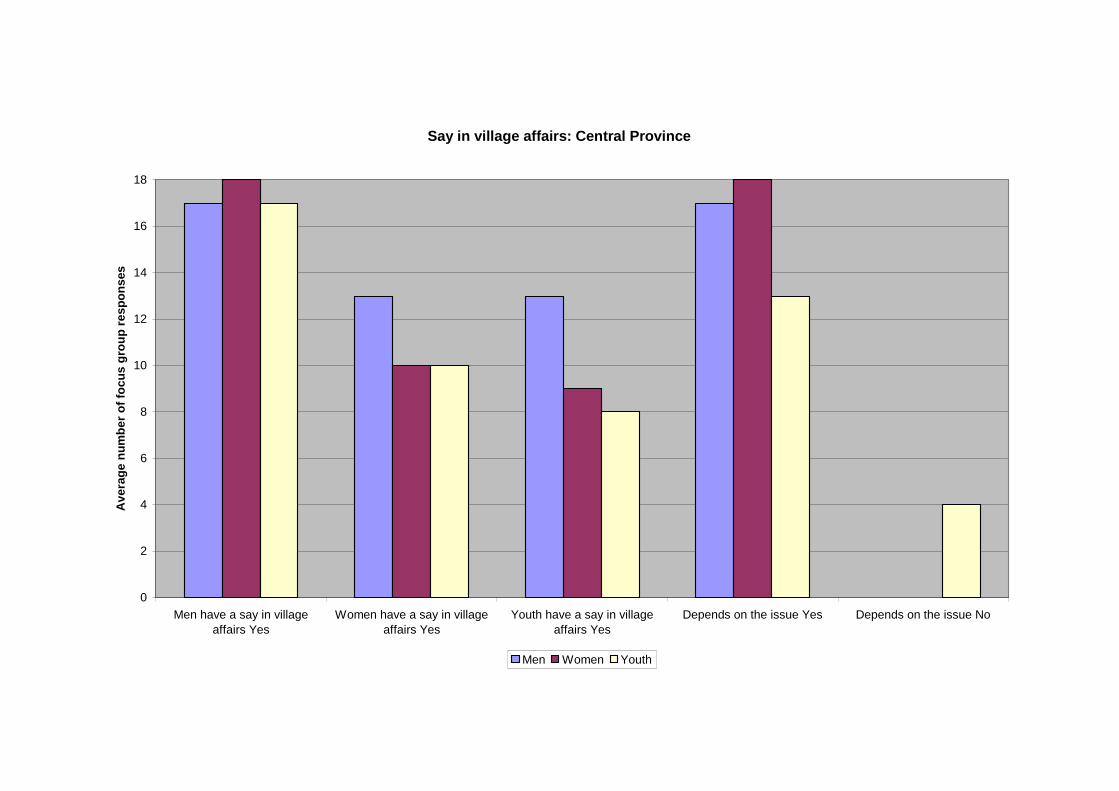
Say in village affairs: Central Province
0
2
4
6
8
10
12
14
16
18
Men have a say in village
affairs Yes
Women have a say in village
affairs Yes
Youth have a say in village
affairs Yes
Depends on the issue Yes Depends on the issue No
Av
era
ge
nu
mb
er
of
foc
us
gro
up
res
po
ns
es
Men Women Youth
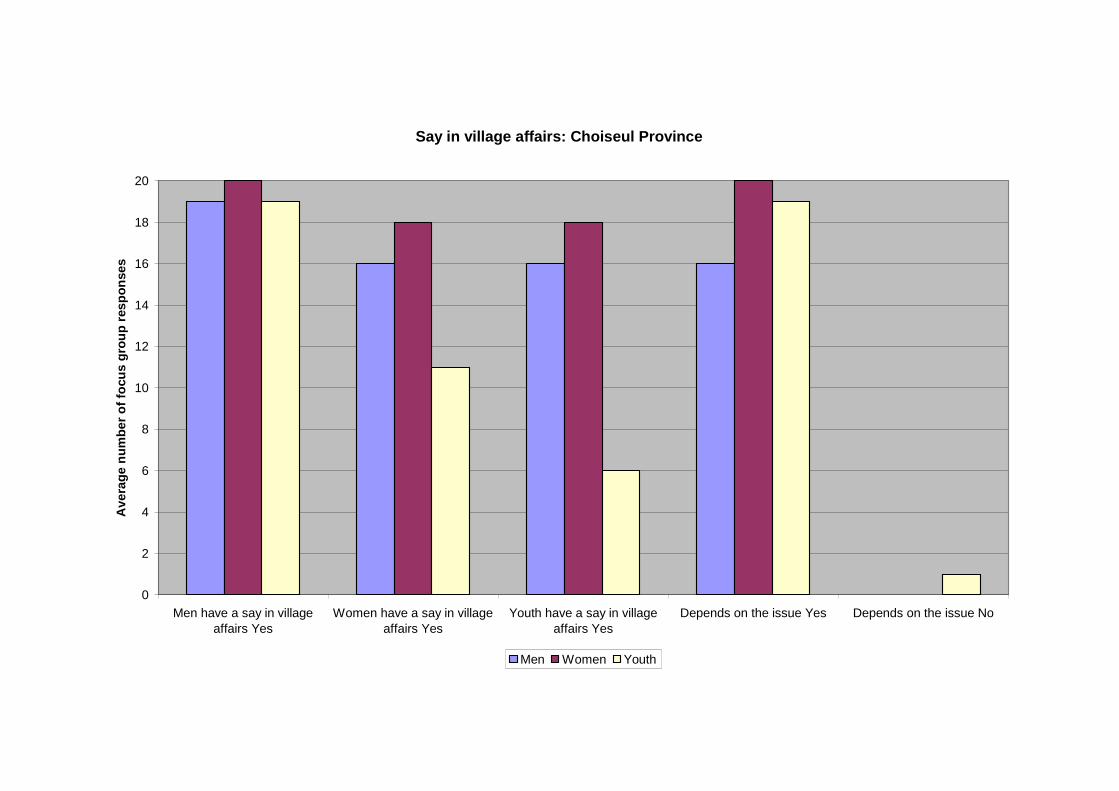
Say in village affairs: Choiseul Province
0
2
4
6
8
10
12
14
16
18
20
Men have a say in villageaffairs Yes
Women have a say in villageaffairs Yes
Youth have a say in villageaffairs Yes
Depends on the issue Yes Depends on the issue No
Av
era
ge
nu
mb
er
of
focu
sg
rou
pre
sp
on
se
s
Men Women Youth
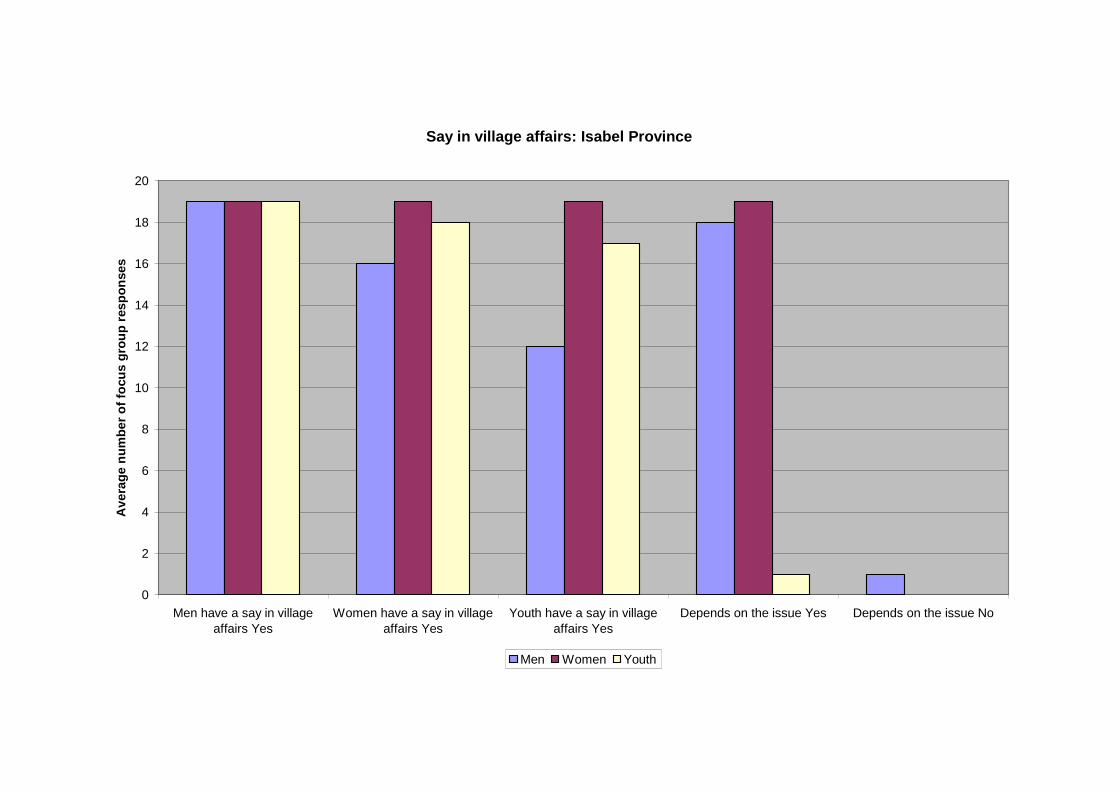
Say in village affairs: Isabel Province
0
2
4
6
8
10
12
14
16
18
20
Men have a say in villageaffairs Yes
Women have a say in villageaffairs Yes
Youth have a say in villageaffairs Yes
Depends on the issue Yes Depends on the issue No
Av
era
ge
nu
mb
er
of
focu
sg
rou
pre
sp
on
se
s
Men Women Youth
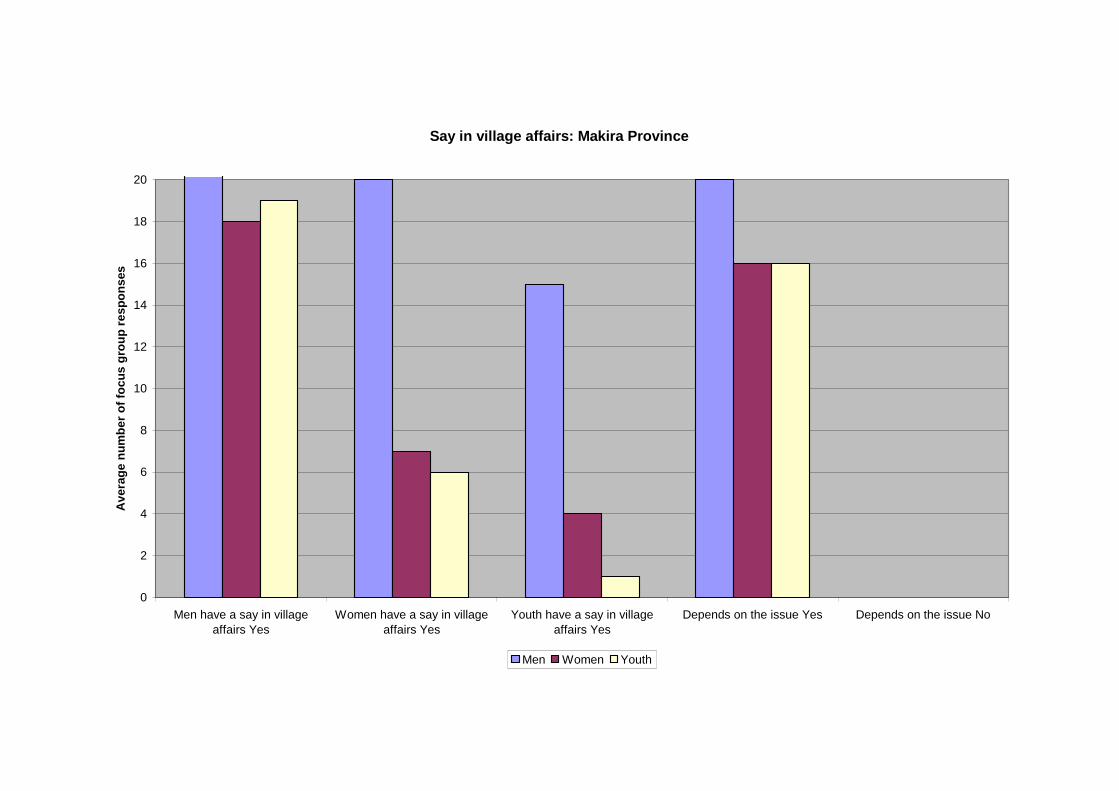
Say in village affairs: Makira Province
0
2
4
6
8
10
12
14
16
18
20
Men have a say in village
affairs Yes
Women have a say in village
affairs Yes
Youth have a say in village
affairs Yes
Depends on the issue Yes Depends on the issue No
Av
era
ge
nu
mb
er
of
foc
us
gro
up
res
po
ns
es
Men Women Youth
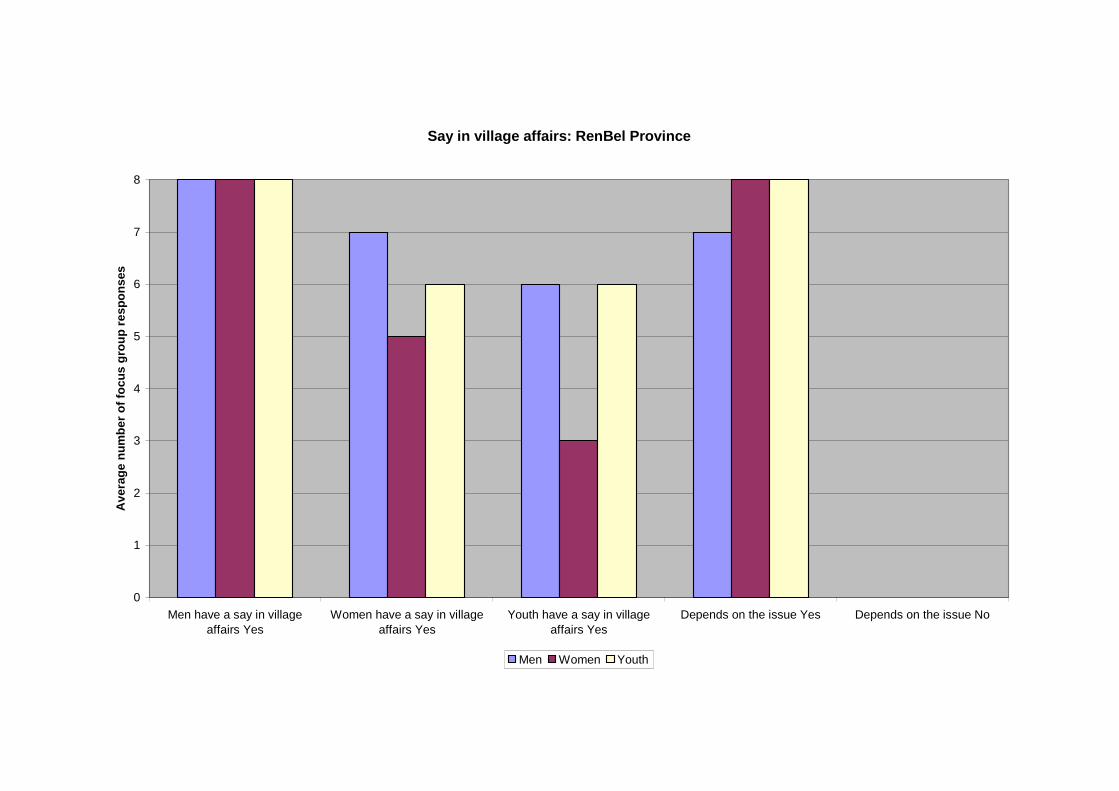
Say in village affairs: RenBel Province
0
1
2
3
4
5
6
7
8
Men have a say in village
affairs Yes
Women have a say in village
affairs Yes
Youth have a say in village
affairs Yes
Depends on the issue Yes Depends on the issue No
Av
era
ge
nu
mb
er
of
foc
us
gro
up
res
po
ns
es
Men Women Youth
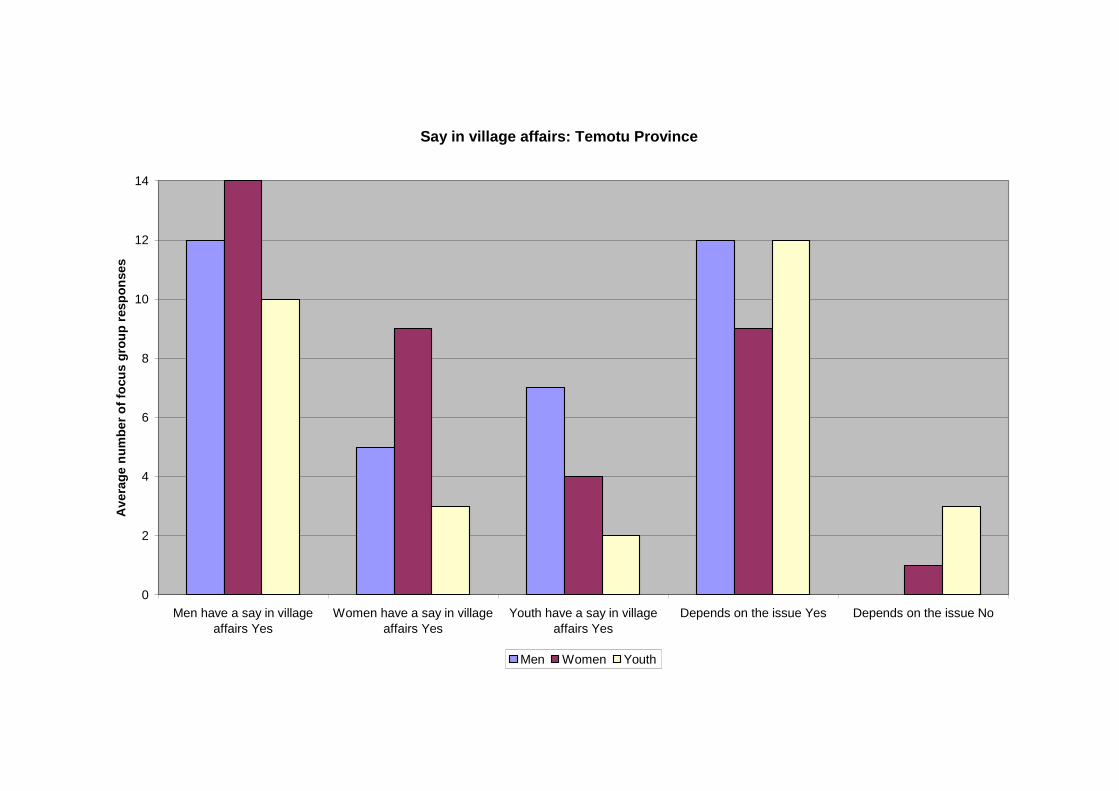
Say in village affairs: Temotu Province
0
2
4
6
8
10
12
14
Men have a say in villageaffairs Yes
Women have a say in villageaffairs Yes
Youth have a say in villageaffairs Yes
Depends on the issue Yes Depends on the issue No
Av
era
ge
nu
mb
er
of
focu
sg
rou
pre
sp
on
se
s
Men Women Youth
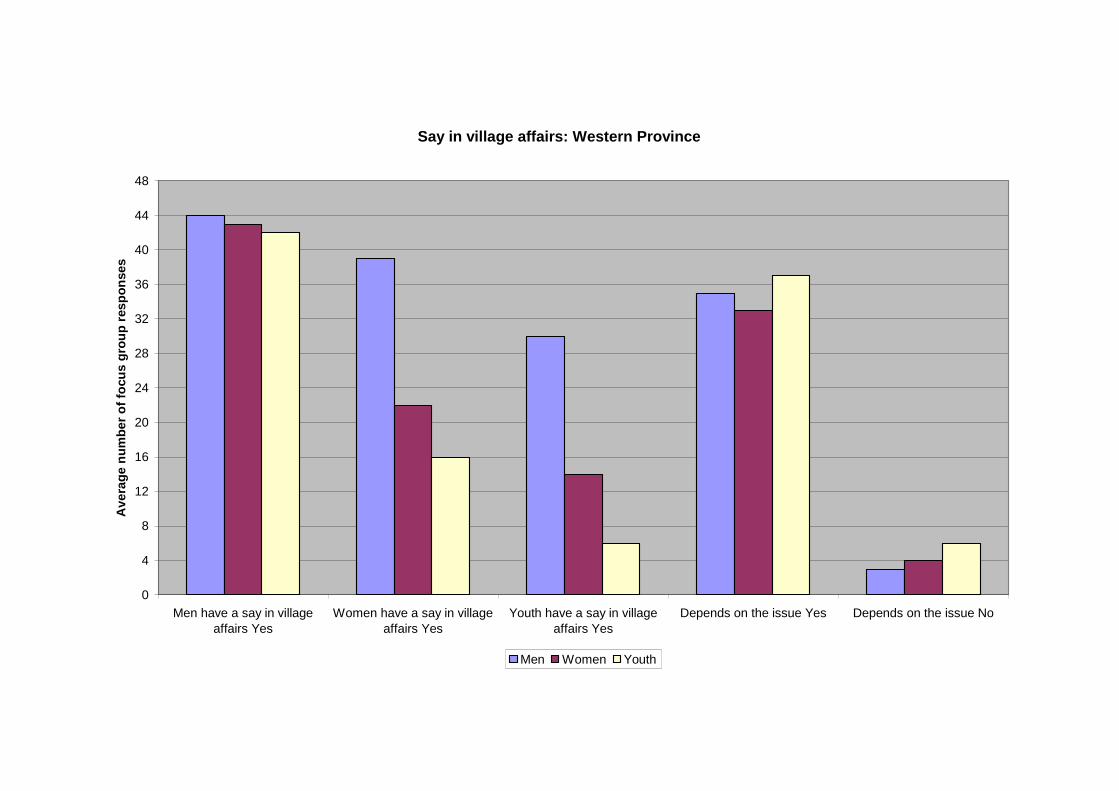
Say in village affairs: Western Province
0
4
8
12
16
20
24
28
32
36
40
44
48
Men have a say in villageaffairs Yes
Women have a say in villageaffairs Yes
Youth have a say in villageaffairs Yes
Depends on the issue Yes Depends on the issue No
Av
era
ge
nu
mb
er
of
focu
sg
rou
pre
sp
on
se
s
Men Women Youth
Charts P26: Village committee structure
Analysis:
Except for RenBel and Temotu Provinces, more than 70 percent of communities surveyed
reported the presence of a village committee. In RenBel Province only 50 percent of
communities had a village committee. In Temotu, only 64 percent of communities reported
having a formal village committee. In Central and Makira Province most committees reached
decisions by either consensus and formal voting but in Choiseul 60 percent of committees
reached decision by consensus and in RenBel Province, those communities with committees
reported that decisions were made by consensus. In the majority of cases decision could be
reached either by consensus or formal voting but it would appear that the nature of the
discussion is more significant that the process. The tabulated responses are:
Central Province 89 percent of communities surveyed had a village committee
where all decisions were reached by either consensus of
formal voting.
Choiseul Province 75 percent of communities surveyed had a village committee,
60 percent of decisions were reached by consensus but 50
percent were reached by both consensus and formal voting.
Isabel Province 95 percent of communities had a village committee and 55
percent of decisions were reached by both consensus and
formal voting. It should be noted that 35 percent of decisions
were reached by formal voting alone.
Makira Province While 70 percent of village had a village committee, 30
percent did not. In those with a committee 60 percent of
decisions were reached by both consensus and formal voting.
RenBel Province Only 50 percent of communities ha d a village committee and
on those that did have a committee, decisions were reached by
consensus.
Temotu Province Only 64 percent of communities had a village committee and
in those communities, 43 percent of decisions were reached by
consensus and 43 percent by both consensus and formal
voting.
Western Province In Western Province, 76 percent of communities had a village
committee. 53 percent of decisions were reached by both
consensus and formal voting.
Issues:
The findings of the National Snapshot report are also significant here. The data suggest that
most decisions are usually reached by either consensus or by formal voting. This is despite
the fact that the usual perception is that Melanesian communities reach decisions only by
consensus and Polynesian communities use consensus within the chiefly circle. The data
reflect the fact that the nature of the discussion is more important than the means of decision-
making and that communities are flexible in resolving issues that require consideration by the
village committee. The issue is that structure is less important than process.
PROVINCIAL SIGNPOST: Village committee structure
It would appear that the nature of the discussion within village committees is more importantthan the process of decision-making. This is also reflected in the chart on who has a say invillage affairs. It would appear that decision making and conflict resolution are fluid mattersthat require some consideration generally before decisions are made.
SIGNPOST: Village committee structure
For donor agencies and service providers it is important to consider that formal approaches tovillages should, in the first instance, be made through existing internal structures of decisionmaking. Within the village committee, decisions will most likely be made according to thenature of the issue under discussion rather than the means of decision making.
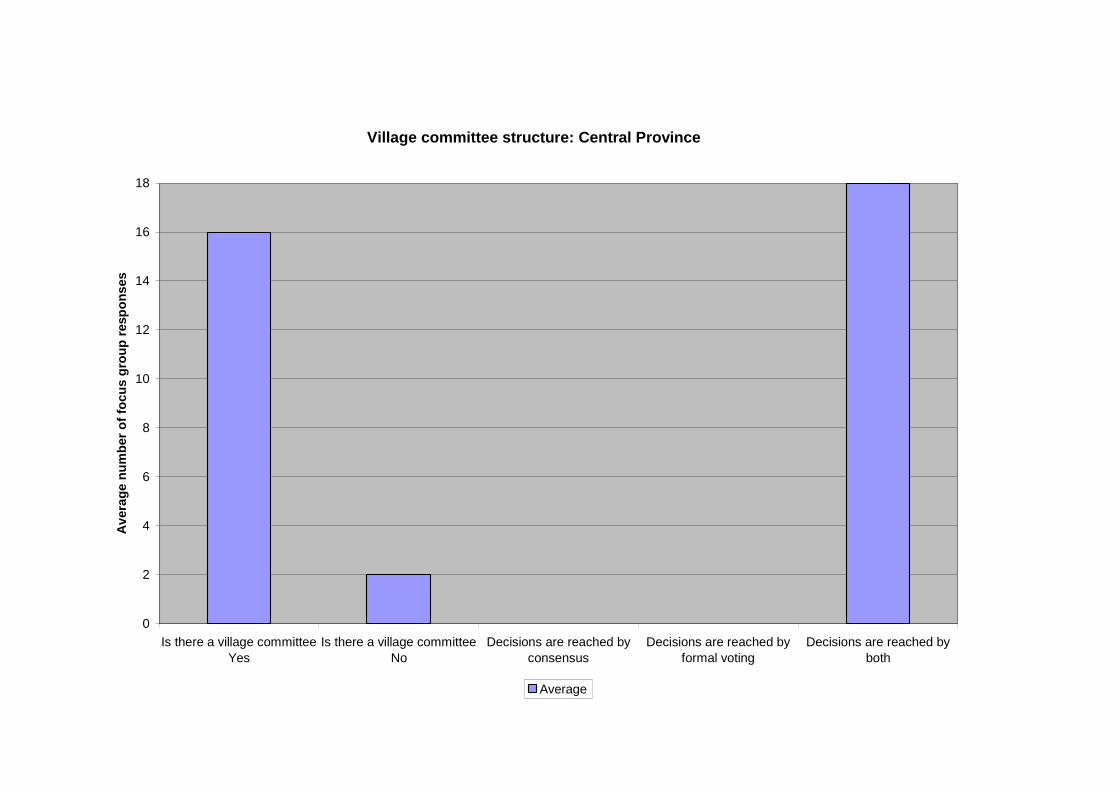
Village committee structure: Central Province
0
2
4
6
8
10
12
14
16
18
Is there a village committeeYes
Is there a village committeeNo
Decisions are reached byconsensus
Decisions are reached byformal voting
Decisions are reached byboth
Av
era
ge
nu
mb
er
of
foc
us
gro
up
resp
on
ses
Average

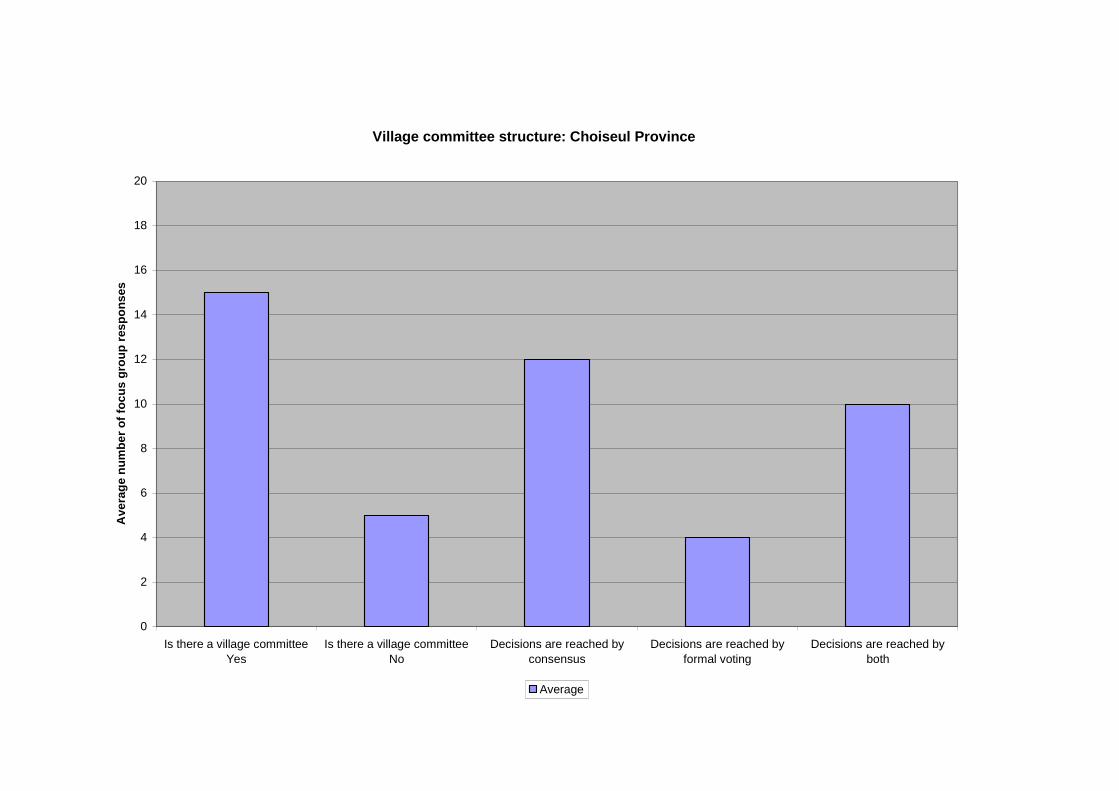
Village committee structure: Choiseul Province
0
2
4
6
8
10
12
14
16
18
20
Is there a village committee
Yes
Is there a village committee
No
Decisions are reached by
consensus
Decisions are reached by
formal voting
Decisions are reached by
both
Ave
rag
en
um
be
ro
ffo
cu
sg
rou
pre
sp
on
ses
Average

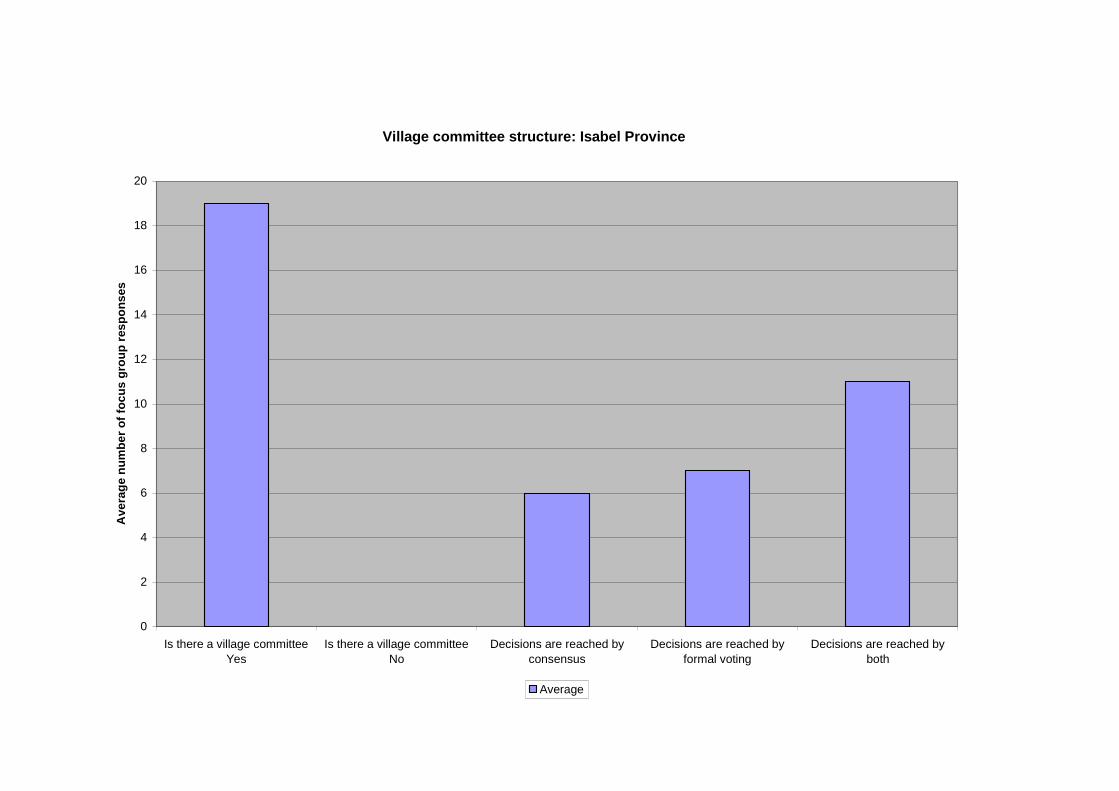
Village committee structure: Isabel Province
0
2
4
6
8
10
12
14
16
18
20
Is there a village committee
Yes
Is there a village committee
No
Decisions are reached by
consensus
Decisions are reached by
formal voting
Decisions are reached by
both
Ave
rag
en
um
be
ro
ffo
cu
sg
rou
pre
sp
on
ses
Average

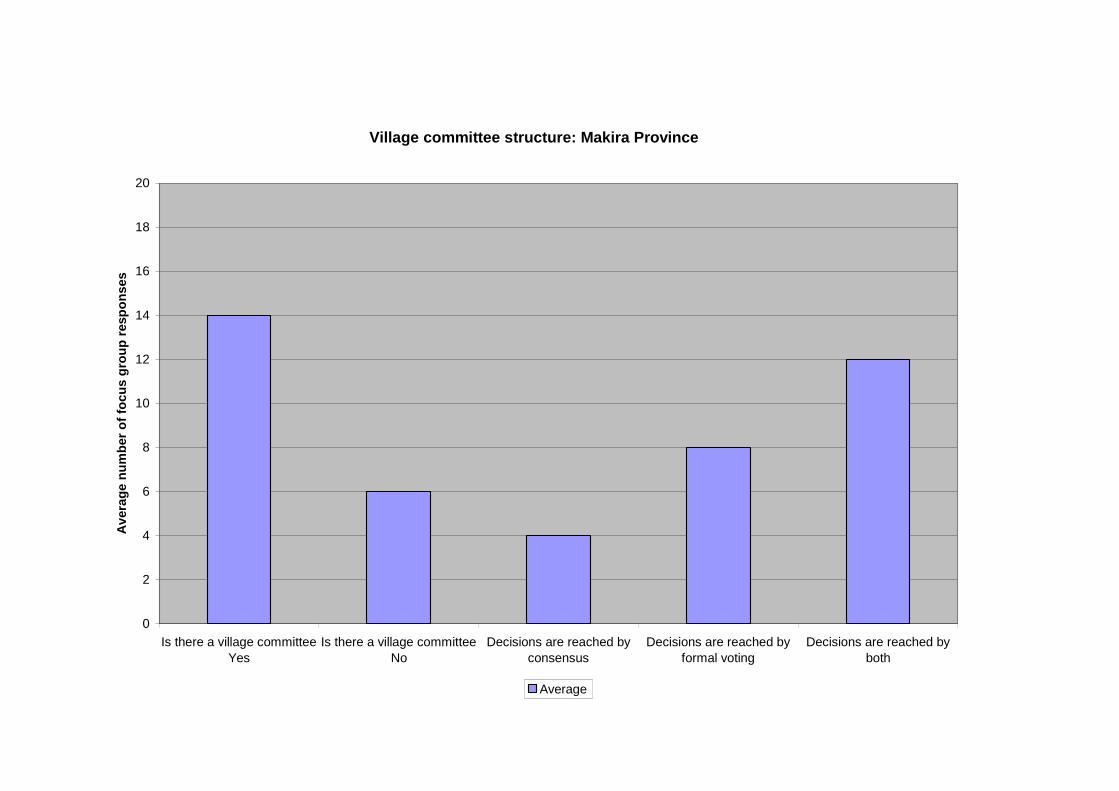
Village committee structure: Makira Province
0
2
4
6
8
10
12
14
16
18
20
Is there a village committeeYes
Is there a village committeeNo
Decisions are reached byconsensus
Decisions are reached byformal voting
Decisions are reached byboth
Av
era
ge
nu
mb
er
of
foc
us
gro
up
resp
on
ses
Average

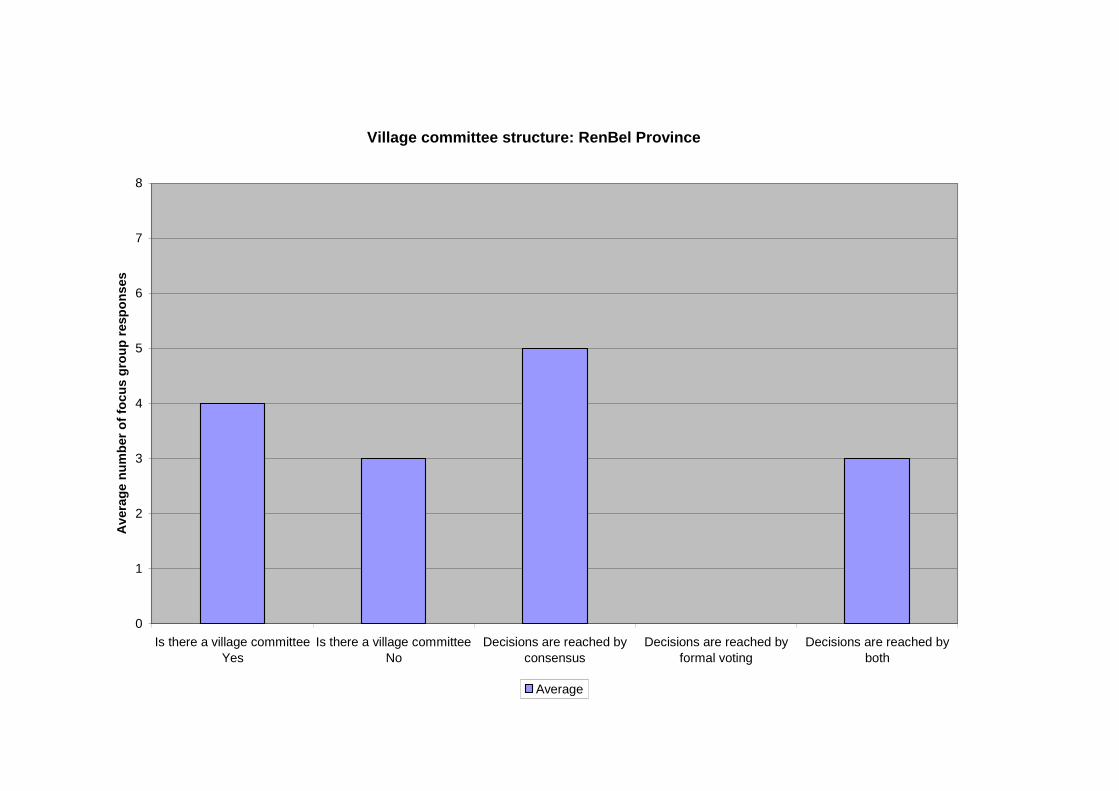
Village committee structure: RenBel Province
0
1
2
3
4
5
6
7
8
Is there a village committeeYes
Is there a village committeeNo
Decisions are reached byconsensus
Decisions are reached byformal voting
Decisions are reached byboth
Av
era
ge
nu
mb
er
of
foc
us
gro
up
resp
on
ses
Average

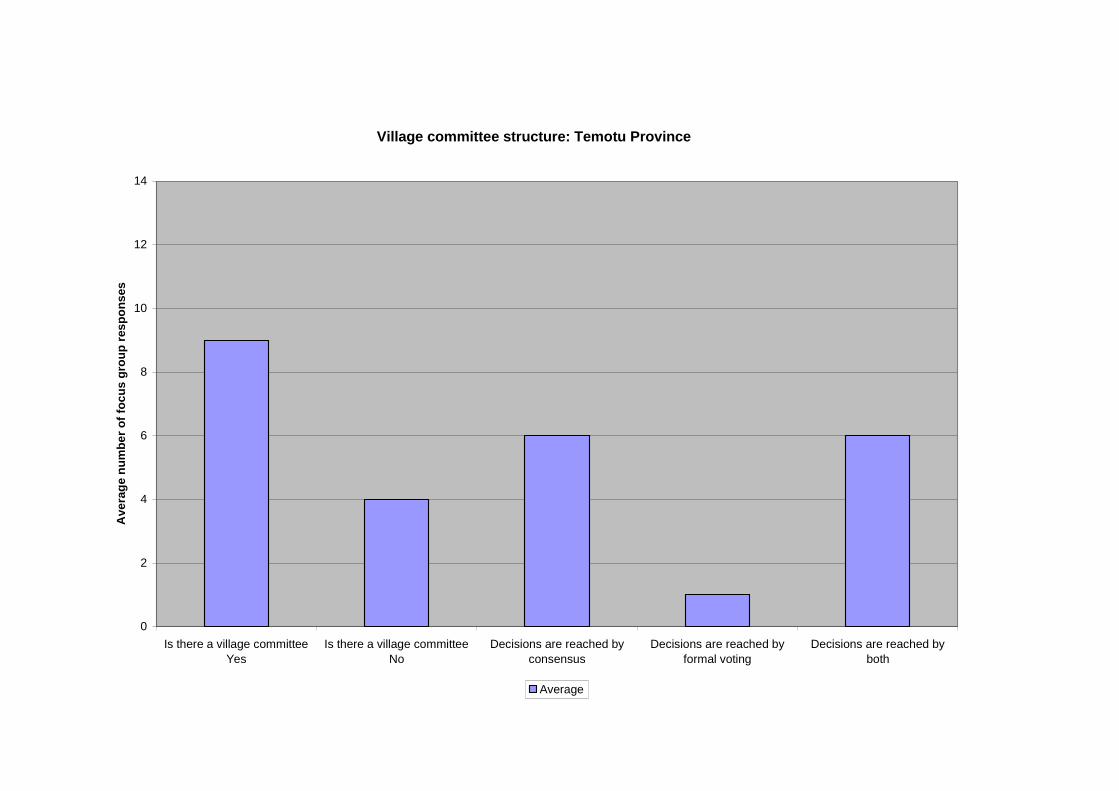
Village committee structure: Temotu Province
0
2
4
6
8
10
12
14
Is there a village committee
Yes
Is there a village committee
No
Decisions are reached by
consensus
Decisions are reached by
formal voting
Decisions are reached by
both
Ave
rag
en
um
be
ro
ffo
cu
sg
rou
pre
sp
on
ses
Average

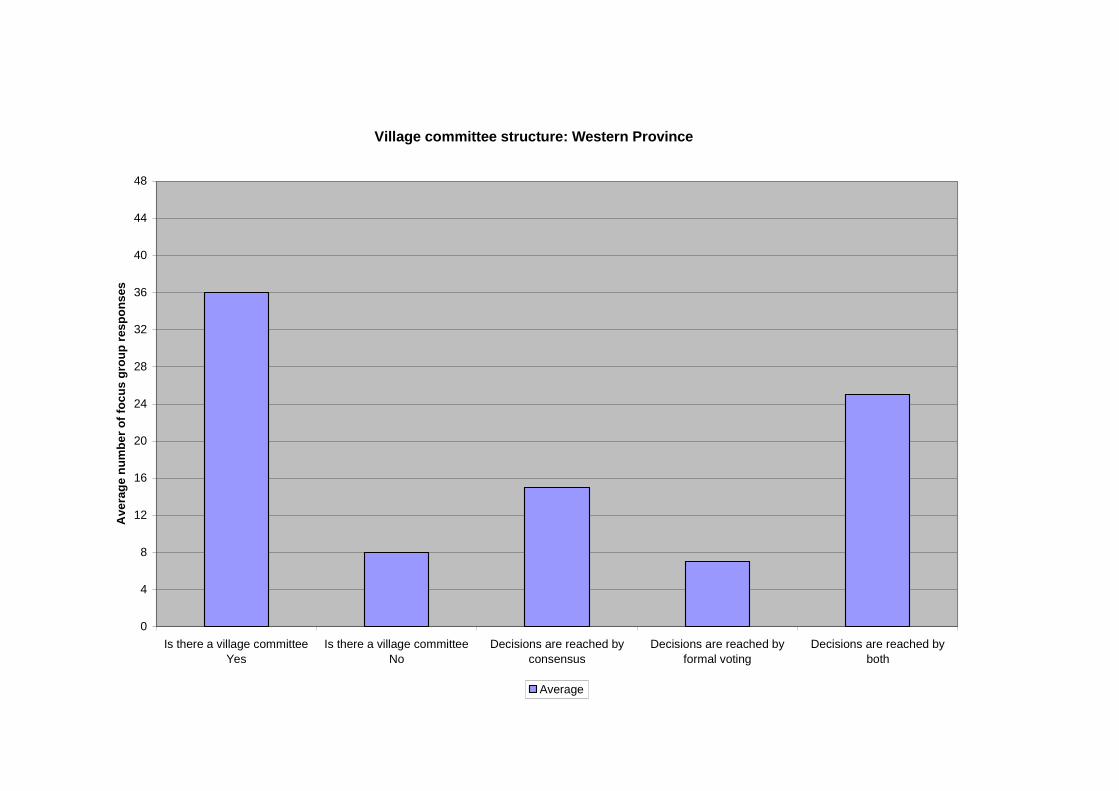
Village committee structure: Western Province
0
4
8
12
16
20
24
28
32
36
40
44
48
Is there a village committee
Yes
Is there a village committee
No
Decisions are reached by
consensus
Decisions are reached by
formal voting
Decisions are reached by
both
Ave
rag
en
um
be
ro
ffo
cu
sg
rou
pre
sp
on
ses
Average
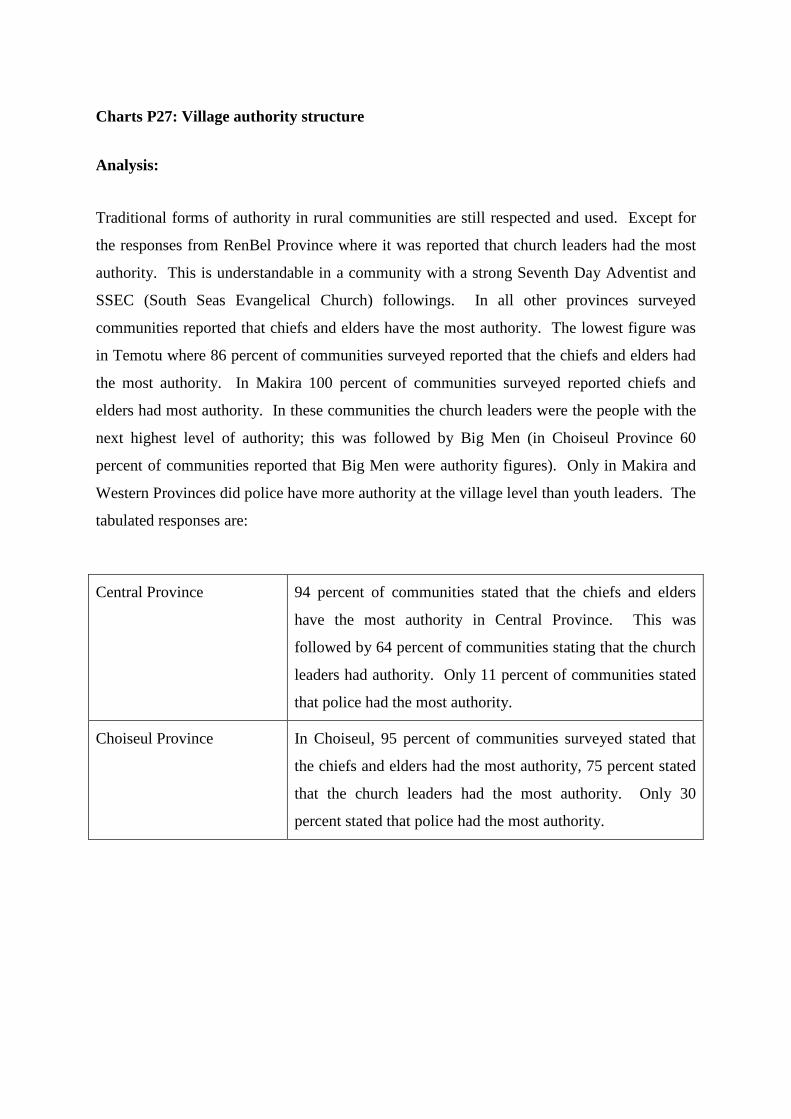
Charts P27: Village authority structure
Analysis:
Traditional forms of authority in rural communities are still respected and used. Except for
the responses from RenBel Province where it was reported that church leaders had the most
authority. This is understandable in a community with a strong Seventh Day Adventist and
SSEC (South Seas Evangelical Church) followings. In all other provinces surveyed
communities reported that chiefs and elders have the most authority. The lowest figure was
in Temotu where 86 percent of communities surveyed reported that the chiefs and elders had
the most authority. In Makira 100 percent of communities surveyed reported chiefs and
elders had most authority. In these communities the church leaders were the people with the
next highest level of authority; this was followed by Big Men (in Choiseul Province 60
percent of communities reported that Big Men were authority figures). Only in Makira and
Western Provinces did police have more authority at the village level than youth leaders. The
tabulated responses are:
Central Province 94 percent of communities stated that the chiefs and elders
have the most authority in Central Province. This was
followed by 64 percent of communities stating that the church
leaders had authority. Only 11 percent of communities stated
that police had the most authority.
Choiseul Province In Choiseul, 95 percent of communities surveyed stated that
the chiefs and elders had the most authority, 75 percent stated
that the church leaders had the most authority. Only 30
percent stated that police had the most authority.
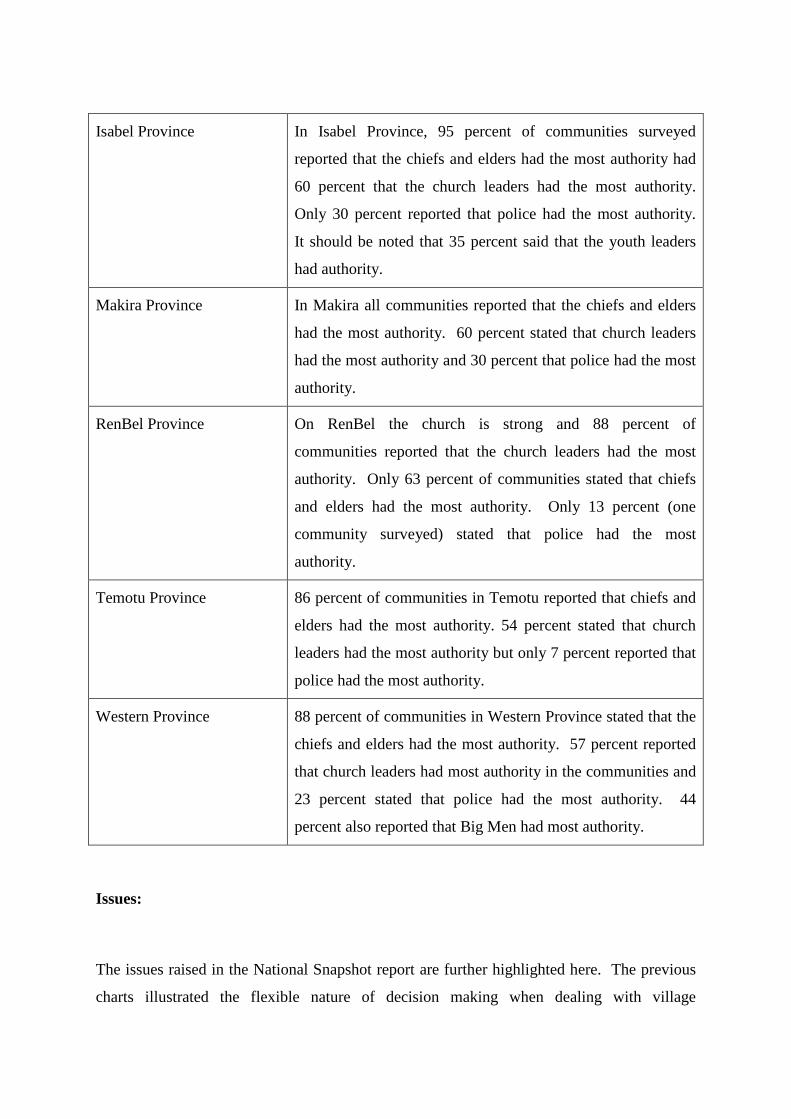
Isabel Province In Isabel Province, 95 percent of communities surveyed
reported that the chiefs and elders had the most authority had
60 percent that the church leaders had the most authority.
Only 30 percent reported that police had the most authority.
It should be noted that 35 percent said that the youth leaders
had authority.
Makira Province In Makira all communities reported that the chiefs and elders
had the most authority. 60 percent stated that church leaders
had the most authority and 30 percent that police had the most
authority.
RenBel Province On RenBel the church is strong and 88 percent of
communities reported that the church leaders had the most
authority. Only 63 percent of communities stated that chiefs
and elders had the most authority. Only 13 percent (one
community surveyed) stated that police had the most
authority.
Temotu Province 86 percent of communities in Temotu reported that chiefs and
elders had the most authority. 54 percent stated that church
leaders had the most authority but only 7 percent reported that
police had the most authority.
Western Province 88 percent of communities in Western Province stated that the
chiefs and elders had the most authority. 57 percent reported
that church leaders had most authority in the communities and
23 percent stated that police had the most authority. 44
percent also reported that Big Men had most authority.
Issues:
The issues raised in the National Snapshot report are further highlighted here. The previous
charts illustrated the flexible nature of decision making when dealing with village
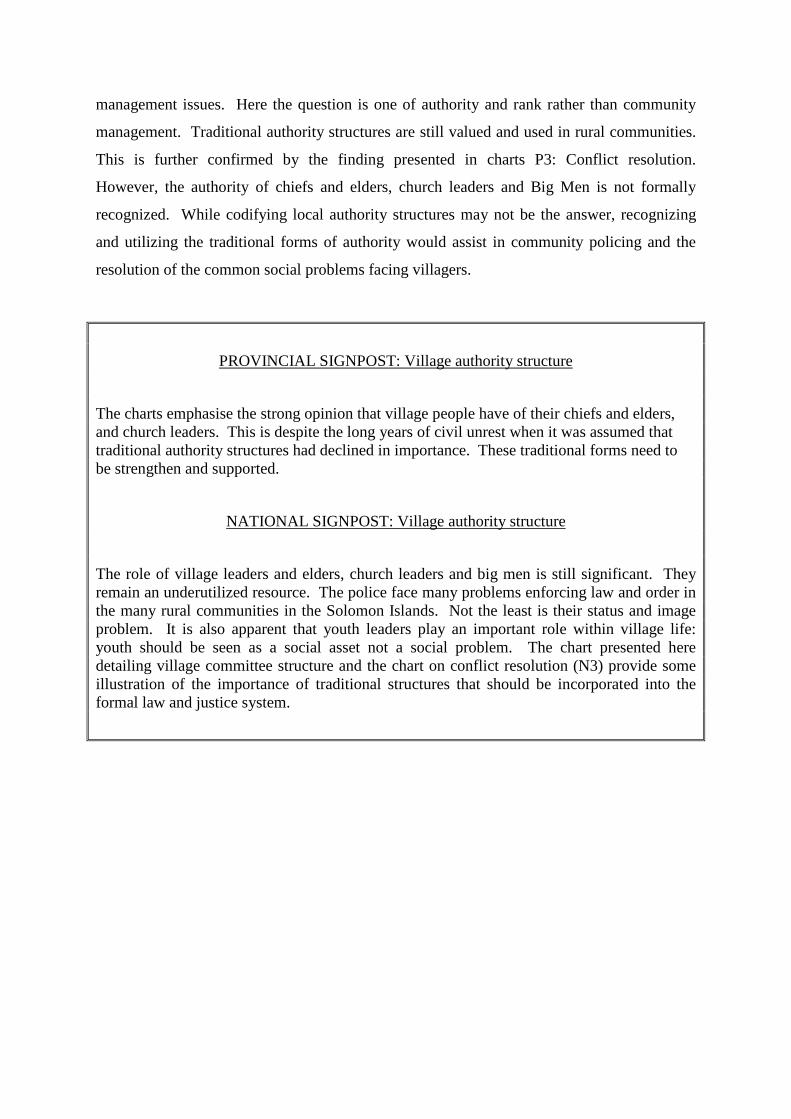
management issues. Here the question is one of authority and rank rather than community
management. Traditional authority structures are still valued and used in rural communities.
This is further confirmed by the finding presented in charts P3: Conflict resolution.
However, the authority of chiefs and elders, church leaders and Big Men is not formally
recognized. While codifying local authority structures may not be the answer, recognizing
and utilizing the traditional forms of authority would assist in community policing and the
resolution of the common social problems facing villagers.
PROVINCIAL SIGNPOST: Village authority structure
The charts emphasise the strong opinion that village people have of their chiefs and elders,and church leaders. This is despite the long years of civil unrest when it was assumed thattraditional authority structures had declined in importance. These traditional forms need tobe strengthen and supported.
NATIONAL SIGNPOST: Village authority structure
The role of village leaders and elders, church leaders and big men is still significant. Theyremain an underutilized resource. The police face many problems enforcing law and order inthe many rural communities in the Solomon Islands. Not the least is their status and imageproblem. It is also apparent that youth leaders play an important role within village life:youth should be seen as a social asset not a social problem. The chart presented heredetailing village committee structure and the chart on conflict resolution (N3) provide someillustration of the importance of traditional structures that should be incorporated into theformal law and justice system.
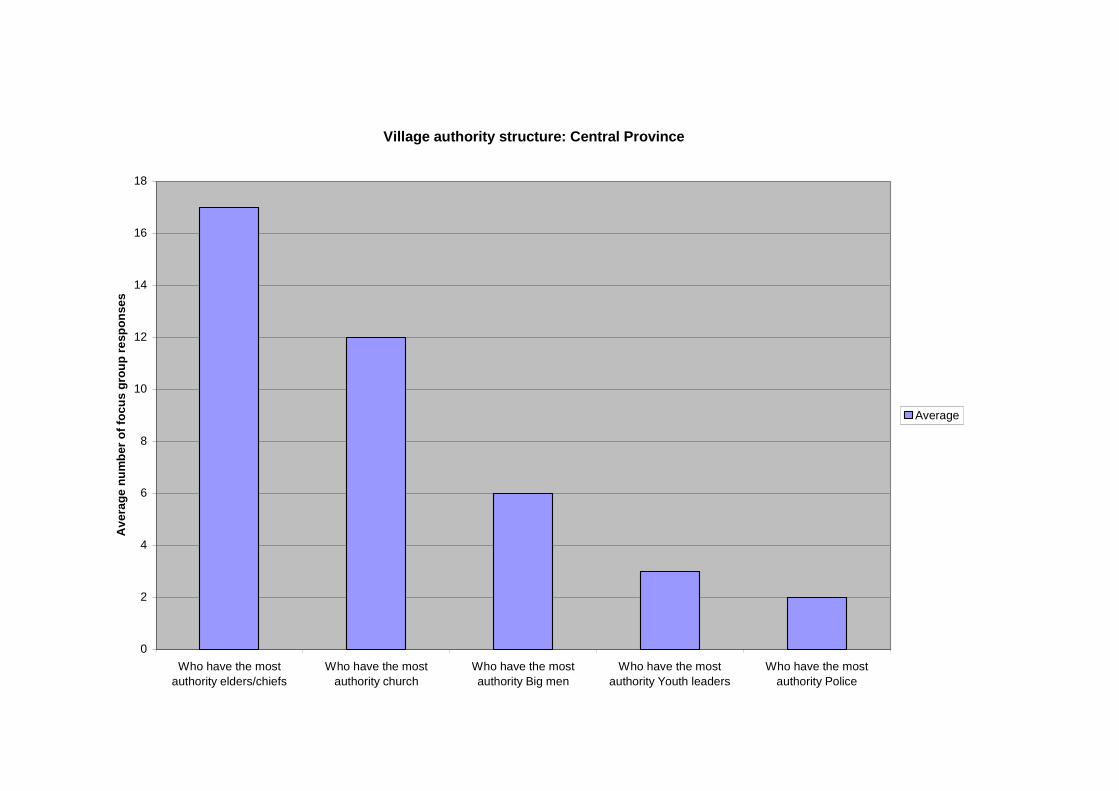
Village authority structure: Central Province
0
2
4
6
8
10
12
14
16
18
Who have the most
authority elders/chiefs
Who have the most
authority church
Who have the most
authority Big men
Who have the most
authority Youth leaders
Who have the most
authority Police
Av
era
ge
nu
mb
er
of
focu
sg
rou
pre
sp
on
se
s
Average

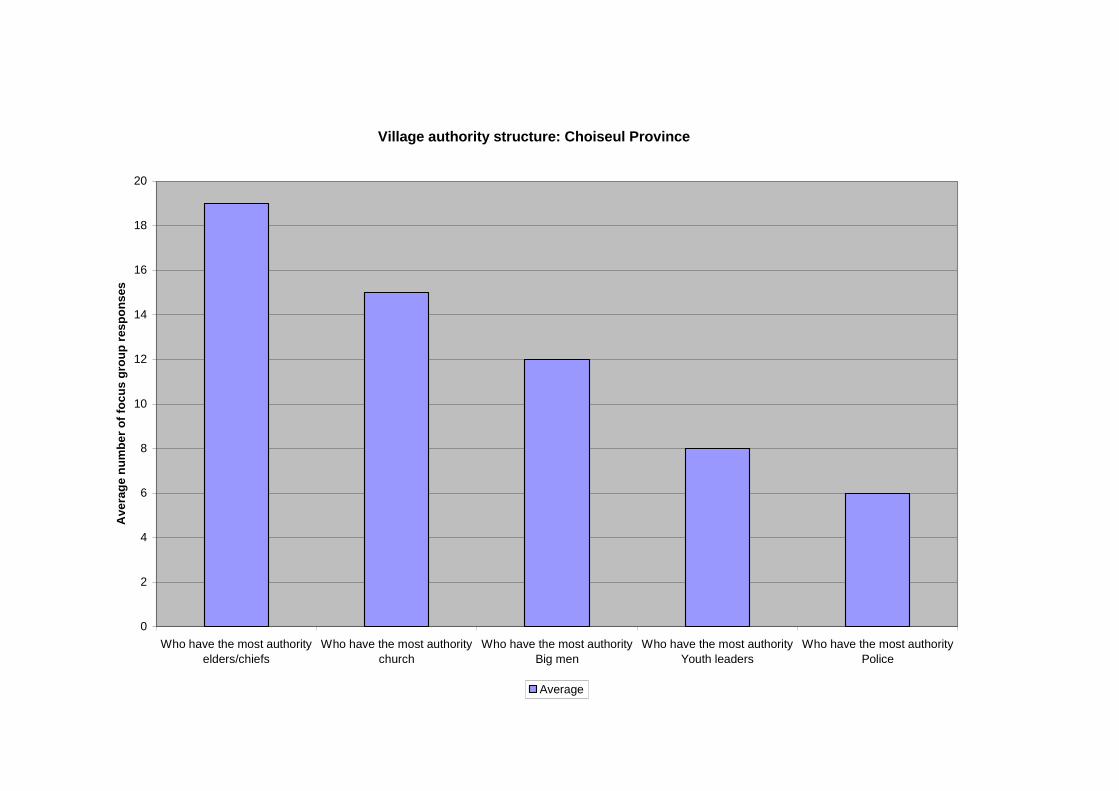
Village authority structure: Choiseul Province
0
2
4
6
8
10
12
14
16
18
20
Who have the most authority
elders/chiefs
Who have the most authority
church
Who have the most authority
Big men
Who have the most authority
Youth leaders
Who have the most authority
Police
Ave
rag
en
um
be
ro
ffo
cu
sg
rou
pre
sp
on
ses
Average

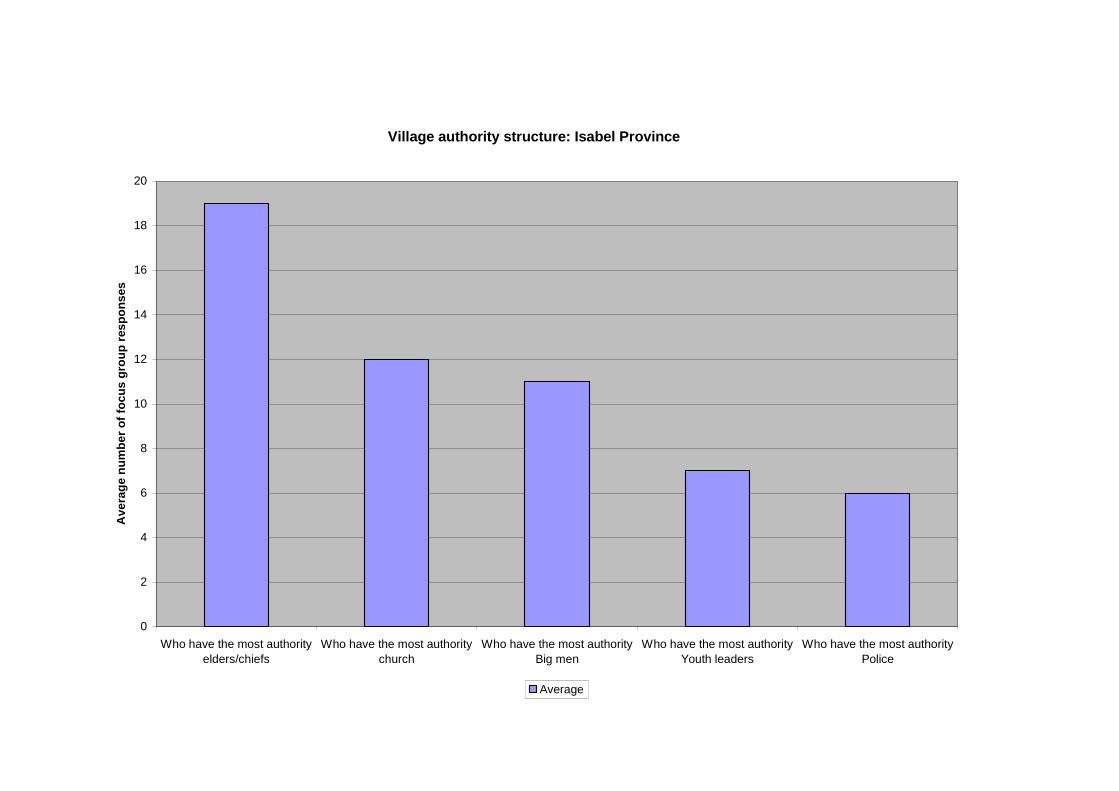
Village authority structure: Isabel Province
0
2
4
6
8
10
12
14
16
18
20
Who have the most authority
elders/chiefs
Who have the most authority
church
Who have the most authority
Big men
Who have the most authority
Youth leaders
Who have the most authority
Police
Ave
rag
en
um
be
ro
ffo
cu
sg
rou
pre
sp
on
ses
Average

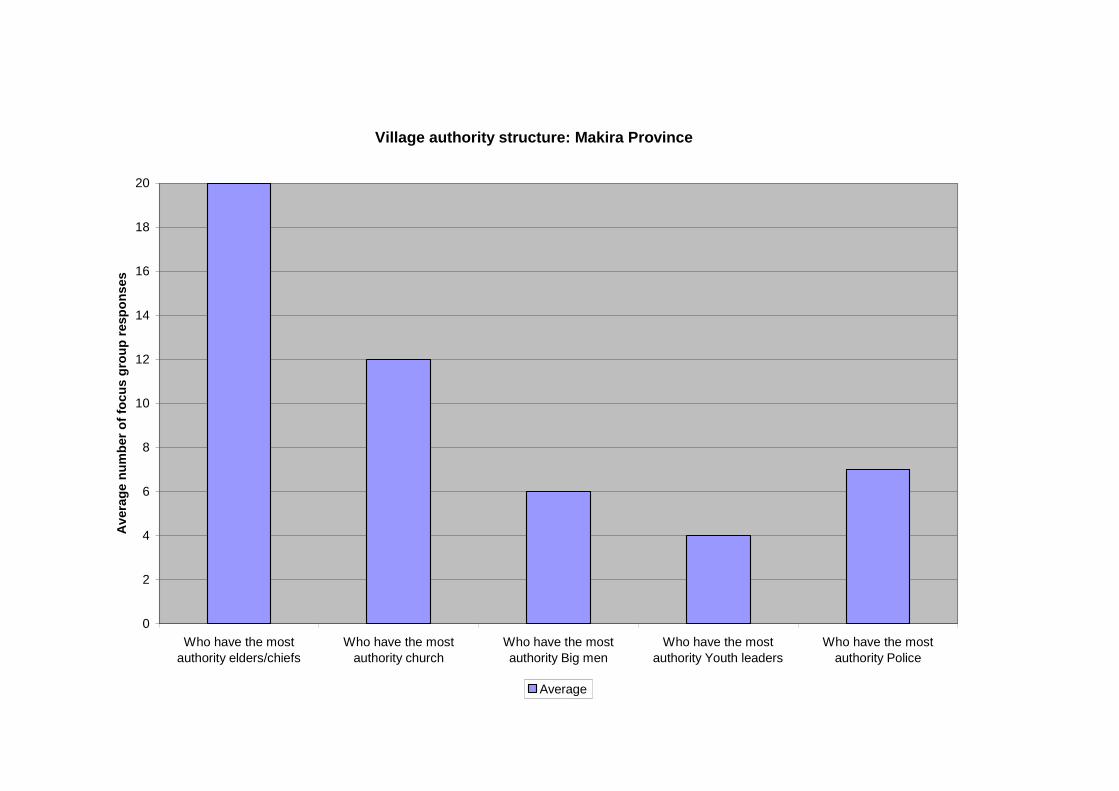
Village authority structure: Makira Province
0
2
4
6
8
10
12
14
16
18
20
Who have the mostauthority elders/chiefs
Who have the mostauthority church
Who have the mostauthority Big men
Who have the mostauthority Youth leaders
Who have the mostauthority Police
Av
era
ge
nu
mb
er
of
foc
us
gro
up
resp
on
ses
Average

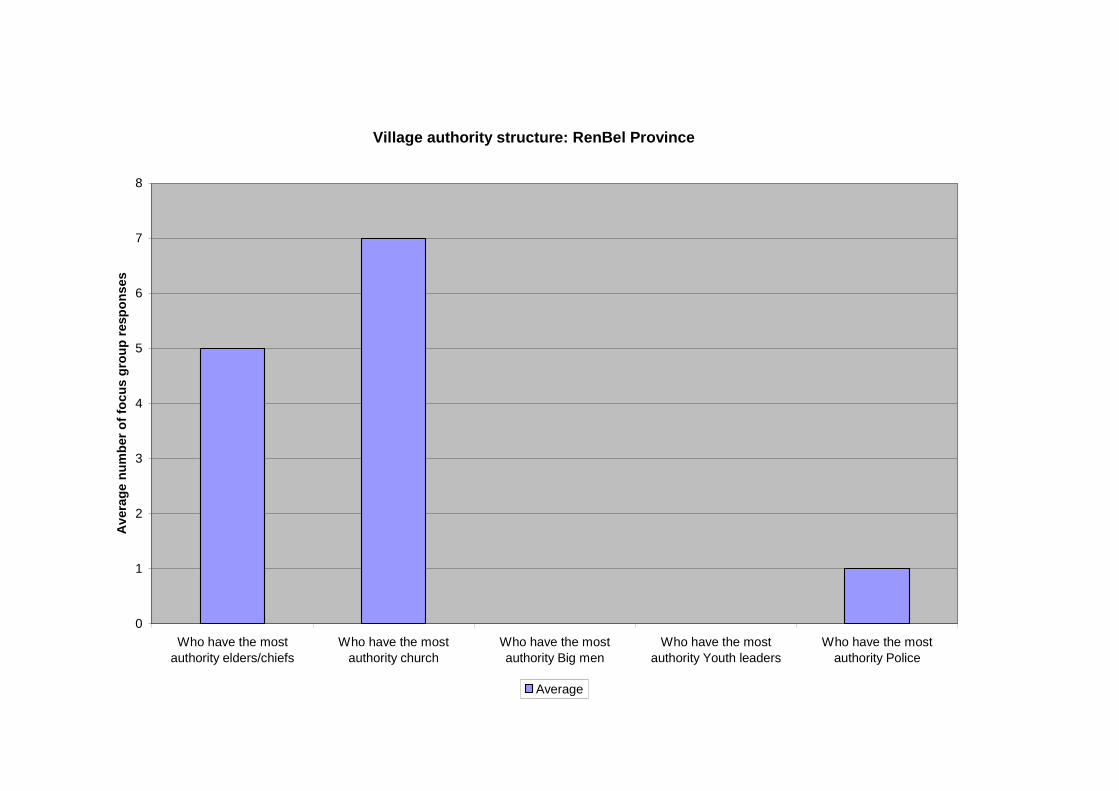
Village authority structure: RenBel Province
0
1
2
3
4
5
6
7
8
Who have the mostauthority elders/chiefs
Who have the mostauthority church
Who have the mostauthority Big men
Who have the mostauthority Youth leaders
Who have the mostauthority Police
Av
era
ge
nu
mb
er
of
foc
us
gro
up
resp
on
ses
Average

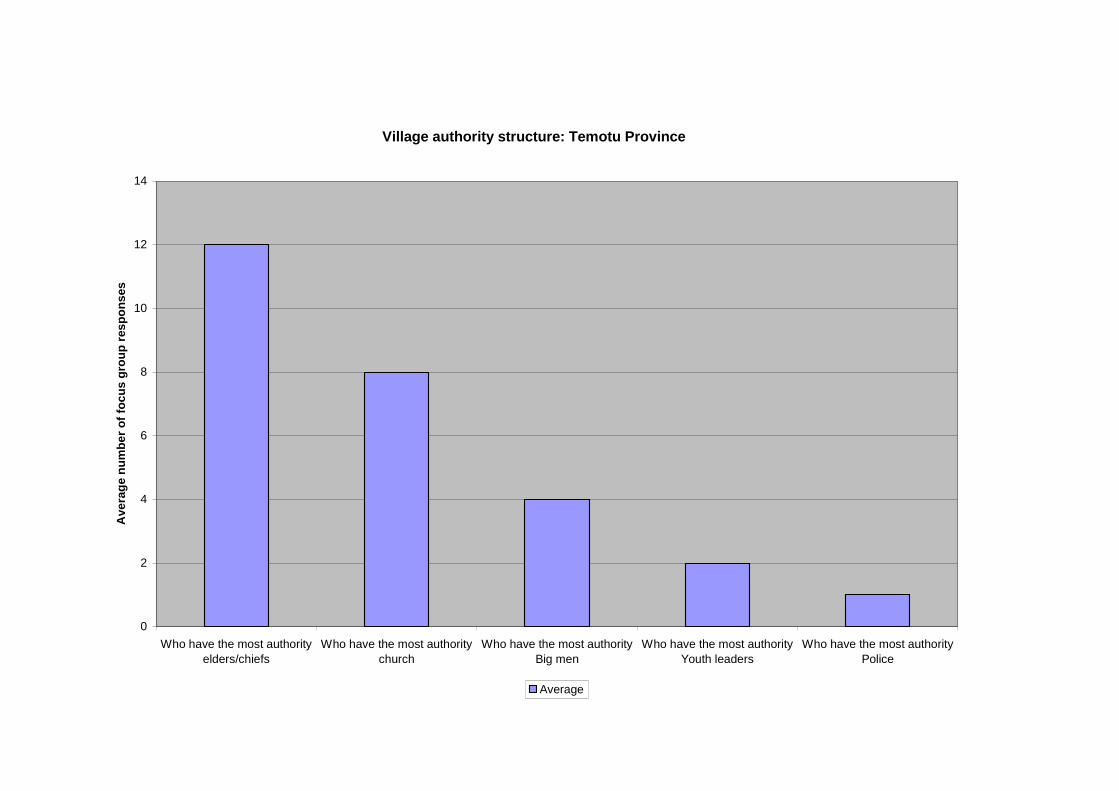
Village authority structure: Temotu Province
0
2
4
6
8
10
12
14
Who have the most authority
elders/chiefs
Who have the most authority
church
Who have the most authority
Big men
Who have the most authority
Youth leaders
Who have the most authority
Police
Ave
rag
en
um
be
ro
ffo
cu
sg
rou
pre
sp
on
ses
Average

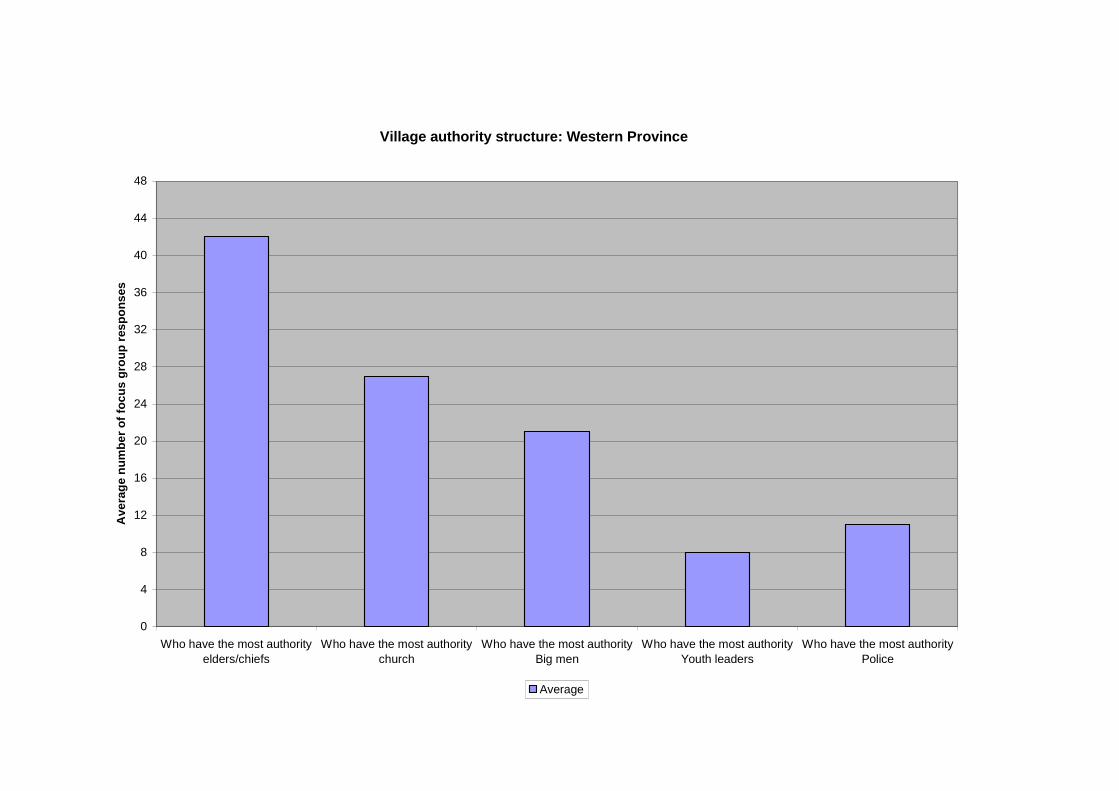
Village authority structure: Western Province
0
4
8
12
16
20
24
28
32
36
40
44
48
Who have the most authority
elders/chiefs
Who have the most authority
church
Who have the most authority
Big men
Who have the most authority
Youth leaders
Who have the most authority
Police
Ave
rag
en
um
be
ro
ffo
cu
sg
rou
pre
sp
on
ses
Average
Charts P28: Service delivery
Rural communities were asked if they felt that they could influence provincial and national
decision-making and if the governments at provincial and national levels had improved
service delivery to rural areas.
Analysis:
Only in Choiseul, Isabel and Western Provinces did people feel that they could influence
provincial or national decision making. In fact 70 percent of communities surveyed in
Choiseul stated that they could influence political decision making. In the other provinces
surveyed, the majority of people felt they could not influence provincial or national decision
making. In RenBel people were evenly divided as to whether they could influence the
political process. However, regardless of the belief that they could influence their provincial
or national members, all communities surveyed agreed that governments at both levels have
not imported service delivery to the people of the outer provinces. Similarly in Central and
Choiseul Province people in rural communities felt that they had contact with their local
members. In the other provinces people reported that they had limited contact with elected
representatives. The tabulated responses are:
Central Province The most important finding here is that 94 percent of
communities stated that governments had not improved their
service delivery to the outer provinces. 78 percent of
communities also stated that they were not in contact with
their local members and 67 percent replied that they did not
influence provincial or national decision making.
Choiseul Province 65 percent of communities stated that governments had not
improved their service delivery to the communities but 55
percent stated that they could influence provincial and national
decision making and 55 percent stated that they were in
contact with local members.
Isabel Province 95 percent of communities replied that governments had not
improved service delivery to the communities but 75 percent
stated that they were in contact with local members and 70
percent felt that they could influence provincial and national
decision making.
Makira Province In Makira, 95 percent of communities surveyed replied that
governments have not improved service delivery and 80
percent stated that they were not in contact with local
members. Consequently 75 percent of communities stated
that they could not influence provincial or national decision
making.
RenBel Province In RenBel people were evenly divided as to whether they
could or could not influence provincial or national decision
making. 63 percent of communities stated that they were in
contact with local members and 63 percent stated that
government had not improved service delivery.
Temotu Province 79 percent of people surveyed in Temotu stated that they
could not influence provincial or national decision making and
71 percent stated that governments had not improved service
delivery. 64 percent replied that they were not in contact with
local members.
Western Province In Western Province people were more evenly divided as to
whether they could or could not influence province or national
decision making. 50 percent of people surveyed stated yes
and 46 percent stated no. 78 percent agreed that governments
had not improved service delivery and 53 percent commented
that they were not in contact with local members. It should be
noted that 42 percent stated that they were in contact with
their local representatives.
Issues:
While the majority of villagers felt that they could not influence political decision making a
significant percentage of people surveyed do feel that they can influence decision making and
do have contact with local members. This indicates that some people still have some faith in
the political process. However, contact with elected representatives was clearly very poor.
The findings in there chart can be compared with those in the charts on contact with
government members. As health, education and welfare services to outer provinces are poor
it is to be expected that the majority of villagers also stated that governments had not
improved service delivery,
PROVINCIAL SIGNPOST: Service delivery
It is to expected that people in remote rural areas will report that governments have notimproved the delivery of services to their villages. Infrastructure is poor, rural services areinadequate and contact with government is uneven. While some people feel that they caninfluence provincial and national decision making, evidence presented here indicates thatcontact with local representatives needs to be significantly improved.
NATIONAL SIGNPOST: Service delivery
It is not surprising that responses to questions relating to the delivery of government serviceto rural communities were negative. All rural communities in the Solomon Islands facedifficulties with infrastructure, transportation, roads, communication, and access to essentialservices. While it is apparent that local members are not in contact with their constituentsand have not delivered basic and essentials services to the rural areas, these are issues thatonly the national and provincial governments can solve.
It is apparent that more can be done to build upon the positive responses of villagers.Solomon Islanders are strongly committed to the democratic political process but it is thesystem that fails the people due to lack of political will, corruption, lack of capacity and acommitment to service in the bureaucracy. Lack of political awareness and poor civiceducation weaken the case for the people.
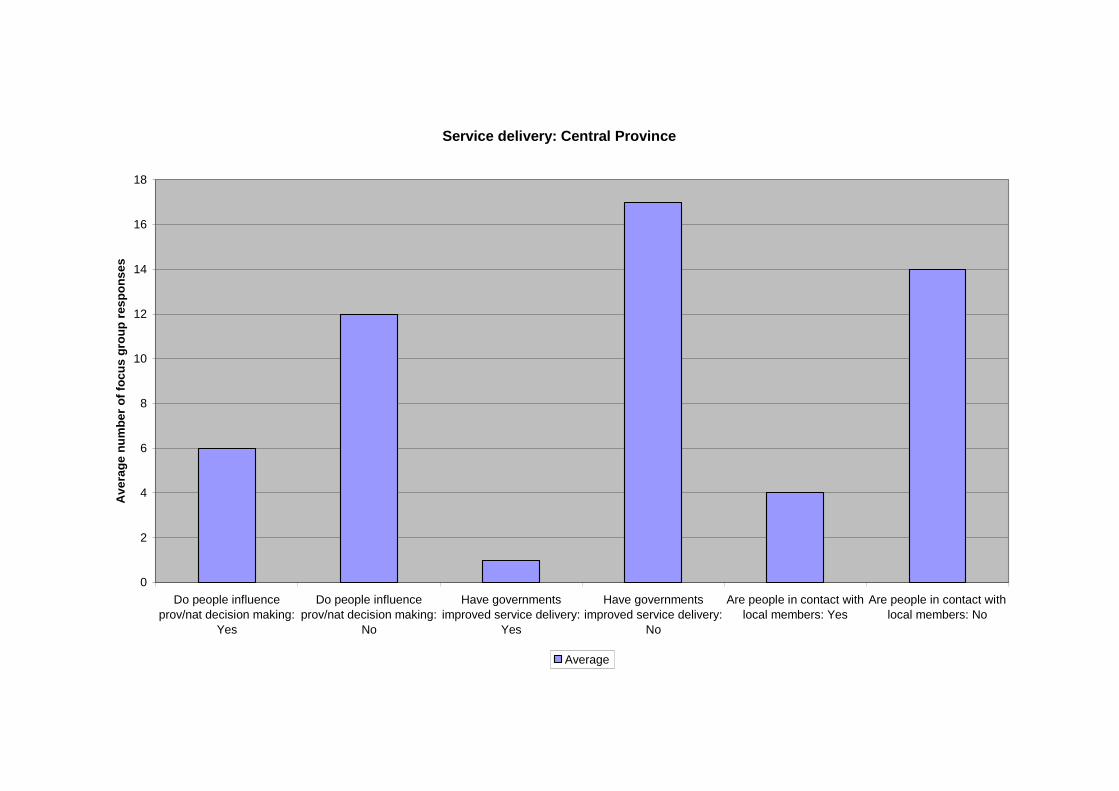
Service delivery: Central Province
0
2
4
6
8
10
12
14
16
18
Do people influence
prov/nat decision making:
Yes
Do people influence
prov/nat decision making:
No
Have governments
improved service delivery:
Yes
Have governments
improved service delivery:
No
Are people in contact with
local members: Yes
Are people in contact with
local members: No
Av
era
ge
nu
mb
er
of
foc
us
gro
up
res
po
ns
es
Average
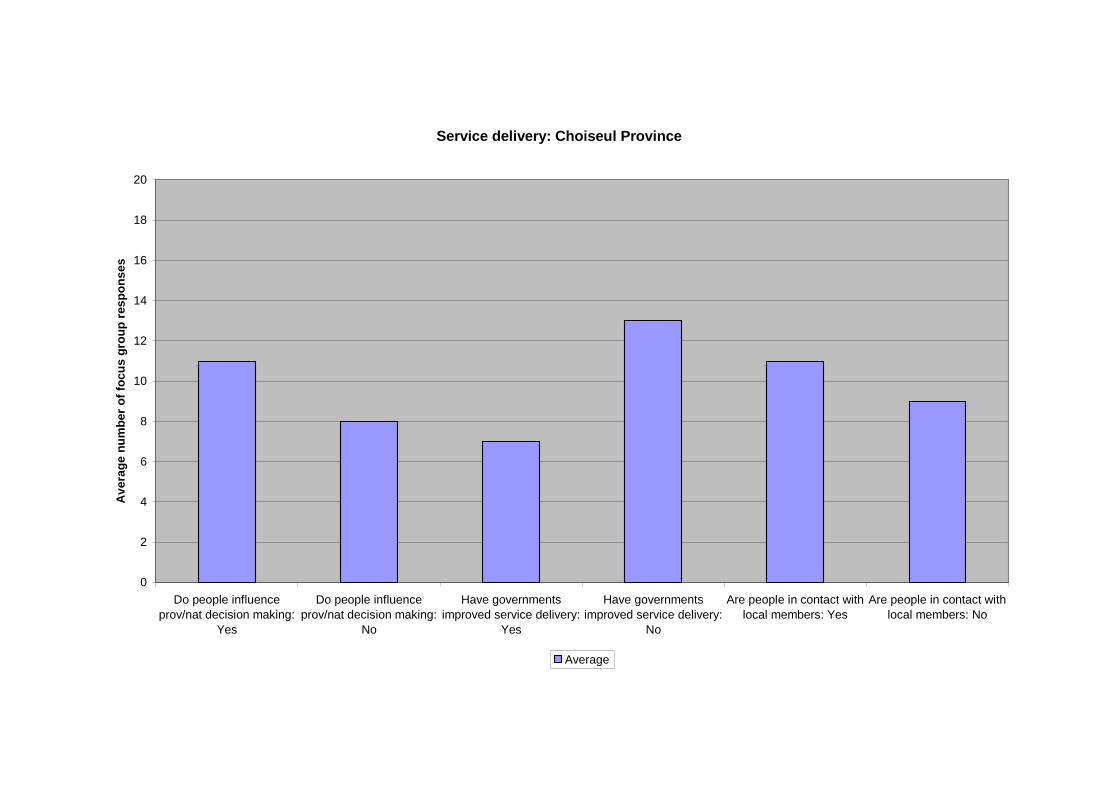
Service delivery: Choiseul Province
0
2
4
6
8
10
12
14
16
18
20
Do people influence
prov/nat decision making:
Yes
Do people influence
prov/nat decision making:
No
Have governments
improved service delivery:
Yes
Have governments
improved service delivery:
No
Are people in contact with
local members: Yes
Are people in contact with
local members: No
Av
era
ge
nu
mb
er
of
foc
us
gro
up
res
po
ns
es
Average
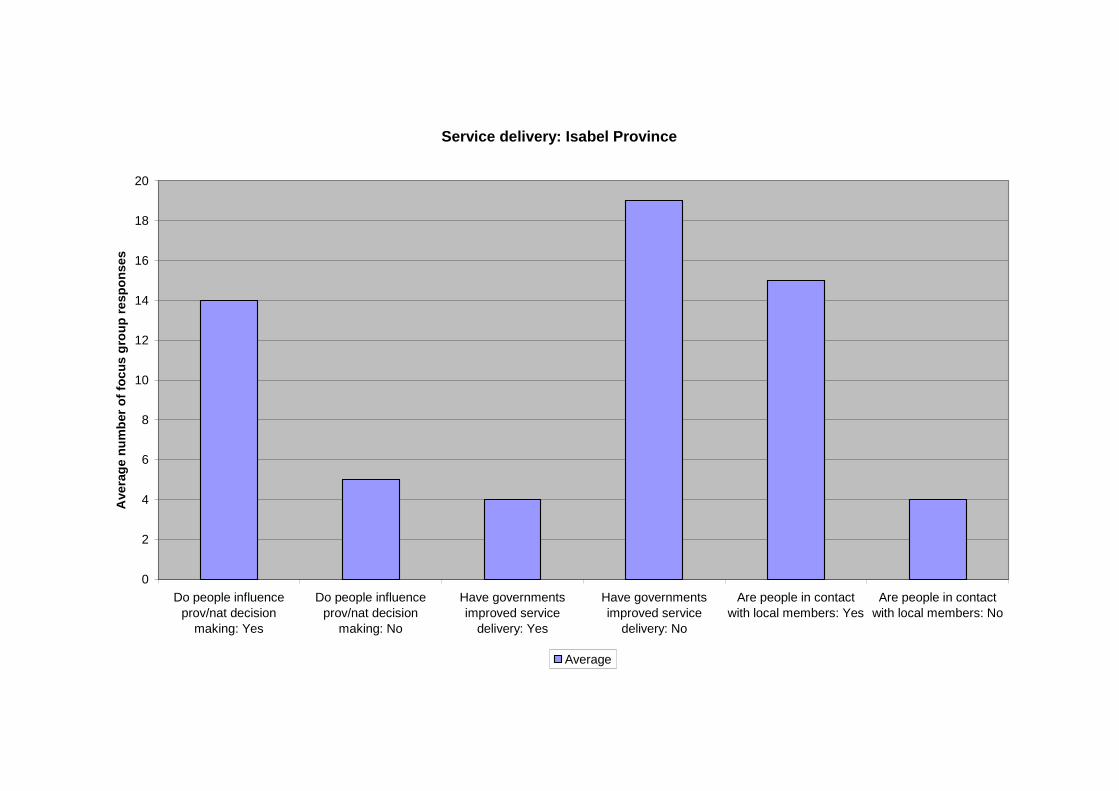
Service delivery: Isabel Province
0
2
4
6
8
10
12
14
16
18
20
Do people influenceprov/nat decision
making: Yes
Do people influenceprov/nat decision
making: No
Have governmentsimproved service
delivery: Yes
Have governmentsimproved service
delivery: No
Are people in contactwith local members: Yes
Are people in contactwith local members: No
Ave
rag
en
um
ber
of
foc
us
gro
up
res
po
ns
es
Average
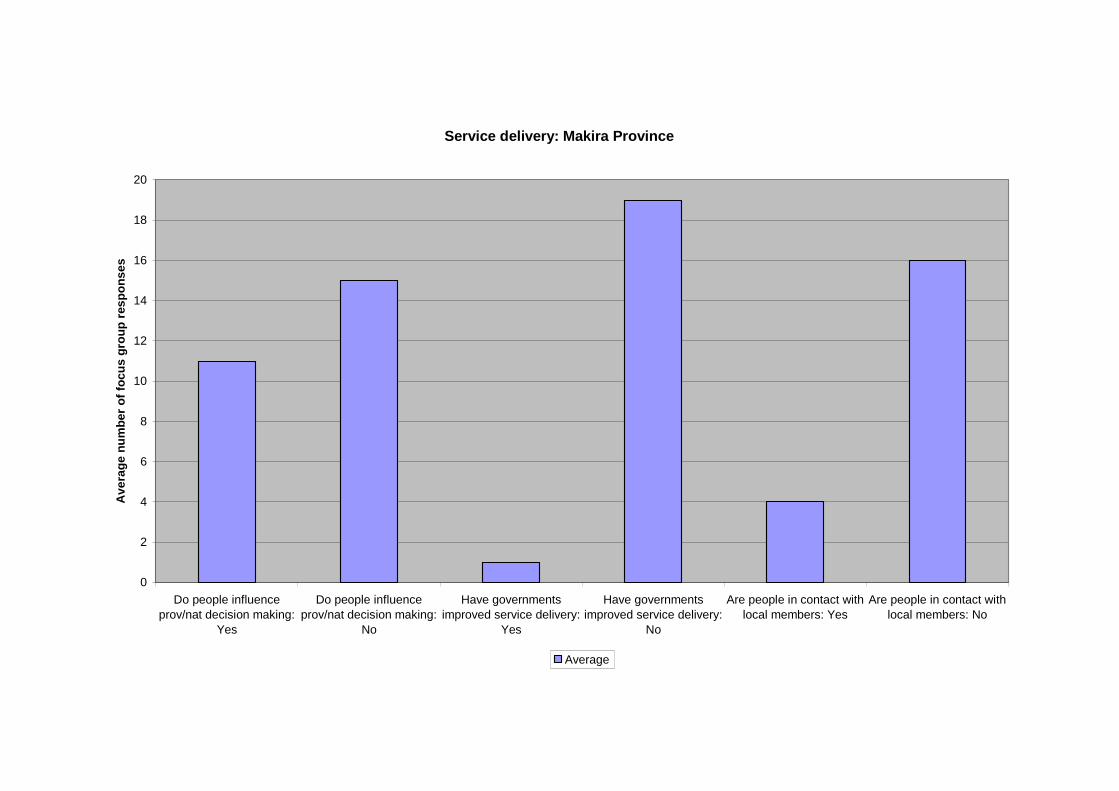
Service delivery: Makira Province
0
2
4
6
8
10
12
14
16
18
20
Do people influence
prov/nat decision making:
Yes
Do people influence
prov/nat decision making:
No
Have governments
improved service delivery:
Yes
Have governments
improved service delivery:
No
Are people in contact with
local members: Yes
Are people in contact with
local members: No
Av
era
ge
nu
mb
er
of
foc
us
gro
up
res
po
ns
es
Average
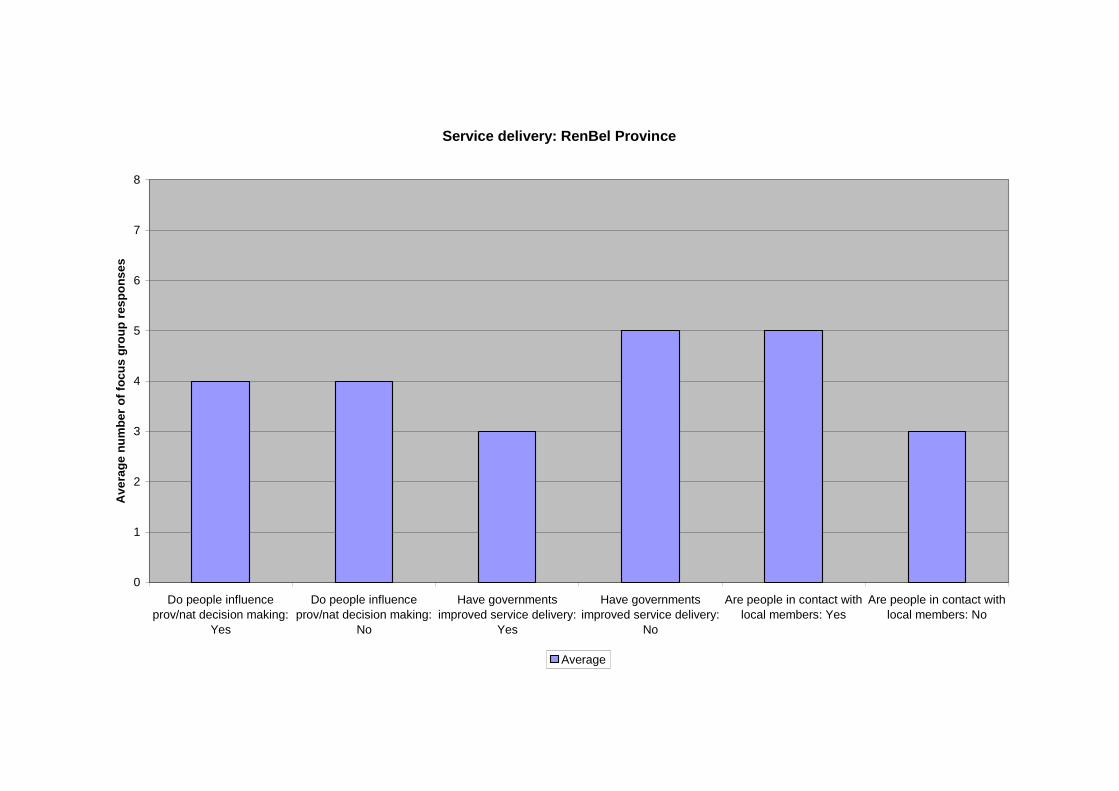
Service delivery: RenBel Province
0
1
2
3
4
5
6
7
8
Do people influence
prov/nat decision making:
Yes
Do people influence
prov/nat decision making:
No
Have governments
improved service delivery:
Yes
Have governments
improved service delivery:
No
Are people in contact with
local members: Yes
Are people in contact with
local members: No
Av
era
ge
nu
mb
er
of
foc
us
gro
up
res
po
ns
es
Average
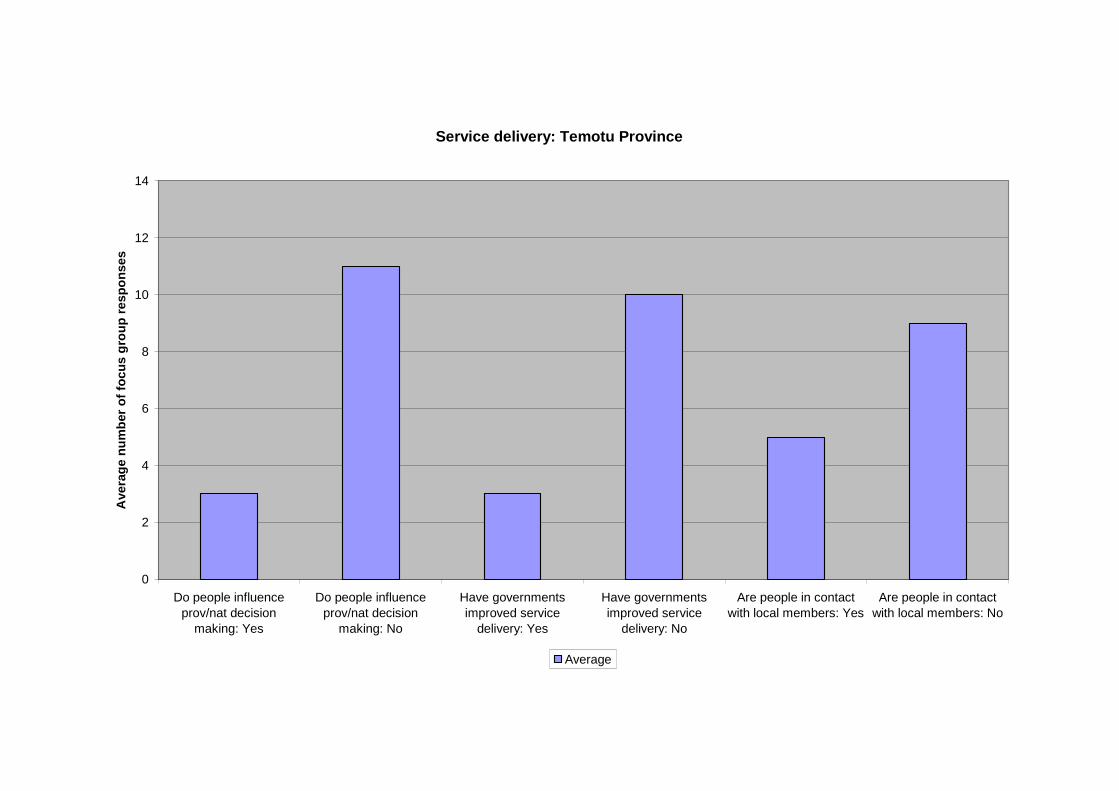
Service delivery: Temotu Province
0
2
4
6
8
10
12
14
Do people influenceprov/nat decision
making: Yes
Do people influenceprov/nat decision
making: No
Have governmentsimproved service
delivery: Yes
Have governmentsimproved service
delivery: No
Are people in contactwith local members: Yes
Are people in contactwith local members: No
Ave
rag
en
um
ber
of
foc
us
gro
up
res
po
ns
es
Average
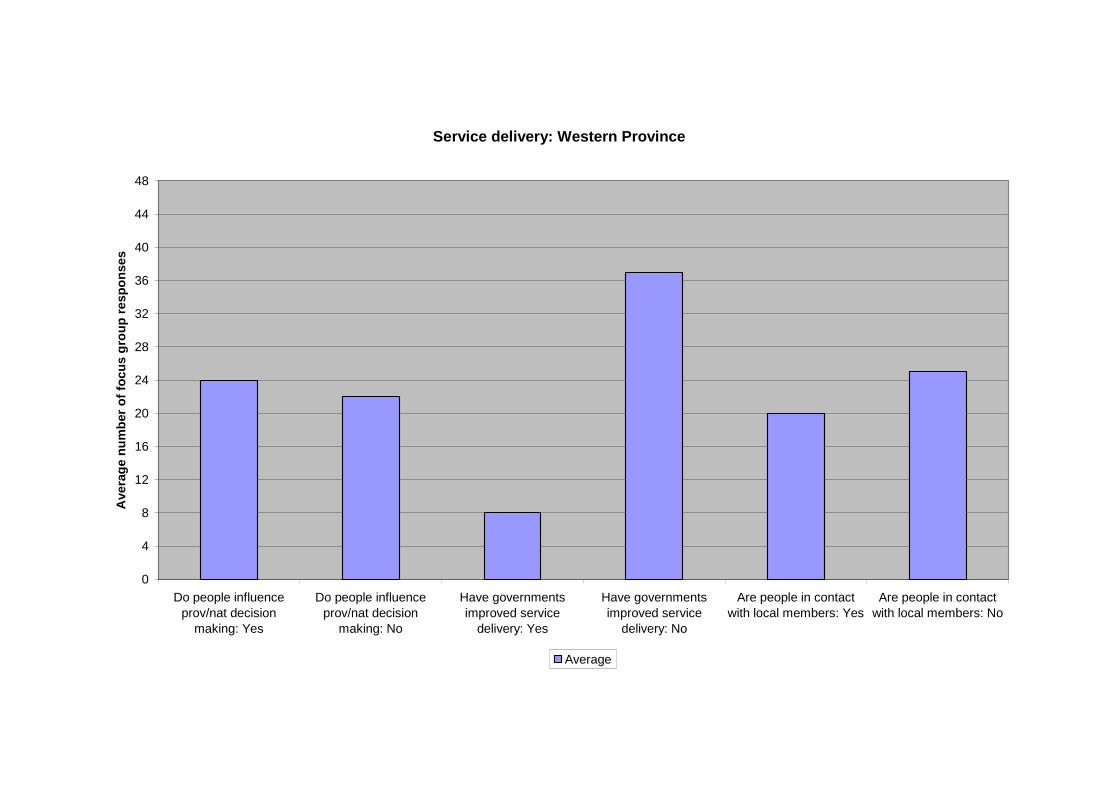
Service delivery: Western Province
0
4
8
12
16
20
24
28
32
36
40
44
48
Do people influenceprov/nat decision
making: Yes
Do people influenceprov/nat decision
making: No
Have governmentsimproved service
delivery: Yes
Have governmentsimproved service
delivery: No
Are people in contactwith local members: Yes
Are people in contactwith local members: No
Ave
rag
en
um
ber
of
foc
us
gro
up
res
po
ns
es
Average
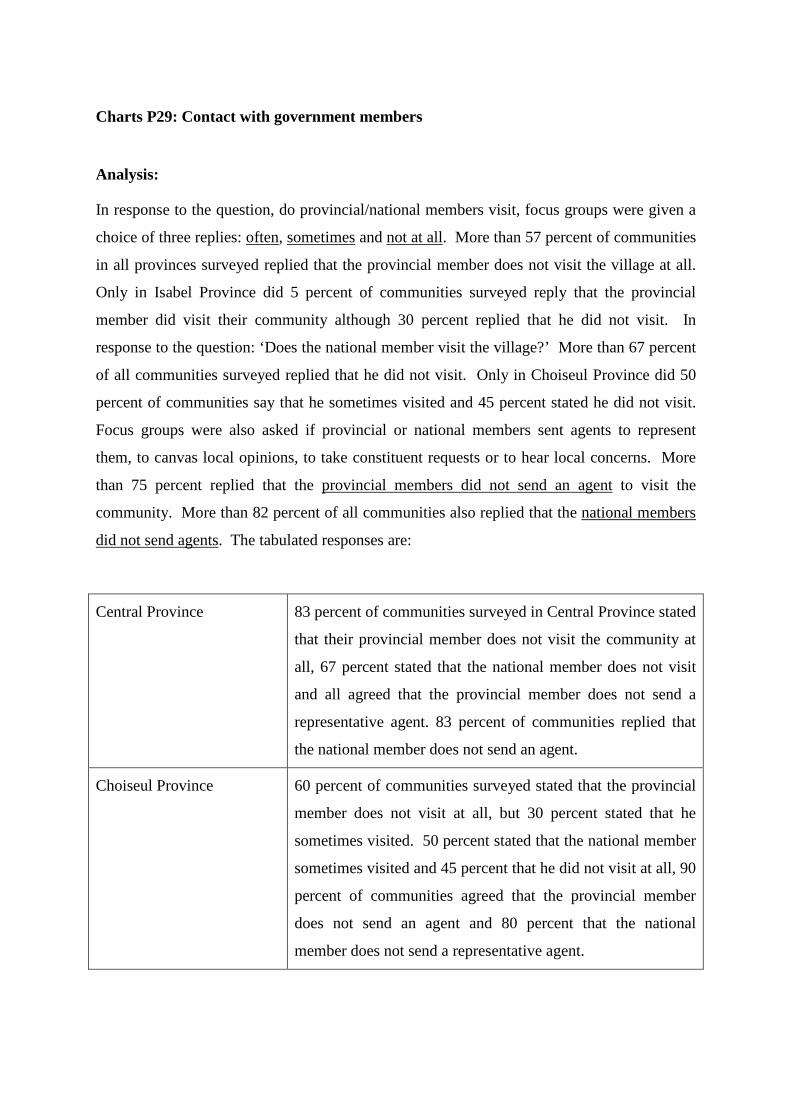
Charts P29: Contact with government members
Analysis:
In response to the question, do provincial/national members visit, focus groups were given a
choice of three replies: often, sometimes and not at all. More than 57 percent of communities
in all provinces surveyed replied that the provincial member does not visit the village at all.
Only in Isabel Province did 5 percent of communities surveyed reply that the provincial
member did visit their community although 30 percent replied that he did not visit. In
response to the question: ‘Does the national member visit the village?’ More than 67 percent
of all communities surveyed replied that he did not visit. Only in Choiseul Province did 50
percent of communities say that he sometimes visited and 45 percent stated he did not visit.
Focus groups were also asked if provincial or national members sent agents to represent
them, to canvas local opinions, to take constituent requests or to hear local concerns. More
than 75 percent replied that the provincial members did not send an agent to visit the
community. More than 82 percent of all communities also replied that the national members
did not send agents. The tabulated responses are:
Central Province 83 percent of communities surveyed in Central Province stated
that their provincial member does not visit the community at
all, 67 percent stated that the national member does not visit
and all agreed that the provincial member does not send a
representative agent. 83 percent of communities replied that
the national member does not send an agent.
Choiseul Province 60 percent of communities surveyed stated that the provincial
member does not visit at all, but 30 percent stated that he
sometimes visited. 50 percent stated that the national member
sometimes visited and 45 percent that he did not visit at all, 90
percent of communities agreed that the provincial member
does not send an agent and 80 percent that the national
member does not send a representative agent.
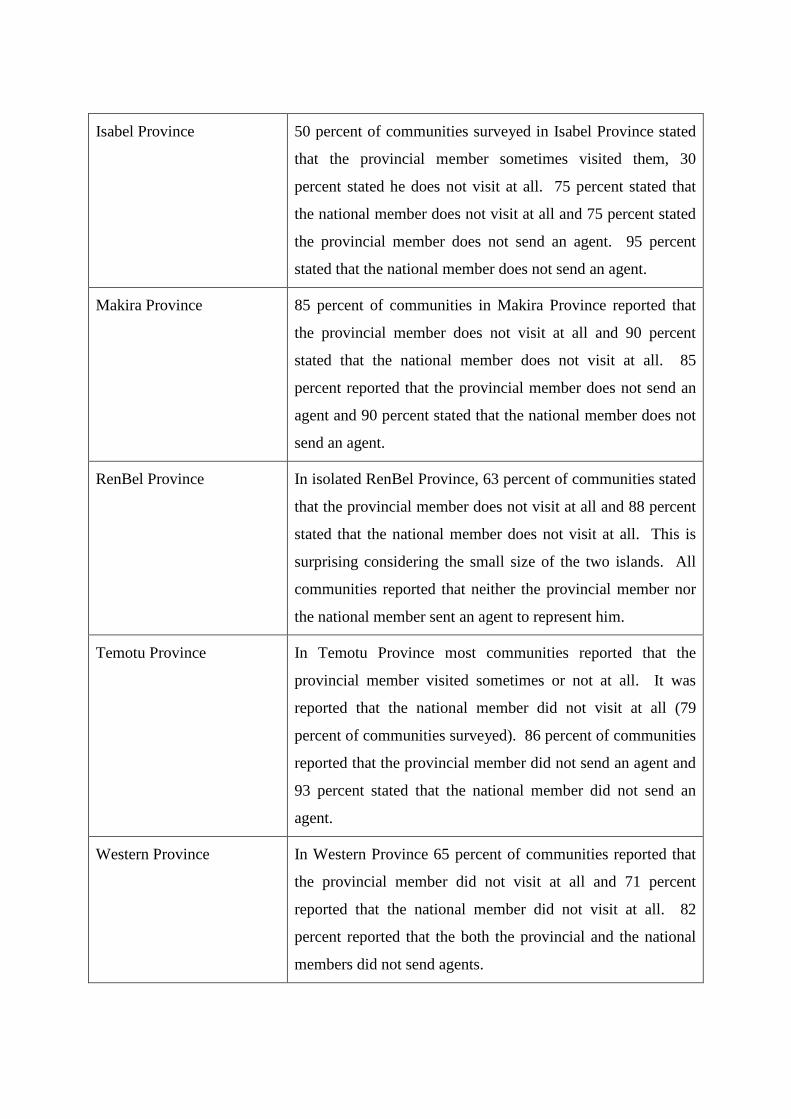
Isabel Province 50 percent of communities surveyed in Isabel Province stated
that the provincial member sometimes visited them, 30
percent stated he does not visit at all. 75 percent stated that
the national member does not visit at all and 75 percent stated
the provincial member does not send an agent. 95 percent
stated that the national member does not send an agent.
Makira Province 85 percent of communities in Makira Province reported that
the provincial member does not visit at all and 90 percent
stated that the national member does not visit at all. 85
percent reported that the provincial member does not send an
agent and 90 percent stated that the national member does not
send an agent.
RenBel Province In isolated RenBel Province, 63 percent of communities stated
that the provincial member does not visit at all and 88 percent
stated that the national member does not visit at all. This is
surprising considering the small size of the two islands. All
communities reported that neither the provincial member nor
the national member sent an agent to represent him.
Temotu Province In Temotu Province most communities reported that the
provincial member visited sometimes or not at all. It was
reported that the national member did not visit at all (79
percent of communities surveyed). 86 percent of communities
reported that the provincial member did not send an agent and
93 percent stated that the national member did not send an
agent.
Western Province In Western Province 65 percent of communities reported that
the provincial member did not visit at all and 71 percent
reported that the national member did not visit at all. 82
percent reported that the both the provincial and the national
members did not send agents.
Issues:
Communities also had limited opportunities to contact members who not only do not
generally visit the rural communities in their electorates but who do not send agents to visit
their local regions. The lack of direct contact has direct relevance to the implementation of
projects under programs like CSP. If the member is used as a vehicle for contact with
communities then the link is tenuous.
PROVINCIAL SIGNPOST: Contact with government members
Contact with government members is difficult for people in remote, outer provinces withpoor communication and the lack of direct contacts with either the elected representative oran agent who can report to the member. Rural communities are marginalised from thenational and provincial decision making processes and from contacts with formal structuressuch as health, education and welfare agencies. There is a critical need for improving accessto essential and basic services for remote communities.
NATIONAL SIGNPOST: Contact with government members
This chart needs to be considered in conjunction with the chart on service delivery. It isapparent that village people feel that governments have not improved service delivery andthat, in general, provincial and national members are not in touch with their constituencies.Nor do members send agents to represent them. There are many urgent issues to be resolvedin rural communities and despite a genuine attachment to the democratic process, the ruralcommunities feel marginalized. Donor agencies must seriously consider the value of usinggovernment members as contacts and representatives of people’s opinions.
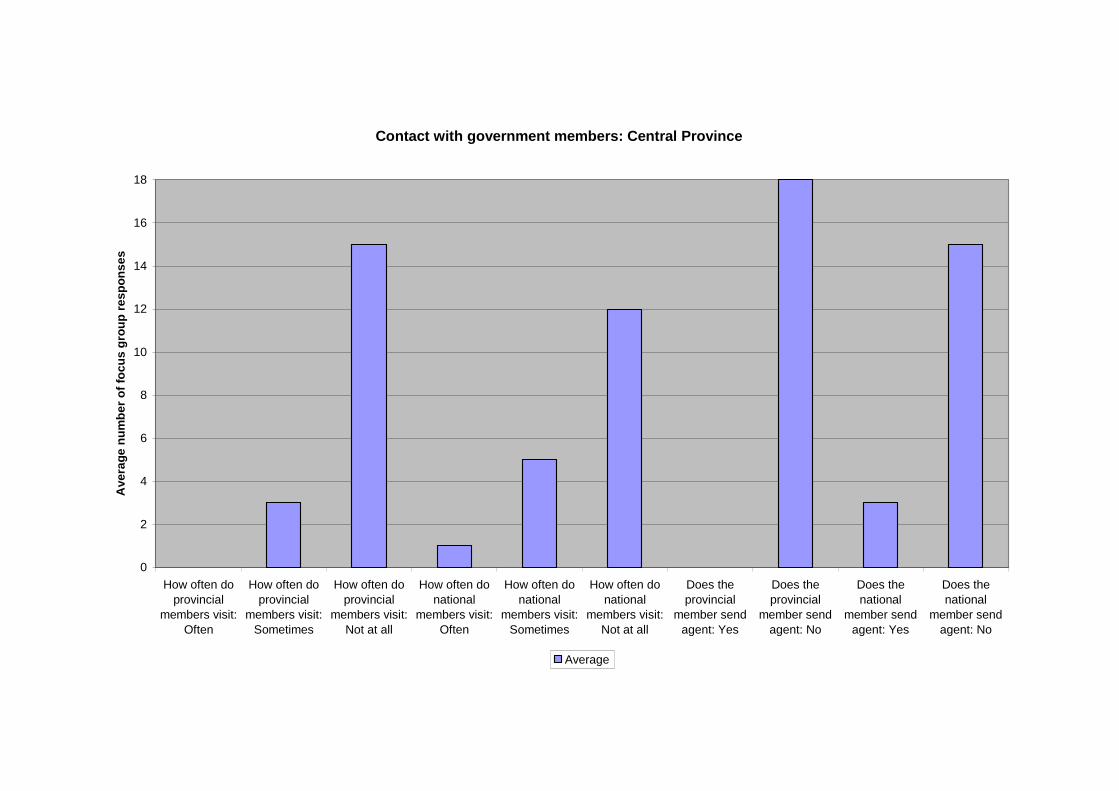
Contact with government members: Central Province
0
2
4
6
8
10
12
14
16
18
How often do
provincial
members visit:
Often
How often do
provincial
members visit:
Sometimes
How often do
provincial
members visit:
Not at all
How often do
national
members visit:
Often
How often do
national
members visit:
Sometimes
How often do
national
members visit:
Not at all
Does the
provincial
member send
agent: Yes
Does the
provincial
member send
agent: No
Does the
national
member send
agent: Yes
Does the
national
member send
agent: No
Ave
rag
en
um
be
ro
ffo
cu
sg
rou
pre
sp
on
se
s
Average
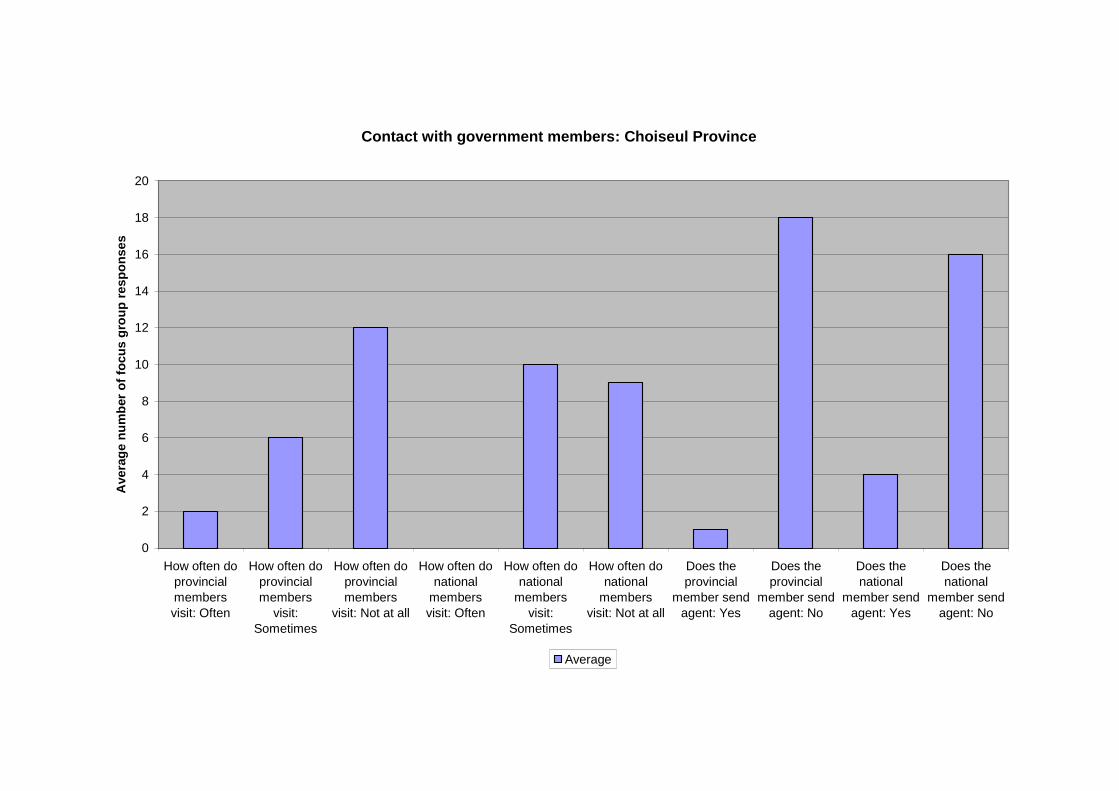
Contact with government members: Choiseul Province
0
2
4
6
8
10
12
14
16
18
20
How often doprovincialmembersvisit: Often
How often doprovincialmembers
visit:Sometimes
How often doprovincialmembers
visit: Not at all
How often donational
membersvisit: Often
How often donational
membersvisit:
Sometimes
How often donational
membersvisit: Not at all
Does theprovincial
member sendagent: Yes
Does theprovincial
member sendagent: No
Does thenational
member sendagent: Yes
Does thenational
member sendagent: No
Ave
rag
en
um
ber
of
foc
us
gro
up
res
po
ns
es
Average
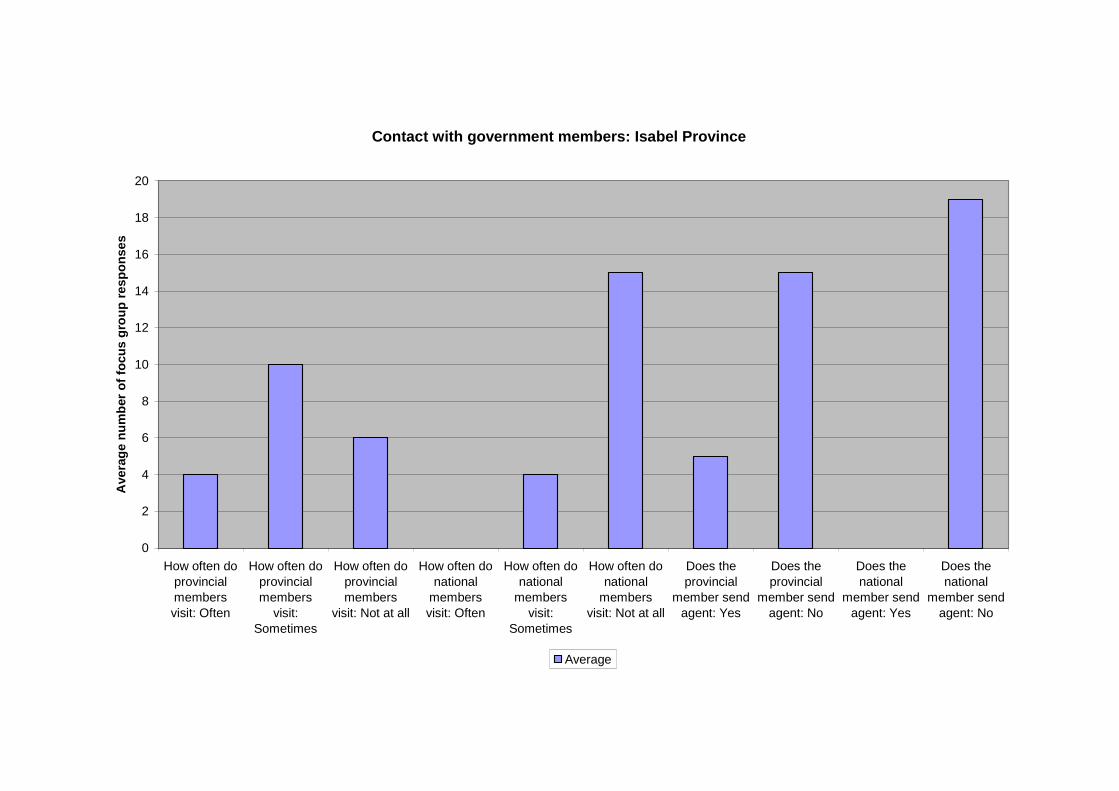
Contact with government members: Isabel Province
0
2
4
6
8
10
12
14
16
18
20
How often doprovincialmembersvisit: Often
How often doprovincialmembers
visit:Sometimes
How often doprovincialmembers
visit: Not at all
How often donational
membersvisit: Often
How often donational
membersvisit:
Sometimes
How often donational
membersvisit: Not at all
Does theprovincial
member sendagent: Yes
Does theprovincial
member sendagent: No
Does thenational
member sendagent: Yes
Does thenational
member sendagent: No
Ave
rag
en
um
ber
of
foc
us
gro
up
res
po
ns
es
Average
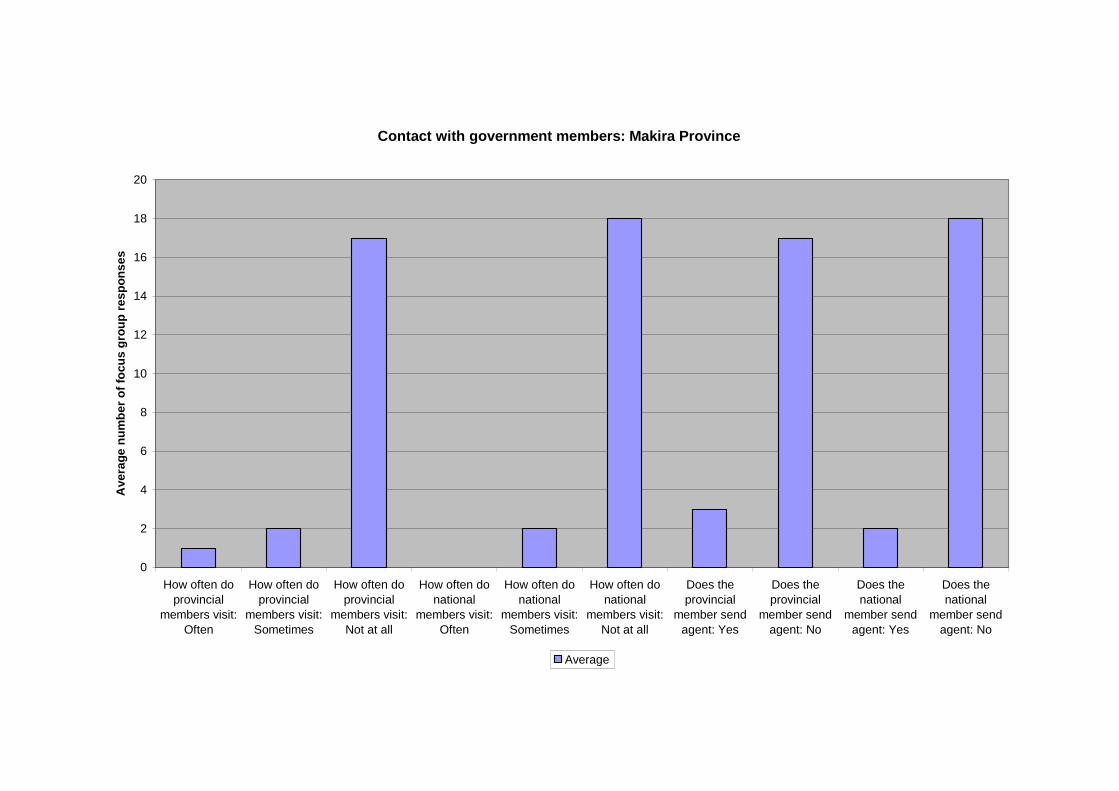
Contact with government members: Makira Province
0
2
4
6
8
10
12
14
16
18
20
How often do
provincial
members visit:
Often
How often do
provincial
members visit:
Sometimes
How often do
provincial
members visit:
Not at all
How often do
national
members visit:
Often
How often do
national
members visit:
Sometimes
How often do
national
members visit:
Not at all
Does the
provincial
member send
agent: Yes
Does the
provincial
member send
agent: No
Does the
national
member send
agent: Yes
Does the
national
member send
agent: No
Ave
rag
en
um
be
ro
ffo
cu
sg
rou
pre
sp
on
se
s
Average
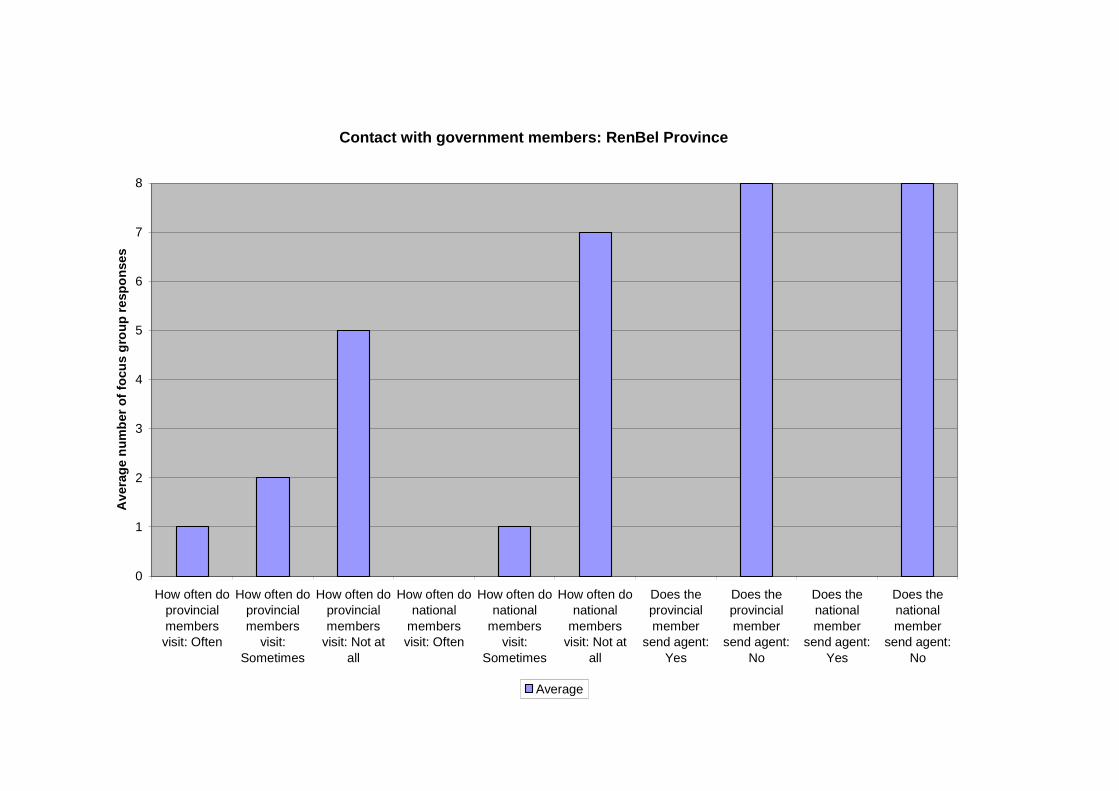
Contact with government members: RenBel Province
0
1
2
3
4
5
6
7
8
How often doprovincialmembersvisit: Often
How often doprovincialmembers
visit:Sometimes
How often doprovincialmembers
visit: Not atall
How often donational
membersvisit: Often
How often donational
membersvisit:
Sometimes
How often donational
membersvisit: Not at
all
Does theprovincialmember
send agent:Yes
Does theprovincialmember
send agent:No
Does thenationalmember
send agent:Yes
Does thenationalmember
send agent:No
Av
era
ge
nu
mb
er
of
focu
sg
rou
pre
sp
on
se
s
Average

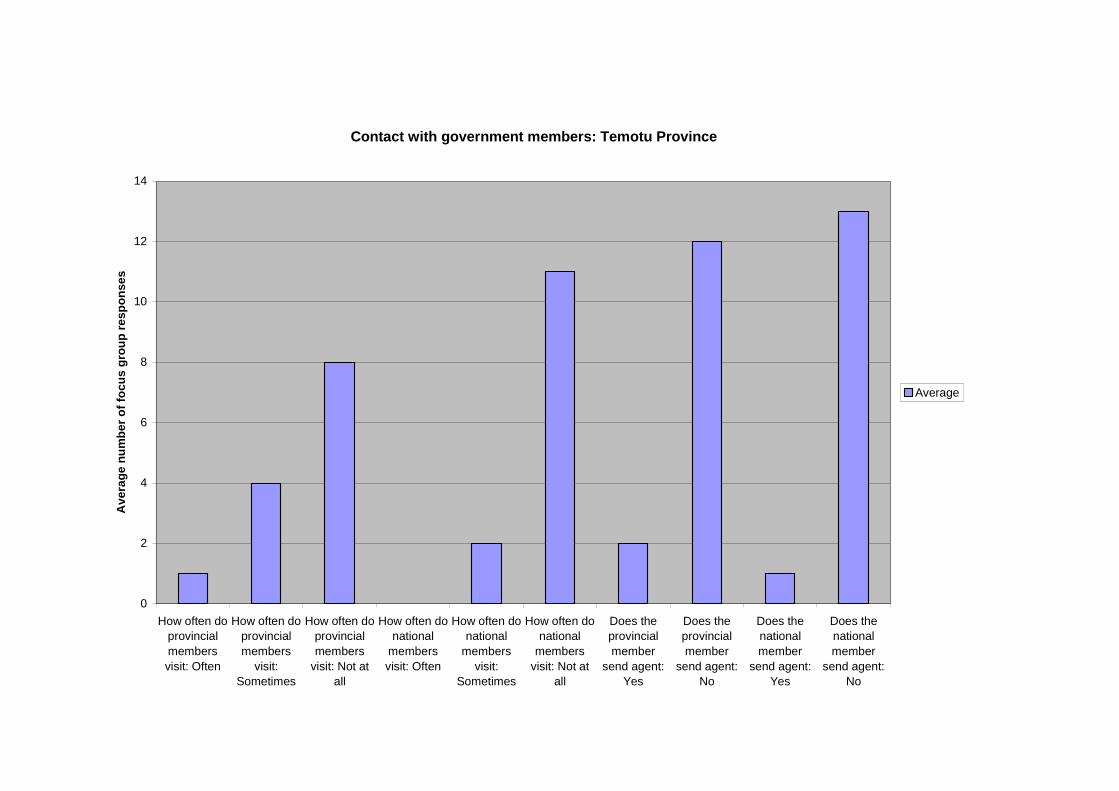
Contact with government members: Temotu Province
0
2
4
6
8
10
12
14
How often do
provincial
members
visit: Often
How often do
provincial
members
visit:
Sometimes
How often do
provincial
members
visit: Not at
all
How often do
national
members
visit: Often
How often do
national
members
visit:
Sometimes
How often do
national
members
visit: Not at
all
Does the
provincial
member
send agent:
Yes
Does the
provincial
member
send agent:
No
Does the
national
member
send agent:
Yes
Does the
national
member
send agent:
No
Av
era
ge
nu
mb
er
of
focu
sg
rou
pre
sp
on
se
s
Average

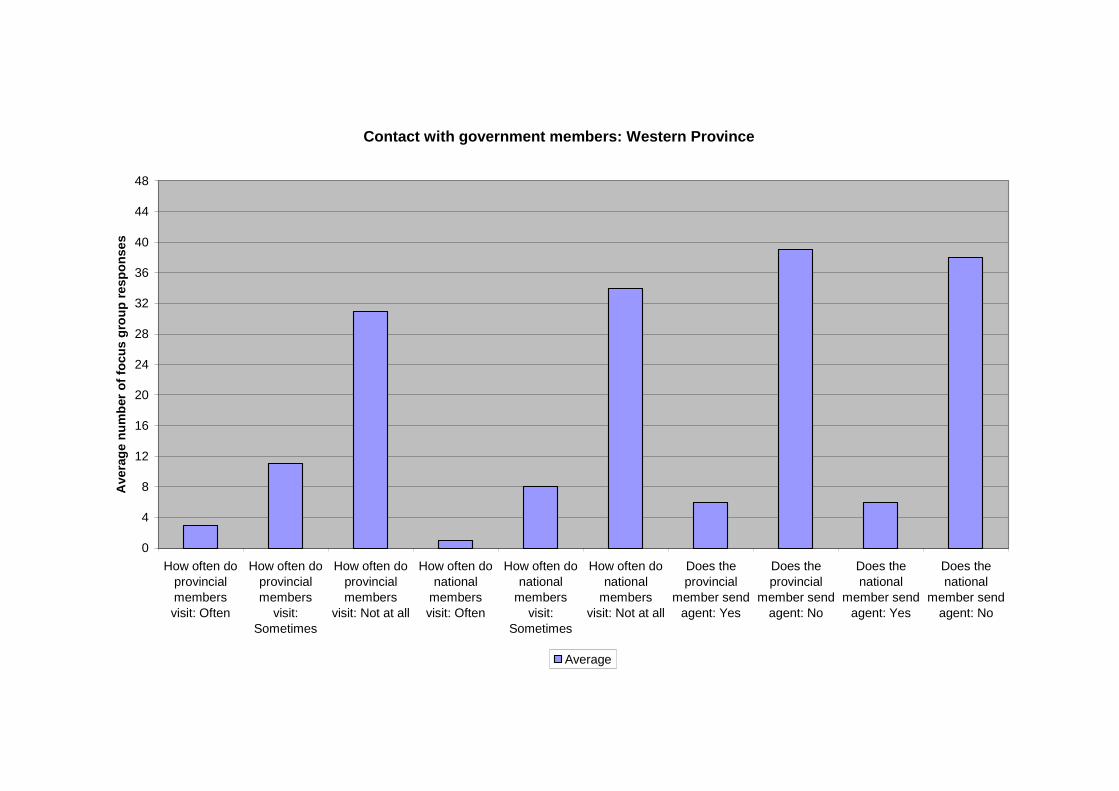
Contact with government members: Western Province
0
4
8
12
16
20
24
28
32
36
40
44
48
How often doprovincialmembersvisit: Often
How often doprovincialmembers
visit:Sometimes
How often doprovincialmembers
visit: Not at all
How often donational
membersvisit: Often
How often donational
membersvisit:
Sometimes
How often donational
membersvisit: Not at all
Does theprovincial
member sendagent: Yes
Does theprovincial
member sendagent: No
Does thenational
member sendagent: Yes
Does thenational
member sendagent: No
Ave
rag
en
um
ber
of
foc
us
gro
up
res
po
ns
es
Average
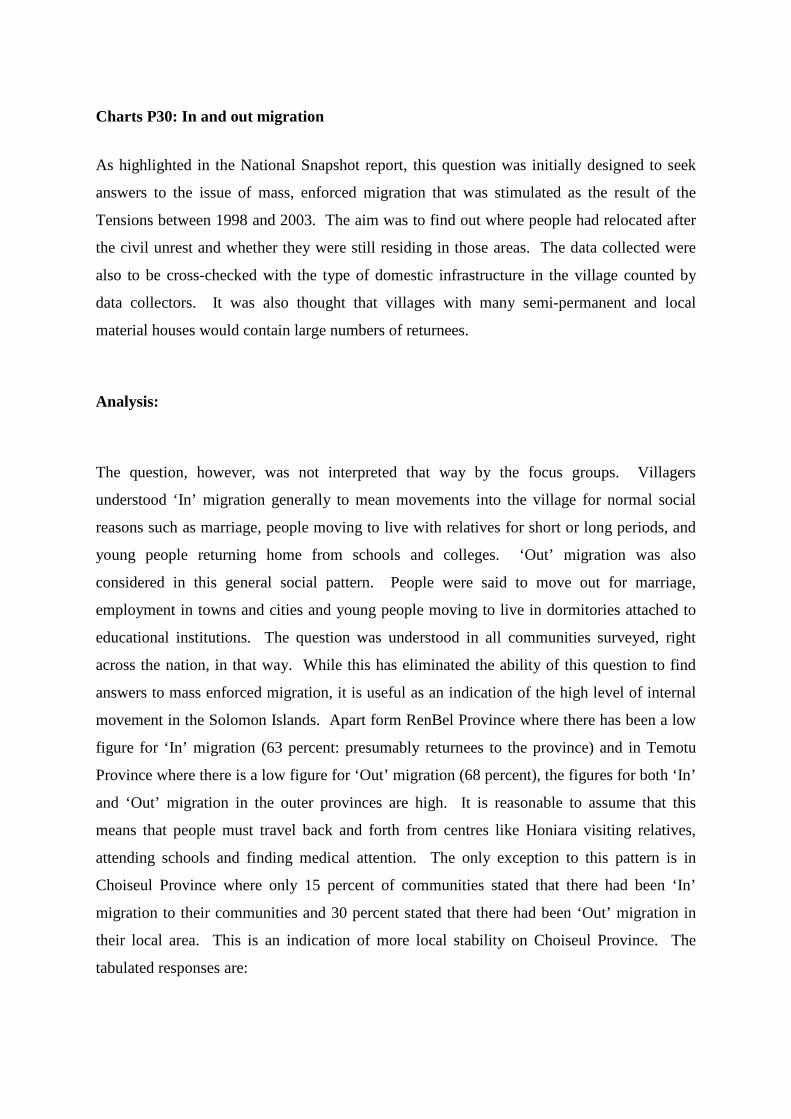
Charts P30: In and out migration
As highlighted in the National Snapshot report, this question was initially designed to seek
answers to the issue of mass, enforced migration that was stimulated as the result of the
Tensions between 1998 and 2003. The aim was to find out where people had relocated after
the civil unrest and whether they were still residing in those areas. The data collected were
also to be cross-checked with the type of domestic infrastructure in the village counted by
data collectors. It was also thought that villages with many semi-permanent and local
material houses would contain large numbers of returnees.
Analysis:
The question, however, was not interpreted that way by the focus groups. Villagers
understood ‘In’ migration generally to mean movements into the village for normal social
reasons such as marriage, people moving to live with relatives for short or long periods, and
young people returning home from schools and colleges. ‘Out’ migration was also
considered in this general social pattern. People were said to move out for marriage,
employment in towns and cities and young people moving to live in dormitories attached to
educational institutions. The question was understood in all communities surveyed, right
across the nation, in that way. While this has eliminated the ability of this question to find
answers to mass enforced migration, it is useful as an indication of the high level of internal
movement in the Solomon Islands. Apart form RenBel Province where there has been a low
figure for ‘In’ migration (63 percent: presumably returnees to the province) and in Temotu
Province where there is a low figure for ‘Out’ migration (68 percent), the figures for both ‘In’
and ‘Out’ migration in the outer provinces are high. It is reasonable to assume that this
means that people must travel back and forth from centres like Honiara visiting relatives,
attending schools and finding medical attention. The only exception to this pattern is in
Choiseul Province where only 15 percent of communities stated that there had been ‘In’
migration to their communities and 30 percent stated that there had been ‘Out’ migration in
their local area. This is an indication of more local stability on Choiseul Province. The
tabulated responses are:
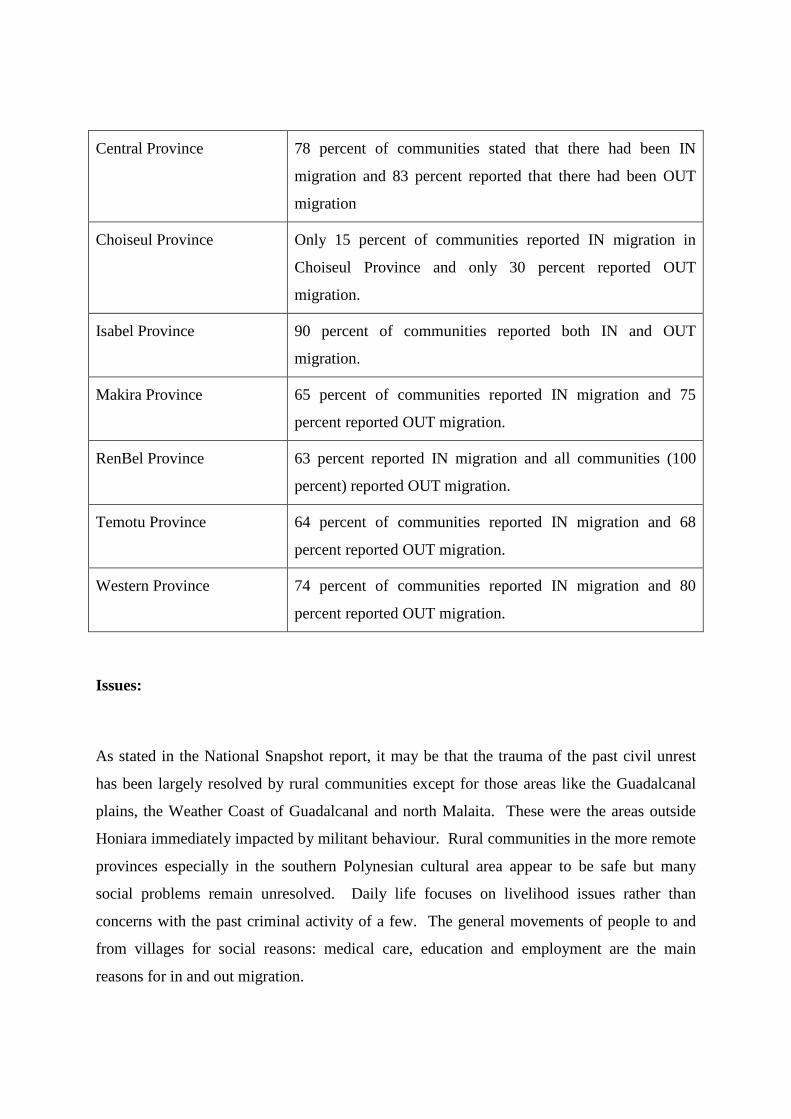
Central Province 78 percent of communities stated that there had been IN
migration and 83 percent reported that there had been OUT
migration
Choiseul Province Only 15 percent of communities reported IN migration in
Choiseul Province and only 30 percent reported OUT
migration.
Isabel Province 90 percent of communities reported both IN and OUT
migration.
Makira Province 65 percent of communities reported IN migration and 75
percent reported OUT migration.
RenBel Province 63 percent reported IN migration and all communities (100
percent) reported OUT migration.
Temotu Province 64 percent of communities reported IN migration and 68
percent reported OUT migration.
Western Province 74 percent of communities reported IN migration and 80
percent reported OUT migration.
Issues:
As stated in the National Snapshot report, it may be that the trauma of the past civil unrest
has been largely resolved by rural communities except for those areas like the Guadalcanal
plains, the Weather Coast of Guadalcanal and north Malaita. These were the areas outside
Honiara immediately impacted by militant behaviour. Rural communities in the more remote
provinces especially in the southern Polynesian cultural area appear to be safe but many
social problems remain unresolved. Daily life focuses on livelihood issues rather than
concerns with the past criminal activity of a few. The general movements of people to and
from villages for social reasons: medical care, education and employment are the main
reasons for in and out migration.
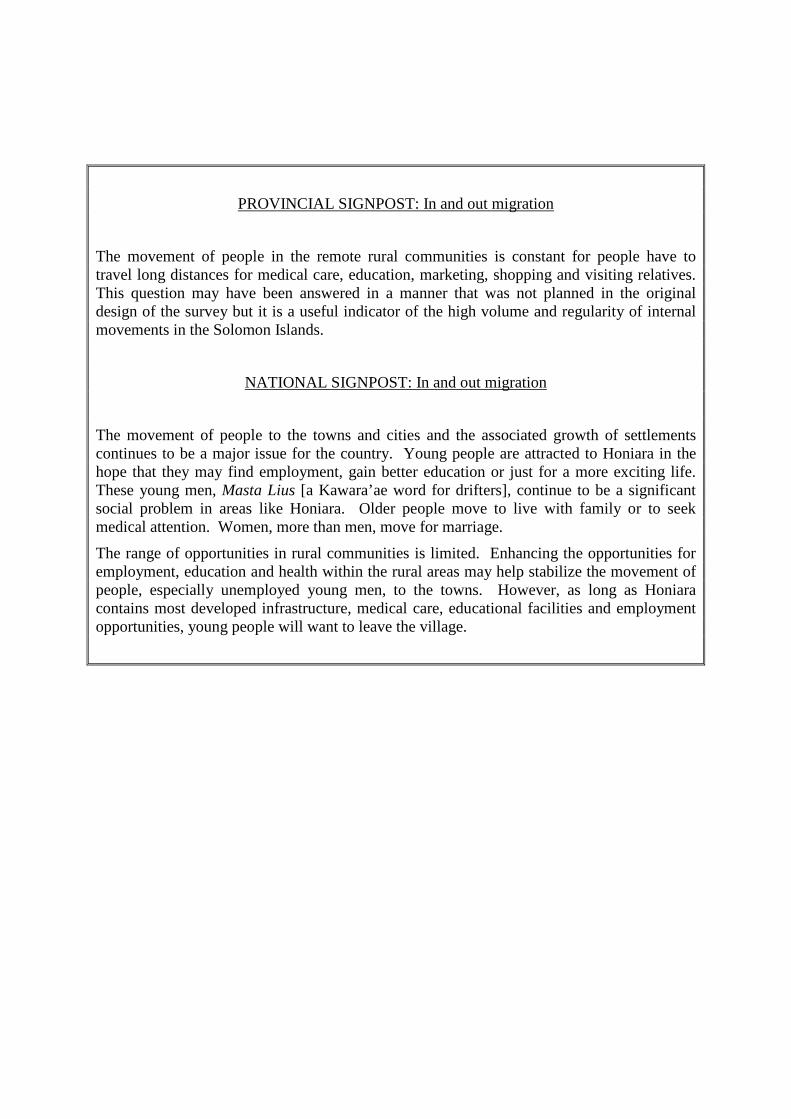
PROVINCIAL SIGNPOST: In and out migration
The movement of people in the remote rural communities is constant for people have totravel long distances for medical care, education, marketing, shopping and visiting relatives.This question may have been answered in a manner that was not planned in the originaldesign of the survey but it is a useful indicator of the high volume and regularity of internalmovements in the Solomon Islands.
NATIONAL SIGNPOST: In and out migration
The movement of people to the towns and cities and the associated growth of settlementscontinues to be a major issue for the country. Young people are attracted to Honiara in thehope that they may find employment, gain better education or just for a more exciting life.These young men, Masta Lius [a Kawara’ae word for drifters], continue to be a significantsocial problem in areas like Honiara. Older people move to live with family or to seekmedical attention. Women, more than men, move for marriage.
The range of opportunities in rural communities is limited. Enhancing the opportunities foremployment, education and health within the rural areas may help stabilize the movement ofpeople, especially unemployed young men, to the towns. However, as long as Honiaracontains most developed infrastructure, medical care, educational facilities and employmentopportunities, young people will want to leave the village.
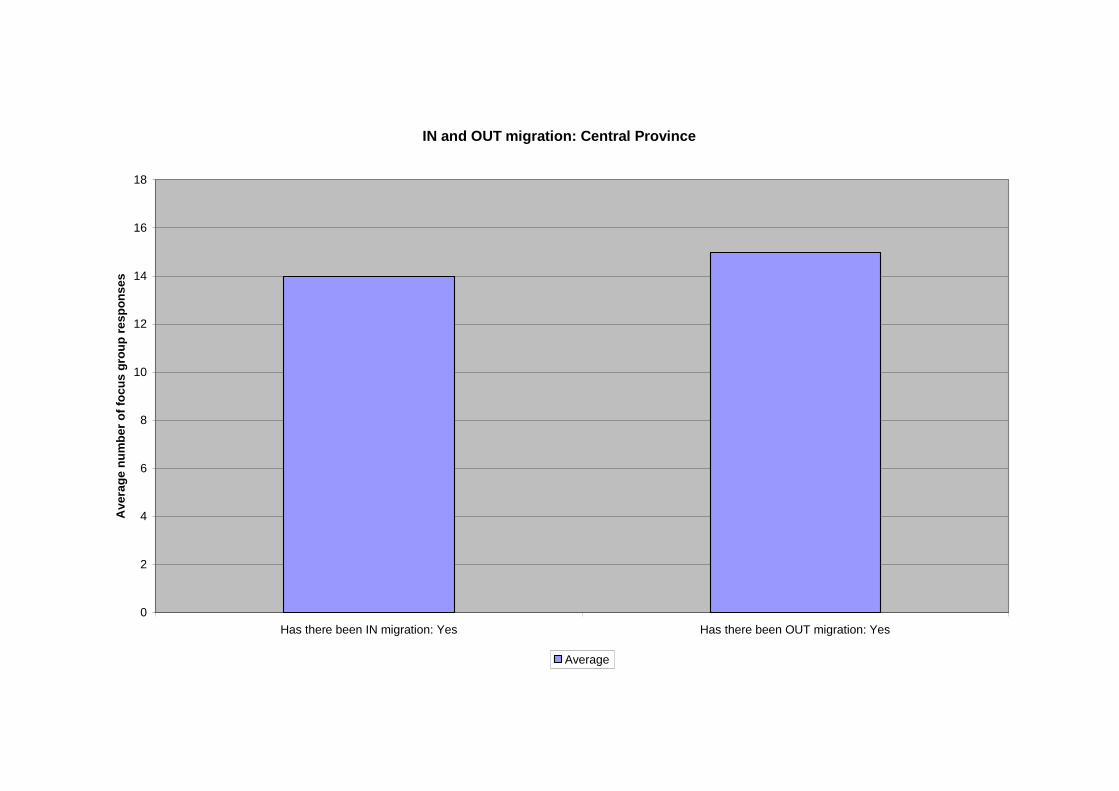
IN and OUT migration: Central Province
0
2
4
6
8
10
12
14
16
18
Has there been IN migration: Yes Has there been OUT migration: Yes
Av
era
ge
nu
mb
er
of
foc
us
gro
up
res
po
ns
es
Average
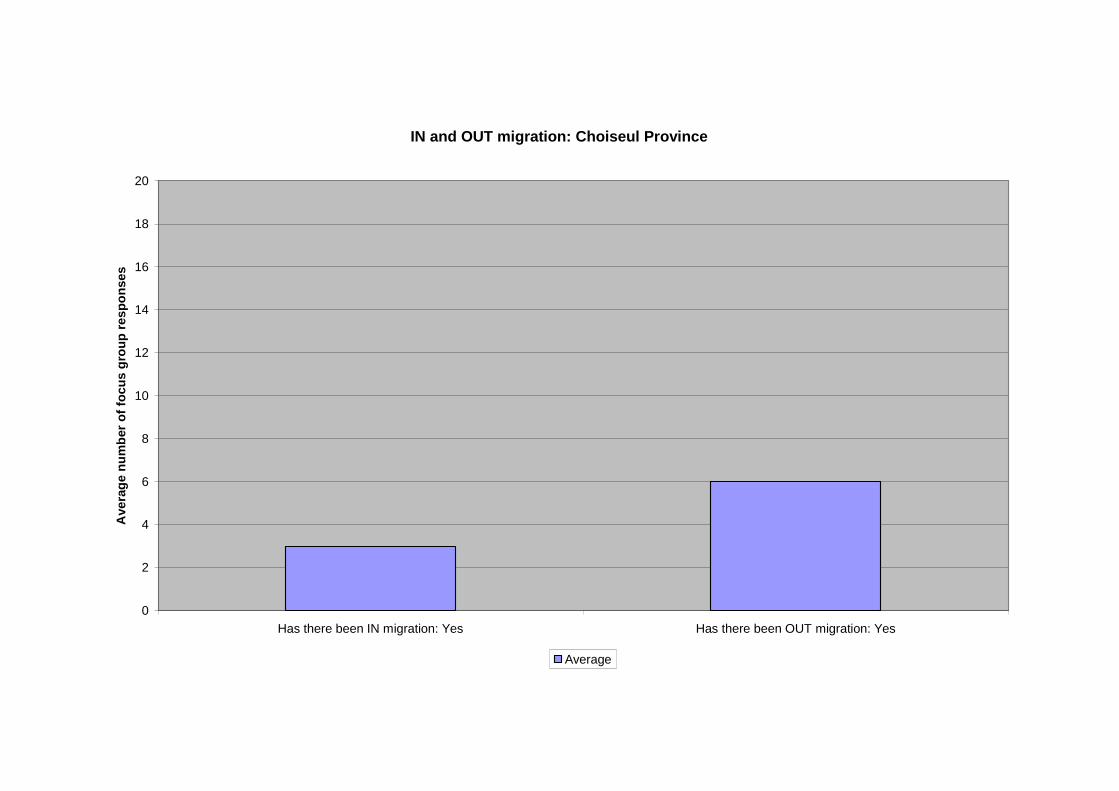
IN and OUT migration: Choiseul Province
0
2
4
6
8
10
12
14
16
18
20
Has there been IN migration: Yes Has there been OUT migration: Yes
Ave
rag
en
um
ber
of
foc
us
gro
up
res
po
ns
es
Average
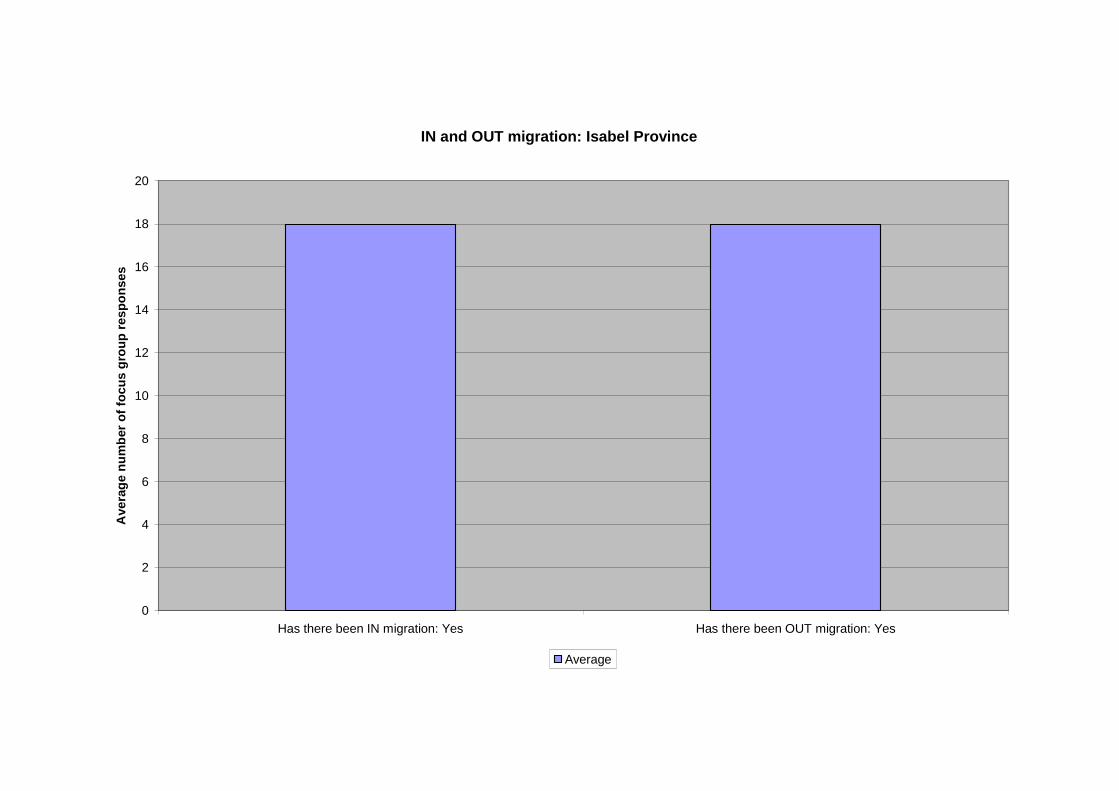
IN and OUT migration: Isabel Province
0
2
4
6
8
10
12
14
16
18
20
Has there been IN migration: Yes Has there been OUT migration: Yes
Ave
rag
en
um
ber
of
foc
us
gro
up
res
po
ns
es
Average
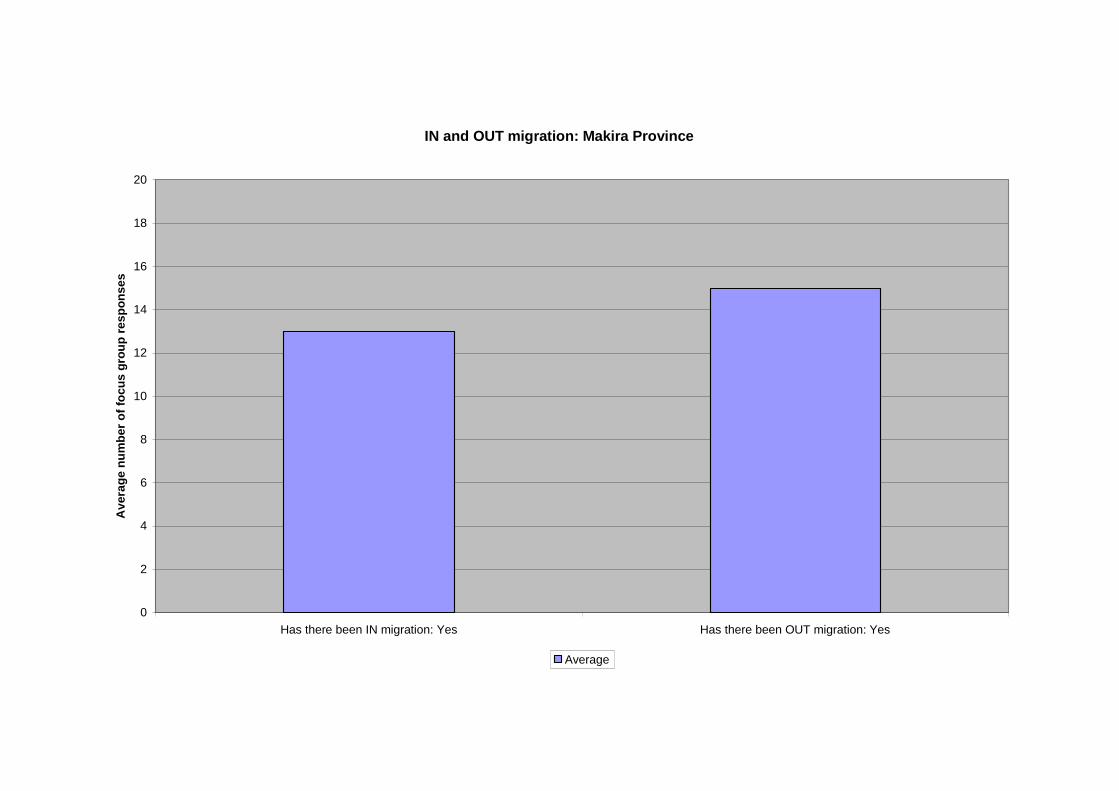
IN and OUT migration: Makira Province
0
2
4
6
8
10
12
14
16
18
20
Has there been IN migration: Yes Has there been OUT migration: Yes
Av
era
ge
nu
mb
er
of
foc
us
gro
up
res
po
ns
es
Average
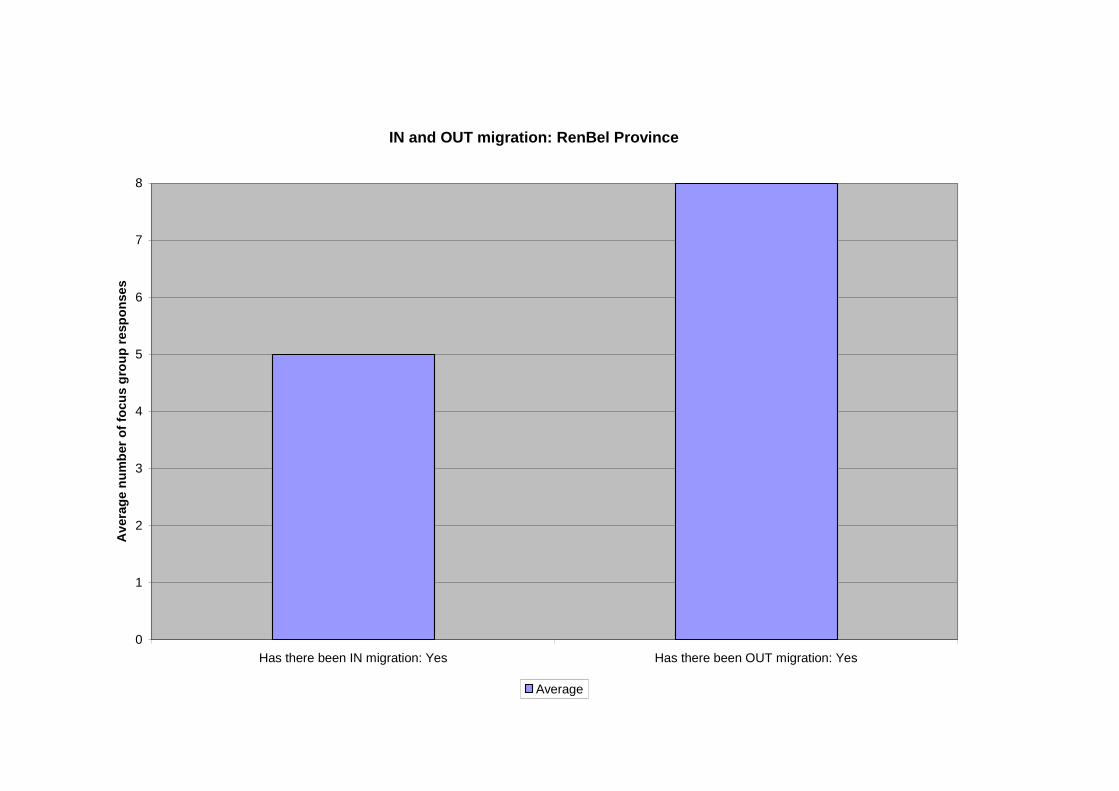
IN and OUT migration: RenBel Province
0
1
2
3
4
5
6
7
8
Has there been IN migration: Yes Has there been OUT migration: Yes
Av
era
ge
nu
mb
er
of
focu
sg
rou
pre
sp
on
se
s
Average

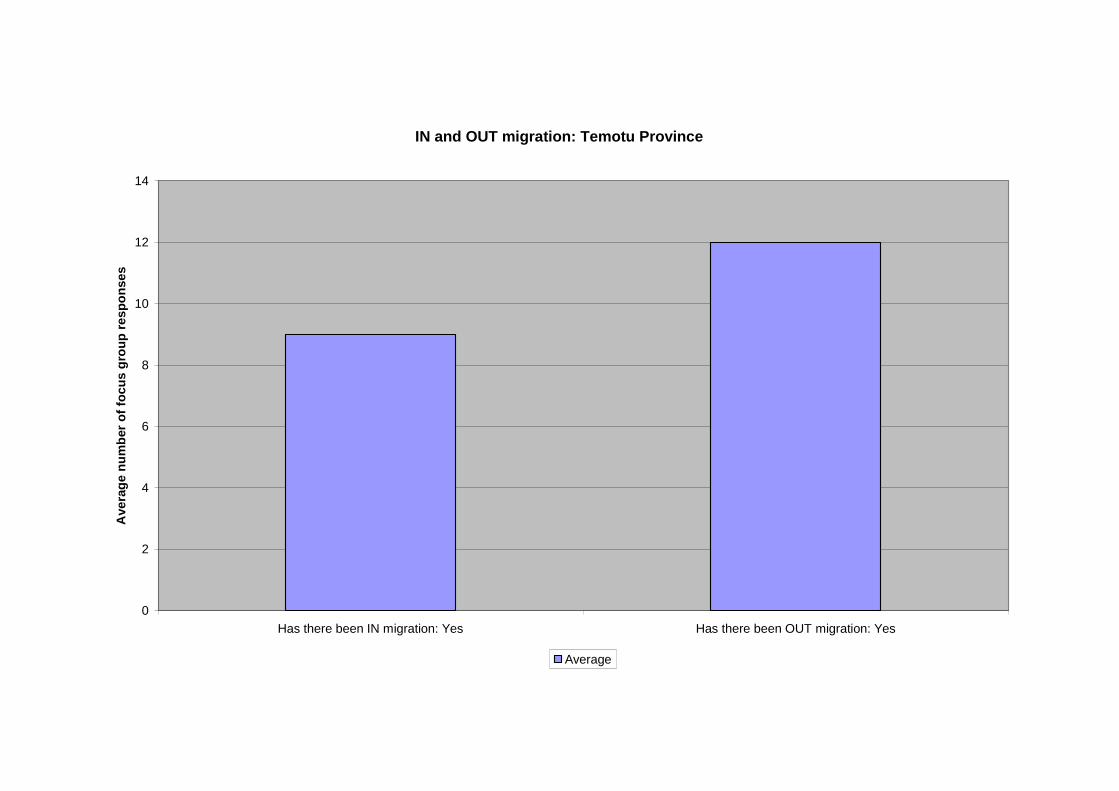
IN and OUT migration: Temotu Province
0
2
4
6
8
10
12
14
Has there been IN migration: Yes Has there been OUT migration: Yes
Ave
rag
en
um
ber
of
foc
us
gro
up
res
po
ns
es
Average
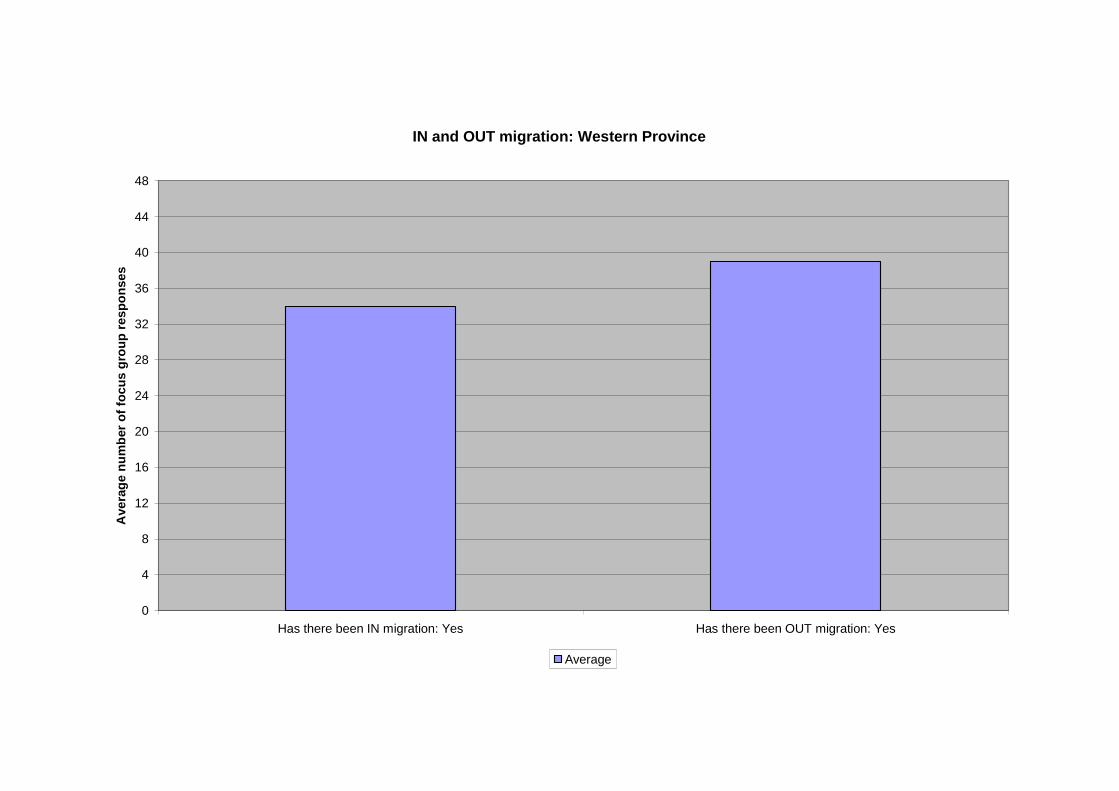
IN and OUT migration: Western Province
0
4
8
12
16
20
24
28
32
36
40
44
48
Has there been IN migration: Yes Has there been OUT migration: Yes
Ave
rag
en
um
ber
of
foc
us
gro
up
res
po
ns
es
Average
Charts P31: Contact with other donors
Analysis:
As stated in the National Snapshot report, comments following this question often listed a
number of agencies that would generally be defined as CBOs or donor agencies. In fact,
there was considerable confusion in villages about the role and status of NGOs in general.
Oxfam, for example, was most frequently called Ox and Palm: a popular brand of tinned
beef. The use of acronyms and abbreviations, especially when the international NGO had a
local counterpart, is the source of great confusion in rural communities.
In general less than 20 percent of communities surveyed across all provinces, with the
exception of Central and Makira Provinces, reported no contact with NGOs. It can be
assumed therefore that the general confusion with identification of donor agencies has meant
that the questions of whether projects were successful or unsuccessful, completed or not
completed, cannot be interpreted with any real accuracy.
Of particular significance is the fact that more than 50 percent of communities, with the
exception of Makira (45 precent of communities surveyed) and RenBel province (only 1
community or 13 percent of responses) reported that they had instigated their own
development projects. Comments record that this generally means assisting with construction
of buildings and installation of equipment for donor projects. The fact that villagers report
this as their own development work should give some indication of the willingness of
communities to assist with local programs and take ownership of them if they are involved in
the construction and maintenance. The tabulated responses are:
Central Province Only 22 percent of communities in Central Province reported
contact with NGOs but 56 percent of communities stated that
they had instigated their own development projects.
Choiseul Province In Choiseul Province only 10 percent of communities
surveyed reported that they had been in contact with NGOs
but 30 percent reported other successful donor projects.
However 45 percent of communities stated that the donor
projects had been unsuccessful. 70 percent stated that they
had uncompleted donor projects and 55 percent of
communities reported that they had instigated their own
development projects.
Isabel Province While 35 percent of communities reported successful donor
projects only 20 percent reported contact with NGOs. 40
percent of the communities surveyed on Isabel Province stated
that they had completed other donor projects but 50 percent
reported that they had instigated their own development
projects.
Makira Province In Makira Province 35 percent of communities surveyed
reported contact with NGOs and 35 percent stated that these
project were successful. 40 percent were reported as
unsuccessful and uncompleted and 40 percent of communities
reported that they had instigated their own development
projects.
RenBel Province In RenBel Province only 13 percent (one community) reported
contact with NGOs although 50 percent reported successful
donor projects and 38 percent reported completed donor
projects. Only 13 percent of communities had instigated their
own development project.
Temotu Province In Temotu only 14 percent of communities (two communities)
reported contact with NGOs but 50 percent reported
successful donor projects and 57 percent reported completed
donor projects. 64 percent stated that they had instigated their
own development projects.
Western Province Only 19 percent of communities in Western Province reported
that they had contact with NGOs and only 21 percent reported
successful donor projects. 25 percent reported completed
projects and 53 percent stated that they had instigated their
own development projects.
Issues:
The failure of donor projects is almost always pointed out to be due to a lack of maintenance
of equipment, a failure to follow the project through to the completion date or the
unsuitability of the project for the community in the first place. Villagers stated that there
was little real consultation with the local community. Few projects are requested by the
villages initially: most are implemented at the insistence of the donor agency or NGO and
usually in order to satisfy international political, environmental or social obligations.
However, the fact that the majority of communities stated that they had instigated their own
development project, even if this means that they assisted with construction or participated in
resolving land disputes, indicates that communities throughout the provinces are willing to
participate in meaningful programs that have consulted and negotiated with the local people.
PROVINCIAL SIGNPOST: Contact with other donors
Village people are genuinely committed to assisting with projects that have been instigated attheir request and can be constructed or developed with their assistance. This bottom upapproach is now part of the logic of development work but criticism of many projectsimplemented in countries like the Solomon Islands is that the project are designed to meetwith donor interpretations of local needs, or to satisfy international social, economic orpolitical criteria.
NATIONAL SIGNPOST: Contact with other donors
This is a question that can only really be successfully answered after analysis of the resurveyresults. Then a longer timeframe will have elapsed for the impact of NGO funded projects tobe measured. Also, international NGOs will have had time to establish local counterparts thatwill hopefully have more understanding of the Solomon Islands and its social, economic andenvironmental dynamics. Until a strong civil society is established in the Solomon Islands,project aid will continue to reflect the values and attitudes of the donors rather than therecipients.
Until then CSP can play a major role in empowering communities to make selective choicesabout projects proposed for their communities and, importantly, rejecting the ones thatcommunities think will not be suitable for their local needs. Involving communities in theconstruction, maintenance or long term operation of projects is the way to build self-reliancein rural areas.
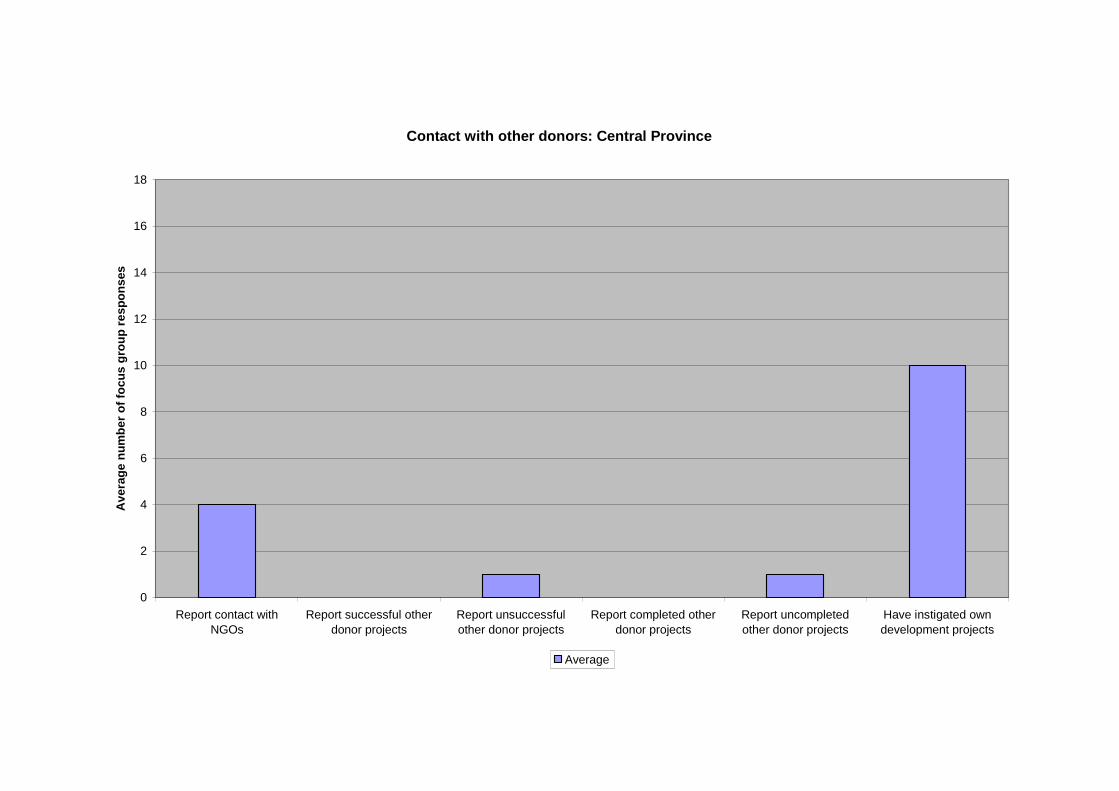
Contact with other donors: Central Province
0
2
4
6
8
10
12
14
16
18
Report contact with
NGOs
Report successful other
donor projects
Report unsuccessful
other donor projects
Report completed other
donor projects
Report uncompleted
other donor projects
Have instigated own
development projects
Av
era
ge
nu
mb
er
of
foc
us
gro
up
res
po
ns
es
Average
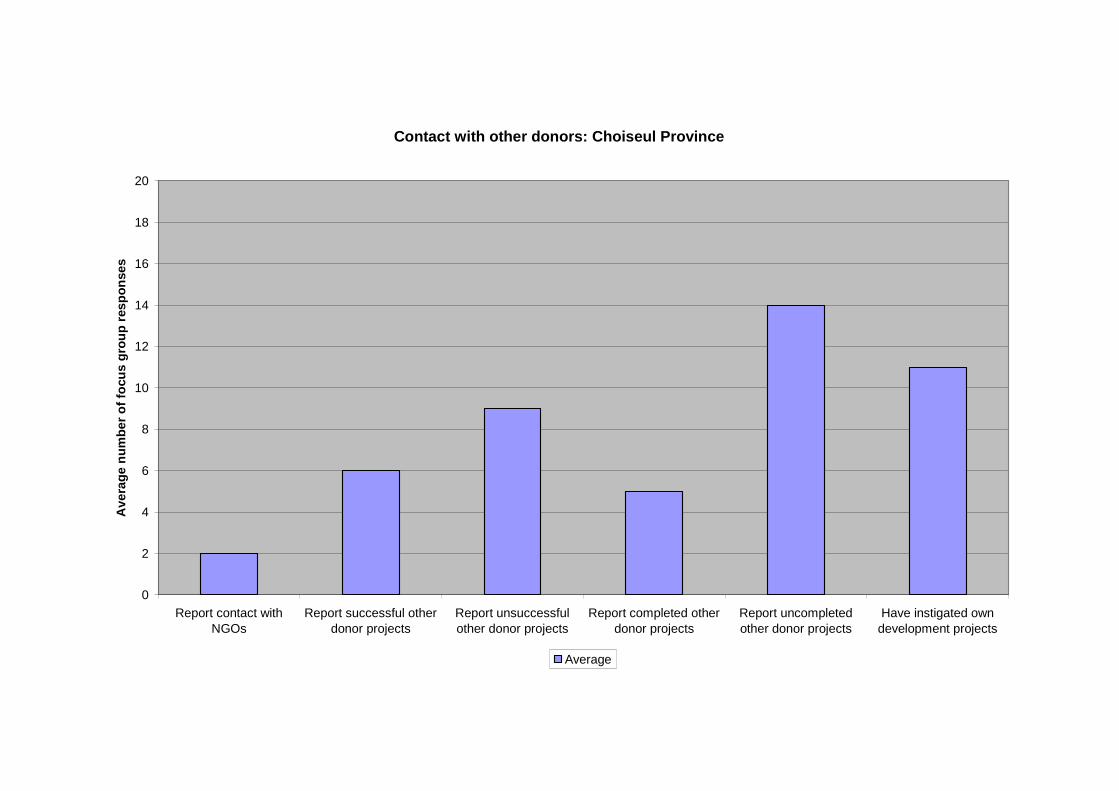
Contact with other donors: Choiseul Province
0
2
4
6
8
10
12
14
16
18
20
Report contact withNGOs
Report successful otherdonor projects
Report unsuccessfulother donor projects
Report completed otherdonor projects
Report uncompletedother donor projects
Have instigated owndevelopment projects
Av
era
ge
nu
mb
er
of
focu
sg
rou
pre
sp
on
se
s
Average
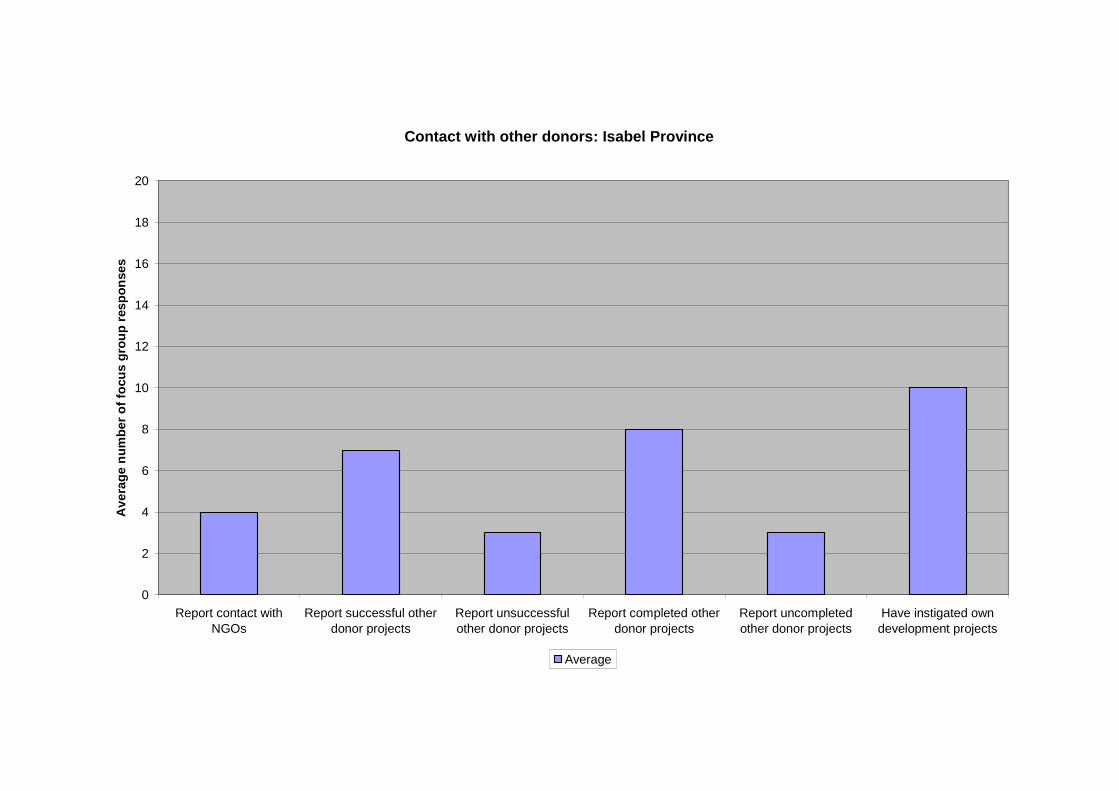
Contact with other donors: Isabel Province
0
2
4
6
8
10
12
14
16
18
20
Report contact withNGOs
Report successful otherdonor projects
Report unsuccessfulother donor projects
Report completed otherdonor projects
Report uncompletedother donor projects
Have instigated owndevelopment projects
Av
era
ge
nu
mb
er
of
focu
sg
rou
pre
sp
on
se
s
Average
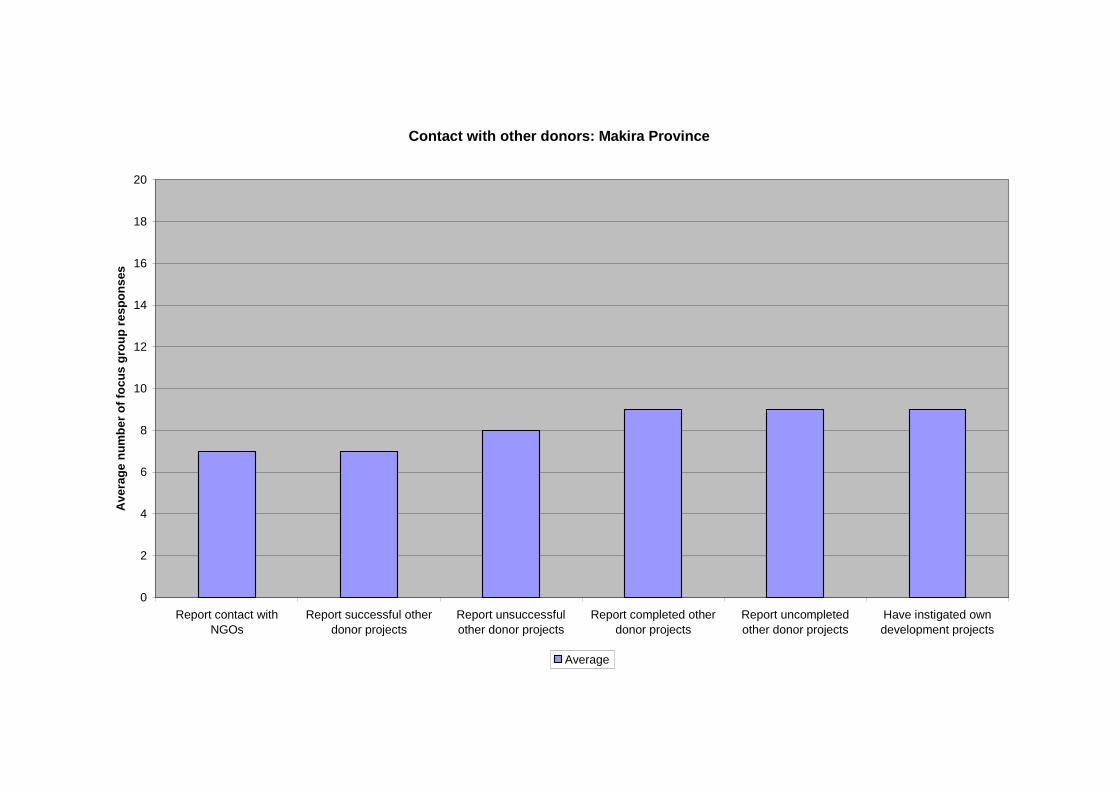
Contact with other donors: Makira Province
0
2
4
6
8
10
12
14
16
18
20
Report contact with
NGOs
Report successful other
donor projects
Report unsuccessful
other donor projects
Report completed other
donor projects
Report uncompleted
other donor projects
Have instigated own
development projects
Av
era
ge
nu
mb
er
of
foc
us
gro
up
res
po
ns
es
Average
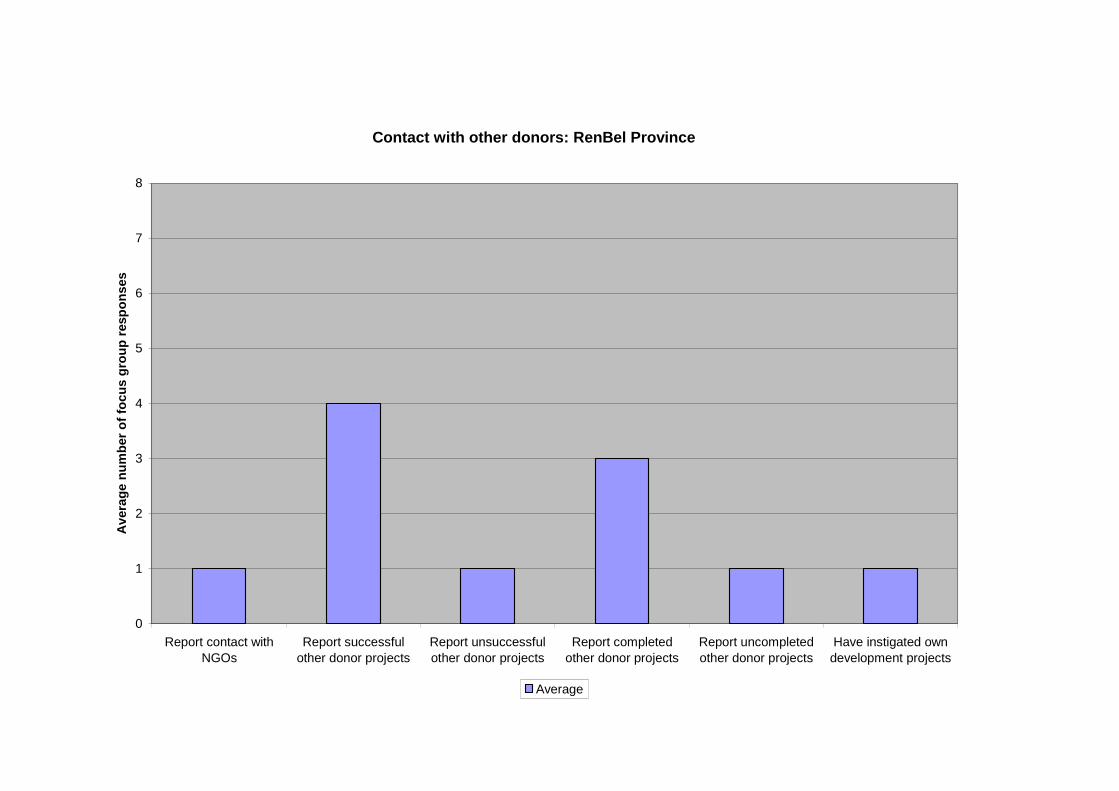
Contact with other donors: RenBel Province
0
1
2
3
4
5
6
7
8
Report contact withNGOs
Report successfulother donor projects
Report unsuccessfulother donor projects
Report completedother donor projects
Report uncompletedother donor projects
Have instigated owndevelopment projects
Av
era
ge
nu
mb
er
of
foc
us
gro
up
resp
on
ses
Average

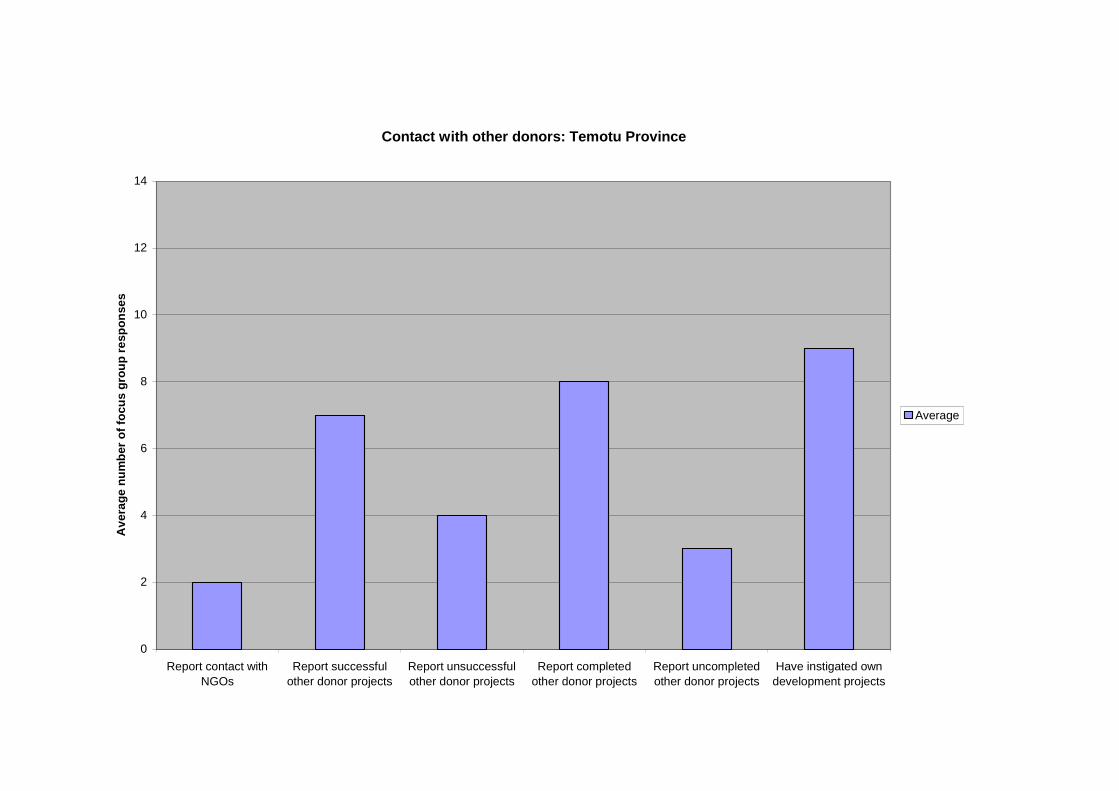
Contact with other donors: Temotu Province
0
2
4
6
8
10
12
14
Report contact with
NGOs
Report successful
other donor projects
Report unsuccessful
other donor projects
Report completed
other donor projects
Report uncompleted
other donor projects
Have instigated own
development projects
Av
era
ge
nu
mb
er
of
focu
sg
rou
pre
sp
on
se
s
Average

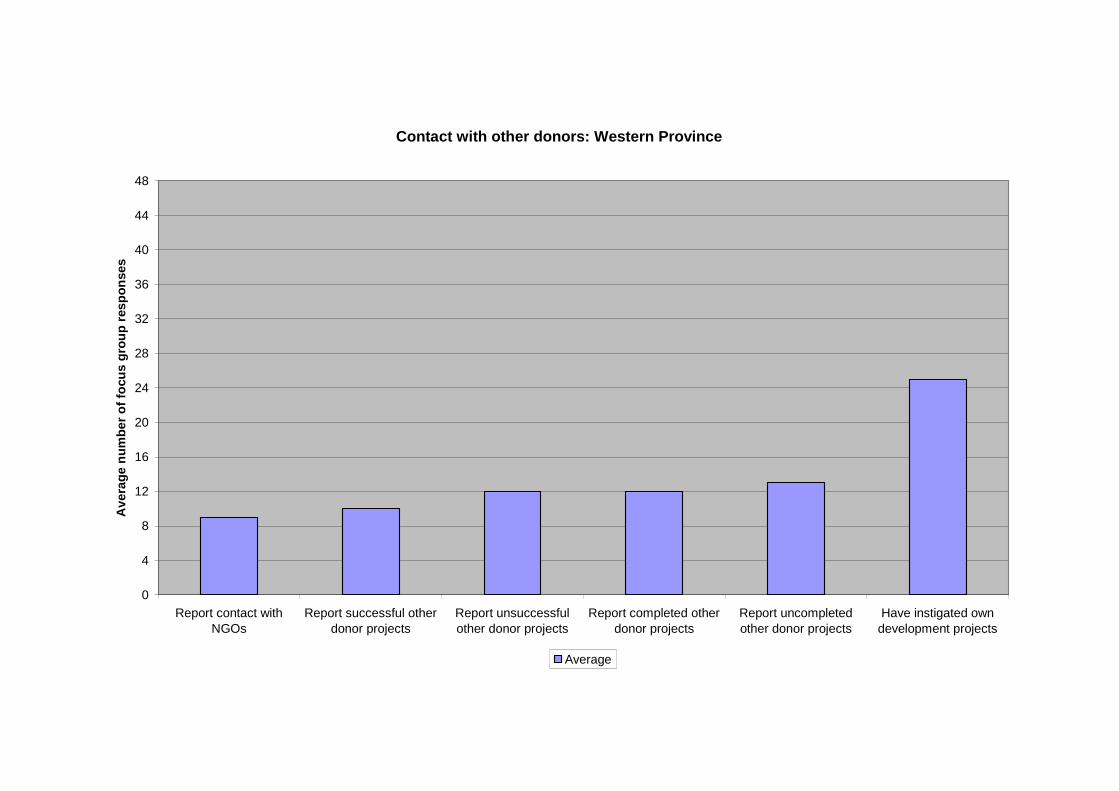
Contact with other donors: Western Province
0
4
8
12
16
20
24
28
32
36
40
44
48
Report contact withNGOs
Report successful otherdonor projects
Report unsuccessfulother donor projects
Report completed otherdonor projects
Report uncompletedother donor projects
Have instigated owndevelopment projects
Av
era
ge
nu
mb
er
of
focu
sg
rou
pre
sp
on
se
s
Average
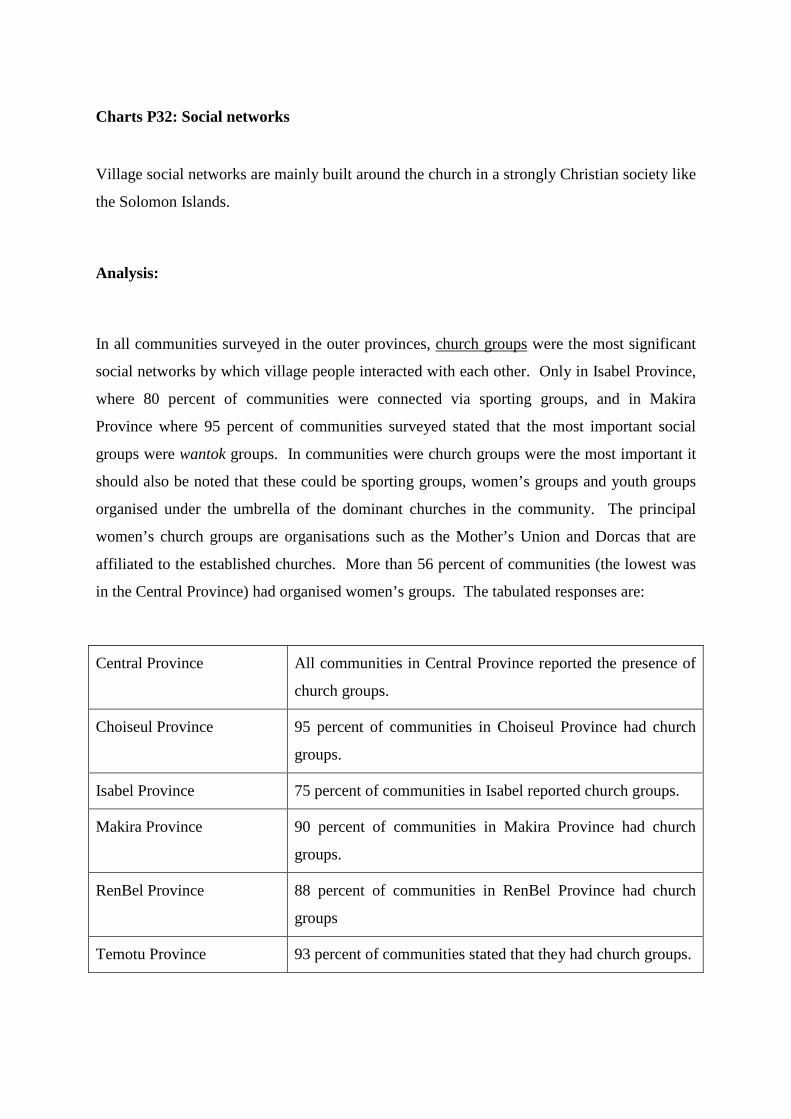
Charts P32: Social networks
Village social networks are mainly built around the church in a strongly Christian society like
the Solomon Islands.
Analysis:
In all communities surveyed in the outer provinces, church groups were the most significant
social networks by which village people interacted with each other. Only in Isabel Province,
where 80 percent of communities were connected via sporting groups, and in Makira
Province where 95 percent of communities surveyed stated that the most important social
groups were wantok groups. In communities were church groups were the most important it
should also be noted that these could be sporting groups, women’s groups and youth groups
organised under the umbrella of the dominant churches in the community. The principal
women’s church groups are organisations such as the Mother’s Union and Dorcas that are
affiliated to the established churches. More than 56 percent of communities (the lowest was
in the Central Province) had organised women’s groups. The tabulated responses are:
Central Province All communities in Central Province reported the presence of
church groups.
Choiseul Province 95 percent of communities in Choiseul Province had church
groups.
Isabel Province 75 percent of communities in Isabel reported church groups.
Makira Province 90 percent of communities in Makira Province had church
groups.
RenBel Province 88 percent of communities in RenBel Province had church
groups
Temotu Province 93 percent of communities stated that they had church groups.
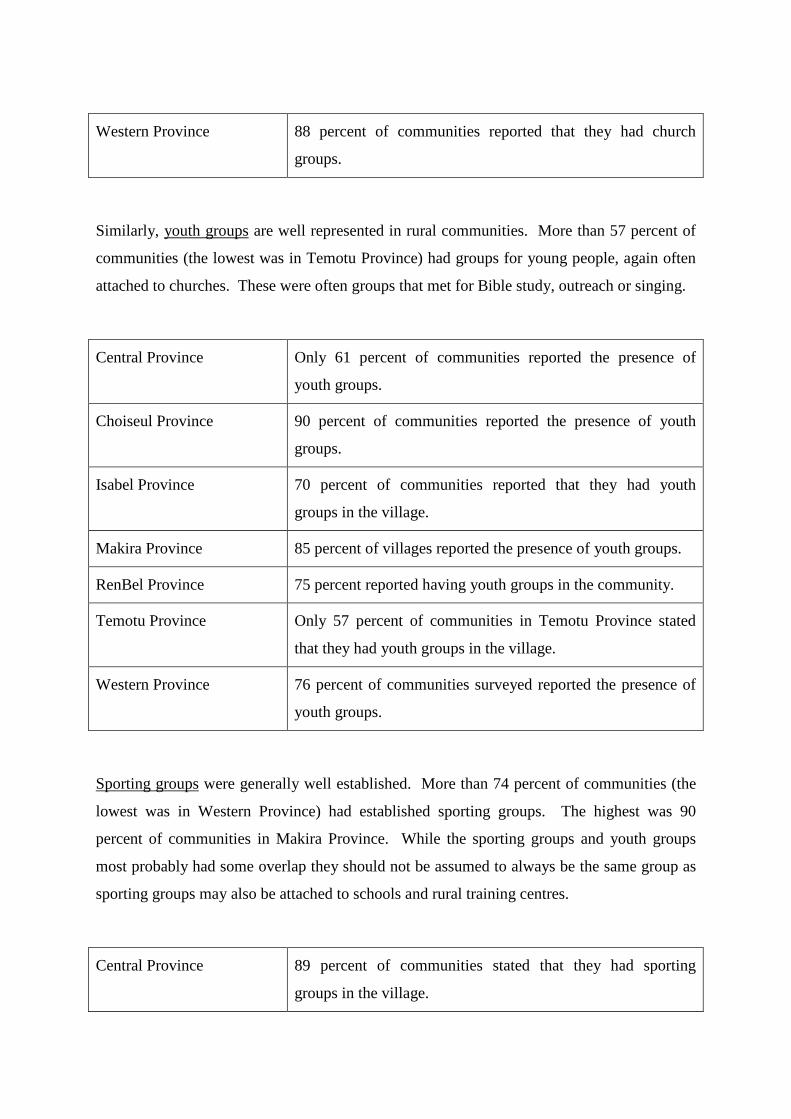
Western Province 88 percent of communities reported that they had church
groups.
Similarly, youth groups are well represented in rural communities. More than 57 percent of
communities (the lowest was in Temotu Province) had groups for young people, again often
attached to churches. These were often groups that met for Bible study, outreach or singing.
Central Province Only 61 percent of communities reported the presence of
youth groups.
Choiseul Province 90 percent of communities reported the presence of youth
groups.
Isabel Province 70 percent of communities reported that they had youth
groups in the village.
Makira Province 85 percent of villages reported the presence of youth groups.
RenBel Province 75 percent reported having youth groups in the community.
Temotu Province Only 57 percent of communities in Temotu Province stated
that they had youth groups in the village.
Western Province 76 percent of communities surveyed reported the presence of
youth groups.
Sporting groups were generally well established. More than 74 percent of communities (the
lowest was in Western Province) had established sporting groups. The highest was 90
percent of communities in Makira Province. While the sporting groups and youth groups
most probably had some overlap they should not be assumed to always be the same group as
sporting groups may also be attached to schools and rural training centres.
Central Province 89 percent of communities stated that they had sporting
groups in the village.
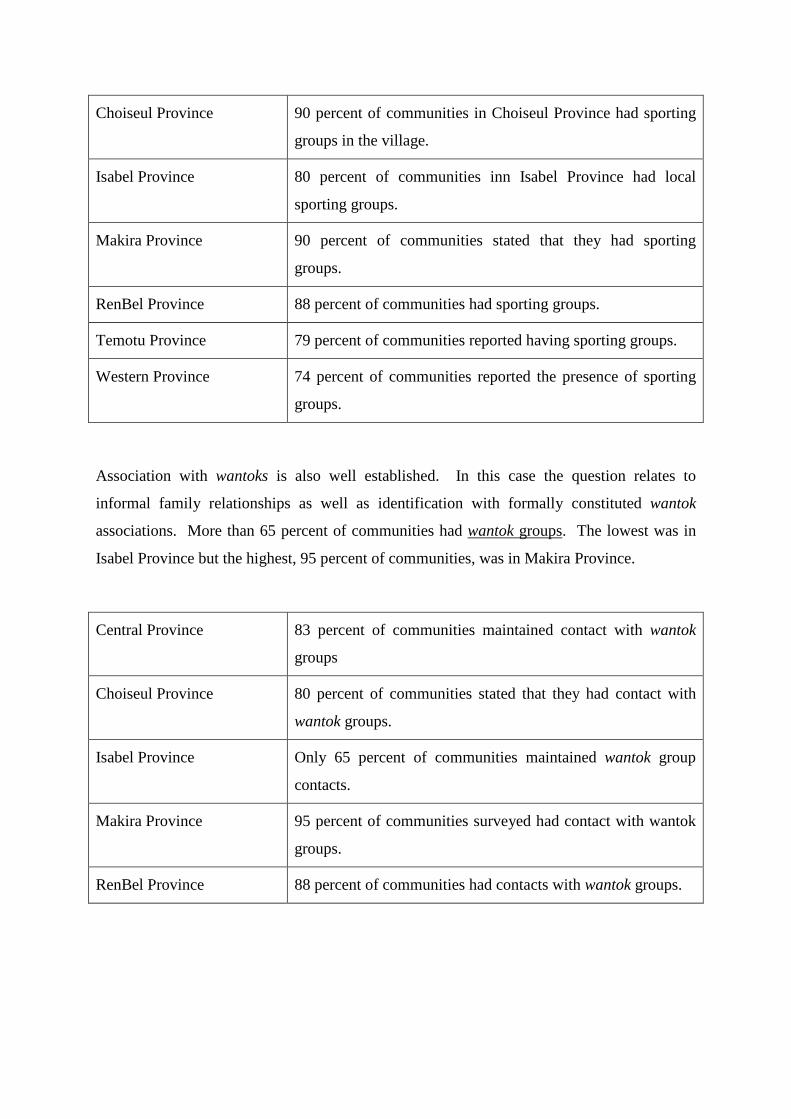
Choiseul Province 90 percent of communities in Choiseul Province had sporting
groups in the village.
Isabel Province 80 percent of communities inn Isabel Province had local
sporting groups.
Makira Province 90 percent of communities stated that they had sporting
groups.
RenBel Province 88 percent of communities had sporting groups.
Temotu Province 79 percent of communities reported having sporting groups.
Western Province 74 percent of communities reported the presence of sporting
groups.
Association with wantoks is also well established. In this case the question relates to
informal family relationships as well as identification with formally constituted wantok
associations. More than 65 percent of communities had wantok groups. The lowest was in
Isabel Province but the highest, 95 percent of communities, was in Makira Province.
Central Province 83 percent of communities maintained contact with wantok
groups
Choiseul Province 80 percent of communities stated that they had contact with
wantok groups.
Isabel Province Only 65 percent of communities maintained wantok group
contacts.
Makira Province 95 percent of communities surveyed had contact with wantok
groups.
RenBel Province 88 percent of communities had contacts with wantok groups.
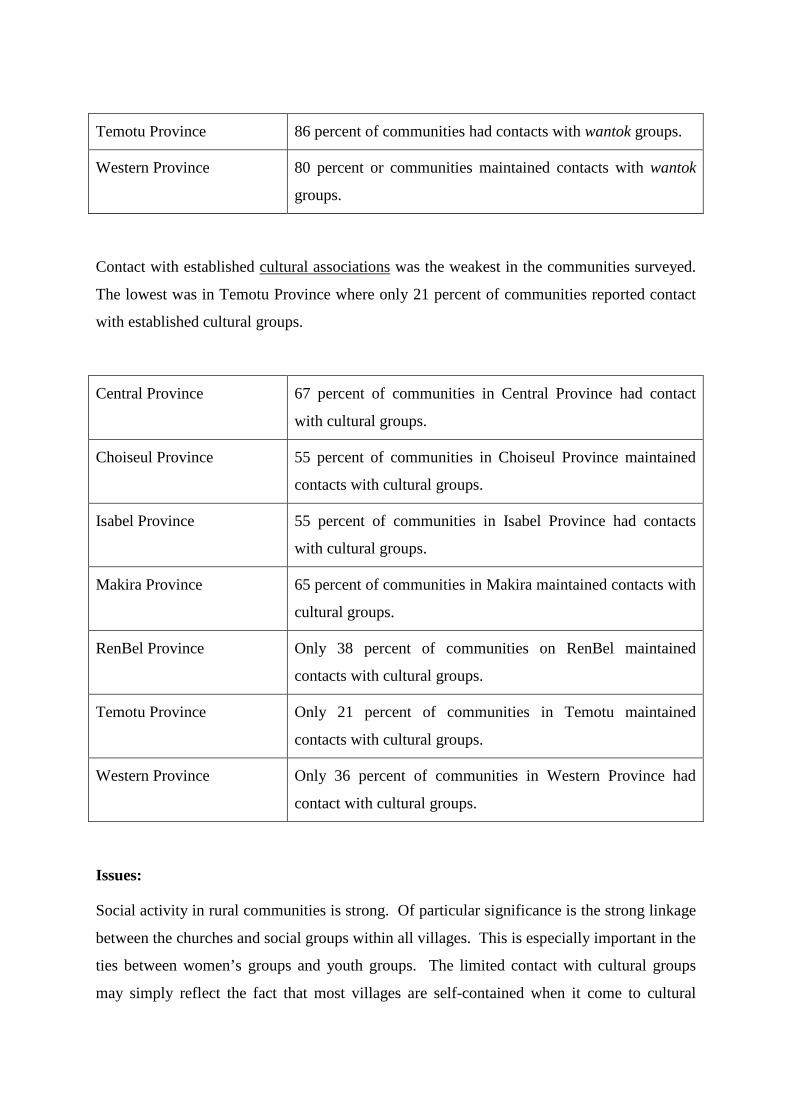
Temotu Province 86 percent of communities had contacts with wantok groups.
Western Province 80 percent or communities maintained contacts with wantok
groups.
Contact with established cultural associations was the weakest in the communities surveyed.
The lowest was in Temotu Province where only 21 percent of communities reported contact
with established cultural groups.
Central Province 67 percent of communities in Central Province had contact
with cultural groups.
Choiseul Province 55 percent of communities in Choiseul Province maintained
contacts with cultural groups.
Isabel Province 55 percent of communities in Isabel Province had contacts
with cultural groups.
Makira Province 65 percent of communities in Makira maintained contacts with
cultural groups.
RenBel Province Only 38 percent of communities on RenBel maintained
contacts with cultural groups.
Temotu Province Only 21 percent of communities in Temotu maintained
contacts with cultural groups.
Western Province Only 36 percent of communities in Western Province had
contact with cultural groups.
Issues:
Social activity in rural communities is strong. Of particular significance is the strong linkage
between the churches and social groups within all villages. This is especially important in the
ties between women’s groups and youth groups. The limited contact with cultural groups
may simply reflect the fact that most villages are self-contained when it come to cultural
issues such as dances and ceremonies and may not maintain close contacts with outside
groups unless the situation arose where a group of communities combined for a particular
cultural event.
PROVINCIAL SIGNPOST: Social networks
Established social networks within village communities in the outer provinces of theSolomon Islands are generally organised around the foundations of the established churches.However, other networks are also important such as the strong wantok linkages. It cannotalways be assumed that the churches organise the social networks as sporting groupsespecially may be attached to local community high schools or RTCs.
NATIONAL SIGNPOST: Social networks
The established social networks provide a useful and strong vehicle for access into villages.By using women’s groups and youth groups that are already operating, developmentprograms can be effective and efficient at the local level. All social groups have internalconflicts as well as strengths and each one will have its own dynamic. These characteristicsshould be examined before the groups are used so that projects do not become sidetracked byinternal political or by particularly strong local cliques. The fact that groups are affiliatedwith mainstream churches gives them status and support.
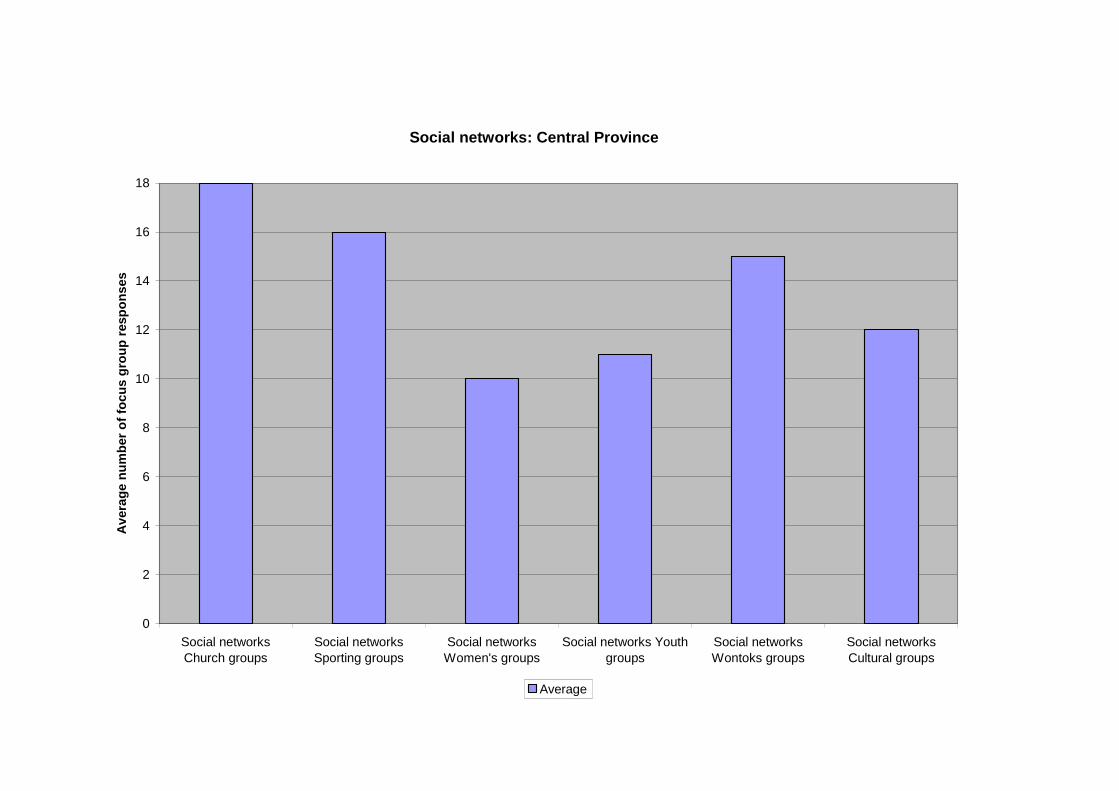
Social networks: Central Province
0
2
4
6
8
10
12
14
16
18
Social networksChurch groups
Social networksSporting groups
Social networksWomen's groups
Social networks Youthgroups
Social networksWontoks groups
Social networksCultural groups
Av
era
ge
nu
mb
er
of
foc
us
gro
up
resp
on
ses
Average

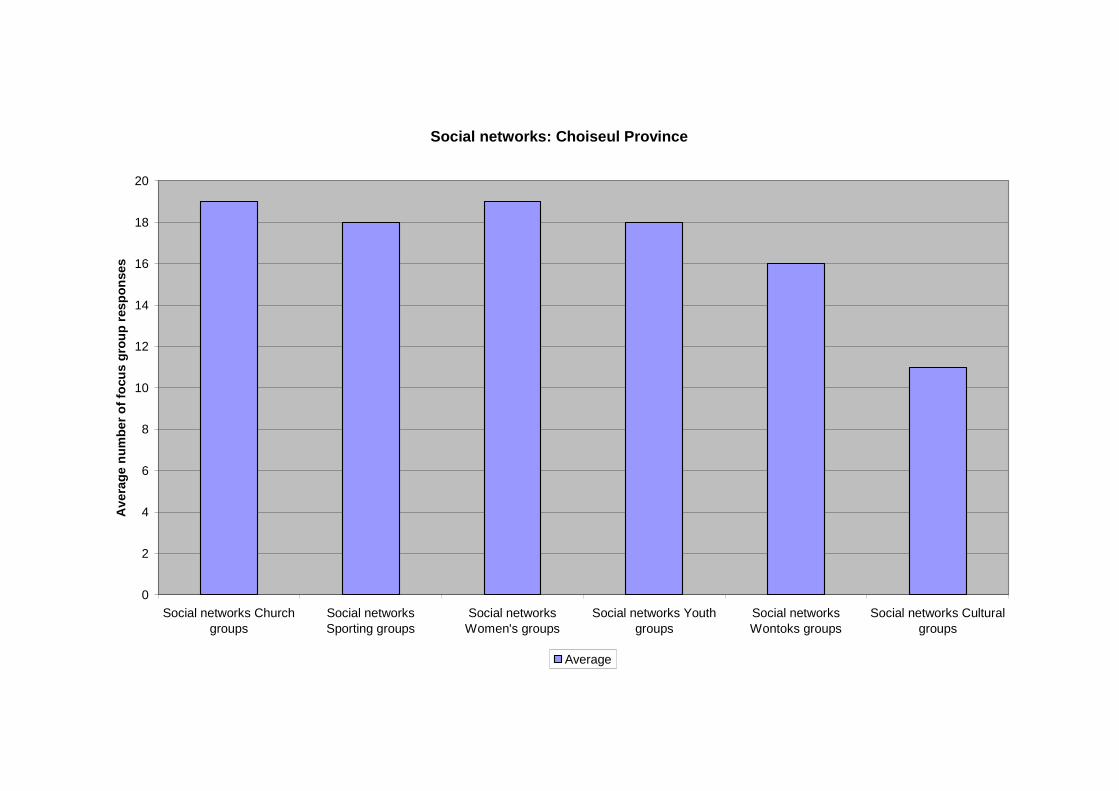
Social networks: Choiseul Province
0
2
4
6
8
10
12
14
16
18
20
Social networks Churchgroups
Social networksSporting groups
Social networksWomen's groups
Social networks Youthgroups
Social networksWontoks groups
Social networks Culturalgroups
Av
era
ge
nu
mb
er
of
focu
sg
rou
pre
sp
on
se
s
Average
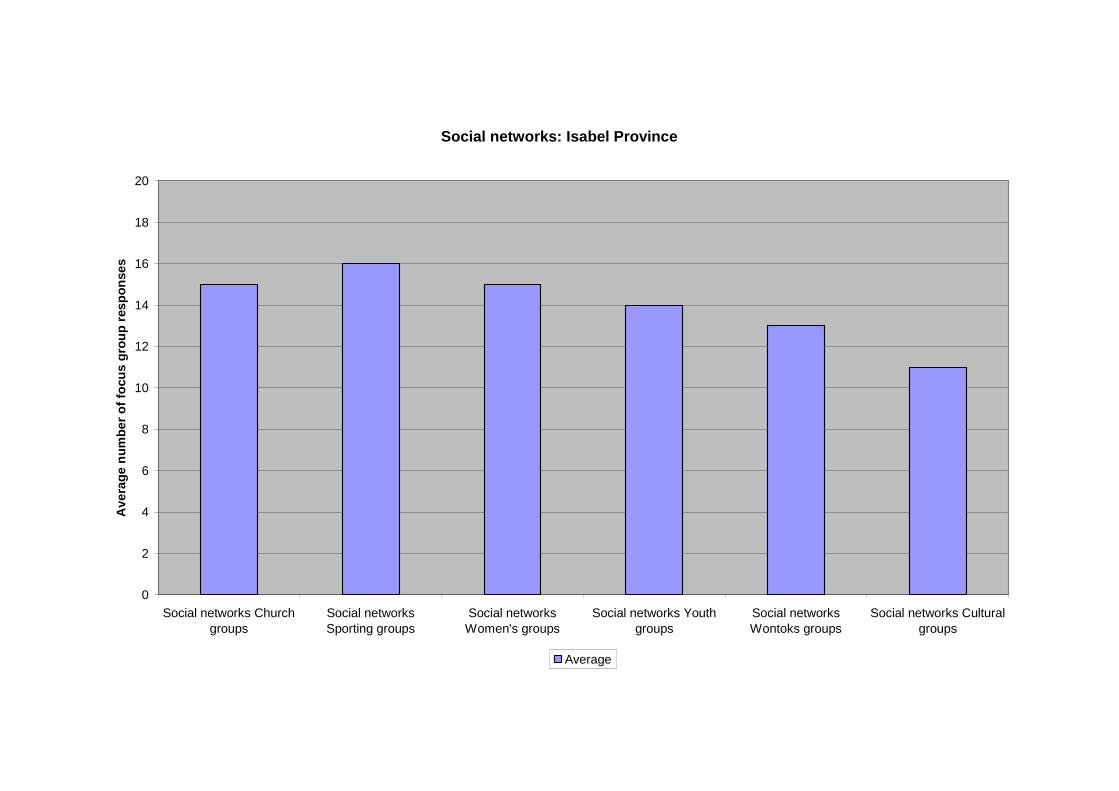
Social networks: Isabel Province
0
2
4
6
8
10
12
14
16
18
20
Social networks Churchgroups
Social networksSporting groups
Social networksWomen's groups
Social networks Youthgroups
Social networksWontoks groups
Social networks Culturalgroups
Av
era
ge
nu
mb
er
of
focu
sg
rou
pre
sp
on
se
s
Average
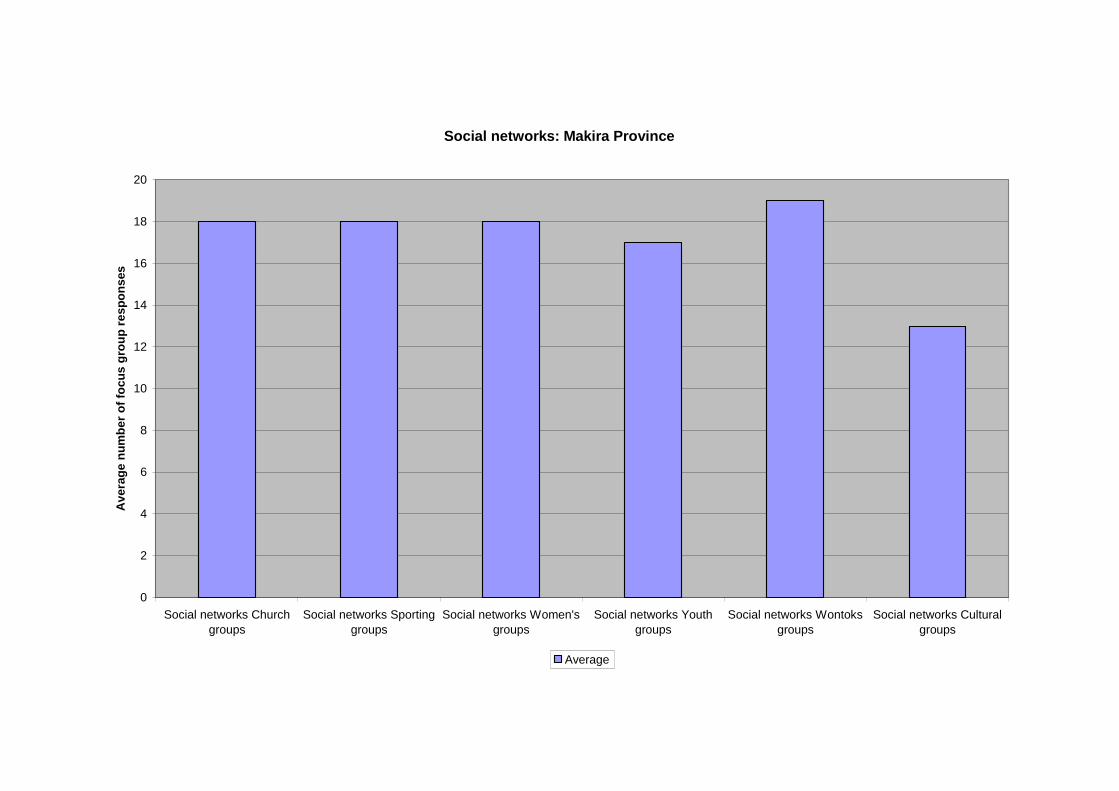
Social networks: Makira Province
0
2
4
6
8
10
12
14
16
18
20
Social networks Church
groups
Social networks Sporting
groups
Social networks Women's
groups
Social networks Youth
groups
Social networks Wontoks
groups
Social networks Cultural
groups
Av
era
ge
nu
mb
er
of
foc
us
gro
up
res
po
ns
es
Average
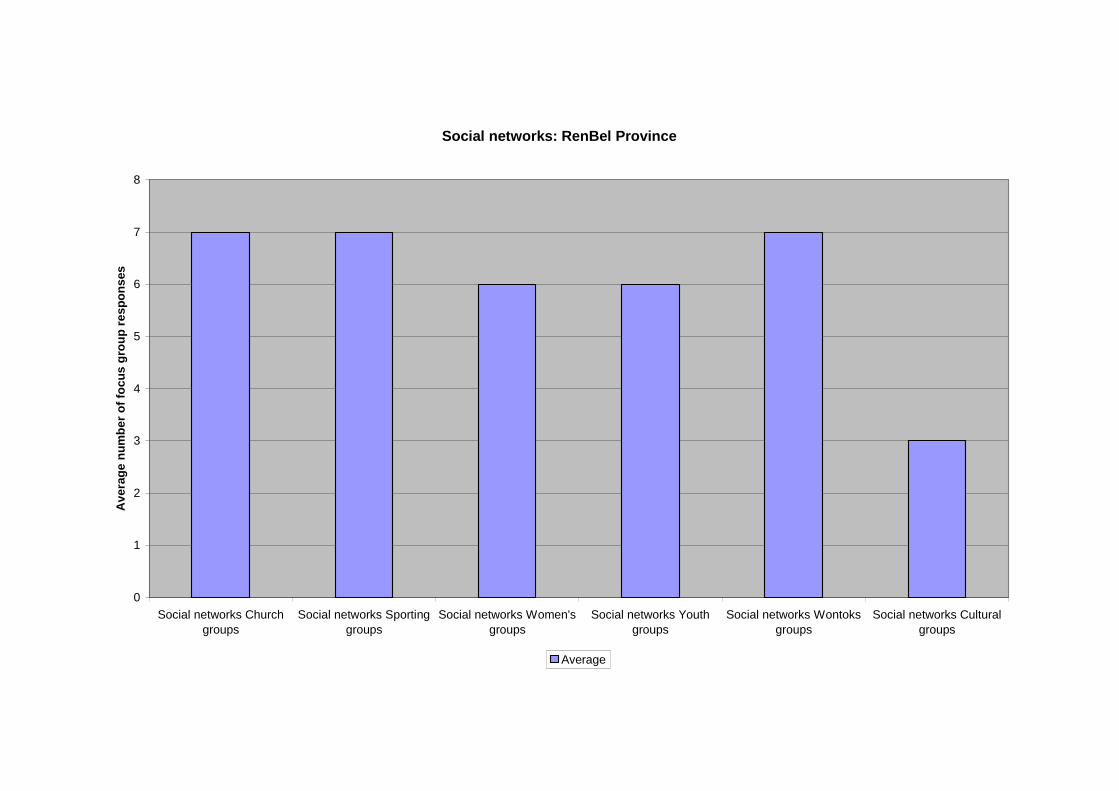
Social networks: RenBel Province
0
1
2
3
4
5
6
7
8
Social networks Church
groups
Social networks Sporting
groups
Social networks Women's
groups
Social networks Youth
groups
Social networks Wontoks
groups
Social networks Cultural
groups
Av
era
ge
nu
mb
er
of
foc
us
gro
up
res
po
ns
es
Average
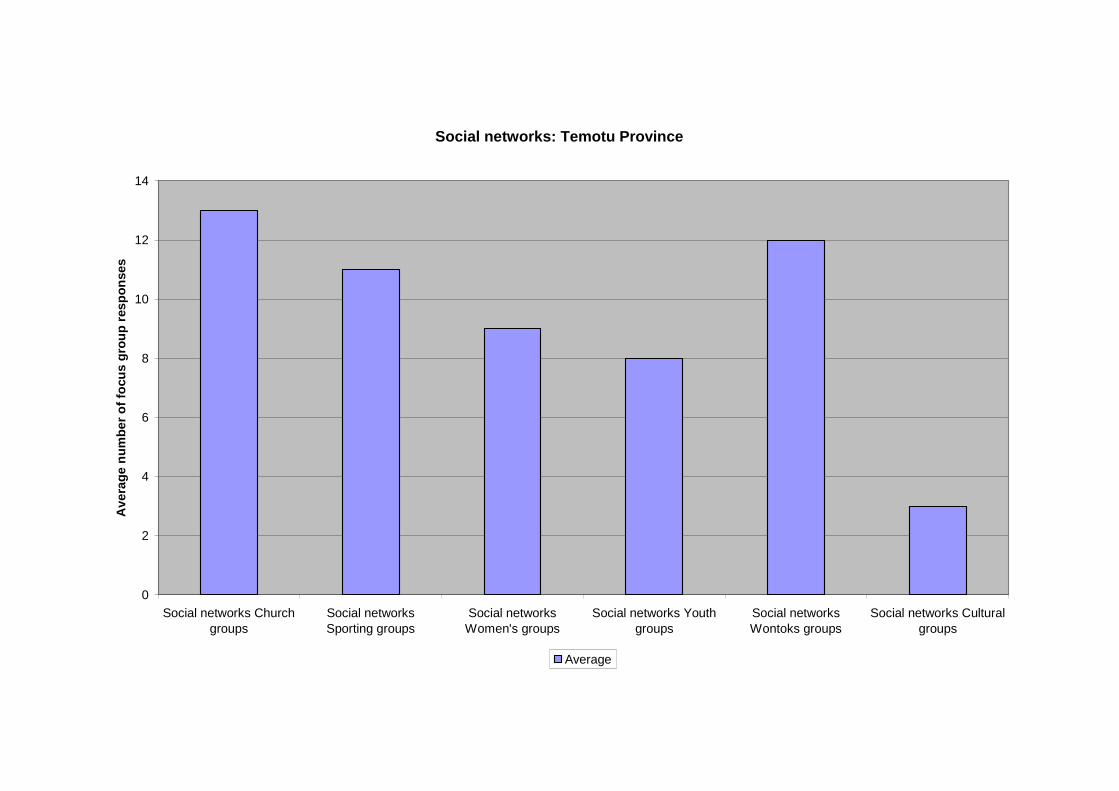
Social networks: Temotu Province
0
2
4
6
8
10
12
14
Social networks Churchgroups
Social networksSporting groups
Social networksWomen's groups
Social networks Youthgroups
Social networksWontoks groups
Social networks Culturalgroups
Av
era
ge
nu
mb
er
of
focu
sg
rou
pre
sp
on
se
s
Average
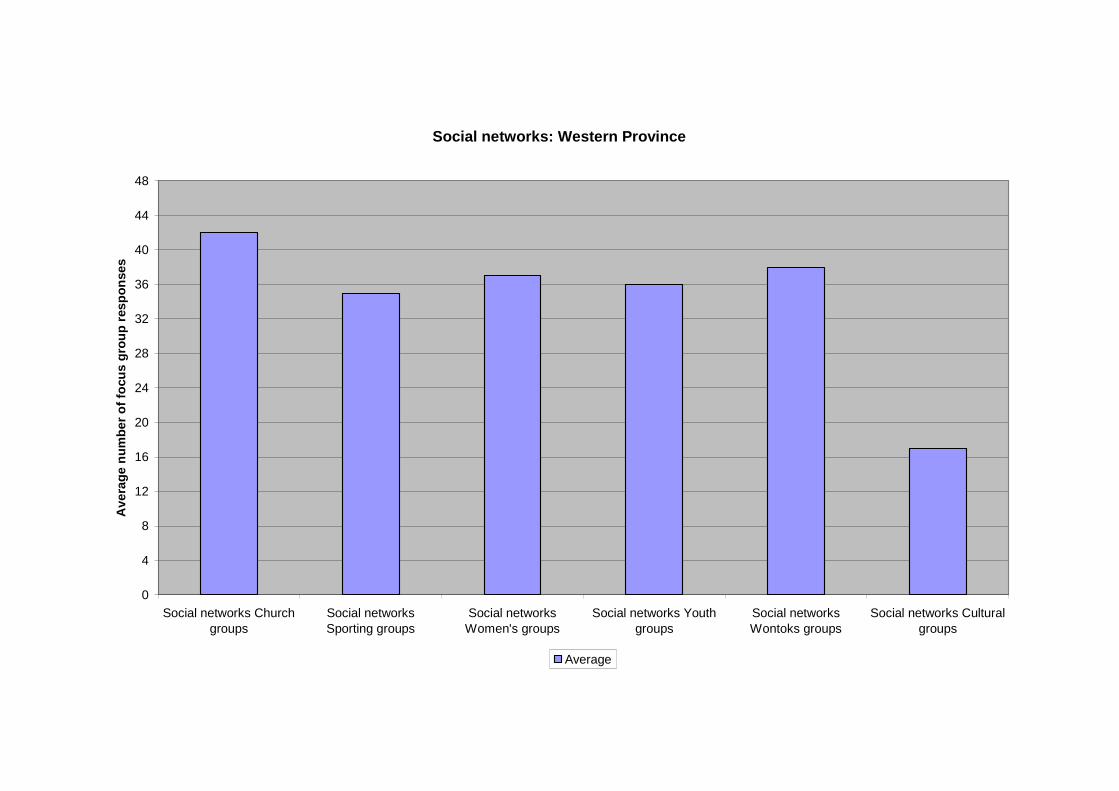
Social networks: Western Province
0
4
8
12
16
20
24
28
32
36
40
44
48
Social networks Churchgroups
Social networksSporting groups
Social networksWomen's groups
Social networks Youthgroups
Social networksWontoks groups
Social networks Culturalgroups
Av
era
ge
nu
mb
er
of
focu
sg
rou
pre
sp
on
se
s
Average
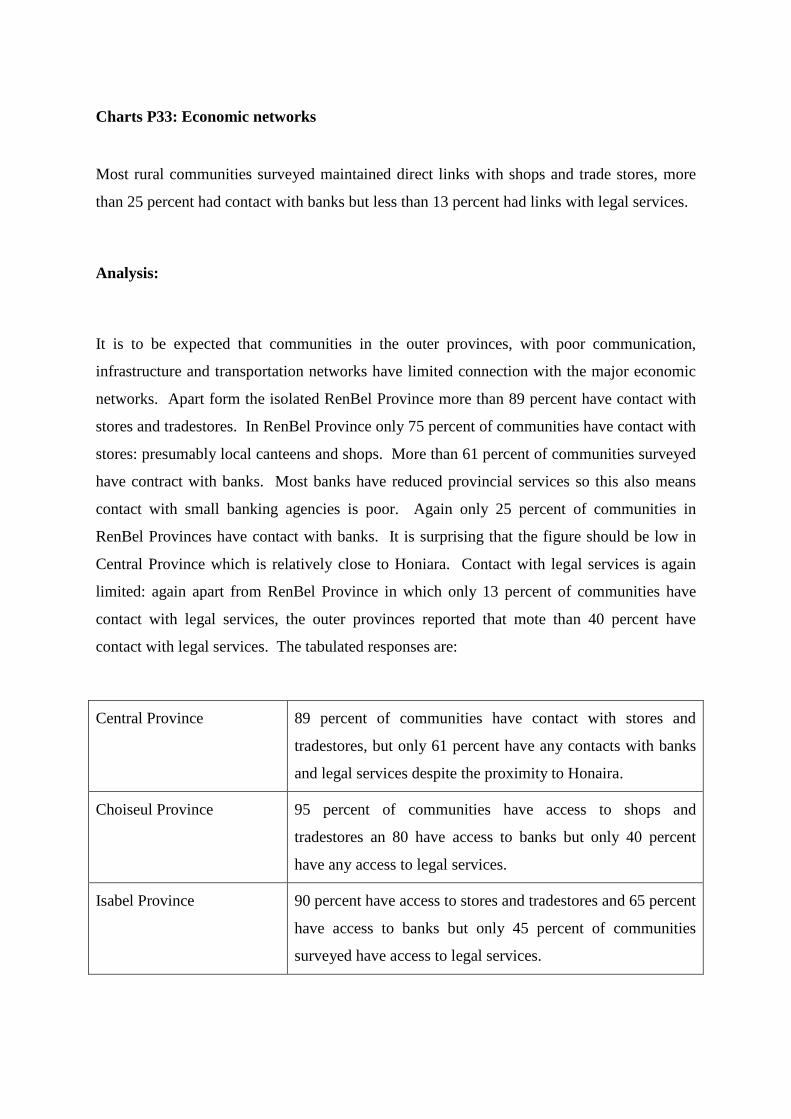
Charts P33: Economic networks
Most rural communities surveyed maintained direct links with shops and trade stores, more
than 25 percent had contact with banks but less than 13 percent had links with legal services.
Analysis:
It is to be expected that communities in the outer provinces, with poor communication,
infrastructure and transportation networks have limited connection with the major economic
networks. Apart form the isolated RenBel Province more than 89 percent have contact with
stores and tradestores. In RenBel Province only 75 percent of communities have contact with
stores: presumably local canteens and shops. More than 61 percent of communities surveyed
have contract with banks. Most banks have reduced provincial services so this also means
contact with small banking agencies is poor. Again only 25 percent of communities in
RenBel Provinces have contact with banks. It is surprising that the figure should be low in
Central Province which is relatively close to Honiara. Contact with legal services is again
limited: again apart from RenBel Province in which only 13 percent of communities have
contact with legal services, the outer provinces reported that mote than 40 percent have
contact with legal services. The tabulated responses are:
Central Province 89 percent of communities have contact with stores and
tradestores, but only 61 percent have any contacts with banks
and legal services despite the proximity to Honaira.
Choiseul Province 95 percent of communities have access to shops and
tradestores an 80 have access to banks but only 40 percent
have any access to legal services.
Isabel Province 90 percent have access to stores and tradestores and 65 percent
have access to banks but only 45 percent of communities
surveyed have access to legal services.
Makira Province 95 percent of communities surveyed reported access to stores,
tradestores and banks and 85 percent had access to legal
services.
RenBel Province While 75 percent of communities surveyed had access to
stores and tradestores, only 25 percent could access banks and
only 13 percent had accessed legal services.
Temotu Province 93 percent of communities could access sores and tradestores
and 79 percent could access banks. 64 percent reported being
able to access legal services.
Western Province 92 percent had access to stores and tradestores, 78 percent had
access to banks but only 55 percent could access legal
services.
Issues:
Many comments noted in the National Snapshot report are relevant here. It should be noted
that the trade store operator, either local Solomon Islander or ethnic Chinese, may be both a
seller of commodities such as clothing, soap, kerosene, petrol, tinned tuna and tinned meat,
but also a buyer of village produce like copra and cocoa. Trade stores may also be places that
sell alcohol and tobacco. Prices vary according to distance from main transportation centres
like Honiara but the range of goods is generally the same across the country. Prices relative
to quality are high.
Banking services are poor in regional area. In many cases people have to go into Honiara or
other centres for major financial transactions, negotiating loans or operating accounts. Legal
services are generally available only in main urban centres.
PROVINCIAL SIGNPOST: Economic networks
Economic networks are vital if the nation is to rebuild its financial infrastructure. At presentthe outer provinces are disadvantaged economically and communities must deal with poorquality services and the general lack of attention. While it is to be expected that the majorityof communities have contacts with tradestores and ships, contact with banks is poor andcontact with legal services even worse.
NATIONAL SIGNPOST: Economic networks
Rural communities face many challenges in financial management. Not only are villagersmostly untrained in modern financial management but they are poorly serviced by banks andother financial institutions, like insurance agencies and local credit unions.
They also have little real buying power in the local area and are committed to buying fromthe small stores that control local markets and prices. Quality is often poor and there is littlechance of returning damaged goods. Most people buy second hand clothing. Not only is itoften the only stock available but even second hand clothing is expensive relative to localincomes.
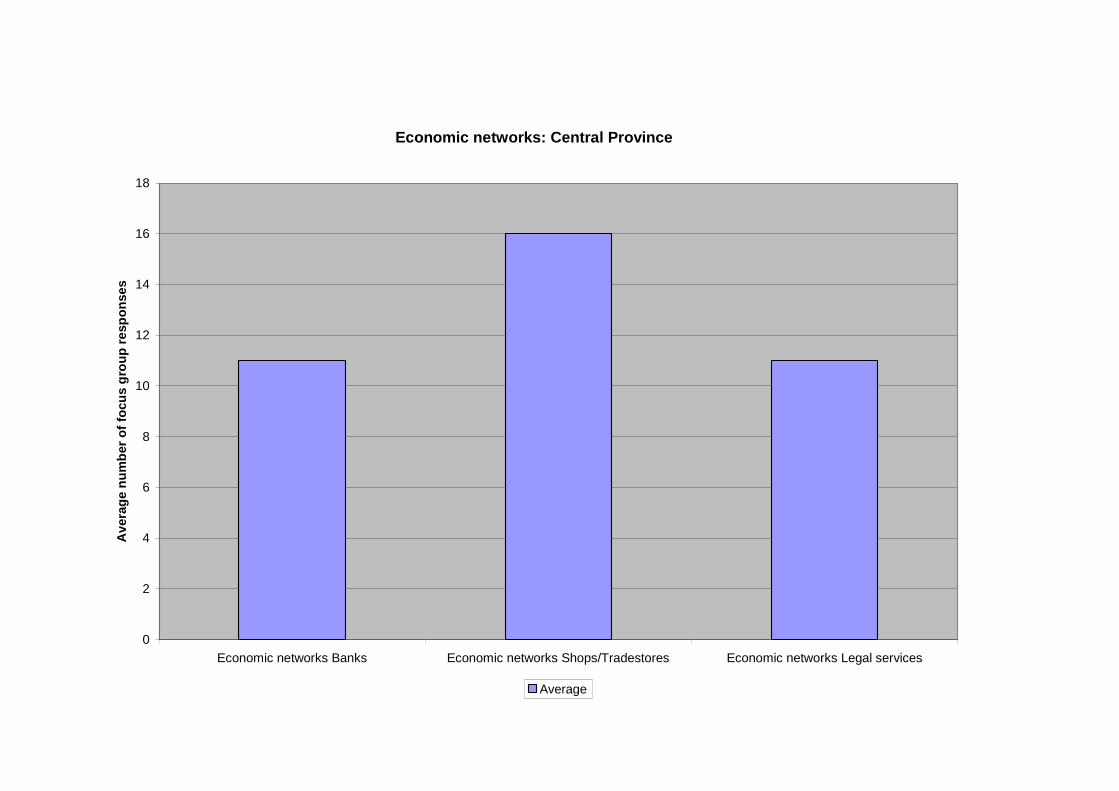
Economic networks: Central Province
0
2
4
6
8
10
12
14
16
18
Economic networks Banks Economic networks Shops/Tradestores Economic networks Legal services
Av
era
ge
nu
mb
er
of
focu
sg
rou
pre
sp
on
se
s
Average

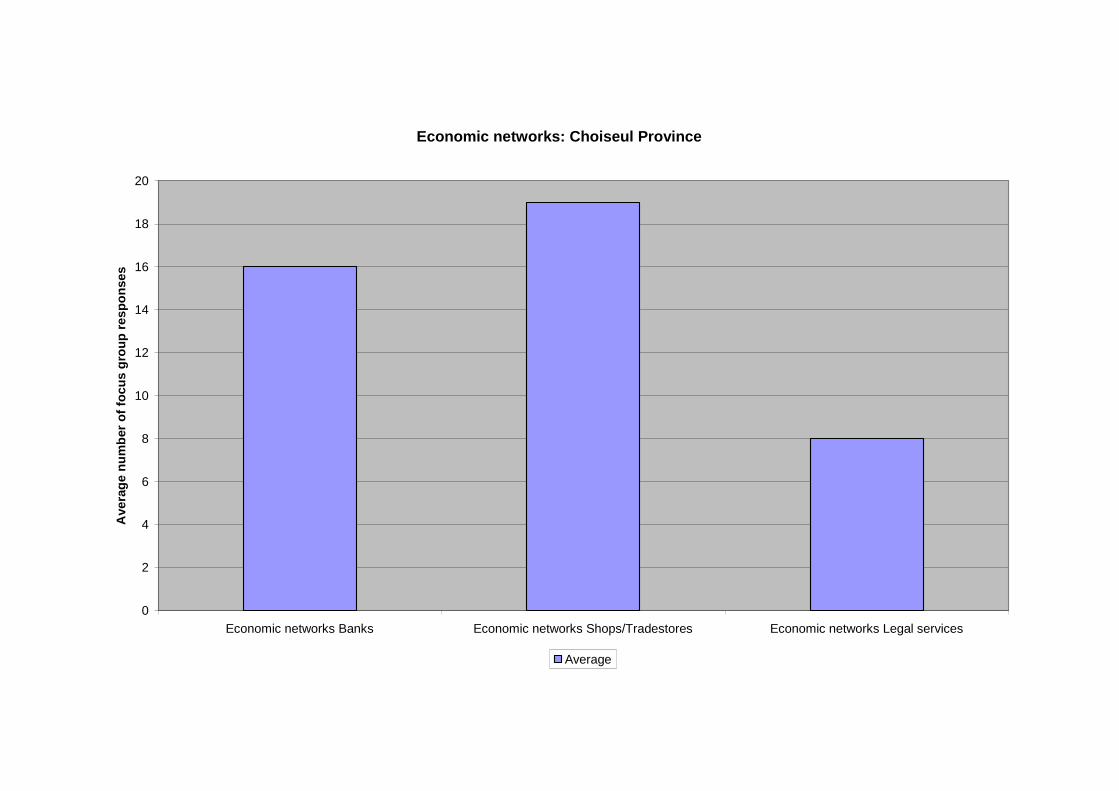
Economic networks: Choiseul Province
0
2
4
6
8
10
12
14
16
18
20
Economic networks Banks Economic networks Shops/Tradestores Economic networks Legal services
Ave
rag
en
um
ber
of
foc
us
gro
up
res
po
ns
es
Average
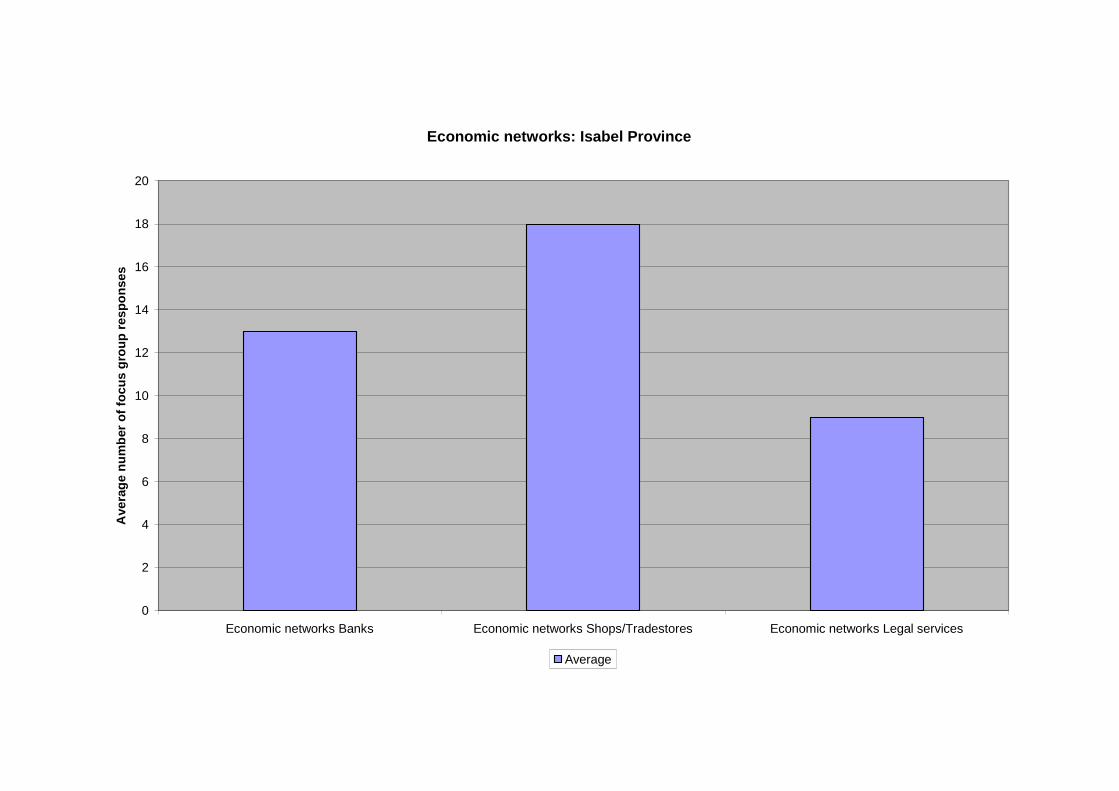
Economic networks: Isabel Province
0
2
4
6
8
10
12
14
16
18
20
Economic networks Banks Economic networks Shops/Tradestores Economic networks Legal services
Ave
rag
en
um
ber
of
foc
us
gro
up
res
po
ns
es
Average
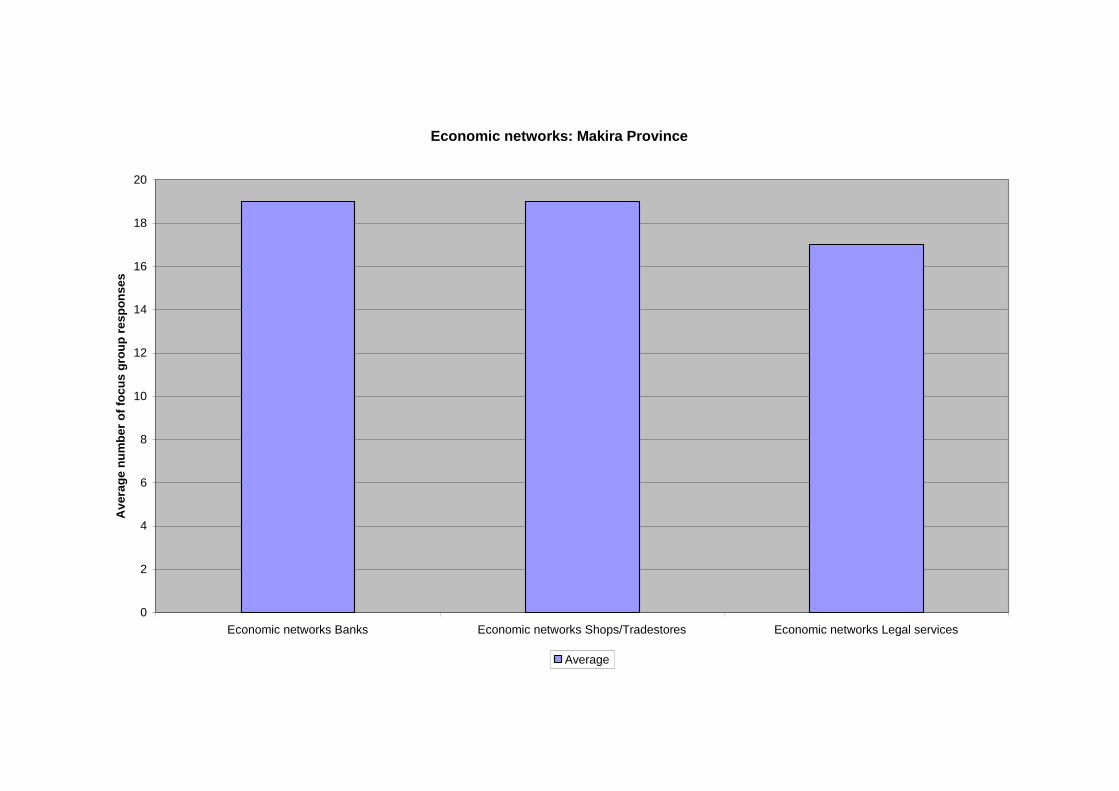
Economic networks: Makira Province
0
2
4
6
8
10
12
14
16
18
20
Economic networks Banks Economic networks Shops/Tradestores Economic networks Legal services
Av
era
ge
nu
mb
er
of
foc
us
gro
up
res
po
ns
es
Average
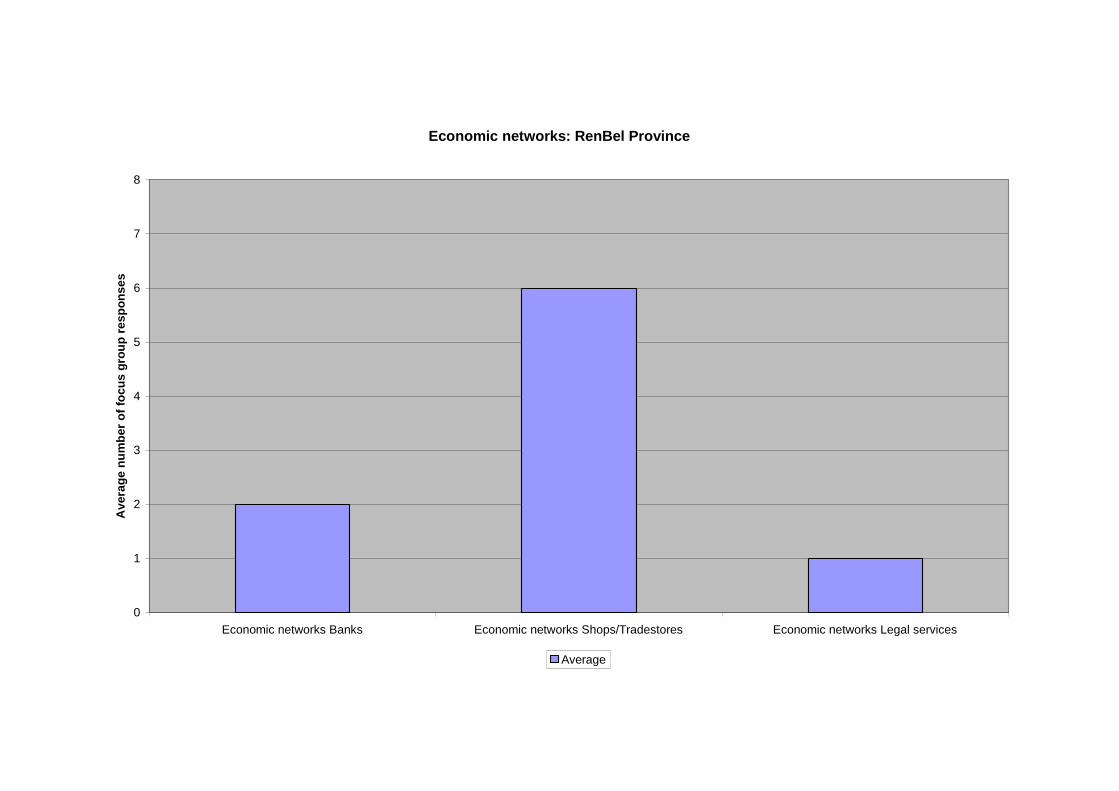
Economic networks: RenBel Province
0
1
2
3
4
5
6
7
8
Economic networks Banks Economic networks Shops/Tradestores Economic networks Legal services
Av
era
ge
nu
mb
er
of
foc
us
gro
up
res
po
ns
es
Average
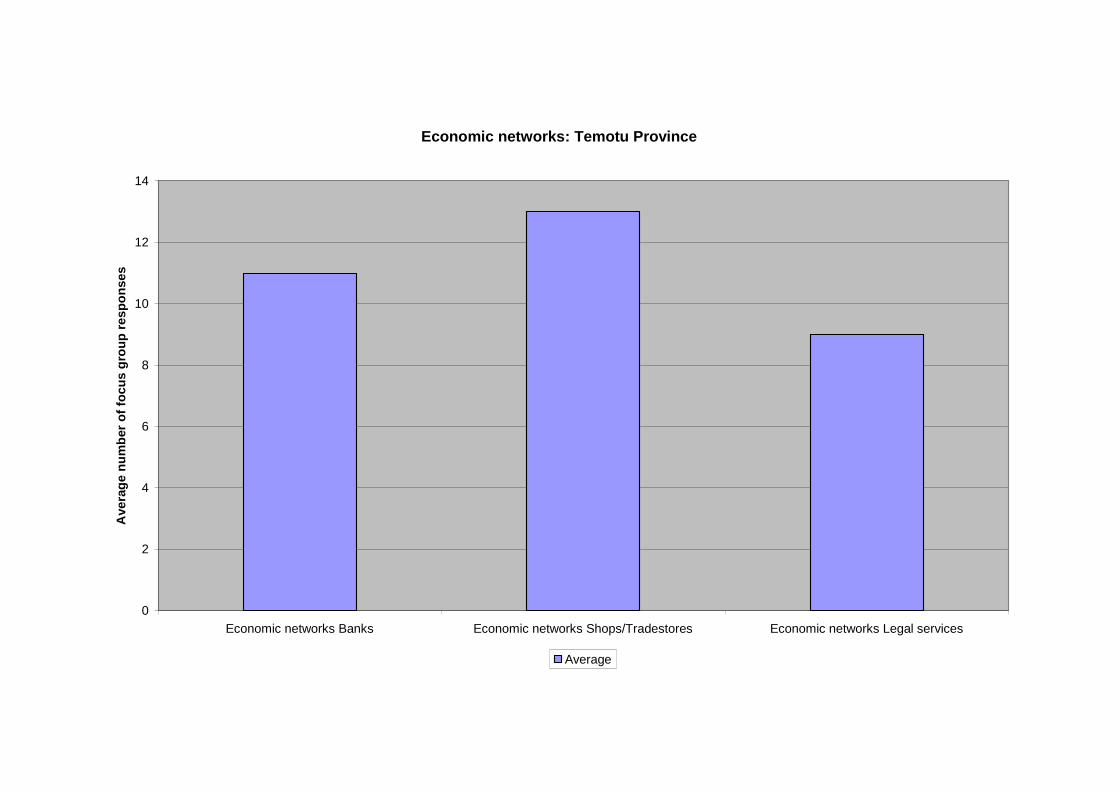
Economic networks: Temotu Province
0
2
4
6
8
10
12
14
Economic networks Banks Economic networks Shops/Tradestores Economic networks Legal services
Ave
rag
en
um
ber
of
foc
us
gro
up
res
po
ns
es
Average
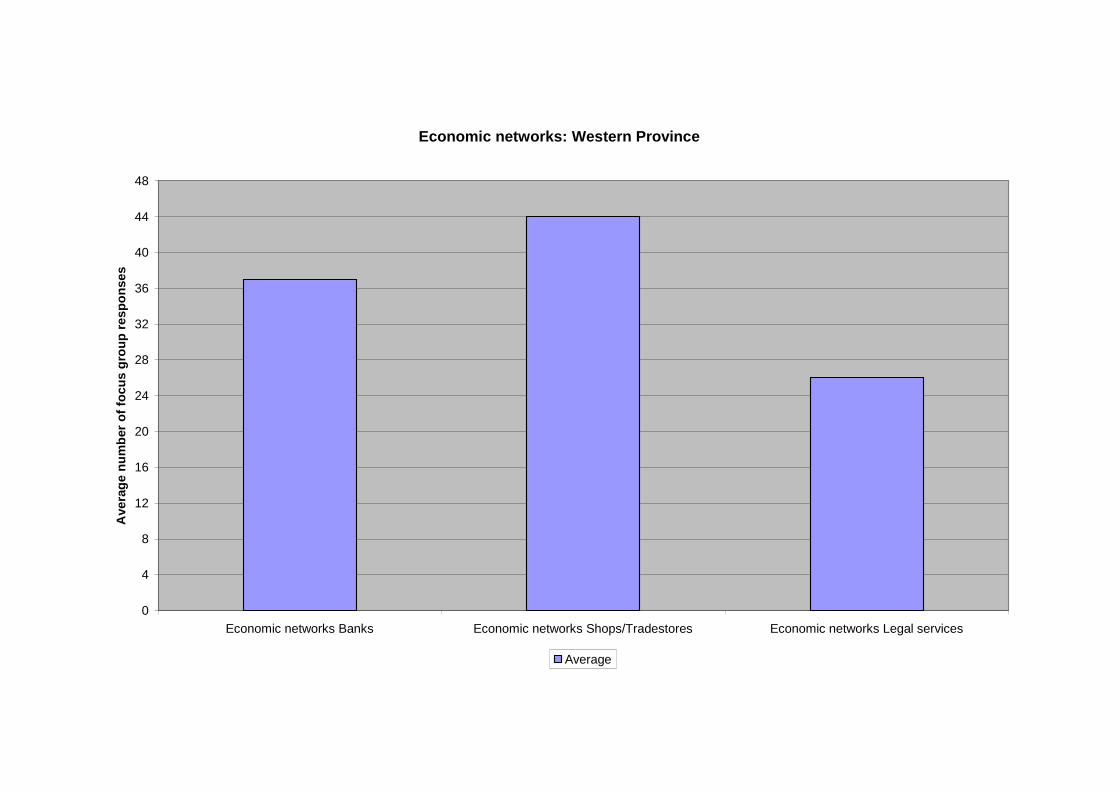
Economic networks: Western Province
0
4
8
12
16
20
24
28
32
36
40
44
48
Economic networks Banks Economic networks Shops/Tradestores Economic networks Legal services
Ave
rag
en
um
ber
of
foc
us
gro
up
res
po
ns
es
Average
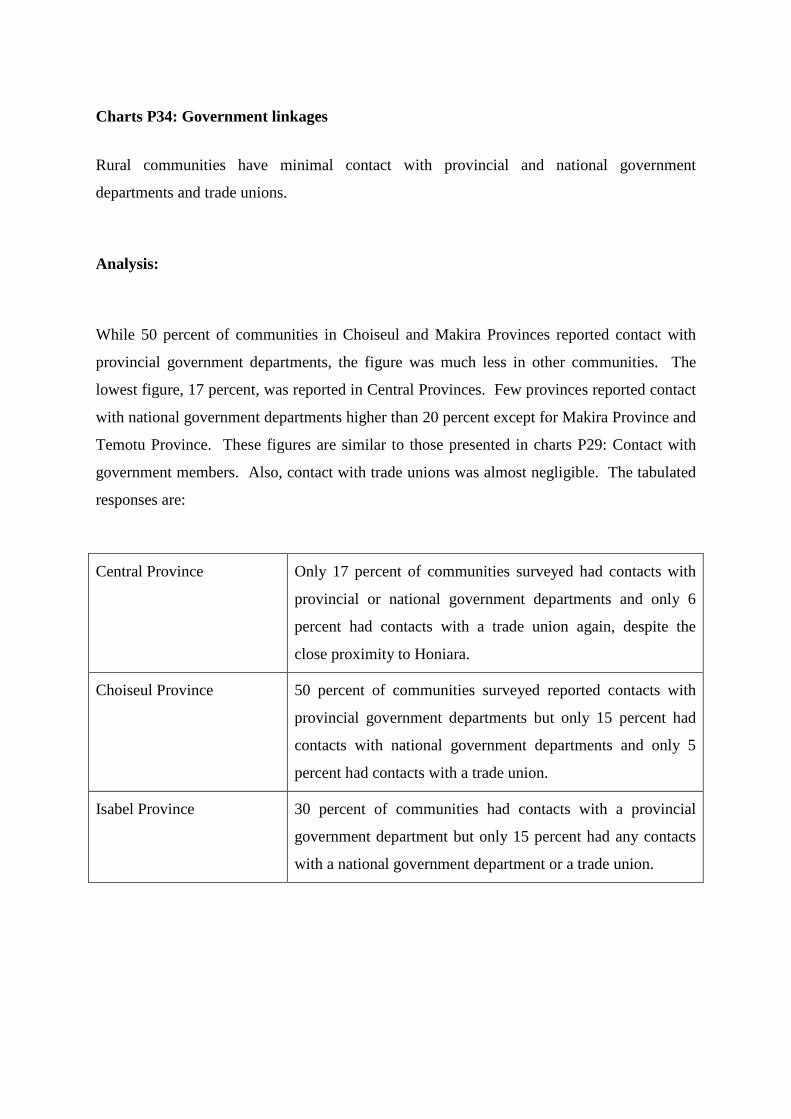
Charts P34: Government linkages
Rural communities have minimal contact with provincial and national government
departments and trade unions.
Analysis:
While 50 percent of communities in Choiseul and Makira Provinces reported contact with
provincial government departments, the figure was much less in other communities. The
lowest figure, 17 percent, was reported in Central Provinces. Few provinces reported contact
with national government departments higher than 20 percent except for Makira Province and
Temotu Province. These figures are similar to those presented in charts P29: Contact with
government members. Also, contact with trade unions was almost negligible. The tabulated
responses are:
Central Province Only 17 percent of communities surveyed had contacts with
provincial or national government departments and only 6
percent had contacts with a trade union again, despite the
close proximity to Honiara.
Choiseul Province 50 percent of communities surveyed reported contacts with
provincial government departments but only 15 percent had
contacts with national government departments and only 5
percent had contacts with a trade union.
Isabel Province 30 percent of communities had contacts with a provincial
government department but only 15 percent had any contacts
with a national government department or a trade union.
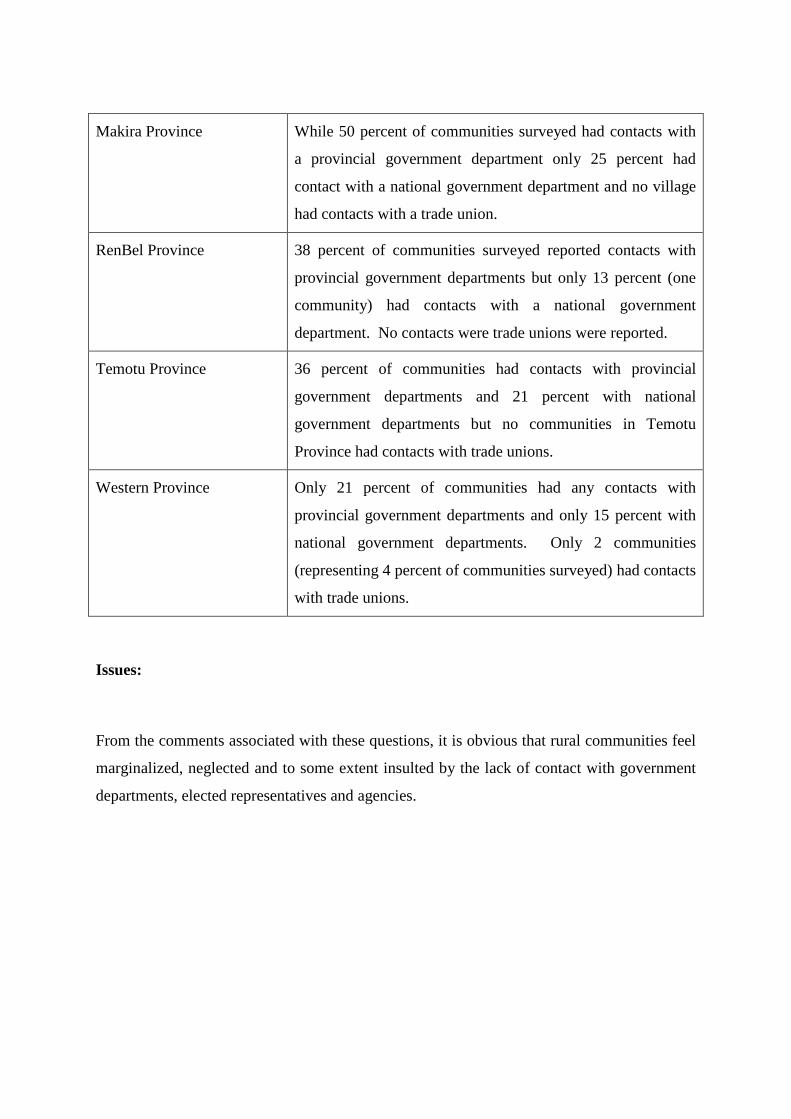
Makira Province While 50 percent of communities surveyed had contacts with
a provincial government department only 25 percent had
contact with a national government department and no village
had contacts with a trade union.
RenBel Province 38 percent of communities surveyed reported contacts with
provincial government departments but only 13 percent (one
community) had contacts with a national government
department. No contacts were trade unions were reported.
Temotu Province 36 percent of communities had contacts with provincial
government departments and 21 percent with national
government departments but no communities in Temotu
Province had contacts with trade unions.
Western Province Only 21 percent of communities had any contacts with
provincial government departments and only 15 percent with
national government departments. Only 2 communities
(representing 4 percent of communities surveyed) had contacts
with trade unions.
Issues:
From the comments associated with these questions, it is obvious that rural communities feel
marginalized, neglected and to some extent insulted by the lack of contact with government
departments, elected representatives and agencies.
PROVINCIAL SIGNPOST: Government linkages
Contact with government departments at all levels and with trade unions is poor, almostnegligible. Rural communities in the outer provinces are especially handicapped by distanceand the lack of communication. There appears to be little incentive for public servants fromthe national or provincial departments to make contact with village people.
NATIONAL SIGNPOST: Government linkages
Government departments at all levels, as well as service agencies like trade unions, need toimprove their visibility in communities. Departments may be hampered by the lack ofresources but the perception is that government officers remain in their offices and do notmake contact with villagers. The fact that senior officers in provincial governmentdepartments are seconded from the national public service and retain their loyalties to theirhome ministries only further complicates the issue.
Neither the provincial governments nor the national government has delivered the necessaryservices to rural communities, a situation that is unlikely to change in the short-term. ForCSP there is an obvious need to build self-reliance in the communities. However, self-reliance requires the villages to develop new ways of thinking about themselves and theirposition.
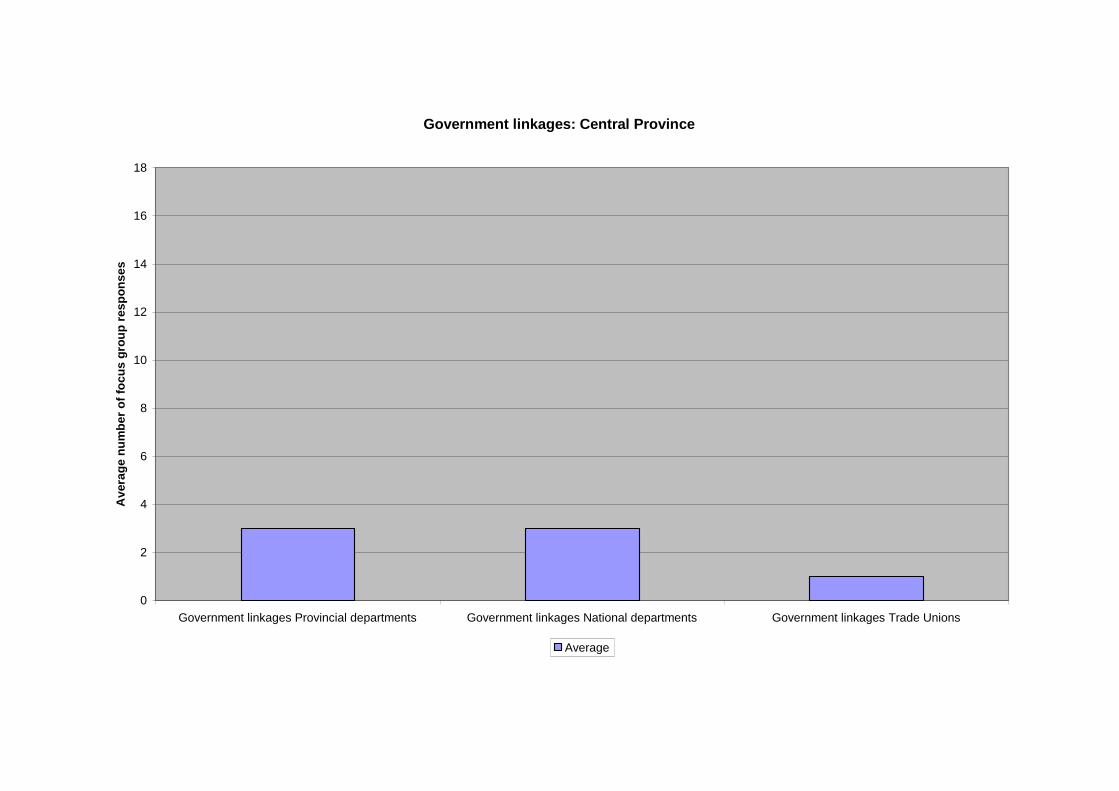
Government linkages: Central Province
0
2
4
6
8
10
12
14
16
18
Government linkages Provincial departments Government linkages National departments Government linkages Trade Unions
Av
era
ge
nu
mb
er
of
foc
us
gro
up
res
po
ns
es
Average
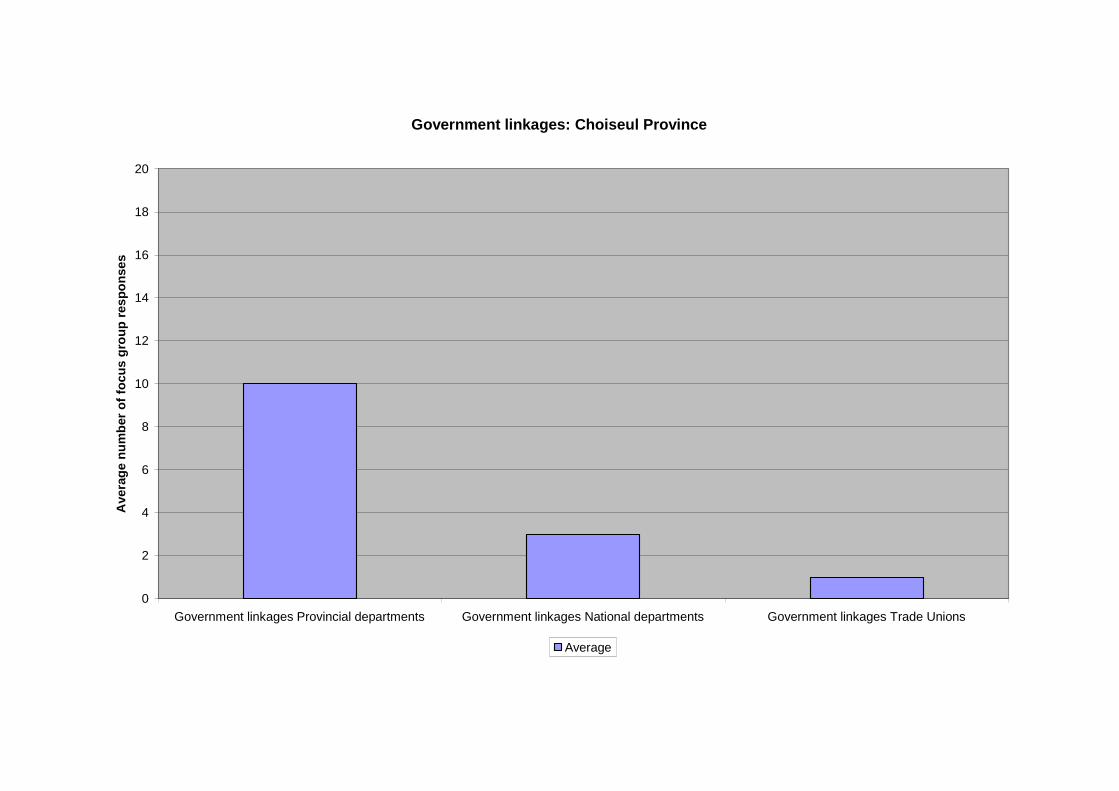
Government linkages: Choiseul Province
0
2
4
6
8
10
12
14
16
18
20
Government linkages Provincial departments Government linkages National departments Government linkages Trade Unions
Ave
rag
en
um
ber
of
foc
us
gro
up
res
po
ns
es
Average
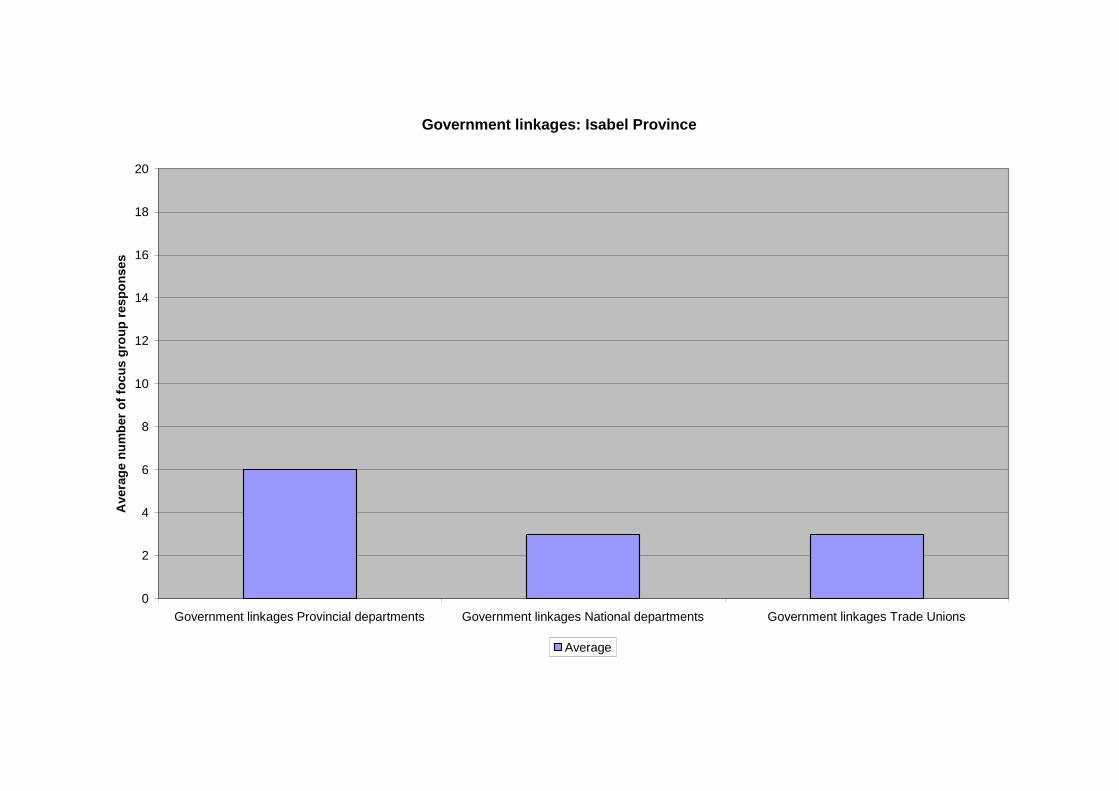
Government linkages: Isabel Province
0
2
4
6
8
10
12
14
16
18
20
Government linkages Provincial departments Government linkages National departments Government linkages Trade Unions
Ave
rag
en
um
ber
of
foc
us
gro
up
res
po
ns
es
Average
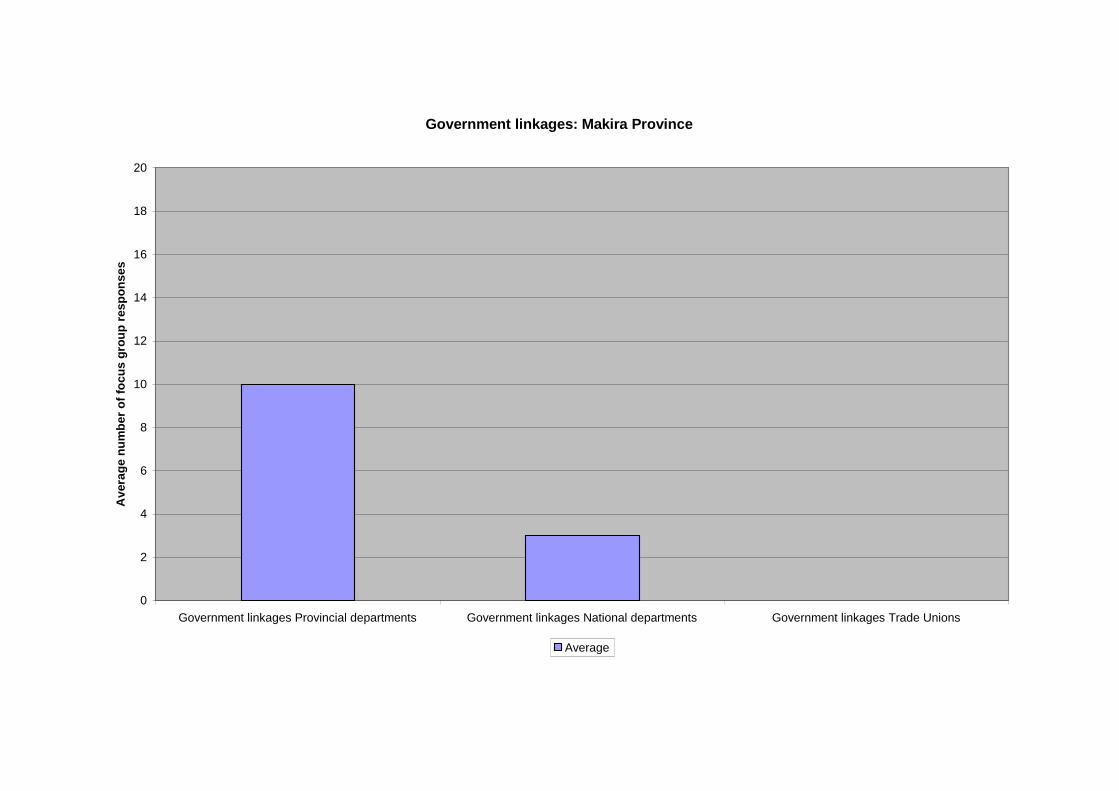
Government linkages: Makira Province
0
2
4
6
8
10
12
14
16
18
20
Government linkages Provincial departments Government linkages National departments Government linkages Trade Unions
Av
era
ge
nu
mb
er
of
foc
us
gro
up
res
po
ns
es
Average
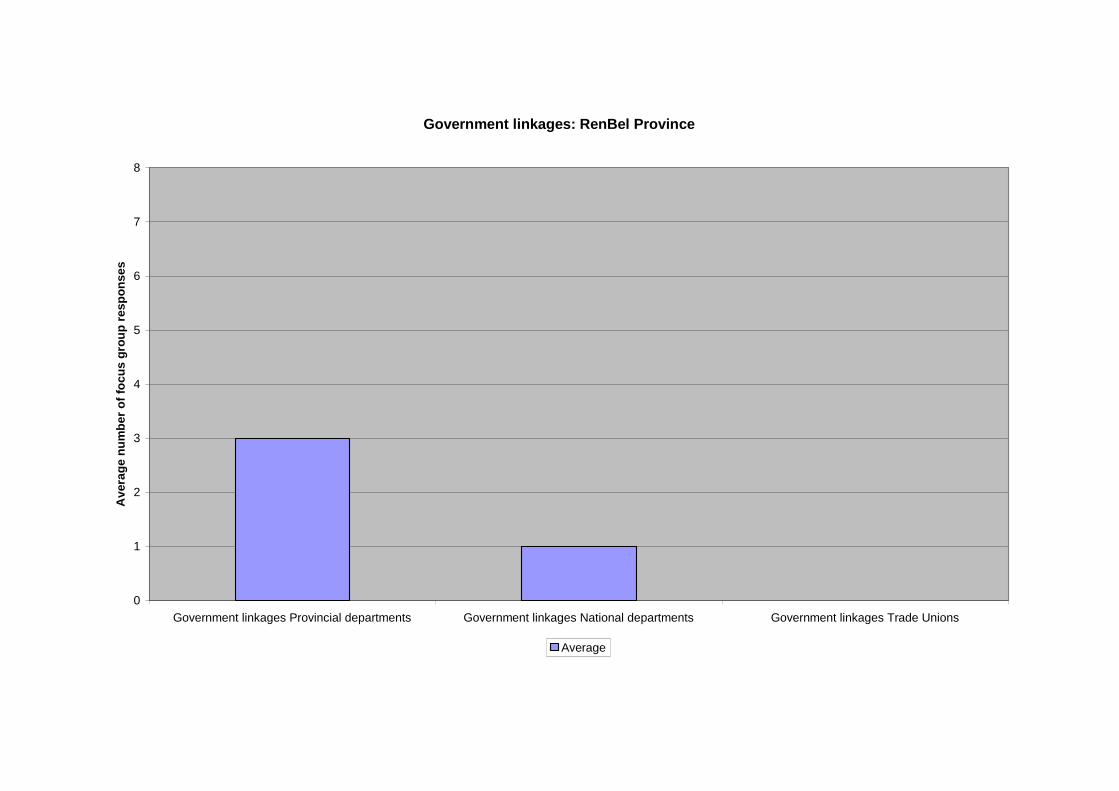
Government linkages: RenBel Province
0
1
2
3
4
5
6
7
8
Government linkages Provincial departments Government linkages National departments Government linkages Trade Unions
Av
era
ge
nu
mb
er
of
foc
us
gro
up
res
po
ns
es
Average
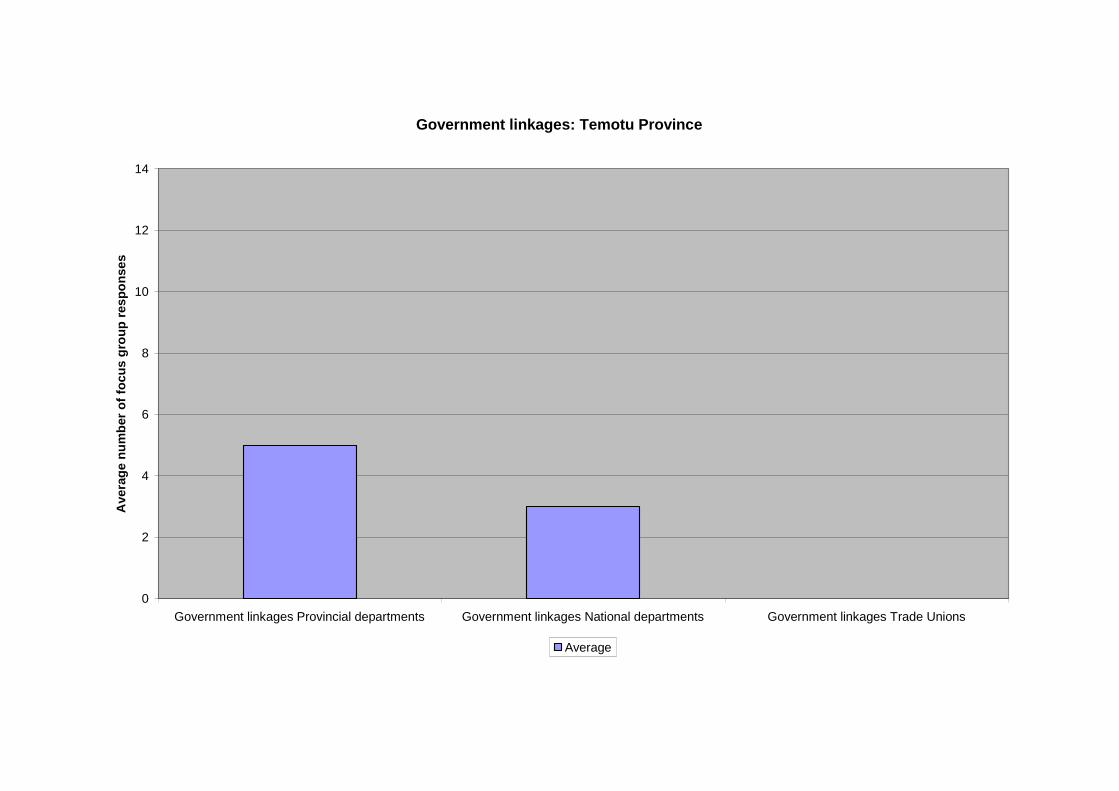
Government linkages: Temotu Province
0
2
4
6
8
10
12
14
Government linkages Provincial departments Government linkages National departments Government linkages Trade Unions
Ave
rag
en
um
ber
of
foc
us
gro
up
res
po
ns
es
Average
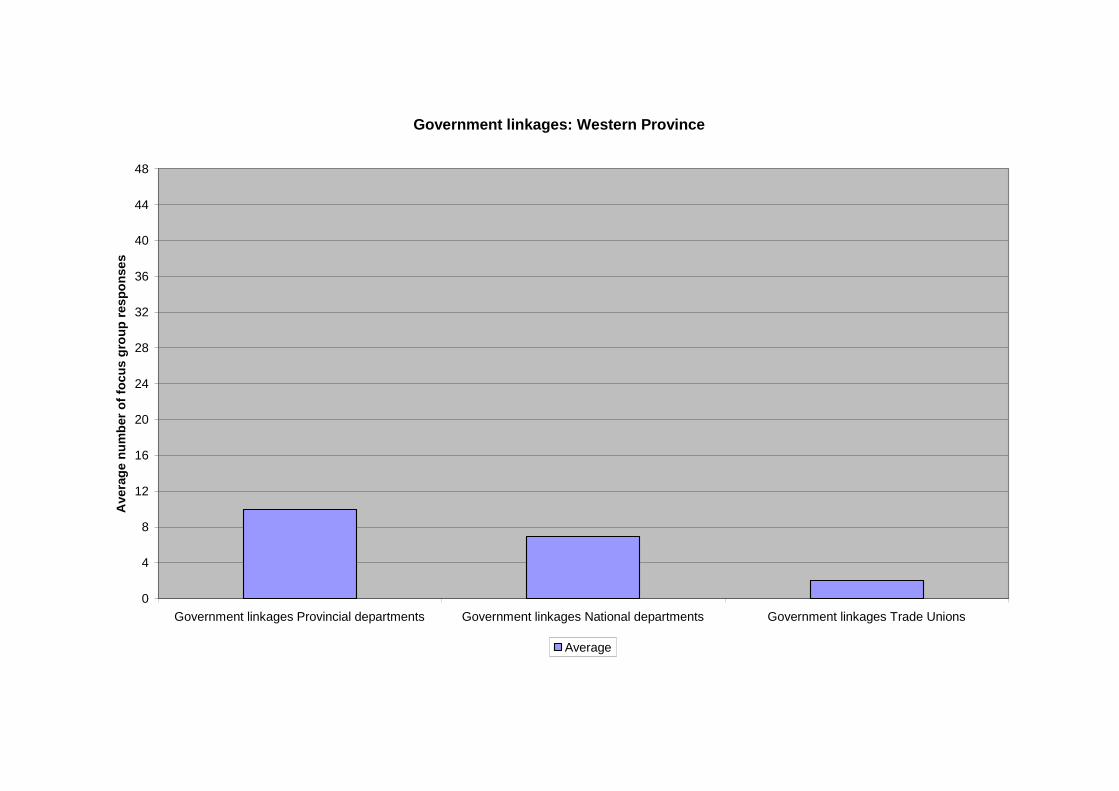
Government linkages: Western Province
0
4
8
12
16
20
24
28
32
36
40
44
48
Government linkages Provincial departments Government linkages National departments Government linkages Trade Unions
Ave
rag
en
um
ber
of
foc
us
gro
up
res
po
ns
es
Average
This volume presents an analysis of the quantitative data gathered during the village survey
from the six outer provinces in the Solomon Islands: Central Province, Choiseul Province,
Isabel Province, Makira Province, RenBel [Rennell-Bellona] Province, Temotu Province and
Western Province. The data presented here is designed to support the information contained
in the Provincial Profiles (Volume One of the Main Report) and to comleement the
information obtained from the village survey conducted in Guadalcanal and Mailata (Volume
Two of the Main Report).
The commentary presented here in the form of “signposts” provides some possible directions
for the CSP work program. However, as stated in the conclusion to the Main Report, these
“signposts” represent the perspective of the Research Coordinator. The survey findings will
be subject to further analyses during the review of the strategies that had been developed to
guide the program during the implementation of the Community Sector Program.
As part of the Village Survey program the standard PRA technique of the preparation of
village maps and seasonal calendars was also undertaken by each focus group. This has
resulted in the compilation of a valuable collection of nearly 900 maps and calendars drawn
by villagers. The maps and calendars have been archived in the CSP office in Honiara but a
selection of the data has been entered onto Excel in a series of provincial files. This
important resource should form the basis of a national food security study from the village
perspective designed to provide additional data for the CSP Livelihoods program. The only
other comprehensive national study of land resources in the Solomon Islands was undertaken
by Wall and Hansell (1974) at the conclusion to the British colonial administration.
It was noted in the introduction to the Main Report that Honiara urban area and the
settlements around the town were excluded form this rural village survey. A number of
studies have been undertaken by other agencies in and around the town but no comprehensive
urban survey or compilation of information has yet been done. This is an urgent task that is
necessary if a complete picture, a Snapshot, of the whole of the Solomon Islands can be
captured at this critical time in the country’s social, economic and political rehabilitation.
Related Documents