MAY / JUNE 2017 29 FEATURE | HELPING INVESTORS RUN THEIR BEST RACE Background on Our Hypothetical Investors For simplicity, let’s assume Bill and Sally are looking to retire in 15 years, have similar financial incomes and net worth, and have no dependents. Bill is largely self-advised, meaning he does his own research about the markets, trades his own portfolio, and has sole discretion for his investment decision-making. Bill is 50 years old and looking to retire when he’s 65. He has about $500,000 total, which includes $400,000 in his 401(k) and $100,000 in an individual retirement account (IRA) that he trades online. He pays about 65 basis points (0.65 percent) annually in trading and account costs (about $650 annually) for his IRA. Bill wants to be able to replace his $80,000 annual paycheck in retirement. Sally is advisor-led, meaning she pays a professional for financial advice that costs her 125 basis points per year (1.25 percent). 5. Ensure investor accountability to stay on track, monitor progress, and keep investments aligned with goals and risk tolerance. When these elements are connected in a plan, an investor can increase the likeli- hood of achieving a financial goal. e investor owns the plan, and achieving investment performance in line with the goals in the plan beats swinging for the fences to get the best possible performance each and every year. rough hypothetical scenarios, we exam- ine the five steps and the pitfalls of emo- tional decision-making. We look at each step through the eyes of two hypothetical investors, an emotional investor named Bill and an objective investor named Sally. Bill consults online articles and friends with money in the market to create his own plan. Sally hires a coach to help her create a plan and hold her accountable for sticking to it. W hen I ran my first marathon, I developed my own plan to run 26.2 miles in less than 4 hours. I trained regularly and felt great on race day. I finished the first half in 1:52, and I kept pushing the pace. But about mile 20, I hit the wall. Soon I was walking. I finished in 4:14, and it wasn’t pretty. What happened? My emotions got the better of me and it spiraled from there. Similarly, lots of investors hit the wall in 2009 and moved into cash. eir emotions took over. But markets have rallied and those who quit missed out. Investors and marathoners alike quit because of “recency bias,” which amplifies recent feelings. As humans, we tend to undervalue the good moments and exag- gerate the bad moments. Just like marathoners, investors need a plan and they need to stick to it. When recency bias kicks in, investors need to be wary of acting emotionally. A plan can be as simple as managing the following five steps (figure 1): 1. Start with investor-defined goals versus market-defined goals. 2. Understand investor timeframes to help build wealth methodically over time. 3. Evaluate investor risk tolerance and ability to withstand market down-draſts that may lead to rash or overly emo- tional decisions. 4. Consider investor knowledge base to build the most appropriate portfolio. BEHAVIORAL COACHING Helping Investors Run Their Best Race By Zar Toolan Figure 1: Five Steps of Investor Behaviors Goals Risk Tolerance Knowledge Base Accountability Start with investor-defined goals versus market-defined goals Understand investor timeframes to help build wealth methodically over time Evaluate investor risk tolerance and ability to withstand market down- drafts that may lead to rash or overly emotional decisions Consider investor knowledge base to build the most appropriate portfolio Ensure investor accountability to stay on track, monitor progress, and keep investments aligned with goals and risk tolerance Timeframes © 2017 Investment Management Consultants Association Inc. Reprinted with permission. All rights reserved.

Welcome message from author
This document is posted to help you gain knowledge. Please leave a comment to let me know what you think about it! Share it to your friends and learn new things together.
Transcript
MAY / JUNE 2017 29
FEATURE | helping invesTors run Their BesT raCe
Background on Our Hypothetical InvestorsFor simplicity, let’s assume Bill and Sally are looking to retire in 15 years, have similar financial incomes and net worth, and have no dependents.
Bill is largely self-advised, meaning he does his own research about the markets, trades his own portfolio, and has sole discretion for his investment decision-making. Bill is 50 years old and looking to retire when he’s 65. He has about $500,000 total, which includes $400,000 in his 401(k) and $100,000 in an individual retirement account (IRA) that he trades online. He pays about 65 basis points (0.65 percent) annually in trading and account costs (about $650 annually) for his IRA. Bill wants to be able to replace his $80,000 annual paycheck in retirement.
Sally is advisor-led, meaning she pays a professional for financial advice that costs her 125 basis points per year (1.25 percent).
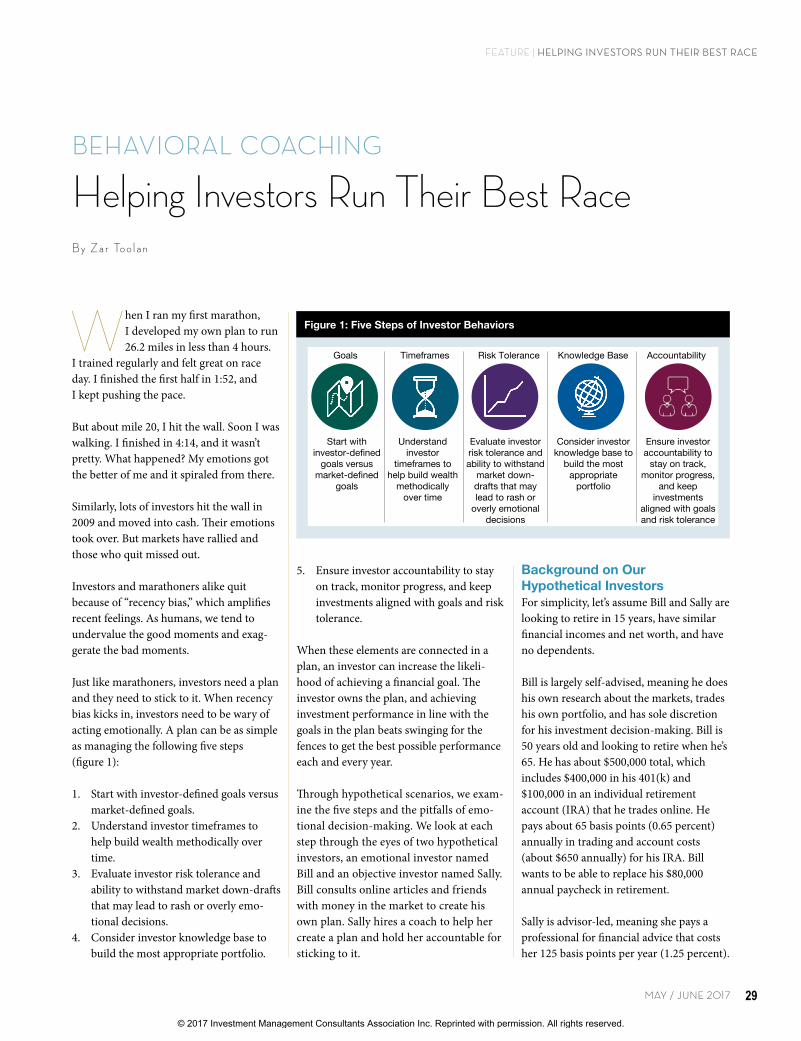
5. Ensure investor accountability to stay on track, monitor progress, and keep investments aligned with goals and risk tolerance.
When these elements are connected in a plan, an investor can increase the likeli-hood of achieving a financial goal. The investor owns the plan, and achieving investment performance in line with the goals in the plan beats swinging for the fences to get the best possible performance each and every year.
Through hypothetical scenarios, we exam-ine the five steps and the pitfalls of emo-tional decision-making. We look at each step through the eyes of two hypothetical investors, an emotional investor named Bill and an objective investor named Sally. Bill consults online articles and friends with money in the market to create his own plan. Sally hires a coach to help her create a plan and hold her accountable for sticking to it.
When I ran my first marathon, I developed my own plan to run 26.2 miles in less than 4 hours.
I trained regularly and felt great on race day. I finished the first half in 1:52, and I kept pushing the pace.
But about mile 20, I hit the wall. Soon I was walking. I finished in 4:14, and it wasn’t pretty. What happened? My emotions got the better of me and it spiraled from there.
Similarly, lots of investors hit the wall in 2009 and moved into cash. Their emotions took over. But markets have rallied and those who quit missed out.
Investors and marathoners alike quit because of “recency bias,” which amplifies recent feelings. As humans, we tend to undervalue the good moments and exag-gerate the bad moments.
Just like marathoners, investors need a plan and they need to stick to it. When recency bias kicks in, investors need to be wary of acting emotionally. A plan can be as simple as managing the following five steps (figure 1):
1. Start with investor-defined goals versus market-defined goals.
2. Understand investor timeframes to help build wealth methodically over time.
3. Evaluate investor risk tolerance and ability to withstand market down-drafts that may lead to rash or overly emo-tional decisions.
4. Consider investor knowledge base to build the most appropriate portfolio.
BEHAVIORAL COACHING
Helping Investors Run Their Best RaceBy Za r To o l a n
Figure 1: Five Steps of Investor Behaviors
Goals Risk Tolerance Knowledge Base Accountability
Start with investor-defined
goals versus market-defined
goals
Understand investor
timeframes to help build wealth
methodically over time
Evaluate investor risk tolerance and ability to withstand
market down-drafts that may lead to rash or
overly emotional decisions
Consider investor knowledge base to
build the most appropriate
portfolio
Ensure investor accountability to
stay on track, monitor progress,
and keep investments
aligned with goals and risk tolerance
Timeframes
© 2017 Investment Management Consultants Association Inc. Reprinted with permission. All rights reserved.
INVESTMENTS&WEALTH MONITOR30
FEATURE | helping invesTors run Their BesT raCe
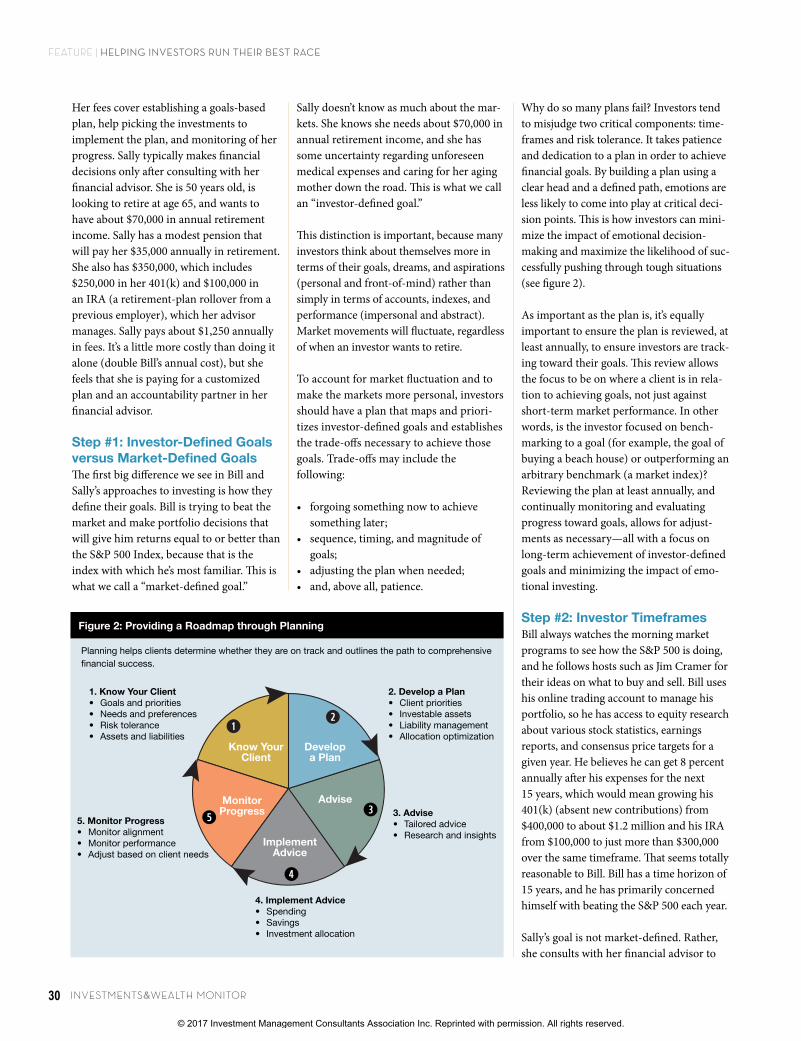
Why do so many plans fail? Investors tend to misjudge two critical components: time-frames and risk tolerance. It takes patience and dedication to a plan in order to achieve financial goals. By building a plan using a clear head and a defined path, emotions are less likely to come into play at critical deci-sion points. This is how investors can mini-mize the impact of emotional decision- making and maximize the likelihood of suc-cessfully pushing through tough situations (see figure 2).
As important as the plan is, it’s equally important to ensure the plan is reviewed, at least annually, to ensure investors are track-ing toward their goals. This review allows the focus to be on where a client is in rela-tion to achieving goals, not just against short-term market performance. In other words, is the investor focused on bench-marking to a goal (for example, the goal of buying a beach house) or outperforming an arbitrary benchmark (a market index)? Reviewing the plan at least annually, and continually monitoring and evaluating progress toward goals, allows for adjust-ments as necessary—all with a focus on long-term achievement of investor-defined goals and minimizing the impact of emo-tional investing.
Step #2: Investor TimeframesBill always watches the morning market programs to see how the S&P 500 is doing, and he follows hosts such as Jim Cramer for their ideas on what to buy and sell. Bill uses his online trading account to manage his portfolio, so he has access to equity research about various stock statistics, earnings reports, and consensus price targets for a given year. He believes he can get 8 percent annually after his expenses for the next 15 years, which would mean growing his 401(k) (absent new contributions) from $400,000 to about $1.2 million and his IRA from $100,000 to just more than $300,000 over the same timeframe. That seems totally reasonable to Bill. Bill has a time horizon of 15 years, and he has primarily concerned himself with beating the S&P 500 each year.
Sally’s goal is not market-defined. Rather, she consults with her financial advisor to
Sally doesn’t know as much about the mar-kets. She knows she needs about $70,000 in annual retirement income, and she has some uncertainty regarding unforeseen medical expenses and caring for her aging mother down the road. This is what we call an “investor-defined goal.”
This distinction is important, because many investors think about themselves more in terms of their goals, dreams, and aspirations (personal and front-of-mind) rather than simply in terms of accounts, indexes, and performance (impersonal and abstract). Market movements will fluctuate, regardless of when an investor wants to retire.
To account for market fluctuation and to make the markets more personal, investors should have a plan that maps and priori-tizes investor-defined goals and establishes the trade-offs necessary to achieve those goals. Trade-offs may include the following:
• forgoing something now to achieve something later;
• sequence, timing, and magnitude of goals;
• adjusting the plan when needed;• and, above all, patience.
Her fees cover establishing a goals-based plan, help picking the investments to implement the plan, and monitoring of her progress. Sally typically makes financial decisions only after consulting with her financial advisor. She is 50 years old, is looking to retire at age 65, and wants to have about $70,000 in annual retirement income. Sally has a modest pension that will pay her $35,000 annually in retirement. She also has $350,000, which includes $250,000 in her 401(k) and $100,000 in an IRA (a retirement-plan rollover from a previous employer), which her advisor manages. Sally pays about $1,250 annually in fees. It’s a little more costly than doing it alone (double Bill’s annual cost), but she feels that she is paying for a customized plan and an accountability partner in her financial advisor.
Step #1: Investor-Defined Goals versus Market-Defined GoalsThe first big difference we see in Bill and Sally’s approaches to investing is how they define their goals. Bill is trying to beat the market and make portfolio decisions that will give him returns equal to or better than the S&P 500 Index, because that is the index with which he’s most familiar. This is what we call a “market-defined goal.”
Figure 2: Providing a Roadmap through Planning
Planning helps clients determine whether they are on track and outlines the path to comprehensive financial success.
1. Know Your Client• Goals and priorities• Needs and preferences• Risk tolerance• Assets and liabilities
5. Monitor Progress• Monitor alignment• Monitor performance• Adjust based on client needs
2. Develop a Plan• Client priorities• Investable assets• Liability management• Allocation optimization
3. Advise• Tailored advice• Research and insights
4. Implement Advice• Spending• Savings• Investment allocation
Know Your Client
Developa Plan
Advise
ImplementAdvice
Monitor Progress
qw
e
r
t
© 2017 Investment Management Consultants Association Inc. Reprinted with permission. All rights reserved.
MAY / JUNE 2017 31
FEATURE | helping invesTors run Their BesT raCe
help keep them on track and on pace for their goals.
An important element of training the ratio-nal brain for investors is to keep an up-to-date risk profile.
• A client’s profile can become “out of date” as a simple result of time and new life circumstances that may not be reflected in the client’s investments.
• Many investors tend to think in terms of what they could have gotten versus what they should have gotten—which may be different still from what they actually got.
• Tolerance for risk is a crucial part of the conversation, but it can be forgotten in higher-return, lower-volatility markets such as the ones we’ve seen recently.
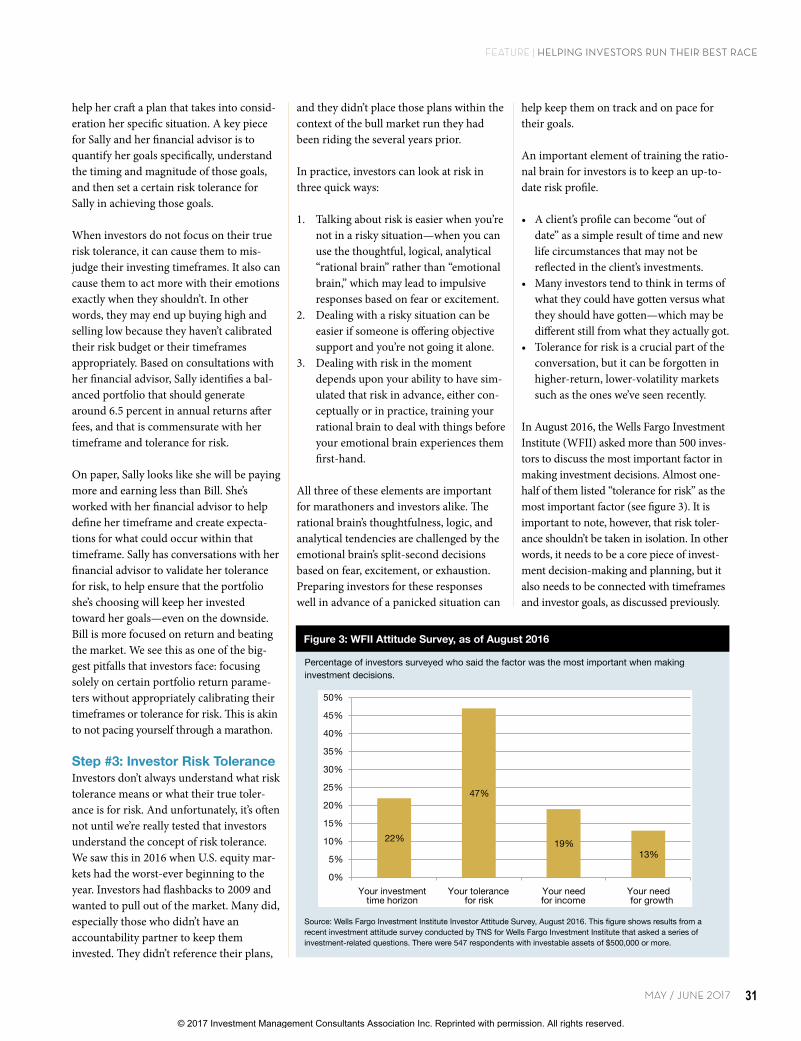
In August 2016, the Wells Fargo Investment Institute (WFII) asked more than 500 inves-tors to discuss the most important factor in making investment decisions. Almost one-half of them listed “tolerance for risk” as the most important factor (see figure 3). It is important to note, however, that risk toler-ance shouldn’t be taken in isolation. In other words, it needs to be a core piece of invest-ment decision-making and planning, but it also needs to be connected with timeframes and investor goals, as discussed previously.
and they didn’t place those plans within the context of the bull market run they had been riding the several years prior.
In practice, investors can look at risk in three quick ways:
1. Talking about risk is easier when you’re not in a risky situation—when you can use the thoughtful, logical, analytical “rational brain” rather than “emotional brain,” which may lead to impulsive responses based on fear or excitement.
2. Dealing with a risky situation can be easier if someone is offering objective support and you’re not going it alone.
3. Dealing with risk in the moment depends upon your ability to have sim-ulated that risk in advance, either con-ceptually or in practice, training your rational brain to deal with things before your emotional brain experiences them first-hand.
All three of these elements are important for marathoners and investors alike. The rational brain’s thoughtfulness, logic, and analytical tendencies are challenged by the emotional brain’s split-second decisions based on fear, excitement, or exhaustion. Preparing investors for these responses well in advance of a panicked situation can
help her craft a plan that takes into consid-eration her specific situation. A key piece for Sally and her financial advisor is to quantify her goals specifically, understand the timing and magnitude of those goals, and then set a certain risk tolerance for Sally in achieving those goals.
When investors do not focus on their true risk tolerance, it can cause them to mis-judge their investing timeframes. It also can cause them to act more with their emotions exactly when they shouldn’t. In other words, they may end up buying high and selling low because they haven’t calibrated their risk budget or their timeframes appropriately. Based on consultations with her financial advisor, Sally identifies a bal-anced portfolio that should generate around 6.5 percent in annual returns after fees, and that is commensurate with her timeframe and tolerance for risk.
On paper, Sally looks like she will be paying more and earning less than Bill. She’s worked with her financial advisor to help define her timeframe and create expecta-tions for what could occur within that timeframe. Sally has conversations with her financial advisor to validate her tolerance for risk, to help ensure that the portfolio she’s choosing will keep her invested toward her goals—even on the downside. Bill is more focused on return and beating the market. We see this as one of the big-gest pitfalls that investors face: focusing solely on certain portfolio return parame-ters without appropriately calibrating their timeframes or tolerance for risk. This is akin to not pacing yourself through a marathon.
Step #3: Investor Risk ToleranceInvestors don’t always understand what risk tolerance means or what their true toler-ance is for risk. And unfortunately, it’s often not until we’re really tested that investors understand the concept of risk tolerance. We saw this in 2016 when U.S. equity mar-kets had the worst-ever beginning to the year. Investors had flashbacks to 2009 and wanted to pull out of the market. Many did, especially those who didn’t have an accountability partner to keep them invested. They didn’t reference their plans,
Figure 3: WFII Attitude Survey, as of August 2016
Source: Wells Fargo Investment Institute Investor Attitude Survey, August 2016. This figure shows results from a recent investment attitude survey conducted by TNS for Wells Fargo Investment Institute that asked a series of investment-related questions. There were 547 respondents with investable assets of $500,000 or more.
22%
47%
19%13%
0%
5%
10%
15%
20%
25%
30%
35%
40%
45%
50%
Your investmenttime horizon
Your tolerancefor risk
Your need for income
Your needfor growth
Percentage of investors surveyed who said the factor was the most important when making investment decisions.
© 2017 Investment Management Consultants Association Inc. Reprinted with permission. All rights reserved.

INVESTMENTS&WEALTH MONITOR32
FEATURE | helping invesTors run Their BesT raCe
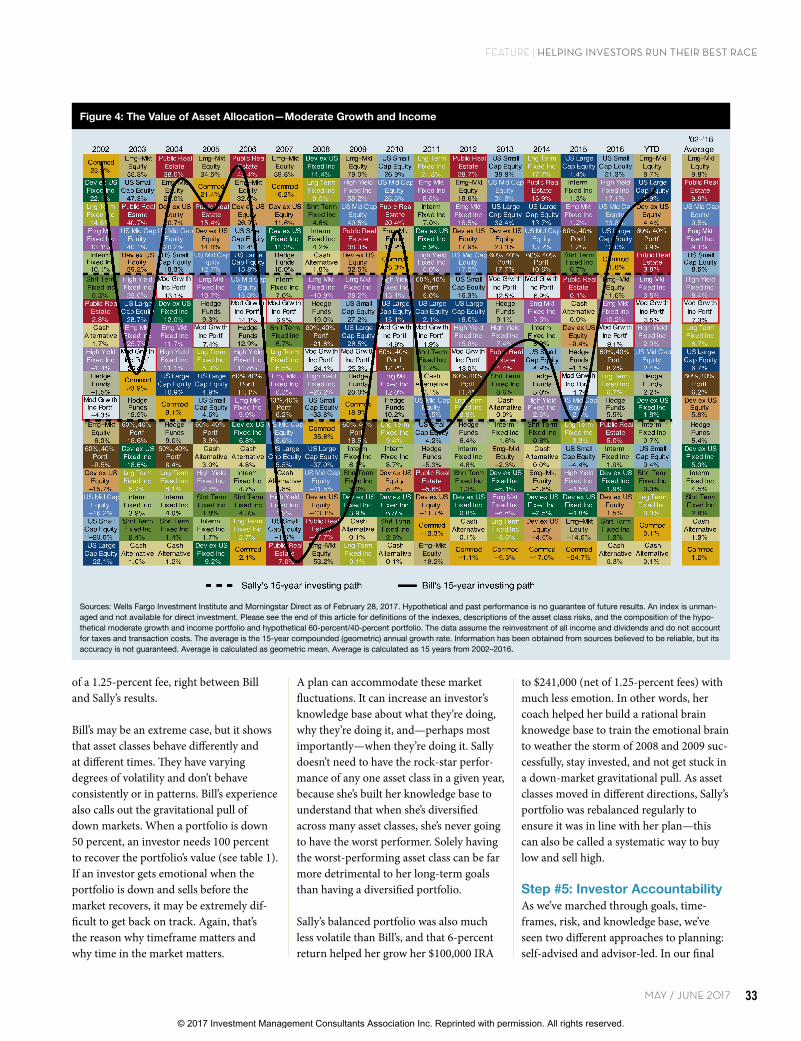
This is where Bill and Sally’s investment philosophies start to differ. Recall that Bill is self-advised and Sally has an advisor. Bill is more focused on market-defined goals whereas Sally is more interested in her own investor-defined goals. Because Bill is focused on market-defined goals, he decides to go with a copy-cat investment strategy based on what has happened previously in the markets. This is his knowledge base.
To simulate Bill’s approach, let’s take a basic asset class quilt chart example, beginning in 2002 (see figure 4). We determine the best asset class from the prior year and pick that asset class for next year, and we do that 15 times through year-end 2016. We assume that as the emotional investor, Bill bought the best-performing asset class of the prior year (in 2002, that was commodities), then ran that asset class all year in 2003. At the end of 2003, Bill sells out of that position entirely, checks for the best performer that year (emerging market equities in 2003). In 2004, Bill loads up on emerging market equities, and he repeats this process through year-end 2016. Because he’s mak-ing these trades in his IRA, we assume there are no tax consequences.
Looking specifically at 2002–2016 and these available asset classes, running with last year’s best performer, Bill winds up growing at 4-percent annually (net of 0.65-percent fees). This assumes that Bill continued to invest according to his buy-last-year’s-winner plan, even after getting the worst performers two years in a row, in 2007 and 2008.
But what about Sally, who trained with a coach? That coach helped her define her goals (versus trying to beat a specific mar-ket return) and identify her true tolerance for risk. Sally was in a fully allocated mod-erate growth and income portfolio that returned 6 percent (net of 1.25-percent fees) over that same period. She never got the best performance of the year, but she also never got the worst.
For comparison, a basic 60-percent equity/ 40-percent fixed income portfolio that was rebalanced annually returned 5 percent net
uum of a plan. It’s important for clients to have plans in their rational brains to help them map their goals on a broader time-line. Objectively, an investor can consider these as a series of cash-flows (money in and money out). Inward cash-flows can be things such as saving for retirement in a 401(k) or IRA. Outward cash-flows could be things such as paying for an aging parent or increased healthcare expenses, which is a concern for Sally.
The plan should take into account the sequence, timing, and magnitude of those cash-flows and then be optimized to create the best likelihood of achieving those cash-flows in the future. This may include stress testing the plan and its potential for risk (down markets), and assessing how it may respond in worsened market conditions. Such exercises can help take some of the emotional elements out of play when those scenarios actually occur—they train the rational brain ahead of time so it can be knowledgeable enough to overcome the emotional brain and the recency bias that emotions can trigger.
Finally, a plan needs to have the ability to track progress and current versus pro-jected dollar amounts against the plan. The plan needs to take into consideration where the portfolio is and where it could be in the future. That means helping the investor understand how far that portfolio, as it is constructed today, could drift from the client’s plan given certain market conditions.
Those what-if scenarios can shore up inves-tors’ knowledge base to prepare them for a time when they might otherwise make an emotional decision. In other words, when will an investor rebalance and how will it be done? An investor can establish a foun-dation in an emotion-free environment to train the brain to overcome what likely will be emotional thoughts during periods of volatility or turmoil. This all helps create empirical knowledge and experience, so when emotions take over, investors have experienced those conditions already in their mind’s eye and are less likely to make rash decisions if and when they occur.
When our hypothetical investors Bill and Sally begin their respective investment plans, they encounter risks they didn’t ini-tially foresee when they first developed their plans. That’s why risk tolerance needs to be connected to other aspects of the invest-ment plan, such as goals and timeframes, which depend largely on the knowledge base of the investor. As noted in the WFII study, “Time horizon and risk tolerance can work together—in that your tolerance for risk can increase as your time horizon lengthens. That is because historically, short-term losses often are recovered over longer periods of time” (McMillion 2016).
Yet not all investors are aware that short-term losses can be recovered in the long term or act rationally based on market his-tory. The less knowledgeable investors are with respect to the markets, the more likely they are to make emotional decisions, which means not waiting for markets to recover. In other words, it’s time in the markets not timing the markets. The deeper the investor knowledge base, the more intricate and nuanced a plan can be to potentially hedge against risk or put into place parameters for systematically dealing with that risk.
Step #4: Investor Knowledge BaseInvestor knowledge base can be bucketed into three broad categories. These focal points of an investment plan can limit investors from making emotional decisions at the wrong time.
1. Investors should know their goals (e.g., retirement or caring for an aging parent).
2. Investors should know the sequence, timing, and magnitude of those goals.
3. Investors should be monitoring prog-ress toward those goals by tracking them against where they should be in time and as part of a broader plan that may have multiple goals.
One of the biggest goals for investors is typ-ically retirement. Although thinking about replacing your paycheck can be emotional —even terrifying, retirement is nothing more than another goal along the contin-
© 2017 Investment Management Consultants Association Inc. Reprinted with permission. All rights reserved.
MAY / JUNE 2017 33
FEATURE | helping invesTors run Their BesT raCe
to $241,000 (net of 1.25-percent fees) with much less emotion. In other words, her coach helped her build a rational brain knowedge base to train the emotional brain to weather the storm of 2008 and 2009 suc-cessfully, stay invested, and not get stuck in a down-market gravitational pull. As asset classes moved in different directions, Sally’s portfolio was rebalanced regularly to ensure it was in line with her plan—this can also be called a systematic way to buy low and sell high.
Step #5: Investor AccountabilityAs we’ve marched through goals, time-frames, risk, and knowledge base, we’ve seen two different approaches to planning: self-advised and advisor-led. In our final
A plan can accommodate these market fluctuations. It can increase an investor’s knowledge base about what they’re doing, why they’re doing it, and—perhaps most importantly—when they’re doing it. Sally doesn’t need to have the rock-star perfor-mance of any one asset class in a given year, because she’s built her knowledge base to understand that when she’s diversified across many asset classes, she’s never going to have the worst performer. Solely having the worst-performing asset class can be far more detrimental to her long-term goals than having a diversified portfolio.
Sally’s balanced portfolio was also much less volatile than Bill’s, and that 6-percent return helped her grow her $100,000 IRA
of a 1.25-percent fee, right between Bill and Sally’s results.
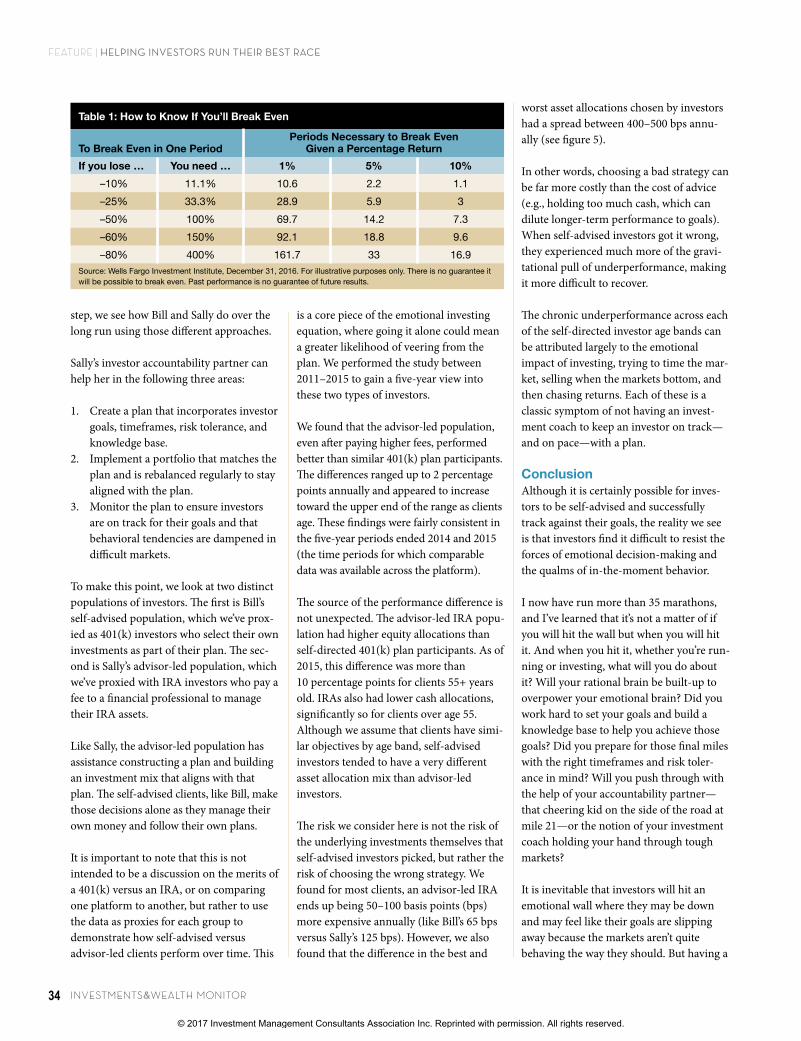
Bill’s may be an extreme case, but it shows that asset classes behave differently and at different times. They have varying degrees of volatility and don’t behave consistently or in patterns. Bill’s experience also calls out the gravitational pull of down markets. When a portfolio is down 50 percent, an investor needs 100 percent to recover the portfolio’s value (see table 1). If an investor gets emotional when the portfolio is down and sells before the market recovers, it may be extremely dif-ficult to get back on track. Again, that’s the reason why timeframe matters and why time in the market matters.
Figure 4: The Value of Asset Allocation—Moderate Growth and Income
Sources: Wells Fargo Investment Institute and Morningstar Direct as of February 28, 2017. Hypothetical and past performance is no guarantee of future results. An index is unman-aged and not available for direct investment. Please see the end of this article for definitions of the indexes, descriptions of the asset class risks, and the composition of the hypo-thetical moderate growth and income portfolio and hypothetical 60-percent/40-percent portfolio. The data assume the reinvestment of all income and dividends and do not account for taxes and transaction costs. The average is the 15-year compounded (geometric) annual growth rate. Information has been obtained from sources believed to be reliable, but its accuracy is not guaranteed. Average is calculated as geometric mean. Average is calculated as 15 years from 2002–2016.
2002 2003 2004 2005 2006 2007 2008 2009 2010 2011 2012 2013 2014 2015 2016 YTD'02–'16
AverageCommod 25.9%
Emg–Mkt Equity 56.3%
Public Real Estate 38.0%
Emg–Mkt Equity 34.5%
Public Real Estate 42.4%
Emg–Mkt Equity 39.8%
Dev ex US Fixed Inc 11.4%
Emg–Mkt Equity 79.0%
US Small Cap Equity
26.9%
Lng Term Fixed Inc 21.8%
Public Real Estate 28.7%
US Small Cap Equity
38.8%
Lng Term Fixed Inc 17.7%
US Large Cap Equity
1.4%
US Small Cap Equity
21.3%
Emg–Mkt Equity 8.7%
Emg–Mkt Equity 9.8%
Dev ex US Fixed Inc 22.1%
US Small Cap Equity
47.3%
Emg–Mkt Equity 26.0%
Commod 21.4%
Emg–Mkt Equity 32.6%
Commod 16.2%
Lng Term Fixed Inc
9.0%
High Yield Fixed Inc 58.2%
US Mid Cap Equity 25.5%
Emg Mkt Fixed Inc
8.5%
Emg–Mkt Equity 18.6%
US Mid Cap Equity 34.8%
Public Real Estate 15.9%
Interm Fixed Inc
1.3%
High Yield Fixed Inc 17.1%
US Large Cap Equity
5.9%
Public Real Estate 9.8%
Lng Term Fixed Inc 14.8%
Public Real Estate 40.7%
Dev ex US Equity 20.7%
Public Real Estate 15.4%
Dev ex US Equity 26.9%
Dev ex US Equity 11.6%
Shrt Term Fixed Inc
4.6%
US Mid Cap Equity 40.5%
Public Real Estate 20.4%
Interm Fixed Inc
7.0%
Emg Mkt Fixed Inc 18.5%
US Large Cap Equity
32.4%
US Large Cap Equity
13.7%
Emg Mkt Fixed Inc
1.2%
US Mid Cap Equity 13.8%
Dev ex US Equity 4.4%
US Mid Cap Equity 9.5%
Emg Mkt Fixed Inc 13.1%
US Mid Cap Equity 40.1%
US Mid Cap Equity 20.2%
Dev ex US Equity 14.0%
US Small Cap Equity
18.4%
Dev ex US Fixed Inc 11.3%
Interm Fixed Inc
4.2%
Public Real Estate 38.3%
Emg–Mkt Equity 19.2%
Dev ex US Fixed Inc
5.9%
Dev ex US Equity 17.9%
Dev ex US Equity 23.3%
US Mid Cap Equity 13.2%
60%,40% Portf 1.2%
US Large Cap Equity
12.0%
60%,40% Portf 3.9%
Emg Mkt Fixed Inc
9.1%Interm
Fixed Inc 10.1%
Dev ex US Equity 39.2%
US Small Cap Equity
18.3%
US Mid Cap Equity 12.7%
US Large Cap Equity
15.8%
Hedge Funds 10.0%
Cash Alternative
1.8%
Dev ex US Equity 32.5%
Commod 16.8%
High Yield Fixed Inc
5.0%
US Mid Cap Equity 17.3%
60%,40% Portf
17.7%
60%,40% Portf
10.6%
Shrt Term Fixed Inc
0.7%Commod 11.8%
Public Real Estate 3.8%
US Small Cap Equity
8.5%Shrt Term Fixed Inc
6.3%
High Yield Fixed Inc 29.0%
Mod Grw th Inc Portf 13.1%
Emg Mkt Fixed Inc 10.7%
US Mid Cap Equity 15.3%
Interm Fixed Inc
7.0%
Emg Mkt Fixed Inc –10.9%
Emg Mkt Fixed Inc 28.2%
High Yield Fixed Inc 15.1%
60%,40% Portf 5.0%
US Small Cap Equity
16.3%
Mod Grw th Inc Portf 12.5%
Mod Grw th Inc Portf
6.9%
Public Real Estate 0.1%
Emg–Mkt Equity 11.6%
Emg Mkt Fixed Inc
3.5%
High Yield Fixed Inc
8.4%Public Real
Estate 2.8%
US Large Cap Equity
28.7%
Dev ex US Fixed Inc 12.0%
Hedge Funds 9.3%
Mod Grw th Inc Portf 14.1%
Mod Grw th Inc Portf
6.9%
Hedge Funds
–19.0%
US Small Cap Equity
27.2%
US Large Cap Equity
15.1%
US Large Cap Equity
2.1%
US Large Cap Equity
16.0%
Hedge Funds 9.1%
Emg Mkt Fixed Inc
5.5%
Cash Alternative
0.0%
Emg Mkt Fixed Inc 10.2%
Mod Grw th Inc Portf
3.5%
Mod Grw th Inc Portf
7.3%Cash
Alternative 1.7%
Emg Mkt Fixed Inc 25.7%
Emg Mkt Fixed Inc 11.7%
Mod Grw th Inc Portf
7.4%
Hedge Funds 12.9%
Shrt Term Fixed Inc
6.7%
60%,40% Portf
–21.6%
US Large Cap Equity
26.5%
Mod Grw th Inc Portf 14.8%
Mod Grw th Inc Portf
1.9%
High Yield Fixed Inc 15.8%
High Yield Fixed Inc
7.4%
Interm Fixed Inc
5.0%
Dev ex US Equity –0.4%
Mod Grw th Inc Portf
9.1%
High Yield Fixed Inc
2.9%
Lng Term Fixed Inc
6.7%High Yield Fixed Inc
–1.4%
Mod Grw th Inc Portf 25.4%
High Yield Fixed Inc 11.1%
Lng Term Fixed Inc
5.3%
High Yield Fixed Inc 11.8%
Lng Term Fixed Inc
6.5%
Mod Grw th Inc Portf –24.1%
Mod Grw th Inc Portf 25.3%
60%,40% Portf
12.2%
Shrt Term Fixed Inc
1.7%
Mod Grw th Inc Portf 13.0%
Public Real Estate 4.4%
US Small Cap Equity
4.9%
Hedge Funds –1.1%
60%,40% Portf 8.2%
US Mid Cap Equity 2.4%
US Large Cap Equity
6.7%Hedge Funds –1.5%
Commod 23.9%
US Large Cap Equity
10.9%
US Large Cap Equity
4.9%
60%,40% Portf
11.1%
Emg Mkt Fixed Inc
6.3%
High Yield Fixed Inc –26.2%
Hedge Funds 20.0%
Emg Mkt Fixed Inc 12.0%
Cash Alternative
0.1%
60%,40% Portf
11.4%
Shrt Term Fixed Inc
0.6%
Hedge Funds 3.0%
Mod Grw th Inc Portf –1.7%
Lng Term Fixed Inc
6.7%
Hedge Funds 2.2%
60%,40% Portf 6.2%
Mod Grw th Inc Portf –4.3%
Hedge Funds 19.5%
Commod 9.1%
US Small Cap Equity
4.6%
Emg Mkt Fixed Inc
9.9%
60%,40% Portf 6.2%
US Small Cap Equity
–33.8%Commod 18.9%
Hedge Funds 10.2%
US Mid Cap Equity –1.5%
Lng Term Fixed Inc
8.8%
Cash Alternative
0.0%
High Yield Fixed Inc
2.5%
US Mid Cap Equity –2.4%
Hedge Funds 5.5%
Dev ex US Fixed Inc
1.8%
Dev ex US Equity 5.8%
Emg–Mkt Equity –6.0%
60%,40% Portf
18.6%
Hedge Funds 9.0%
60%,40% Portf 3.9%
Dev ex US Fixed Inc
6.8%
US Mid Cap Equity 5.6%
Commod –35.6%
60%,40% Portf
18.5%
Lng Term Fixed Inc
9.4%
US Small Cap Equity
–4.2%
Hedge Funds 6.4%
Interm Fixed Inc
–1.6%
Shrt Term Fixed Inc
0.8%
Lng Term Fixed Inc
–3.3%
Public Real Estate 5.0%
Interm Fixed Inc
0.7%
Hedge Funds 5.4%
60%,40% Portf –9.5%
Dev ex US Fixed Inc 18.6%
60%,40% Portf 8.4%
Cash Alternative
3.0%
Cash Alternative
4.8%
US Large Cap Equity
5.5%
US Large Cap Equity
–37.0%
Interm Fixed Inc
6.0%
Interm Fixed Inc
8.7%
Hedge Funds –5.3%
Interm Fixed Inc
4.8%
Emg–Mkt Equity –2.3%
Cash Alternative
0.0%
US Small Cap Equity
–4.4%
Interm Fixed Inc
1.9%
US Small Cap Equity
0.4%
Dev ex US Fixed Inc
5.0%Dev ex US
Equity –15.7%
Lng Term Fixed Inc
5.7%
Lng Term Fixed Inc
8.1%
High Yield Fixed Inc
2.7%
Interm Fixed Inc
4.7%
Cash Alternative
4.8%
US Mid Cap Equity –41.5%
Shrt Term Fixed Inc
5.0%
Dev ex US Equity 8.2%
Public Real Estate –5.8%
Shrt Term Fixed Inc
1.3%
Dev ex US Fixed Inc
–5.1%
Emg–Mkt Equity –1.8%
High Yield Fixed Inc
–4.5%
Dev ex US Fixed Inc
1.9%
Shrt Term Fixed Inc
0.3%
Interm Fixed Inc
4.5%US Mid Cap
Equity –16.2%
Interm Fixed Inc
3.9%
Interm Fixed Inc
4.0%
Shrt Term Fixed Inc
1.8%
Shrt Term Fixed Inc
4.3%
High Yield Fixed Inc
1.9%
Dev ex US Equity –43.1%
Dev ex US Fixed Inc
3.9%
Dev ex US Fixed Inc
6.8%
Dev ex US Equity –11.7%
Dev ex US Fixed Inc
0.8%
Emg Mkt Fixed Inc
–6.6%
Dev ex US Fixed Inc
–2.5%
Dev ex US Fixed Inc
–4.8%
Dev ex US Equity 1.5%
Lng Term Fixed Inc
0.3%
Shrt Term Fixed Inc
2.8%US Small
Cap Equity –20.5%
Shrt Term Fixed Inc
2.4%
Shrt Term Fixed Inc
1.4%
Interm Fixed Inc
1.7%
Lng Term Fixed Inc
2.7%
US Small Cap Equity
–1.6%
Public Real Estate –47.7%
Cash Alternative
0.1%
Shrt Term Fixed Inc
2.6%
Commod –13.3%
Cash Alternative
0.1%
Lng Term Fixed Inc
–8.6%
Dev ex US Equity –4.5%
Emg–Mkt Equity
–14.6%
Shrt Term Fixed Inc
1.3%
Commod 0.1%
Cash Alternative
1.3%US Large
Cap Equity –22.1%
Cash Alternative
1.0%
Cash Alternative
1.2%
Dev ex US Fixed Inc
–9.2%
Commod 2.1%
Public Real Estate –7.0%
Emg–Mkt Equity
–53.2%
Lng Term Fixed Inc
0.1%
Cash Alternative
0.1%
Emg–Mkt Equity
–18.2%
Commod –1.1%
Commod –9.5%
Commod –17.0%
Commod –24.7%
Cash Alternative
0.3%
Cash Alternative
0.1%
Commod 1.2%
3.8%Emgmm –Mktkk EEEEEEEEmmgmm MkMkMkMkMkMM ttttttkkk
5.0% 17.3% 17.7% 10.6% 0.7%6060606060606060%%%%%%% 404040404440%%%%%%%% US Smamm ll ModMM Grw th PPPPPPPPubbbbbbbbliiiiicc RRRRRRReeeaallllll EModMM Grw thighhhhh YYYYYYiiiiiieelllllllddddddd
10.0% 1.8% 32.5%aaap Interm EEEEEEEmmmgmm MkMkMkMMkMkMkttttkkkkk EEEEEEmmgmmm MkMMkMkMkMkMktttttkk HHHHHHH
18.3% 12.7% 15.8%EEEEEEEEmmgmm MkMkMkMkMkMkMM ttttttkkkkkk UUUUUUUUSSSSSSSSS MMMMMMidddddddd CCCCCCCCCModMM Grw th
39.2%HHHHHHHiiiighhhhhhh YYYYYYYiiiiieelllllllddddd
10.1%Shrt Term
Hedge Interm ShSmamm ll0%%%%%%%%%%% LLLLLLLLLLnnnnnnnggggggg TTTTTTTTTTTeeeeerrrrrrrmmmmmmm US SSSSSSSSSSS MMMMMMMMMMiidddddddddddd CCCCCCCCCCCaaaaaaappppp C d 60606060606606066 %%%%%%%%%%%,404040404004040404.3%
Emgmm –Mktkk 606060606060600000%%%%%%%%%,4040404040404040400%%%%%%%%% Hedge 660606060606060606000%%%%%%%%%%%,40404040404040404004 %%%%%%%%%% DDDDDDDDDDDeeeevvvvvvv eeeeeeeexxxxxx UUUUUUUUUUSSSSSSSSS UUUUUUUUU rt Term LLLLLLLnnnnnnnnggggggg TTTTTTTTTTTTeeeerrrrrrmmmmmmm PPPPPPPPPuuuuubbbbbbbbbbliliiiiiiiicccccc RRRRRRRRRRRReeeeeeeaaaaaaalllllllll Interm
Sally's 15-year investing path Bill's 15-year investing path
© 2017 Investment Management Consultants Association Inc. Reprinted with permission. All rights reserved.
INVESTMENTS&WEALTH MONITOR34
FEATURE | helping invesTors run Their BesT raCe
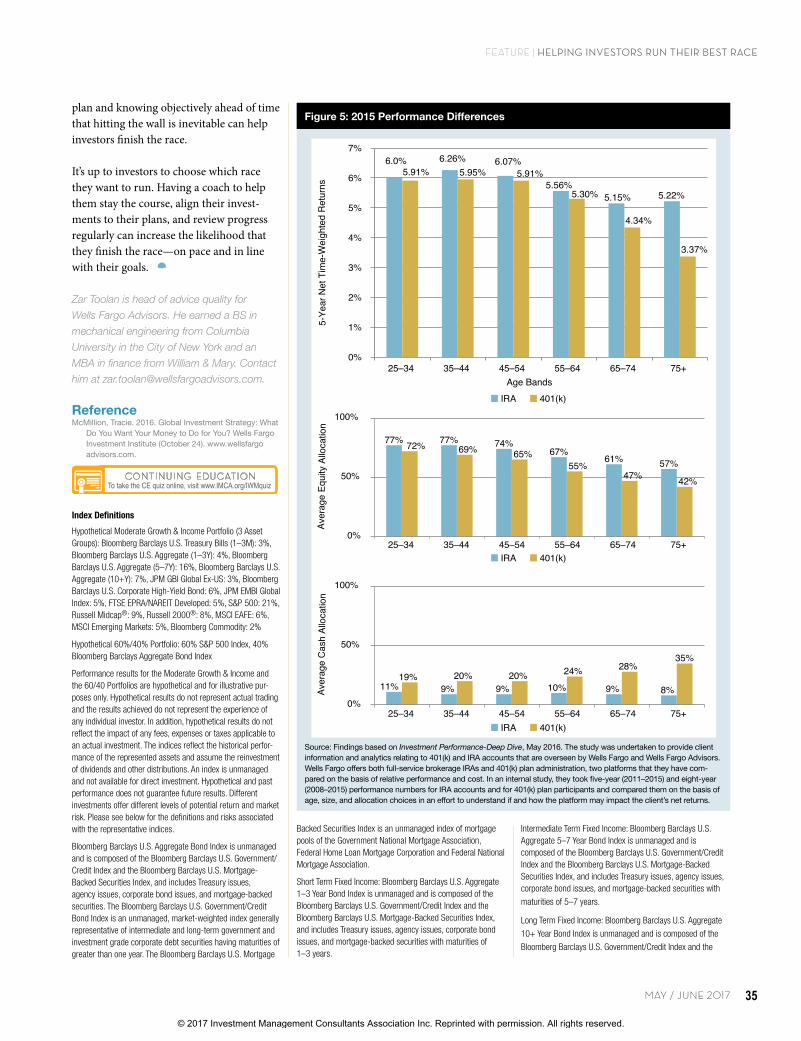
worst asset allocations chosen by investors had a spread between 400–500 bps annu-ally (see figure 5).
In other words, choosing a bad strategy can be far more costly than the cost of advice (e.g., holding too much cash, which can dilute longer-term performance to goals). When self-advised investors got it wrong, they experienced much more of the gravi-tational pull of underperformance, making it more difficult to recover.
The chronic underperformance across each of the self-directed investor age bands can be attributed largely to the emotional impact of investing, trying to time the mar-ket, selling when the markets bottom, and then chasing returns. Each of these is a classic symptom of not having an invest-ment coach to keep an investor on track—and on pace—with a plan.
ConclusionAlthough it is certainly possible for inves-tors to be self-advised and successfully track against their goals, the reality we see is that investors find it difficult to resist the forces of emotional decision-making and the qualms of in-the-moment behavior.
I now have run more than 35 marathons, and I’ve learned that it’s not a matter of if you will hit the wall but when you will hit it. And when you hit it, whether you’re run-ning or investing, what will you do about it? Will your rational brain be built-up to overpower your emotional brain? Did you work hard to set your goals and build a knowledge base to help you achieve those goals? Did you prepare for those final miles with the right timeframes and risk toler-ance in mind? Will you push through with the help of your accountability partner—that cheering kid on the side of the road at mile 21—or the notion of your investment coach holding your hand through tough markets?
It is inevitable that investors will hit an emotional wall where they may be down and may feel like their goals are slipping away because the markets aren’t quite behaving the way they should. But having a
is a core piece of the emotional investing equation, where going it alone could mean a greater likelihood of veering from the plan. We performed the study between 2011–2015 to gain a five-year view into these two types of investors.
We found that the advisor-led population, even after paying higher fees, performed better than similar 401(k) plan participants. The differences ranged up to 2 percentage points annually and appeared to increase toward the upper end of the range as clients age. These findings were fairly consistent in the five-year periods ended 2014 and 2015 (the time periods for which comparable data was available across the platform).
The source of the performance difference is not unexpected. The advisor-led IRA popu-lation had higher equity allocations than self-directed 401(k) plan participants. As of 2015, this difference was more than 10 percentage points for clients 55+ years old. IRAs also had lower cash allocations, significantly so for clients over age 55. Although we assume that clients have simi-lar objectives by age band, self-advised investors tended to have a very different asset allocation mix than advisor-led investors.
The risk we consider here is not the risk of the underlying investments themselves that self-advised investors picked, but rather the risk of choosing the wrong strategy. We found for most clients, an advisor-led IRA ends up being 50–100 basis points (bps) more expensive annually (like Bill’s 65 bps versus Sally’s 125 bps). However, we also found that the difference in the best and
step, we see how Bill and Sally do over the long run using those different approaches.
Sally’s investor accountability partner can help her in the following three areas:
1. Create a plan that incorporates investor goals, timeframes, risk tolerance, and knowledge base.
2. Implement a portfolio that matches the plan and is rebalanced regularly to stay aligned with the plan.
3. Monitor the plan to ensure investors are on track for their goals and that behavioral tendencies are dampened in difficult markets.
To make this point, we look at two distinct populations of investors. The first is Bill’s self-advised population, which we’ve prox-ied as 401(k) investors who select their own investments as part of their plan. The sec-ond is Sally’s advisor-led population, which we’ve proxied with IRA investors who pay a fee to a financial professional to manage their IRA assets.
Like Sally, the advisor-led population has assistance constructing a plan and building an investment mix that aligns with that plan. The self-advised clients, like Bill, make those decisions alone as they manage their own money and follow their own plans.
It is important to note that this is not intended to be a discussion on the merits of a 401(k) versus an IRA, or on comparing one platform to another, but rather to use the data as proxies for each group to demonstrate how self-advised versus advisor-led clients perform over time. This
Table 1: How to Know If You’ll Break Even
To Break Even in One PeriodPeriods Necessary to Break Even
Given a Percentage Return
If you lose … You need … 1% 5% 10%
–10% 11.1% 10.6 2.2 1.1
–25% 33.3% 28.9 5.9 3
–50% 100% 69.7 14.2 7.3
–60% 150% 92.1 18.8 9.6
–80% 400% 161.7 33 16.9Source: Wells Fargo Investment Institute, December 31, 2016. For illustrative purposes only. There is no guarantee it will be possible to break even. Past performance is no guarantee of future results.
© 2017 Investment Management Consultants Association Inc. Reprinted with permission. All rights reserved.
MAY / JUNE 2017 35
FEATURE | helping invesTors run Their BesT raCe
plan and knowing objectively ahead of time that hitting the wall is inevitable can help investors finish the race.
It’s up to investors to choose which race they want to run. Having a coach to help them stay the course, align their invest-ments to their plans, and review progress regularly can increase the likelihood that they finish the race—on pace and in line with their goals.
Zar Toolan is head of advice quality for
Wells Fargo Advisors. He earned a BS in
mechanical engineering from Columbia
University in the City of New York and an
MBA in finance from William & Mary. Contact
him at [email protected].
ReferenceMcMillion, Tracie. 2016. Global Investment Strategy: What
Do You Want Your Money to Do for You? Wells Fargo Investment Institute (October 24). www.wellsfargo advisors.com.
To take the CE quiz online, visit www.IMCA.org/IWMquiz
Index Definitions
Hypothetical Moderate Growth & Income Portfolio (3 Asset Groups): Bloomberg Barclays U.S. Treasury Bills (1–3M): 3%, Bloomberg Barclays U.S. Aggregate (1–3Y): 4%, Bloomberg Barclays U.S. Aggregate (5–7Y): 16%, Bloomberg Barclays U.S. Aggregate (10+Y): 7%, JPM GBI Global Ex-US: 3%, Bloomberg Barclays U.S. Corporate High-Yield Bond: 6%, JPM EMBI Global Index: 5%, FTSE EPRA/NAREIT Developed: 5%, S&P 500: 21%, Russell Midcap®: 9%, Russell 2000®: 8%, MSCI EAFE: 6%, MSCI Emerging Markets: 5%, Bloomberg Commodity: 2%
Hypothetical 60%/40% Portfolio: 60% S&P 500 Index, 40% Bloomberg Barclays Aggregate Bond Index
Performance results for the Moderate Growth & Income and the 60/40 Portfolios are hypothetical and for illustrative pur-poses only. Hypothetical results do not represent actual trading and the results achieved do not represent the experience of any individual investor. In addition, hypothetical results do not reflect the impact of any fees, expenses or taxes applicable to an actual investment. The indices reflect the historical perfor-mance of the represented assets and assume the reinvestment of dividends and other distributions. An index is unmanaged and not available for direct investment. Hypothetical and past performance does not guarantee future results. Different investments offer different levels of potential return and market risk. Please see below for the definitions and risks associated with the representative indices.
Bloomberg Barclays U.S. Aggregate Bond Index is unmanaged and is composed of the Bloomberg Barclays U.S. Government/Credit Index and the Bloomberg Barclays U.S. Mortgage- Backed Securities Index, and includes Treasury issues, agency issues, corporate bond issues, and mortgage-backed securities. The Bloomberg Barclays U.S. Government/Credit Bond Index is an unmanaged, market-weighted index generally representative of intermediate and long-term government and investment grade corporate debt securities having maturities of greater than one year. The Bloomberg Barclays U.S. Mortgage
Figure 5: 2015 Performance Differences
Source: Findings based on Investment Performance-Deep Dive, May 2016. The study was undertaken to provide client information and analytics relating to 401(k) and IRA accounts that are overseen by Wells Fargo and Wells Fargo Advisors. Wells Fargo offers both full-service brokerage IRAs and 401(k) plan administration, two platforms that they have com-pared on the basis of relative performance and cost. In an internal study, they took five-year (2011–2015) and eight-year (2008–2015) performance numbers for IRA accounts and for 401(k) plan participants and compared them on the basis of age, size, and allocation choices in an effort to understand if and how the platform may impact the client’s net returns.
6.0% 6.26% 6.07%
5.56%5.15% 5.22%
5.91% 5.95% 5.91%
5.30%
4.34%
3.37%
0%
1%
2%
3%
4%
5%
6%
7%
25–34 35–44 45–54 55–64 65–74 75+
25–34 35–44 45–54 55–64 65–74 75+
25–34 35–44 45–54 55–64 65–74 75+
Age Bands
5-Ye
ar N
et T
ime-
Wei
ghte
d R
etur
ns
IRA 401(k)
IRA 401(k)
IRA 401(k)
Aver
age
Equi
ty A
lloca
tion
77% 77% 74%67%
61% 57%
72% 69% 65%55%
47% 42%
0%
50%
100%
11% 9% 9% 10% 9% 8%19% 20% 20% 24% 28%
35%
0%
50%
100%
Aver
age
Cas
h Al
loca
tion
Backed Securities Index is an unmanaged index of mortgage pools of the Government National Mortgage Association, Federal Home Loan Mortgage Corporation and Federal National Mortgage Association.
Short Term Fixed Income: Bloomberg Barclays U.S. Aggregate 1–3 Year Bond Index is unmanaged and is composed of the Bloomberg Barclays U.S. Government/Credit Index and the Bloomberg Barclays U.S. Mortgage-Backed Securities Index, and includes Treasury issues, agency issues, corporate bond issues, and mortgage-backed securities with maturities of 1–3 years.
Intermediate Term Fixed Income: Bloomberg Barclays U.S. Aggregate 5–7 Year Bond Index is unmanaged and is composed of the Bloomberg Barclays U.S. Government/Credit Index and the Bloomberg Barclays U.S. Mortgage-Backed Securities Index, and includes Treasury issues, agency issues, corporate bond issues, and mortgage-backed securities with
maturities of 5–7 years.
Long Term Fixed Income: Bloomberg Barclays U.S. Aggregate
10+ Year Bond Index is unmanaged and is composed of the
Bloomberg Barclays U.S. Government/Credit Index and the
© 2017 Investment Management Consultants Association Inc. Reprinted with permission. All rights reserved.

INVESTMENTS&WEALTH MONITOR36
FEATURE | helping invesTors run Their BesT raCe
Republic, Egypt, Greece, Hungary, India, Indonesia, Korea,
Malaysia, Mexico, Peru, Philippines, Poland, Qatar, Russia, South
Africa, Taiwan, Thailand, Turkey, and United Arab Emirates.
U.S. Small Cap Equities: Russell 2000® Index measures the
performance of the 2,000 smallest companies in the Russell
3000® Index, which represents approximately 8% of the total
market capitalization of the Russell 3000 Index.
Russell 3000® Index measures the performance of the 3,000
largest U.S. companies based on total market capitalization,
which represents approximately 98% of the investable U.S.
equity market.
U.S. Mid Cap Equities: Russell Midcap® Index measures the
performance of the 800 smallest companies in the Russell
1000 Index, which represent approximately 25% of the total
market capitalization of the Russell 1000® Index.
Russell 1000® Index measures the performance of the 1,000
largest companies in the Russell 3000 Index, which represents
approximately 92% of the total market capitalization of the
Russell 3000 Index.
U.S. Large Cap Equities: S&P 500 Index is a market capitalization-
weighted index composed of 500 widely held common stocks
that is generally considered representative of the US stock market.
Asset Class Risks
Asset allocation is an investment method used to help manage
risk. It does not ensure a profit or protect against a loss.
Bonds: Investments in fixed-income securities are subject to
market, interest rate, credit and other risks. Bond prices fluctu-
sovereign and quasi-sovereign debt. While products in the
asset class have become more diverse, focusing on both local
currency and corporate issuance, there is currently no widely
accepted aggregate index reflecting the broader opportunity
set available, although the asset class is evolving. By using the
same index provider as the one used in the developed-market
bonds asset class, there is consistent categorization of countries
among developed international bonds (ex. U.S.) and emerging
market bonds.
Developed Market Ex-U.S. Fixed Income: JPMorgan Global Ex
United States Index (JPM GBI Global Ex-US) is a total return,
market capitalization weighted index, rebalanced monthly,
consisting of the following countries: Australia, Germany,
Spain, Belgium, Italy, Sweden, Canada, Japan, United Kingdom,
Denmark, Netherlands, and France.
Developed Market Ex-U.S. Equities: MSCI EAFE Index (Europe,
Australasia, Far East) Index (MSCI EAFE) is a free float-
adjusted market capitalization index designed to measure the
equity market performance of developed markets, excluding
the U.S. and Canada. The index consists of the following 21
developed-market country indexes: Australia, Austria, Belgium,
Denmark, Finland, France, Germany, Hong Kong, Ireland,
Israel, Italy, Japan, the Netherlands, New Zealand, Norway,
Portugal, Singapore, Spain, Sweden, Switzerland, and the
United Kingdom.
Emerging Market Equities: MSCI Emerging Markets Index
(MSCI EM) is a free float-adjusted market capitalization index
designed to measure equity market performance of emerging
markets. The index consists of the following 23 emerging
market country indexes: Brazil, Chile, China, Colombia, Czech
Bloomberg Barclays U.S. Mortgage-Backed Securities Index, and includes Treasury issues, agency issues, corporate bond
issues, and mortgage-backed securities with maturities of
10 years or more.
High Yield Fixed Income: Bloomberg Barclays U.S. Corporate
High-Yield Bond Index covers the U.S. dollar-denominated,
non-investment grade, fixed-rate, taxable corporate bond
market. Securities are classified as high-yield if the middle
rating of Moody’s, Fitch, and S&P is Ba1/BB+/BB= or below.
Included issues must have at least one year until final maturity.
Cash Alternatives/Treasury Bills: Bloomberg Barclays U.S. Trea-
sury Bills (1–3M) Index is representative of money markets.
Commodities: Bloomberg Commodity Index is a broadly diver-
sified index comprised of 22 exchange-traded futures on physi-
cal commodities and represents 20 commodities weighted to
account for economic significance and market liquidity.
Public Real Estate: FTSE EPRA/NAREIT Developed Index is
designed to track the performance of listed real-estate
companies and REITs in developed countries worldwide.
Hedge Funds: HFRI Fund Weighted Index is a fund-weighted
(equal-weighted) index designed to measure the total returns
(net of fees) of the approximately 2,000 hedge funds that
comprise the Index. Constituent funds must have either
$50 million under management or a track record of greater
than 12 months. Sub-strategies include: HFRI Event-Driven,
Distressed/Restructuring Index, and HFRI Event-Driven
(Total) Index.
Emerging Market Fixed Income: JPMorgan EMBI Global Index
is a U.S. dollar-denominated, investible, market cap-weighted
index representing a broad universe of emerging market Continued on page 54 ➧
Thank you to IMCA’s 2017 Annual Conference Experience—ACE 2017 Partners & Sponsors
PLATINUM PARTNERS
GOLD PARTNERS
SILVER PARTNERS
CONFERENCE SPONSORS
Thank you to IMCA’s 2017 Annual Conference Experience—ACE 2017 Partners & Sponsors
PLATINUM PARTNERS
GOLD PARTNERS
SILVER PARTNERS
CONFERENCE SPONSORS
© 2017 Investment Management Consultants Association Inc. Reprinted with permission. All rights reserved.

INVESTMENTS&WEALTH MONITOR54
ate inversely to changes in interest rates. Therefore, a general
rise in interest rates can result in the decline in the bond’s
price. Because bond prices generally fall as interest rates rise,
the current low interest rate environment can increase the
bond’s interest rate risk. Credit risk is the risk that an issuer
will default on payments of interest and principal. This risk is
higher when investing in high yield bonds, also known as junk
bonds, which have lower ratings and are subject to greater
volatility. If sold prior to maturity, fixed income securities are
subject to market risk. All fixed income investments may be
worth less than their original cost upon redemption or maturity.
Commodities: Investing in commodities is not suitable for
all investors. Exposure to the commodities markets may
subject an investment to greater share price volatility than an
investment in traditional equity or debt securities. Investments
in commodities may be affected by changes in overall market
movements, commodity index volatility, changes in interest
rates or factors affecting a particular industry or commodity.
Products that invest in commodities may employ more complex
strategies which may expose investors to additional risks.
Foreign: Foreign investing involves risks not typically associated
with U.S. investing, including currency fluctuations, political in-
stability, uncertain economic conditions and different accounting
standards. These risks are heightened in emerging markets.
Hedge Funds: Hedge funds trade in diverse complex strategies
that are affected in different ways and at different times by
changing market conditions. Investing in hedge funds involves
the risks inherent in an investment in securities, as well as
specific risks associated with limited liquidity, the use of
leverage, short sales, options, futures, derivative instruments,
and investments in non-U.S. securities, “junk” bonds, illiquid
investments and arbitrage methodologies.
REITs: There are special risks associated with an investment in
real estate, including the possible illiquidity of the underlying
properties, credit risk, interest rate fluctuations and the impact
of varied economic conditions.
Stocks: Stocks are subject to market risk which means their val-
ue may fluctuate in response to general economic and market
conditions, the prospects of individual companies, and industry
sectors. The prices of small/mid-company stocks are generally
more volatile than large company stocks. They often involve
higher risks because of smaller and mid-sized companies may
lack the management expertise, financial resources, product
diversification and competitive strengths to endure adverse
economic conditions.
Wells Fargo Investment Institute, Inc. is a registered investment
adviser and wholly-owned subsidiary of Wells Fargo & Compa-
ny and provides investment advice to Wells Fargo Bank, N.A.,
Wells Fargo Advisors and other Wells Fargo affiliates. Wells
Fargo Bank, N.A. is a bank affiliate of Wells Fargo & Company.
Wells Fargo Advisors is registered with the U.S. Securities
Exchange Commission and the Financial Industry Regulatory
Authority, but is not licensed or registered with any financial
services regulatory authority outside of the U.S. Non-U.S. res-
idents who maintain U.S.-based financial services account(s)
with Wells Fargo Advisors may not be afforded certain protec-
tions conferred by legislation and regulations in their country
of residence in respect of any investments, investment transac-
tions or communications made with Wells Fargo Advisors.
Wells Fargo Advisors is a trade name used by Wells Fargo Clear-
ing Services, LLC and Wells Fargo Advisors Financial Network,
LLC, Members SIPC, separate registered broker-dealers and non-
bank affiliates of Wells Fargo & Company. CAR 0317-02050
©2017 Wells Fargo Clearing Services, LLC. All rights reserved.
HELPING INVESTORS RUN THEIR BEST...Continued from page 36
© 2017 Investment Management Consultants Association Inc. Reprinted with permission. All rights reserved.
Related Documents