“Help Wanted”: Demographics, Labour Supply and Economic Change in Newfoundland and Labrador Keith Storey Keith Storey Harris Centre, Memorial University, St. John’s, Newfoundland, Canada

Welcome message from author
This document is posted to help you gain knowledge. Please leave a comment to let me know what you think about it! Share it to your friends and learn new things together.
Transcript

“Help Wanted”: Demographics, Labour Supply and Economic Change in Newfoundland and Labrador
Keith StoreyKeith StoreyHarris Centre, Memorial University, St. John’s, Newfoundland, Canada

“Help Wanted”: Demographics, Labour Supply and Economic Change in Newfoundland and Labrador
Leslie Harris Centre of Regional Policy and Development (The Harris Centre), Memorial U i itUniversity• co-ordinates/facilitates Memorial University’s activities
relating to regional policy and developmentrelating to regional policy and development• advises on building the University’s capacity and
identifies priority themes and projects relating to: teaching, research and outreach
• http://www.mun.ca/harriscentre/index.php

“Help Wanted”: Demographics, Labour Supply and Economic Change in Newfoundland and Labrador
Over the medium to long term, labour shortages associated with population decline and aging are among the most significant labour market challenges facing N f dl d d L b dNewfoundland and Labrador
Canada-Newfoundland and LabradorLabour Market AgreementLabour Market Agreement
2009-10 Annual Plan
“Help Wanted”: Demographics, Labour Supply and Economic Change in Newfoundland and Labrador
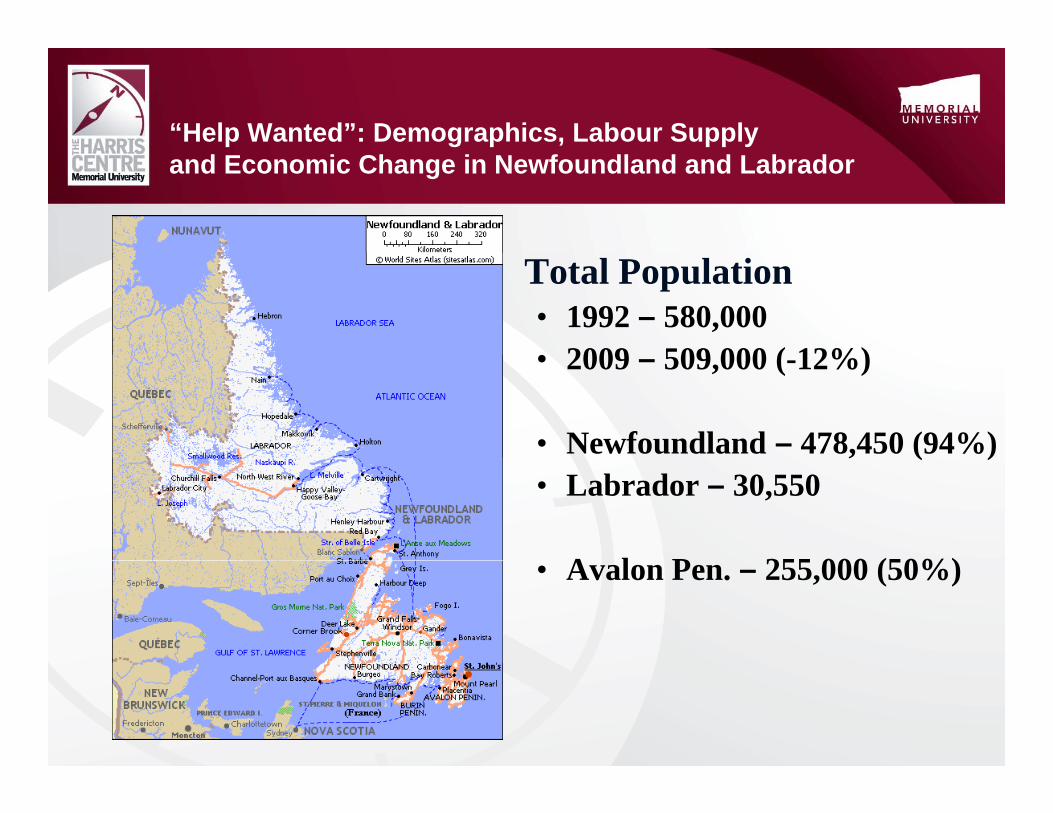
Total Population • 1992 – 580,000• 2009 509 000 ( 12%)• 2009 – 509,000 (-12%)
• Newfoundland – 478,450 (94%), ( )• Labrador – 30,550
A l P 255 000 (50%)• Avalon Pen. – 255,000 (50%)
“Help Wanted”: Demographics, Labour Supply and Economic Change in Newfoundland and Labrador
• Natural population change• Natural population change• TFR declined since 1960s
C t f tilit 1 3 l t i C d• Current fertility 1.3 – lowest in Canada• Births
1960 15 000• 1960s – 15,000 per annum• 2008 – 4,300
• Deaths• Deaths• 1960s – 3,000 per annum• 2008 – 4 500• 2008 – 4,500

“Help Wanted”: Demographics, Labour Supply and Economic Change in Newfoundland and Labrador
Source: http://www.economics.gov.nl.ca/pdf2007/regionaldemographicprofiles.pdf

“Help Wanted”: Demographics, Labour Supply and Economic Change in Newfoundland and Labrador
Net migration 1972-2007g
Source: http://www.economics.gov.nl.ca/pdf2007/regionaldemographicprofiles.pdf

“Help Wanted”: Demographics, Labour Supply and Economic Change in Newfoundland and Labrador
• Age Structure• Age Structure• Rapidly aging population
• 1971 median age 20.9 • 2008 median age 42.0

“Help Wanted”: Demographics, Labour Supply and Economic Change in Newfoundland and Labrador
Population Pyramids Newfoundland and Labrador
1992
Population Pyramids Newfoundland and Labrador
1992
2007
Source: http://www.economics.gov.nl.ca/pdf2007/regionaldemographicprofiles.pdf

“Help Wanted”: Demographics, Labour Supply and Economic Change in Newfoundland and Labrador
• Geographic distribution shiftsl d li• rural – decline
• urban – stable/growing

Population shift:
-- away from rural coastal communities, to
-- urban centres along Trans-Canada Highway
Source: http://www.economics.gov.nl.ca/pdf2007/regionaldemographicprofiles.pdf
“Help Wanted”: Demographics, Labour Supply and Economic Change in Newfoundland and Labrador
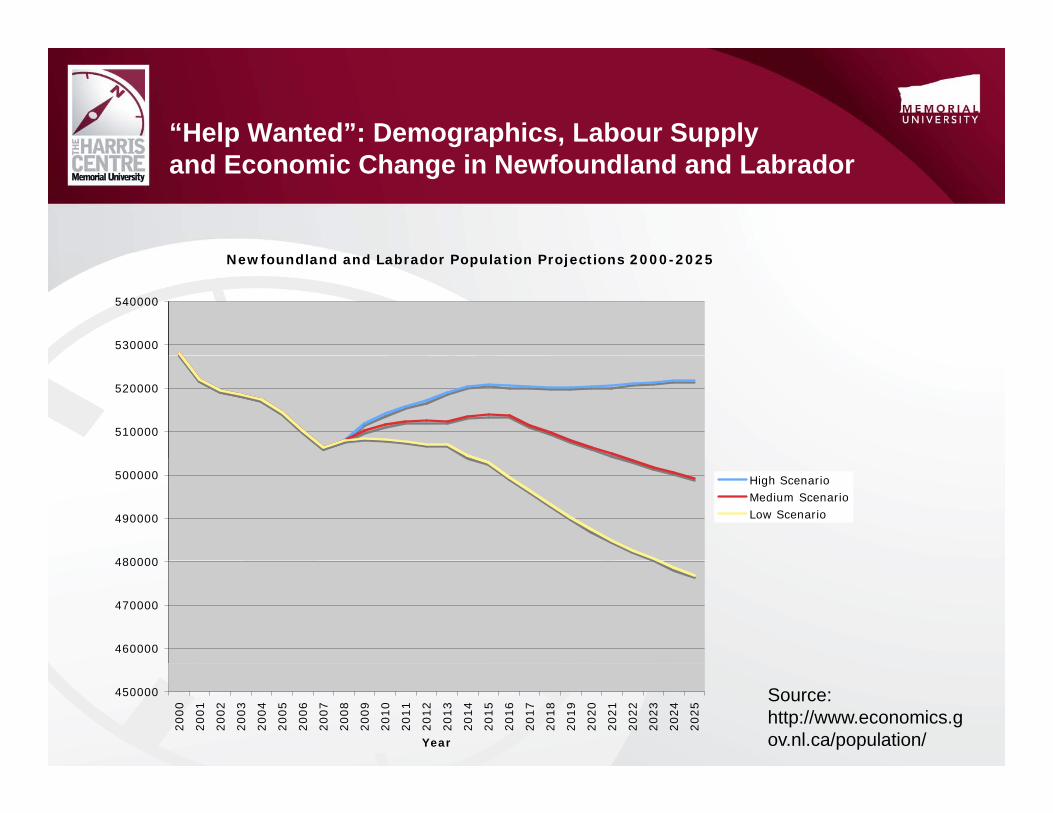
Newfoundland and Labrador Population Projections 2000-2025
530000
540000
510000
520000
480000
490000
500000 High ScenarioMedium ScenarioLow Scenario
460000
470000
480000
450000
2000
2001
2002
2003
2004
2005
2006
2007
2008
2009
2010
2011
2012
2013
2014
2015
2016
2017
2018
2019
2020
2021
2022
2023
2024
2025
Year
Source: http://www.economics.gov.nl.ca/population/

“Help Wanted”: Demographics, Labour Supply and Economic Change in Newfoundland and Labrador
Implications• Labour Markets – demand/supply imbalancesLabour Markets demand/supply imbalances• Business Sector – shifting spending/needs• Health Care – home support, pharmaceuticalsHealth Care home support, pharmaceuticals• Education – declining enrolments• Municipalities – declining revenue basep g• Regional Economic Development – declining
rural population, loss of entrepreneurs/ volunteers

“Help Wanted”: Demographics, Labour Supply and Economic Change in Newfoundland and Labrador
Labour Market Conditions – Canada• Construction sectorConstruction sector
• 150,000 new entrants required 2005-2014• mostly to replace retirees
• Mining Sector• 40% plan retirement by 2014
27 500 70 800 h f ll 2004 2014• 27,500-70,800 shortfall 2004-2014• NL demographics means provincial
retirement/replacement needs greateret e e t/ ep ace e t eeds g eate

“Help Wanted”: Demographics, Labour Supply and Economic Change in Newfoundland and Labrador
Labour Market Strategies
• Fertility rates • Immigration• Youth attraction and retention• Education and training
Unemplo ment red ction/participation increases• Unemployment reduction/participation increases
“Help Wanted”: Demographics, Labour Supply and Economic Change in Newfoundland and Labrador
Fertility Rates
• 2007 NL government pro-natalist policy• $4.5m budget
$1 000 bi th/ d ti• $1,000 per birth/adoption• $100/month parental leave subsidy• daycare developmenty p
• Effectiveness• Too early to say• Quebec c. 14.6% increase in births, cost $15,000 per
child (Milligan 2002)

“Help Wanted”: Demographics, Labour Supply and Economic Change in Newfoundland and Labrador
Immigration
• Canada 18% foreign born• 400,000/a at peak in early 1900s• 225,000/a current average, g• 75% immigrants to Toronto (43%), Montreal, Vancouver
• Atlantic Provinces• 7 6% population 1 2% immigrants• 7.6% population, 1.2% immigrants
• Newfoundland and Labrador• 1.6% population, 0.16% immigrants

“Help Wanted”: Demographics, Labour Supply and Economic Change in Newfoundland and Labrador
Immigration
• Immigrants more highly educated• Immigrants more highly educated• 90% in skilled worker category have post-secondary education• 43% Canadians
40% h i it d ti• 40% have a university education• 20% Canadians
• Immigrants younger• 86% of immigrants to NL under 44• 40% under 24
• Retention rate• NL immigrants 36%

“Help Wanted”: Demographics, Labour Supply and Economic Change in Newfoundland and Labrador
Newfoundland and Labrador Immigrants 1999 2008Newfoundland and Labrador Immigrants 1999-2008
16001800
100012001400 Immigrants
International
400600800
InternationalStudentsTemporaryWorkers
0200
1999 2001 2003 2005 20071999 2001 2003 2005 2007
Source: Citizenship and Immigration Canada 2008

“Help Wanted”: Demographics, Labour Supply and Economic Change in Newfoundland and Labrador
Immigration Challenges for NL
• no large urban areas• few family, friends, contacts• few employment opportunities• few employment opportunities• recognition of credentials• lack of knowledge about NLg• misperceptions about NL• no incentives to settle in NL

“Help Wanted”: Demographics, Labour Supply and Economic Change in Newfoundland and Labrador
Immigration Strategy
• March 2007 NL immigration strategy launched• Diversity ~ Opportunity and Growth• $6m allocated• $4.1m promotion of NL as a destination• $1.9m to support immigration initiatives
• health coverage for students• ESL training• strengthen Provincial Nominee Program

“Help Wanted”: Demographics, Labour Supply and Economic Change in Newfoundland and Labrador
Youth attraction and retention
• Priority for most NL stakeholders• June 2008
• Youth Retention and Attraction Strategy planning• Youth Retention and Attraction Strategy planning• objective: make NL a province of choice for young
adults• Youth Advisory Panel, Ministerial Committee• dialogue sessions, youth summit
• Fall 2009• Fall 2009• release of Youth Retention and Strategy Policy

“Help Wanted”: Demographics, Labour Supply and Economic Change in Newfoundland and Labrador
Education and trainingEducation and training
• adult literacy (Level 3 or higher)y ( g )• Canada 52% NL 45%
• not completed high school• Canada 15% NL 26%
• some post-secondary education• Canada 61% NL 54 8 %• Canada 61% NL 54.8 %
• university graduation • Canada 19% NL 12%*
• college/trade post-secondary certification• Canada 31% NL 33%

“Help Wanted”: Demographics, Labour Supply and Economic Change in Newfoundland and Labrador
Unemployment reduction/participation increases
• Highest unemployment rate in the country• Canada 8.7%
NL 15 6%*• NL 15.6%*(* more seasonal workers than elsewhere)
• Low participationow p c p o• Canada 67.3%• NL 59.3%

“Help Wanted”: Demographics, Labour Supply and Economic Change in Newfoundland and Labrador
Labour Market trends 2003-2008
l t i 3 8%• employment increases 3.8%• unemployment decreases 16.5-13.2%• growth in full-time employment• employment growth outpaces labour force growth• productivity increases• wage rates increasewage rates increase• labour force participation increases• employment insurance usage decreases
i di it i• economic diversity increases

“Help Wanted”: Demographics, Labour Supply and Economic Change in Newfoundland and Labrador
• 2003-2008• Labour outmigration - Alberta• Labour shortages

“Help Wanted”: Demographics, Labour Supply and Economic Change in Newfoundland and Labrador
Labour Market trends 2008-2017
• NL overall did not suffer 2008 downturn as badly as other places• St. John’s shows continued strong growthSt. John s shows continued strong growth• Rural NL significant job losses in forestry and fishery
• Strong economic projections for medium-long term• Public/private investments – Vale Inco nickel smelter,
Hebron offshore oil field, Lower Churchill Hydro projectp j
• 9,000 new jobs in peak construction phases

“Help Wanted”: Demographics, Labour Supply and Economic Change in Newfoundland and Labrador
Labour Market Challenges
• increasing job skills and changing job demands• downward industry adjustments
• primary resource sector forestry fishery• primary resource sector – forestry, fishery• limited HR planning capacity• underrepresented marginalized groupsunderrepresented marginalized groups
• women, aboriginals, low-skilled, displaced

“Help Wanted”: Demographics, Labour Supply and Economic Change in Newfoundland and Labrador
Labour Market Priorities
• $10.75m investment 2009-10• strategic training and skills development $5.5m
• displaced workersdisplaced workers• apprenticeship support $2.0m
• training/work experience towards journeyman status• employment and development supports and services $2 6m• employment and development supports and services $2.6m
• preparation for, finding, maintaining employment

“Help Wanted”: Demographics, Labour Supply and Economic Change in Newfoundland and Labrador
Outstanding questions
• Will the labour force strategies deliver?• Which offer the best hopes?Which offer the best hopes?• Will future development be constrained?
Related Documents