Plot‐Scale Monitoring to Determine Effectiveness of Individual Water Quality Practices Matthew Helmers Dean’s Professor, College of Ag. & Life Sciences Professor, Dept. of Ag. and Biosystems Eng. Iowa State University Department of Agricultural and Biosystems Engineering

Welcome message from author
This document is posted to help you gain knowledge. Please leave a comment to let me know what you think about it! Share it to your friends and learn new things together.
Transcript

Plot‐Scale Monitoring to Determine Effectiveness of Individual Water Quality Practices
Matthew HelmersDean’s Professor, College of Ag. & Life Sciences Professor, Dept. of Ag. and Biosystems Eng.
Iowa State University
Department of Agricultural and Biosystems Engineering
NWRF DrainageGilmore City DRF
NERF Drainage
COBS
SERF Drainage
Replicated subsurface drainage plots to evaluate performance of various in-field management practices
Department of Agricultural and Biosystems Engineering
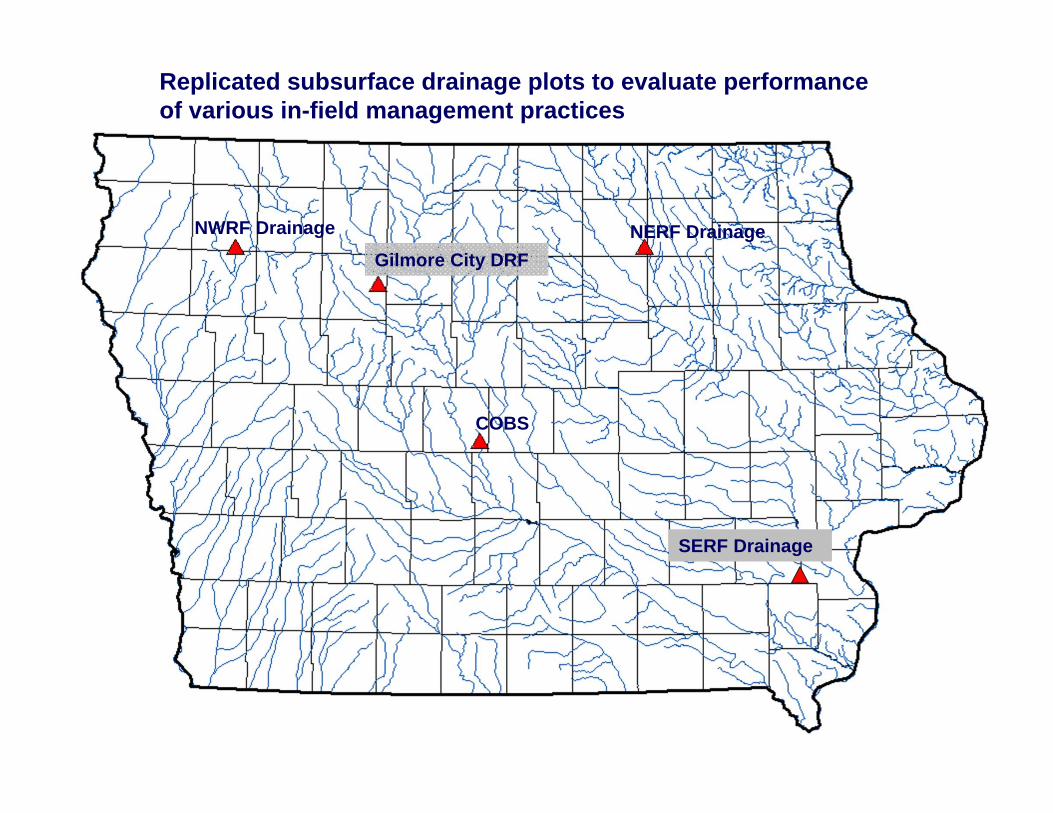
Plot Sampling Layout
125 ft
50 ft
Perforated border tile -drains to remote outlet
Flow monitoring sump(three drain lines in each sump)
Treatment plot
125 ft
50 ft
Perforated border tile -drains to remote outlet
Flow monitoring sump(three drain lines in each sump)
Treatment plot
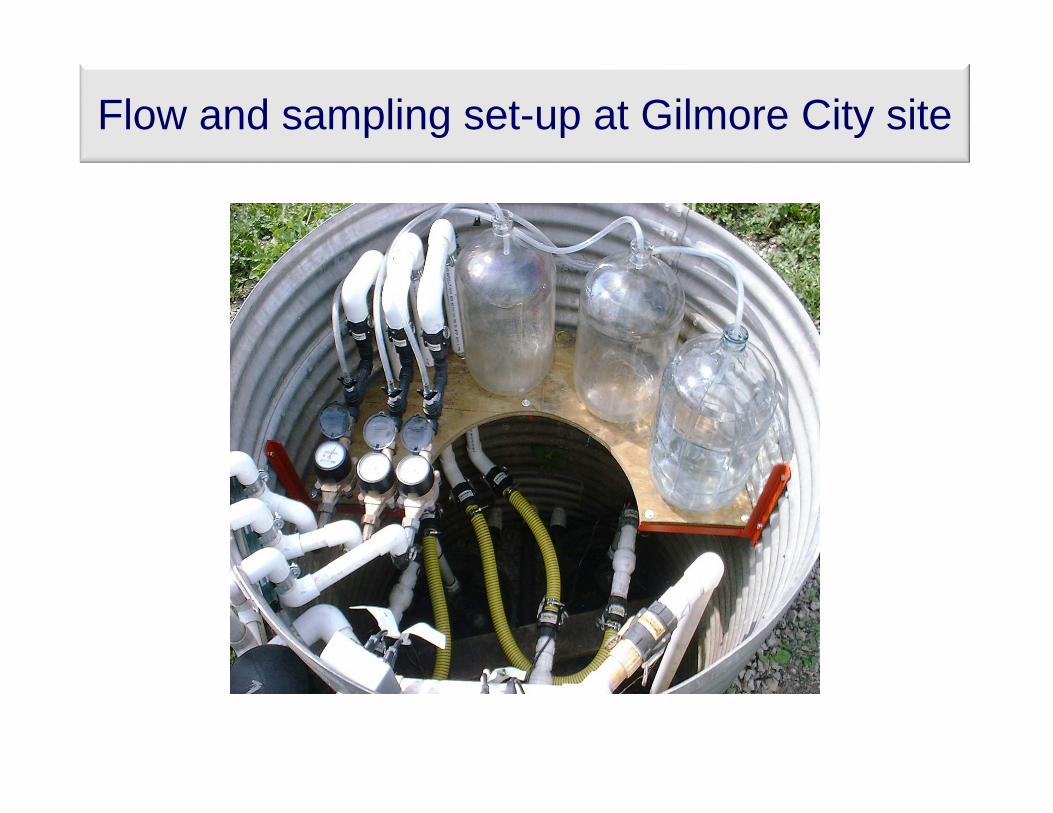
Flow and sampling set-up at Gilmore City site

Timing of Subsurface Drainage (1990-2011)
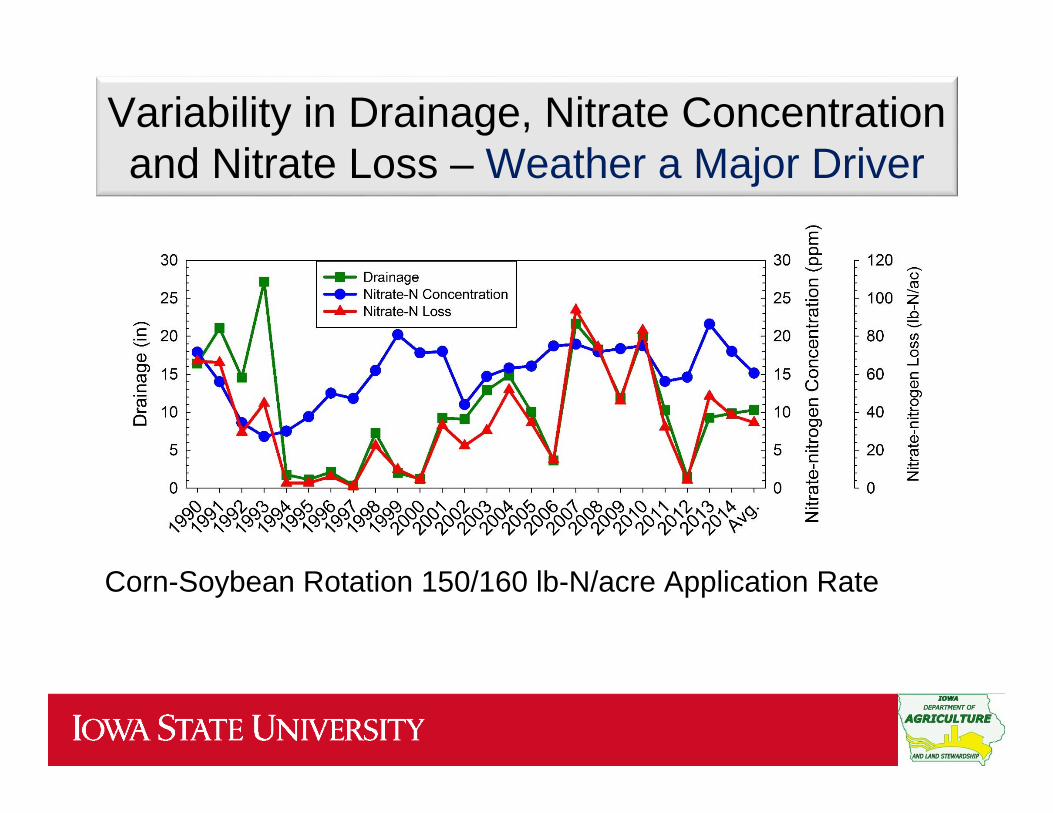
Corn-Soybean Rotation 150/160 lb-N/acre Application Rate
Variability in Drainage, Nitrate Concentration and Nitrate Loss – Weather a Major Driver
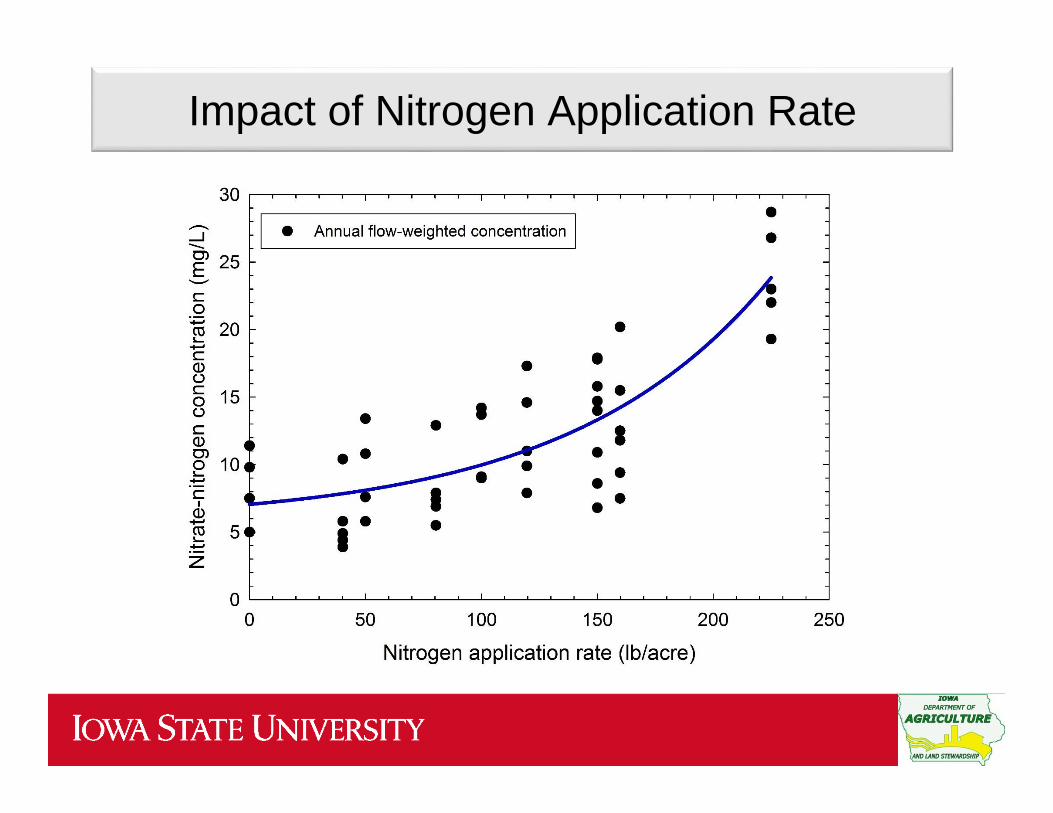
Impact of Nitrogen Application Rate
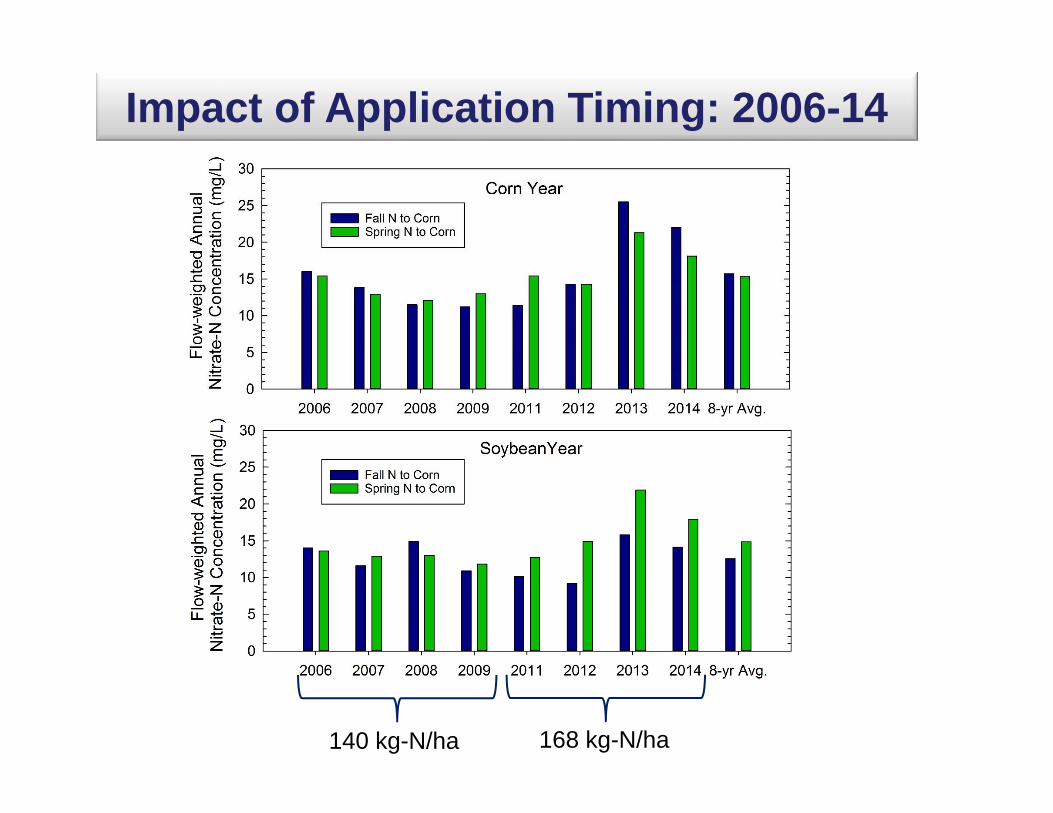
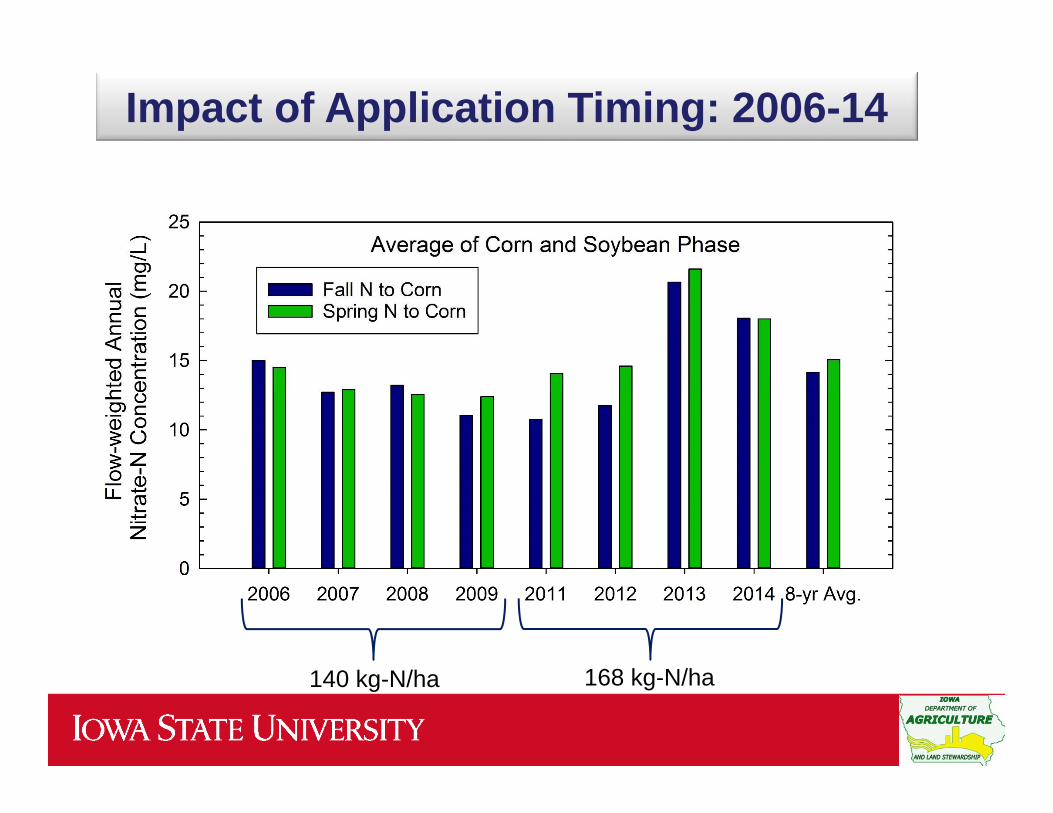
Impact of Application Timing: 2006-14
140 kg-N/ha 168 kg-N/ha
Impact of Application Timing: 2006-14
140 kg-N/ha 168 kg-N/ha

Impact of Nitrogen Source – 168kg-N/ha
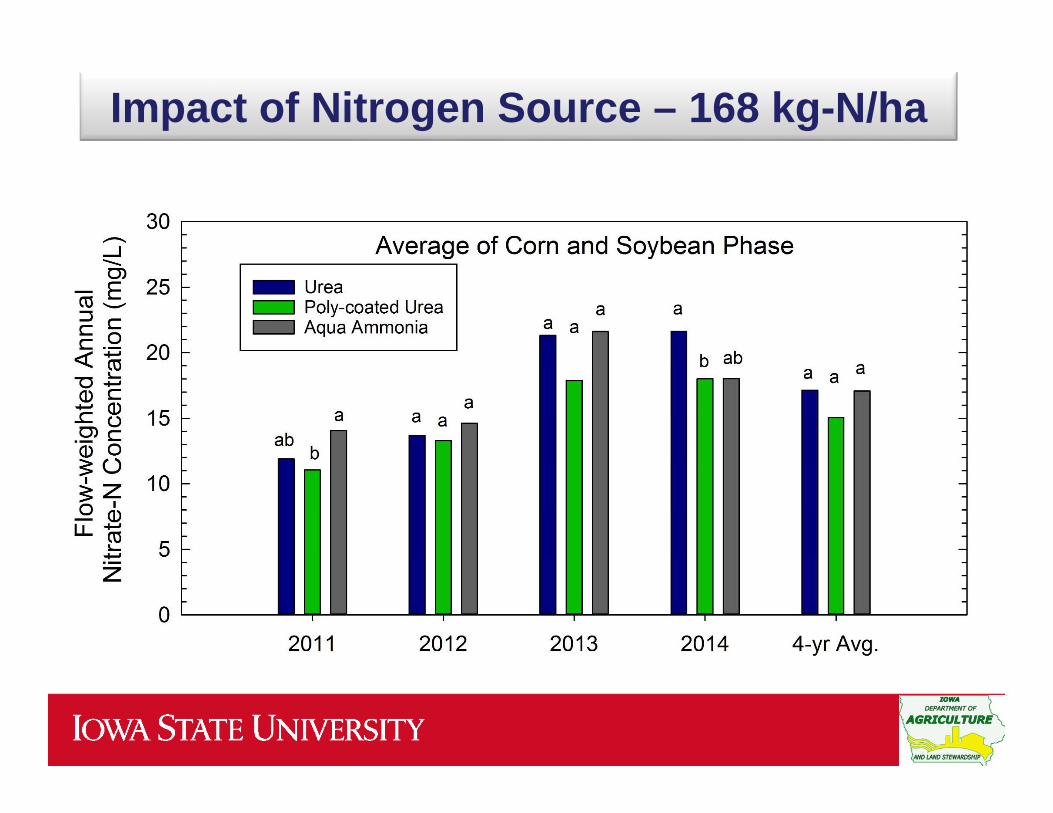
Impact of Nitrogen Source – 168 kg-N/ha
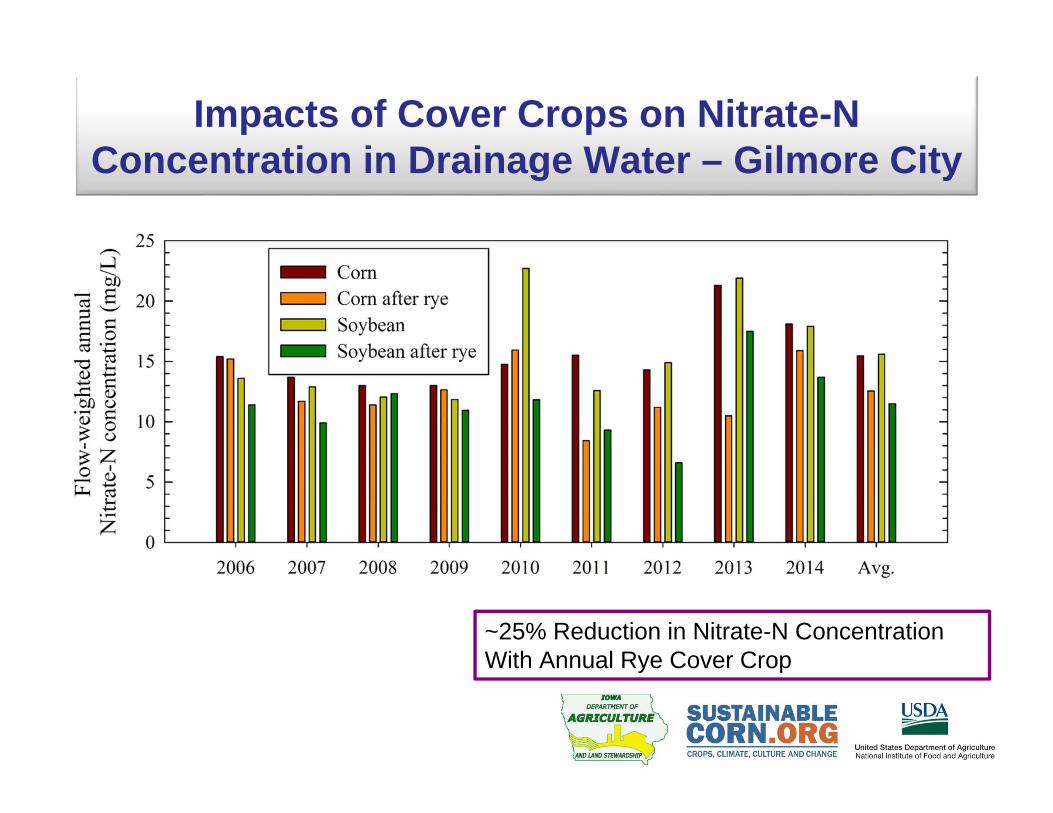
Impacts of Cover Crops on Nitrate-N Concentration in Drainage Water – Gilmore City
~25% Reduction in Nitrate-N Concentration With Annual Rye Cover Crop
Using Prairie Strips to Reduce Sediment and Nutrient Loss
prairiestrips.org
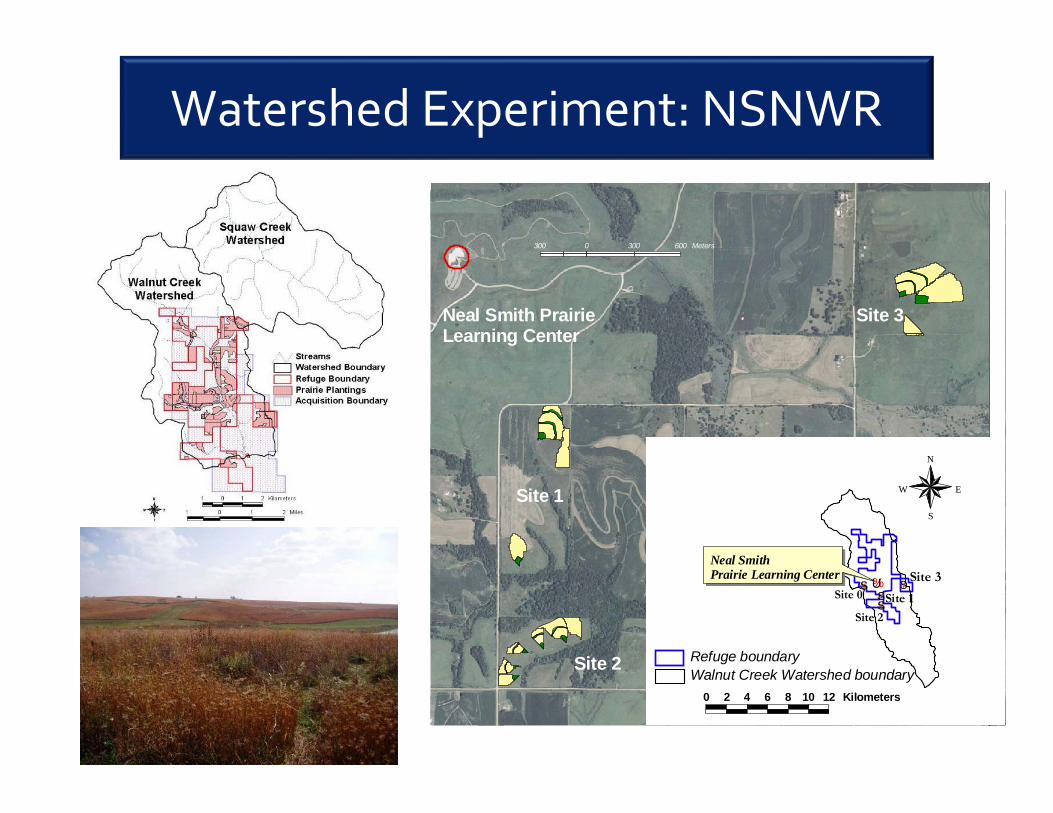
Watershed Experiment: NSNWR
Neal Smith Prairie Learning Center
Site 1
Site 2
Site 3
#S#S#S
#SSite 1
Site 2
Site 3Site 0
%U
Neal Smith Prairie Learning Center
0 2 4 6 8 10 12 Kilometers
N
EW
S
300 0 300 600 Meters
Walnut Creek Watershed boundaryRefuge boundary
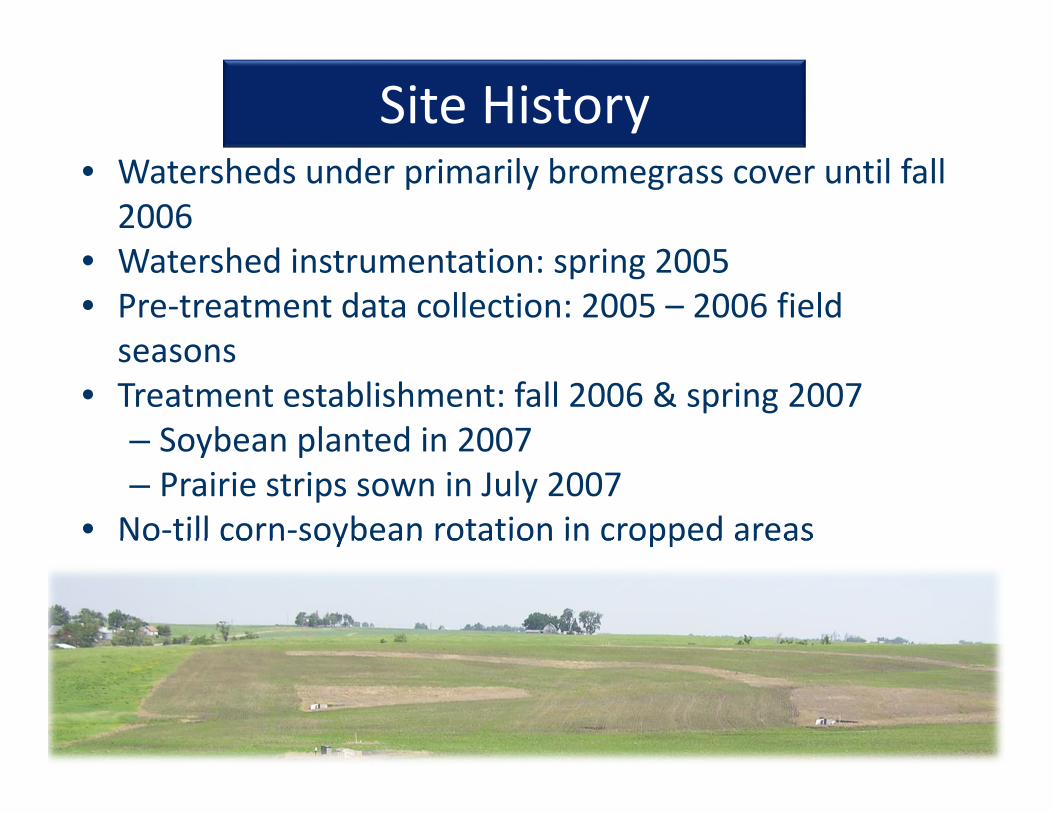
Site History• Watersheds under primarily bromegrass cover until fall 2006
• Watershed instrumentation: spring 2005• Pre‐treatment data collection: 2005 – 2006 field seasons
• Treatment establishment: fall 2006 & spring 2007– Soybean planted in 2007– Prairie strips sown in July 2007
• No‐till corn‐soybean rotation in cropped areas

reconstructed prairie
corn - soybean row crops, ZERO TILLAGE
Experimental Watershed Treatments
12 watersheds: Balanced Incomplete Block Design:
3 reps X 4 treatments X 3 blocks
0% 10% 10% 20%
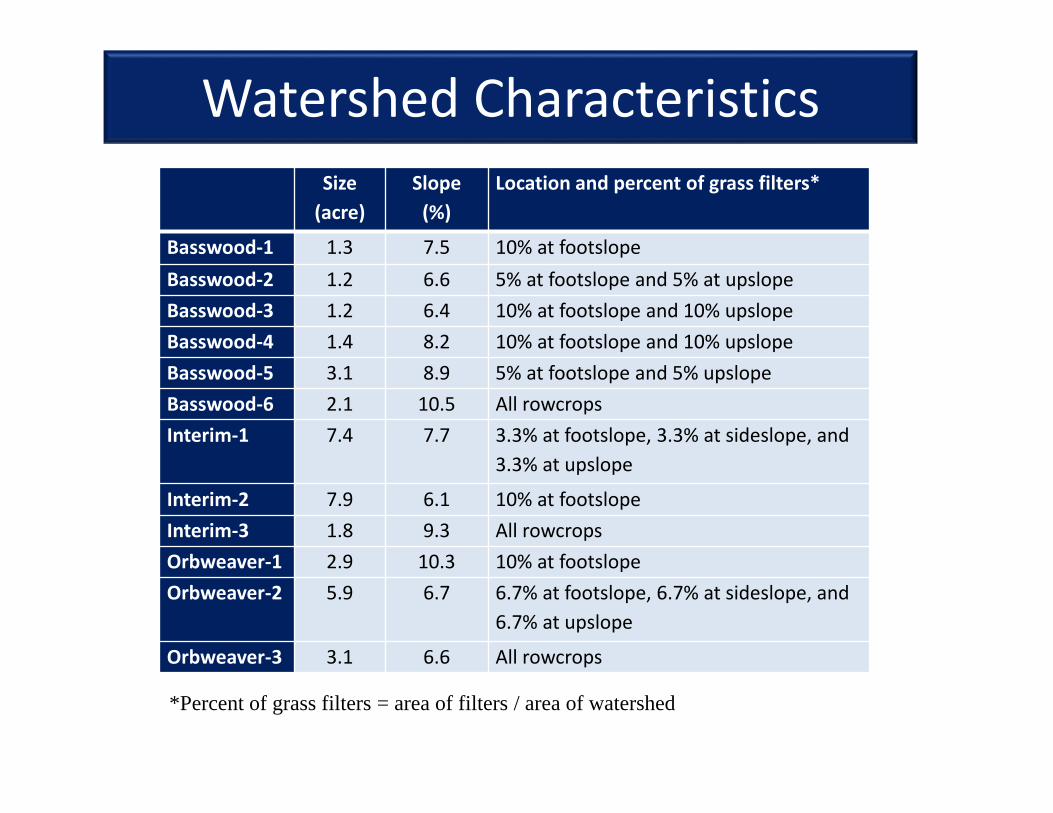
Watershed CharacteristicsSize (acre)
Slope (%)
Location and percent of grass filters*
Basswood‐1 1.3 7.5 10% at footslopeBasswood‐2 1.2 6.6 5% at footslope and 5% at upslopeBasswood‐3 1.2 6.4 10% at footslope and 10% upslopeBasswood‐4 1.4 8.2 10% at footslope and 10% upslopeBasswood‐5 3.1 8.9 5% at footslope and 5% upslopeBasswood‐6 2.1 10.5 All rowcropsInterim‐1 7.4 7.7 3.3% at footslope, 3.3% at sideslope, and
3.3% at upslope
Interim‐2 7.9 6.1 10% at footslopeInterim‐3 1.8 9.3 All rowcropsOrbweaver‐1 2.9 10.3 10% at footslopeOrbweaver‐2 5.9 6.7 6.7% at footslope, 6.7% at sideslope, and
6.7% at upslope
Orbweaver‐3 3.1 6.6 All rowcrops
*Percent of grass filters = area of filters / area of watershed
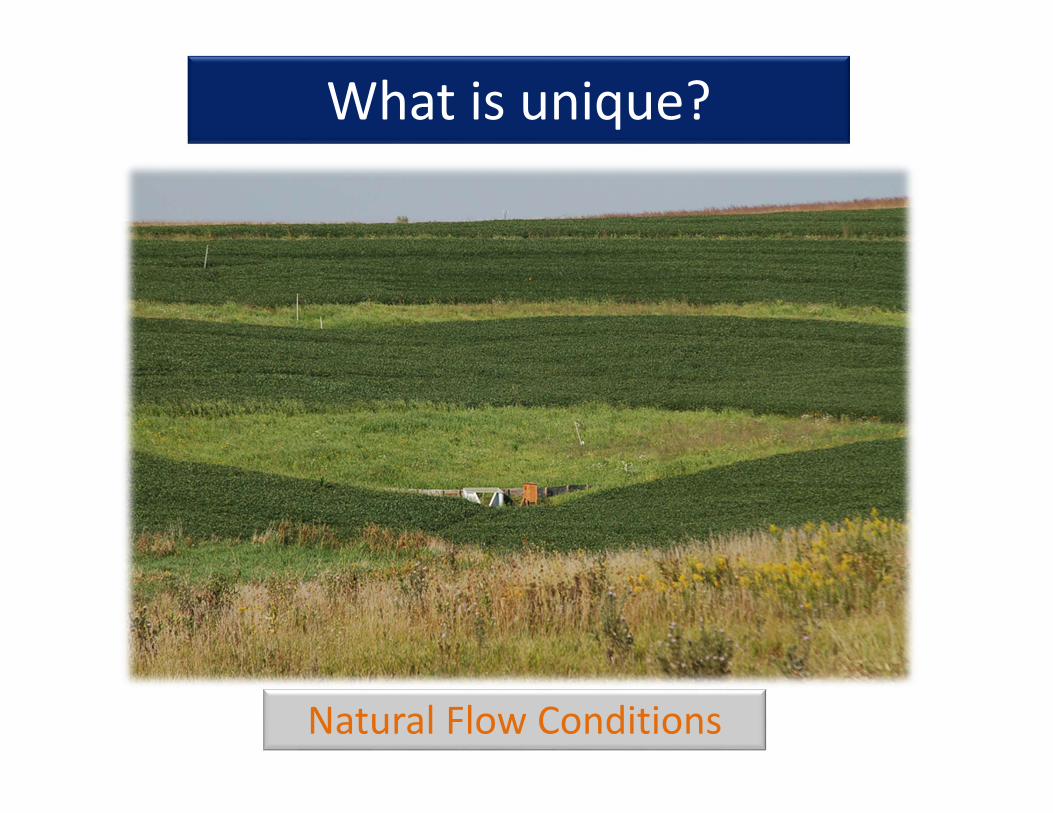
What is unique?
Natural Flow Conditions
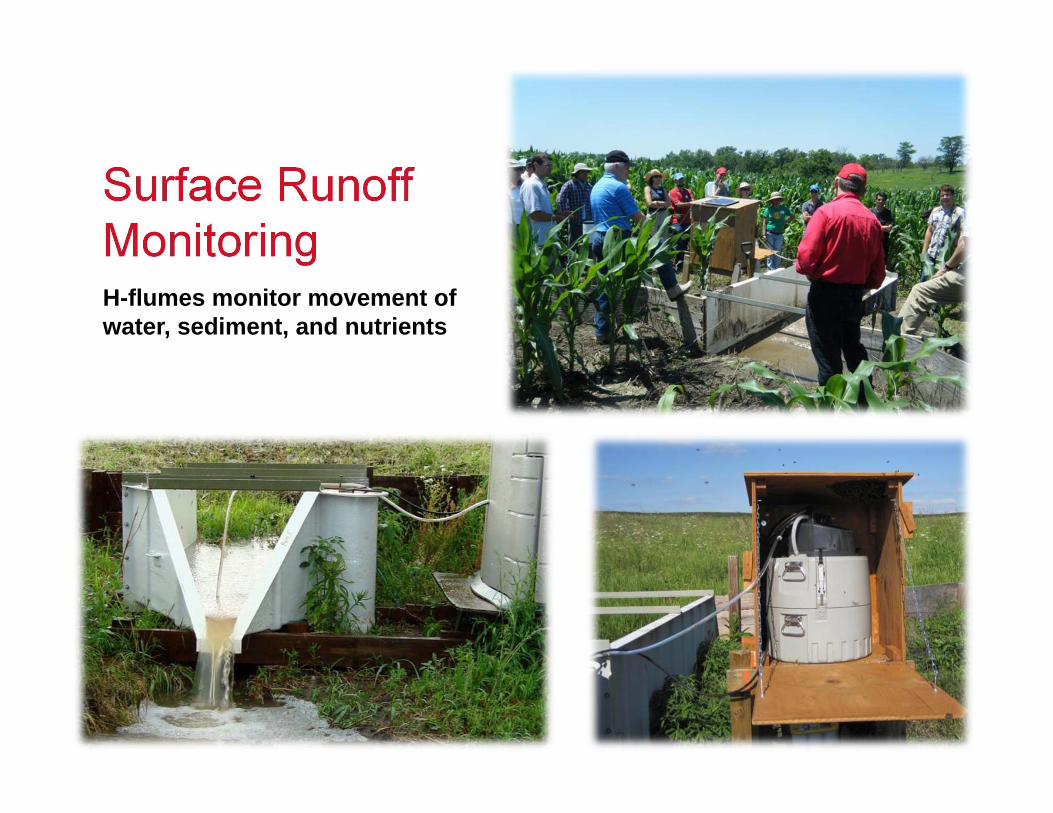
Surface Runoff MonitoringH-flumes monitor movement of water, sediment, and nutrients
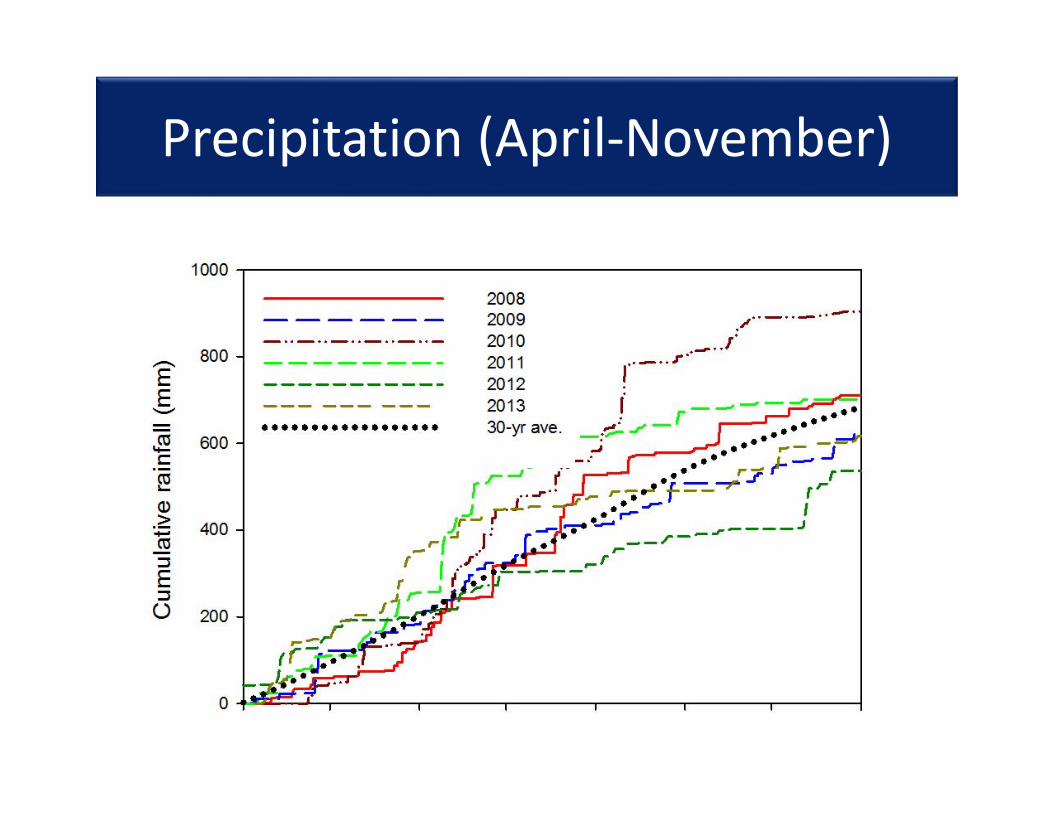
Precipitation (April‐November)
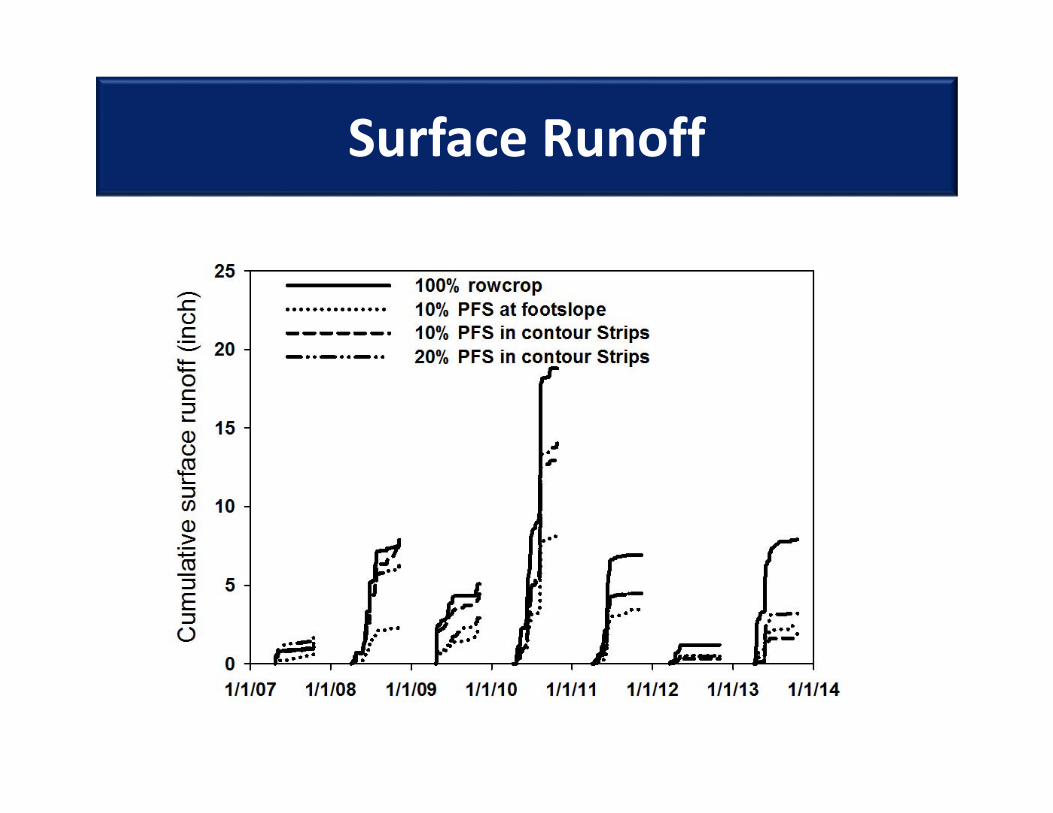
Surface Runoff
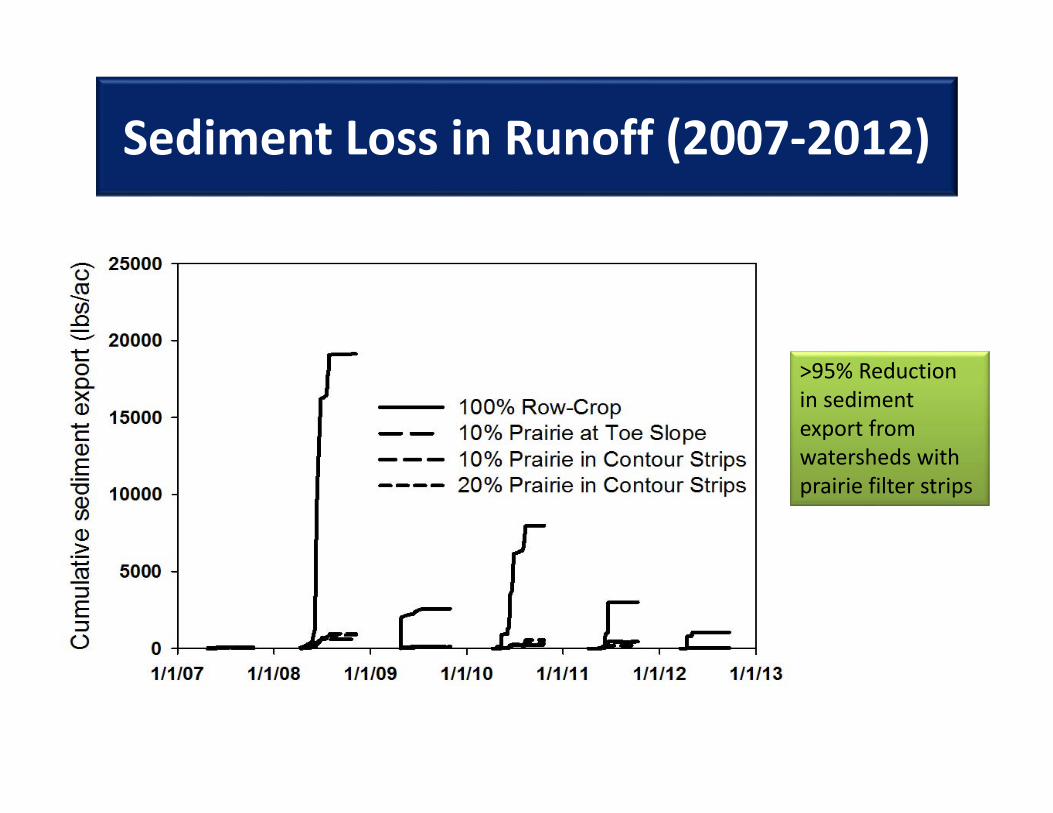
Sediment Loss in Runoff (2007‐2012)
>95% Reduction in sediment export from watersheds with prairie filter strips
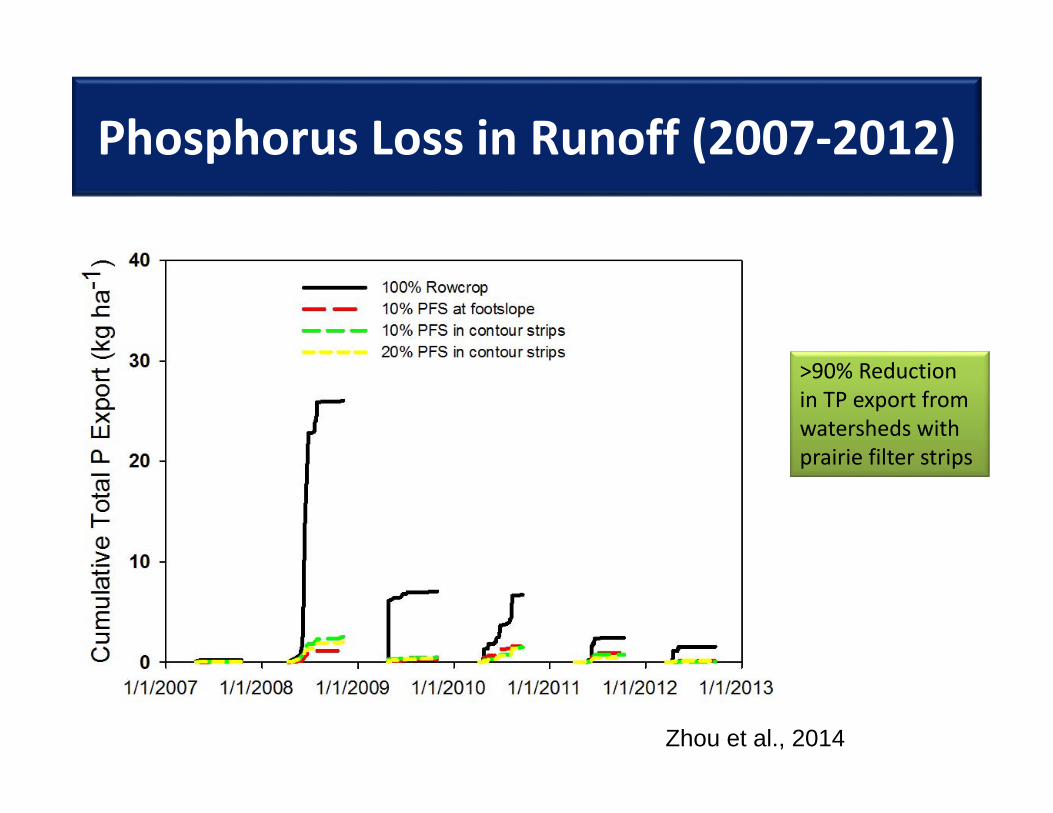
Phosphorus Loss in Runoff (2007‐2012)
Zhou et al., 2014
>90% Reduction in TP export from watersheds with prairie filter strips
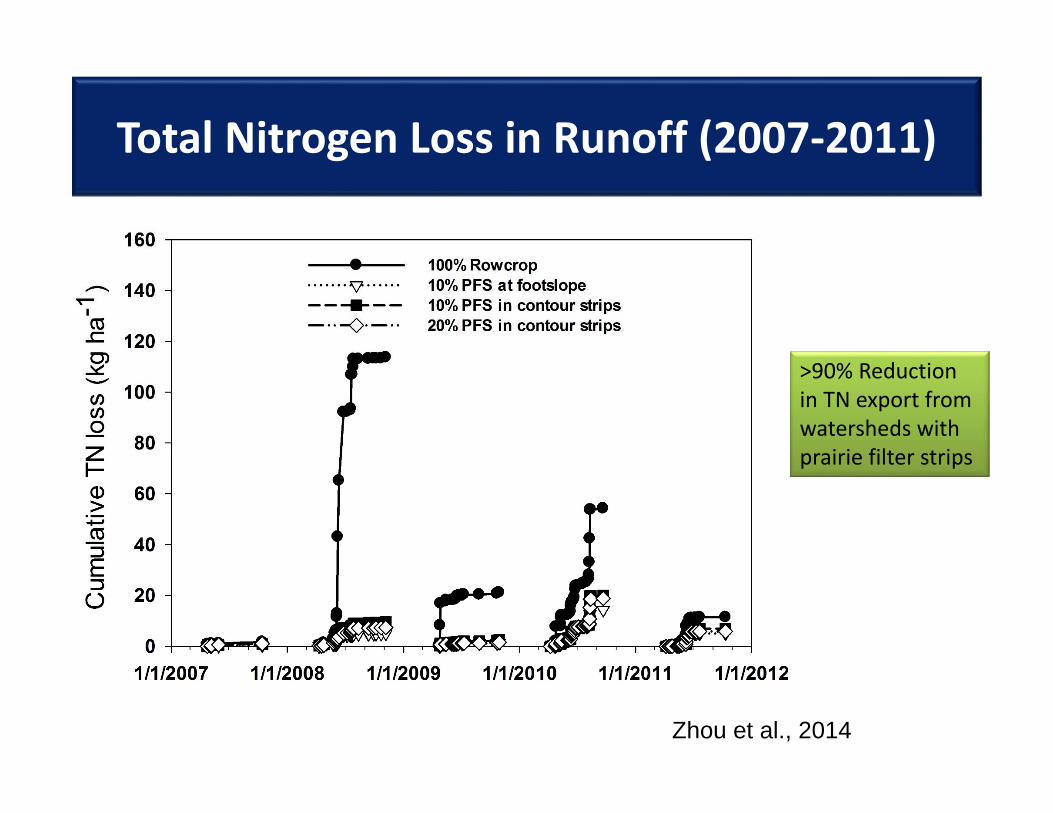
Total Nitrogen Loss in Runoff (2007‐2011)
Zhou et al., 2014
>90% Reduction in TN export from watersheds with prairie filter strips
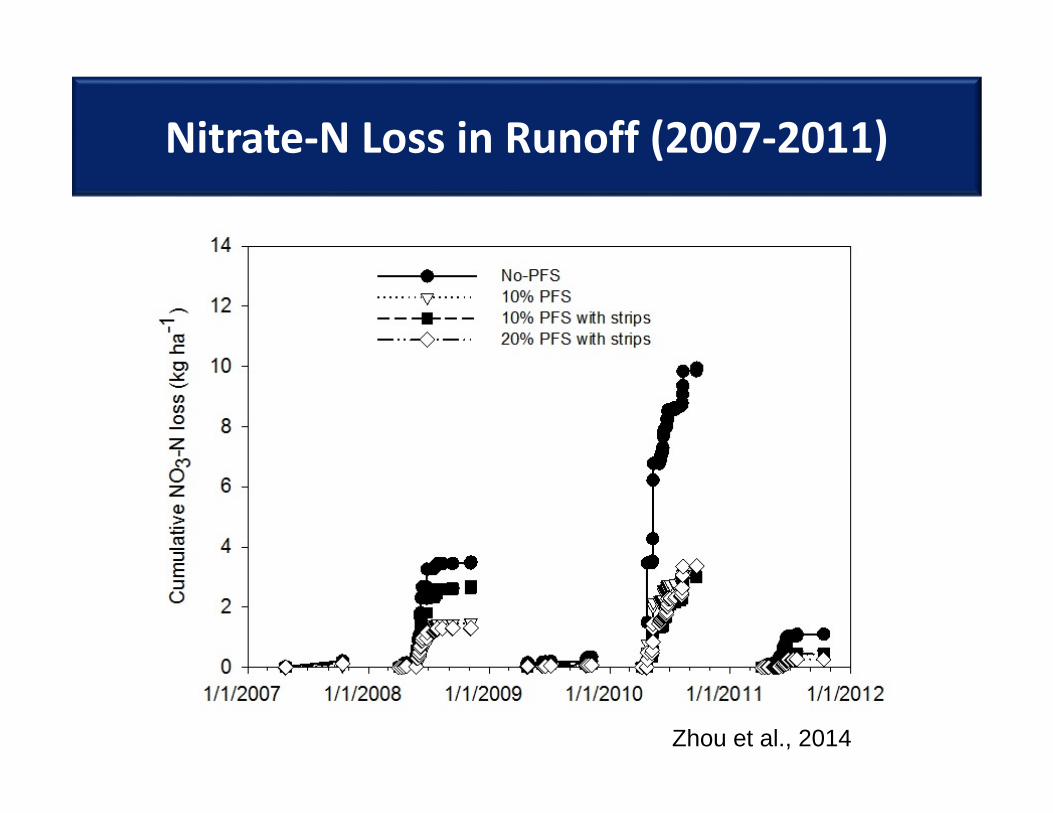
Nitrate‐N Loss in Runoff (2007‐2011)
Zhou et al., 2014

Visual Examples (4 inch rain in June 2008)
100% Crop 100% Prairie10% Prairie90% Crop

Summary• In Iowa, on average the majority of drainage
and nitrate-N loss occurs in April-June• Timing of nitrogen application (fall or early
season sidedress) had little impact on nitrate-N concentrations in drainage
• In north-central Iowa, winter cereal rye cover crops reduced nitrate-N concentration in subsurface drainage by ~25%
• Strategically sited prairie strips hold potential for reducing surface runoff and loss of sediment and nutrients with surface runoff
Related Documents