HELLENIC REPUBLIC MINISTRY OF ENVIRONMENT, ENERGY AND CLIMATE CHANGE 5 th NATIONAL COMMUNICATION TO THE UNITED NATIONS FRAMEWORK CONVENTION ON CLIMATE CHANGE JANUARY 2010

Welcome message from author
This document is posted to help you gain knowledge. Please leave a comment to let me know what you think about it! Share it to your friends and learn new things together.
Transcript
HELLENIC REPUBLIC
MINISTRY OF ENVIRONMENT, ENERGY AND
CLIMATE CHANGE
5th NATIONAL COMMUNICATION TO THE UNITED NATIONS FRAMEWORK CONVENTION ON
CLIMATE CHANGE
JANUARY 2010

5th NATIONAL COMMUNICATION TO THE UNFCCC 1 CHAPTER 1. EXECUTIVE SUMMARY
1.1 National Circumstances
1.1.1 Government structure
The Constitution of 1975, as revised in 1986, 2001 and in 2008, defines the political system of Greece as a Parliamentary Democracy with the President being the head of state.
At the top administrative level is the national government, with ministers appointed by the prime minister. The ministries mainly prepare and implement national laws. The Ministry of Environment, Energy and Climate Change -MEECC (former Ministry for the Environment, Physical Planning and Public Works -MEPPPW) is the main governmental body concerned with the development and implementation of environmental policy in Greece, while other Ministries are responsible for integrating environmental policy targets within their respective fields. The Ministry of Environment, Energy and Climate Change (MEECC) is the competent authority for Climate Change, and the Council of Ministers is responsible for the final approval of policies and measures related to Climate Change.
1.1.2 Population
In 2007, the total population of Greece (as estimated in the middle of the year) was approximately 11.19 million inhabitants, according to the data provided by the National Statistical Service of Greece. According to the Census of March 2001, the total population of the country was approximately 10.95 million. The total population increased by 9.1% compared to the 1991 Census results, with 34% of total population living in the greater Athens area. The average size of households is continuously decreased (2.80 persons per household according to the Census of 2001) while population density is 85.2 inhabitants/km2.
1.1.3 Geographic and climate profile
Greece has a total area of 131,957 km2 and occupies the southernmost extension of the Balkan Peninsula. The mainland accounts for 80% of the land area, with the remaining 20% divided among nearly 3,000 islands. The Greek landscape, with its extensive coastline, exceeding 15,000 km in length, is closely linked with the sea, since only a small region in the northwest is further than 80 km from the sea. Approximately 25% of it is lowland, particularly the coastal plains along the seashore of the country.
Forest land, divided into Forests (high and coppice forests) and Other Wooded Lands (branchy dwarf trees and scrubs), covers 49.4% of the total area of the country. Grassland, rangeland and pasture with vegetation that falls below the threshold of forest definition, covers 13% of the total area of the country. Agricultural land, including fallow land, account for 29.2% of the total area. Settlements, developed land including transportation infrastructure and human settlements of any size, account for 4.0% of the total area. Finally, wetlands, land that is covered or saturated by water for all or the greatest part of the year, and other land, areas that do not fall into any of other land-use categories (e.g. rocky areas, bare soil, mine and quarry land), account for 2.3 % and 2.0 %, respectively.
Greece has a Mediterranean climate, with mild and wet winters in the southern lowland and island regions and cold winters with strong snowfalls in the mountainous areas in the central and northern regions and hot, dry summers. The mean temperature during summer (April to September) is approximately 24°C in Athens and southern Greece, while lower in the north. Generally, temperatures are higher in the southern part of the country. Except for a few
5th NATIONAL COMMUNICATION TO THE UNFCCC 2 thunderstorms, rainfall is rare from June to August, where sunny and dry days are mainly observed. The dry, hot weather is often relieved by a system of seasonal breezes.
The mean annual temperature for the period 2001 – 2004, as measured at selected meteorological stations of the country, is higher in most of the stations compared to the mean annual temperature of the period 1991 – 2000 while the mean annual temperature for the period 1991 – 2000 is higher compared to these of the period 1961 – 1990.
1.1.4 Economic profile
In January 1st, 2001, Greece became the 12th member of the Economic and Monetary Union in EU. Over the last decade, Greek growth performance was impressive. The annual rate of increase of the GDP during the period 2000-2004 was approximately 4.5%. Explanations for this development include, among others, the financial market liberalization coupled with membership in the monetary union, which led to substantial increase in credit expansion and reduction in borrowing costs, the stimulus given by the Olympic Games hosted in Athens in 2004 and the Community Structural Funds. Contrary to expectations of a post-Olympics slump, the economy continued to grow briskly in 2005-2007 period. GDP growth increased by an average growth rate of 3.7% and thus Greece enjoyed one of the highest growth rates in the EU and the Eurozone. The repercussions from the international financial crisis are unavoidable felt also in Greece. GDP growth remained strong during the first three quarters of 2008, but on declining path, and is estimated at 2% for the whole year.
1.1.5 Transportation
Economic development and improved living standards have a significant effect on the ownership of passenger cars. The number of passenger cars in 2007 was almost 20 times higher compared to the number of passenger cars in 1970, while similar trends are also observed for the number of trucks, buses and motorcycles. In 1990, the number of passenger cars was 1.7 million cars (1 car for every 6 inhabitants), while in 2007 this figure reached 4.8 million cars. Since 1995 the number of advanced technology catalytic passenger cars is constantly increasing, while the number of medium and large size passenger cars almost doubled from 1990 to 2007. In 2007, of the vehicles that were operated for the first time, 88% were new and the rest 12% were used. Passenger cars represented 64.6% of total motor vehicles in operation, motorcycles 17.6%, trucks 17.0%, taxies 0.5% and buses 0.4%.
The Greek maritime fleet is one of the largest in the world, and in 2007, according to the data of the competent Ministry,, it comprised of 2049 vessels (1455 fly the Greek flag) of a total dead-weight tonnage of approximately 98.2 GRT, that represent the 18% of world shipping capacity. In 2007, sea transport of passengers increased by approximately 2.6%, compared to 2000, while sea transport of goods increased by 33.5%.
Railways cover a small part of transportation activity in Greece. On the contrary, air traffic presents an average annual increase of 3.1% for the period 1997 – 2007 while the number of passengers increased by approximately 3.9% in the same period.
1.1.6 Energy system
The total gross inland consumption in Greece increased continuously during the period 1990-2007. In 2007, gross inland consumption reached a total of approximately 31.6 Mtoe, presenting an increase of approximately 45% compared to 1990 level. However, the average annual growth rate in the period 1990 -2007 (2.65%) is lower compared to the rate of increase recorded in the 1980s (3.3%).
5th NATIONAL COMMUNICATION TO THE UNFCCC 3 During the period 1990-2007, the consumption of oil and coal products have retained a high share (83% - 96%) while the only significant change in the Greek energy system in the last decade was the introduction of natural gas in 1997, which represents the 11% of gross inland consumption in 2007.
The contribution of renewable energy sources (RES) to gross inland consumption, including large hydro, varies from 3.1% to 5.7% according to the fluctuations of the production of large hydropower plants. Excluding large hydro, the share of renewable energy sources is about 4% for the period 1990 - 2007. The exploitation of renewable energy sources (excluding hydro) is related to the use of biomass for space heating in the domestic sector, the use of solar energy for water heating mainly in the domestic sector and the wind energy for electricity production.
The electricity-generation system in Greece consists of thermal and hydroelectric units as well as a small, though increasing, percentage of other renewable energy sources. In 2007, the total installed capacity of the Public Power Corporation (PPC) generating system was 13526 MW which corresponds to an increase of approximately 55% compared to 1990 levels, while the net electrical capacity of auto producers in 2007 was 176 MW. Electricity generation increased continuously with an average annual rate of approximately 4.8% for the period 1990-2007. Gross electricity production in 2007 totalled 63.5 TWh, 55% of electricity is produced by solid fuels (lignite using steam coal and / or BKB as additives), while the share of liquid fuels and natural gas is 28% and 11% respectively. The rest of electricity production derives from hydropower and wind energy.
In 2007, final energy consumption in Greece totalled 24.8 Mtoe. Energy consumption in industry accounted for 29.6% of final energy consumption (including consumption of the energy sector). The share of transport in final energy consumption is estimated at 35.8% in 2007, while the share of residential and tertiary sector was 34.6%. The average annual rate of increase for the period 1990 - 2007 is estimated at 3.2%. The per capita final energy consumption has increased by 41% from 1990 to 2007 (1.57 and 2.22 toe/cap respectively).
All three sectors increased their energy use from 1990 to 2007, with the residential and tertiary sector showing the highest increase (92.5% in 2007 compared to 1990), followed by transportation (49.5%) and industry (29.4%). This resulted in a total increase of 54% between 1990 and 2007.
1.1.7 Waste
Over the period 1990 – 2007, waste generation presented a continuous increase. Solid waste generated quantities increased from 3.1 Mt in 1990 to 5.0 Mt in 2007, while the per capita solid waste generation increased from 0.82 kg/person/day in 1990 to 1.21 kg/person/day in 2007, remaining however below the EU average (EU-15). The share of solid waste disposed in managed solid waste disposal sites (SWDS) has been noticeably increased since 1999, due to the construction of new SWDS in the framework of the integrated national plan of solid waste disposal on land, developed according to the requirements of the Directive of the European Union 91/156/EEC.
The amount of recycled wastes present a remarkable increase during the last years from 8% in 2000 to 23% in 2007 due to the recycle projects that are promoted in Athens. During the previous decade no significant change has been observed ranging about 8-9%. Biogas recovery and flaring installations operate in 4 large SWDS in Greece (Athens, Thessalonika, Larissa, Patra), which accept 87% of waste disposed to SWDS.
The number of wastewater handling facilities under aerobic conditions has increased considerably since 1999. The percentage of population that is served by aerobic wastewater handling facilities increased from 32% in 1999 to 90% in 2002, in accordance with the
5th NATIONAL COMMUNICATION TO THE UNFCCC 4 targets set by the Directive 91/271/EEC concerning the collection, treatment and disposal of domestic wastewater.
1.2 Greenhouse gas inventory information
1.2.1 Emissions / Removals of GHG in Greece for the period 1990 – 2007
Emissions estimates were calculated according to the CORINAIR methodology, the Revised 1996 IPCC Guidelines for National Greenhouse Gas Inventories, the IPCC Good Practice Guidance and Uncertainty Management in National Greenhouse Gas Inventories and the IPCC Good Practice Guidance for Land Use, Land Use Change and Forestry. Βase year emissions are calculated using 1990 as the base year for carbon dioxide (CO2), methane (CH4) and nitrous oxide (N2O), and 1995 for fluorinated gases (F-gases-Hydrofluorocarbons, HFCs / Perfluorocarbons, PFCs / Sulphur hexafluoride, SF6).
An overview of GHG emissions for the time period 1990–2007 is presented in Table 1.1a and Table 1.1b, while emissions/removals per sector are presented in Table 1.2a and Table 1.2.b.
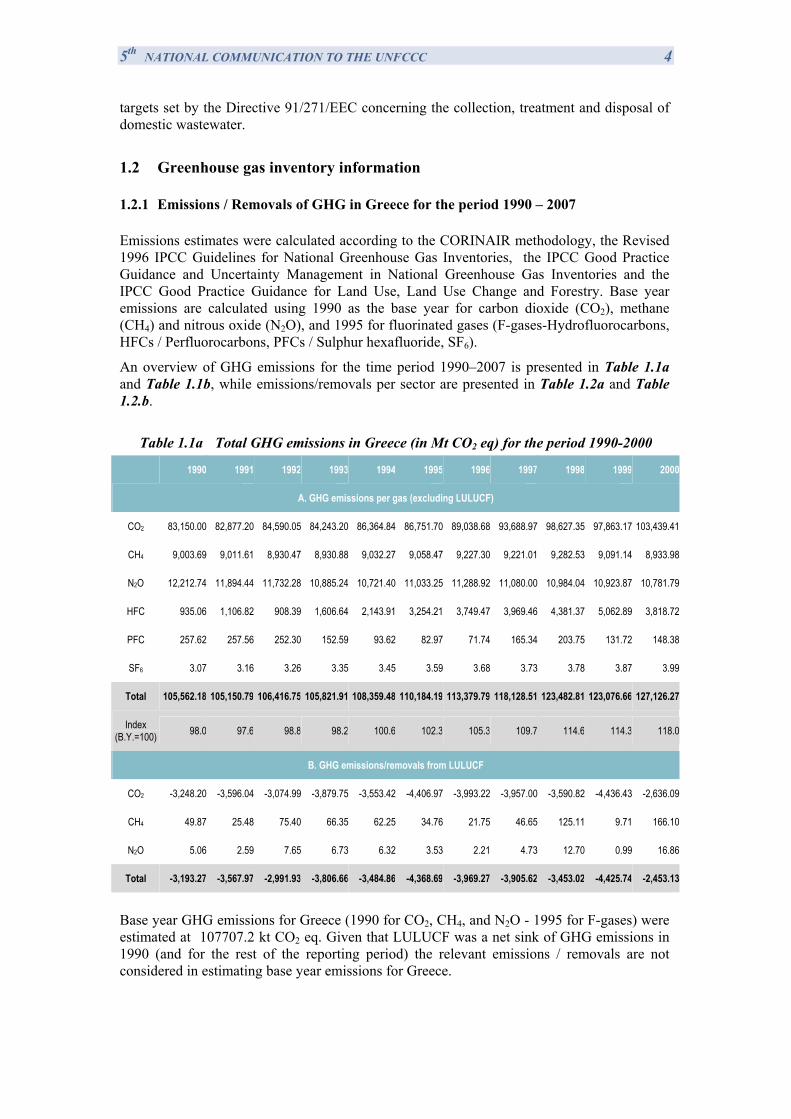
Table 1.1a Total GHG emissions in Greece (in Mt CO2 eq) for the period 1990-2000
1990 1991 1992 1993 1994 1995 1996 1997 1998 1999 2000
A. GHG emissions per gas (excluding LULUCF)
CO2 83,150.00 82,877.20 84,590.05 84,243.20 86,364.84 86,751.70 89,038.68 93,688.97 98,627.35 97,863.17 103,439.41
CH4 9,003.69 9,011.61 8,930.47 8,930.88 9,032.27 9,058.47 9,227.30 9,221.01 9,282.53 9,091.14 8,933.98
N2O 12,212.74 11,894.44 11,732.28 10,885.24 10,721.40 11,033.25 11,288.92 11,080.00 10,984.04 10,923.87 10,781.79
HFC 935.06 1,106.82 908.39 1,606.64 2,143.91 3,254.21 3,749.47 3,969.46 4,381.37 5,062.89 3,818.72
PFC 257.62 257.56 252.30 152.59 93.62 82.97 71.74 165.34 203.75 131.72 148.38
SF6 3.07 3.16 3.26 3.35 3.45 3.59 3.68 3.73 3.78 3.87 3.99
Total 105,562.18 105,150.79 106,416.75 105,821.91 108,359.48 110,184.19 113,379.79 118,128.51 123,482.81 123,076.66 127,126.27
Index (B.Y.=100) 98.0 97.6 98.8 98.2 100.6 102.3 105.3 109.7 114.6 114.3 118.0
B. GHG emissions/removals from LULUCF
CO2 -3,248.20 -3,596.04 -3,074.99 -3,879.75 -3,553.42 -4,406.97 -3,993.22 -3,957.00 -3,590.82 -4,436.43 -2,636.09
CH4 49.87 25.48 75.40 66.35 62.25 34.76 21.75 46.65 125.11 9.71 166.10
N2O 5.06 2.59 7.65 6.73 6.32 3.53 2.21 4.73 12.70 0.99 16.86
Total -3,193.27 -3,567.97 -2,991.93 -3,806.66 -3,484.86 -4,368.69 -3,969.27 -3,905.62 -3,453.02 -4,425.74 -2,453.13
Base year GHG emissions for Greece (1990 for CO2, CH4, and Ν2Ο - 1995 for F-gases) were estimated at 107707.2 kt CO2 eq. Given that LULUCF was a net sink of GHG emissions in 1990 (and for the rest of the reporting period) the relevant emissions / removals are not considered in estimating base year emissions for Greece.
5th NATIONAL COMMUNICATION TO THE UNFCCC 5
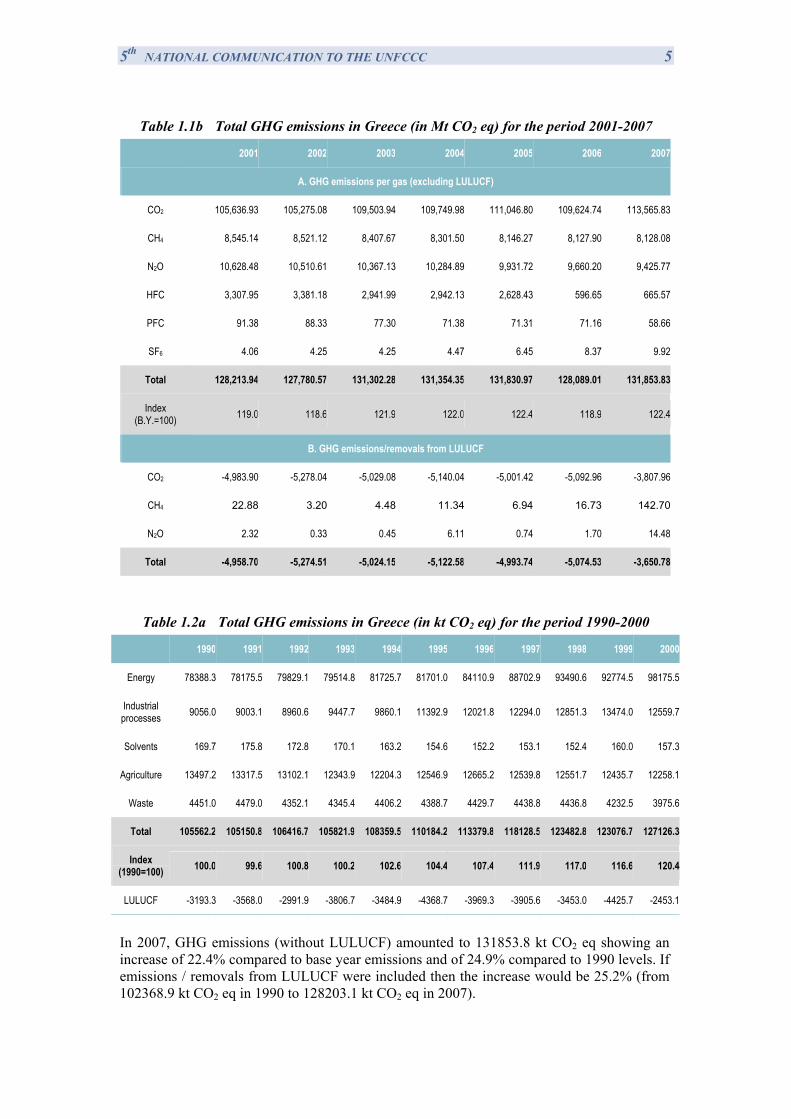
Table 1.1b Total GHG emissions in Greece (in Mt CO2 eq) for the period 2001-2007
2001 2002 2003 2004 2005 2006 2007
A. GHG emissions per gas (excluding LULUCF)
CO2 105,636.93 105,275.08 109,503.94 109,749.98 111,046.80 109,624.74 113,565.83
CH4 8,545.14 8,521.12 8,407.67 8,301.50 8,146.27 8,127.90 8,128.08
N2O 10,628.48 10,510.61 10,367.13 10,284.89 9,931.72 9,660.20 9,425.77
HFC 3,307.95 3,381.18 2,941.99 2,942.13 2,628.43 596.65 665.57
PFC 91.38 88.33 77.30 71.38 71.31 71.16 58.66
SF6 4.06 4.25 4.25 4.47 6.45 8.37 9.92
Total 128,213.94 127,780.57 131,302.28 131,354.35 131,830.97 128,089.01 131,853.83
Index (B.Y.=100) 119.0 118.6 121.9 122.0 122.4 118.9 122.4
B. GHG emissions/removals from LULUCF
CO2 -4,983.90 -5,278.04 -5,029.08 -5,140.04 -5,001.42 -5,092.96 -3,807.96
CH4 22.88 3.20 4.48 11.34 6.94 16.73 142.70
N2O 2.32 0.33 0.45 6.11 0.74 1.70 14.48
Total -4,958.70 -5,274.51 -5,024.15 -5,122.58 -4,993.74 -5,074.53 -3,650.78
Table 1.2a Total GHG emissions in Greece (in kt CO2 eq) for the period 1990-2000
1990 1991 1992 1993 1994 1995 1996 1997 1998 1999 2000
Energy 78388.3 78175.5 79829.1 79514.8 81725.7 81701.0 84110.9 88702.9 93490.6 92774.5 98175.5
Industrial processes 9056.0 9003.1 8960.6 9447.7 9860.1 11392.9 12021.8 12294.0 12851.3 13474.0 12559.7
Solvents 169.7 175.8 172.8 170.1 163.2 154.6 152.2 153.1 152.4 160.0 157.3
Agriculture 13497.2 13317.5 13102.1 12343.9 12204.3 12546.9 12665.2 12539.8 12551.7 12435.7 12258.1
Waste 4451.0 4479.0 4352.1 4345.4 4406.2 4388.7 4429.7 4438.8 4436.8 4232.5 3975.6
Total 105562.2 105150.8 106416.7 105821.9 108359.5 110184.2 113379.8 118128.5 123482.8 123076.7 127126.3
Index (1990=100) 100.0 99.6 100.8 100.2 102.6 104.4 107.4 111.9 117.0 116.6 120.4
LULUCF -3193.3 -3568.0 -2991.9 -3806.7 -3484.9 -4368.7 -3969.3 -3905.6 -3453.0 -4425.7 -2453.1
In 2007, GHG emissions (without LULUCF) amounted to 131853.8 kt CO2 eq showing an increase of 22.4% compared to base year emissions and of 24.9% compared to 1990 levels. If emissions / removals from LULUCF were included then the increase would be 25.2% (from 102368.9 kt CO2 eq in 1990 to 128203.1 kt CO2 eq in 2007).
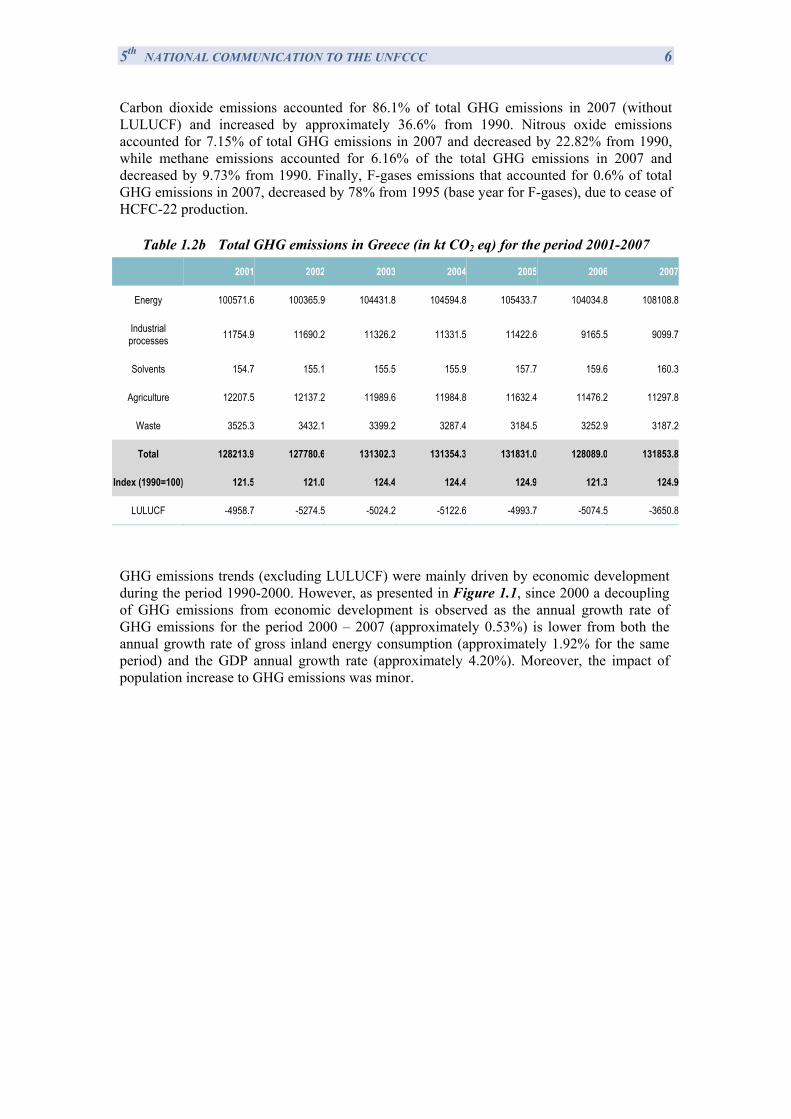
5th NATIONAL COMMUNICATION TO THE UNFCCC 6 Carbon dioxide emissions accounted for 86.1% of total GHG emissions in 2007 (without LULUCF) and increased by approximately 36.6% from 1990. Nitrous oxide emissions accounted for 7.15% of total GHG emissions in 2007 and decreased by 22.82% from 1990, while methane emissions accounted for 6.16% of the total GHG emissions in 2007 and decreased by 9.73% from 1990. Finally, F-gases emissions that accounted for 0.6% of total GHG emissions in 2007, decreased by 78% from 1995 (base year for F-gases), due to cease of HCFC-22 production.
Table 1.2b Total GHG emissions in Greece (in kt CO2 eq) for the period 2001-2007
2001 2002 2003 2004 2005 2006 2007
Energy 100571.6 100365.9 104431.8 104594.8 105433.7 104034.8 108108.8
Industrial processes 11754.9 11690.2 11326.2 11331.5 11422.6 9165.5 9099.7
Solvents 154.7 155.1 155.5 155.9 157.7 159.6 160.3
Agriculture 12207.5 12137.2 11989.6 11984.8 11632.4 11476.2 11297.8
Waste 3525.3 3432.1 3399.2 3287.4 3184.5 3252.9 3187.2
Total 128213.9 127780.6 131302.3 131354.3 131831.0 128089.0 131853.8
Index (1990=100) 121.5 121.0 124.4 124.4 124.9 121.3 124.9
LULUCF -4958.7 -5274.5 -5024.2 -5122.6 -4993.7 -5074.5 -3650.8
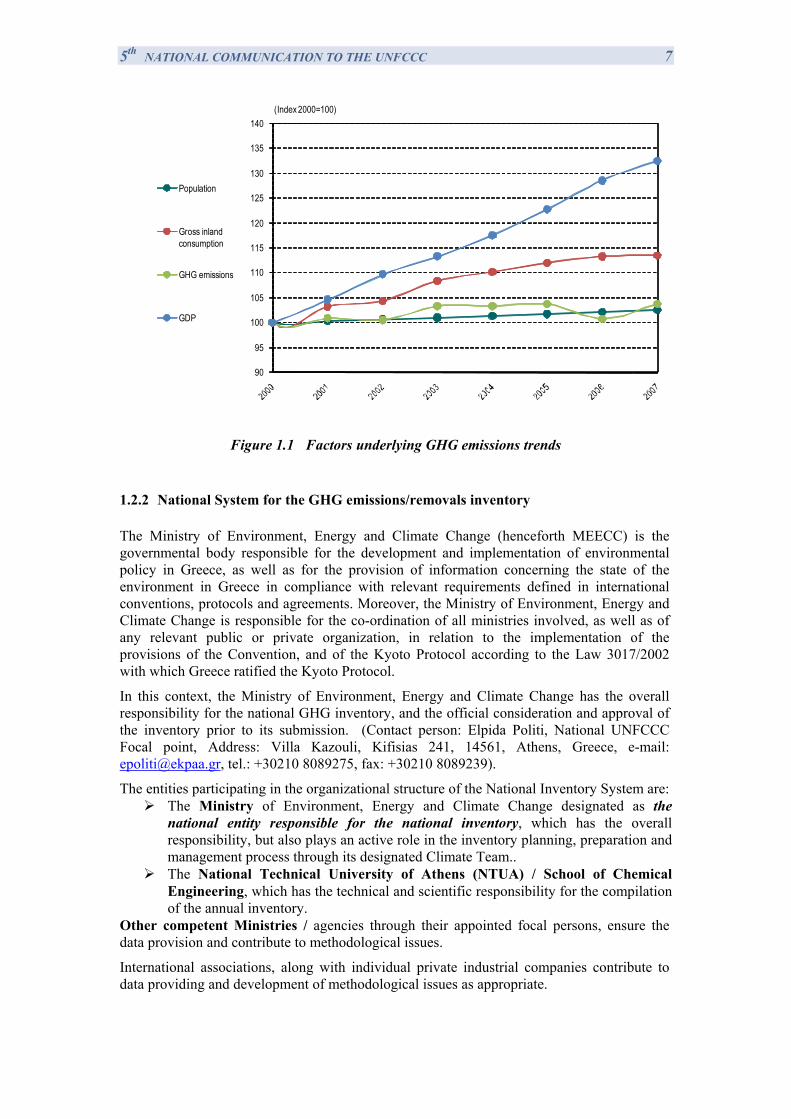
GHG emissions trends (excluding LULUCF) were mainly driven by economic development during the period 1990-2000. However, as presented in Figure 1.1, since 2000 a decoupling of GHG emissions from economic development is observed as the annual growth rate of GHG emissions for the period 2000 – 2007 (approximately 0.53%) is lower from both the annual growth rate of gross inland energy consumption (approximately 1.92% for the same period) and the GDP annual growth rate (approximately 4.20%). Moreover, the impact of population increase to GHG emissions was minor.
5th NATIONAL COMMUNICATION TO THE UNFCCC 7
90
95
100
105
110
115
120
125
130
135
140(Index 2000=100)
Population
Gross inland consumption
GHG emissions
GDP
Figure 1.1 Factors underlying GHG emissions trends
1.2.2 National System for the GHG emissions/removals inventory
The Ministry of Environment, Energy and Climate Change (henceforth MEECC) is the governmental body responsible for the development and implementation of environmental policy in Greece, as well as for the provision of information concerning the state of the environment in Greece in compliance with relevant requirements defined in international conventions, protocols and agreements. Moreover, the Ministry of Environment, Energy and Climate Change is responsible for the co-ordination of all ministries involved, as well as of any relevant public or private organization, in relation to the implementation of the provisions of the Convention, and of the Kyoto Protocol according to the Law 3017/2002 with which Greece ratified the Kyoto Protocol.
In this context, the Ministry of Environment, Energy and Climate Change has the overall responsibility for the national GHG inventory, and the official consideration and approval of the inventory prior to its submission. (Contact person: Elpida Politi, National UNFCCC Focal point, Address: Villa Kazouli, Kifisias 241, 14561, Athens, Greece, e-mail: [email protected], tel.: +30210 8089275, fax: +30210 8089239).
The entities participating in the organizational structure of the National Inventory System are: The Ministry of Environment, Energy and Climate Change designated as the
national entity responsible for the national inventory, which has the overall responsibility, but also plays an active role in the inventory planning, preparation and management process through its designated Climate Team..
The National Technical University of Athens (NTUA) / School of Chemical Engineering, which has the technical and scientific responsibility for the compilation of the annual inventory.
Other competent Ministries / agencies through their appointed focal persons, ensure the data provision and contribute to methodological issues.
International associations, along with individual private industrial companies contribute to data providing and development of methodological issues as appropriate.
5th NATIONAL COMMUNICATION TO THE UNFCCC 8 The compilation of the inventory is completed in three main stages, as follows:
Stage 1: the first stage consists of data collection and check for all source/sink categories.
The main data sources used are the National Statistical Service of Greece (NSSG), the Ministries and government agencies involved, large private enterprises, along with the verified reports from installations under the EU ETS. Quality control of activity data include the comparison of the same or similar data from alternative data sources, as well as time-series assessment, in order to identify changes that cannot be explained. In cases where problems and/or inconsistencies are identified, the agency’s representative, responsible for data providing, is called to explain the inconsistency and/or help solving the problem.
Stage 2: Once the reliability of input data is checked and certified, emissions/removals per
source/sink category are estimated. Emissions estimates are then transformed to the format required by the CRF Reporter. This stage also includes the evaluation of the emission factors used and the assessment of the consistency of the methodologies applied, in relation to the provisions of the IPCC Guidelines, the IPCC Good Practice Guidance and the LULUCF Good Practice Guidance.
Quality control checks, at this stage, are related to time-series assessment as well as to the identification and correction of any errors / gaps while estimating emissions / removals and filling in the CRF Reporter.
Stage 3: The last stage involves the compilation of the NIR and its internal (i.e. within
NTUA) check. The official approval procedure follows for one month period of interactions between the Inventory Team (NTUA) and the Climate Team (MEECC), starting on 1st of February of the year of submission. During this period, the NTUA Inventory Team has to revise the report according to the observations and recommendations of the Climate Team. On the basis of this interaction process, the final version of the report is compiled. The General Director for the Environment of MEECC, who supervises the National GHG inventory system, approves the inventory and then the NIR is submitted, by the Ministry of Environment, Energy and Climate Change , to the European Commission and to the UNFCCC Secretariat.
The information that is related to the annual GHG emissions inventory is kept at the Centralized Inventory File in MEECC. Moreover, the final results (NIR and CRF tables) are available in the MINENV web site (http://www.minenv.gr/4/41/g4107.html).
1.2.3 National registry
The National Centre for the Environment and Sustainable Development (N.C.E.S.D), operates the Greek GHG Registry under the Min. Dec. 54409/2632/2004. The Greek GHG Registry is hosted and supported by SmartTech GmbH (2 persons: Mr Gerhard Schwartz and Janos Mozes), in Vienna, Austria. So there are no changes to the Registry Developers since the last inventory submission.
Greece cooperates with the member states of the European Union and the registry of the European Community (CITL). The names of the other member states are: Austria, Belgium, Cyprus, Czech Republic, Denmark, Estonia, Finland, France, Germany, Hungary, Ireland, Italy, Latvia, Lithuania, Luxembourg, Malta, Netherlands, Poland, Portugal, Slovak Republic, Slovenia, Spain, Sweden, United Kingdom, Bulgaria and Romania. Consolidated Community’s Registry system will start from 2012.
The capacity of the Greek registry is designed for 5000 accounts. 139 Operator Holding Accounts plus 13 Personal Holding Accounts are currently installed.
5th NATIONAL COMMUNICATION TO THE UNFCCC 9
1.3 Policies and Measures
1.3.1 Policy-making process
The Ministry of Environment, Energy and Climate Change (MEECC) is the main governmental body entrusted with the development and implementation of environmental policy in Greece. MEECC is responsible, among others, for the formulation of policies concerning environmental protection, for the coordination of implementation efforts and to ensure compliance with the current legislative framework. For this purpose, MEECC cooperates both with other competent ministries and with regional, prefectural and local authorities. Other ministries are responsible for integrating environmental policy targets within their respective fields.
Climate change mitigation is one of the main targets identified in the Greek strategy for sustainable development launched by MEECC in 2002. The objective of the strategy is the development of a set of principles for the formulation of an action plan in line with international challenges, and in accordance with EU policy directions and adjusted to the specific national circumstances.
Policies and measures, as well as all other issues and actions regarding mitigation are discussed within the framework of an inter-ministerial committee, comprising representatives from all competent Ministries. Final approval of policies and measures related to climate change mitigation rests with the Council of Ministers.
Greece ratified the Kyoto Protocol in 2002 (Law 3017/2002) and adopted a National Programme for achieving its commitment by a decision of the Council of Ministers (DCM5/2003). By Law 3017/2002 the former MEPPPW - present MEECC is designated as the governmental body responsible for the coordination, within its responsibilities, of all other competent ministries and possibly any other public and / or private entities involved, for:
1. the implementation of the provisions of the Kyoto Protocol and
2. the formulation and monitoring of the National Programme for achieving the national targets set under the Kyoto Protocol.
Moreover, with this law it is defined that all issues related to the implementation of the provisions of the Kyoto Protocol, including among others, the establishment of the necessary administrative structures and procedures, enforcement rules, etc. are to be resolved and adopted by Common Ministerial Decisions of the Minister of Environment, Energy and Climate Channge and other, as appropriate, competent Ministers. The same procedure is to be followed in order to introduce into the national legislation any decisions of the COP and/or CMP or any necessary modifications to the National Programme.
1.3.2 Results of policies and measures
The most important supporting policies related with the implementation of measures for the restriction of GHG emissions in Greece are:
The 2nd National Climate Change Programme, that was elaborated and adopted in 2002 (Act of the Ministerial Council 5/27.02.2003, Official Journal of the Hellenic Republic Α' 58 – 05.03.2003) defines the additional policies and measures necessary
5th NATIONAL COMMUNICATION TO THE UNFCCC 10
for Greece to meet its Kyoto target, i.e., restricting the increase of GHG emissions to 25% over the time period 2008–2012, compared to base year emissions.
The European common and coordinated policies and measures (CCPM), that constitute a legislative framework that supports and set the targets of a number of the respective national policies for the restriction of GHG emissions.
The European emissions trading scheme (Directive 2003/87/EC) the operation of which started in 2005. In Greece, the trading system for the period 2008-2012 comprises 140 industrial installations (power plants, refineries, cement plants etc). An allowance reserve is also created which is intended to cover possible unknown new entrants in the period. According to the 2nd National Allocation Plan (NAP), the allowances of CO2 emissions that were allocated to installations included in the EU-ETS were fixed to 341,547,710 t CO2, which requires a considerable decrease of emissions by the enterprises that participate in the system. It is estimated that this decrease of emissions or, with other words, the effect of ETS supporting policy is a 16.7% reduction or 69.2 Mt of CO2 emissions of ETS installations for the period 2008-2012.
The financing mechanisms for the funding for the support of policies that either straightforward or inter alia contributes in the restriction of GHG emissions have been developed in a big extent under the frame of the Community Support Frameworks.
The fiscal measures that support policies and measures that reduce GHG emissions, such as the tax regime of energy products, the registration tax of vehicles, the Motor vehicle circulation fee (road tax), the income taxation – relief and exemptions.
The total realistic GHG emissions reduction potential from the implemented and adopted policies and measures was estimated to be 28.6 Mt CO2eq for 2010, 37.1 Mt CO2eq for 2015 and 47.0 Mt CO2eq for 2020. The possible interferences between these implemented/adopted measures, which may restrict the estimated GHG emissions reduction potential, were taken into account as possible. Thus, it is obvious that the application of the already implemented and adopted measures for the restriction of GHG emissions contributes considerably in the restriction of the augmentative trend of emissions that characterizes the Greek economy, leading to the achievement of the Kyoto objectives exclusively with domestic measures and actions.
Respectively, the total GHG emissions reduction potential for the planned policies and measures was estimated to be 1.7 Mt CO2eq for 2010, 11.7 Mt CO2eq for 2015 and 18.2 Mt CO2eq for 2020, also with the interferences between them to be taken into account as possible. Planned measures have been identified with a view to ensure compliance with the target set in the framework of the Kyoto Protocol for Greece and the further commitments set by the 2020 CC&E package and EC directives concerning RES-E, CHP, end-use energy efficiency, biofuels, proposals for post 2012 ETS etc. The estimation for the emissions reduction potential in the time horizon of 2020 has been based on specific assumptions concerning further penetration/implementation of the planned policies and measures, taking into account the dynamics that will develop from the fulfilment of the targets of the 1st Commitment Period of the Protocol and EC directives.
1.3.3 Minimization of adverse effects
The Kyoto Protocol aims at the implementation of effective policies and measures by Annex I Parties so as to prevent dangerous anthropogenic interference with the climate system,
5th NATIONAL COMMUNICATION TO THE UNFCCC 11 contributing thus in the minimisation of adverse effects of climate change on other Parties and especially developing countries. The Protocol is seeking to minimize the potential adverse effects that may be caused by the implementation of policies and measures adopted by Annex I Parties to specific sectors of economic activity, industrial sectors or other Parties to the Convention, including the adverse effects on the international trade, social, environmental and economic impacts in developing countries, etc.
The formulation of climate policy in Greece has taken into account the minimization of the adverse effects of emissions reduction policies and measures, according to Articles 4.8 and 4.9 of the Framework Convention on Climate Change and Article 2 of the Kyoto Protocol.
1.4 Projections and the Total Effect of Policies and Measures
1.4.1 Projections
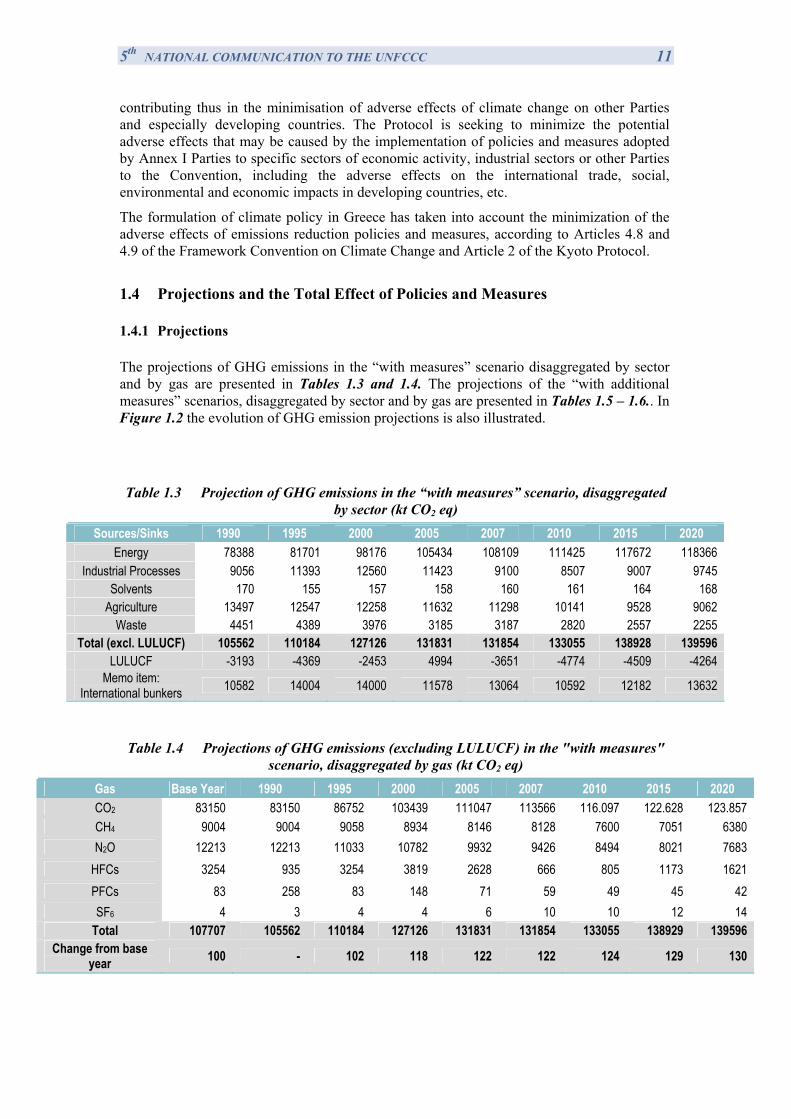
The projections of GHG emissions in the “with measures” scenario disaggregated by sector and by gas are presented in Tables 1.3 and 1.4. The projections of the “with additional measures” scenarios, disaggregated by sector and by gas are presented in Tables 1.5 – 1.6.. In Figure 1.2 the evolution of GHG emission projections is also illustrated.
Table 1.3 Projection of GHG emissions in the “with measures” scenario, disaggregated by sector (kt CO2 eq)
Sources/Sinks 1990 1995 2000 2005 2007 2010 2015 2020 Energy 78388 81701 98176 105434 108109 111425 117672 118366
Industrial Processes 9056 11393 12560 11423 9100 8507 9007 9745 Solvents 170 155 157 158 160 161 164 168
Agriculture 13497 12547 12258 11632 11298 10141 9528 9062 Waste 4451 4389 3976 3185 3187 2820 2557 2255
Total (excl. LULUCF) 105562 110184 127126 131831 131854 133055 138928 139596 LULUCF -3193 -4369 -2453 4994 -3651 -4774 -4509 -4264
Memo item: International bunkers 10582 14004 14000 11578 13064 10592 12182 13632
Table 1.4 Projections of GHG emissions (excluding LULUCF) in the "with measures" scenario, disaggregated by gas (kt CO2 eq)
Gas Base Year 1990 1995 2000 2005 2007 2010 2015 2020 CO2 83150 83150 86752 103439 111047 113566 116.097 122.628 123.857 CH4 9004 9004 9058 8934 8146 8128 7600 7051 6380 N2O 12213 12213 11033 10782 9932 9426 8494 8021 7683
HFCs 3254 935 3254 3819 2628 666 805 1173 1621 PFCs 83 258 83 148 71 59 49 45 42 SF6 4 3 4 4 6 10 10 12 14
Total 107707 105562 110184 127126 131831 131854 133055 138929 139596 Change from base
year 100 - 102 118 122 122 124 129 130
5th NATIONAL COMMUNICATION TO THE UNFCCC 12
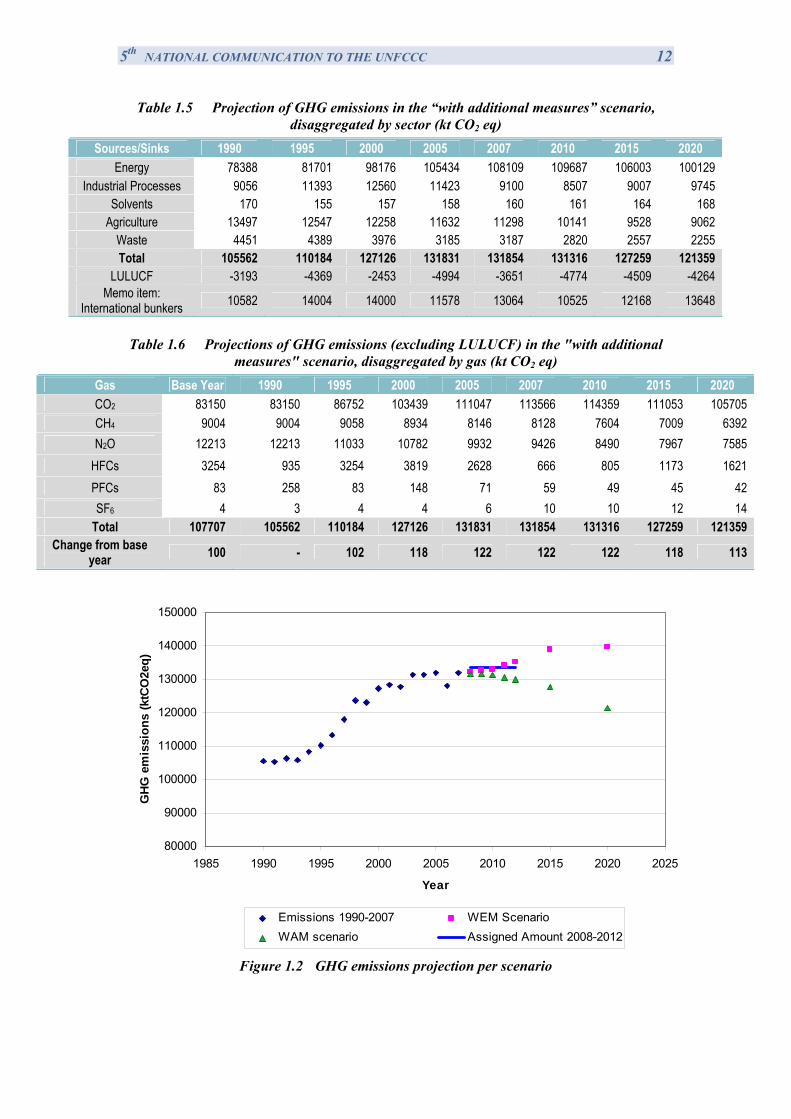
Table 1.5 Projection of GHG emissions in the “with additional measures” scenario, disaggregated by sector (kt CO2 eq)
Sources/Sinks 1990 1995 2000 2005 2007 2010 2015 2020 Energy 78388 81701 98176 105434 108109 109687 106003 100129
Industrial Processes 9056 11393 12560 11423 9100 8507 9007 9745 Solvents 170 155 157 158 160 161 164 168
Agriculture 13497 12547 12258 11632 11298 10141 9528 9062 Waste 4451 4389 3976 3185 3187 2820 2557 2255 Total 105562 110184 127126 131831 131854 131316 127259 121359
LULUCF -3193 -4369 -2453 -4994 -3651 -4774 -4509 -4264 Memo item:
International bunkers 10582 14004 14000 11578 13064 10525 12168 13648
Table 1.6 Projections of GHG emissions (excluding LULUCF) in the "with additional
measures" scenario, disaggregated by gas (kt CO2 eq) Gas Base Year 1990 1995 2000 2005 2007 2010 2015 2020 CO2 83150 83150 86752 103439 111047 113566 114359 111053 105705 CH4 9004 9004 9058 8934 8146 8128 7604 7009 6392 N2O 12213 12213 11033 10782 9932 9426 8490 7967 7585
HFCs 3254 935 3254 3819 2628 666 805 1173 1621 PFCs 83 258 83 148 71 59 49 45 42 SF6 4 3 4 4 6 10 10 12 14
Total 107707 105562 110184 127126 131831 131854 131316 127259 121359 Change from base
year 100 - 102 118 122 122 122 118 113
80000
90000
100000
110000
120000
130000
140000
150000
1985 1990 1995 2000 2005 2010 2015 2020 2025
Year
GH
G e
mis
sion
s (k
tCO
2eq)
Emissions 1990-2007 WEM ScenarioWAM scenario Assigned Amount 2008-2012
Figure 1.2 GHG emissions projection per scenario
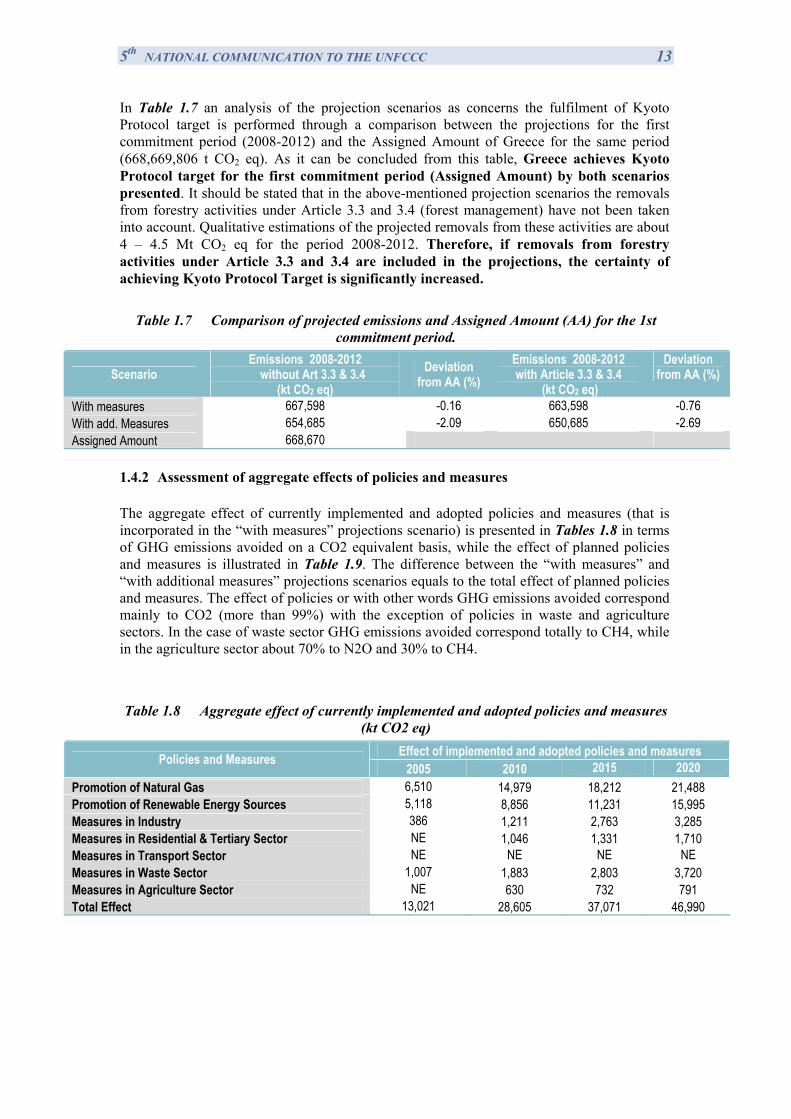
5th NATIONAL COMMUNICATION TO THE UNFCCC 13 In Table 1.7 an analysis of the projection scenarios as concerns the fulfilment of Kyoto Protocol target is performed through a comparison between the projections for the first commitment period (2008-2012) and the Assigned Amount of Greece for the same period (668,669,806 t CO2 eq). As it can be concluded from this table, Greece achieves Kyoto Protocol target for the first commitment period (Assigned Amount) by both scenarios presented. It should be stated that in the above-mentioned projection scenarios the removals from forestry activities under Article 3.3 and 3.4 (forest management) have not been taken into account. Qualitative estimations of the projected removals from these activities are about 4 – 4.5 Mt CO2 eq for the period 2008-2012. Therefore, if removals from forestry activities under Article 3.3 and 3.4 are included in the projections, the certainty of achieving Kyoto Protocol Target is significantly increased.
Table 1.7 Comparison of projected emissions and Assigned Amount (AA) for the 1st
commitment period.
Scenario Emissions 2008-2012
without Art 3.3 & 3.4 (kt CO2 eq)
Deviation from AA (%)
Emissions 2008-2012 with Article 3.3 & 3.4
(kt CO2 eq)
Deviation from AA (%)
With measures 667,598 -0.16 663,598 -0.76 With add. Measures 654,685 -2.09 650,685 -2.69 Assigned Amount 668,670
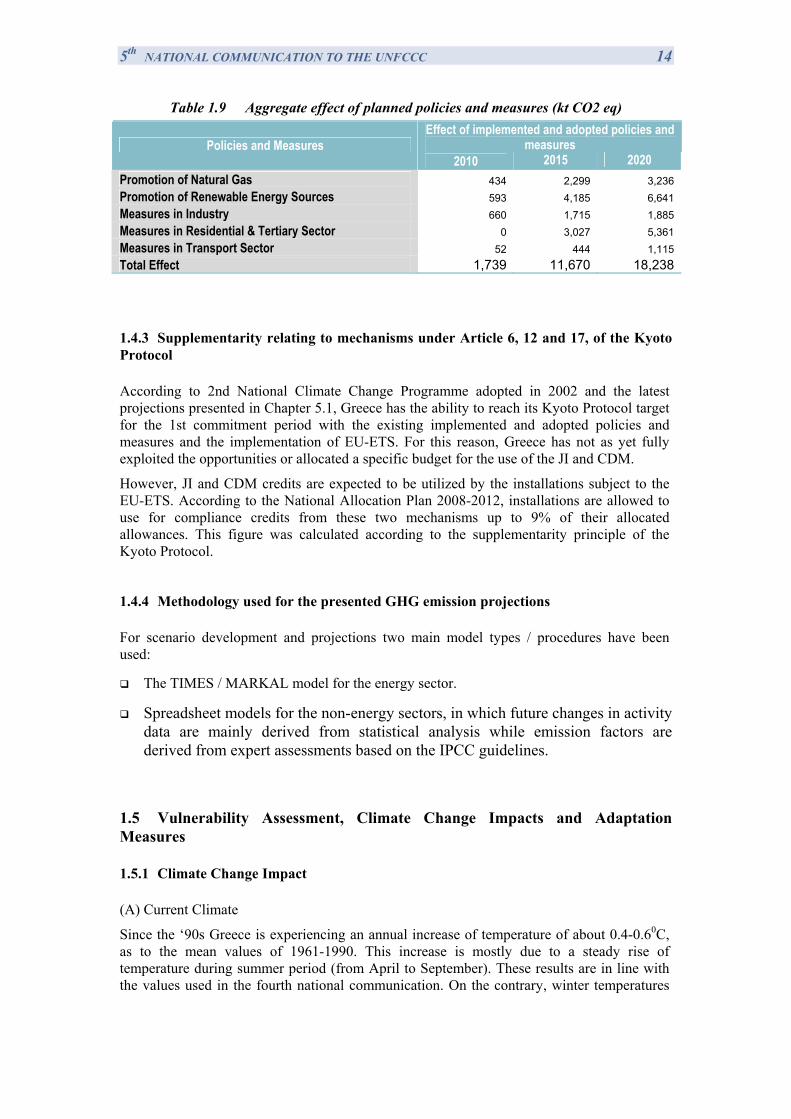
1.4.2 Assessment of aggregate effects of policies and measures
The aggregate effect of currently implemented and adopted policies and measures (that is incorporated in the “with measures” projections scenario) is presented in Tables 1.8 in terms of GHG emissions avoided on a CO2 equivalent basis, while the effect of planned policies and measures is illustrated in Table 1.9. The difference between the “with measures” and “with additional measures” projections scenarios equals to the total effect of planned policies and measures. The effect of policies or with other words GHG emissions avoided correspond mainly to CO2 (more than 99%) with the exception of policies in waste and agriculture sectors. In the case of waste sector GHG emissions avoided correspond totally to CH4, while in the agriculture sector about 70% to N2O and 30% to CH4.
Table 1.8 Aggregate effect of currently implemented and adopted policies and measures
(kt CO2 eq) Effect of implemented and adopted policies and measures Policies and Measures
2005 2010 2015 2020 Promotion of Natural Gas 6,510 14,979 18,212 21,488 Promotion of Renewable Energy Sources 5,118 8,856 11,231 15,995 Measures in Industry 386 1,211 2,763 3,285 Measures in Residential & Tertiary Sector NE 1,046 1,331 1,710 Measures in Transport Sector NE NE NE NE Measures in Waste Sector 1,007 1,883 2,803 3,720 Measures in Agriculture Sector NE 630 732 791 Total Effect 13,021 28,605 37,071 46,990
5th NATIONAL COMMUNICATION TO THE UNFCCC 14
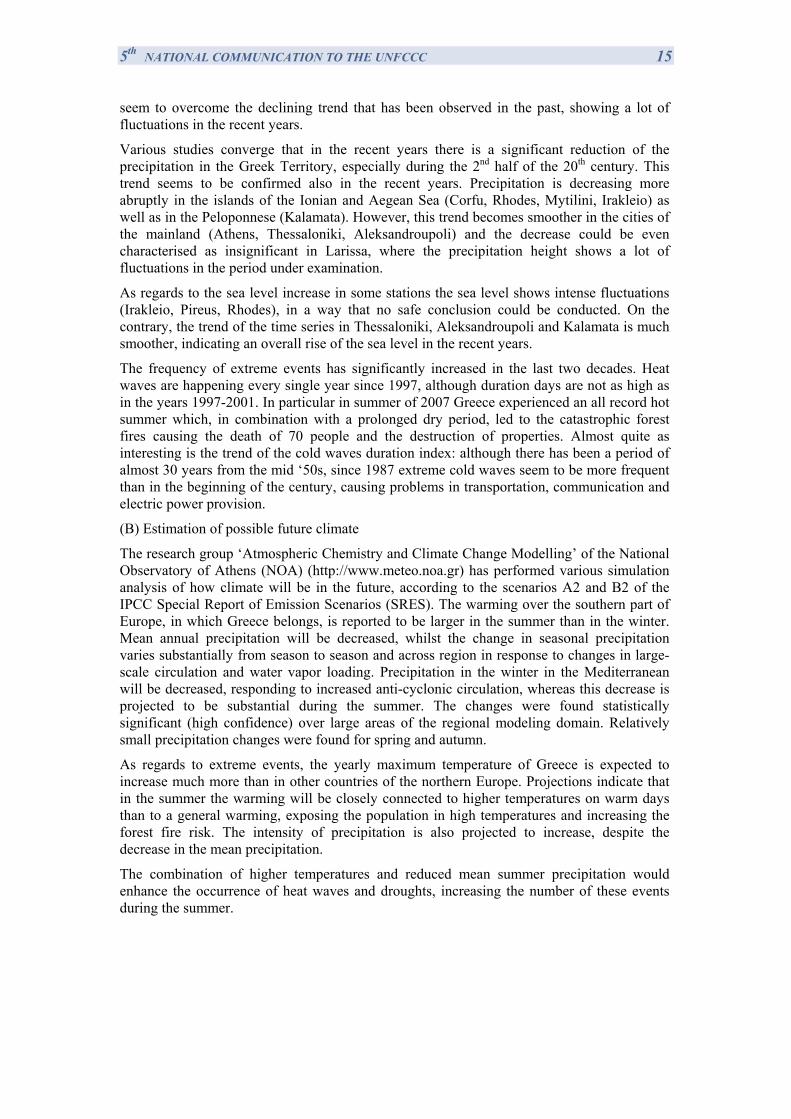
Table 1.9 Aggregate effect of planned policies and measures (kt CO2 eq) Effect of implemented and adopted policies and
measures Policies and Measures 2010 2015 2020
Promotion of Natural Gas 434 2,299 3,236 Promotion of Renewable Energy Sources 593 4,185 6,641 Measures in Industry 660 1,715 1,885 Measures in Residential & Tertiary Sector 0 3,027 5,361 Measures in Transport Sector 52 444 1,115 Total Effect 1,739 11,670 18,238
1.4.3 Supplementarity relating to mechanisms under Article 6, 12 and 17, of the Kyoto Protocol
According to 2nd National Climate Change Programme adopted in 2002 and the latest projections presented in Chapter 5.1, Greece has the ability to reach its Kyoto Protocol target for the 1st commitment period with the existing implemented and adopted policies and measures and the implementation of EU-ETS. For this reason, Greece has not as yet fully exploited the opportunities or allocated a specific budget for the use of the JI and CDM.
However, JI and CDM credits are expected to be utilized by the installations subject to the EU-ETS. According to the National Allocation Plan 2008-2012, installations are allowed to use for compliance credits from these two mechanisms up to 9% of their allocated allowances. This figure was calculated according to the supplementarity principle of the Kyoto Protocol.
1.4.4 Methodology used for the presented GHG emission projections
For scenario development and projections two main model types / procedures have been used:
The TIMES / MARKAL model for the energy sector.
Spreadsheet models for the non-energy sectors, in which future changes in activity data are mainly derived from statistical analysis while emission factors are derived from expert assessments based on the IPCC guidelines.
1.5 Vulnerability Assessment, Climate Change Impacts and Adaptation Measures
1.5.1 Climate Change Impact
(A) Current Climate
Since the ‘90s Greece is experiencing an annual increase of temperature of about 0.4-0.60C, as to the mean values of 1961-1990. This increase is mostly due to a steady rise of temperature during summer period (from April to September). These results are in line with the values used in the fourth national communication. On the contrary, winter temperatures
5th NATIONAL COMMUNICATION TO THE UNFCCC 15 seem to overcome the declining trend that has been observed in the past, showing a lot of fluctuations in the recent years.
Various studies converge that in the recent years there is a significant reduction of the precipitation in the Greek Territory, especially during the 2nd half of the 20th century. This trend seems to be confirmed also in the recent years. Precipitation is decreasing more abruptly in the islands of the Ionian and Aegean Sea (Corfu, Rhodes, Mytilini, Irakleio) as well as in the Peloponnese (Kalamata). However, this trend becomes smoother in the cities of the mainland (Athens, Thessaloniki, Aleksandroupoli) and the decrease could be even characterised as insignificant in Larissa, where the precipitation height shows a lot of fluctuations in the period under examination.
As regards to the sea level increase in some stations the sea level shows intense fluctuations (Irakleio, Pireus, Rhodes), in a way that no safe conclusion could be conducted. On the contrary, the trend of the time series in Thessaloniki, Aleksandroupoli and Kalamata is much smoother, indicating an overall rise of the sea level in the recent years.
The frequency of extreme events has significantly increased in the last two decades. Heat waves are happening every single year since 1997, although duration days are not as high as in the years 1997-2001. In particular in summer of 2007 Greece experienced an all record hot summer which, in combination with a prolonged dry period, led to the catastrophic forest fires causing the death of 70 people and the destruction of properties. Almost quite as interesting is the trend of the cold waves duration index: although there has been a period of almost 30 years from the mid ‘50s, since 1987 extreme cold waves seem to be more frequent than in the beginning of the century, causing problems in transportation, communication and electric power provision.
(B) Estimation of possible future climate
The research group ‘Atmospheric Chemistry and Climate Change Modelling’ of the National Observatory of Athens (NOA) (http://www.meteo.noa.gr) has performed various simulation analysis of how climate will be in the future, according to the scenarios A2 and B2 of the IPCC Special Report of Emission Scenarios (SRES). The warming over the southern part of Europe, in which Greece belongs, is reported to be larger in the summer than in the winter. Mean annual precipitation will be decreased, whilst the change in seasonal precipitation varies substantially from season to season and across region in response to changes in large-scale circulation and water vapor loading. Precipitation in the winter in the Mediterranean will be decreased, responding to increased anti-cyclonic circulation, whereas this decrease is projected to be substantial during the summer. The changes were found statistically significant (high confidence) over large areas of the regional modeling domain. Relatively small precipitation changes were found for spring and autumn.
As regards to extreme events, the yearly maximum temperature of Greece is expected to increase much more than in other countries of the northern Europe. Projections indicate that in the summer the warming will be closely connected to higher temperatures on warm days than to a general warming, exposing the population in high temperatures and increasing the forest fire risk. The intensity of precipitation is also projected to increase, despite the decrease in the mean precipitation.
The combination of higher temperatures and reduced mean summer precipitation would enhance the occurrence of heat waves and droughts, increasing the number of these events during the summer.
5th NATIONAL COMMUNICATION TO THE UNFCCC 16 1.5.2 Vulnerability assessment
1.5.2.1 Energy sector
Climate change will affect both the energy input and the energy demand.
According to the National Observatory of Athens (National Observatory of Athens, 2007), general remarks on the energy input are summarized in the following:
• Hydropower will be the renewable energy source mostly affected by climate change, while wind power generation and photovoltaic panels are not expected to be significantly affected.
• The air temperature increase will reduce the efficiency of thermoelectrical units due to the increased needs for cooling water.
There will also be an increase of the loss on electricity distribution networks. The increase of the frequency of extreme events is estimated to increase damages on power generation infrastructure and power distribution networks resulting in an increase of the frequency and the duration of power cut.Warmer climate conditions will probably lead to decreased electricity demand in winter and increased electricity demand during summer, as a result of the increase of summer days. Moreover, the effect of higher temperatures in summer is likely to be considerably larger on peak energy demand than on net demand, suggesting that there will be a need to install additional generating capacity over and above that needed to cater for underlying economic growth . The increase of the cold degree days will be quite important in northern part of Greece, leading to the corresponding increase in the electricity demand. A change of energy sources is also expected to occur in the country: a low water supply reduces energy production from hydroelectric plants, as well as from conventional power plants, which require water for cooling and for driving the turbines. On the other hand, conditions for renewable energy production, such as solar power, may improve under climate change.
1.5.2.2 Agriculture
Greece, as a part of the southern Mediterranean countries, is expected to suffer from various changes in the currently cultivated crops. In general, changes in yields are expected in the future (2070-2099) due to shorter growing season, extreme events during developing stages, higher risk of heat stress during flowering period, higher risk of raining days during sowing dates, higher rainfall intensity, longer dry spells.
1.5.2.3 Tourism
The increased temperatures during summer can lead to the gradual decrease of summer tourism in the Mediterranean, but in increase during spring and autumn. Studies have shown that climate change will lead to the prolongation of the touristic period in Greece and Spain up to 2030, in a way that the arrival of tourists can be allocated more homogenously, decreasing the intensity of the water scarcity and energy consumption issues in the islands during summer.
Attica and Heraclio (Crete) are the touristic areas that will experience the higher rate of water change that might result to shortages that would affect touristic activities, while the islands of the Aegean, and especially the Cyclades, seem to keep their cool climate, indicating that the impact of the sea is very important in the moderation of increased temperatures.
5th NATIONAL COMMUNICATION TO THE UNFCCC 17 1.5.2.4 Water resources
Quantity and quality water problems caused by climate change are mainly attributed to the projected decrease of precipitation during the summer months and also to the salinisation of the water as a result of coming in contact with the sea. The geomorphology of the country, and especially the large number of islands, is responsible for an additional problem: in many cases the large demand of water of special large hydrological regions is of the same order of the sum of smaller hydrological and dispersed areas. In the same time, the water supply centres are equally dispersed and the estimation of their availability depends on the construction of hydrological balances for a large number of small hydrological basins.
Major drought episodes are projected to become more frequent with particularly intense summer droughts. This may be further exacerbated because of an increasing demand for water as a result of elevated temperatures. Greece is among the countries that are expected to be worst hit by an increase in frequency and severity of droughts and water scarcity. Heat waves will affect tourism activities as well as people’ health and enhance energy consumption for cooling purposes.
1.5.2.5 Biodiversity
Climate change has a very important impact on the marine environment of Greece. Many of the environmental mechanisms controlling growth, abundance, distribution, composition, diversity and recruitment success of Mediterranean species that are quite abundant in the Greek seas, like anchovy (Engraulis encrasicolus) or sardine (Sardinella aurita and Sardina pilchardus), include: regional temperature variations, riverine inputs and wind-induced mixing, which influences sea surface temperature and salinity, hydrographical features as well as nutrient enrichment and planktonic production.
The main impacts of climate change on the forest biodiversity in Greece are linked to the forest increase of temperature and decrease of precipitation and to the forest fires.In Greece the most vulnerable forest ecosystems are the ones whose spreading is spatially limited. These forests include the forests of islands and coastal zones and the forests in the mountains of South Greece, like Taigetos and Parnonas. However, the summer of 2007 has shown that apart from the mountain forests of South Greece, even the ones in the North of the country are becoming more vulnerable due to climate change.The predicted increase of the mean minimum winter temperature could affect forests that are used in a colder climate. The national parks of the country will be also affected by the rise in the temperature. Another important impact of climate change on the forests is forest fires. Most of the areas in the Greek territory show a generally increasing trend of the extreme risk of forest fires by 10 days.
1.5.2.6 Desertification
The potential desertification risk in Greece is estimated primarily by the National Committee for Combating Desertification. The main reasons for the desertification are soil erosion and salinisation. The pressures that are associated to climate change and lead to soil desertification are drought, over-exploitation of land (including over-grazing) and water resources, irrational irrigational schemes, forest fires and land abandonment. On the other hand, salinization is also associated(though not uniquely) with climate change.
The most significant impacts of droughts in the Nestos and the Mornos Basins refer to stream flow reduction and the reduction in agricultural production. In addition, in the Nestos River Basin an important effect on the wetland ecosystem and biodiversity loss have been
5th NATIONAL COMMUNICATION TO THE UNFCCC 18 observed. In the Mornos River Basin the pressure on the water supply system of the city of Athens has been a very significant issue.
1.5.2.7 Coastal areas
The issue of possible impacts of climate change on Greek coastal areas becomes even more important given the geomorphology of the country and the high percentage of population living in these areas. The potential impacts include water availability, erosion and flooding, coastal ecosystems, sea level rise.
1.5.3 Adaptation measures
In most of the cases, the adaptation measures that are currently under implementation in Greece are part of a broader network of measures that applies to the specific areas of identified vulnerabilities. However, the Ministry of Environment, Energy and Climate Change has planned, in the context of the National Strategic Reference Framework for the period 2007-2013, the following projects to be implemented:
• Study of the vulnerability of the Greek coastal areas & proposals of appropriate adaptation policies and measures.
• Study of the impacts of climate change per geographical prefecture.
• Elaboration of a National Strategy for the Adaptation to Climate Change.
In particular, the elaboration of the national adaptation strategy is in line with the suggestion performed by the ERT in the centralized in-depth review of the 4th National Communication.
The Operational Programme “Environment – Sustainable Development” (former Ministry for the Environment, Physical Planning and Public Works, September 2007), that has already been approved by the European Commission in 2007, includes the following priority axis that are related to adaptation to climate change:
• Protection of the Atmospheric Environment & Response to climate change – Renewable Energy Sources
• Water resources management and protection
• Prevention and response to environmental danger
• Protection of the natural environment and of Biodiversity
In line with this spirit, the General National Framework for Spatial Planning and Sustainable Development (National Gazette 128 A/3.7.2008) includes the following measures that could be considered as adaptive to climate change:
− Rapid promotion of the RES use
− Infrastructure for the generalization of natural gas use (esp. in the field of electricity production)
− Energy saving measures
− Forest fire prevention measures and reforestation measures
− Implementation of bioclimatic architecture
5th NATIONAL COMMUNICATION TO THE UNFCCC 19
− Reinforcement of the natural regeneration mechanisms (forests, wetlands etc.) and of their biodiversity.
− It should be also noted that some policy orientations going through the entire General Framework Spatial Plan could be considered as indirect adaptation measures.
1.5.3.1 Coastal Zone Management
At operational level, measures are mainly undertaken on an ad-hoc basis. Part of the strategy to cope with the consequences of climate change in coastal zones is already embedded in the law concerning the creation of new settlements or the expansion of existing ones.
Additional useful provisions exist in the Specific Framework Spatial Plans that were published in the Government Gazette in the first semester of 2009 and refer to Tourism and Industry. The provisions of the Specific Framework Spatial Plan for Tourism include specific commitments for the coastal zones, in order to reduce potential impacts of climate change. Furthermore, in order to promote the management of coastal zones that are exposed to particular and complex pressures, including the climate change impacts, a Specific Framework Spatial Plan of Coastal Areas and Islands has been elaborated and presented to the public.
The draft Specific Framework Spatial Plan of Coastal Areas includes an action programme addresses the risk of flooding and erosion by proposing a “non-edificandi” set-back zone of 50 to 100 m (depending on the altitude), in which building will be prohibited.
1.5.3.2 Water resources
Apart from the Framework for Spatial Planning, that has been already mentioned, Water Scarcity and Drought Management Strategies are being implemented. Integrated Water Resources Management has been placed in the centre of priorities. In parallel, the uneven spatial and seasonal distribution of water resources in Greece is being addressed more effectively than in the past, aiming at adapting to prolonged droughts by elaborating and implementing Regional Strategies that are compatible with the EU Water Framework Directive, while the preparation of the implementation of the EU Marine Strategy Framework Directive is being underway..
The Central Water Agency has been established in 2006 in accordance with the European Water Framework Directive. This agency has been tasked to define a national water policy for Greece and to coordinate the activities of regional directorates. Water Council, consisting of about 30 members (stakeholders, NGOs), provides a consultative function in each region. Greece updated its water management framework by adopting first a new water law (Law 3199/2003) in December 2003, and then the measures and procedures for integrated water resource management in 2007 (Presidential Decree 51/2007).
The National Strategy for the Management of Water Resources aims, among others to the sustainable use of existing water reserves. Regional objectives will be set out in the 14 river basin management plans, to be finalised by the end of 2009 (as required by the WFD). Also, the pre-mentioned measures in the context of the Operational Programme for Environment and Sustainable Development 2007-2013 are considered as a main framework to address water management issues raised by different pressures, including climate change.
Other adaptation measures include the pricing of municipal water services.
5th NATIONAL COMMUNICATION TO THE UNFCCC 20 Finally, it should be also mentioned that Greece, as leader of the Mediterranean Component of the EU Water Initiative, has taken up various actions to assist the efforts of the Mediterranean countries in building adaptation measures. All the actions are described in Chapter 7, section 7.5.1.1 (Mediterranean Component of the EU’s Initiative ‘Water for Life’ (MED EUWI)).
1.5.3.3 Agriculture & Forests
The National Strategic Plan of Rural Development 2007-2013 identifies the priorities of Greece for the period 2007-2013. The national strategy is implemented via the Program of Rural Development 2007-2013 “ Aleksandros Mpaltatzis” (Hellenic Ministry of Rural Development and Food, November 2007), where priorities have been set in order to adapt to climate change.
1.5.3.4 Other areas of concern
Biodiversity
Greece continues to extend the protected areas network, holding a large variety of Mediterranean habitats included in the reference list of the Natura 2000 initiative (EU Bird Directive 79/409/EEC and Habitat Directive 92/43/EEC): from open sea, tidal areas and sea dunes, to several types of shrubs and grasslands and Mediterranean mountainous forests of coniferous. The Natura 2000 network covers 21% of the Greek land surface and 5.5% of the territorial waters.
Greek legislation provides for the protection of a large number of native flora and wildlife species (916 plants, 139 vertebrates and 82 invertebrates), and for strict controls over international trade of species. Protected areas represent an instrument for species conservation. Outside protected areas, measures for species protection include regulation on the hunting period, a binding fishing code, access restrictions, limited user rights, and compensations for income loss.
The National Biodiversity Strategy, that is currently being re-evaluated by the new Public Administration structure # and based on the priorities of the new government, includes the objectives of “Contribution to the response to climate change, adaptation to it and reduction of the impacts in biodiversity through adaptation actions to climate change”.
Floods
Floods are an important impact that is indirectly caused by climate change. In Greece the problem is quite severe, since the catastrophic forest fires (of 2007 and also the recent ones of summer 2009) have caused additional soil erosion. Various preventive adaptation measures have been planned and are currently implemented, as part of a wider flood-preventive policy as described in the previous sections.
In addition to the above, the General Secretariat of Civil Protection (http://www.gscp.gr) has issued in September 2009 a circular regarding the Civil Protection planning and actions for facing the risk of flooding events. Apart from the enumeration of adaptation measures that are currently implemented in the country, in the circular the obligations of several authorities before, during and after a flood in the whole of the Greek territory are explicitly defined. Also, the Civil Protection Secretaries of the Prefectures that are responsible for the public awareness in case of heavy precipitation and floods are also responsible for providing further advisory services to special groups of citizens, like stock farmers and peasants.
5th NATIONAL COMMUNICATION TO THE UNFCCC 21 Desertification
As described in the 4th National Communication, the National Action Plan for Combating Desertification has been approved since 2001 through a Common Ministerial Decision (996005/31719). The implementation of the plan is co-ordinated by the National Committee to Combat Desertification, The Ministry of Rural Development and Food ensures secretarial and technical support to the committee, which brings together relevant ministries, universities and research institutes and NGOs to: formulate proposals for combating desertification; co-ordinate national, regional and local action plans; pursue co-operation with the EU and other international bodies on desertification programmes; promote research; and raise public awareness.
1.6 Financial Resources and Transfer of Technology
Greece’s net bilateral and multilateral Official Development Aid (ODA) disbursements have indicated increasing trends over recent years in absolute terms and, in 2008, also as a percentage of the GNI. Greece's current goal is to progressively increase its ODA/GNI ratio to 0.51% by 2012. In 2008, Greece’s ODA totaled USD 708 million, of which USD 391 million were channeled as multilateral ODA, while bilateral ODA amounted to USD 317 million. The ratio of ODA/GNI in 2008 stood at 0.21%, compared to 0.16% in the previous year, representing an increase, in absolute terms, of USD 207 million. This rise was due both to an increase of Greece’s contribution to multilateral international organisations and to the rise of bilateral ODA.
Climate change is an important dimension of Greece’s bilateral development assistance and co-operation policy, particularly with respect to Least Developed Countries. It is noteworthy that bilateral aid directed towards Least Developed Countries has risen substantially over recent years. More specifically, aid to African countries rose by approximately 50% in 2008 compared to the previous year (USD 44.42 million versus USD29.68 million in 2007), while aid to Sub-Saharan African countries registered a 48% increase (USD 24.96 million versus USD 16.86 million in 2007). These trends translate a shift in Greece’s development cooperation financing priorities, aiming to intensify support towards Least Developed Countries, by providing new and additional funds in favour of the latter.
A substantial part of Greece’s multilateral ODA is dedicated to organizations and/or programmes aiming to address global environmental issues and to support national sustainable development initiatives, including capacity-building activities related to technology transfer for limiting/reducing GHG emissions, implementation of the UNFCC Convention and preparations for effective participation in the Kyoto Protocol.
Greece has contributed to the Global Environment Facility’s (GEF) Replenishments Contributions to the UNFCCC Fund amounted to an average annual amount of USD 85,000, with increasing trends. Greece’s multilateral and multi-bilateral economic contributions to UN environmental related Organisations, Secretariats and Funds over the period 2003-2008 amounted to approximately EURO13.3 million.
Through its multilateral ODA, Greece is currently intensifying its efforts on financing adaptation to climate change programmes in Least Developed Countries and in regions that, due to their geographical location, are most vulnerable to climate change (Sub Saharan Africa and Small Island Developing States). Greece entered into medium term (4 years) funding arrangements for climate change adaptation and mitigation programmes with:
the African Union (AU) (September 2008) for a total amount of EUR 12 million.
5th NATIONAL COMMUNICATION TO THE UNFCCC 22
the Caribbean Community Climate Change Centre (CARICOM CCC) (September 2008) for a total amount of EUR 4 million.
the Indian Ocean Committee (IOC) (September 2009) with a total budget of EUR 4 million.
Greece has agreed (September 2009) to contribute EUR 2 million in 2010-2011 to the World Meteorological Organisation (WMO), to a programme of improved climate information services for climate change adaptation in East and Central Africa.
Greece is engaged in a number of environmental cooperation and transfer of technology regional initiatives, the most important of which involves leadership of the Mediterranean Component of the EU’s Initiative ‘Water for Life’ (MED EUWI), in the follow up of the World Summit for Sustainable Development (WSSD), and cooperation on environmental protection within the Black Sea Economic Cooperation (BSEC) Organisation through the BSEC Hellenic Development Fund (BSEC-HDF). At the same time, Greece finances bilateral projects in a number of developing countries, aiming to facilitate the access to, or transfer of environmentally sound technologies and to promote the use of RES in developing countries as well as in countries with economies in transition.
1.7 Research and Systematic Observation
1.7.1 Research
The General Secretariat of Research and Technology of the Ministry of Education, Lifelong Learning and Religious Affairs (before October 2009 the Secretariat was under the responsibility of the Ministry of Development) is the responsible institution for supporting and promoting research in Greece.
Reseatch inn Greece is carried out at Research Centres, Universities and to some extend in industry. The main funding sources in the research sector in Greece include public and private funds. Public funds are provided by the national budget, by the Programme of Public Investments, Structural Funds and also the European Commission’s funds. The Gross Domestic Expenditure on R&D (percentage of GDP) is estimated at 0.57% for 2007, while in 2005 the 46.8% has been funded by the State and the 31.1% by the Business Enterprise sector (EUROSTAT, 2009).
Funds that derive from the regular national budget, on an annual basis and at a more limited range than the ones of the Programme of Public Investments, concern principally the covering of the operational need of Universities and National Research Centres (including the conservation and operation of the GCOS network whenever applicable).
Programmes that are funded from Structural Funds are included in the European Commission’s Support Frameworks and are managed by the Ministry of Economy.The main means of European Funds in the area of Research are the Framework Programmes. The 7th Framework Programme for Research and Technological Development (7th FP), has started in 2007 and will be completed in 2013. Until October of 2008 the Greek research organisations have obtained contributions of about 121MEuros, through the 7th FP. According to information from the European Commission (European Commission - European Research Area, 2009), up to now the 3.3% of signed grant agreements regard the sector of “Energy and Environment (including Climate Change).Regional development is substantial for the increase of the research potential in the EU. Greece is recieving this kind of support in the Research sector, in the context of the ‘Convergence’ objective, that is financed by the European Regional Development Fund.
5th NATIONAL COMMUNICATION TO THE UNFCCC 23 International cooperation in the field of research is ensured by the implementation of projects. Greece in the past has participated in a number of bilateral and cross-border programmes.
During the new programming period, the Community Initiative Programmes are replaced by the Programmes of Goal III "European Territorial Cooperation". The objective of “European Territorial Cooperation” is offering an important support to research and innovation. The total budget of Goal III programmes amounts to EUR 8.7 billion, of which EUR 210 million from the European Regional Development Fund (ERDF) have been earmarked for Greece. Thus, also including national resources, nearly EUR 300 million of Community and national resources will be allocated to European Territorial Cooperation Programmes.
Three programmes of the cross-border regions of Greece are aimed to research and are co - financed by Greece and the European Regional Development Fund: Adriatic Programme, Mediterranean Sea Basin, Black Sea.
Greece participates in two transnational programmes: MEDA Programme, resulted from the merger of the INTERREG, ARCHIMED and MEDOCC Programmes, and Southeast Europe Area, resulted from the division of the CADSES programme into two different zones, north and south.
Greece participates also in the INTERREG IV C interregional programme and in the INTERACT, ESPON and URBACT networks.
The above mentioned programmes are including various projects that are directly or indirectly related to climate change observation, mitigation and adaptation actions.
The main institutes that perform research in the sector of climate change in Greece are: the Hellenic National Meteorological Service (HNMS)
the National Observatory of Athens,
the Academy of Athens,
the Hellenic Centre for Marine Research,
the National Technical University of Athens,
the National & Kapodistrian University of Athens,
the Aristotle University of Thessaloniki,
the University of the Aegean,
the National Agricultural Research Foundation.
In addition, there are other institutes in Greece that are working on research areas that are related to climate change (i.e., forest fires, water management, coastal zones, biodiversity new energy technologies), like the Agricultural University of Athens, the University of Patras, the Technical University of Crete, the Greek Biotope/Wetland Centre, the Centre for Renewable Energy Sources and Saving - CRES etc.
1.7.2 Systematic Observation
The network of systematic observation of climatic parameters in Greece includes the Hellenic National Meteorological Service (HNMS), services of the Greek Armed Forces, the Ministry
5th NATIONAL COMMUNICATION TO THE UNFCCC 24 of Rural Development and Food, the Ministry of Environment, Energy and Climate Change, the School of Civil Engineering in the NTUA,as well as a number of national research centres (National Observatory of Athens, Hellenic Centre for Marine Research, etc.). Furthermore, the Public Power Corporation of Greece (PPC) operates a network of meteorological stations in the vicinity of its thermal and hydro power plants and dams for electricity production.
Greece is a member of the European organization for the exploitation of Meteorological Satellites (EUMETSAT), the consortium that operates the meteorological observation satellite METEOSAT, and is represented in EUMETSAT by HNMS. In addition, Greece is a member of ESA and participates in basic, as well as in optional, research projects. Greece also participates in three actions of the Global Monitoring for Environment and Stability (GMES) program of ESA. Also, the HCMR is a member of the European Global Ocean Observating System (Eur-GOOS).
1.8 Education, Public Awareness
1.8.1 Education
As part of the Greek programme for the implementation of the Convention and the New Delhi Programme, the following programmes are being carried out, aiming at the integration of climate change issues at all educational levels and disciplines, the dissemination of information and promotion of participation of youth, stakeholders, and public, as well as the enhancement of cooperation and co-ordination at regional and international level.
The environmental education has been considered a priority in the Greek educational system as early as the beginning of 1980’s. In Greek schools it is implemented in three forms:
(a) Standard environmental education that is included in the school programmes.
(b) Optional activities including the study of special environmental issues on a voluntary basis
(c) Informal activities that reflect the environmental culture of each concrete school and of the school environment.
The Ministry of Education, Lifelong Learning and Religious Affairs (M.E.) published in October 2007 and in October 2009 two circulars regarding the Planning and Implementation of School Activities Programmes regarding, among others, the environmental education for the school years 2007-2008 and 2009-2010 respectively. The issue of climate change is especially treated in these programmes.
Under the M.E., the Educational Institute of Greece is providing substantial guidance on environmental education to teachers. In the respective website, entitled “Environmental Education”, the Institute suggests specific projects of environmental issues that could be applied by teachers regarding the climate, the forests and the energy forms.
The Environmental Education Centres (EEC) are also involved in the implementation of educational programmes and activities. Currently 69 EECs are operating in Greece (http://kpe-kastor.kas.sch.gr/kpe/pe/kpe.htm). Several educational programmes related to climate change have been developed in the EECs during 2008-2009, referring to different aspects of the issue (tourism and climate change, wetland ecosystems, sea life and fisheries etc.).
In the context of the UN Decade of Education for Sustainable Development 2005-2014, the Ministry of Education has planned various educational actions for the decade 2005-2014,
5th NATIONAL COMMUNICATION TO THE UNFCCC 25 aiming at the development of school activities that support the formation of energetic citizens and at the same time promote the opening of the school to the society.
Other Environmental Education Activities include the School Programmes of Environmental Education, that have been implemented in the period 2002-2006 by the University of the Aegean and are included in the Best Practices of the Community Support Framework in Greece, as well as the National Thematic Networks of Environmental Education 2005-2009.
Greece has participated in various meetings that promoted the close cooperation between the Ministries of Education and Environment, in the context of the United Nations Economic Commission for Europe (UNECE) and adopted the Strategy for the Education for Sustainable Development.
A number of programmes are implemented in the framework of UNESCO, with the support of the Hellenic National UNESCO Committee.
The Hellenic Association of Teachers for Environmental Education (HATEE) has been established in 1992, and since then it aims at the mutual support, the exchange of views and the coordination between teachers within the framework of environmental education activities.
A substantial number of environmental non-governmental organizations (NGOs) are active on environmental education issues, promoting at the same time awareness on specific environmental issues. Also, Greece launched in the WSSD and is leading the implementation of the Mediterranean Educational Initiative for Environment & Sustainability - MEdIES. MEdIES is a Type II Initiative on ESD, supported financially by the Hellenic Ministry of Environment and officially approved by the Hellenic Ministry of Education. Leading partners are also MIO-ECSDE together with UNEP/MAP and UNESCO. Its confirmed partners include several Ministries of Environment, Universities, IGOs and NGOs as well as schools.
Regarding Education in universities and technical education centres, the establishment of new departments dealing with environmental issues and the enlargement of the scientific content of many existing ones during the recent years, have created a significant technical knowledge on climate change issues and their causes, both at the level of research as well as - progressively - at the level of higher education.
Recognizing the rapid development of scientific fields and institutional frameworks related to climate change mitigation and adaptation, an increasing number of Greek scientific and educational institutions extend their activities in the area of continuous education, in order to contribute to the enhancement of scientific knowledge in public administration, private enterprises and the citizens in general.The public institution that plans and executes the actions in lifelong education in Greece is the General Secretatariat of Lifelong Learning (http://www.gsae.edu.gr/, available in greek only), that is functioning under the Ministry of Education.
Finally, non-educational institutions and research centers play an important role in producing educational material and in organizing activities of continuous education on issues related to climate change.
1.8.2 Environmental information and awareness
Environmental information and awareness is taking place through different tracks, including Governmental initiatives (Hellenic Parliament’s Permanent Special Committee on Environmental Protection, the Ministry of Environment, Energy and Climate Change –
5th NATIONAL COMMUNICATION TO THE UNFCCC 26 MEECC, Ministry of Foreign Affairs, Ministry of Infrastructure, Transport and Networks, Ministry of Rural Development and Agriculture).
Some of the MEECC’s (former Ministry for the Environment, Physical Planning and Public Works), actions include:
The creation of “Centres for Environmental Information” for environmental protection and administration Institutions in Balkan countries, on issues of environmental politics and administration (in the framework of DAC/OECD)
The National Network for Environmental Information for the registration and processing of information related to the state of the environment in local, regional and national level.
The National Centre for the Environment and Sustainable Development – NCESD, supervised by MEECC, provides consultancy to the Greek State on environmental and sustainable development issues, through the provision of permanent, reliable and objective information, technical knowledge and proposals.
The Special Service of Environmental Inspectors – SSEI, established in 2003, a control mechanism for the enforcement of environmental legislation and the protection of environment, aiming, among others, to the achievement of sustainable development of the country’s regions.
public competitions in special issues regarding adaptation and mitigation techniques.
During the rotating annual Chairmanship of the Human Security Network (HSN), Greece (Ministry of Foreign Affairs) chose to focus its activities on the human security implications of climate change in developing countries. The objective of the Hellenic Chairmanship was to raise, at a global level, awareness on the impacts that changing living conditions (caused by the climatic change) can have on peoples’ security in developing countries, with a special emphasis on the implications that these circumstances can have on three particularly vulnerable groups, namely women, children and populations fleeing their homes as a result of climate change.
In the recent years many municipalities are becoming more interested in the climate change issue, in a way that relative local activities and events are becoming much more often than in the past. Non-governmental Organisations are also taking initiatives relating to climate change isssues. Apart for the NGOs, a number of institutions of the civil society show an increasing interest on energy, climate change and environmental issues.
1.8.3 International cooperation
Apart from the cooperating actions included in the above mentioned programmes, initiatives to enhance cooperation in regional and international level in the areas and promote capacity building in the areas of education, dissemination of information and awareness, mitigation and adaptation, are taking place, including:
a. Since the WSSD in 2002, Greece has been very active on promoting Education for Sustainable Development (ESD), also encompassing climate change issues, on the regional and international levels. Greece launched in the WSSD, and is leading, the implementation of the Mediterranean Educational Initiative for Environment & Sustainability - MEdIES. Greece is also chairing the UNECE Steering Group on ESD responsible for the follow up of the implementation of the ESD Strategy by UNECE countries.
b. Governmental initiatives with countries of the Africa region,
The different levels of cooperation between Greece and the African countries can be summarized as cooperation at international level through UN organizations - CSD, UNDP,
5th NATIONAL COMMUNICATION TO THE UNFCCC 27 UNEP, GEF, cooperation at regional level, with emphasis on the Mediterranean region, through multilateral processes, such as the Barcelona Convention and the Mediterranean Action Plan of the United Nations Environment Programme (UNEP/MAP), the Mediterranean Commission for Sustainable Development (MCSD), the MED EUWI, the “Barcelona Process: Union for the Mediterranean”, and cooperation at bilateral level.
Greece has established inter-governmental Agreements with a number of African countries on several sectors, such as: economic/scientific/technical cooperation, tourism, air transport, agriculture, maritime, legal issues, protection of investments, taxation issues. Economic / commercial relations were developed and Official Development Assistance (ODA) provided in African countries in sectors such as environment and climate change, education and training, health, culture, water, employment and food/humanitarian aid.
In 1999, the Ministry of Environment began a Bilateral Development Assistance Programme The Ministry’s efforts focused on capacity building, and promoted the principles of demand-driven projects and local ownership. Greece, through the Ministry of Environment, financed the initial phase of four Type II Initiative Partnerships, which were launched during WSSD and involved NGOs and other stakeholders as implementation actors.
A main consideration of the Hellenic Chairmanship of the Human Security Network (2007-2008, was that adaptation programs to climate change in developing countries will greatly contribute to limiting the threats against human security, while increasing the chances for achieving the MDGs. In this respect, Greece has already started setting, in cooperation with international and regional organisations, special trust funds for adaptation programs to climate change in Africa and Small Island States.
Also, Greece, as a Member State of the EU, actively participates in the EU-Africa cooperation, and as a Donor country in the EU - Africa Infrastructure Trust Fund.
Cooperation at a bilateral level
Greece is currently further intensifying its efforts regarding ODA focusing at climate change adaptation. For example, Greece is currently financing programmes for adaptation to climate change in Least Developed Countries and in regions that, due to their geographical location, are under severe danger from climate change which mainly include Africa and Small Island States. In order to ensure the best possible utilization of funds and distribution to programmes according to the most significant needs of the threatened regions, the Hellenic development assistance plan is implemented in coordination with regional organizations of the areas under consideration, such as the African Union.
5th NATIONAL COMMUNICATION TO THE UNFCCC 28
TABLE OF CONTENTS
CHAPTER 1. EXECUTIVE SUMMARY.............................................................................. 1
1.1 National Circumstances.................................................................................... 1 1.1.1 Government structure ....................................................................................... 1 1.1.2 Population......................................................................................................... 1 1.1.3 Geographic and climate profile ........................................................................ 1 1.1.4 Economic profile .............................................................................................. 2 1.1.5 Transportation .................................................................................................. 2 1.1.6 Energy system .................................................................................................. 2 1.1.7 Waste ................................................................................................................ 3
1.2 Greenhouse gas inventory information ............................................................ 4 1.2.1 Emissions / Removals of GHG in Greece for the period 1990 – 2007............. 4 1.2.2 National System for the GHG emissions/removals inventory.......................... 7 1.2.3 National registry ............................................................................................... 8
1.3 Policies and Measures ...................................................................................... 9 1.3.1 Policy-making process ..................................................................................... 9 1.3.2 Results of policies and measures...................................................................... 9 1.3.3 Minimization of adverse effects ..................................................................... 10
1.4 Projections and the Total Effect of Policies and Measures ............................ 11 1.4.1 Projections ...................................................................................................... 11 1.4.2 Assessment of aggregate effects of policies and measures ............................ 13 1.4.3 Supplementarity relating to mechanisms under Article 6, 12 and 17, of the Kyoto Protocol ................................................................................................................ 14 1.4.4 Methodology used for the presented GHG emission projections................... 14
1.5 Vulnerability Assessment, Climate Change Impacts and Adaptation Measures ........................................................................................................................ 14
1.5.1 Climate Change Impact .................................................................................. 14 1.5.2 Vulnerability assessment ................................................................................ 16
1.5.2.1 Energy sector ............................................................................................... 16 1.5.2.2 Agriculture................................................................................................... 16 1.5.2.3 Tourism........................................................................................................ 16 1.5.2.4 Water resources ........................................................................................... 17 1.5.2.5 Biodiversity ................................................................................................. 17 1.5.2.6 Desertification ............................................................................................. 17 1.5.2.7 Coastal areas ................................................................................................ 18
1.5.3 Adaptation measures ...................................................................................... 18 1.5.3.1 Coastal Zone Management .......................................................................... 19 1.5.3.2 Water resources ........................................................................................... 19 1.5.3.3 Agriculture & Forests .................................................................................. 20 1.5.3.4 Other areas of concern................................................................................. 20
1.6 Financial Resources and Transfer of Technology .......................................... 21 1.7 Research and Systematic Observation............................................................ 22
1.7.1 Research ......................................................................................................... 22 1.7.2 Systematic Observation .................................................................................. 23
1.8 Education, Public Awareness ......................................................................... 24 1.8.1 Education........................................................................................................ 24 1.8.2 Environmental information and awareness .................................................... 25
5th NATIONAL COMMUNICATION TO THE UNFCCC 29
1.8.3 International cooperation................................................................................ 26 TABLE OF CONTENTS ........................................................................................................ 28 TABLES ........................................................................................................................ 35 FIGURES ........................................................................................................................ 40 CHAPTER 2. NATIONAL CIRCUMSTANCES................................................................. 43
2.1 Government structure ..................................................................................... 43 2.2 Preparation of national communications ........................................................ 45 2.3 Population....................................................................................................... 45 2.4 Geographic profile.......................................................................................... 46
2.4.1 Geomorphologic characteristics ..................................................................... 46 2.4.2 Ecosystems ..................................................................................................... 46 2.4.3 Land use ......................................................................................................... 47
2.5 Climate profile................................................................................................ 47 2.6 Economic profile ............................................................................................ 49
2.6.1 General ........................................................................................................... 49 2.6.2 Primary sector................................................................................................. 52
2.6.2.1 Agriculture................................................................................................... 52 2.6.2.2 Livestock ..................................................................................................... 54 2.6.2.3 Forestry........................................................................................................ 55
2.6.3 Secondary sector............................................................................................. 57 2.6.3.1 Mining ......................................................................................................... 58 2.6.3.2 Manufacture................................................................................................. 58 2.6.3.3 Construction ................................................................................................ 59 2.6.3.4 Energy industries ......................................................................................... 59
2.6.4 Tertiary sector................................................................................................. 59 2.6.5 Prospects for 2009-2010................................................................................. 62
2.7 Transportation ................................................................................................ 63 2.7.1 Road transport ................................................................................................ 63 2.7.2 Shipping ......................................................................................................... 65 2.7.3 Railways ......................................................................................................... 66 2.7.4 Air transport ................................................................................................... 66
2.8 The Greek energy system............................................................................... 67 2.8.1 Energy supply................................................................................................. 67 2.8.2 Final energy consumption .............................................................................. 72
2.8.2.1 Industry........................................................................................................ 73 2.8.2.2 Residential, tertiary sector and agriculture .................................................. 74 2.8.2.3 Transport...................................................................................................... 75
2.9 Waste .............................................................................................................. 75 2.9.1 Solid waste ..................................................................................................... 75 2.9.2 Wastewater ..................................................................................................... 77
CHAPTER 3. GREENHOUSE GAS INVENTORY INFORMATION ............................... 78
3.1 Summary tables .............................................................................................. 78 3.2 GHG emissions trends.................................................................................... 82
3.2.1 GHG emissions trends per sector ................................................................... 82 3.2.2 GHG Emissions trends per gas....................................................................... 85
3.2.2.1 Carbon dioxide ............................................................................................ 85 3.2.2.2 Methane ....................................................................................................... 86
5th NATIONAL COMMUNICATION TO THE UNFCCC 30
3.2.2.3 Nitrous oxide ............................................................................................... 87 3.2.2.4 Halocarbons and SF6................................................................................... 88
3.2.3 Emissions trends for indirect greenhouse gases and SO2 ............................... 89 3.3 National System for the GHG emissions/removals inventory........................ 92
3.3.1 Overview ........................................................................................................ 92 3.3.2 Roles and Responsibilities.............................................................................. 94
3.3.2.1 Ministry of Environment, Energy and Climate Change .............................. 94 3.3.2.2 National Technical University of Athens-School of Chemical Engineering95 3.3.2.3 Government Ministries/ Government agencies ........................................... 97
3.3.3 Methodology and data sources ....................................................................... 98 3.3.3.1 Activity data ................................................................................................ 98 3.3.3.2 Emission factors .......................................................................................... 98 3.3.3.3 Global warming potential ............................................................................ 99 3.3.3.4 GHG emissions inventory preparation process ........................................... 99
3.3.4 Key categories analysis ................................................................................ 101 3.3.5 Improvement of GHG emissions / removals inventories ............................. 102 3.3.6 Quality assurance – Quality control system ................................................. 102 3.3.7 Official consideration and approval of the inventory................................... 105
3.4 National registry ........................................................................................... 106 3.4.1 Overview ...................................................................................................... 106 3.4.2 Conformity with Data Exchange Standards ................................................. 107 3.4.3 Minimisation of discrepancies and measures to deal with ........................... 107 3.4.4 Security measures......................................................................................... 109 3.4.5 Information publicly available by means of the user interface .................... 110 3.4.6 Safeguard and Recovery of Data.................................................................. 112 3.4.7 Procedures results......................................................................................... 113
CHAPTER 4. POLICIES AND MEASURES, INCLUDING THOSE IN ACCORDANCE WITH ARTICLE 2 OF KYOTO PROTOCOL, AND DOMESTIC AND REGIONAL PROGRAMMES AND/OR LEGISLATIVE ARRANGEMENTS AND ENFORCEMENT AND ADMINISTRATIVE PROCEDURES............................................................................................ 114
4.1 Policy-making process ................................................................................. 114 4.2 Domestic and regional programmes and/or legislative arrangements and enforcement and administrative procedures ...................................................................... 115
4.2.1 Activities under articles 3.3 and 3.4 of Kyoto Protocol ............................... 117 4.3 Policies and measures and their effect.......................................................... 119
4.3.1 Supporting Policies for the restriction of GHG emissions ........................... 119 4.3.1.1 2nd National Climate Change Program..................................................... 119 4.3.1.2 European common and coordinated policies and measures ...................... 119 4.3.1.3 Emissions trading system – aviation – marine bunker fuels...................... 121 4.3.1.4 Financing mechanisms .............................................................................. 123 4.3.1.5 Fiscal measures.......................................................................................... 125 4.3.1.6 Local authorities contribution to mitigation of climate change adverse effects ................................................................................................................... 129
4.3.2 Effect of Policies and Measures ................................................................... 130 4.3.2.1 Overview ................................................................................................... 130 4.3.2.2 Promotion of natural gas ........................................................................... 131 4.3.2.3 Improvements in the conventional power generation system.................... 132 4.3.2.4 Promotion of renewable energy sources.................................................... 132 4.3.2.5 Measures in the industrial sector ............................................................... 136 4.3.2.6 Measures in transport sector ...................................................................... 137
5th NATIONAL COMMUNICATION TO THE UNFCCC 31
4.3.2.7 Measures in residential and tertiary sector ................................................ 139 4.3.2.8 Measures in agricultural sector.................................................................. 140 4.3.2.9 Measures in the industrial processes sector ............................................... 140 4.3.2.10 Measures in the waste sector ................................................................. 141 4.3.2.11 Measures in LULUCF sector................................................................. 141
4.4 Minimization of adverse effects ................................................................... 149 4.5 Policies and measures no longer in place ..................................................... 150
CHAPTER 5. PROJECTIONS AND THE TOTAL EFFECT OF POLICIES AND MEASURES, AND SUPPLEMENTARITY RELATING TO KYOTO PROTOCOL MECHANISMS ..................................................................... 151
5.1 Projections .................................................................................................... 151 5.2 Assessment of aggregate effects of policies and measures .......................... 153 5.3 Supplementarity relating to mechanisms under Article 6, 12 and 17, of the Kyoto Protocol .................................................................................................................. 154 5.4 Methodology used for the presented GHG emission projections................. 155
5.4.1 Energy Sector ............................................................................................... 155 5.4.1.1 Methodology ............................................................................................. 155 5.4.1.2 Identification of national targets................................................................ 156 5.4.1.3 Main assumptions ...................................................................................... 157 5.4.1.4 Projections ................................................................................................. 161
5.4.2 Non-energy sectors....................................................................................... 164 5.4.2.1 Methodology ............................................................................................. 164 5.4.2.2 Industrial processes ................................................................................... 165 5.4.2.3 Solvents and other products use ................................................................ 166 5.4.2.4 Waste ......................................................................................................... 167 5.4.2.5 Agriculture................................................................................................. 168 5.4.2.6 Land Use, Land Use Change and Forestry ................................................ 171
5.5 Evaluation of GHG emissions scenarios ...................................................... 172 CHAPTER 6. VULNERABILITY ASSESSMENT, CLIMATE CHANGE IMPACTS AND
ADAPTATION MEASURES...................................................................... 174
6.1 Expected impacts of climate change ............................................................ 174 6.1.1 Present climate – Observed changes ............................................................ 174
6.1.1.1 Temperature............................................................................................... 174 6.1.1.2 Precipitation............................................................................................... 179 6.1.1.3 Sea level..................................................................................................... 179 6.1.1.4 Extreme weather events............................................................................. 179
6.1.2 Future climate and climate change ............................................................... 183 6.1.2.1 Temperature changes................................................................................. 184 6.1.2.2 Precipitation changes................................................................................. 185 6.1.2.3 Extreme weather events............................................................................. 187
6.2 Vulnerability assessment .............................................................................. 188 6.2.1 Energy sector................................................................................................ 188 6.2.2 Agriculture ................................................................................................... 191 6.2.3 Tourism ........................................................................................................ 193 6.2.4 Water resources ............................................................................................ 194
6.2.4.1 General situation........................................................................................ 194 6.2.4.2 Sectoral issues ........................................................................................... 195 6.2.4.3 Water balances per Region ........................................................................ 196
6.2.5 Biodiversity .................................................................................................. 199
5th NATIONAL COMMUNICATION TO THE UNFCCC 32
6.2.5.1 Marine ecosystem and fisheries................................................................. 199 6.2.5.2 Forests........................................................................................................ 201 6.2.5.3 Alpine zone of the Lefka Ori, Crete .......................................................... 202
6.2.6 Desertification .............................................................................................. 203 6.2.7 Coastal areas................................................................................................. 206
6.3 Adaptation measures ................................................................................................... 208 6.3.1 Coastal Zone Management ........................................................................... 210 6.3.2 Water resources ............................................................................................ 211 6.3.3 Agriculture & Forests ................................................................................... 214
6.3.3.1 Priorities .................................................................................................... 214 6.3.3.2 Indicative actions regarding adaptation to climate change........................ 215
6.3.4 Other areas of concern.................................................................................. 217 CHAPTER 7. FINANCIAL RESOURCES AND TRANSFER OF TECHNOLOGY ....... 222
7.1 Introduction .................................................................................................. 222 7.2 ODA general trends...................................................................................... 222 7.3 Bilateral cooperation .................................................................................... 223 7.4 Multilateral contributions ............................................................................. 224 7.5 Environmental cooperation and transfer of technology: .............................. 229
7.5.1 Multilateral/Regional cooperation:............................................................... 229 7.5.1.1 Mediterranean Component of the EU’s Initiative ‘Water for Life’ (MED EUWI) ................................................................................................................... 229 7.5.1.2 Regional cooperation on environmental protection within the Black Sea Economic Cooperation (BSEC) Organisation........................................................... 231
7.5.2 Bilateral cooperation .................................................................................... 233 CHAPTER 8. RESEARCH AND SYSTEMATIC OBSERVATION ................................ 235
8.1 General policy on research and systematic observation............................... 235 8.1.1 Summary information on GCOS activities................................................... 235 8.1.2 General policy on and funding of research (and systematic observation).... 236 8.1.3 International cooperation.............................................................................. 238
8.2 Research ....................................................................................................... 242 8.3 Systematic Observation ................................................................................ 245
8.3.1 Atmospheric essential climate variables....................................................... 245 8.3.1.1 Measurements of meteorological parameters ............................................ 245 8.3.1.2 Measurements of atmospheric electricity discharges ................................ 246 8.3.1.3 Meteorological RADAR............................................................................ 246 8.3.1.4 Wind Measurements .................................................................................. 247 8.3.1.5 Ozone and UV-radiation measurements .................................................... 247 8.3.1.6 Ground level air pollutants ........................................................................ 248 8.3.1.7 Satellite observations................................................................................. 249
8.3.2 Oceanic essential climate variables .............................................................. 252 8.3.2.1 Overview ................................................................................................... 252 8.3.2.2 Hellenic Centre for Marine Research (HCMR)......................................... 252 8.3.2.3 The Hellenic Navy Hydrographic Service................................................. 255 8.3.2.4 National Contribution................................................................................ 257 8.3.2.5 Satellite observations................................................................................. 258 8.3.2.6 Actions taken in response of the recommended actions in the GCOS implementation plan .................................................................................................. 259
8.3.3 Terrestrial Observations ............................................................................... 259 8.3.3.1 Overview ................................................................................................... 259
5th NATIONAL COMMUNICATION TO THE UNFCCC 33
8.3.3.2 Observation System on quantity/quality of surface water......................... 259 8.3.3.3 Observation System on quantity/quality of ground................................... 260 8.3.3.4 Forest ecosystem health observation ......................................................... 261 8.3.3.5 CO2 flux measurements ............................................................................. 261 8.3.3.6 National Contribution................................................................................ 261 8.3.3.7 Satellite observations................................................................................. 261
CHAPTER 9 EDUCATION, TRAINING AND PUBLIC AWARENESS ....................... 265
9.1 General policy towards education, training and public awareness............... 265 9.2 Education..................................................................................................... 266
9.2.1 The structure of the education system.......................................................... 266 9.2.2.1 Ministry of Education, Lifelong Learning and Religious Affairs (M.E.).. 267 9.2.2.2 Ministry of Environment, Energy and climate Change ............................. 273 9.2.2.3 Hellenic Association of Teachers for Environmental Education............... 274 9.2.2.4 Non-governmental organizations .............................................................. 274 9.2.2.5 The MEdIES programme........................................................................... 275
9.2.3 Education in universities and technical education centres ........................... 277 9.2.4 Continuous education ................................................................................... 277
9.2.4.1 General Secretariat of Lifelong Learning .................................................. 278 9.2.4.2 Summer schools......................................................................................... 279 9.2.4.3 Centre for Renewable Energy Sources and Saving ................................... 280
9.2.5 Other organizations ...................................................................................... 281 9.2.5.1 Interdisciplinary Institute for Environmental Research (INIER) .............. 281 9.2.5.2 Hellenic Association for the Protection of Environment and Cultural Heritage ................................................................................................................... 281
9.3 Environmental information and awareness .................................................. 282 9.3.1 Governmental Initiatives .............................................................................. 282
9.3.1.1 Hellenic Parliament ................................................................................... 282 9.3.1.2 Ministry of Environment ........................................................................... 282 9.3.1.3 Ministry of Foreign Affairs ....................................................................... 284 9.3.1.4 Other public sector bodies ......................................................................... 285
9.3.2 Non-governmental Organisations Initiatives................................................ 287 9.3.2.1 Greenpeace ................................................................................................ 287 9.3.2.2 Mediterranean SOS Network..................................................................... 287 9.3.2.3 WWF Hellas .............................................................................................. 288 9.3.2.4 Institute of Energy for South East Europe (IENE) .................................... 289 9.3.2.5 Law+Nature............................................................................................... 290
9.3.3 Environmental information-awareness and a civil society........................... 291 9.3.4 International cooperation.............................................................................. 291
9.3.4.1 Governmental initiatives: Countries of the Africa Region ........................ 291 9.3.4.2 NGOs initiatives: Mediterranean SOS Network........................................ 296
BIBLIOGRAPHY ................................................................................................................. 298 ANNEXES ...................................................................................................................... 301
A.I Summary tables on emission trends ............................................................. 302 A.II Responsibilities / roles per entity involved in the National GHG Inventory System ...................................................................................................................... 313 A.III Inventory preparation details........................................................................ 318 A.IV Greek national registry official authorization............................................... 324 A.V Summary of reporting of the Supplementary information under Article 7, paragraph 2, of the Kyoto Protocol in the NC5................................................................. 326

5th NATIONAL COMMUNICATION TO THE UNFCCC 34
A.VI National Communication Preparation Process ............................................. 328
5th NATIONAL COMMUNICATION TO THE UNFCCC 35 TABLES
Table 1.1a Total GHG emissions in Greece (in Mt CO2 eq) for the period 1990-2000..... 4 Table 1.1b Total GHG emissions in Greece (in Mt CO2 eq) for the period 2001-2007..... 5 Table 1.2a Total GHG emissions in Greece (in kt CO2 eq) for the period 1990-2000 ...... 5 Table 1.2b Total GHG emissions in Greece (in kt CO2 eq) for the period 2001-2007 ...... 6 Table 1.3 Projection of GHG emissions in the “with measures” scenario, disaggregated
by sector (kt CO2 eq) ...................................................................................... 11 Table 1.4 Projections of GHG emissions (excluding LULUCF) in the "with measures"
scenario, disaggregated by gas (kt CO2 eq).................................................... 11 Table 1.5 Projection of GHG emissions in the “with additional measures” scenario,
disaggregated by sector (kt CO2 eq)............................................................... 12 Table 1.6 Projections of GHG emissions (excluding LULUCF) in the "with additional
measures" scenario, disaggregated by gas (kt CO2 eq) .................................. 12 Table 1.7 Comparison of projected emissions and Assigned Amount (AA) for the 1st
commitment period......................................................................................... 13 Table 1.8 Aggregate effect of currently implemented and adopted policies and measures
(kt CO2 eq)..................................................................................................... 13 Table 1.9 Aggregate effect of planned policies and measures (kt CO2 eq) ................... 14 Table 2.1a Number of animals (thousands) by species for the period 1990–2000 .......... 54 Table 2.1b Number of animals (thousands) by species for the period 2001-2007 ........... 55 Table 2.2 Area and growing stock per forest type in Greek forests ............................... 56 Table 2.3 Distribution of forest and other forest areas per type of ownership ............... 56 Table 2.4 Employment in the secondary sector for the period 1998 – 2007 (thousands
employees)...................................................................................................... 57 Table 2.5 Industrial production index for the period 1995-2007 (base year, 2000)....... 60 Table 2.6 Employment in the tertiary sector for the period 1998 – 2007 (thousands
employees)...................................................................................................... 62 Table 2.7 Basic macroeconomic aggregates................................................................... 63 Table 2.8 Vehicle categories. mileage. average speed and mileage contribution by road
vehicle category (2007). ................................................................................. 64 Table 2.9 Installed capacity of the electricity generation system (in MW) in 2008....... 71 Table 3.1a Total GHG emissions in Greece (in kt CO2 eq) for the period 1990-2000 .... 79 Table 3.1b Total GHG emissions in Greece (in kt CO2 eq) for the period 2001-2007 .... 80 Table 3.2a GHG (kt CO2 eq) and other gases emissions (kt) from international transport
for the period 1990-2000................................................................................ 80 Table 3.2b GHG and other gases emissions from international transport for the period
2001-2007....................................................................................................... 81 Table 3.3a Ozone precursor gases and SO2 emissions for the period 1990 – 2000 (kt)... 81 Table 3.3b Ozone precursor gases and SO2 emissions for the period 2001 – 2007 (kt)... 81 Table 3.4a Total GHG emissions in Greece (in kt CO2 eq) for the period 1990-2000 .... 82
5th NATIONAL COMMUNICATION TO THE UNFCCC 36 Table 3.4b Total GHG emissions in Greece (in kt CO2 eq) for the period 2001-2007 .... 83 Table 3.5 Basic indicators for the assessment of GHG emissions trends for the period
1990–2007...................................................................................................... 84 Table 3.6a Actual F-gases emissions for the period 1990-2000 (in kt CO2 eq) ............... 89 Table 3.6b Actual F-gases emissions for the period 2001-2007 (in kt CO2 eq) ............... 89 Table 3.7 Quality assurance / quality control procedures for the Greek GHG emissions
inventory....................................................................................................... 104 Table 4.1 Responsibilities of Ministries concerning issues of environmental policy in
Greece........................................................................................................... 114 Table 4.2 European common and coordinated policies and measures (CCPM) .......... 120 Table 4.3 Energy Efficiency National Action Plan Measures...................................... 122 Table 4.4 Expenditures for the inter alia confrontation of climate change(in millions
euros) ............................................................................................................ 124 Table 4.5 Excise duty rates for specified products during the period 2006-2009 ........ 126 Table 4.6 Revenues from registration tax from 1999 until 2007.................................. 126 Table 4.7 Road tax applicable to passenger cars and motorcycles for private use(year
2009)............................................................................................................. 127 Table 4.8 Revenues from road tax during the period 1999-2008................................. 127 Table 4.9 Renewable energy feed-in tariffs in the year 2008....................................... 133 Table 4.10 Installed capacity of RES systems in MW (December 2007 – January 2008)
...................................................................................................................... 134 Table 4.11 RES production authorisations in the mainland without installation
authorisation, except the areas where grid reinforcement has been scheduled(2007) ........................................................................................... 135
Table 4.12 Hydroelectric plants planned by the PPC for commissioning by 2010........ 135 Table 4.13 Effects of implemented / adopted policies and measures (included in the “with
measures” scenario)...................................................................................... 143 Table 4.14 Effects of planned policies and measures..................................................... 146 Table 5.1 Projection of GHG emissions in the “with measures” scenario, disaggregated
by sector (kt CO2 eq) .................................................................................... 151 Table 5.2 Projections of GHG emissions (excluding LULUCF) in the "with measures"
scenario, disaggregated by gas (kt CO2 eq).................................................. 152 Table 5.3 Projection of GHG emissions in the “with additional measures” scenario,
disaggregated by sector (kt CO2 eq)............................................................. 152 Table 5.4 Projections of GHG emissions (excluding LULUCF) in the "with additional
measures" scenario, disaggregated by gas (kt CO2 eq) ................................ 152 Table 5.5 Comparison of projected emissions and Assigned Amount (AA) for the 1st
commitment period....................................................................................... 153 Table 5.6 Aggregate effect of currently implemented and adopted policies and measures
(kt CO2 eq)................................................................................................... 154 Table 5.7 Aggregate effect of planned policies and measures (kt CO2 eq) ................. 154 Table 5.8 International fuel prices according to IEA ................................................... 157
5th NATIONAL COMMUNICATION TO THE UNFCCC 37 Table 5.9 Average annual population rate of increase ................................................. 158 Table 5.10 Average annual household size rates of change ........................................... 158 Table 5.11 Average annual rates of increase as provided by GEM-E3 model, %.......... 158 Table 5.12 Electricity demand for the mainland’s interconnected system..................... 159 Table 5.13 Electricity demand for islands (non interconnected system)........................ 160 Table 5.14 CO2 emissions from the energy sector (in MT) for ‘with measures’ scenario of
projections .................................................................................................... 162 Table 5.15 CH4 emissions from the energy sector (in kt) for ‘with measures’ scenario of
projections .................................................................................................... 162 Table 5.16 N2O emissions from the energy sector (in kt) for ‘with measures’ scenario of
projections .................................................................................................... 162 Table 5.17 Total emissions from the energy sector (in Mt CO2 eq) for ‘with measures’
scenario of projections.................................................................................. 163 Table 5.18 CO2 emissions from the energy sector (in Mt) for the “with additional
measures” scenario of projections ................................................................ 163 Table 5.19 CH4 emissions from the energy sector (in kt) for the “with additional
measures” scenario of projections ................................................................ 163 Table 5.20 N2O emissions from the energy sector (in kt) for the “with additional
measures” scenario of projections ................................................................ 164 Table 5.21 Total emissions from the energy sector (in Mt CO2 eq) for the “with additional
measures” scenario of projections ................................................................ 164 Table 5.22 Main assumptions for the “with measures” and “with additional measures”
scenarios in Industrial processes sector. ....................................................... 165 Table 5.23 Projections of GHG emissions from the industrial processes sector (in kt
CO2eq) .......................................................................................................... 166 Table 5.24 GHG emissions from solvents and other products use (in kt CO2) .............. 167 Table 5.25 Main assumptions of projections scenarios for solid waste disposal on land167 Table 5.26 GHG emissions from the waste sector (kt CO2eq) ....................................... 168 Table 5.27 Animal population (thousands) per species (3-year average) ...................... 169 Table 5.28 Projection of nitrogen inputs in soils (in kt) from synthetic fertilizers ........ 169 Table 5.29 Projection of agricultural crops production.................................................. 170 Table 5.30 GHG emissions from agriculture in the “with measures” scenario (kt CO2eq)
...................................................................................................................... 170 Table 5.31 Net emissions / removals of GHG from Land Use, Land Use Changes and
Forestry per gas (kt CO2 eq)......................................................................... 171 Table 5.32 Projection of basic indices for the evaluation of policies and measures
implementation to reduce GHG emissions................................................... 173 Table 6.1 Statistics of summer 2007 with respect to climate values for the entire
instrumental period (1891-2006) and the recent reference period of 1961-1990 (NOA weather station at Thissio, Athens). .................................................. 183
Table 6.2 Mean length of growing season for different crop types under the present eliminate scenario and mean percentage of change under future scenarios . 192
5th NATIONAL COMMUNICATION TO THE UNFCCC 38 Table 6.3 Comparison of water supply and demand during July (in hm3): Current
situation by water region. ............................................................................. 197 Table 6.4 Comparison of water supply and demand during July (in hm3): Medium-term
scenario by water region............................................................................... 198 Table 6.5 Comparison of water supply and demand during July (in hm3): Long-term
scenario by water region............................................................................... 198 Table 6.6 Summary of information on vulnerability and adaptation to Climate Change
...................................................................................................................... 221 Table 7.1 ODA Volumes 2002-2008............................................................................ 223 Table 7.2 Bilateral development cooperation – Aid per sector per year (Flows in
MUSD) ......................................................................................................... 224 Table 7.3 Financial Contributions to the Global Environmental Facility (GEF) ......... 224 Table 7.4(a) ODA eligible financial contributions to multilateral institutions and
programmes (2006-2008) ............................................................................. 225 Table 7.4(b) Contributions to UN Environmental related Organizations, Secretariats and
Funds ............................................................................................................ 226 Table 7.5 Description of selected projects or programmes that promoted practicable
steps to facilitate and/or finance the transfer of, or access to, environmentally-sound technologies ....................................................................................... 233
Table 8.1 International cooperation programmes of Greece and indicative projects that are related to climate change ........................................................................ 241
Table 8.2 Selected projects that are directly or indirectly related to climate change and to which Greece is a partner ......................................................................... 244
Table 8.3 National contribution to the surface-based atmospheric essential climate variables ....................................................................................................... 250
Table 8.4 National contribution to the upper-air atmospheric essential climate variables...................................................................................................................... 251
Table 8.5 National contribution to the atmospheric composition................................. 251 Table 8.6 Location of the buoys network of the POSEIDON System ......................... 254 Table 8.7 National Contributions to oceanic essential climate variables - surface ...... 257 Table 8.8 National Contribution to the oceanic essential climate variables – water
column.......................................................................................................... 258 Table 8.9 Global products requiring satellite observations-oceans .............................. 258 Table 8.10 National contributions to the terrestrial domain essential climate variables 262 Table 9.1 Programmes related to climate change in Secondary Education School Units
(school year 2008-09)................................................................................... 269 Table 9.2 Coordinated and developed actions in the National Thematic Networks..... 273 Table 9.3 Implemented programmes for the environment in the Centres of Adult
Training, during the period 2008-2009 ........................................................ 278 Table A.Ι.1a Evaluation of CO2 emissions for the period 1990 – 1999 (in kt) ................ 303 Table A.Ι.1b Evaluation of CO2 emissions for the period 2000 – 2007 (in kt) ................ 304 Table A.Ι.2a Evaluation of CH4 emissions for the period 1990 – 1999 (in kt) ................ 305
5th NATIONAL COMMUNICATION TO THE UNFCCC 39 Table A.Ι.2b Evaluation of CH4 emissions for the period 2000 – 2007 (in kt) ................ 306 Table A.Ι.3a Evaluation of Ν2Ο emissions for the period 1990 – 1999 (in kt) ................ 307 Table A.Ι.3b Evaluation of Ν2Ο emissions for the period 2000 – 2007 (in kt) ................ 308 Table A.Ι.4a Evaluation of F-gases emissions per gas (in kt) and in total (in kt CO2 eq) for
the period 1990 – 1999................................................................................. 309 Table A.Ι.4b Evaluation of F-gases emissions per gas (in kt) and in total (in kt CO2 eq) for
the period 2000 – 2007................................................................................. 310 Table A.Ι.5a Evaluation of GHG emissions / removals per gas and per sector for the period
1990 – 1999 (kt CO2 eq).............................................................................. 311 Table A.Ι.5b Evaluation of GHG emissions / removals per gas and per sector for the period
2000 – 2007 (kt CO2 eq).............................................................................. 312 Table A.III.1 Overview of methods applied for the calculation of GHG emissions /
removals ....................................................................................................... 319 Table A.III.2 Global Warming Potential (in t of CO2 eq) for the 100-year horizon .......... 321 Table A.III.3 Key categories for the Greek inventory system without LULUCF.............. 322 Table A.III.4 Key categories for the Greek inventory system with LULUCF................... 323 Table A.V.1 Summary of reporting of the Supplementary information under Article 7,
paragraph 2, of the Kyoto Protocol in the NC5............................................ 327
5th NATIONAL COMMUNICATION TO THE UNFCCC 40 FIGURES
Figure 1.1 Factors underlying GHG emissions trends....................................................... 7 Figure 1.2 GHG emissions projection per scenario ......................................................... 12 Figure 2.1 Major administrative regions of Greece ......................................................... 44 Figure 2.2 Population of Greece and average household size ......................................... 45 Figure 2.3 Distribution of the area of Greece by land cover category (2000) ................. 47 Figure 2.4 Mean annual temperature (in ˚C) at selected meteorological stations for the
periods 1961 – 1990 and 1991 – 2000, 2001-2003 and for the year 2004..... 48 Figure 2.5 Precipitation height (in mm) at selected meteorological stations for the periods
1961 – 1990 and 1991 – 2000, 2001-2003 and for the year 2004.................. 49 Figure 2.6 Basic macroeconomic indicators of the Greek economy for the period 2000 -
2007................................................................................................................ 51 Figure 2.7 Gross value added (in constant prices 2000) per economic sector for the
period 2000 – 2007......................................................................................... 51 Figure 2.8 Distribution of agricultural land in irrigated and non-irrigated and fallow land
(in Mha) for the period 1990 – 2006 .............................................................. 53 Figure 2.9 Agricultural land by cultivation type for the year 2006 ................................. 54 Figure 2.10 The structure of gross value added in the secondary sector for the period 2000
– 2007............................................................................................................. 57 Figure 2.11 The structure of gross value added in Manufacture for the period 2000 – 2007
........................................................................................................................ 58 Figure 2.12 Structure of gross value added in the tertiary sector for the period 2000 – 2007
........................................................................................................................ 61 Figure 2.13 Number of catalytic and total passenger cars for the period 1990 - 2007 ...... 65 Figure 2.14 Domestic and international air traffic for the period 1990 – 2007 ................. 67 Figure 2.15 Gross inland consumption (Mtoe) in Greece for the period 1990 - 2007....... 68 Figure 2.16 Gross electricity generation (in TWh) in Greece for the period 1990 – 2007 72 Figure 2.17 Final energy consumption (in Mtoe) by economic sector for the period 1990 –
2007................................................................................................................ 73 Figure 2.18 Energy consumption (in Mtoe) in industry for the period 1990 – 2007......... 74 Figure 2.19 Final energy consumption (in Mtoe) in the residential, tertiary sector and in
agriculture for the period 1990 - 2007............................................................ 75 Figure 2.20 Solid waste disposal / management practices applied in Greece.................... 76 Figure 3.1 Factors underlying GHG emissions trends..................................................... 82 Figure 3.2 Contribution of activity sectors to total GHG emissions (without LULUCF) in
2007................................................................................................................ 83 Figure 3.3 CO2 emissions by sector (in Mt) for the years 1990 – 2007 (without
LULUCF) ....................................................................................................... 86 Figure 3.4 CH4 emissions by sector (kt) for the years 1990 – 2007 (without LULUCF) 87 Figure 3.5 Ν2Ο emissions by sector (kt) for the years 1990 – 2007 (without LULUCF)88
5th NATIONAL COMMUNICATION TO THE UNFCCC 41 Figure 3.6 Emissions from indirect greenhouse gases and SO2 per gas and sector for the
period 1990 – 2007......................................................................................... 91 Figure 3.7 Organizational Structure of the National Inventory System .......................... 93 Figure 3.8 Flow chart activities concerning the GHG emissions inventory .................. 103 Figure 3.9 Overview of the registry database structure ................................................. 106 Figure 5.1 GHG emissions projection per scenario ....................................................... 153 Figure 5.2 Fuel prices projection according to IEA (November 2007) ......................... 157 Figure 6.1 Deviation of the average annual temperature from the average of period 1961-
1990 in selected meteorological stations of Greece ..................................... 175 Figure 6.2 Deviation of the average summer temperature from the average rates of the
period 1961-1990 in selected meteorological stations of Greece................. 176 Figure 6.3 Deviation of the average winter temperature from the average rates of the
period 1961-1990 in selected meteorological stations of Greece................. 177 Figure 6.4 Selected meteorological areas of HNMS...................................................... 178 Figure 6.5 Annual and seasonal (summer/winter) precipitation height in selected
meteorological stations of Greece and 5-year moving average.................... 180 Figure 6.6 Annual sea level in selected stations of the Hellenic Nay Hydrographic
Service & 5-year moving average ................................................................ 181 Figure 6.7 Heat Wave Duration Index (HWDI) and Cold Wave Duration Index (CWDI)
in Athens (NOA meteorological station), on an annual basis, for the years 1897-2008..................................................................................................... 182
Figure 6.8 Seasonal Heat Wave Duration Index (HWDI) and Cold Wave Duration Index (CWDI) in Athens, for the years 2001-2008 ................................................ 182
Figure 6.9 Left column: difference in the average annual (a) maximum, (b) mean, and (c) minimum temperature between 2031-3060 and 1961-1990. Right column: the corresponding 95% conference range. ......................................................... 185
Figure 6.10 Left column: Difference in mean (a) winter, (b) spring, (c) summer and (d) autumn temperatures between 2031-2060 and 1961-1990. Right column: corresponding 95% confidence range. ......................................................... 186
Figure 6.11 Left column: Percentage change in annual rainfall between 2031-2060 and 1961-1990. Centre column: Same as left column but in absolute changes. Right column: corresponding 95% confidence range. ................................. 186
Figure 6.12 Left column: increase in the number of (a) summer days, (b) hot days, (c) heatwave days, and (d) tropical nights, and (e) decrease in the number of frost nights between 2031-2060 and 1961-1990. Average numbers are considered and units are weeks. Right column: the corresponding 95%confidence range in weeks........................................................................................................ 187
Figure 6.13 Monthly energy demand in MWH and temperature for the period 2005-2007, according to data provided by the Hellenic Transmission System Operator S.A................................................................................................................ 189
Figure 6.14 Peak loads for the period 2009-2012 taking into consideration the climatic effects, as projected by the Hellenic Transmission System Operator S.A. .. 190
Figure 6.15 Change in the number of days with (a) large cooling demand and (b) large heating demand between the future and the control period (1961-1990)..... 191
5th NATIONAL COMMUNICATION TO THE UNFCCC 42 Figure 6.16 Change of the monthly electricity demand in Greece during the period 2071-
2100 exclusively as a result of climate change under the A2 and B2 IPCC scenarios. ...................................................................................................... 191
Figure 6.17 Left column: The percentage change in the risk of heat stress during the flowering stages of crop development across the Mediterranean region as a result of climate change. Right column: The percentage change in summer crop as across the Mediterranean region as a result of climate change. Differences in both case are between the present day (1961-1990) and the future (2070-2099) periods for the A2 (a) and B2 (b) scenarios. ................. 192
Figure 6.18 Impact of climate change on crop yields with CO2 effect for different types of crops. The changes are reported as percentages and obtained as differences between the mean yields in the two future scenarios and present yields...... 193
Figure 6.19 Map of the potential desertification risk for Greece..................................... 204 Figure 6.20 Standardized Precipitation Index (SPI) for Greece in years 2005, 2006, 2007
and 2008. ...................................................................................................... 205 Figure 6.21 Nestos and Mornos Basins in Greece........................................................... 205 Figure 6.22 Evolution of population in coastal regions................................................... 206 Figure 6.23 Sea-level changes in Europe, October 1992 - May 2007 ............................. 208
5th NATIONAL COMMUNICATION TO THE UNFCCC 43 CHAPTER 2. NATIONAL CIRCUMSTANCES
This chapter includes a short description of Greece’s government structure, and geographical, climate, population, and economic profiles of the country. Emphasis is given in identifying those parameters related to national circumstances that affect greenhouse gases (GHG) and describe more completely the national conditions which influence the national emissions/removals over time.
2.1 Government structure
The Constitution of 1975, as revised in 1986, 2001 and in 2008, defines the political system of Greece as a parliamentary democracy with the President being the Head of State.
Legislative power is vested in the national parliament, which comprises 300 members, each elected by direct, secret, and universal ballot. The Parliament’s term is four years. The parliament deals with legislative work, while it controls the government and national administration in general.
At the top administrative level is the national government, with ministers appointed by the Prime Minister. The ministries mainly prepare and implement national laws. At the next level are 13 administrative regions (Figure 2.1), each headed by a Secretary General who is appointed by the Council of Ministers and who reports to the Minister for the Interior, Decentralisation and E-government. The primary responsibility of the regional authorities is the development and implementation of regional economic-development plans. Such plans are financed by the Ministry of Economy, Competitiveness and Shipping. Below the 13 administrative regions, are 50 prefectures. Regional authorities coordinate the activities of the prefectures in their jurisdiction. A prefect directly elected for a four-year term, heads each of the 50 prefectures.
An additional administrative level, below the prefectures, comprises local authorities which according to the Constitution are independent in administrative level. There are 1033 municipalities and communities, 900 of which are municipalities (i.e. with population greater than 10,000 people). The local authorities are responsible for issues concerning licensing procedures for buildingsI in urban areas and certain industrial units, planning and implementation of waste management, etc.
According to the Presidential Decree No 189 dated 5th November 2009 the responsibilities of the former Ministry for the Environment, Physical Planning and Public Works are altered by including Energy Policy and Forest Management and by excluding Public Works. Therefore, the General Directorates of Energy and Natural Resources, previously belonging to the Ministry of Development as well as the General Directorate of Forest Development and Protection and Natural Resources, previously belonging to the Ministry of Rural Development and Food, were accordingly transferred to the Ministry of Environment, Energy and Climate Change. The Ministry of Environment, Energy and Climate Change (former Ministry for the Environment, Physical Planning and Public Works) retains the responsibilities of Environmental Protection, Physical and Town Planning of the former Ministry. The Public Works General Secretariat was transferred to the new Ministry of Infrastructure, Transport and Networks.
The Ministry of Environment, Energy and Climate Change (MEECC) is the main governmental body concerned with the development and implementation of environmental
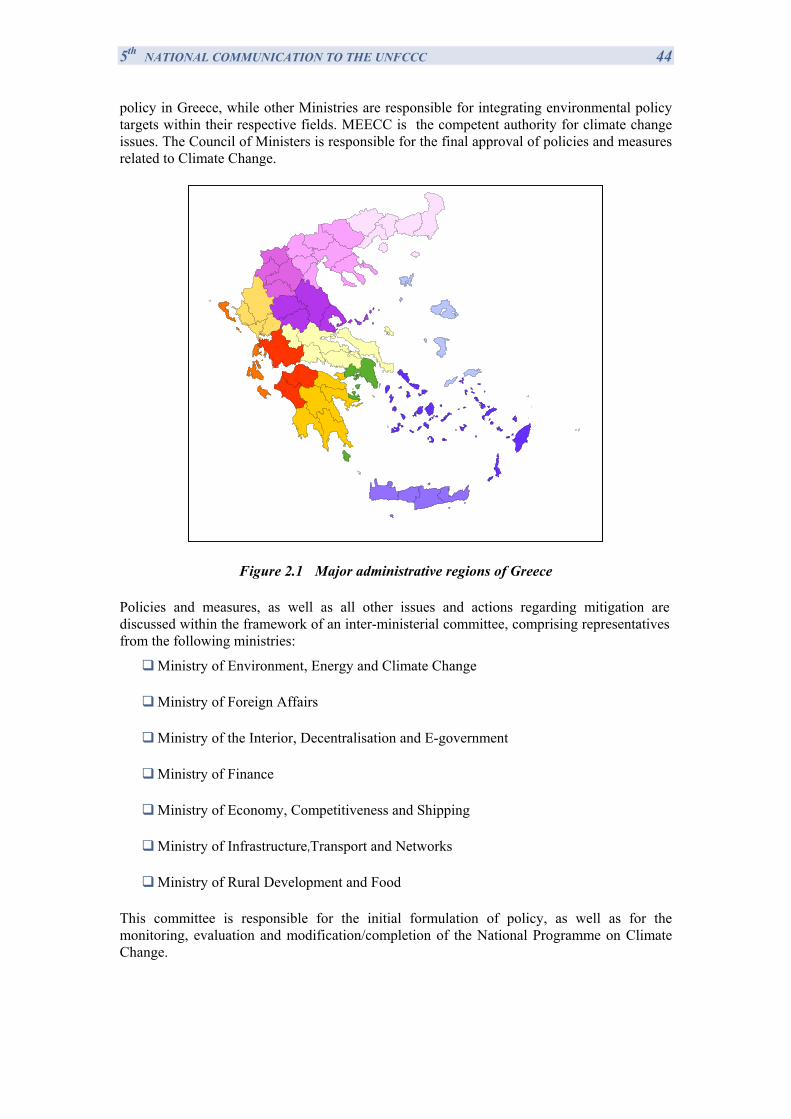
5th NATIONAL COMMUNICATION TO THE UNFCCC 44 policy in Greece, while other Ministries are responsible for integrating environmental policy targets within their respective fields. MEECC is the competent authority for climate change issues. The Council of Ministers is responsible for the final approval of policies and measures related to Climate Change.
Figure 2.1 Major administrative regions of Greece
Policies and measures, as well as all other issues and actions regarding mitigation are discussed within the framework of an inter-ministerial committee, comprising representatives from the following ministries:
Ministry of Environment, Energy and Climate Change
Ministry of Foreign Affairs
Ministry of the Interior, Decentralisation and E-government
Ministry of Finance
Ministry of Economy, Competitiveness and Shipping
Ministry of Infrastructure,Transport and Networks
Ministry of Rural Development and Food
This committee is responsible for the initial formulation of policy, as well as for the monitoring, evaluation and modification/completion of the National Programme on Climate Change.
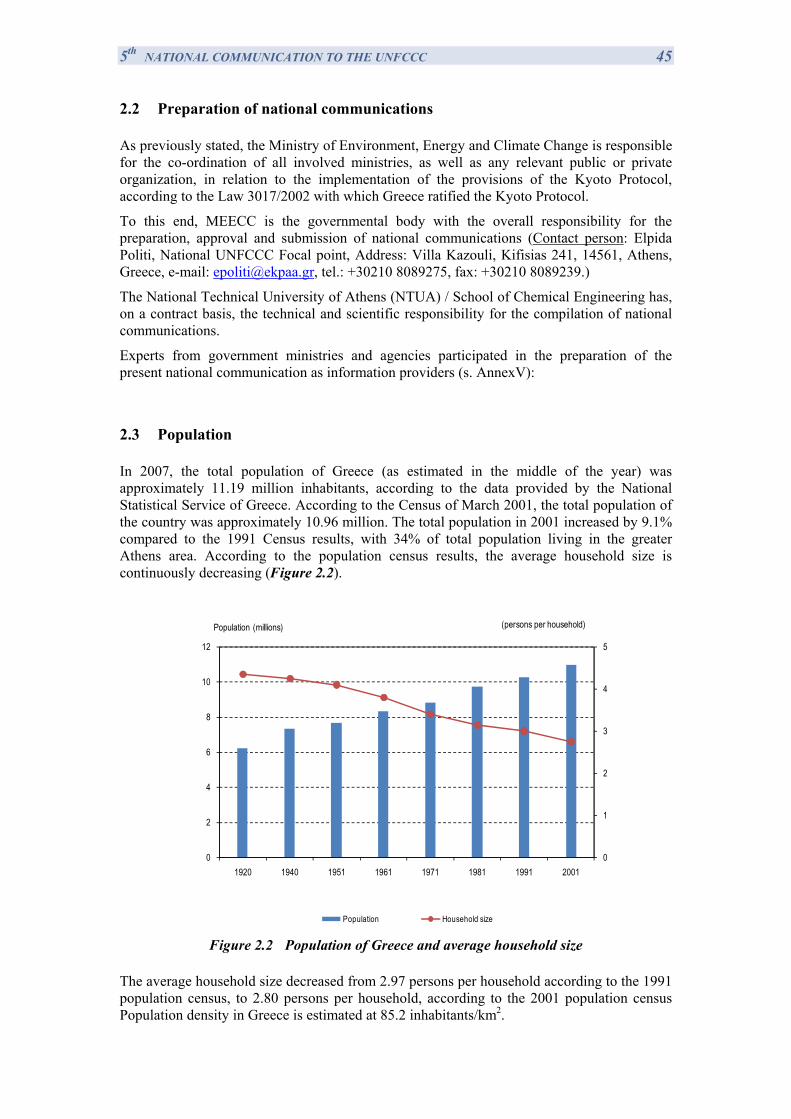
5th NATIONAL COMMUNICATION TO THE UNFCCC 45 2.2 Preparation of national communications
As previously stated, the Ministry of Environment, Energy and Climate Change is responsible for the co-ordination of all involved ministries, as well as any relevant public or private organization, in relation to the implementation of the provisions of the Kyoto Protocol, according to the Law 3017/2002 with which Greece ratified the Kyoto Protocol.
To this end, MEECC is the governmental body with the overall responsibility for the preparation, approval and submission of national communications (Contact person: Elpida Politi, National UNFCCC Focal point, Address: Villa Kazouli, Kifisias 241, 14561, Athens, Greece, e-mail: [email protected], tel.: +30210 8089275, fax: +30210 8089239.)
The National Technical University of Athens (NTUA) / School of Chemical Engineering has, on a contract basis, the technical and scientific responsibility for the compilation of national communications.
Experts from government ministries and agencies participated in the preparation of the present national communication as information providers (s. AnnexV):
2.3 Population
In 2007, the total population of Greece (as estimated in the middle of the year) was approximately 11.19 million inhabitants, according to the data provided by the National Statistical Service of Greece. According to the Census of March 2001, the total population of the country was approximately 10.96 million. The total population in 2001 increased by 9.1% compared to the 1991 Census results, with 34% of total population living in the greater Athens area. According to the population census results, the average household size is continuously decreasing (Figure 2.2).
0
1
2
3
4
5
0
2
4
6
8
10
12
1920 1940 1951 1961 1971 1981 1991 2001
(persons per household)Population (millions)
Population Household size
Figure 2.2 Population of Greece and average household size
The average household size decreased from 2.97 persons per household according to the 1991 population census, to 2.80 persons per household, according to the 2001 population census Population density in Greece is estimated at 85.2 inhabitants/km2.
5th NATIONAL COMMUNICATION TO THE UNFCCC 46 2.4 Geographic profile
Greece has a total area of 131.957 km2 and occupies the southernmost extension of the Balkan Peninsula. The mainland accounts for 80% of the land area, with the remaining 20% divided among nearly 3000 islands. The Greek landscape, with its extensive coastline, exceeding 15,000 km in length, is closely linked with the sea, since only a small region in the northwest is further than 80 km from the sea. Approximately 25% of it is lowland, particularly the coastal plains along the seashore of the country.
2.4.1 Geomorphologic characteristics
Greece is a mountainous country, two thirds of which are largely covered by mountains of medium height. The great mountain masses run the length of the country from NNW to SSE (the Pindos complex, the Agrafa, Tymfristos, Panetolikon, Oiti, Vardousia, Parnassos, Giona in northern and central Greece, and Panachaikon, Erymanthos, the Aroania mountains, Kyllene, Maenalon, Parnon, Taygetos in the Peloponnese) and divide it into two distinct climatic and phytogeographic regions. The mountain ranges of the east part of the country (Bermio, Pieria, Olympos, Ossa, Mavrovouni, Pelion) are directed from North to South. Finally the mountain ranges of Northern Greece (Voras, Tzena, Paiko, Beles, Angistro, Falakron mountains and the Rhodope range) run east-west, shielding the country from the cold north winds.
Greece presents a variety of rock formations. Geologically and petrologically the rocks of Greece can be divided into pre-Alpine, Alpine and post-Alpine formations. The pre-Alpine formations contain the crystalline schist rocks of the crystalline masses of Greece, and some small areas of sedimentary and igneous rocks. The Alpine and post-Alpine formations include the greater part of the sedimentary cover of Greece, as well as quite large igneous outcrops.
2.4.2 Ecosystems
The main floristic regions found in Greece are the Mediterranean, the European (Eurasian) and the Irano-Caspian. The Mediterranean flora is found in a zone of varying width along the coasts and on the islands of the Ionian and Aegean Seas. The width of this zone and the altitude to which it reaches decrease with increasing latitude. The Central European flora predominates on the mountains of Northern and Central Greece, gradually losing ground as we move south. Representatives of the Irano-Caspian flora, such as the oriental oak and others, are found in North-East Greece (Thrace) and on the islands of the North-East Aegean. In Crete representatives of the north-African flora are also found. Due to the geographical position and the coexistence of the above-mentioned flora regions, the flora of Greece is very rich, consisting of approximately 6,000 phanerogamous plants. Also, the country’s mountainous nature and the many islands favour conditions of isolation and endemism. As a result, significant proportion of plant species and subspecies (13%) are endemic.
The large climatic variation in Greece is expressed by the variation of vegetation zones (types) of the natural vegetation, ranging from the thermomediterranean formations of the Oleo-Ceratonion sub-type, such as the most Xerothermophilous ecosystems of the natural palm forest in Crete island (Vai), to the most psychrobious (cold resistant) formations of Mid-European type of Pinus sylvestris and Picea excelsa as in the area of Drama (Elatia). The limits of the five vegetation zones are often overlapped and the illustration on the map is not well defined. These zones are:
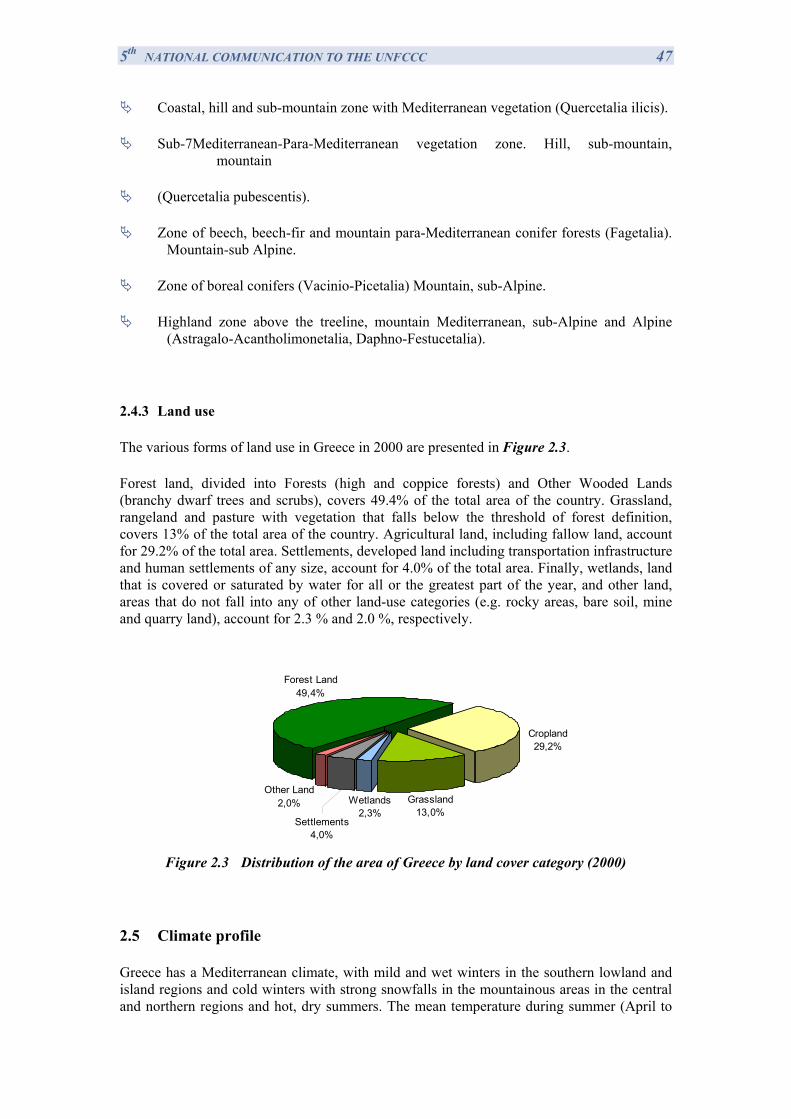
5th NATIONAL COMMUNICATION TO THE UNFCCC 47
Coastal, hill and sub-mountain zone with Mediterranean vegetation (Quercetalia ilicis).
Sub-7Mediterranean-Para-Mediterranean vegetation zone. Hill, sub-mountain, mountain
(Quercetalia pubescentis).
Zone of beech, beech-fir and mountain para-Mediterranean conifer forests (Fagetalia). Mountain-sub Alpine.
Zone of boreal conifers (Vacinio-Picetalia) Mountain, sub-Alpine.
Highland zone above the treeline, mountain Mediterranean, sub-Alpine and Alpine (Astragalo-Acantholimonetalia, Daphno-Festucetalia).
2.4.3 Land use
The various forms of land use in Greece in 2000 are presented in Figure 2.3.
Forest land, divided into Forests (high and coppice forests) and Other Wooded Lands (branchy dwarf trees and scrubs), covers 49.4% of the total area of the country. Grassland, rangeland and pasture with vegetation that falls below the threshold of forest definition, covers 13% of the total area of the country. Agricultural land, including fallow land, account for 29.2% of the total area. Settlements, developed land including transportation infrastructure and human settlements of any size, account for 4.0% of the total area. Finally, wetlands, land that is covered or saturated by water for all or the greatest part of the year, and other land, areas that do not fall into any of other land-use categories (e.g. rocky areas, bare soil, mine and quarry land), account for 2.3 % and 2.0 %, respectively.
Other Land2,0% Wetlands
2,3%Settlements
4,0%
Grassland13,0%
Forest Land49,4%
Cropland29,2%
Figure 2.3 Distribution of the area of Greece by land cover category (2000)
2.5 Climate profile
Greece has a Mediterranean climate, with mild and wet winters in the southern lowland and island regions and cold winters with strong snowfalls in the mountainous areas in the central and northern regions and hot, dry summers. The mean temperature during summer (April to
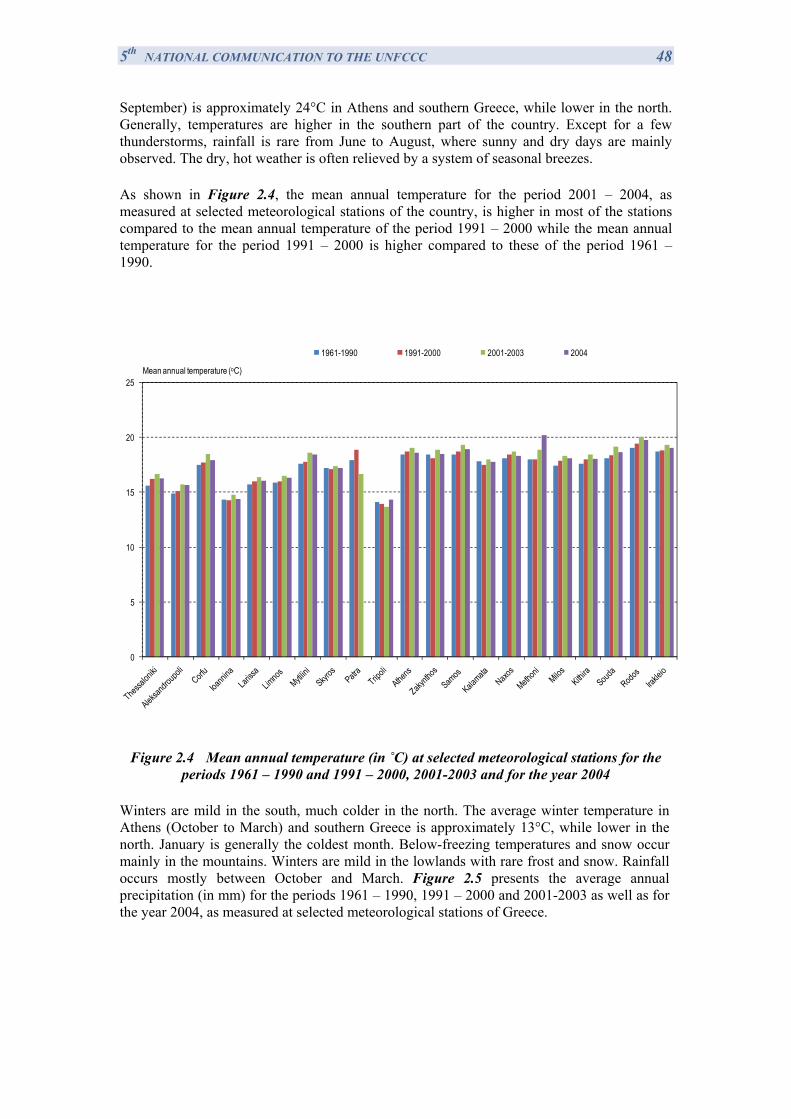
5th NATIONAL COMMUNICATION TO THE UNFCCC 48 September) is approximately 24°C in Athens and southern Greece, while lower in the north. Generally, temperatures are higher in the southern part of the country. Except for a few thunderstorms, rainfall is rare from June to August, where sunny and dry days are mainly observed. The dry, hot weather is often relieved by a system of seasonal breezes.
As shown in Figure 2.4, the mean annual temperature for the period 2001 – 2004, as measured at selected meteorological stations of the country, is higher in most of the stations compared to the mean annual temperature of the period 1991 – 2000 while the mean annual temperature for the period 1991 – 2000 is higher compared to these of the period 1961 – 1990.
0
5
10
15
20
25Mean annual temperature (oC)
1961-1990 1991-2000 2001-2003 2004
Figure 2.4 Mean annual temperature (in ˚C) at selected meteorological stations for the periods 1961 – 1990 and 1991 – 2000, 2001-2003 and for the year 2004
Winters are mild in the south, much colder in the north. The average winter temperature in Athens (October to March) and southern Greece is approximately 13°C, while lower in the north. January is generally the coldest month. Below-freezing temperatures and snow occur mainly in the mountains. Winters are mild in the lowlands with rare frost and snow. Rainfall occurs mostly between October and March. Figure 2.5 presents the average annual precipitation (in mm) for the periods 1961 – 1990, 1991 – 2000 and 2001-2003 as well as for the year 2004, as measured at selected meteorological stations of Greece.
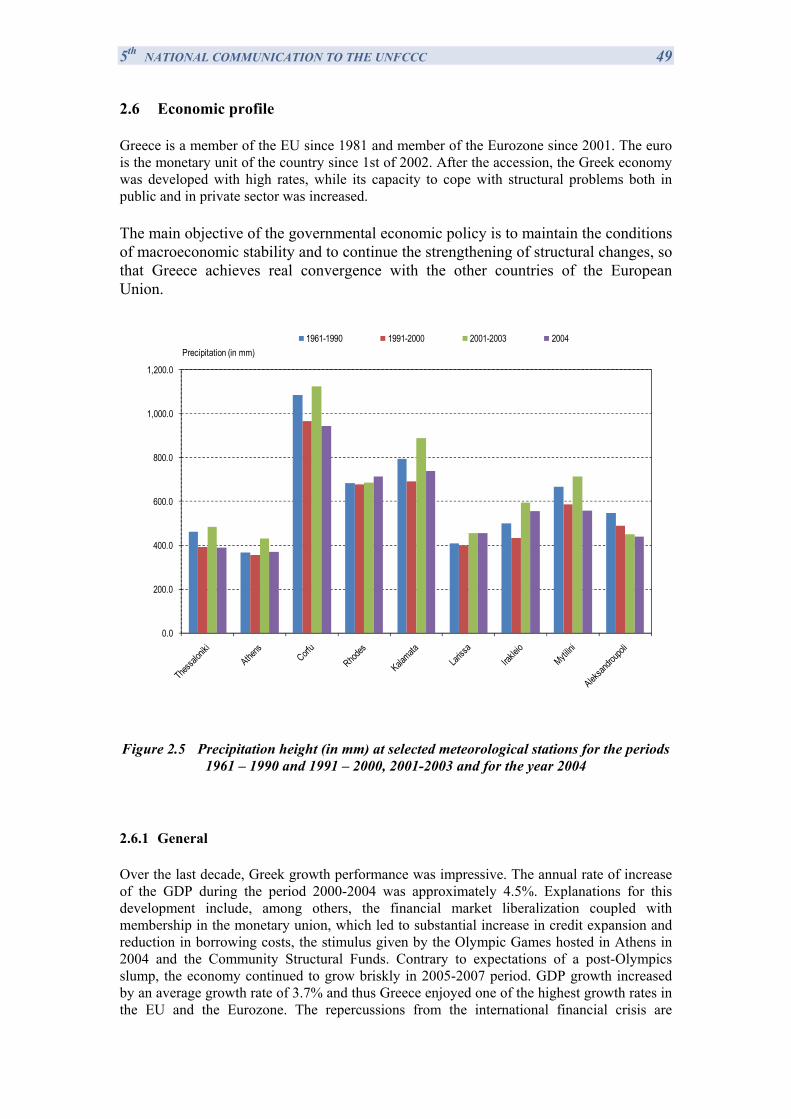
5th NATIONAL COMMUNICATION TO THE UNFCCC 49 2.6 Economic profile
Greece is a member of the EU since 1981 and member of the Eurozone since 2001. The euro is the monetary unit of the country since 1st of 2002. After the accession, the Greek economy was developed with high rates, while its capacity to cope with structural problems both in public and in private sector was increased.
The main objective of the governmental economic policy is to maintain the conditions of macroeconomic stability and to continue the strengthening of structural changes, so that Greece achieves real convergence with the other countries of the European Union.
0.0
200.0
400.0
600.0
800.0
1,000.0
1,200.0
Precipitation (in mm) 1961-1990 1991-2000 2001-2003 2004
Figure 2.5 Precipitation height (in mm) at selected meteorological stations for the periods 1961 – 1990 and 1991 – 2000, 2001-2003 and for the year 2004
2.6.1 General
Over the last decade, Greek growth performance was impressive. The annual rate of increase of the GDP during the period 2000-2004 was approximately 4.5%. Explanations for this development include, among others, the financial market liberalization coupled with membership in the monetary union, which led to substantial increase in credit expansion and reduction in borrowing costs, the stimulus given by the Olympic Games hosted in Athens in 2004 and the Community Structural Funds. Contrary to expectations of a post-Olympics slump, the economy continued to grow briskly in 2005-2007 period. GDP growth increased by an average growth rate of 3.7% and thus Greece enjoyed one of the highest growth rates in the EU and the Eurozone. The repercussions from the international financial crisis are
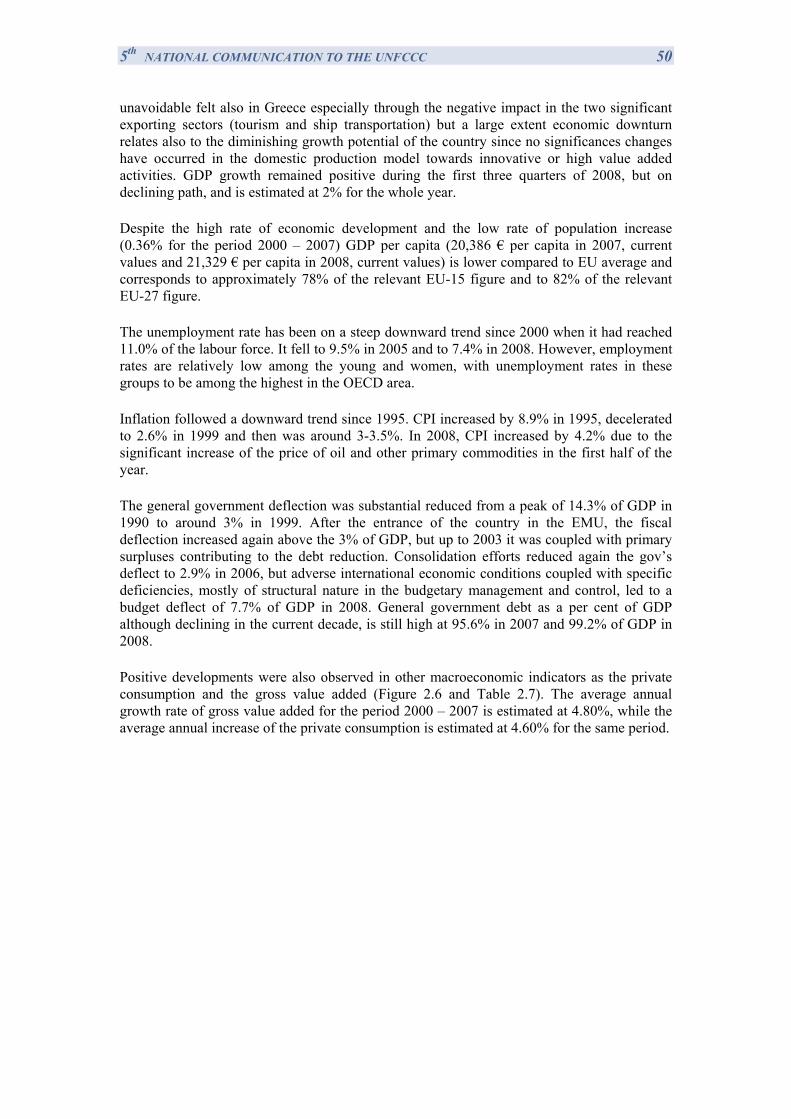
5th NATIONAL COMMUNICATION TO THE UNFCCC 50 unavoidable felt also in Greece especially through the negative impact in the two significant exporting sectors (tourism and ship transportation) but a large extent economic downturn relates also to the diminishing growth potential of the country since no significances changes have occurred in the domestic production model towards innovative or high value added activities. GDP growth remained positive during the first three quarters of 2008, but on declining path, and is estimated at 2% for the whole year.
Despite the high rate of economic development and the low rate of population increase (0.36% for the period 2000 – 2007) GDP per capita (20,386 € per capita in 2007, current values and 21,329 € per capita in 2008, current values) is lower compared to EU average and corresponds to approximately 78% of the relevant EU-15 figure and to 82% of the relevant EU-27 figure.
The unemployment rate has been on a steep downward trend since 2000 when it had reached 11.0% of the labour force. It fell to 9.5% in 2005 and to 7.4% in 2008. However, employment rates are relatively low among the young and women, with unemployment rates in these groups to be among the highest in the OECD area.
Inflation followed a downward trend since 1995. CPI increased by 8.9% in 1995, decelerated to 2.6% in 1999 and then was around 3-3.5%. In 2008, CPI increased by 4.2% due to the significant increase of the price of oil and other primary commodities in the first half of the year.
The general government deflection was substantial reduced from a peak of 14.3% of GDP in 1990 to around 3% in 1999. After the entrance of the country in the EMU, the fiscal deflection increased again above the 3% of GDP, but up to 2003 it was coupled with primary surpluses contributing to the debt reduction. Consolidation efforts reduced again the gov’s deflect to 2.9% in 2006, but adverse international economic conditions coupled with specific deficiencies, mostly of structural nature in the budgetary management and control, led to a budget deflect of 7.7% of GDP in 2008. General government debt as a per cent of GDP although declining in the current decade, is still high at 95.6% in 2007 and 99.2% of GDP in 2008.
Positive developments were also observed in other macroeconomic indicators as the private consumption and the gross value added (Figure 2.6 and Table 2.7). The average annual growth rate of gross value added for the period 2000 – 2007 is estimated at 4.80%, while the average annual increase of the private consumption is estimated at 4.60% for the same period.
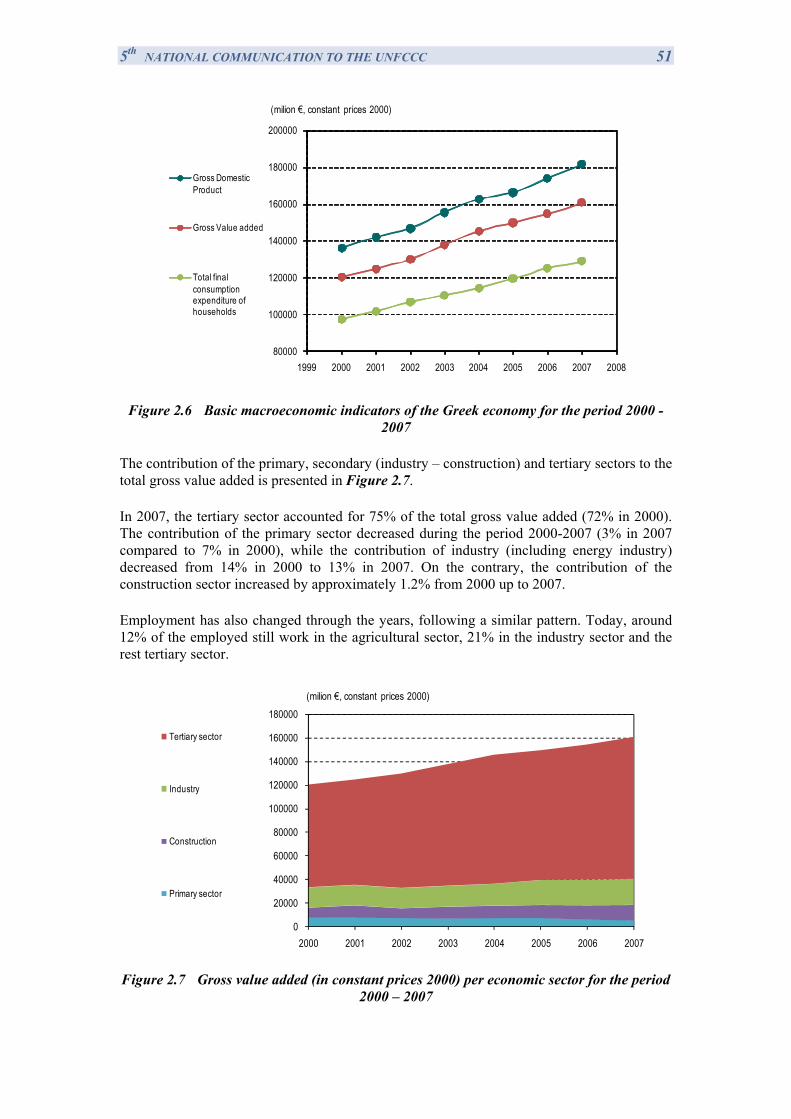
5th NATIONAL COMMUNICATION TO THE UNFCCC 51
80000
100000
120000
140000
160000
180000
200000
1999 2000 2001 2002 2003 2004 2005 2006 2007 2008
(milion €, constant prices 2000)
Gross Domestic Product
Gross Value added
Total final consumption expenditure of households
Figure 2.6 Basic macroeconomic indicators of the Greek economy for the period 2000 - 2007
The contribution of the primary, secondary (industry – construction) and tertiary sectors to the total gross value added is presented in Figure 2.7.
In 2007, the tertiary sector accounted for 75% of the total gross value added (72% in 2000). The contribution of the primary sector decreased during the period 2000-2007 (3% in 2007 compared to 7% in 2000), while the contribution of industry (including energy industry) decreased from 14% in 2000 to 13% in 2007. On the contrary, the contribution of the construction sector increased by approximately 1.2% from 2000 up to 2007.
Employment has also changed through the years, following a similar pattern. Today, around 12% of the employed still work in the agricultural sector, 21% in the industry sector and the rest tertiary sector.
0
20000
40000
60000
80000
100000
120000
140000
160000
180000
2000 2001 2002 2003 2004 2005 2006 2007
(milion €, constant prices 2000)
Tertiary sector
Industry
Construction
Primary sector
Figure 2.7 Gross value added (in constant prices 2000) per economic sector for the period
2000 – 2007
5th NATIONAL COMMUNICATION TO THE UNFCCC 52 With the exception of the primary sector, the rest sectors of economic activity presented positive growth rates. The construction sector presented the highest average annual growth rate (approximately 8%) due to the significant infrastructure investments realised during this period which to a large extent were related to the organisation of the Olympic Games of 2004. The average annual rate of increase of gross value added in industry and in the tertiary sector, during the period 2000-2007, was 4.1% and 5.5% respectively. The gross value added of the primary sector decreased with a 4 % rate.
EU and especially the Eurozone countries are the main trading partners of Greece for both imports and exports. More than 50% of the total trade is taking place with EU countries. As far as the Greek exports are concerned, industrial products have the higher share, around 64%, of total exports. Agricultural products constitute the 20%, raw materials the 5% and petroleum products the 12%. On the other hand, industrial products are around the 70% of total Greek imports of goods.
2.6.2 Primary sector
The contribution of the primary sector to the total gross value added decreased by 2.8% from 2000 to 2007. During the same period employment in the sector decreased by 26% and as a result employment in the primary sector accounts for 11% of total employment in 2007. The corresponding figure in 2000 was approximately 12%.
2.6.2.1 Agriculture
In 2007, the total area of agricultural land in Greece was approximately 3.7 Μha, more than half of which is on relatively steep slopes on which cultivation is carried out without protection against soil erosion. The area of agricultural land decreased by 7.5% in 2006 compared to 1990.
No significant changes took place since 2000 concerning fallow land, irrigated land (Figure 2.8) and the average area of agricultural holdings.
The percentage of irrigated agricultural land has remained constant since 2000 (38%), while total irrigated land in 2006 increased by 22% compared to 1990.
The majority of cultivated areas (76%) are holdings with an area less than 5 ha. Holdings with an area between 5 ha and 20 ha represent the 20% of cultivated areas and only the rest 4% of the cultivated area is distributed among holdings with an area exceeding 20 ha.
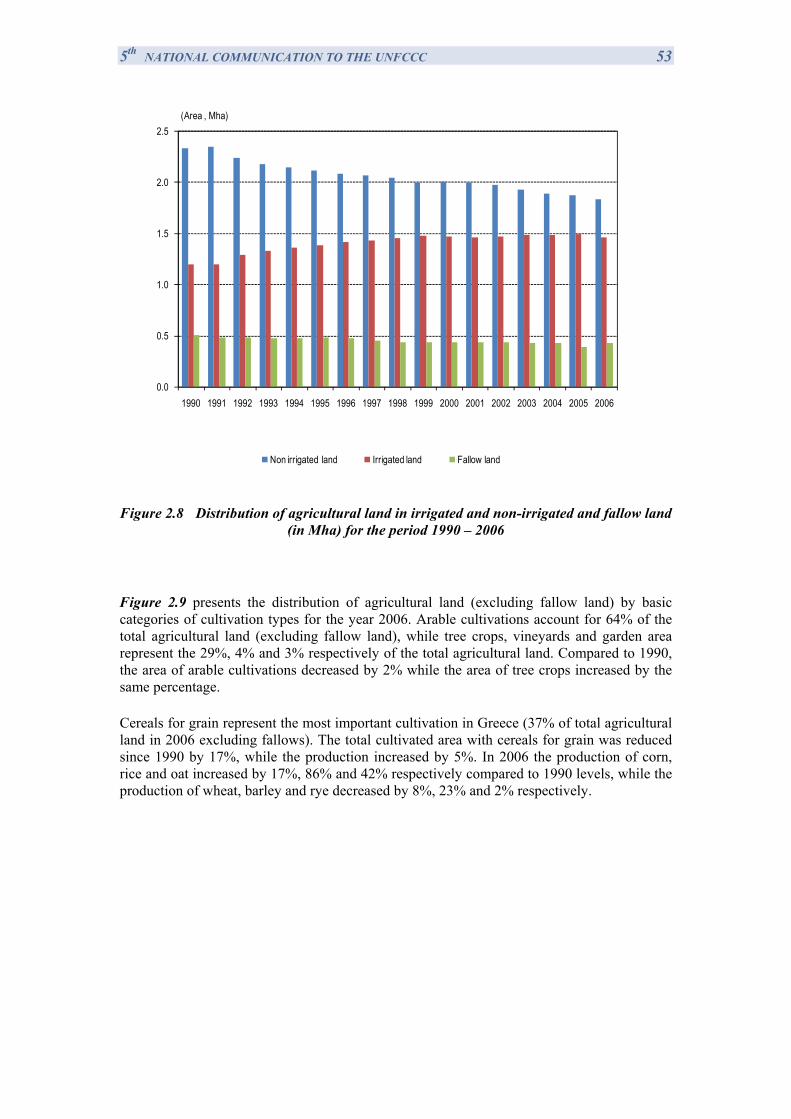
5th NATIONAL COMMUNICATION TO THE UNFCCC 53
0.0
0.5
1.0
1.5
2.0
2.5
1990 1991 1992 1993 1994 1995 1996 1997 1998 1999 2000 2001 2002 2003 2004 2005 2006
(Area , Mha)
Non irrigated land Irrigated land Fallow land
Figure 2.8 Distribution of agricultural land in irrigated and non-irrigated and fallow land (in Mha) for the period 1990 – 2006
Figure 2.9 presents the distribution of agricultural land (excluding fallow land) by basic categories of cultivation types for the year 2006. Arable cultivations account for 64% of the total agricultural land (excluding fallow land), while tree crops, vineyards and garden area represent the 29%, 4% and 3% respectively of the total agricultural land. Compared to 1990, the area of arable cultivations decreased by 2% while the area of tree crops increased by the same percentage.
Cereals for grain represent the most important cultivation in Greece (37% of total agricultural land in 2006 excluding fallows). The total cultivated area with cereals for grain was reduced since 1990 by 17%, while the production increased by 5%. In 2006 the production of corn, rice and oat increased by 17%, 86% and 42% respectively compared to 1990 levels, while the production of wheat, barley and rye decreased by 8%, 23% and 2% respectively.
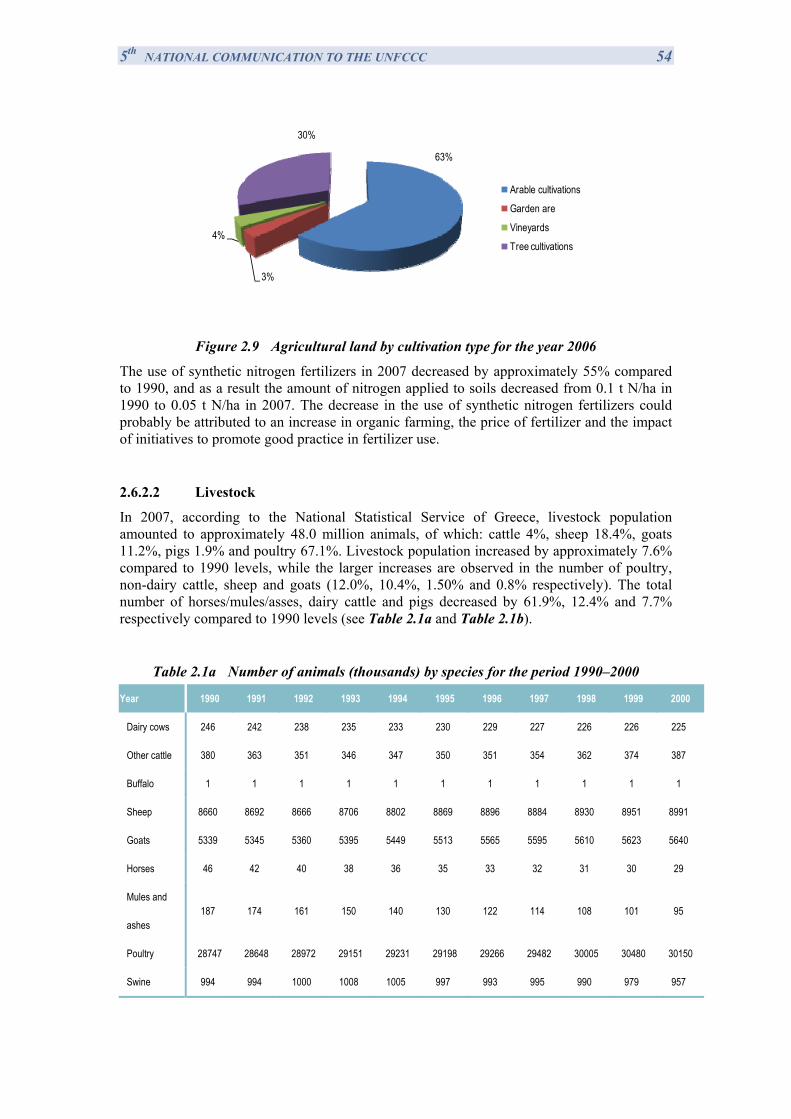
5th NATIONAL COMMUNICATION TO THE UNFCCC 54
63%
3%
4%
30%
Arable cultivations
Garden are
Vineyards
Tree cultivations
Figure 2.9 Agricultural land by cultivation type for the year 2006
The use of synthetic nitrogen fertilizers in 2007 decreased by approximately 55% compared to 1990, and as a result the amount of nitrogen applied to soils decreased from 0.1 t N/ha in 1990 to 0.05 t N/ha in 2007. The decrease in the use of synthetic nitrogen fertilizers could probably be attributed to an increase in organic farming, the price of fertilizer and the impact of initiatives to promote good practice in fertilizer use.
2.6.2.2 Livestock
In 2007, according to the National Statistical Service of Greece, livestock population amounted to approximately 48.0 million animals, of which: cattle 4%, sheep 18.4%, goats 11.2%, pigs 1.9% and poultry 67.1%. Livestock population increased by approximately 7.6% compared to 1990 levels, while the larger increases are observed in the number of poultry, non-dairy cattle, sheep and goats (12.0%, 10.4%, 1.50% and 0.8% respectively). The total number of horses/mules/asses, dairy cattle and pigs decreased by 61.9%, 12.4% and 7.7% respectively compared to 1990 levels (see Table 2.1a and Table 2.1b).
Table 2.1a Number of animals (thousands) by species for the period 1990–2000
Year 1990 1991 1992 1993 1994 1995 1996 1997 1998 1999 2000
Dairy cows 246 242 238 235 233 230 229 227 226 226 225
Other cattle 380 363 351 346 347 350 351 354 362 374 387
Buffalo 1 1 1 1 1 1 1 1 1 1 1
Sheep 8660 8692 8666 8706 8802 8869 8896 8884 8930 8951 8991
Goats 5339 5345 5360 5395 5449 5513 5565 5595 5610 5623 5640
Horses 46 42 40 38 36 35 33 32 31 30 29
Mules and
ashes 187 174 161 150 140 130 122 114 108 101 95
Poultry 28747 28648 28972 29151 29231 29198 29266 29482 30005 30480 30150
Swine 994 994 1000 1008 1005 997 993 995 990 979 957
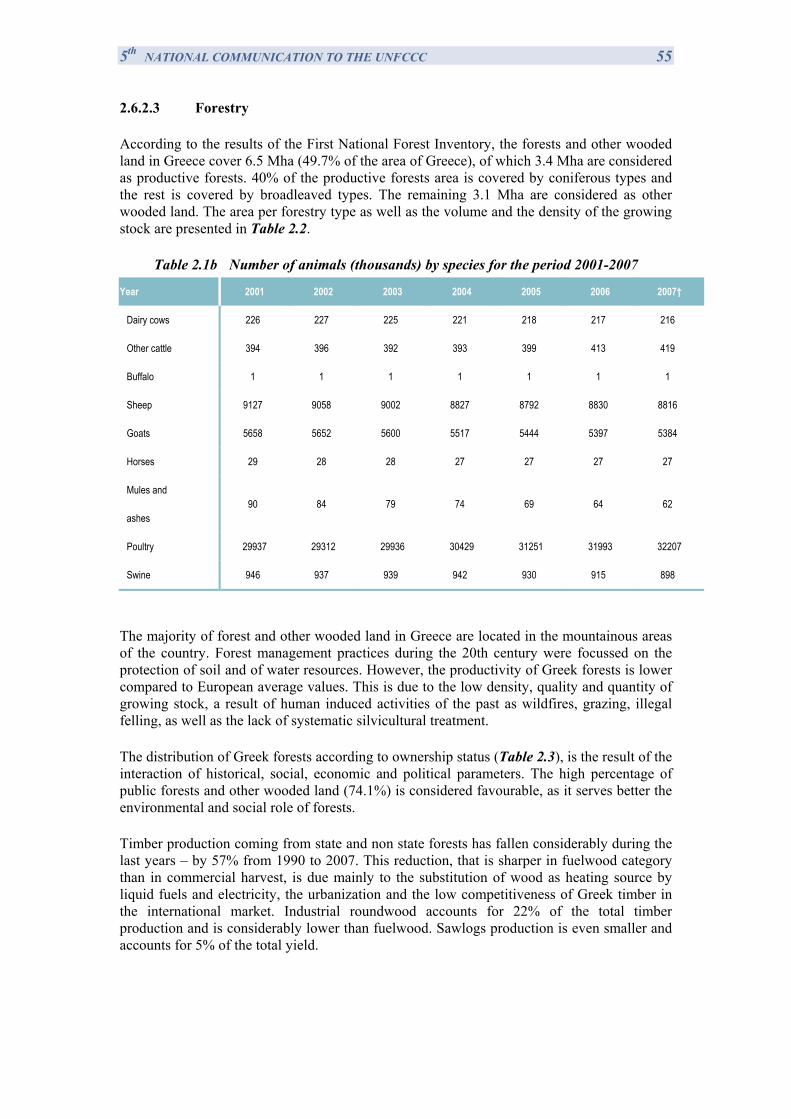
5th NATIONAL COMMUNICATION TO THE UNFCCC 55 2.6.2.3 Forestry
According to the results of the First National Forest Inventory, the forests and other wooded land in Greece cover 6.5 Mha (49.7% of the area of Greece), of which 3.4 Mha are considered as productive forests. 40% of the productive forests area is covered by coniferous types and the rest is covered by broadleaved types. The remaining 3.1 Mha are considered as other wooded land. The area per forestry type as well as the volume and the density of the growing stock are presented in Table 2.2.
Table 2.1b Number of animals (thousands) by species for the period 2001-2007
Year 2001 2002 2003 2004 2005 2006 2007†
Dairy cows 226 227 225 221 218 217 216
Other cattle 394 396 392 393 399 413 419
Buffalo 1 1 1 1 1 1 1
Sheep 9127 9058 9002 8827 8792 8830 8816
Goats 5658 5652 5600 5517 5444 5397 5384
Horses 29 28 28 27 27 27 27
Mules and
ashes 90 84 79 74 69 64 62
Poultry 29937 29312 29936 30429 31251 31993 32207
Swine 946 937 939 942 930 915 898
The majority of forest and other wooded land in Greece are located in the mountainous areas of the country. Forest management practices during the 20th century were focussed on the protection of soil and of water resources. However, the productivity of Greek forests is lower compared to European average values. This is due to the low density, quality and quantity of growing stock, a result of human induced activities of the past as wildfires, grazing, illegal felling, as well as the lack of systematic silvicultural treatment.
The distribution of Greek forests according to ownership status (Table 2.3), is the result of the interaction of historical, social, economic and political parameters. The high percentage of public forests and other wooded land (74.1%) is considered favourable, as it serves better the environmental and social role of forests.
Timber production coming from state and non state forests has fallen considerably during the last years – by 57% from 1990 to 2007. This reduction, that is sharper in fuelwood category than in commercial harvest, is due mainly to the substitution of wood as heating source by liquid fuels and electricity, the urbanization and the low competitiveness of Greek timber in the international market. Industrial roundwood accounts for 22% of the total timber production and is considerably lower than fuelwood. Sawlogs production is even smaller and accounts for 5% of the total yield.
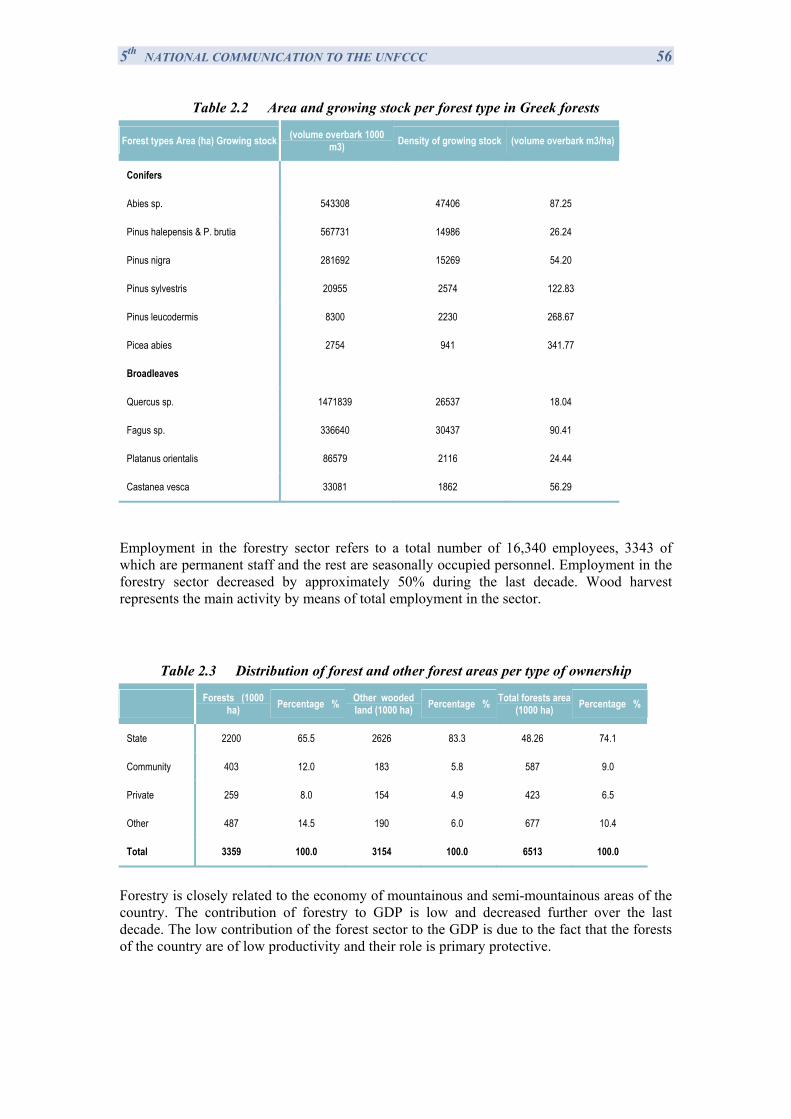
5th NATIONAL COMMUNICATION TO THE UNFCCC 56
Table 2.2 Area and growing stock per forest type in Greek forests
Forest types Area (ha) Growing stock (volume overbark 1000 m3) Density of growing stock (volume overbark m3/ha)
Conifers
Abies sp. 543308 47406 87.25
Pinus halepensis & P. brutia 567731 14986 26.24
Pinus nigra 281692 15269 54.20
Pinus sylvestris 20955 2574 122.83
Pinus leucodermis 8300 2230 268.67
Picea abies 2754 941 341.77
Broadleaves
Quercus sp. 1471839 26537 18.04
Fagus sp. 336640 30437 90.41
Platanus orientalis 86579 2116 24.44
Castanea vesca 33081 1862 56.29
Employment in the forestry sector refers to a total number of 16,340 employees, 3343 of which are permanent staff and the rest are seasonally occupied personnel. Employment in the forestry sector decreased by approximately 50% during the last decade. Wood harvest represents the main activity by means of total employment in the sector.
Table 2.3 Distribution of forest and other forest areas per type of ownership
Forests (1000 ha) Percentage % Other wooded
land (1000 ha) Percentage % Total forests area (1000 ha) Percentage %
State 2200 65.5 2626 83.3 48.26 74.1
Community 403 12.0 183 5.8 587 9.0
Private 259 8.0 154 4.9 423 6.5
Other 487 14.5 190 6.0 677 10.4
Total 3359 100.0 3154 100.0 6513 100.0
Forestry is closely related to the economy of mountainous and semi-mountainous areas of the country. The contribution of forestry to GDP is low and decreased further over the last decade. The low contribution of the forest sector to the GDP is due to the fact that the forests of the country are of low productivity and their role is primary protective.
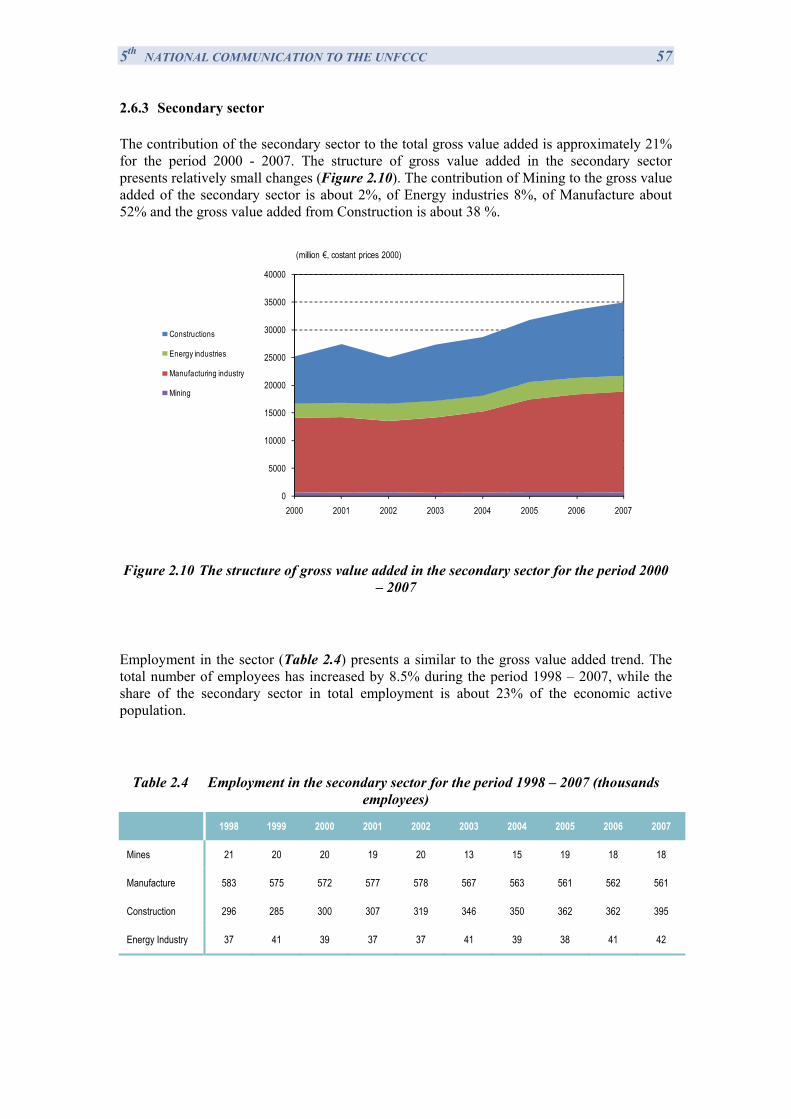
5th NATIONAL COMMUNICATION TO THE UNFCCC 57 2.6.3 Secondary sector
The contribution of the secondary sector to the total gross value added is approximately 21% for the period 2000 - 2007. The structure of gross value added in the secondary sector presents relatively small changes (Figure 2.10). The contribution of Mining to the gross value added of the secondary sector is about 2%, of Energy industries 8%, of Manufacture about 52% and the gross value added from Construction is about 38 %.
0
5000
10000
15000
20000
25000
30000
35000
40000
2000 2001 2002 2003 2004 2005 2006 2007
(million €, costant prices 2000)
Constructions
Energy industries
Manufacturing industry
Mining
Figure 2.10 The structure of gross value added in the secondary sector for the period 2000 – 2007
Employment in the sector (Table 2.4) presents a similar to the gross value added trend. The total number of employees has increased by 8.5% during the period 1998 – 2007, while the share of the secondary sector in total employment is about 23% of the economic active population.
Table 2.4 Employment in the secondary sector for the period 1998 – 2007 (thousands employees)
1998 1999 2000 2001 2002 2003 2004 2005 2006 2007
Mines 21 20 20 19 20 13 15 19 18 18
Manufacture 583 575 572 577 578 567 563 561 562 561
Construction 296 285 300 307 319 346 350 362 362 395
Energy Industry 37 41 39 37 37 41 39 38 41 42
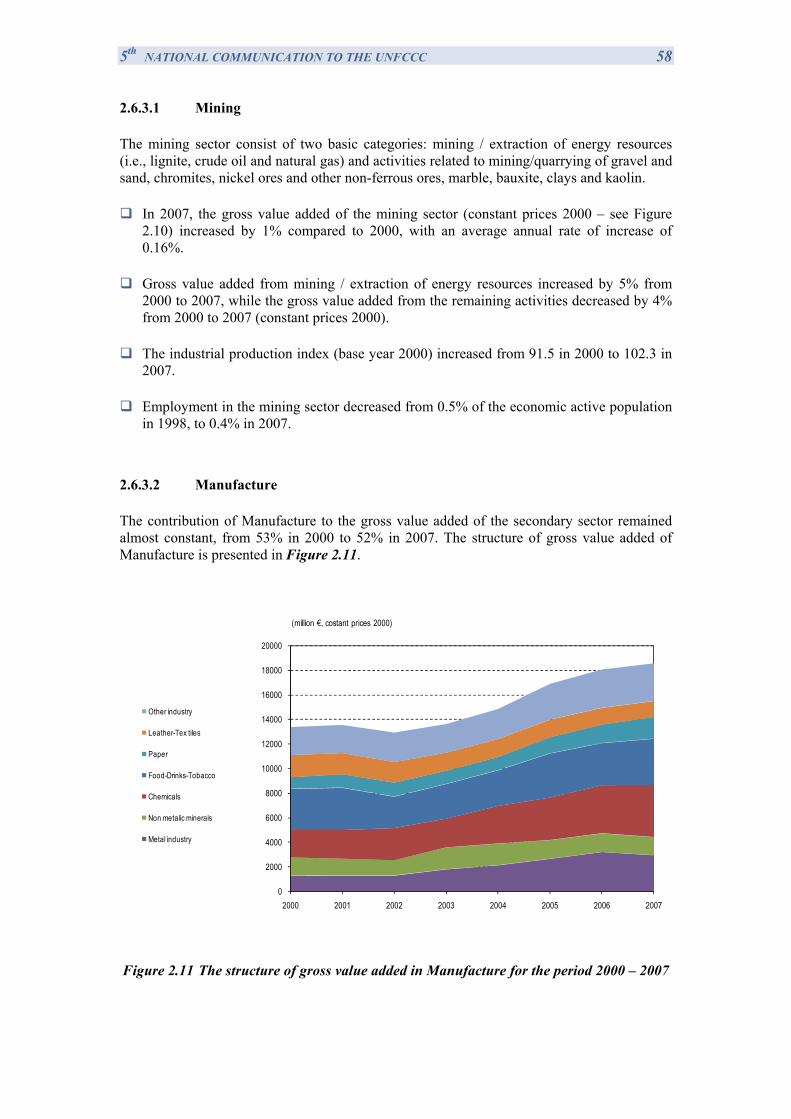
5th NATIONAL COMMUNICATION TO THE UNFCCC 58 2.6.3.1 Mining
The mining sector consist of two basic categories: mining / extraction of energy resources (i.e., lignite, crude oil and natural gas) and activities related to mining/quarrying of gravel and sand, chromites, nickel ores and other non-ferrous ores, marble, bauxite, clays and kaolin.
In 2007, the gross value added of the mining sector (constant prices 2000 – see Figure 2.10) increased by 1% compared to 2000, with an average annual rate of increase of 0.16%.
Gross value added from mining / extraction of energy resources increased by 5% from 2000 to 2007, while the gross value added from the remaining activities decreased by 4% from 2000 to 2007 (constant prices 2000).
The industrial production index (base year 2000) increased from 91.5 in 2000 to 102.3 in 2007.
Employment in the mining sector decreased from 0.5% of the economic active population in 1998, to 0.4% in 2007.
2.6.3.2 Manufacture
The contribution of Manufacture to the gross value added of the secondary sector remained almost constant, from 53% in 2000 to 52% in 2007. The structure of gross value added of Manufacture is presented in Figure 2.11.
0
2000
4000
6000
8000
10000
12000
14000
16000
18000
20000
2000 2001 2002 2003 2004 2005 2006 2007
(million €, costant prices 2000)
Other industry
Leather-Tex tiles
Paper
Food-Drinks-Tobacco
Chemicals
Non metalic minerals
Metal industry
Figure 2.11 The structure of gross value added in Manufacture for the period 2000 – 2007
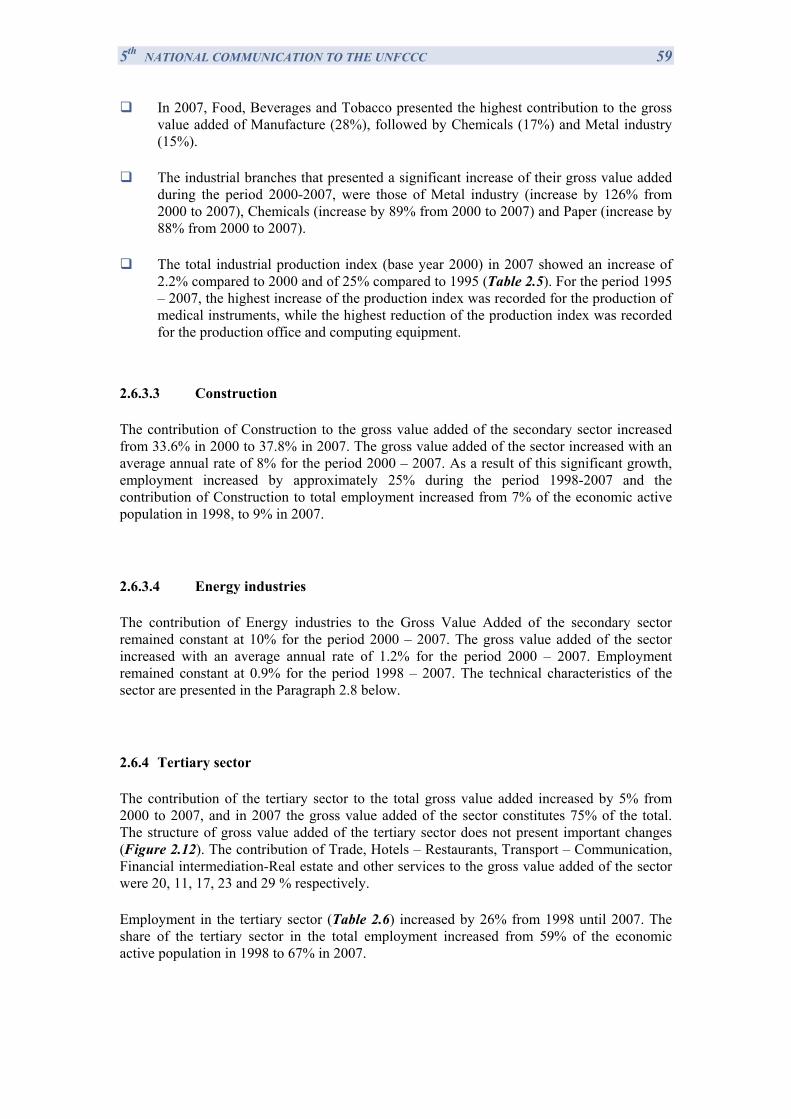
5th NATIONAL COMMUNICATION TO THE UNFCCC 59
In 2007, Food, Beverages and Tobacco presented the highest contribution to the gross value added of Manufacture (28%), followed by Chemicals (17%) and Metal industry (15%).
The industrial branches that presented a significant increase of their gross value added during the period 2000-2007, were those of Metal industry (increase by 126% from 2000 to 2007), Chemicals (increase by 89% from 2000 to 2007) and Paper (increase by 88% from 2000 to 2007).
The total industrial production index (base year 2000) in 2007 showed an increase of 2.2% compared to 2000 and of 25% compared to 1995 (Table 2.5). For the period 1995 – 2007, the highest increase of the production index was recorded for the production of medical instruments, while the highest reduction of the production index was recorded for the production office and computing equipment.
2.6.3.3 Construction
The contribution of Construction to the gross value added of the secondary sector increased from 33.6% in 2000 to 37.8% in 2007. The gross value added of the sector increased with an average annual rate of 8% for the period 2000 – 2007. As a result of this significant growth, employment increased by approximately 25% during the period 1998-2007 and the contribution of Construction to total employment increased from 7% of the economic active population in 1998, to 9% in 2007.
2.6.3.4 Energy industries
The contribution of Energy industries to the Gross Value Added of the secondary sector remained constant at 10% for the period 2000 – 2007. The gross value added of the sector increased with an average annual rate of 1.2% for the period 2000 – 2007. Employment remained constant at 0.9% for the period 1998 – 2007. The technical characteristics of the sector are presented in the Paragraph 2.8 below.
2.6.4 Tertiary sector
The contribution of the tertiary sector to the total gross value added increased by 5% from 2000 to 2007, and in 2007 the gross value added of the sector constitutes 75% of the total. The structure of gross value added of the tertiary sector does not present important changes (Figure 2.12). The contribution of Trade, Hotels – Restaurants, Transport – Communication, Financial intermediation-Real estate and other services to the gross value added of the sector were 20, 11, 17, 23 and 29 % respectively.
Employment in the tertiary sector (Table 2.6) increased by 26% from 1998 until 2007. The share of the tertiary sector in the total employment increased from 59% of the economic active population in 1998 to 67% in 2007.
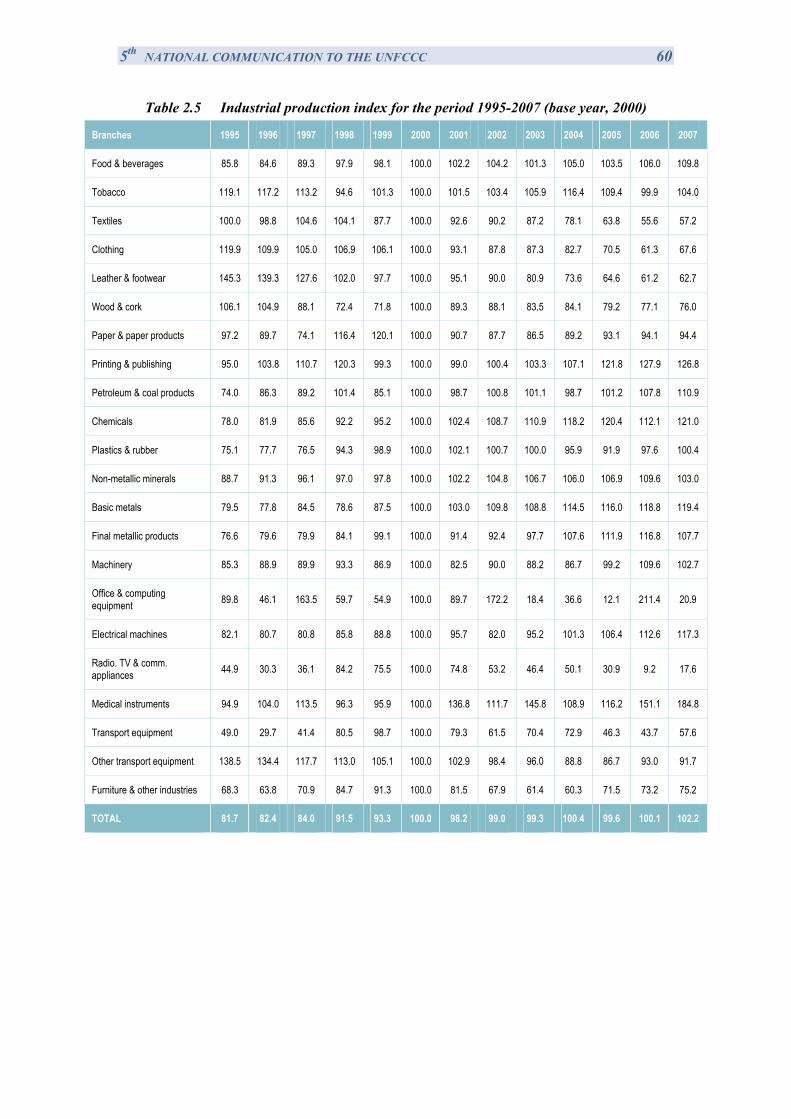
5th NATIONAL COMMUNICATION TO THE UNFCCC 60
Table 2.5 Industrial production index for the period 1995-2007 (base year, 2000)
Branches 1995 1996 1997 1998 1999 2000 2001 2002 2003 2004 2005 2006 2007
Food & beverages 85.8 84.6 89.3 97.9 98.1 100.0 102.2 104.2 101.3 105.0 103.5 106.0 109.8
Tobacco 119.1 117.2 113.2 94.6 101.3 100.0 101.5 103.4 105.9 116.4 109.4 99.9 104.0
Textiles 100.0 98.8 104.6 104.1 87.7 100.0 92.6 90.2 87.2 78.1 63.8 55.6 57.2
Clothing 119.9 109.9 105.0 106.9 106.1 100.0 93.1 87.8 87.3 82.7 70.5 61.3 67.6
Leather & footwear 145.3 139.3 127.6 102.0 97.7 100.0 95.1 90.0 80.9 73.6 64.6 61.2 62.7
Wood & cork 106.1 104.9 88.1 72.4 71.8 100.0 89.3 88.1 83.5 84.1 79.2 77.1 76.0
Paper & paper products 97.2 89.7 74.1 116.4 120.1 100.0 90.7 87.7 86.5 89.2 93.1 94.1 94.4
Printing & publishing 95.0 103.8 110.7 120.3 99.3 100.0 99.0 100.4 103.3 107.1 121.8 127.9 126.8
Petroleum & coal products 74.0 86.3 89.2 101.4 85.1 100.0 98.7 100.8 101.1 98.7 101.2 107.8 110.9
Chemicals 78.0 81.9 85.6 92.2 95.2 100.0 102.4 108.7 110.9 118.2 120.4 112.1 121.0
Plastics & rubber 75.1 77.7 76.5 94.3 98.9 100.0 102.1 100.7 100.0 95.9 91.9 97.6 100.4
Non-metallic minerals 88.7 91.3 96.1 97.0 97.8 100.0 102.2 104.8 106.7 106.0 106.9 109.6 103.0
Basic metals 79.5 77.8 84.5 78.6 87.5 100.0 103.0 109.8 108.8 114.5 116.0 118.8 119.4
Final metallic products 76.6 79.6 79.9 84.1 99.1 100.0 91.4 92.4 97.7 107.6 111.9 116.8 107.7
Machinery 85.3 88.9 89.9 93.3 86.9 100.0 82.5 90.0 88.2 86.7 99.2 109.6 102.7
Office & computing equipment 89.8 46.1 163.5 59.7 54.9 100.0 89.7 172.2 18.4 36.6 12.1 211.4 20.9
Electrical machines 82.1 80.7 80.8 85.8 88.8 100.0 95.7 82.0 95.2 101.3 106.4 112.6 117.3
Radio. TV & comm. appliances 44.9 30.3 36.1 84.2 75.5 100.0 74.8 53.2 46.4 50.1 30.9 9.2 17.6
Medical instruments 94.9 104.0 113.5 96.3 95.9 100.0 136.8 111.7 145.8 108.9 116.2 151.1 184.8
Transport equipment 49.0 29.7 41.4 80.5 98.7 100.0 79.3 61.5 70.4 72.9 46.3 43.7 57.6
Other transport equipment 138.5 134.4 117.7 113.0 105.1 100.0 102.9 98.4 96.0 88.8 86.7 93.0 91.7
Furniture & other industries 68.3 63.8 70.9 84.7 91.3 100.0 81.5 67.9 61.4 60.3 71.5 73.2 75.2
TOTAL 81.7 82.4 84.0 91.5 93.3 100.0 98.2 99.0 99.3 100.4 99.6 100.1 102.2
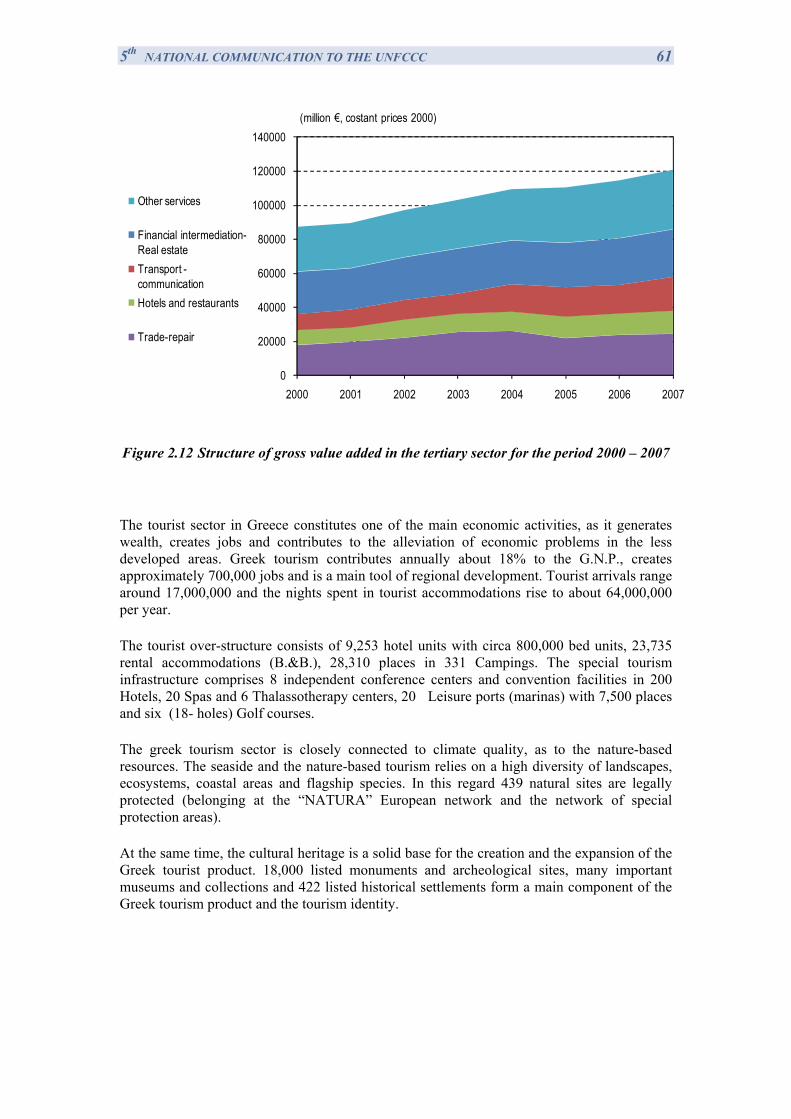
5th NATIONAL COMMUNICATION TO THE UNFCCC 61
0
20000
40000
60000
80000
100000
120000
140000
2000 2001 2002 2003 2004 2005 2006 2007
(million €, costant prices 2000)
Other services
Financial intermediation-Real estateTransport -communicationHotels and restaurants
Trade-repair
Figure 2.12 Structure of gross value added in the tertiary sector for the period 2000 – 2007
The tourist sector in Greece constitutes one of the main economic activities, as it generates wealth, creates jobs and contributes to the alleviation of economic problems in the less developed areas. Greek tourism contributes annually about 18% to the G.N.P., creates approximately 700,000 jobs and is a main tool of regional development. Tourist arrivals range around 17,000,000 and the nights spent in tourist accommodations rise to about 64,000,000 per year.
The tourist over-structure consists of 9,253 hotel units with circa 800,000 bed units, 23,735 rental accommodations (B.&B.), 28,310 places in 331 Campings. The special tourism infrastructure comprises 8 independent conference centers and convention facilities in 200 Hotels, 20 Spas and 6 Thalassotherapy centers, 20 Leisure ports (marinas) with 7,500 places and six (18- holes) Golf courses.
The greek tourism sector is closely connected to climate quality, as to the nature-based resources. The seaside and the nature-based tourism relies on a high diversity of landscapes, ecosystems, coastal areas and flagship species. In this regard 439 natural sites are legally protected (belonging at the “NATURA” European network and the network of special protection areas).
At the same time, the cultural heritage is a solid base for the creation and the expansion of the Greek tourist product. 18,000 listed monuments and archeological sites, many important museums and collections and 422 listed historical settlements form a main component of the Greek tourism product and the tourism identity.
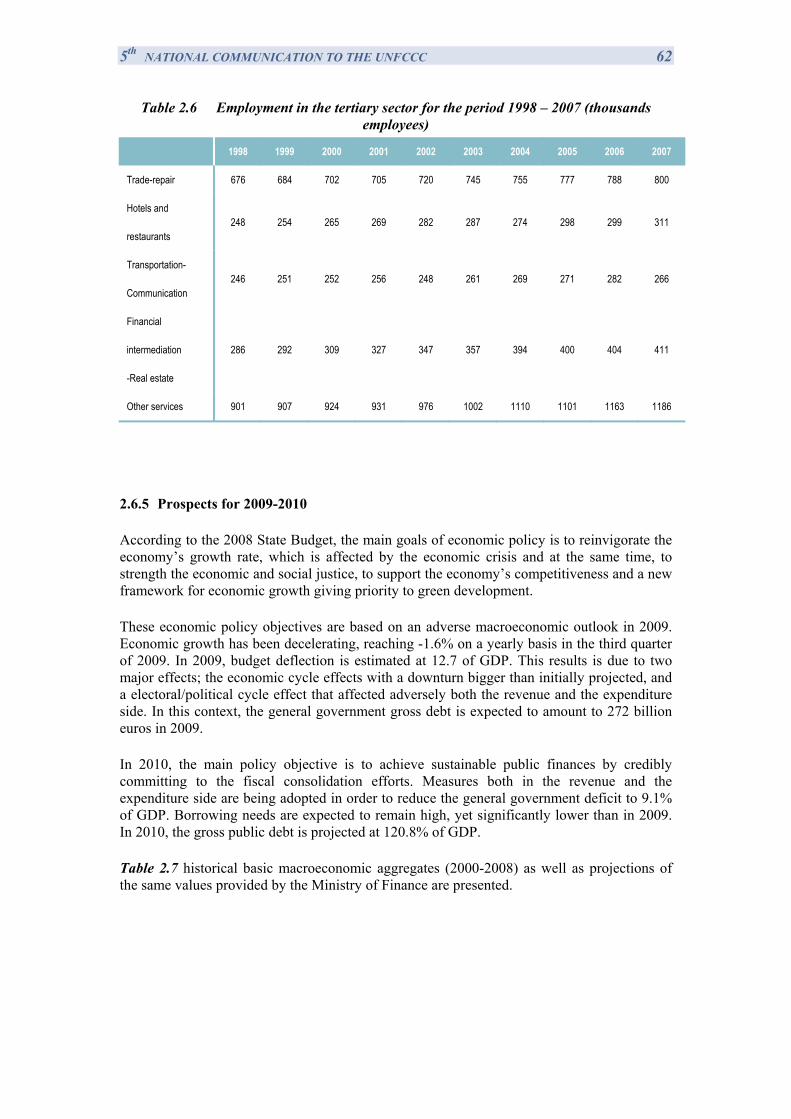
5th NATIONAL COMMUNICATION TO THE UNFCCC 62
Table 2.6 Employment in the tertiary sector for the period 1998 – 2007 (thousands employees)
1998 1999 2000 2001 2002 2003 2004 2005 2006 2007
Trade-repair 676 684 702 705 720 745 755 777 788 800
Hotels and
restaurants 248 254 265 269 282 287 274 298 299 311
Transportation-
Communication 246 251 252 256 248 261 269 271 282 266
Financial
intermediation
-Real estate
286 292 309 327 347 357 394 400 404 411
Other services 901 907 924 931 976 1002 1110 1101 1163 1186
2.6.5 Prospects for 2009-2010
According to the 2008 State Budget, the main goals of economic policy is to reinvigorate the economy’s growth rate, which is affected by the economic crisis and at the same time, to strength the economic and social justice, to support the economy’s competitiveness and a new framework for economic growth giving priority to green development.
These economic policy objectives are based on an adverse macroeconomic outlook in 2009. Economic growth has been decelerating, reaching -1.6% on a yearly basis in the third quarter of 2009. In 2009, budget deflection is estimated at 12.7 of GDP. This results is due to two major effects; the economic cycle effects with a downturn bigger than initially projected, and a electoral/political cycle effect that affected adversely both the revenue and the expenditure side. In this context, the general government gross debt is expected to amount to 272 billion euros in 2009.
In 2010, the main policy objective is to achieve sustainable public finances by credibly committing to the fiscal consolidation efforts. Measures both in the revenue and the expenditure side are being adopted in order to reduce the general government deficit to 9.1% of GDP. Borrowing needs are expected to remain high, yet significantly lower than in 2009. In 2010, the gross public debt is projected at 120.8% of GDP.
Table 2.7 historical basic macroeconomic aggregates (2000-2008) as well as projections of the same values provided by the Ministry of Finance are presented.
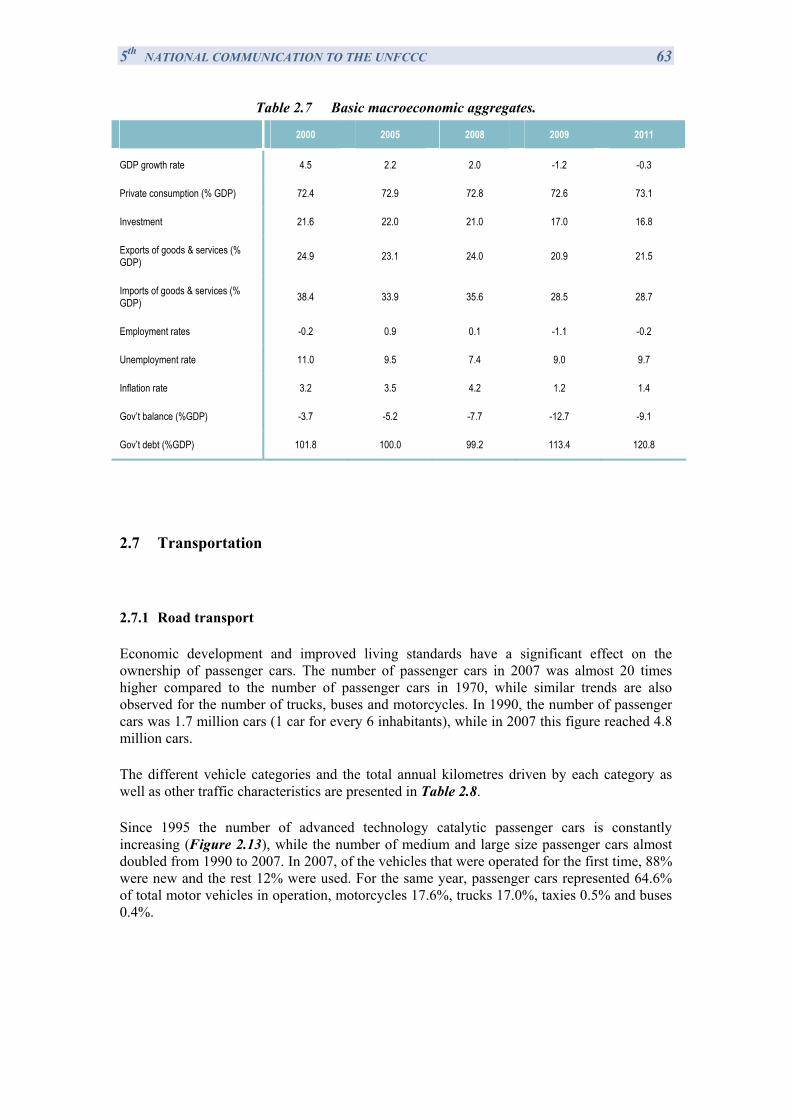
5th NATIONAL COMMUNICATION TO THE UNFCCC 63
Table 2.7 Basic macroeconomic aggregates.
2000 2005 2008 2009 2011
GDP growth rate 4.5 2.2 2.0 -1.2 -0.3
Private consumption (% GDP) 72.4 72.9 72.8 72.6 73.1
Investment 21.6 22.0 21.0 17.0 16.8
Exports of goods & services (% GDP) 24.9 23.1 24.0 20.9 21.5
Imports of goods & services (% GDP) 38.4 33.9 35.6 28.5 28.7
Employment rates -0.2 0.9 0.1 -1.1 -0.2
Unemployment rate 11.0 9.5 7.4 9.0 9.7
Inflation rate 3.2 3.5 4.2 1.2 1.4
Gov’t balance (%GDP) -3.7 -5.2 -7.7 -12.7 -9.1
Gov’t debt (%GDP) 101.8 100.0 99.2 113.4 120.8
2.7 Transportation
2.7.1 Road transport
Economic development and improved living standards have a significant effect on the ownership of passenger cars. The number of passenger cars in 2007 was almost 20 times higher compared to the number of passenger cars in 1970, while similar trends are also observed for the number of trucks, buses and motorcycles. In 1990, the number of passenger cars was 1.7 million cars (1 car for every 6 inhabitants), while in 2007 this figure reached 4.8 million cars.
The different vehicle categories and the total annual kilometres driven by each category as well as other traffic characteristics are presented in Table 2.8.
Since 1995 the number of advanced technology catalytic passenger cars is constantly increasing (Figure 2.13), while the number of medium and large size passenger cars almost doubled from 1990 to 2007. In 2007, of the vehicles that were operated for the first time, 88% were new and the rest 12% were used. For the same year, passenger cars represented 64.6% of total motor vehicles in operation, motorcycles 17.6%, trucks 17.0%, taxies 0.5% and buses 0.4%.
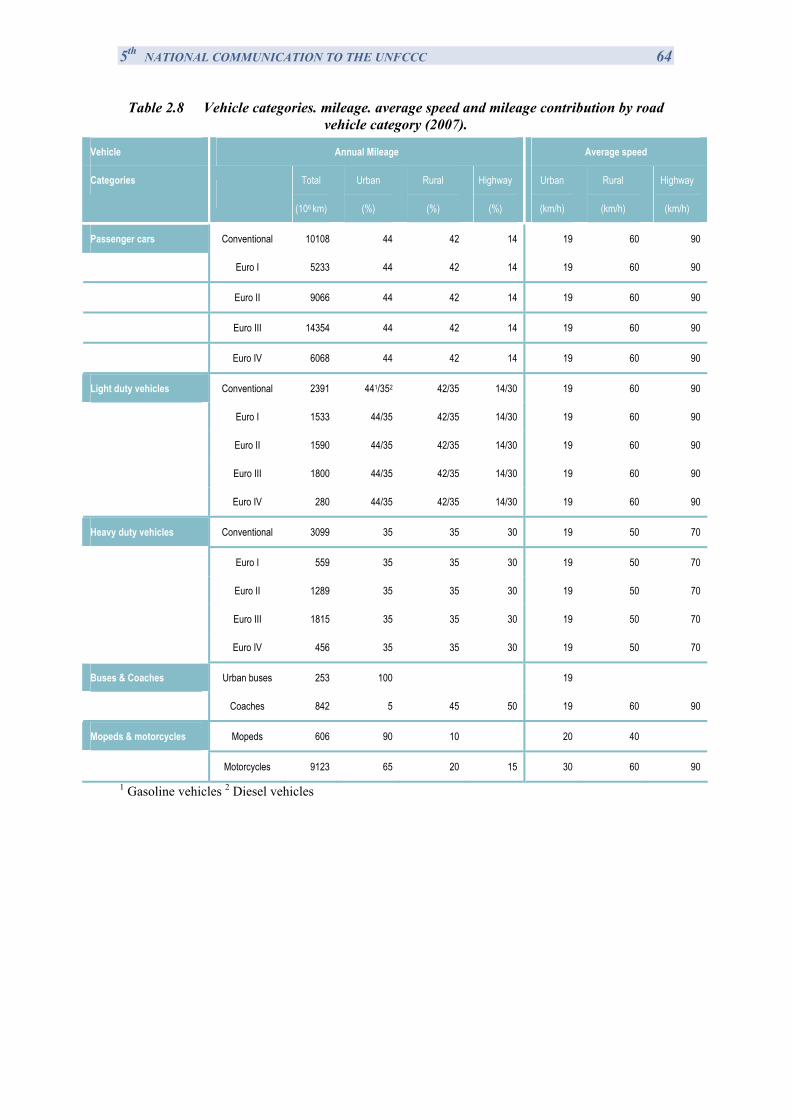
5th NATIONAL COMMUNICATION TO THE UNFCCC 64
Table 2.8 Vehicle categories. mileage. average speed and mileage contribution by road vehicle category (2007).
Vehicle Annual Mileage Average speed
Categories
Total
(106 km)
Urban
(%)
Rural
(%)
Highway
(%)
Urban
(km/h)
Rural
(km/h)
Highway
(km/h)
Passenger cars Conventional 10108 44 42 14 19 60 90
Euro I 5233 44 42 14 19 60 90
Euro II 9066 44 42 14 19 60 90
Euro III 14354 44 42 14 19 60 90
Euro IV 6068 44 42 14 19 60 90
Light duty vehicles Conventional 2391 441/352 42/35 14/30 19 60 90
Euro I 1533 44/35 42/35 14/30 19 60 90
Euro II 1590 44/35 42/35 14/30 19 60 90
Euro III 1800 44/35 42/35 14/30 19 60 90
Euro IV 280 44/35 42/35 14/30 19 60 90
Heavy duty vehicles Conventional 3099 35 35 30 19 50 70
Euro I 559 35 35 30 19 50 70
Euro II 1289 35 35 30 19 50 70
Euro III 1815 35 35 30 19 50 70
Euro IV 456 35 35 30 19 50 70
Buses & Coaches Urban buses 253 100 19
Coaches 842 5 45 50 19 60 90
Mopeds & motorcycles Mopeds 606 90 10 20 40
Motorcycles 9123 65 20 15 30 60 90
1 Gasoline vehicles 2 Diesel vehicles
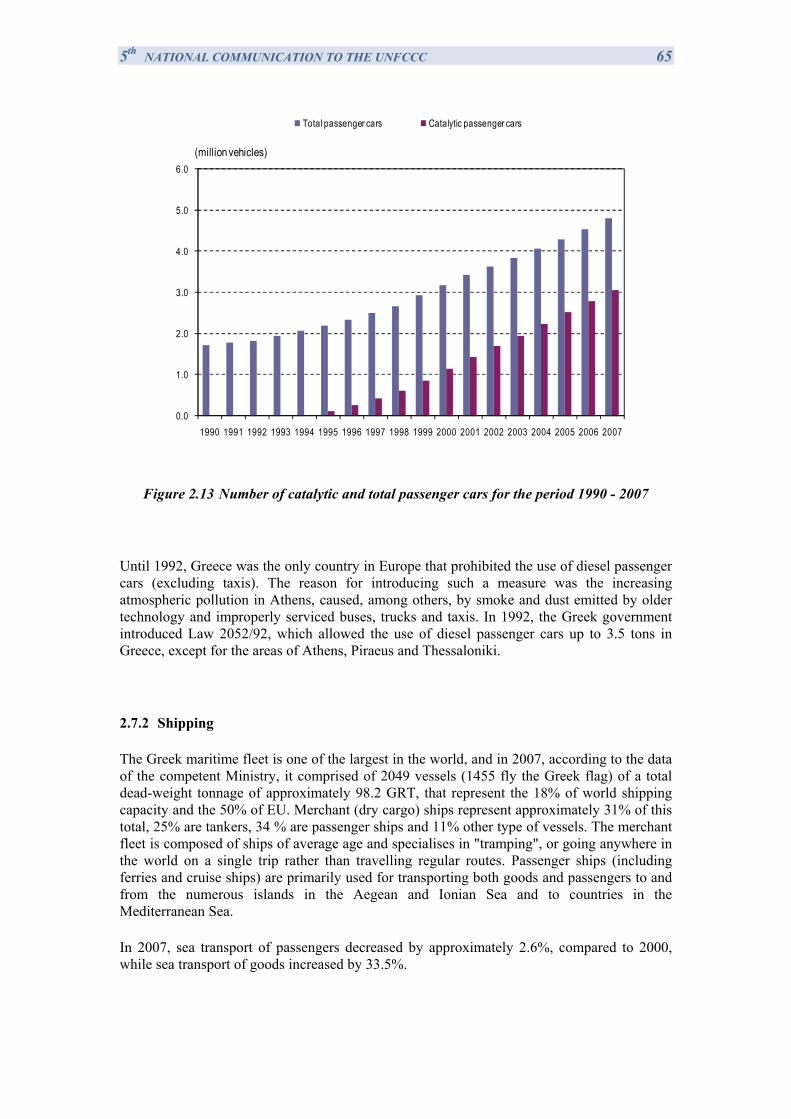
5th NATIONAL COMMUNICATION TO THE UNFCCC 65
0.0
1.0
2.0
3.0
4.0
5.0
6.0
1990 1991 1992 1993 1994 1995 1996 1997 1998 1999 2000 2001 2002 2003 2004 2005 2006 2007
(million vehicles)
Total passenger cars Catalytic passenger cars
Figure 2.13 Number of catalytic and total passenger cars for the period 1990 - 2007
Until 1992, Greece was the only country in Europe that prohibited the use of diesel passenger cars (excluding taxis). The reason for introducing such a measure was the increasing atmospheric pollution in Athens, caused, among others, by smoke and dust emitted by older technology and improperly serviced buses, trucks and taxis. In 1992, the Greek government introduced Law 2052/92, which allowed the use of diesel passenger cars up to 3.5 tons in Greece, except for the areas of Athens, Piraeus and Thessaloniki.
2.7.2 Shipping
The Greek maritime fleet is one of the largest in the world, and in 2007, according to the data of the competent Ministry, it comprised of 2049 vessels (1455 fly the Greek flag) of a total dead-weight tonnage of approximately 98.2 GRT, that represent the 18% of world shipping capacity and the 50% of EU. Merchant (dry cargo) ships represent approximately 31% of this total, 25% are tankers, 34 % are passenger ships and 11% other type of vessels. The merchant fleet is composed of ships of average age and specialises in "tramping", or going anywhere in the world on a single trip rather than travelling regular routes. Passenger ships (including ferries and cruise ships) are primarily used for transporting both goods and passengers to and from the numerous islands in the Aegean and Ionian Sea and to countries in the Mediterranean Sea.
In 2007, sea transport of passengers decreased by approximately 2.6%, compared to 2000, while sea transport of goods increased by 33.5%.
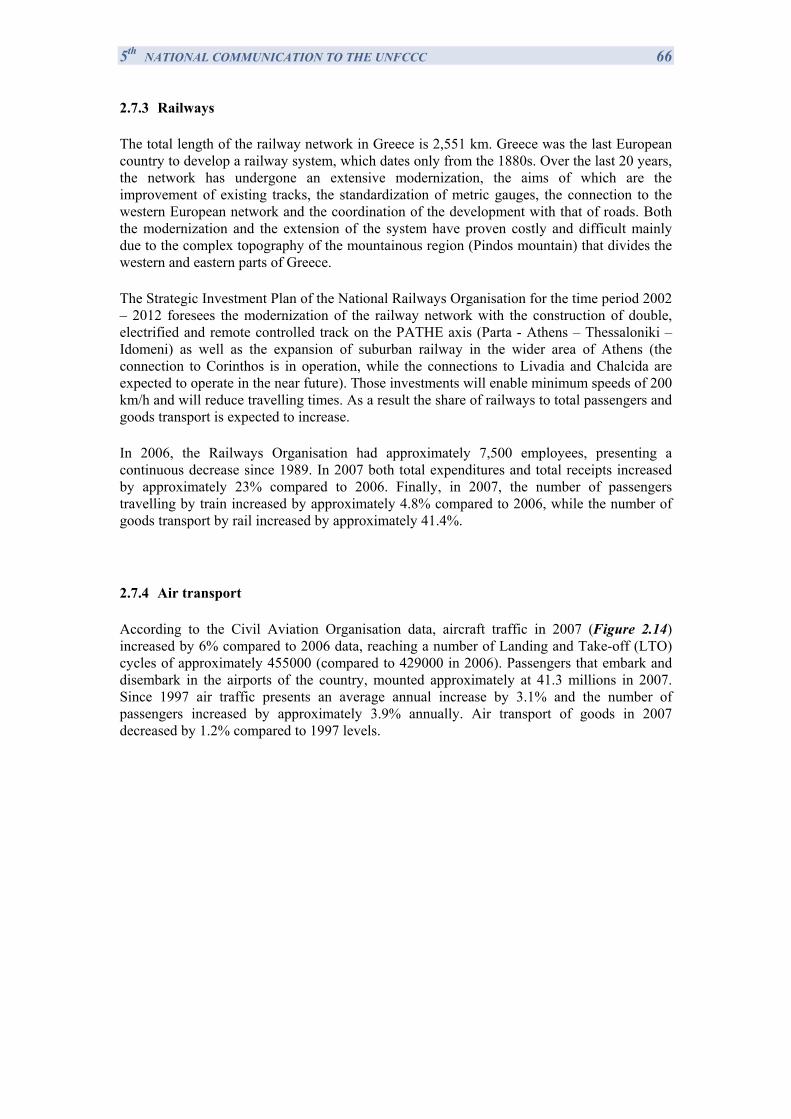
5th NATIONAL COMMUNICATION TO THE UNFCCC 66 2.7.3 Railways
The total length of the railway network in Greece is 2,551 km. Greece was the last European country to develop a railway system, which dates only from the 1880s. Over the last 20 years, the network has undergone an extensive modernization, the aims of which are the improvement of existing tracks, the standardization of metric gauges, the connection to the western European network and the coordination of the development with that of roads. Both the modernization and the extension of the system have proven costly and difficult mainly due to the complex topography of the mountainous region (Pindos mountain) that divides the western and eastern parts of Greece.
The Strategic Investment Plan of the National Railways Organisation for the time period 2002 – 2012 foresees the modernization of the railway network with the construction of double, electrified and remote controlled track on the PATHE axis (Parta - Athens – Thessaloniki – Idomeni) as well as the expansion of suburban railway in the wider area of Athens (the connection to Corinthos is in operation, while the connections to Livadia and Chalcida are expected to operate in the near future). Those investments will enable minimum speeds of 200 km/h and will reduce travelling times. As a result the share of railways to total passengers and goods transport is expected to increase.
In 2006, the Railways Organisation had approximately 7,500 employees, presenting a continuous decrease since 1989. In 2007 both total expenditures and total receipts increased by approximately 23% compared to 2006. Finally, in 2007, the number of passengers travelling by train increased by approximately 4.8% compared to 2006, while the number of goods transport by rail increased by approximately 41.4%.
2.7.4 Air transport
According to the Civil Aviation Organisation data, aircraft traffic in 2007 (Figure 2.14) increased by 6% compared to 2006 data, reaching a number of Landing and Take-off (LTO) cycles of approximately 455000 (compared to 429000 in 2006). Passengers that embark and disembark in the airports of the country, mounted approximately at 41.3 millions in 2007. Since 1997 air traffic presents an average annual increase by 3.1% and the number of passengers increased by approximately 3.9% annually. Air transport of goods in 2007 decreased by 1.2% compared to 1997 levels.
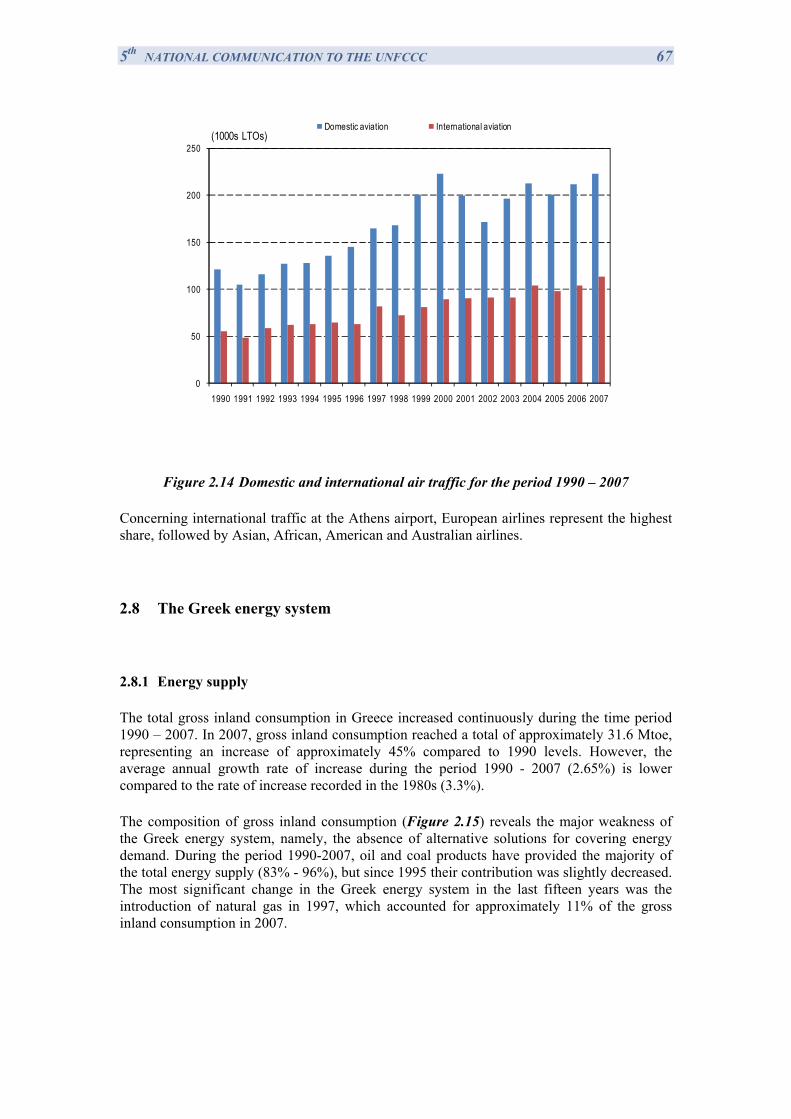
5th NATIONAL COMMUNICATION TO THE UNFCCC 67
0
50
100
150
200
250
1990 1991 1992 1993 1994 1995 1996 1997 1998 1999 2000 2001 2002 2003 2004 2005 2006 2007
(1000s LTOs)Domestic aviation International aviation
Figure 2.14 Domestic and international air traffic for the period 1990 – 2007
Concerning international traffic at the Athens airport, European airlines represent the highest share, followed by Asian, African, American and Australian airlines.
2.8 The Greek energy system
2.8.1 Energy supply
The total gross inland consumption in Greece increased continuously during the time period 1990 – 2007. In 2007, gross inland consumption reached a total of approximately 31.6 Mtoe, representing an increase of approximately 45% compared to 1990 levels. However, the average annual growth rate of increase during the period 1990 - 2007 (2.65%) is lower compared to the rate of increase recorded in the 1980s (3.3%).
The composition of gross inland consumption (Figure 2.15) reveals the major weakness of the Greek energy system, namely, the absence of alternative solutions for covering energy demand. During the period 1990-2007, oil and coal products have provided the majority of the total energy supply (83% - 96%), but since 1995 their contribution was slightly decreased. The most significant change in the Greek energy system in the last fifteen years was the introduction of natural gas in 1997, which accounted for approximately 11% of the gross inland consumption in 2007.
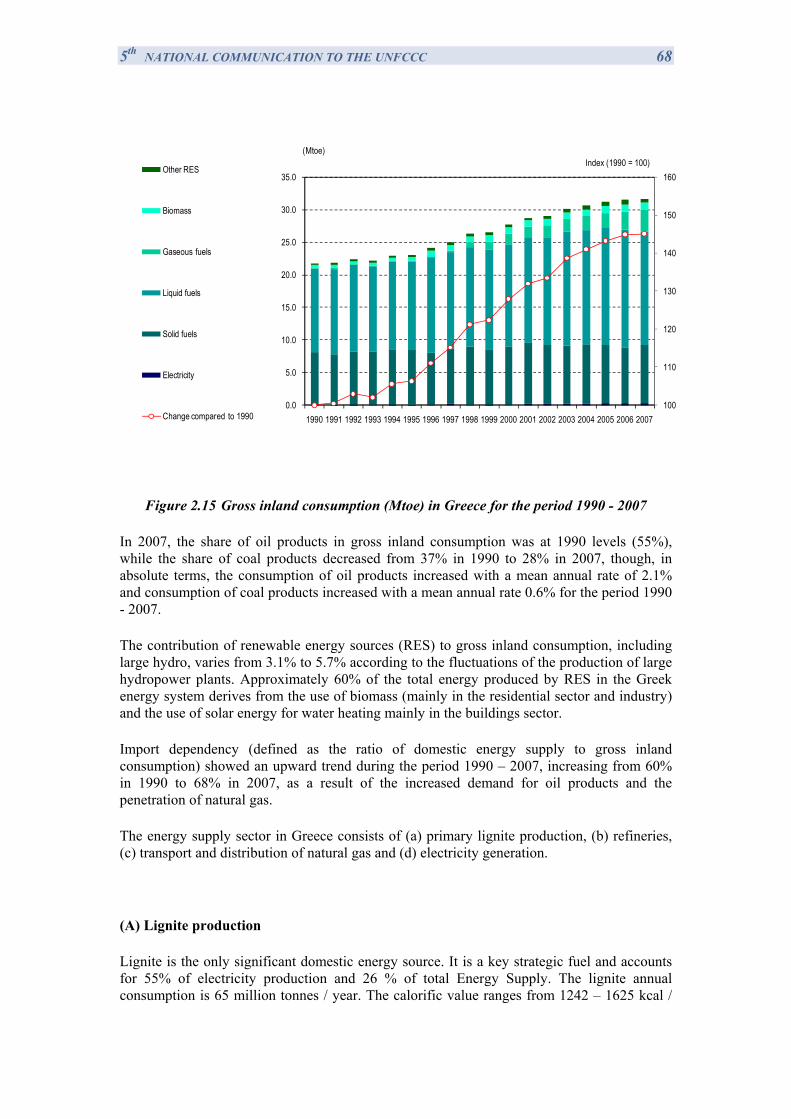
5th NATIONAL COMMUNICATION TO THE UNFCCC 68
100
110
120
130
140
150
160
0.0
5.0
10.0
15.0
20.0
25.0
30.0
35.0
1990 1991 1992 1993 1994 1995 1996 1997 1998 1999 2000 2001 2002 2003 2004 2005 2006 2007
Index (1990 = 100)(Mtoe)
Other RES
Biomass
Gaseous fuels
Liquid fuels
Solid fuels
Electricity
Change compared to 1990
Figure 2.15 Gross inland consumption (Mtoe) in Greece for the period 1990 - 2007
In 2007, the share of oil products in gross inland consumption was at 1990 levels (55%), while the share of coal products decreased from 37% in 1990 to 28% in 2007, though, in absolute terms, the consumption of oil products increased with a mean annual rate of 2.1% and consumption of coal products increased with a mean annual rate 0.6% for the period 1990 - 2007.
The contribution of renewable energy sources (RES) to gross inland consumption, including large hydro, varies from 3.1% to 5.7% according to the fluctuations of the production of large hydropower plants. Approximately 60% of the total energy produced by RES in the Greek energy system derives from the use of biomass (mainly in the residential sector and industry) and the use of solar energy for water heating mainly in the buildings sector.
Import dependency (defined as the ratio of domestic energy supply to gross inland consumption) showed an upward trend during the period 1990 – 2007, increasing from 60% in 1990 to 68% in 2007, as a result of the increased demand for oil products and the penetration of natural gas.
The energy supply sector in Greece consists of (a) primary lignite production, (b) refineries, (c) transport and distribution of natural gas and (d) electricity generation.
(A) Lignite production
Lignite is the only significant domestic energy source. It is a key strategic fuel and accounts for 55% of electricity production and 26 % of total Energy Supply. The lignite annual consumption is 65 million tonnes / year. The calorific value ranges from 1242 – 1625 kcal /
5th NATIONAL COMMUNICATION TO THE UNFCCC 69 kg. There also a better quality of 600 thousand tones / year of higher calorific value 2591 kcal / kg.
Production comes from opencast mines under operation
in Megalopolis (Peloponnese) with 2 power plants of 850 MW installed capacity and
in Ptolemaes and Florina (Northern Greece) with 5 power plants of 4.439 MW installed capacity.
New lignite-fired power plants are under consideration substituting older one.
in Florina of 450 MW installed capacity and
in Ptolemaes, of 650 MW installed capacity,
At the present rate of extraction, 65 million tonnes of lignite are produced annually, by moving a total of 320 Million m3 of earth material. The confirmed lignite deposits amount to 4,3 billion tonnes, out of which 3.2 billion tonnes (~75%) are economically recoverable deposits. These reserves exhibit a remarkable geographical distribution throughout Greece. According to the extended drill holes exploration project, no significant rise of lignite reserves is expected in the future. Considering the current technical and economic situation, the lignite reserves suitable for electric power generation amount to 2,7 billion tonnes approximately. The Lower Calorific Value of lignite reserves ranges between 900 and 2,300 kcal/kg.
Lignite mining ensures security of energy supply, low and stable extraction cost, as well as availability of indigenous energy reserves with time horizon exceeding 40 years, under the current scheduled mine production in relation to power plants requirements.
Till now coal is used in Greece for cement production and non ferrous metal industry. Coal total imports were 605 thousands of metric tonnes for 2007, mainly from Russia.
Final, according to the topic “Coal situation and better use of coal in the Member States” the strategy of Greek policy is mainly oriented to the following actions:
• Construction of new low CO2 emissions and high efficiency power plants.
• Optimum social, economical, as well as environmental exploitation of lignite deposits.
• Optimum land reclamation in lignite mining areas, maximizing the long-term sustainability of the broader mining area.
(B) Refineries
The Greek market of oil and petroleum products comprises four refineries, approximately 50 companies active in the marketing of petroleum products and a large number of retailers and gas stations. The companies which are activated in the marketing of petroleum products in Greece function as follows:
5th NATIONAL COMMUNICATION TO THE UNFCCC 70
They buy ready products from the country's refineries, which they either store in their own facilities or channel directly to the customers through filling stations or by delivery to their customers' production units.
They import ready products from refineries abroad, which they store in their own facilities and then channel to customers.
The annual refining capacity of the four refineries amounts to 20.9 Mt of crude oil, while fluid catalytic cracking units operate in two of the refineries.
Energy consumption in the refineries is based, to the extent possible, on intermediate products (low sulphur heavy fuel oil and refinery gas) while energy management practices are focused on energy conservation.
(C) Transport and distribution of natural gas
The decision for the introduction of natural gas into the Greek energy system was taken in an effort to ensure the modernisation and improvement of the energy balance, as well as the diversification of the country's energy sources. Greece is supplied with natural gas from Russia and Algeria (to a lesser extent in the case of the latter). The natural gas from Russia reaches Greece through a pipeline system, while that from Algeria is transported by special tankers in liquefied form.
The construction of the required infrastructure (apart from the distribution networks) began in 1992 and is continuously improved. The basic infrastructure of the Greek system for the transportation, storage and distribution of natural gas includes:
the main pipeline with a length of 512 km, the natural Gas transmission branches, 689 km in length, extend from the main
pipeline, aiming at supplying the regions of Eastern Macedonia and Thrace, Thessaloniki, Platy, Trikala, Volos, Inofyta, Antikyra and Attica with natural gas. With the completion of the Korinthos project by the autumn of 2007, the transmission branches will extend roughly to 700 km.
the terminal station of the liquefied natural gas, which includes two storage tanks with a total capacity of 130,000 m3. In July 2007, the revamping (expansion project) of the Liquefied Natural Gas (LNG) Terminal at Revythousa was completed, thus carrying out one of most significant investments in Greece’s energy infrastructure. With this revamping, the Terminal has the capacity to accept and handle triple the quantity of LNG than before and supply the National Transmission System with 5.2 -5.3 billion cubic meters annually.
the distribution networks (of medium and low pressure) of natural gas to cover the needs of the above mentioned regions.
Recently, the National Natural Gas Transportation System has been extended from Komotini to the Greek-Turkish borders (Kipi site) and interconnected with the Turkish transmission system.
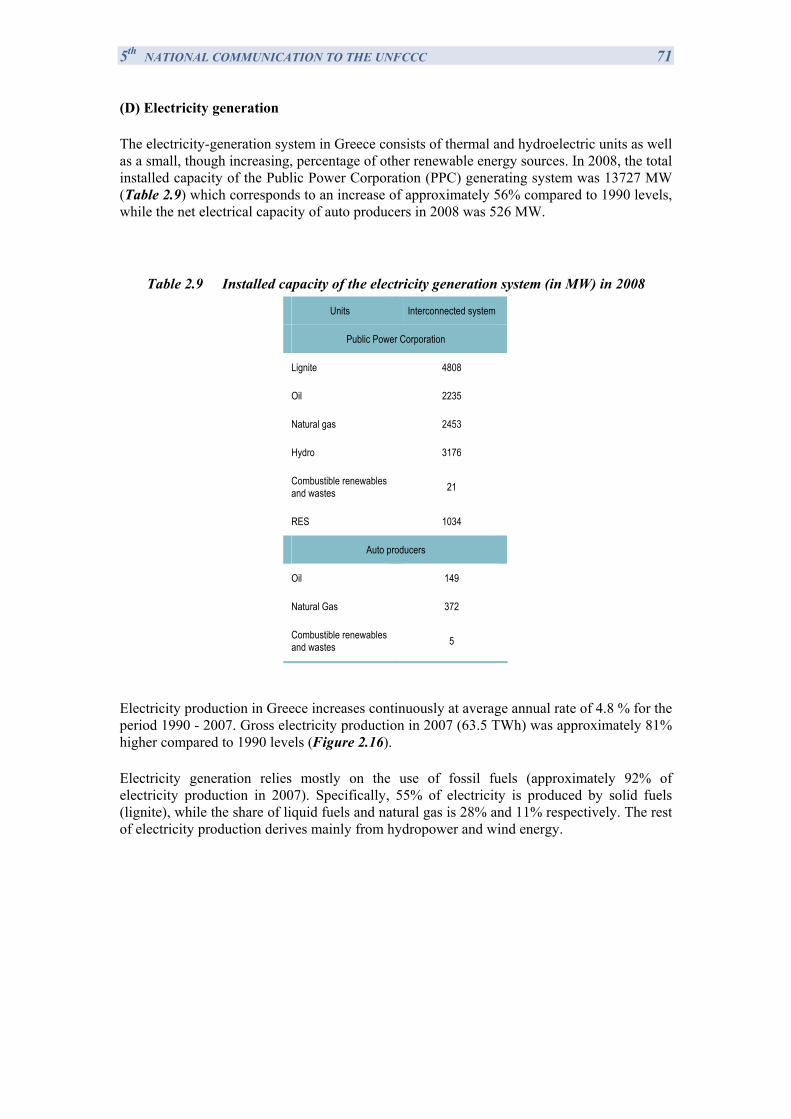
5th NATIONAL COMMUNICATION TO THE UNFCCC 71 (D) Electricity generation
The electricity-generation system in Greece consists of thermal and hydroelectric units as well as a small, though increasing, percentage of other renewable energy sources. In 2008, the total installed capacity of the Public Power Corporation (PPC) generating system was 13727 MW (Table 2.9) which corresponds to an increase of approximately 56% compared to 1990 levels, while the net electrical capacity of auto producers in 2008 was 526 MW.
Table 2.9 Installed capacity of the electricity generation system (in MW) in 2008
Units Interconnected system
Public Power Corporation
Lignite 4808
Oil 2235
Natural gas 2453
Hydro 3176
Combustible renewables and wastes 21
RES 1034
Auto producers
Oil 149
Natural Gas 372
Combustible renewables and wastes 5
Electricity production in Greece increases continuously at average annual rate of 4.8 % for the period 1990 - 2007. Gross electricity production in 2007 (63.5 TWh) was approximately 81% higher compared to 1990 levels (Figure 2.16).
Electricity generation relies mostly on the use of fossil fuels (approximately 92% of electricity production in 2007). Specifically, 55% of electricity is produced by solid fuels (lignite), while the share of liquid fuels and natural gas is 28% and 11% respectively. The rest of electricity production derives mainly from hydropower and wind energy.
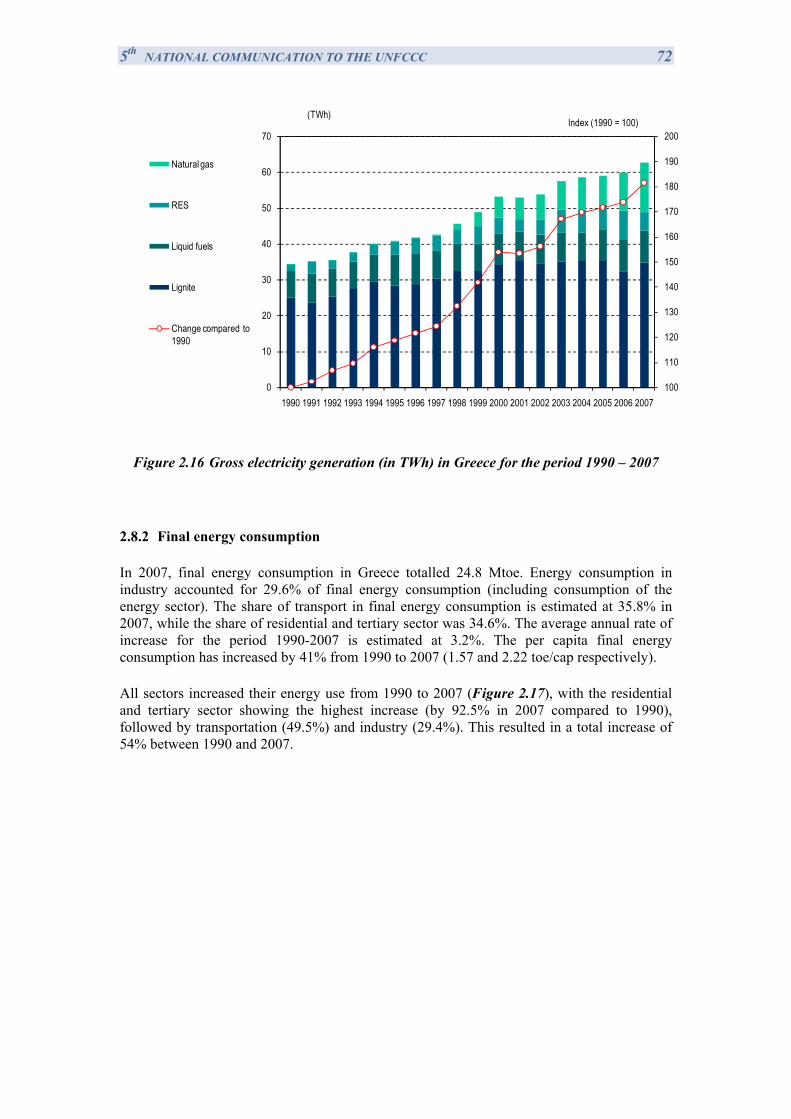
5th NATIONAL COMMUNICATION TO THE UNFCCC 72
100
110
120
130
140
150
160
170
180
190
200
0
10
20
30
40
50
60
70
1990 1991 1992 1993 1994 1995 1996 1997 1998 1999 2000 2001 2002 2003 2004 2005 2006 2007
Index (1990 = 100)(TWh)
Natural gas
RES
Liquid fuels
Lignite
Change compared to 1990
Figure 2.16 Gross electricity generation (in TWh) in Greece for the period 1990 – 2007
2.8.2 Final energy consumption
In 2007, final energy consumption in Greece totalled 24.8 Mtoe. Energy consumption in industry accounted for 29.6% of final energy consumption (including consumption of the energy sector). The share of transport in final energy consumption is estimated at 35.8% in 2007, while the share of residential and tertiary sector was 34.6%. The average annual rate of increase for the period 1990-2007 is estimated at 3.2%. The per capita final energy consumption has increased by 41% from 1990 to 2007 (1.57 and 2.22 toe/cap respectively).
All sectors increased their energy use from 1990 to 2007 (Figure 2.17), with the residential and tertiary sector showing the highest increase (by 92.5% in 2007 compared to 1990), followed by transportation (49.5%) and industry (29.4%). This resulted in a total increase of 54% between 1990 and 2007.
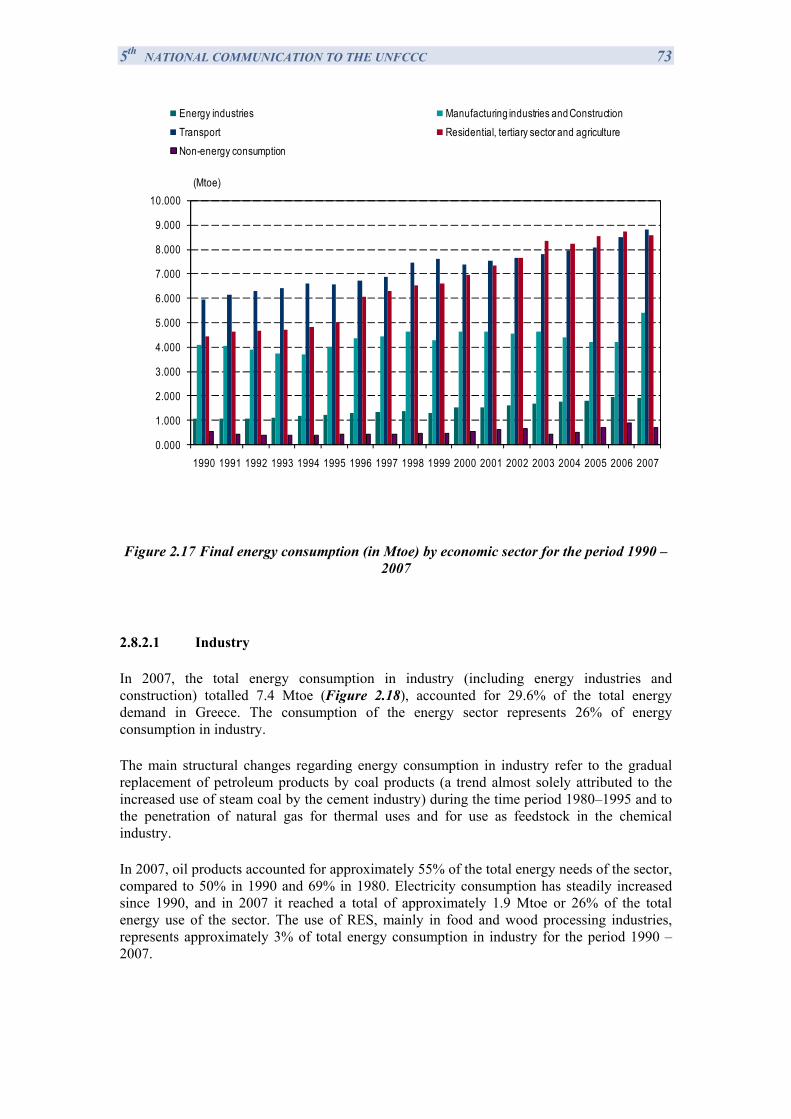
5th NATIONAL COMMUNICATION TO THE UNFCCC 73
0.000
1.000
2.000
3.000
4.000
5.000
6.000
7.000
8.000
9.000
10.000
1990 1991 1992 1993 1994 1995 1996 1997 1998 1999 2000 2001 2002 2003 2004 2005 2006 2007
(Mtoe)
Energy industries Manufacturing industries and ConstructionTransport Residential, tertiary sector and agricultureNon-energy consumption
Figure 2.17 Final energy consumption (in Mtoe) by economic sector for the period 1990 – 2007
2.8.2.1 Industry
In 2007, the total energy consumption in industry (including energy industries and construction) totalled 7.4 Mtoe (Figure 2.18), accounted for 29.6% of the total energy demand in Greece. The consumption of the energy sector represents 26% of energy consumption in industry.
The main structural changes regarding energy consumption in industry refer to the gradual replacement of petroleum products by coal products (a trend almost solely attributed to the increased use of steam coal by the cement industry) during the time period 1980–1995 and to the penetration of natural gas for thermal uses and for use as feedstock in the chemical industry.
In 2007, oil products accounted for approximately 55% of the total energy needs of the sector, compared to 50% in 1990 and 69% in 1980. Electricity consumption has steadily increased since 1990, and in 2007 it reached a total of approximately 1.9 Mtoe or 26% of the total energy use of the sector. The use of RES, mainly in food and wood processing industries, represents approximately 3% of total energy consumption in industry for the period 1990 – 2007.
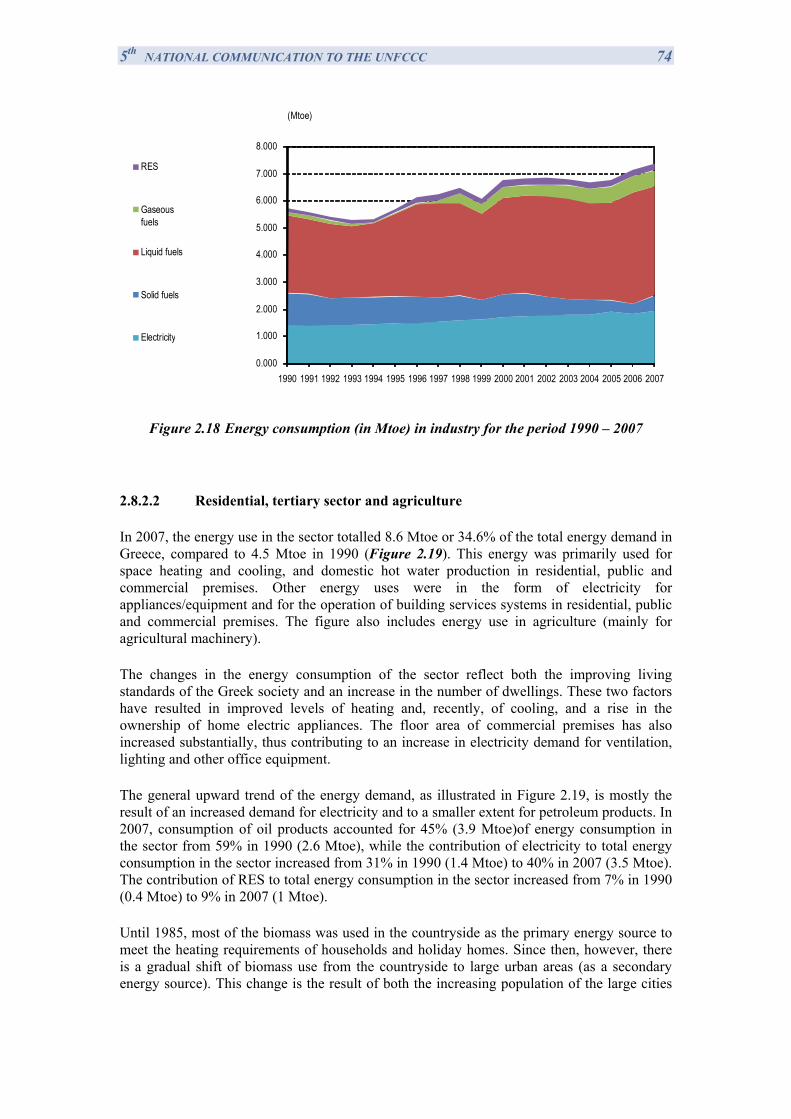
5th NATIONAL COMMUNICATION TO THE UNFCCC 74
0.000
1.000
2.000
3.000
4.000
5.000
6.000
7.000
8.000
1990 1991 1992 1993 1994 1995 1996 1997 1998 1999 2000 2001 2002 2003 2004 2005 2006 2007
(Mtoe)
RES
Gaseous fuels
Liquid fuels
Solid fuels
Electricity
Figure 2.18 Energy consumption (in Mtoe) in industry for the period 1990 – 2007
2.8.2.2 Residential, tertiary sector and agriculture
In 2007, the energy use in the sector totalled 8.6 Mtoe or 34.6% of the total energy demand in Greece, compared to 4.5 Mtoe in 1990 (Figure 2.19). This energy was primarily used for space heating and cooling, and domestic hot water production in residential, public and commercial premises. Other energy uses were in the form of electricity for appliances/equipment and for the operation of building services systems in residential, public and commercial premises. The figure also includes energy use in agriculture (mainly for agricultural machinery).
The changes in the energy consumption of the sector reflect both the improving living standards of the Greek society and an increase in the number of dwellings. These two factors have resulted in improved levels of heating and, recently, of cooling, and a rise in the ownership of home electric appliances. The floor area of commercial premises has also increased substantially, thus contributing to an increase in electricity demand for ventilation, lighting and other office equipment.
The general upward trend of the energy demand, as illustrated in Figure 2.19, is mostly the result of an increased demand for electricity and to a smaller extent for petroleum products. In 2007, consumption of oil products accounted for 45% (3.9 Mtoe)of energy consumption in the sector from 59% in 1990 (2.6 Mtoe), while the contribution of electricity to total energy consumption in the sector increased from 31% in 1990 (1.4 Mtoe) to 40% in 2007 (3.5 Mtoe). The contribution of RES to total energy consumption in the sector increased from 7% in 1990 (0.4 Mtoe) to 9% in 2007 (1 Mtoe).
Until 1985, most of the biomass was used in the countryside as the primary energy source to meet the heating requirements of households and holiday homes. Since then, however, there is a gradual shift of biomass use from the countryside to large urban areas (as a secondary energy source). This change is the result of both the increasing population of the large cities
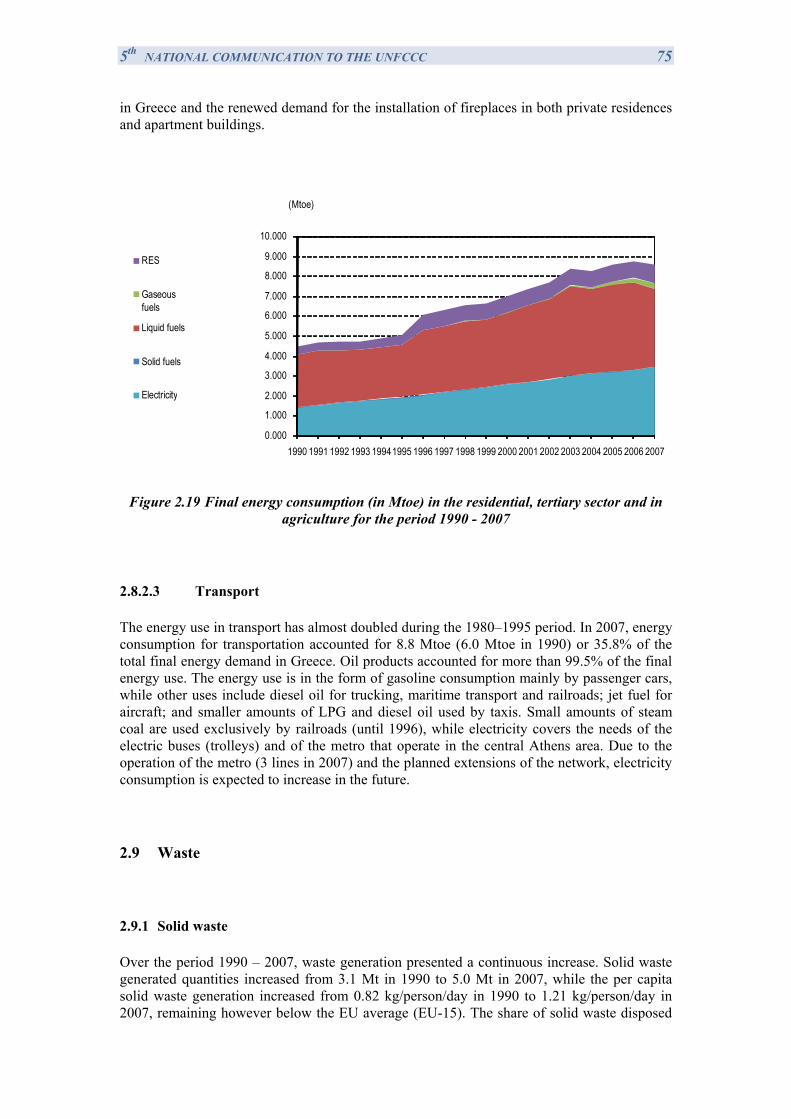
5th NATIONAL COMMUNICATION TO THE UNFCCC 75 in Greece and the renewed demand for the installation of fireplaces in both private residences and apartment buildings.
0.000
1.000
2.000
3.000
4.000
5.000
6.000
7.000
8.000
9.000
10.000
1990 1991 1992 1993 19941995 1996 1997 1998 1999 2000 2001 2002 2003 2004 2005 2006 2007
(Mtoe)
RES
Gaseous fuels
Liquid fuels
Solid fuels
Electricity
Figure 2.19 Final energy consumption (in Mtoe) in the residential, tertiary sector and in agriculture for the period 1990 - 2007
2.8.2.3 Transport
The energy use in transport has almost doubled during the 1980–1995 period. In 2007, energy consumption for transportation accounted for 8.8 Mtoe (6.0 Mtoe in 1990) or 35.8% of the total final energy demand in Greece. Oil products accounted for more than 99.5% of the final energy use. The energy use is in the form of gasoline consumption mainly by passenger cars, while other uses include diesel oil for trucking, maritime transport and railroads; jet fuel for aircraft; and smaller amounts of LPG and diesel oil used by taxis. Small amounts of steam coal are used exclusively by railroads (until 1996), while electricity covers the needs of the electric buses (trolleys) and of the metro that operate in the central Athens area. Due to the operation of the metro (3 lines in 2007) and the planned extensions of the network, electricity consumption is expected to increase in the future.
2.9 Waste
2.9.1 Solid waste
Over the period 1990 – 2007, waste generation presented a continuous increase. Solid waste generated quantities increased from 3.1 Mt in 1990 to 5.0 Mt in 2007, while the per capita solid waste generation increased from 0.82 kg/person/day in 1990 to 1.21 kg/person/day in 2007, remaining however below the EU average (EU-15). The share of solid waste disposed
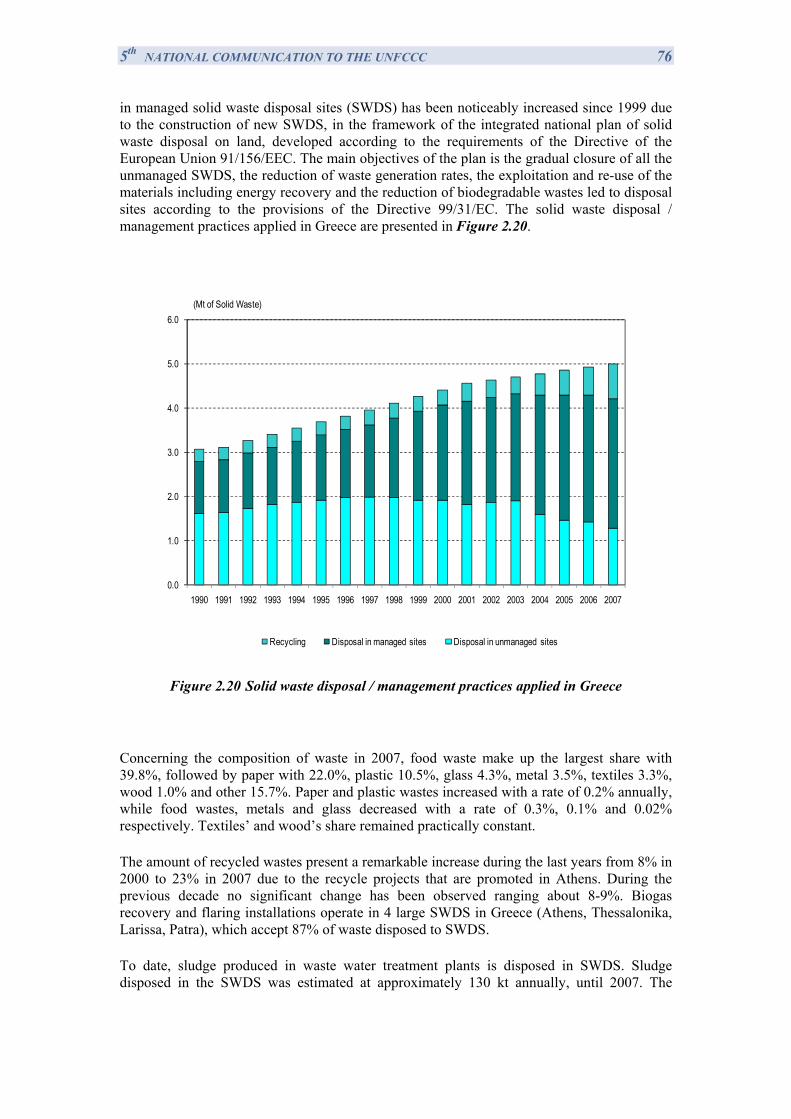
5th NATIONAL COMMUNICATION TO THE UNFCCC 76 in managed solid waste disposal sites (SWDS) has been noticeably increased since 1999 due to the construction of new SWDS, in the framework of the integrated national plan of solid waste disposal on land, developed according to the requirements of the Directive of the European Union 91/156/EEC. The main objectives of the plan is the gradual closure of all the unmanaged SWDS, the reduction of waste generation rates, the exploitation and re-use of the materials including energy recovery and the reduction of biodegradable wastes led to disposal sites according to the provisions of the Directive 99/31/EC. The solid waste disposal / management practices applied in Greece are presented in Figure 2.20.
0.0
1.0
2.0
3.0
4.0
5.0
6.0
1990 1991 1992 1993 1994 1995 1996 1997 1998 1999 2000 2001 2002 2003 2004 2005 2006 2007
(Mt of Solid Waste)
Recycling Disposal in managed sites Disposal in unmanaged sites
Figure 2.20 Solid waste disposal / management practices applied in Greece
Concerning the composition of waste in 2007, food waste make up the largest share with 39.8%, followed by paper with 22.0%, plastic 10.5%, glass 4.3%, metal 3.5%, textiles 3.3%, wood 1.0% and other 15.7%. Paper and plastic wastes increased with a rate of 0.2% annually, while food wastes, metals and glass decreased with a rate of 0.3%, 0.1% and 0.02% respectively. Textiles’ and wood’s share remained practically constant.
The amount of recycled wastes present a remarkable increase during the last years from 8% in 2000 to 23% in 2007 due to the recycle projects that are promoted in Athens. During the previous decade no significant change has been observed ranging about 8-9%. Biogas recovery and flaring installations operate in 4 large SWDS in Greece (Athens, Thessalonika, Larissa, Patra), which accept 87% of waste disposed to SWDS.
To date, sludge produced in waste water treatment plants is disposed in SWDS. Sludge disposed in the SWDS was estimated at approximately 130 kt annually, until 2007. The
5th NATIONAL COMMUNICATION TO THE UNFCCC 77 construction of a sludge dehydration unit is planned to facilitate the on-site combustion of sludge.
The hospitals in the Attica region have the possibility to dispose clinical wastes in the central incineration unit in Ano Liosia, which can process a total of 30 tons of waste per day. In 2007 this unit accepted approximately 3.67 kt of clinical waste, i.e. it is still operating well below its nominal capacity due to high operational costs. Up to 2001 a small incinerator with a capacity of approximately 600 kg per day was in operation in Ano Liosia.
2.9.2 Wastewater
The number of wastewater treatment plants (WWTP) has been increased considerably since 1999. The percentage of population of agglomerations with p.e.> 2.000 that is served by a WWTP increased from 32% in 1999 to 90% in 2007, in compliance with the Directive 91/271/EEC concerning the collection, treatment and discharge of the urban wastewater. By completion of all ongoing works within the 3rd Programming Period, the % percentage will rise up to 91%. The remaining 9% of the population is going to be served by a WWTP during the 4th Programming period. In the Psyttalia wastewater treatment plant that serves approximately 4 millions of Attica population, the sludge produced is treated under anaerobic conditions resulting in the production of biogas. The biogas produced covers the energy needs of the wastewater treatment facilities, while the surplus is flared.
5th NATIONAL COMMUNICATION TO THE UNFCCC 78 CHAPTER 3. GREENHOUSE GAS INVENTORY INFORMATION
3.1 Summary tables
This chapter summarizes greenhouse gas (GHG) emissions of Greece for the time period 1990–2007 as reported in the National Inventory Report submitted to the UNFCCC in 2009 (MEECC, NTUA, 2009).
Emissions estimates were calculated according to the Revised 1996 IPCC Guidelines for National Greenhouse Gas Inventories (henceforth IPCC Guidelines), the IPCC Good Practice Guidance and Uncertainty Management in National Greenhouse Gas Inventories (henceforth IPCC Good Practice Guidance) and the IPCC Good Practice Guidance for Land Use, Land Use Change and Forestry (henceforth LULUCF Good Practice Guidance). It is noted that base year emissions are calculated using 1990 as the base year for carbon dioxide (CO2), methane (CH4) and nitrous oxide (N2O), and 1995 for fluorinated gases (F-gases: Hydrofluorocarbons, HFC / Perfluorocarbons, PFC / Sulphur hexafluoride, SF6).
An overview of GHG emissions for the time period 1990–2007 is presented in Table 3.1a and Table 3.1b. The detailed CRF trend tables are presented in Annex I. Following the IPCC Guidelines, emissions from international air transport and marine bunkers are not included in the national totals and are presented separately in Table 3.2 and Table 3.2b. Finally, emissions of the ozone precursors gases (NOx, CO and NMVOC) along with SO2 are presented in Table 3.3a and Table 3.3b.
Total uncertainty for the 2007 emissions is estimated at 18.5% (including Land Use, Land Use Change and Forestry - LULUCF), while the uncertainty carried over into the GHG emissions trend is approximately 13.2% (MEECC, NTUA 2009). The uncertainty estimates for GHG emissions per gas (including LULUCF), in 2007, were estimated at:
4.5% for CO2 emissions,
54.9% for CH4 emissions,
80.8% for N2O emissions
183.9% for F-gases
Base year GHG emissions for Greece (1990 for CO2, CH4, and Ν2Ο - 1995 for F-gases) were estimated at 107707.2 kt CO2 eq. Given that LULUCF was a net sink of GHG emissions in 1990 (as for the rest of the reporting period) the relevant emissions / removals are not considered in estimating base year emissions for Greece.
In 2007, GHG emissions (without LULUCF) amounted to 131853.8 kt CO2 eq showing an increase of 22.4% compared to base year emissions and of 24.9% compared to 1990 levels. If emissions / removals from LULUCF were included then the increase would be 25.2% (from 102368.9 kt CO2 eq in 1990 to 128203.1 kt CO2 eq in 2007).
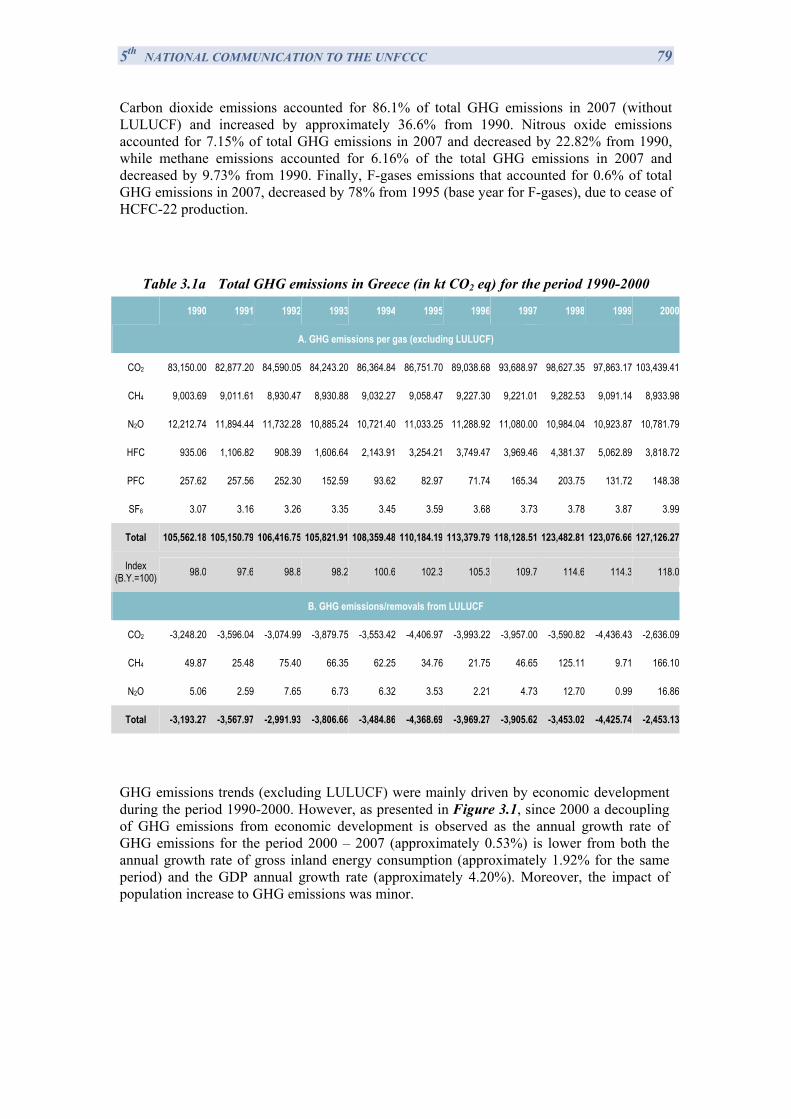
5th NATIONAL COMMUNICATION TO THE UNFCCC 79 Carbon dioxide emissions accounted for 86.1% of total GHG emissions in 2007 (without LULUCF) and increased by approximately 36.6% from 1990. Nitrous oxide emissions accounted for 7.15% of total GHG emissions in 2007 and decreased by 22.82% from 1990, while methane emissions accounted for 6.16% of the total GHG emissions in 2007 and decreased by 9.73% from 1990. Finally, F-gases emissions that accounted for 0.6% of total GHG emissions in 2007, decreased by 78% from 1995 (base year for F-gases), due to cease of HCFC-22 production.
Table 3.1a Total GHG emissions in Greece (in kt CO2 eq) for the period 1990-2000
1990 1991 1992 1993 1994 1995 1996 1997 1998 1999 2000
A. GHG emissions per gas (excluding LULUCF)
CO2 83,150.00 82,877.20 84,590.05 84,243.20 86,364.84 86,751.70 89,038.68 93,688.97 98,627.35 97,863.17 103,439.41
CH4 9,003.69 9,011.61 8,930.47 8,930.88 9,032.27 9,058.47 9,227.30 9,221.01 9,282.53 9,091.14 8,933.98
N2O 12,212.74 11,894.44 11,732.28 10,885.24 10,721.40 11,033.25 11,288.92 11,080.00 10,984.04 10,923.87 10,781.79
HFC 935.06 1,106.82 908.39 1,606.64 2,143.91 3,254.21 3,749.47 3,969.46 4,381.37 5,062.89 3,818.72
PFC 257.62 257.56 252.30 152.59 93.62 82.97 71.74 165.34 203.75 131.72 148.38
SF6 3.07 3.16 3.26 3.35 3.45 3.59 3.68 3.73 3.78 3.87 3.99
Total 105,562.18 105,150.79 106,416.75 105,821.91 108,359.48 110,184.19 113,379.79 118,128.51 123,482.81 123,076.66 127,126.27
Index (B.Y.=100) 98.0 97.6 98.8 98.2 100.6 102.3 105.3 109.7 114.6 114.3 118.0
B. GHG emissions/removals from LULUCF
CO2 -3,248.20 -3,596.04 -3,074.99 -3,879.75 -3,553.42 -4,406.97 -3,993.22 -3,957.00 -3,590.82 -4,436.43 -2,636.09
CH4 49.87 25.48 75.40 66.35 62.25 34.76 21.75 46.65 125.11 9.71 166.10
N2O 5.06 2.59 7.65 6.73 6.32 3.53 2.21 4.73 12.70 0.99 16.86
Total -3,193.27 -3,567.97 -2,991.93 -3,806.66 -3,484.86 -4,368.69 -3,969.27 -3,905.62 -3,453.02 -4,425.74 -2,453.13
GHG emissions trends (excluding LULUCF) were mainly driven by economic development during the period 1990-2000. However, as presented in Figure 3.1, since 2000 a decoupling of GHG emissions from economic development is observed as the annual growth rate of GHG emissions for the period 2000 – 2007 (approximately 0.53%) is lower from both the annual growth rate of gross inland energy consumption (approximately 1.92% for the same period) and the GDP annual growth rate (approximately 4.20%). Moreover, the impact of population increase to GHG emissions was minor.
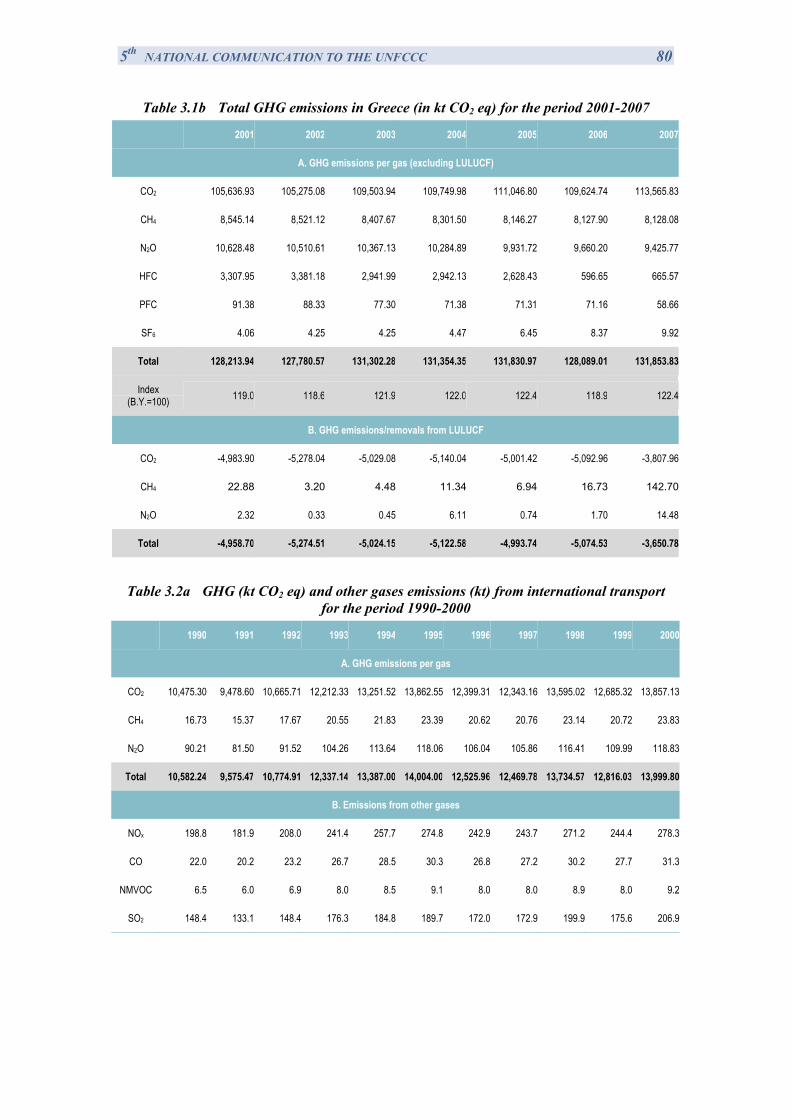
5th NATIONAL COMMUNICATION TO THE UNFCCC 80
Table 3.1b Total GHG emissions in Greece (in kt CO2 eq) for the period 2001-2007
2001 2002 2003 2004 2005 2006 2007
A. GHG emissions per gas (excluding LULUCF)
CO2 105,636.93 105,275.08 109,503.94 109,749.98 111,046.80 109,624.74 113,565.83
CH4 8,545.14 8,521.12 8,407.67 8,301.50 8,146.27 8,127.90 8,128.08
N2O 10,628.48 10,510.61 10,367.13 10,284.89 9,931.72 9,660.20 9,425.77
HFC 3,307.95 3,381.18 2,941.99 2,942.13 2,628.43 596.65 665.57
PFC 91.38 88.33 77.30 71.38 71.31 71.16 58.66
SF6 4.06 4.25 4.25 4.47 6.45 8.37 9.92
Total 128,213.94 127,780.57 131,302.28 131,354.35 131,830.97 128,089.01 131,853.83
Index (B.Y.=100) 119.0 118.6 121.9 122.0 122.4 118.9 122.4
B. GHG emissions/removals from LULUCF
CO2 -4,983.90 -5,278.04 -5,029.08 -5,140.04 -5,001.42 -5,092.96 -3,807.96
CH4 22.88 3.20 4.48 11.34 6.94 16.73 142.70
N2O 2.32 0.33 0.45 6.11 0.74 1.70 14.48
Total -4,958.70 -5,274.51 -5,024.15 -5,122.58 -4,993.74 -5,074.53 -3,650.78
Table 3.2a GHG (kt CO2 eq) and other gases emissions (kt) from international transport for the period 1990-2000
1990 1991 1992 1993 1994 1995 1996 1997 1998 1999 2000
A. GHG emissions per gas
CO2 10,475.30 9,478.60 10,665.71 12,212.33 13,251.52 13,862.55 12,399.31 12,343.16 13,595.02 12,685.32 13,857.13
CH4 16.73 15.37 17.67 20.55 21.83 23.39 20.62 20.76 23.14 20.72 23.83
N2O 90.21 81.50 91.52 104.26 113.64 118.06 106.04 105.86 116.41 109.99 118.83
Total 10,582.24 9,575.47 10,774.91 12,337.14 13,387.00 14,004.00 12,525.96 12,469.78 13,734.57 12,816.03 13,999.80
Β. Emissions from other gases
NOx 198.8 181.9 208.0 241.4 257.7 274.8 242.9 243.7 271.2 244.4 278.3
CO 22.0 20.2 23.2 26.7 28.5 30.3 26.8 27.2 30.2 27.7 31.3
NMVOC 6.5 6.0 6.9 8.0 8.5 9.1 8.0 8.0 8.9 8.0 9.2
SO2 148.4 133.1 148.4 176.3 184.8 189.7 172.0 172.9 199.9 175.6 206.9
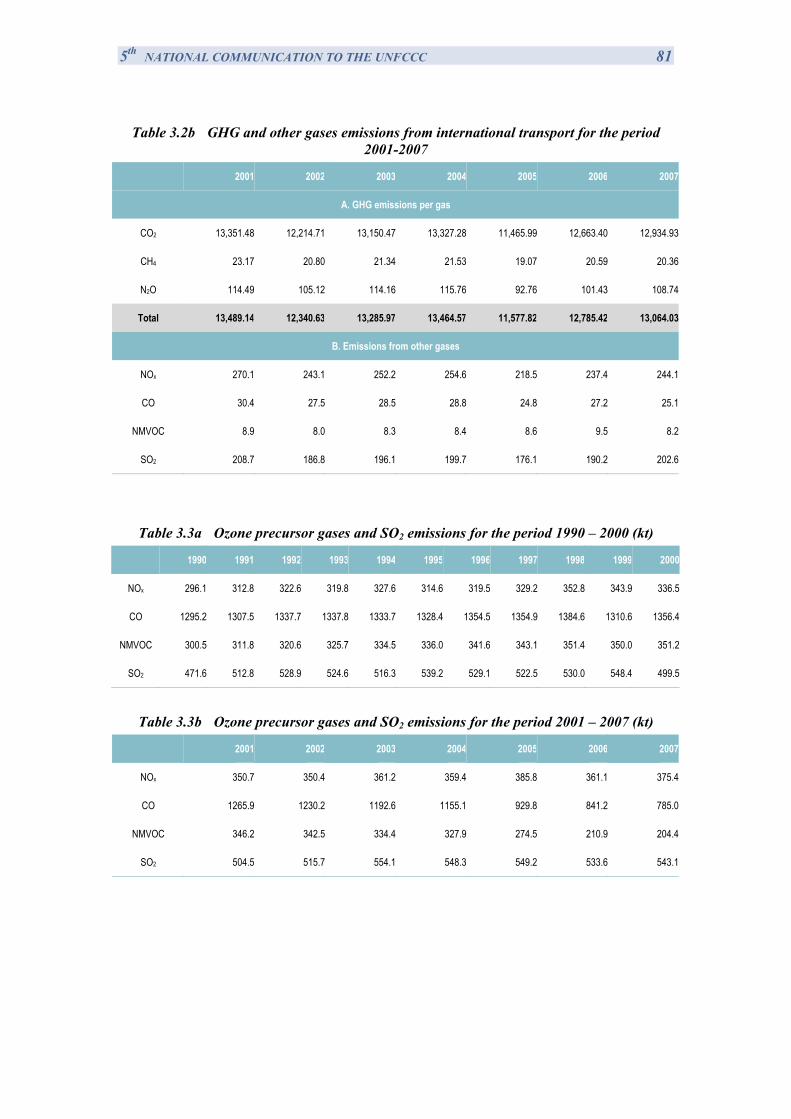
5th NATIONAL COMMUNICATION TO THE UNFCCC 81
Table 3.2b GHG and other gases emissions from international transport for the period 2001-2007
2001 2002 2003 2004 2005 2006 2007
A. GHG emissions per gas
CO2 13,351.48 12,214.71 13,150.47 13,327.28 11,465.99 12,663.40 12,934.93
CH4 23.17 20.80 21.34 21.53 19.07 20.59 20.36
N2O 114.49 105.12 114.16 115.76 92.76 101.43 108.74
Total 13,489.14 12,340.63 13,285.97 13,464.57 11,577.82 12,785.42 13,064.03
Β. Emissions from other gases
NOx 270.1 243.1 252.2 254.6 218.5 237.4 244.1
CO 30.4 27.5 28.5 28.8 24.8 27.2 25.1
NMVOC 8.9 8.0 8.3 8.4 8.6 9.5 8.2
SO2 208.7 186.8 196.1 199.7 176.1 190.2 202.6
Table 3.3a Ozone precursor gases and SO2 emissions for the period 1990 – 2000 (kt)
1990 1991 1992 1993 1994 1995 1996 1997 1998 1999 2000
NOx 296.1 312.8 322.6 319.8 327.6 314.6 319.5 329.2 352.8 343.9 336.5
CO 1295.2 1307.5 1337.7 1337.8 1333.7 1328.4 1354.5 1354.9 1384.6 1310.6 1356.4
NMVOC 300.5 311.8 320.6 325.7 334.5 336.0 341.6 343.1 351.4 350.0 351.2
SO2 471.6 512.8 528.9 524.6 516.3 539.2 529.1 522.5 530.0 548.4 499.5
Table 3.3b Ozone precursor gases and SO2 emissions for the period 2001 – 2007 (kt)
2001 2002 2003 2004 2005 2006 2007
NOx 350.7 350.4 361.2 359.4 385.8 361.1 375.4
CO 1265.9 1230.2 1192.6 1155.1 929.8 841.2 785.0
NMVOC 346.2 342.5 334.4 327.9 274.5 210.9 204.4
SO2 504.5 515.7 554.1 548.3 549.2 533.6 543.1
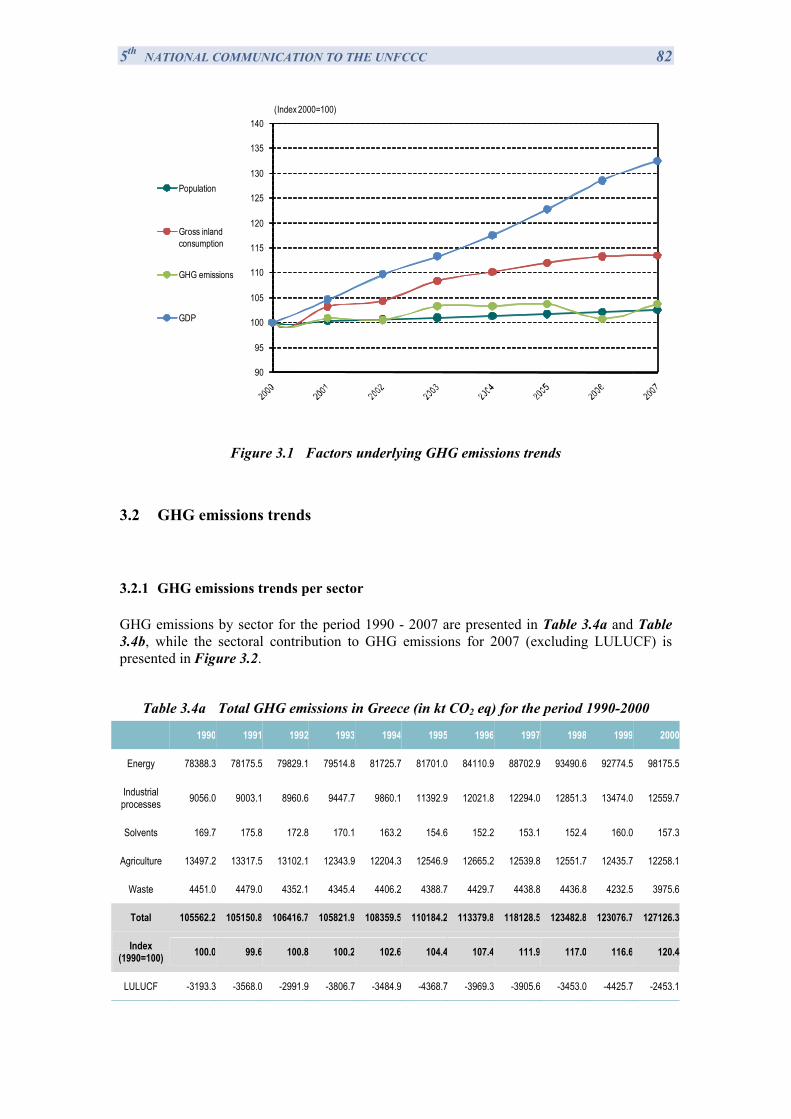
5th NATIONAL COMMUNICATION TO THE UNFCCC 82
90
95
100
105
110
115
120
125
130
135
140(Index 2000=100)
Population
Gross inland consumption
GHG emissions
GDP
Figure 3.1 Factors underlying GHG emissions trends
3.2 GHG emissions trends
3.2.1 GHG emissions trends per sector
GHG emissions by sector for the period 1990 - 2007 are presented in Table 3.4a and Table 3.4b, while the sectoral contribution to GHG emissions for 2007 (excluding LULUCF) is presented in Figure 3.2.
Table 3.4a Total GHG emissions in Greece (in kt CO2 eq) for the period 1990-2000
1990 1991 1992 1993 1994 1995 1996 1997 1998 1999 2000
Energy 78388.3 78175.5 79829.1 79514.8 81725.7 81701.0 84110.9 88702.9 93490.6 92774.5 98175.5
Industrial processes 9056.0 9003.1 8960.6 9447.7 9860.1 11392.9 12021.8 12294.0 12851.3 13474.0 12559.7
Solvents 169.7 175.8 172.8 170.1 163.2 154.6 152.2 153.1 152.4 160.0 157.3
Agriculture 13497.2 13317.5 13102.1 12343.9 12204.3 12546.9 12665.2 12539.8 12551.7 12435.7 12258.1
Waste 4451.0 4479.0 4352.1 4345.4 4406.2 4388.7 4429.7 4438.8 4436.8 4232.5 3975.6
Total 105562.2 105150.8 106416.7 105821.9 108359.5 110184.2 113379.8 118128.5 123482.8 123076.7 127126.3
Index (1990=100) 100.0 99.6 100.8 100.2 102.6 104.4 107.4 111.9 117.0 116.6 120.4
LULUCF -3193.3 -3568.0 -2991.9 -3806.7 -3484.9 -4368.7 -3969.3 -3905.6 -3453.0 -4425.7 -2453.1
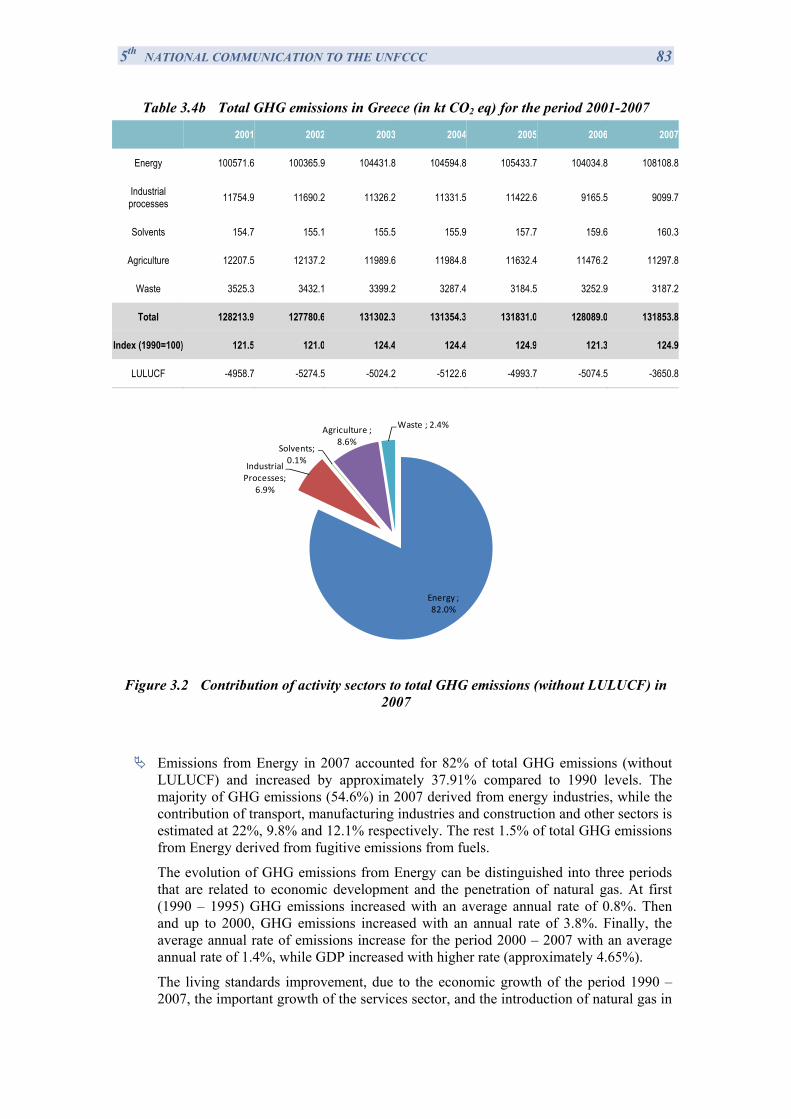
5th NATIONAL COMMUNICATION TO THE UNFCCC 83
Table 3.4b Total GHG emissions in Greece (in kt CO2 eq) for the period 2001-2007
2001 2002 2003 2004 2005 2006 2007
Energy 100571.6 100365.9 104431.8 104594.8 105433.7 104034.8 108108.8
Industrial processes 11754.9 11690.2 11326.2 11331.5 11422.6 9165.5 9099.7
Solvents 154.7 155.1 155.5 155.9 157.7 159.6 160.3
Agriculture 12207.5 12137.2 11989.6 11984.8 11632.4 11476.2 11297.8
Waste 3525.3 3432.1 3399.2 3287.4 3184.5 3252.9 3187.2
Total 128213.9 127780.6 131302.3 131354.3 131831.0 128089.0 131853.8
Index (1990=100) 121.5 121.0 124.4 124.4 124.9 121.3 124.9
LULUCF -4958.7 -5274.5 -5024.2 -5122.6 -4993.7 -5074.5 -3650.8
Energy ; 82.0%
Industrial Processes;
6.9%
Solvents; 0.1%
Agriculture ; 8.6%
Waste ; 2.4%
Figure 3.2 Contribution of activity sectors to total GHG emissions (without LULUCF) in
2007
Emissions from Energy in 2007 accounted for 82% of total GHG emissions (without LULUCF) and increased by approximately 37.91% compared to 1990 levels. The majority of GHG emissions (54.6%) in 2007 derived from energy industries, while the contribution of transport, manufacturing industries and construction and other sectors is estimated at 22%, 9.8% and 12.1% respectively. The rest 1.5% of total GHG emissions from Energy derived from fugitive emissions from fuels.
The evolution of GHG emissions from Energy can be distinguished into three periods that are related to economic development and the penetration of natural gas. At first (1990 – 1995) GHG emissions increased with an average annual rate of 0.8%. Then and up to 2000, GHG emissions increased with an annual rate of 3.8%. Finally, the average annual rate of emissions increase for the period 2000 – 2007 with an average annual rate of 1.4%, while GDP increased with higher rate (approximately 4.65%).
The living standards improvement, due to the economic growth of the period 1990 – 2007, the important growth of the services sector, and the introduction of natural gas in
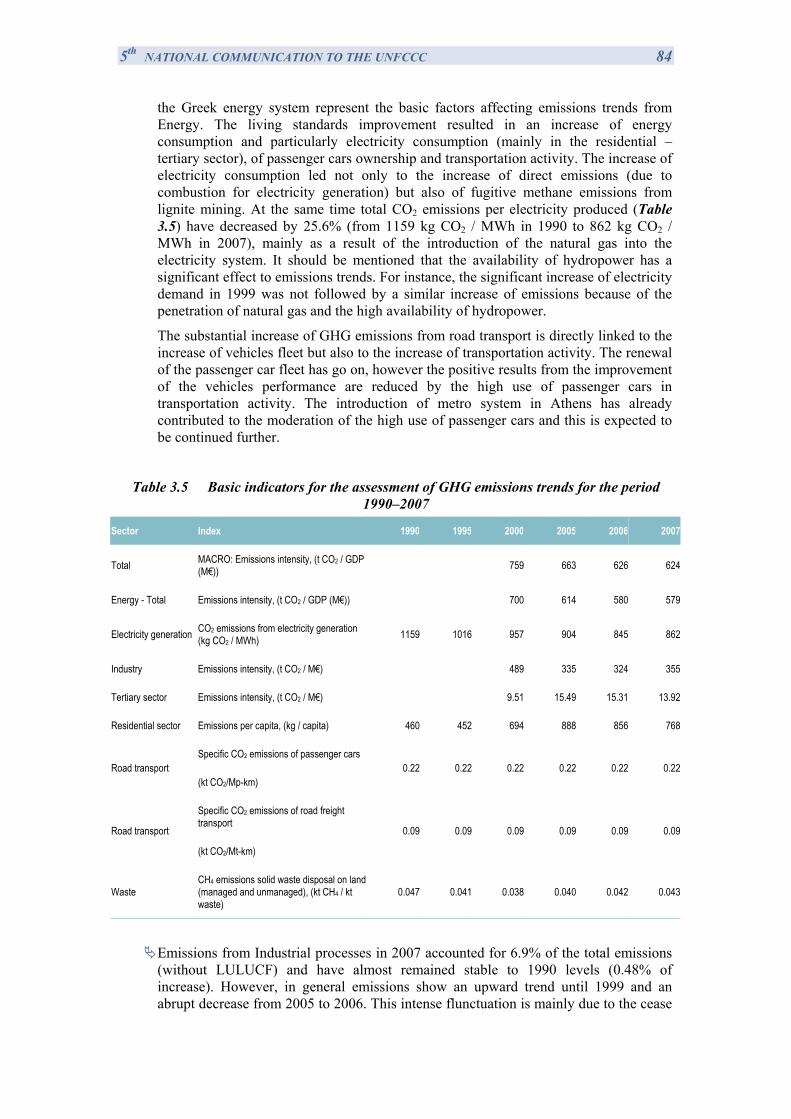
5th NATIONAL COMMUNICATION TO THE UNFCCC 84
the Greek energy system represent the basic factors affecting emissions trends from Energy. The living standards improvement resulted in an increase of energy consumption and particularly electricity consumption (mainly in the residential – tertiary sector), of passenger cars ownership and transportation activity. The increase of electricity consumption led not only to the increase of direct emissions (due to combustion for electricity generation) but also of fugitive methane emissions from lignite mining. At the same time total CO2 emissions per electricity produced (Table 3.5) have decreased by 25.6% (from 1159 kg CO2 / MWh in 1990 to 862 kg CO2 / MWh in 2007), mainly as a result of the introduction of the natural gas into the electricity system. It should be mentioned that the availability of hydropower has a significant effect to emissions trends. For instance, the significant increase of electricity demand in 1999 was not followed by a similar increase of emissions because of the penetration of natural gas and the high availability of hydropower.
The substantial increase of GHG emissions from road transport is directly linked to the increase of vehicles fleet but also to the increase of transportation activity. The renewal of the passenger car fleet has go on, however the positive results from the improvement of the vehicles performance are reduced by the high use of passenger cars in transportation activity. The introduction of metro system in Athens has already contributed to the moderation of the high use of passenger cars and this is expected to be continued further.
Table 3.5 Basic indicators for the assessment of GHG emissions trends for the period 1990–2007
Sector Index 1990 1995 2000 2005 2006 2007
Total MACRO: Emissions intensity, (t CO2 / GDP (M€)) 759 663 626 624
Energy - Total Emissions intensity, (t CO2 / GDP (M€)) 700 614 580 579
Electricity generation CO2 emissions from electricity generation (kg CO2 / MWh) 1159 1016 957 904 845 862
Industry Emissions intensity, (t CO2 / M€) 489 335 324 355
Tertiary sector Emissions intensity, (t CO2 / M€) 9.51 15.49 15.31 13.92
Residential sector Emissions per capita, (kg / capita) 460 452 694 888 856 768
Road transport Specific CO2 emissions of passenger cars
(kt CO2/Mp-km) 0.22 0.22 0.22 0.22 0.22 0.22
Road transport
Specific CO2 emissions of road freight transport
(kt CO2/Mt-km)
0.09 0.09 0.09 0.09 0.09 0.09
Waste CH4 emissions solid waste disposal on land (managed and unmanaged), (kt CH4 / kt waste)
0.047 0.041 0.038 0.040 0.042 0.043
Emissions from Industrial processes in 2007 accounted for 6.9% of the total emissions (without LULUCF) and have almost remained stable to 1990 levels (0.48% of increase). However, in general emissions show an upward trend until 1999 and an abrupt decrease from 2005 to 2006. This intense flunctuation is mainly due to the cease
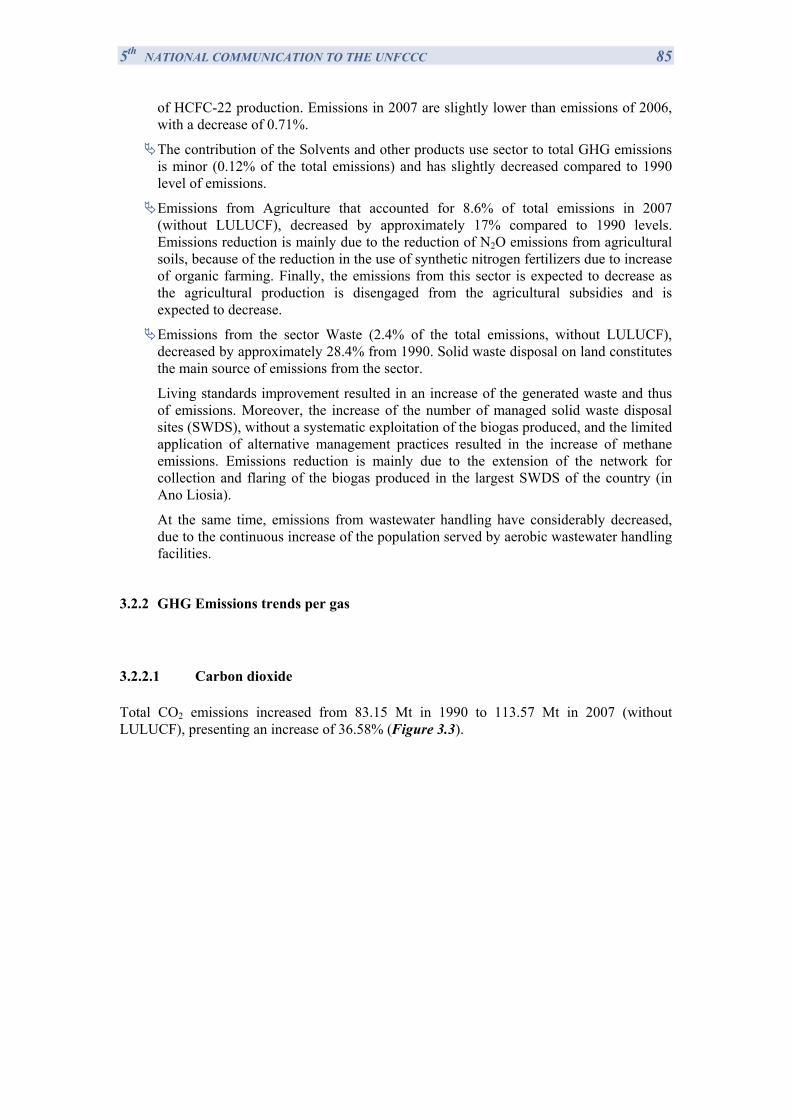
5th NATIONAL COMMUNICATION TO THE UNFCCC 85
of HCFC-22 production. Emissions in 2007 are slightly lower than emissions of 2006, with a decrease of 0.71%.
The contribution of the Solvents and other products use sector to total GHG emissions is minor (0.12% of the total emissions) and has slightly decreased compared to 1990 level of emissions.
Emissions from Agriculture that accounted for 8.6% of total emissions in 2007 (without LULUCF), decreased by approximately 17% compared to 1990 levels. Emissions reduction is mainly due to the reduction of Ν2Ο emissions from agricultural soils, because of the reduction in the use of synthetic nitrogen fertilizers due to increase of organic farming. Finally, the emissions from this sector is expected to decrease as the agricultural production is disengaged from the agricultural subsidies and is expected to decrease.
Emissions from the sector Waste (2.4% of the total emissions, without LULUCF), decreased by approximately 28.4% from 1990. Solid waste disposal on land constitutes the main source of emissions from the sector.
Living standards improvement resulted in an increase of the generated waste and thus of emissions. Moreover, the increase of the number of managed solid waste disposal sites (SWDS), without a systematic exploitation of the biogas produced, and the limited application of alternative management practices resulted in the increase of methane emissions. Emissions reduction is mainly due to the extension of the network for collection and flaring of the biogas produced in the largest SWDS of the country (in Ano Liosia).
At the same time, emissions from wastewater handling have considerably decreased, due to the continuous increase of the population served by aerobic wastewater handling facilities.
3.2.2 GHG Emissions trends per gas
3.2.2.1 Carbon dioxide
Total CO2 emissions increased from 83.15 Mt in 1990 to 113.57 Mt in 2007 (without LULUCF), presenting an increase of 36.58% (Figure 3.3).
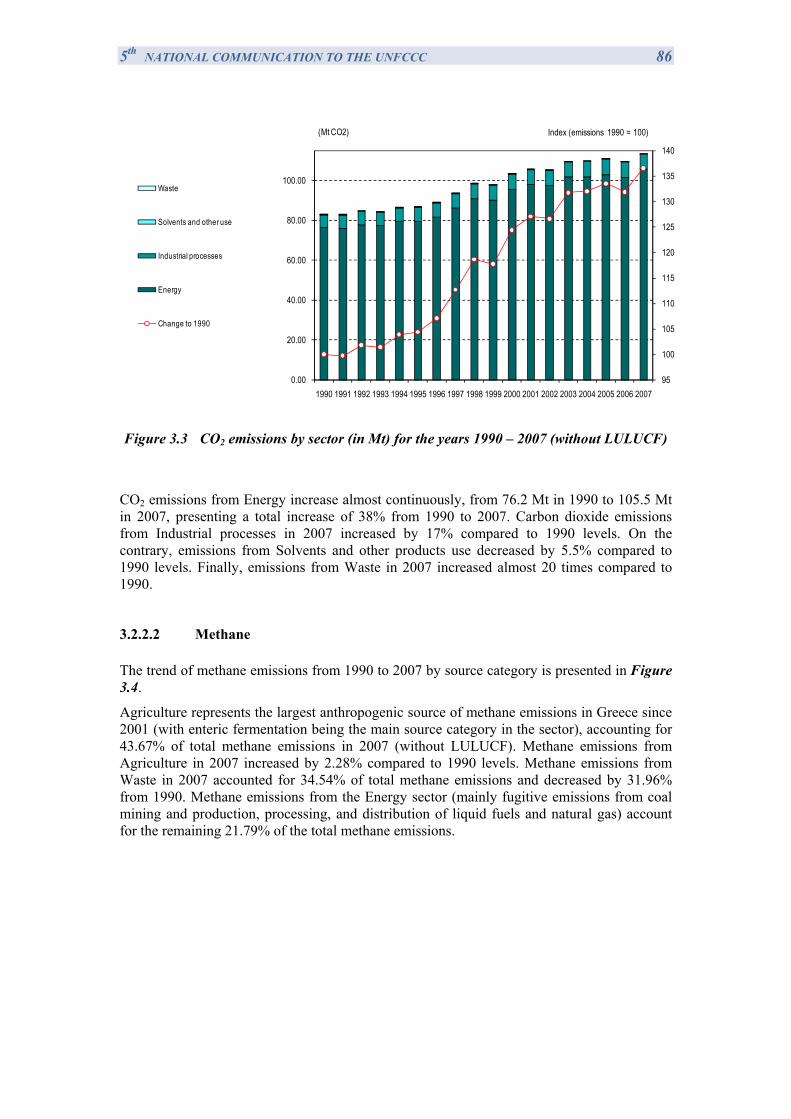
5th NATIONAL COMMUNICATION TO THE UNFCCC 86
95
100
105
110
115
120
125
130
135
140
0.00
20.00
40.00
60.00
80.00
100.00
1990 1991 1992 1993 1994 1995 1996 1997 1998 1999 2000 2001 2002 2003 2004 2005 2006 2007
Index (emissions 1990 = 100)(Mt CO2)
Waste
Solvents and other use
Industrial processes
Energy
Change to 1990
Figure 3.3 CO2 emissions by sector (in Mt) for the years 1990 – 2007 (without LULUCF)
CO2 emissions from Energy increase almost continuously, from 76.2 Mt in 1990 to 105.5 Mt in 2007, presenting a total increase of 38% from 1990 to 2007. Carbon dioxide emissions from Industrial processes in 2007 increased by 17% compared to 1990 levels. On the contrary, emissions from Solvents and other products use decreased by 5.5% compared to 1990 levels. Finally, emissions from Waste in 2007 increased almost 20 times compared to 1990.
3.2.2.2 Methane
The trend of methane emissions from 1990 to 2007 by source category is presented in Figure 3.4.
Agriculture represents the largest anthropogenic source of methane emissions in Greece since 2001 (with enteric fermentation being the main source category in the sector), accounting for 43.67% of total methane emissions in 2007 (without LULUCF). Methane emissions from Agriculture in 2007 increased by 2.28% compared to 1990 levels. Methane emissions from Waste in 2007 accounted for 34.54% of total methane emissions and decreased by 31.96% from 1990. Methane emissions from the Energy sector (mainly fugitive emissions from coal mining and production, processing, and distribution of liquid fuels and natural gas) account for the remaining 21.79% of the total methane emissions.
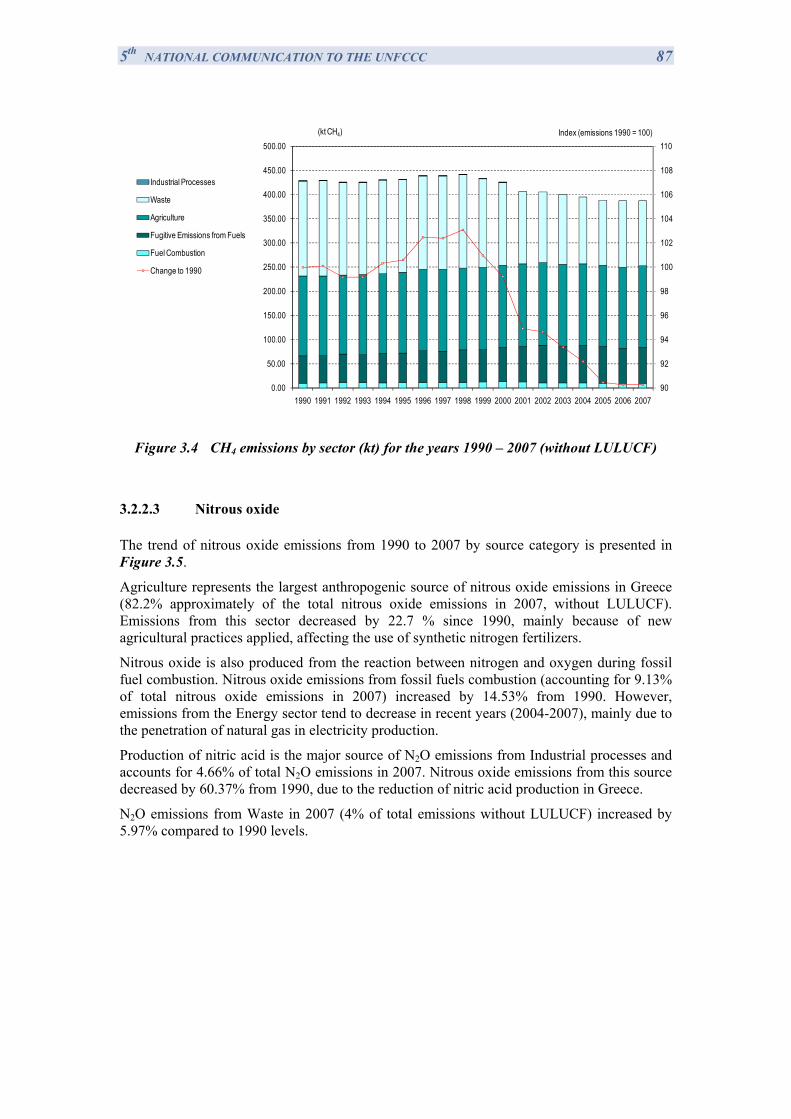
5th NATIONAL COMMUNICATION TO THE UNFCCC 87
90
92
94
96
98
100
102
104
106
108
110
0.00
50.00
100.00
150.00
200.00
250.00
300.00
350.00
400.00
450.00
500.00
1990 1991 1992 1993 1994 1995 1996 1997 1998 1999 2000 2001 2002 2003 2004 2005 2006 2007
(kt CH4) Index (emissions 1990 = 100)
Industrial Processes
Waste
Agriculture
Fugitive Emissions from Fuels
Fuel Combustion
Change to 1990
Figure 3.4 CH4 emissions by sector (kt) for the years 1990 – 2007 (without LULUCF)
3.2.2.3 Nitrous oxide
The trend of nitrous oxide emissions from 1990 to 2007 by source category is presented in Figure 3.5.
Agriculture represents the largest anthropogenic source of nitrous oxide emissions in Greece (82.2% approximately of the total nitrous oxide emissions in 2007, without LULUCF). Emissions from this sector decreased by 22.7 % since 1990, mainly because of new agricultural practices applied, affecting the use of synthetic nitrogen fertilizers.
Nitrous oxide is also produced from the reaction between nitrogen and oxygen during fossil fuel combustion. Nitrous oxide emissions from fossil fuels combustion (accounting for 9.13% of total nitrous oxide emissions in 2007) increased by 14.53% from 1990. However, emissions from the Energy sector tend to decrease in recent years (2004-2007), mainly due to the penetration of natural gas in electricity production.
Production of nitric acid is the major source of N2O emissions from Industrial processes and accounts for 4.66% of total N2O emissions in 2007. Nitrous oxide emissions from this source decreased by 60.37% from 1990, due to the reduction of nitric acid production in Greece.
N2O emissions from Waste in 2007 (4% of total emissions without LULUCF) increased by 5.97% compared to 1990 levels.
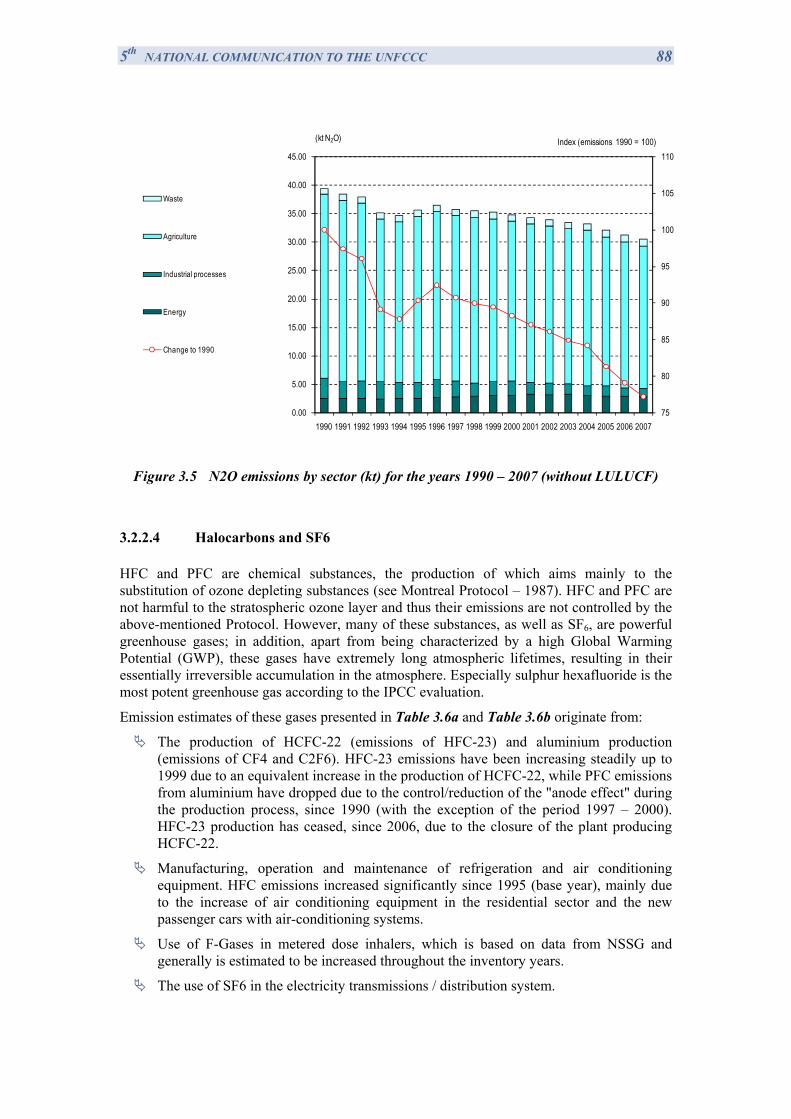
5th NATIONAL COMMUNICATION TO THE UNFCCC 88
75
80
85
90
95
100
105
110
0.00
5.00
10.00
15.00
20.00
25.00
30.00
35.00
40.00
45.00
1990 1991 1992 1993 1994 1995 1996 1997 1998 1999 2000 2001 2002 2003 2004 2005 2006 2007
Index (emissions 1990 = 100)(kt N2O)
Waste
Agriculture
Industrial processes
Energy
Change to 1990
Figure 3.5 Ν2Ο emissions by sector (kt) for the years 1990 – 2007 (without LULUCF)
3.2.2.4 Halocarbons and SF6
HFC and PFC are chemical substances, the production of which aims mainly to the substitution of ozone depleting substances (see Montreal Protocol – 1987). HFC and PFC are not harmful to the stratospheric ozone layer and thus their emissions are not controlled by the above-mentioned Protocol. However, many of these substances, as well as SF6, are powerful greenhouse gases; in addition, apart from being characterized by a high Global Warming Potential (GWP), these gases have extremely long atmospheric lifetimes, resulting in their essentially irreversible accumulation in the atmosphere. Especially sulphur hexafluoride is the most potent greenhouse gas according to the IPCC evaluation.
Emission estimates of these gases presented in Table 3.6a and Table 3.6b originate from:
The production of HCFC-22 (emissions of HFC-23) and aluminium production (emissions of CF4 and C2F6). HFC-23 emissions have been increasing steadily up to 1999 due to an equivalent increase in the production of HCFC-22, while PFC emissions from aluminium have dropped due to the control/reduction of the "anode effect" during the production process, since 1990 (with the exception of the period 1997 – 2000). HFC-23 production has ceased, since 2006, due to the closure of the plant producing HCFC-22.
Manufacturing, operation and maintenance of refrigeration and air conditioning equipment. HFC emissions increased significantly since 1995 (base year), mainly due to the increase of air conditioning equipment in the residential sector and the new passenger cars with air-conditioning systems.
Use of F-Gases in metered dose inhalers, which is based on data from NSSG and generally is estimated to be increased throughout the inventory years.
The use of SF6 in the electricity transmissions / distribution system.
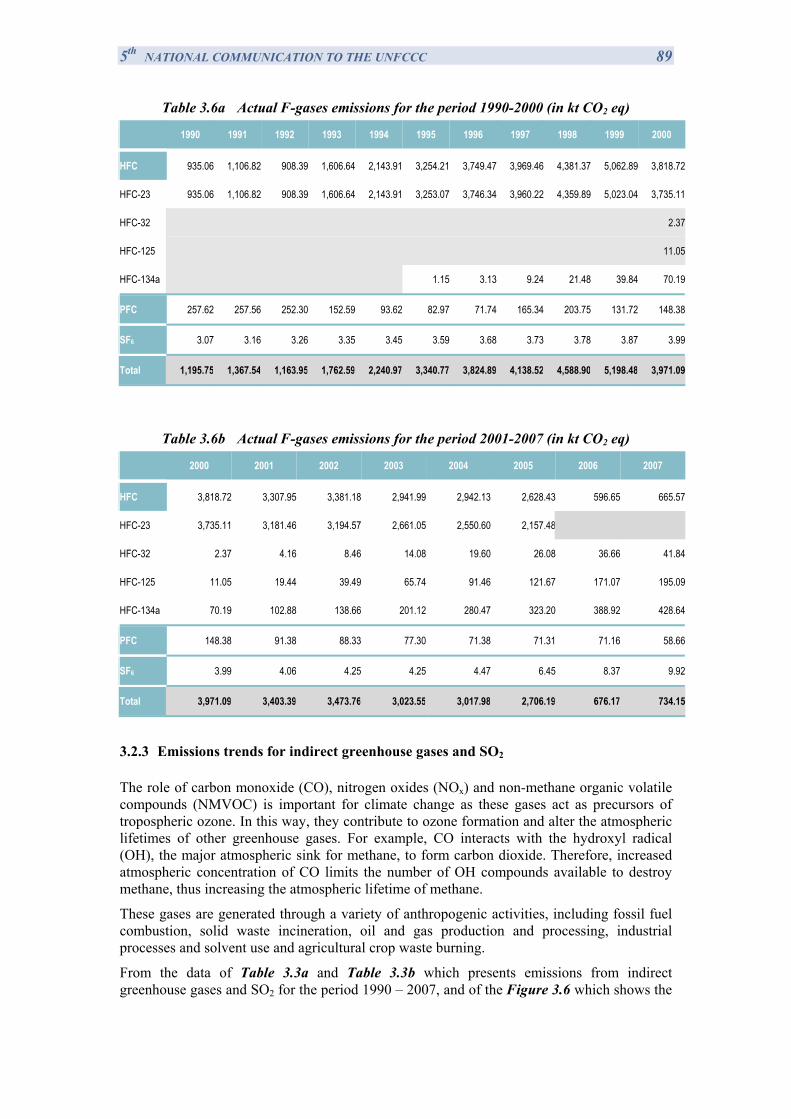
5th NATIONAL COMMUNICATION TO THE UNFCCC 89
Table 3.6a Actual F-gases emissions for the period 1990-2000 (in kt CO2 eq)
1990 1991 1992 1993 1994 1995 1996 1997 1998 1999 2000
HFC 935.06 1,106.82 908.39 1,606.64 2,143.91 3,254.21 3,749.47 3,969.46 4,381.37 5,062.89 3,818.72
HFC-23 935.06 1,106.82 908.39 1,606.64 2,143.91 3,253.07 3,746.34 3,960.22 4,359.89 5,023.04 3,735.11
HFC-32 2.37
HFC-125 11.05
HFC-134a 1.15 3.13 9.24 21.48 39.84 70.19
PFC 257.62 257.56 252.30 152.59 93.62 82.97 71.74 165.34 203.75 131.72 148.38
SF6 3.07 3.16 3.26 3.35 3.45 3.59 3.68 3.73 3.78 3.87 3.99
Total 1,195.75 1,367.54 1,163.95 1,762.59 2,240.97 3,340.77 3,824.89 4,138.52 4,588.90 5,198.48 3,971.09
Table 3.6b Actual F-gases emissions for the period 2001-2007 (in kt CO2 eq)
2000 2001 2002 2003 2004 2005 2006 2007
HFC 3,818.72 3,307.95 3,381.18 2,941.99 2,942.13 2,628.43 596.65 665.57
HFC-23 3,735.11 3,181.46 3,194.57 2,661.05 2,550.60 2,157.48
HFC-32 2.37 4.16 8.46 14.08 19.60 26.08 36.66 41.84
HFC-125 11.05 19.44 39.49 65.74 91.46 121.67 171.07 195.09
HFC-134a 70.19 102.88 138.66 201.12 280.47 323.20 388.92 428.64
PFC 148.38 91.38 88.33 77.30 71.38 71.31 71.16 58.66
SF6 3.99 4.06 4.25 4.25 4.47 6.45 8.37 9.92
Total 3,971.09 3,403.39 3,473.76 3,023.55 3,017.98 2,706.19 676.17 734.15
3.2.3 Emissions trends for indirect greenhouse gases and SO2
The role of carbon monoxide (CO), nitrogen oxides (NOx) and non-methane organic volatile compounds (NMVOC) is important for climate change as these gases act as precursors of tropospheric ozone. In this way, they contribute to ozone formation and alter the atmospheric lifetimes of other greenhouse gases. For example, CO interacts with the hydroxyl radical (OH), the major atmospheric sink for methane, to form carbon dioxide. Therefore, increased atmospheric concentration of CO limits the number of OH compounds available to destroy methane, thus increasing the atmospheric lifetime of methane.
These gases are generated through a variety of anthropogenic activities, including fossil fuel combustion, solid waste incineration, oil and gas production and processing, industrial processes and solvent use and agricultural crop waste burning.
From the data of Table 3.3a and Table 3.3b which presents emissions from indirect greenhouse gases and SO2 for the period 1990 – 2007, and of the Figure 3.6 which shows the
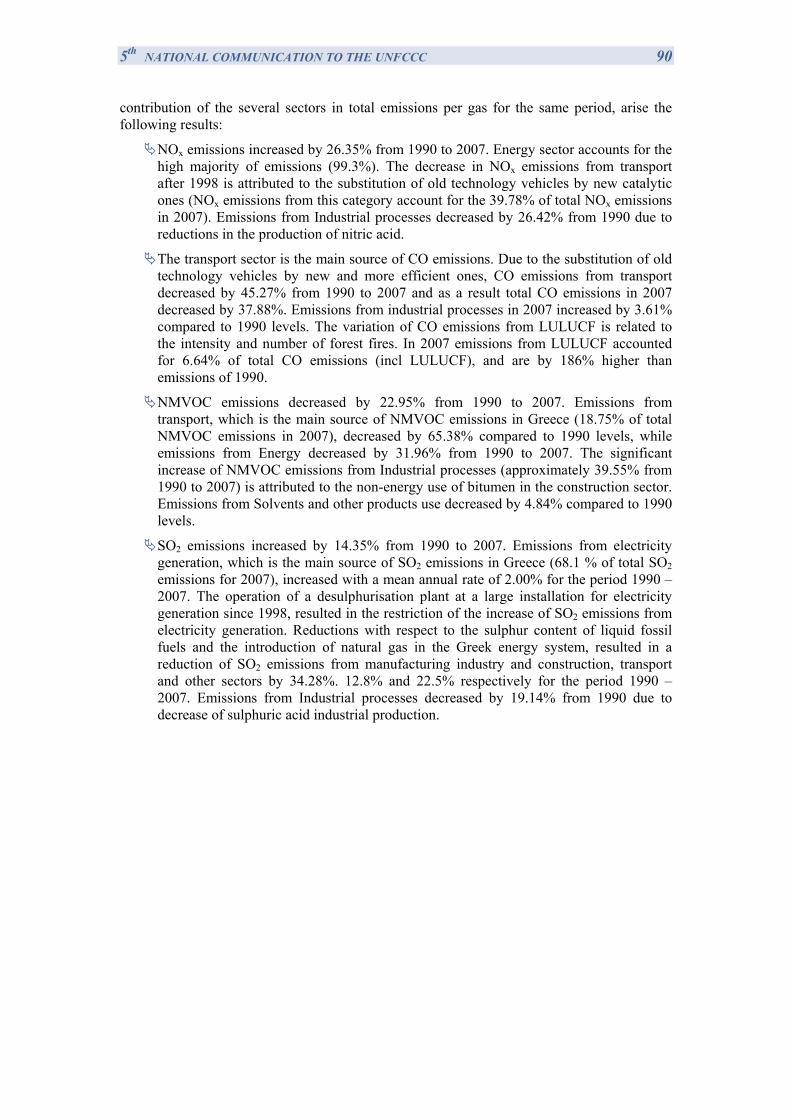
5th NATIONAL COMMUNICATION TO THE UNFCCC 90 contribution of the several sectors in total emissions per gas for the same period, arise the following results:
NOx emissions increased by 26.35% from 1990 to 2007. Energy sector accounts for the high majority of emissions (99.3%). The decrease in NOx emissions from transport after 1998 is attributed to the substitution of old technology vehicles by new catalytic ones (NOx emissions from this category account for the 39.78% of total NOx emissions in 2007). Emissions from Industrial processes decreased by 26.42% from 1990 due to reductions in the production of nitric acid.
The transport sector is the main source of CO emissions. Due to the substitution of old technology vehicles by new and more efficient ones, CO emissions from transport decreased by 45.27% from 1990 to 2007 and as a result total CO emissions in 2007 decreased by 37.88%. Emissions from industrial processes in 2007 increased by 3.61% compared to 1990 levels. The variation of CO emissions from LULUCF is related to the intensity and number of forest fires. In 2007 emissions from LULUCF accounted for 6.64% of total CO emissions (incl LULUCF), and are by 186% higher than emissions of 1990.
NMVOC emissions decreased by 22.95% from 1990 to 2007. Emissions from transport, which is the main source of NMVOC emissions in Greece (18.75% of total NMVOC emissions in 2007), decreased by 65.38% compared to 1990 levels, while emissions from Energy decreased by 31.96% from 1990 to 2007. The significant increase of NMVOC emissions from Industrial processes (approximately 39.55% from 1990 to 2007) is attributed to the non-energy use of bitumen in the construction sector. Emissions from Solvents and other products use decreased by 4.84% compared to 1990 levels.
SO2 emissions increased by 14.35% from 1990 to 2007. Emissions from electricity generation, which is the main source of SO2 emissions in Greece (68.1 % of total SO2 emissions for 2007), increased with a mean annual rate of 2.00% for the period 1990 – 2007. The operation of a desulphurisation plant at a large installation for electricity generation since 1998, resulted in the restriction of the increase of SO2 emissions from electricity generation. Reductions with respect to the sulphur content of liquid fossil fuels and the introduction of natural gas in the Greek energy system, resulted in a reduction of SO2 emissions from manufacturing industry and construction, transport and other sectors by 34.28%. 12.8% and 22.5% respectively for the period 1990 – 2007. Emissions from Industrial processes decreased by 19.14% from 1990 due to decrease of sulphuric acid industrial production.
5th NATIONAL COMMUNICATION TO THE UNFCCC 91
0.0
50.0
100.0
150.0
200.0
250.0
300.0
350.0
400.0
450.0
NOx Emissioms (kt)
LULUCF
Agriculture
Industrial processesEnergy -TransportationEnergy - Stationary combustion
0.0
200.0
400.0
600.0
800.0
1000.0
1200.0
1400.0
1600.0
CO Emissioms (kt)
LULUCF
Agriculture
Industrial processes
Energy -Transportation
0.0
50.0
100.0
150.0
200.0
250.0
300.0
350.0
400.0NMVOC emissions (kt)
Solvents
Industrial processes
Energy -Transportation
Energy -Stationary combustion
0.0
100.0
200.0
300.0
400.0
500.0
600.0
SO2 Emissioms (kt)
Industrial processes
Energy -Transportation
Energy -Stationary combustion
Figure 3.6 Emissions from indirect greenhouse gases and SO2 per gas and sector for the
period 1990 – 2007
5th NATIONAL COMMUNICATION TO THE UNFCCC 92 3.3 National System for the GHG emissions/removals inventory
3.3.1 Overview
The Ministry of Environment, Energy and Climate Change (MEECC) is the governmental body responsible for the development and implementation of environmental policy in Greece, as well as for the provision of information concerning the state of the environment in Greece in compliance with relevant requirements defined in international conventions, protocols and agreements. Moreover, the Ministry of Environment, Energy and Climate Change is responsible for the co-ordination of all involved ministries, as well as any relevant public or private organization, in relation to the implementation of the provisions of the Kyoto Protocol according to the Law 3017/2002, with which Greece ratified the Kyoto Protocol.
In this context, the Ministry of Environment, Energy and Climate Change has the overall responsibility for the national GHG inventory, and the official consideration and approval of the inventory prior to its submission. (Contact person: Elpida Politi, National UNFCCC Focal point, Address: Villa Kazouli, Kifisias 241, 14561, Athens, Greece, e-mail: [email protected], tel.: +30210 8089275, fax: +30210 8089239.)
Figure 3.7 provides an overview of the organizational structure of the National Inventory System. The entities participating in it are:
The Ministry of Environment, Energy and Climate Change designated as the national entity responsible for the national inventory, which has the overall responsibility, but also plays an active role in the inventory planning, preparation and management process.
The National Technical University of Athens (NTUA) / School of Chemical Engineering, which has the technical and scientific responsibility for the compilation of the annual inventory.
Other competent Ministries / agencies through their appointed focal persons, ensure the data provision and contribute to methodological issues.
International associations, along with individual private industrial companies, contribute to data providing and development of methodological issues as appropriate.
The legal framework defining the roles-responsibilities and the co-operation between the MEECC Climate team, the NTUA Inventory team and the designated focal persons of the competent Ministries were formalized by a circular 918/21-4-08 released by MEECC entitled “Structure and operation of the National Greenhouse Gases Inventory System- Roles and Responsibilities”
The above-mentioned circular includes a description of each entity’s responsibilities, concerning the inventory preparation, data providing, approval procedure and other relative information. In Annex II the responsibilities / roles per entity involved in the National GHG Inventory System are presented in a tabular format. This formal framework has improved the collaboration between the entities involved, assuring the timely collection and quality of the activity data required and solving data access restriction problems raised due to confidentiality issues.
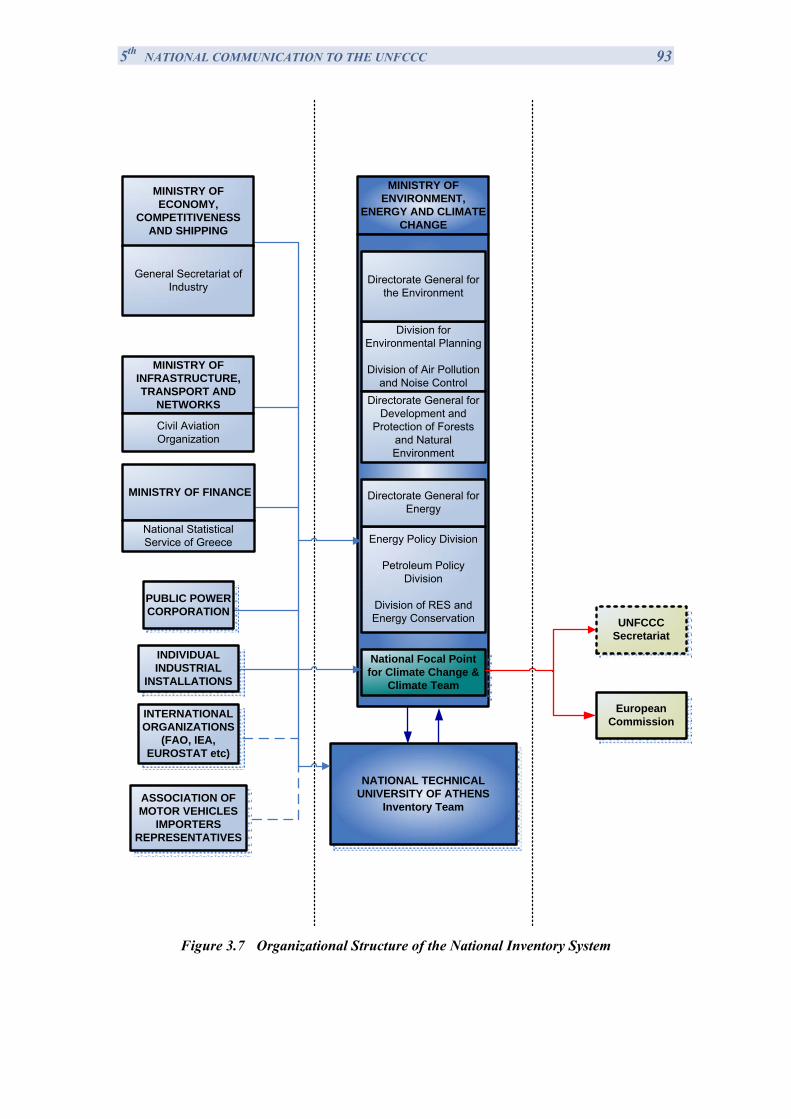
5th NATIONAL COMMUNICATION TO THE UNFCCC 93
MINISTRY OF INFRASTRUCTURE, TRANSPORT AND
NETWORKS
Civil Aviation Organization
MINISTRY OF FINANCE
National Statistical Service of Greece
PUBLIC POWER CORPORATION
INDIVIDUAL INDUSTRIAL
INSTALLATIONS
ASSOCIATION OF MOTOR VEHICLES
IMPORTERS REPRESENTATIVES
NATIONAL TECHNICAL UNIVERSITY OF ATHENS
Inventory Team
MINISTRY OF ENVIRONMENT,
ENERGY AND CLIMATE CHANGE
National Focal Point for Climate Change &
Climate Team
Division for Environmental Planning
Division of Air Pollution and Noise Control
European Commission
UNFCCC Secretariat
Directorate General for the Environment
Directorate General for Development and
Protection of Forests and Natural Environment
MINISTRY OF ECONOMY,
COMPETITIVENESS AND SHIPPING
General Secretariat of Industry
Energy Policy Division
Petroleum Policy Division
Division of RES and Energy Conservation
Directorate General for Energy
INTERNATIONAL ORGANIZATIONS
(FAO, IEA, EUROSTAT etc)
Figure 3.7 Organizational Structure of the National Inventory System
5th NATIONAL COMMUNICATION TO THE UNFCCC 94 3.3.2 Roles and Responsibilities
3.3.2.1 Ministry of Environment, Energy and Climate Change
The Ministry of Environment, Energy and Climate Change, as the competent national entity, has the overall responsibility for the national GHG inventory. Among its responsibilities are the following:
The co-ordination of all ministries and governmental agencies involved, as well as any relevant public or private organization. In this context, it oversees the operation of the National System and decides on the necessary arrangements to ensure compliance with relevant decisions of the COP/CMP.
The official consideration and approval of the inventory prior to its submission.
The timely submission of the GHG inventory to the European Commission and to the UNFCCC Secretariat.
The keeping of the Centralised Inventory File, which is delivered to the institute which has the technical responsibility for the inventory planning, preparation and management (currently NTUA) at the beginning of each inventory cycle. The Centralised Inventory File is kept at the premises of MEECC.
The response to any issues raised by the inventory review process under Article 8 of the Kyoto Protocol, in co-operation with the technical consultant (NTUA Inventory Team), who has the technical and scientific responsibility for the inventory planning, preparation and management of all sectors.
The administration of the National Registry. The administration of the registry is assigned to the National Center for the Environment and Sustainable Development, which reports to the Ministry of Environment , Energy and Climate Change and operates under the authority of the latter.
The supervision of Quality Assurance/Quality Control Plan (QA/QC).
As it appears from the above description, the role of the Ministry of Environment, Energy and Climate Change is not narrowed to the co-ordination of the entities involved in the inventory process and to facilitate the activity data transfer from the data providers to the NTUA’s Inventory Team. MEECC has an active role in monitoring and overseeing the inventory process through continuous communication and frequent scheduled and / or ad-hoc meetings with the Inventory Team of NTUA and the competent ministries or other agencies involved.
For the fulfilment of the above-mentioned roles and responsibilities of the ministry, a Climate Team was established within the Ministry of Environment, Energy and Climate Change (MEECC Climate Team), comprising the following experts:
1. Elpida Politi, National UNFCCC focal point, Co-ordinator
2. Afroditi Kotidou
3. Efthymiou-Charalampopoulou Nektaria
4. Moraiti Christina, alternate Lazaridis Klimis
5. Ballas Dionisios, alternate Koromila Chryssoula
5th NATIONAL COMMUNICATION TO THE UNFCCC 95 For each inventory sector, specified in the circular, a member of the MEECC’s Climate Team has been assigned as responsible for overseeing the NTUA’s inventory work and for communication with other Ministries’ / agencies’ data providers.
Furthermore, for expanding the overseeing role of MEECC in the inventory process, the supervision of QA/QC system is performed by the QA/QC responsible, an expert from the National Center for the Environment and Sustainable Development (NCESD), which is supervised by MEECC. The QA/QC responsible is not involved in the day-to-day inventory preparation and compilation. In co-operation with the scientific responsible of NTUA team and the NTUA inventory sector experts, he is responsible for the sound performance of the QA/QC system.
3.3.2.2 National Technical University of Athens-School of Chemical Engineering
The Ministry of Environment, Energy and Climate Change has assigned, on a contract basis, the National Technical University of Athens (NTUA) / School of Chemical Engineering as the national institution that has the overall technical and scientific responsibility for the planning, preparation and management of the annual national inventory. In this framework, NTUA (Inventory Team) has the following responsibilities / tasks to fulfill for the GHG inventory preparation:
1. Data collection (activity data and emission factors) for all source / sinks categories that are Energy, Industrial Processes, Solvents and Other Product Use, Agriculture, Land Use, Land Use Change and Forestry, and Waste.
2. Reliability check of input data through
the comparison of the same or similar data from alternative data sources and
time-series assessment in order to identify changes that cannot be explained.
3. Selection of the appropriate methodologies according to IPCC guidelines. GHG emissions estimates preparation by applying the methodologies and models having been selected.
4. Data processing and archiving.
5. Assessment of the consistency of the methodologies applied, inventory improvement – recalculations.
6. Reliability check of results.
7. Key categories analysis.
8. Uncertainty assessment.
9. Preparation of Common Reporting Format (CRF) tables.
10. Preparation of National Inventory Report (NIR).
11. Reporting of the required information according to Article 3 of the Decision 280/2004/EC of the European Parliament and of the Council.
12. Preparation and keeping of annual Centralised Inventory File. At the end of each cycle of the inventory preparation, all inventory related information is handled to the MEECC’s employee responsible for keeping the Centralised Inventory File (member of the Climate Team), who in turn gives the latest version of all relevant files to the NTUA inventory team at the beginning of the next inventory cycle.
13. Development of QA/QC procedures.
5th NATIONAL COMMUNICATION TO THE UNFCCC 96
14. Implementing the QA/QC procedures under the supervision of MEECC.
15. Training the representatives of providing data agencies on inventory issues.
The NTUA co-operates with a number of government agencies and other entities for the preparation of the inventory (see next section). It should be mentioned that this co-operation is not restricted to data collection but it also concerns methodological issues as appropriate. However, the technical consultant (NTUA) is responsible for the final decision concerning methodological issues.
NTUA is also responsible in co-operation with MEECC’s Climate Team to perform greenhouse gas balance projections in terms of sources and sinks as a minimum for the years 2010, 2015 and 2020, organized by gas and by sector, according to the national policies and measures adopted.
The names and contact details of the NTUA inventory team follows:
1. Prof. Ioannis Ziomas, Scientific responsible
Address: National Technical University of Athens, School of Chemical Engineering, Heroon Polytechniou 9, Zografos, 157 80 Athens, Greece.
E-mail: [email protected]
Tel:+30 210 772 2358
FAX: +30 210 772 3155
2. Prof. Dimitris Marinos-Kouris
E-mail: [email protected]
Tel: +30 210 772 3148
FAX: +30 210 772 3155
3. Athina Progiou, Dr Mechanical Engineer
E-mail: [email protected]
Tel: +30 210 8223083
Fax: +30 210 8238604
4. Ioannis Sempos (Sebos), Chemical Engineer, MBA, NTUA research and technical associate
E-mail: [email protected]
Tel: +30 210 772 3240
FAX: +30 210 772 3155
5. Spyridoula Ntemiri, Chemical Engineer, NTUA
E-mail: [email protected]
Tel: +30 210 772 3149
FAX: +30 210 772 3155
6. Leonidas Kallinikos, Chemical Engineer, NTUA
E-mail: [email protected]
Tel: +30 210 772 3240
FAX: +30 210 772 3155
5th NATIONAL COMMUNICATION TO THE UNFCCC 97 It should be stressed that, when necessary, the above mentioned NTUA’s Inventory Team is ad hoc supported by experts either from the NTUA or other institutions.
3.3.2.3 Government Ministries/ Government agencies
The following government agencies and ministries, develop and maintain, within their terms of operation, data sets and emission methodology information necessary for the estimation of GHG emissions / removals. Most of these institutes have been used as sources of data since the first submission of Greek GHG national inventory. However, new sources of information are being sought both for further inventory development and improvement (higher Tier methodology usage) and quality control issues.
Each of the following ministries/agencies, has appointed focal persons responsible for data provision, included in the above mentioned circular:
The Ministry of Environment, Energy and Climate Change provides information and data for :
o Large Combustion Plants (fuel consumption, NOx and SO2 emissions – Department of industries), solid waste management (Department of Solid Waste Management), domestic wastewater handling practices (Department of Water Resources) (Contact persons: Dimitris Chadjidakis and Macheras Ioannis)
o annual statistical data for energy consumption and production (Solid fuels and electricity; Liquid and gaseous fuels; Renewable energy sources, (Contact persons: Constantinos Chatzigianakis,General Director of Energy and Loukas Georgalas, Director of Renewable Energy Sources and Energy Efficiency Directorate)
o LULUCF and emissions / removals from activities under Article 3, paragraphs 3 and 4 of the Kyoto Protocol. The above-mentioned activities are afforestation, reforestation and deforestation, which are mandatory according to Article 3.3, along with the elected one forest land management, according to Article 3.4. (Contact persons: Argyro Zerva, and Maria Chatziioannou, General Directorate of Forests).
The National Statistical Service of Greece, supervised by the Ministry of Finance, represents the main source of information for the estimation of emissions / removals from most of the IPCC source / sink categories (contact persons: Ioanna Papanagnou , and Konstantina Katartzi).
The Ministry of Economy, Competitiveness and Shipping provides information on industry data (Contact person: Xarikleia Piperopoulou, Director in the General Secretariat of Industry).
The Ministry of Rural Development and Food provides information and data (through the National Statistical Service of Greece which processes primary data collected by the Ministry) for the main indices and parameters of rural economy (e.g. animal population, cultivated areas, crops production, etc.) .
The Ministry of Infrastructure, Transport and Networks provides information and data for the vehicle fleet and its technical characteristics. The Civil Aviation Organization, supervised by the same Ministry provides information on Landing and Take-off cycles for both domestic and international aviation (Contact persons: Anastasios Kokkinos, General Director of Civil Aviation Organisation and Panagiotis Tselikas). Data from the Association of Motor Vehicles Importers Representatives are supplementary to the official data and are only used in cases where official data are temporarily not available. The above-mentioned data are used by NTUA experts for the preparation of GHG emissions. As concerns emissions from road transport the model COPERT III is being used.
5th NATIONAL COMMUNICATION TO THE UNFCCC 98 Data are also obtained from International Organizations as the United Nations Food and Agricultural Organization (FAO) from which data on the annual consumption of fertilizers are collected, the EUROSTAT, the International Iron and Steel Institute, the International Energy Association. These data are supplementary to the data collected from the aforementioned data providers.
Furthermore, associations, along with individual public and private industrial companies contribute to data providing and development of methodological issues as appropriate. For example, data from the Association of Motor Vehicles Importers Representatives are supplementary to the official data and are only used in cases where official data are temporarily not available. Individual industrial companies / installations, either public or private, as Power Public Corporation, cement plants, etc, constitute a data source for the GHG inventory preparation. However, these data are used supplementary to the above mentioned data sources (e.g. for QC).
3.3.3 Methodology and data sources
3.3.3.1 Activity data
Data collection, processing and check constitute the activity with the longest duration in the annual inventory cycle. The duration of this activity is related to the amount of the necessary data and the number of the entities involved. The on-time and successful completion of this activity has a major effect on the timeliness preparation and submission of the inventory as well as on its accuracy, completeness and consistency.
It should be noted that information and data collected (through questionnaires developed according to the guidelines described in the Commission Decision 2004/156/EC) in the framework of the formulation of the National Allocation Plan (NAP) for the period 2005 – 2007, according to the EU Directive 2003/87/EC (and its transposition to the national Law, JMD 2004) along with the data from the verified reports from installations under the EU ETS for years 2005, 2006 & 2007 constituted a significant source of information and an additional quality control check. Data collected, cover the period 2000 – 2007 and in some cases the whole period 1990 – 2007. Data processing resulted in (a) the estimation of country specific emission factors (e.g. cement production) (b) the improvement of completeness in specific sub-source categories (e.g. iron and steel production) and (c) the distribution of fuel consumption into different technologies / activities in Manufacturing industries and Construction.
3.3.3.2 Emission factors
The estimation of GHG emissions / removals per source / sink category is based on the methods described in the IPCC Guidelines, the IPCC Good Practice Guidance, the LULUCF Good Practice Guidance and the CORINAIR methodology. The emission factors used derive from the above-mentioned methodological sources and special attention was paid in selecting the emission factors that better describe practices in Greece. Furthermore, emission factors were obtained from plant specific information contained in EU ETS reports. An overview of the methods applied for the calculation of emissions / removals is presented in ANNEX AIII, Table AIII.1.
The key categories analysis constitutes the basic tool for methodological choice and for the prioritisation of the necessary improvements. In addition, the results of the various review processes (at national and international level) represent key input information for the identification of possible improvements. It should be mentioned however, that data
5th NATIONAL COMMUNICATION TO THE UNFCCC 99 availability as well as availability of resources (both human and financial) need also to be considered.
Data availability could become a significant restrictive parameter when selecting an estimation methodology. The accuracy and the consistency of the emissions estimated are depended on the availability of the data needed for the correct application of the selected methodology.
Availability of resources needs also to be considered as searching for and the collection of the necessary data to apply a detailed methodology for a source category should not affect the completeness and the on-time preparation of an inventory submission.
3.3.3.3 Global warming potential
Emissions from anthropogenic activities affect the concentration and distribution of greenhouse gases in the atmosphere. These changes can potentially produce a radiative forcing of the Earth’s surface and lower atmosphere, by changing either the reflection or absorption of solar radiation or the emissions and absorption of long-wave radiation.
A simple measure of the relative radiative effects of the emissions of various greenhouse gases is the Global Warming Potential (GWP) index. This index is defined as the cumulative radiative forcing between the present and some chosen time-horizon caused by a unit mass of gas emitted now, expressed relative to that for some reference gas. The values for GWP for some of the most potent greenhouse gases are given in Annex AIII, Table A.III.2.
Corresponding values of GWP for other gases (NOx, CO, NMVOC) are not given by the IPCC (nor by other sources for this purpose), since at present it is impossible to calculate the indirect results of these gases, as the scientific knowledge on their chemical reactions taking place in the atmosphere is not sufficient.
3.3.3.4 GHG emissions inventory preparation process
The preparation of the Greek GHG emissions inventory is based on the application of the Revised 1996 IPCC Guidelines for National Greenhouse Gas Inventories, as elaborated by the IPCC good practice guidance.
The compilation of the inventory is completed in three main stages:
Stage 1: The first stage consists of data collection and check for all source/sink categories. The main data sources used are the National Statistical Service of Greece (NSSG), the government agencies involved and large private enterprises, along with the verified reports from installations under the EU ETS.
Quality control of activity data include the comparison of the same or similar data from alternative data sources (e.g. National Statistical Service of Greece and International Iron & Steel Institute for steel production) as well as time-series assessment in order to identify changes that cannot be explained. In cases where problems and/or inconsistencies are identified, the agency’s representative, responsible for data providing, is called to explain the inconsistency and/or help solving the problem.
Stage 2: Once the reliability of input data is checked and certified, emissions/removals per source/sink category are estimated. Emissions estimates are then transformed to the format required by the CRF Reporter. This stage also includes the evaluation of the emission factors used and the assessment of the consistency of the methodologies
5th NATIONAL COMMUNICATION TO THE UNFCCC 100
applied in relation to the provisions of the IPCC Guidelines, the IPCC Good Practice Guidance and the LULUCF Good Practice Guidance.
Quality control checks, when at this stage, are related to time-series assessment as well as to the identification and correction of any errors / gaps while estimating emissions / removals and filling in the CRF Reporter.
Stage 3: The last stage involves the compilation of the NIR, its internal (i.e. within NTUA) check, the official approval procedure and final the submission of the inventory report (NIR) by the Ministry of Environment, Energy and Climate Change to the UNFCCC Secretariat.
The government agencies and ministries and the individual private or public industrial companies referred previously should have collected and delivered to the MEECC Climate Team and the NTUA Inventory Team the respective activity data needed for the inventory (for year X-2) and any changes in activity data for the period 1990 to year X-2, within the time period of May to November of year X-1 (X is the submission year of CRF tables and NIR referred to X-2 GHG emissions inventory).
The information that is related to the annual GHG emissions inventory (activity data, emission factors, analytic results, compilation in the required analysis level of the CRF tables) is stored in MS Excel spreadsheets. Moreover, the final results (NIR and CRF tables) are available in the MEECC web site (http://www.minenv.gr/4/41/g4107.html).
In addition, and within the context of the Quality Assurance/Quality Control system developed, two master files have been organized aiming at the systematic and safe archiving of inventory information: the Input Data File and the Centralised Inventory File.
The Input Data File contains (in electronic format and/or hard copy) all input data and parameters that are necessary for the estimation of GHG emissions/removals. Data are stored in files by sector and reference year.
The Centralised Inventory File includes all information relevant to the GHG emissions/removals inventory. At the end of each cycle of the inventory preparation, all inventory related information is handled by the NTUA Inventory Team to the person responsible for keeping the Centralised Inventory File (member of the Climate Team) in MEECC, who in turn provides the latest version of all relevant files (calculation files and NIR) to the Inventory Team at the beginning of the next inventory cycle.
More specifically the information stored in the Centralised Inventory Files includes:
A list of the reports, the input data files and the calculation/estimation files.
The members of the Inventory Team.
Final versions, in electronic format and hard copy, of the NIR.
CRF tables in electronic format and a hard copy of the CRF tables for the last year covered by each submission.
XML file and database of CRF reporter
Calculation files, including the uncertainty estimation files.
Expert review reports.
Any comments from the public review of the inventory.
Documentation derived from the implementation of the QA/QC procedures.
5th NATIONAL COMMUNICATION TO THE UNFCCC 101 3.3.4 Key categories analysis
The IPCC Good Practice Guidance defines procedures (in the form of decision trees) for the choice of estimation methods within the context of the IPCC Guidelines. Decision trees formalize the choice of the estimation method most suited to national circumstances considering at the same time the need for accuracy and the available resources (both financial and human). Generally, inventory uncertainty is lower when emissions are estimated using the most rigorous methods, but due to finite resources, this may not be feasible for every source category. Therefore it is good practice to identify those source categories (key source categories) that have the greatest contribution to overall inventory uncertainty in order to make the most efficient use of available resources.
In that context, a key source category is one that is prioritised within the national inventory system because its estimate has a significant influence on a country’s total inventory of direct greenhouse gases in terms of the absolute level of emissions (level assessment) or/and to the trend of emissions (trend assessment). As far as possible, key source categories should receive special consideration in terms of two important inventory aspects:
1. The use of source category-specific good practice methods is preferable, unless resources are unavailable.
2. The key source categories should receive additional attention with respect to quality assurance (QA) and quality control (QC).
As a result of the adoption of the LULUCF Good Practice Guidance (Decision 13/CP.9) the concept of key sources has been expanded in order to cover LULUCF emissions by sources and removals by sinks. Therefore the term key category is used in order to include both sources and sinks.
The determination of the key categories for the Greek inventory system is based on the application of the Tier 1 methodology described in the IPCC Good Practice Guidance, adopting the categorization of sources that is presented in of the IPCC Good Practice Guidance, adopting the categorization of sources that is presented in Table 7.1 of the IPCC Good Practice Guidance.
Tier 1 methodology for the identification of key categories assesses the impacts of various source categories on the level and the trend of the national emissions inventory. Key categories are those which, when summed together in descending order of magnitude, add up to over 95% of total emissions (level assessment) or the trend of the inventory in absolute terms.
It should be mentioned that:
Source category uncertainty estimates are not taken into consideration.
Base year estimates were calculated considering 1990 as base year for carbon dioxide, methane and nitrous oxide and 1995 for F - gases.
The key categories for the Greek inventory system (without LULUCF) are presented in Annex III, Table A.III.3.
Seven key sources are found in the energy sector, being responsible for 80.8% of total GHG emissions in 2007 (without LULUCF).
The methodology applied for the determination of the key categories with LULUCF is similar to the one presented above. The key categories identified are presented in Annex III, Table A.III.4. The comparison of the results of the analysis with and without LULUCF reveals no differences in the source categories identified.
5th NATIONAL COMMUNICATION TO THE UNFCCC 102
3.3.5 Improvement of GHG emissions / removals inventories
A number of recalculations have been performed in comparison with the previous inventory submissions in order to improve consistency with UNFCCC reporting guidelines and IPCC guidelines. The recalculations made are driven by the results of Greece’s QA/QC system and the various review processes, while prioritisation is based on the key source analysis and the availability of resources
The reasons for recalculations made, can be classified as follows:
1. Changes or refinements in methods. A methodological change occurs when an inventory agency uses a different tier to estimate emissions from a source category (e.g. for key source categories) or when it moves from a tier described in the IPCC Guidelines to a national method. Methodological changes are often driven by the development of new and different data sets. A methodological refinement occurs when an inventory agency uses the same tier to estimate emissions but applies it using a different data source or a different level of aggregation.
2. Inclusion of new sources. A new source is defined as a source for which estimates (all or some gases) did not exist in previous inventories either due to lack of data or because it has just been identified.
3. Allocation. Changes in allocation of emissions to different sectors or sources/sub-sources.
4. Correction of errors. This case concerns errors during calculating emissions (e.g. transcript errors) or while filling in the required information in the CRF tables. Inconsistencies resolving is also included in this category.
3.3.6 Quality assurance – Quality control system
The development and the implementation of an inventory Quality Assurance / Quality Control (QA/QC) plan represents a key tool for meeting the objectives of National Systems under Article 5 Paragraph 1 of the Protocol as described in Decision 20/CP.7.
With the Protocol’s application, it is expected that the pressure upon national GHG emissions inventories will increase and therefore quality management would be essential to comply with the requirements of (a) producing transparent, consistent, comparable, complete and accurate emissions estimates, (b) establishing a reliable central archiving system concerning all necessary information for GHG emissions inventories development and (c) compiling national reports according to the provisions of the adopted decisions.
In this framework, a QA/QC system is being implemented since April 2004. For the implementation of the QA/QC system the National Technical University of Athens is responsible in close co-operation with the Ministry of Environment, Energy and Climate Change. The system is based on the ISO 9001:2000 standard and its quality objectives, as stated in the quality management handbook, are the following:
1. Compliance with the IPCC guidelines and the UNFCCC reporting guidelines while estimating and reporting emissions/removals.
2. Continuous improvement of GHG emissions/removals estimates.
3. Timely submission of necessary information in compliance with relevant requirements defined in international conventions, protocols and agreements.
The accomplishment of the above-mentioned objectives can only be ensured by the implementation, from all the members of the Inventory Team (see Figure 3.8 for the flow
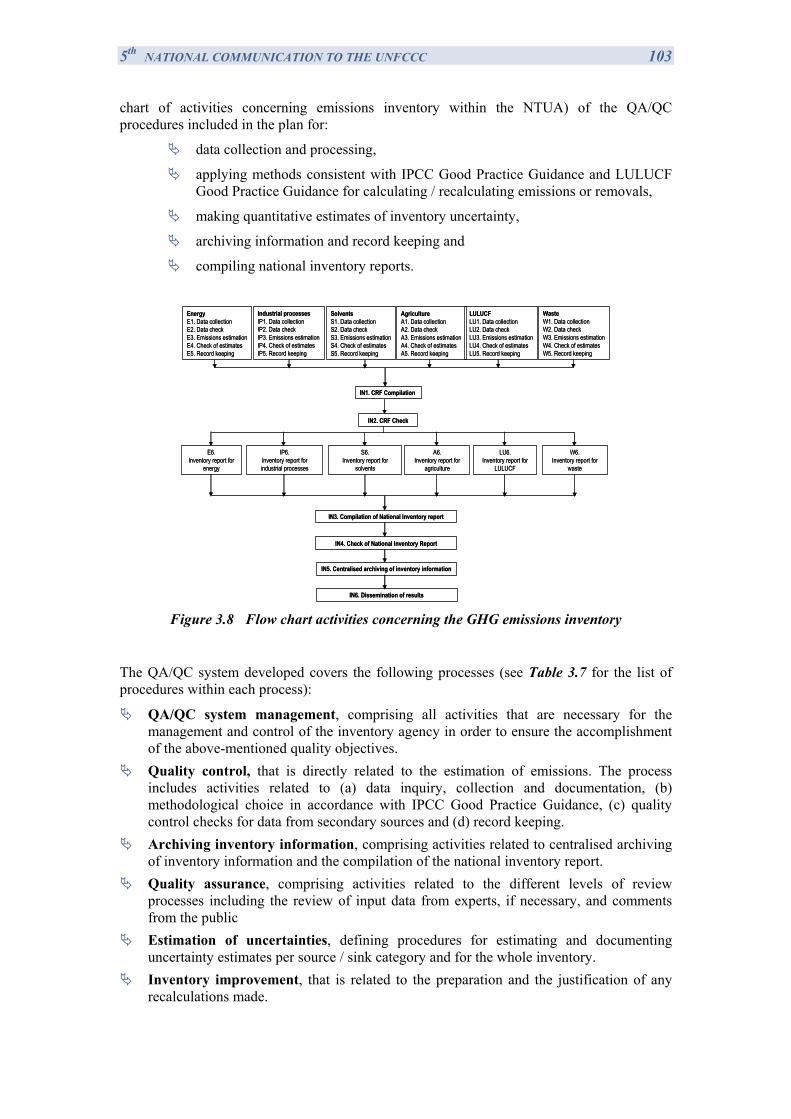
5th NATIONAL COMMUNICATION TO THE UNFCCC 103 chart of activities concerning emissions inventory within the NTUA) of the QA/QC procedures included in the plan for:
data collection and processing,
applying methods consistent with IPCC Good Practice Guidance and LULUCF Good Practice Guidance for calculating / recalculating emissions or removals,
making quantitative estimates of inventory uncertainty,
archiving information and record keeping and
compiling national inventory reports.
EnergyΕ1. Data collectionΕ2. Data checkΕ3. Emissions estimationΕ4. Check of estimatesΕ5. Record keeping
IN1. CRF Compilation
IN2. CRF Check
Ε6.Inventory report for
energy
LU6.Inventory report for
LULUCF
IN3. Compilation of National Inventory report
IN4. Check of National Inventory Report
IN5. Centralised archiving of inventory information
IN6. Dissemination of results
Industrial processesIP1. Data collectionIP2. Data checkIP3. Emissions estimationIP4. Check of estimatesIP5. Record keeping
IP6.Inventory report for industrial processes
W6.Inventory report for
waste
A6.Inventory report for
agriculture
S6.Inventory report for
solvents
SolventsS1. Data collectionS2. Data checkS3. Emissions estimationS4. Check of estimatesS5. Record keeping
AgricultureA1. Data collectionA2. Data checkA3. Emissions estimationA4. Check of estimatesA5. Record keeping
LULUCFLU1. Data collectionLU2. Data checkLU3. Emissions estimationLU4. Check of estimatesLU5. Record keeping
WasteW1. Data collectionW2. Data checkW3. Emissions estimationW4. Check of estimatesW5. Record keeping
Figure 3.8 Flow chart activities concerning the GHG emissions inventory
The QA/QC system developed covers the following processes (see Table 3.7 for the list of procedures within each process):
QA/QC system management, comprising all activities that are necessary for the management and control of the inventory agency in order to ensure the accomplishment of the above-mentioned quality objectives.
Quality control, that is directly related to the estimation of emissions. The process includes activities related to (a) data inquiry, collection and documentation, (b) methodological choice in accordance with IPCC Good Practice Guidance, (c) quality control checks for data from secondary sources and (d) record keeping.
Archiving inventory information, comprising activities related to centralised archiving of inventory information and the compilation of the national inventory report.
Quality assurance, comprising activities related to the different levels of review processes including the review of input data from experts, if necessary, and comments from the public
Estimation of uncertainties, defining procedures for estimating and documenting uncertainty estimates per source / sink category and for the whole inventory.
Inventory improvement, that is related to the preparation and the justification of any recalculations made.
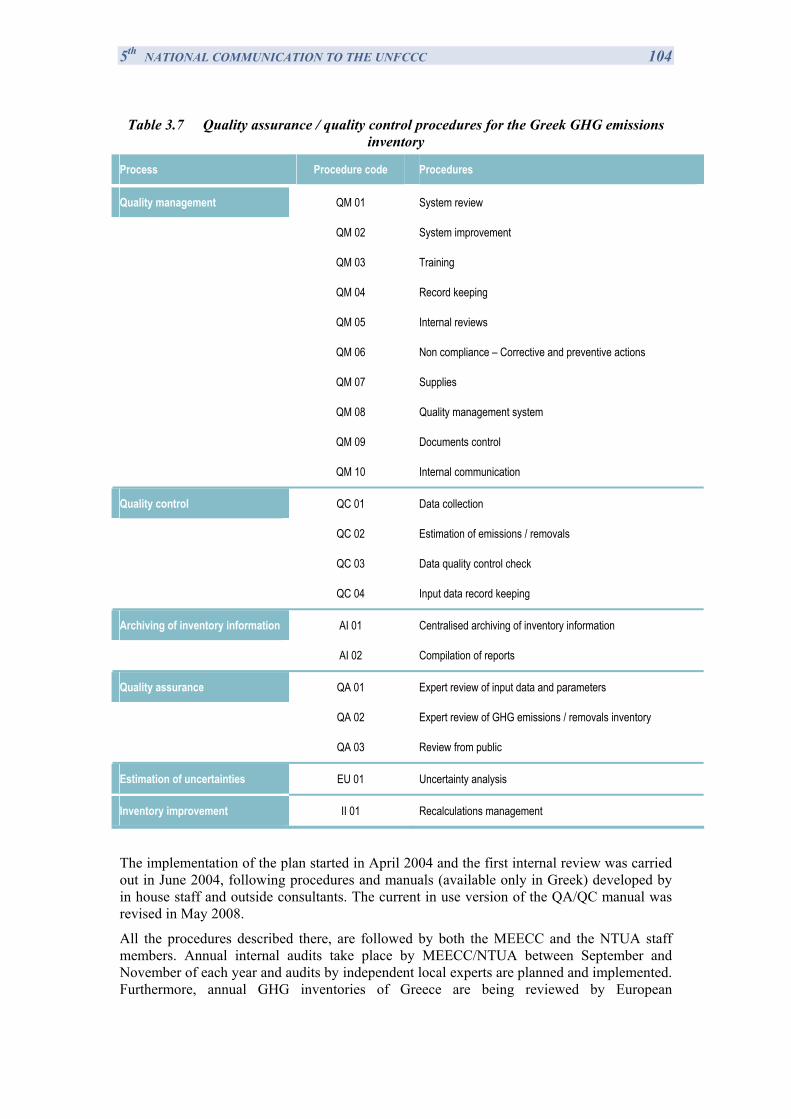
5th NATIONAL COMMUNICATION TO THE UNFCCC 104
Table 3.7 Quality assurance / quality control procedures for the Greek GHG emissions inventory
Process Procedure code Procedures
Quality management QM 01 System review
QM 02 System improvement
QM 03 Training
QM 04 Record keeping
QM 05 Internal reviews
QM 06 Non compliance – Corrective and preventive actions
QM 07 Supplies
QM 08 Quality management system
QM 09 Documents control
QM 10 Internal communication
Quality control QC 01 Data collection
QC 02 Estimation of emissions / removals
QC 03 Data quality control check
QC 04 Input data record keeping
Archiving of inventory information ΑI 01 Centralised archiving of inventory information
ΑI 02 Compilation of reports
Quality assurance QA 01 Expert review of input data and parameters
QA 02 Expert review of GHG emissions / removals inventory
QA 03 Review from public
Estimation of uncertainties ΕU 01 Uncertainty analysis
Inventory improvement II 01 Recalculations management
The implementation of the plan started in April 2004 and the first internal review was carried out in June 2004, following procedures and manuals (available only in Greek) developed by in house staff and outside consultants. The current in use version of the QA/QC manual was revised in May 2008.
All the procedures described there, are followed by both the MEECC and the NTUA staff members. Annual internal audits take place by MEECC/NTUA between September and November of each year and audits by independent local experts are planned and implemented. Furthermore, annual GHG inventories of Greece are being reviewed by European
5th NATIONAL COMMUNICATION TO THE UNFCCC 105 Commission according to decision 280/2004/EC and are also subjected to european QA/QC internal audits.
The continuous improvement of the quality of local emission factors, activity data and models is pursued by following the described QA/QC system and by participating to European Commission respective efforts (implementation of decision 280/2004/EC, participation in Working Group I – “Annual inventories” under the Climate Change Committee and relative workshops). Significant improvement of the quality of the GHG inventory of the energy and industrial processes sectors is being achieved by the cross checking of activity data, emission factors and other plant specific information obtained from installation reports under the EU Emission Trading System with those obtained from other data sources, like national energy balance, IPCC guidelines and literature. Moreover, similar cross-checking is being performed for the sectors industrial processes, agriculture, waste and LULUCF between data and emission estimation models obtained from several national experts (national institutes and universities, importing companies, market researchers and experts) with those obtained from official sources (departments and agencies of ministries, statistical service of Greece).
3.3.7 Official consideration and approval of the inventory
The official approval procedure of the inventory holds for one month period of interactions between the Inventory Team (NTUA) and the Climate Team (MEECC), starting on the 1st of February of the year of submission. During this period, the NTUA Inventory Team has to revise the report according to the observations and recommendations of the Climate Team. On the basis of this interaction process, the final version of the report is compiled. The General Director for the Environment of MEECC, who supervises the National System, approves the inventory and then the Ministry of Environment, Energy and Climate Change submits the NIR to the European Commission and to the UNFCCC Secretariat.
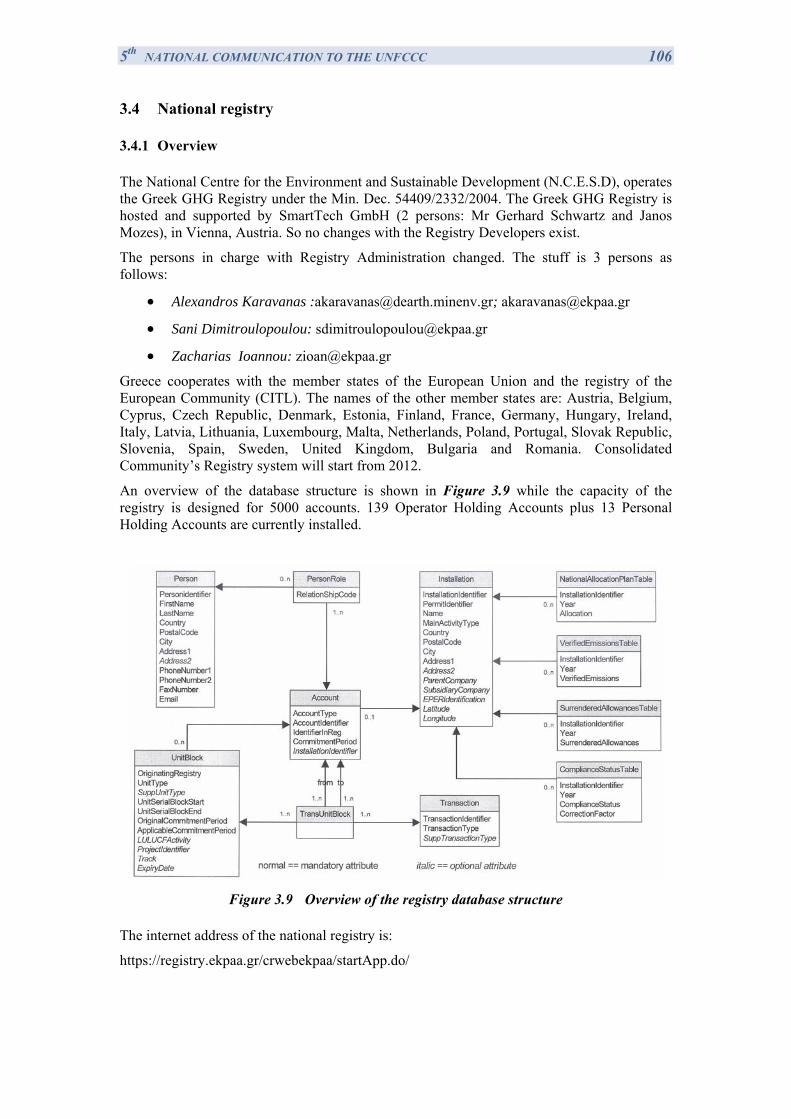
5th NATIONAL COMMUNICATION TO THE UNFCCC 106 3.4 National registry
3.4.1 Overview
The National Centre for the Environment and Sustainable Development (N.C.E.S.D), operates the Greek GHG Registry under the Min. Dec. 54409/2332/2004. The Greek GHG Registry is hosted and supported by SmartTech GmbH (2 persons: Mr Gerhard Schwartz and Janos Mozes), in Vienna, Austria. So no changes with the Registry Developers exist.
The persons in charge with Registry Administration changed. The stuff is 3 persons as follows:
• Alexandros Karavanas :[email protected]; [email protected]
• Sani Dimitroulopoulou: [email protected]
• Zacharias Ioannou: [email protected]
Greece cooperates with the member states of the European Union and the registry of the European Community (CITL). The names of the other member states are: Austria, Belgium, Cyprus, Czech Republic, Denmark, Estonia, Finland, France, Germany, Hungary, Ireland, Italy, Latvia, Lithuania, Luxembourg, Malta, Netherlands, Poland, Portugal, Slovak Republic, Slovenia, Spain, Sweden, United Kingdom, Bulgaria and Romania. Consolidated Community’s Registry system will start from 2012.
An overview of the database structure is shown in Figure 3.9 while the capacity of the registry is designed for 5000 accounts. 139 Operator Holding Accounts plus 13 Personal Holding Accounts are currently installed.
Figure 3.9 Overview of the registry database structure
The internet address of the national registry is:
https://registry.ekpaa.gr/crwebekpaa/startApp.do/
5th NATIONAL COMMUNICATION TO THE UNFCCC 107 3.4.2 Conformity with Data Exchange Standards
The software version 1.1.12.2 of the Greek national registry which is currently used is programmed according to the data exchange standards for registry systems under the Kyoto Protocol (DES), technical specifications Version 1.1.
• A description of the formats used in the national registry for account numbers, serial numbers for ERUs, CERs, AAUs and RMUs, including project identifiers and transaction numbers:
The formats in the national registry are used according to DES 1.1 Annex F – Definition of Identifiers.
• A list, and the electronic format, of the information transmitted electronically when transferring ERUs, CERs, AAUs and/or RMUs to other registries:
The formats for information transmitted electronically to the transaction log and other registries are used as specified for messages in DES 1.1.
• A list, and the electronic format, of the information transmitted electronically when acquiring ERUs, CERs, AAUs and/or RMUs from other national registries or the CDM registry;
The formats for information transmitted electronically to the transaction log and other registries when acquiring Kyoto units are used as specified for acquiring messages in DES 1.1.
• A list, and the electronic format, of the information transmitted electronically from the national registry to the independent transaction log when issuing, transferring, acquiring, cancelling and retiring ERUs, CERs, AAUs and/or RMUs:
The formats for information transmitted electronically to the transaction log and other registries are used as specified for messages in DES 1.1.
The supplementary transactions log (STL) of the European Community is based on DES 1.1. With test procedures that have been performed with the Greek national registry and the European STL, the accuracy of the implementation according to the DES has been tested.
The procedures that were also implemented in the registry software version were:
• Handling of tCERs and lCERs (such as replacement, expiry date change, cancellations),
• Carry-over,
• Notification log and handling of notifications,
• Net-source cancellations, non-compliance cancellations, excess issuance cancellations and other procedures like expiry date change of tCER and lCER that are performed after notifications from the ITL,
• Commitment period reserve checks
3.4.3 Minimisation of discrepancies and measures to deal with
To prevent discrepancies, internal checks and routines are implemented as far as possible. In the software version, the corresponding checks were:
• Checks concerning the handling of tCERs and lCERs (such as replacement, expiry date change, cancellations),
• Checks concerning carry-over procedures,
5th NATIONAL COMMUNICATION TO THE UNFCCC 108 • Checks concerning the handling of notifications,
• Checks concerning net source cancellations and non-compliance cancellations and other procedures that are performed after notification from the ITL,
• Commitment period reserve checks.
The measures to deal with discrepancies are:
1. Whenever a possible discrepancy is detected by the internal checks, no transaction will be started.
2. Unit blocks involved in a pending transaction are locked for use in any other transaction.
3. There will be an automatic termination of the transaction that has caused the discrepancy (i.e. response code sent by ITL or STL in a web service request).
4. In the event of a failure to terminate the transaction, an inconsistency with the ITL or STL will be detected during the subsequent reconciliation process. The ITL or STL will then block any transaction involving the related blocks. The status of the blocks will afterwards be corrected manually by the registry administrator with the help of a manual intervention function. This intervention will be logged automatically in the registry. If no inconsistencies are detected during the next reconciliation process with the ITL or STL, the related unit blocks will be unblocked so that further transactions with these blocks will be possible.
The measures to prevent or handle communication problems with the ITL or STL are:
1. In case of communication or connection problems (response message of web service, time-out or negative acknowledgement of the message), if this problem continues after some retries, the transaction stays pending to avoid inconsistent transaction statuses between the registry and ITL or STL. In this case the registry operator can retry the message manually after fixing the connection problem or he can start a rollback of the transaction manually (only if there is no automatic deletion of the transaction by the ITL or STL).
2. Deletion of transactions after 24 hours upon request by STL.
To prevent the reoccurrence of any type of discrepancies, the following measures will be taken by the technical staff of the Greek registry service administrator:
1. Locate the error (error hypothesis, repetition of the steps in the test environments if necessary, contact with the European ITL/STL helpdesk, isolation of individual processes to identify the factor causing the error).
2. Check the related part of the data exchange standards for registry systems under the Kyoto Protocol, technical specifications (current version).
3. If necessary: correction of the error.
4. Regression test on the test system.
5. Implementation of the corrected software version in the productive system.
5th NATIONAL COMMUNICATION TO THE UNFCCC 109 3.4.4 Security measures
The security features comprise those features that ensure the protection of the product against intervention from outside.
Every user of the system is identified by an unambiguous Login name and authenticated via a personal password of at least 8 characters and must contain at least three of the four categories: small letters, capital letters, numbers and special characters. Passwords are stored with the help of one-way coding, which ensures that the plain text of the passwords cannot be viewed by anyone (not even by administrators).
The identification and authentication take place before any other interaction with the system. Queries referred to the system via the WEB Services defined in the specification are authenticated by means of certificates.
The system manages access rights to those objects that are subject to administrative rights (accounts and installations) for each user and for a particular role to the user. Only users with the role "Register Administrator" are authorised to set up, delete or change these objects and to assign access rights themselves. Users with the role "Operator of an installation" are only allowed to view their own objects. Changes to the account balance are only possible indirectly through the initiation of transactions. Further roles are possible according to the specification. With each access to an object or with the initiation of transactions, it is first verified whether the user has the corresponding rights.
Authentication attempts and access to objects are correspondingly logged with the Login name or ID, date and time, type of access as well as success or failure of the access (“Audit Trailing“). With authentification attempts, the identification of the client (IP-address) is also logged. The system provides corresponding tools with which the above mentioned logs can be analysed (filter by user, time range and type of access).
Apart from the measures within the software for the identification and authentication of authorised users (described in the previous section), the following technical and organisational measures are also in place, in order to prevent access to the data by third parties:
• SSL-based encoding of the data transmission in the WEB and user authentication to gain entry to the system.
• Employment of continuously updated virus-scanner software on the servers and the clients of the registry administration.
• Continuous security updates of the system software, multi-stage access control for the staff of the computer centre, which is located in Austria (the IT part of Greek registry is located in Vienna, Austria, operating by Smart Technologies GmbH via a Hosting Contract with the NCESD):
° Duty of identification when entering the premises.
° Electronic access control before entering the staff offices in the computer centre.
° Security channel in front of the computer rooms.
° Lockable computer rooms.
• Network infrastructure with hardware firewalls of renowned manufacturers and setup of a demilitarised zone for the interfacing of the WEB server with the Internet.
• Continuous check of the firewall logs for attack attempts.
5th NATIONAL COMMUNICATION TO THE UNFCCC 110 • All persons employed in the operation and maintenance of the emission trading registry system has appropriate clauses in their service contracts regarding confidentiality when handling data.
3.4.5 Information publicly available by means of the user interface
The following information for each account is available on request in the week after the account has been created in a registry, and is updated on a weekly basis:
(a) Account holder name: the holder of the account (person, operator, Party);
(b) Alphanumeric identifier: the identifier specified by the account holder assigned to each account;
(c) Name, address, city, postcode, country, telephone number, facsimile number and email address of the primary and secondary authorised representatives of the account specified by the account holder for that account.
The following additional information for each operator holding account is available on request in the week after the account has been created in the registry, and is updated on a weekly basis:
(a) Installation parent company, installation subsidiary company and EPER (European Pollutant Emission Register) identification;
(b) Permit identification code: the code assigned to the installation related to the operator holding account comprising the elements set out in Annex VI, Regulation (EC) No 2216/2004 of the European Commission;
(c) Installation identification code: the code assigned to the installation related to the operator holding account comprising the elements set out in Annex VI, Regulation (EC) No 2216/2004 of the European Commission;
(d) Allowances and any force majeure allowances allocated to the installation related to the operator holding account, which is part of the national al-location plan table or is a new entrant, under Article 11 of Directive 2003/87/EC of the European Commission.
The following additional information for each operator holding account for the years 2005 onwards is available on request in accordance with the following specified dates:
(a) Verified emissions figure for the installation related to the operator holding account for year X is displayed from 15 May onwards of year (X+1);
(b) Allowances surrendered pursuant to Articles 52, 53 and 54, by unit identification code, for year X are displayed from 15 May onwards of year (X+1);
(c) A symbol identifying whether the installation related to the operator holding account is or is not in breach of its obligation under Article 6(2)(e) of Directive 2003/87/EC of the European Commission for year X is displayed from 15 May onwards of year (X+1).
The following holding and transaction information, by unit identification code comprising the elements set out in Annex VI, Regulation (EC) No 2216/2004 of the European Commission, relevant for that registry for the years 2005 onwards is available on request in accordance with the following specified dates:
5th NATIONAL COMMUNICATION TO THE UNFCCC 111 (a) The total quantity of ERUs, CERs, AAUs and RMUs held in each account (person holding, operator holding, Party holding, cancellation, re-placement or retirement) on 1 January of year X is displayed from 15 January onwards of year (X+5);
(b) The total quantity of AAUs issued in year X on the basis of the assigned amount pursuant to Article 7 of Decision No 280/2004/EC of the European Commission is displayed from 15 January onwards of year (X+1);
(c) The total quantity of ERUs issued in year X on the basis of project activity implemented pursuant to Article 6 of the Kyoto Protocol is displayed from 15 January onwards of year (X+1);
(d) The total quantity of ERUs, CERs, AAUs and RMUs acquired from other registries in year X and the identity of the transferring accounts and registries is displayed from 15 January onwards of year (X+5);
(e) The total quantity of RMUs issued in year X on the basis of each activity under Article 3, paragraphs 3 and 4 of the Kyoto Protocol is displayed from 15 January onwards of year (X+1);
(f) The total quantity of ERUs, CERs, AAUs and RMUs transferred to other registries in year X and the identity of the acquiring accounts and registries is displayed from 15 January onwards of year (X+5);
(g) The total quantity of ERUs, CERs, AAUs and RMUs cancelled in year X on the basis of activities under Article 3, paragraphs 3 and 4 of the Kyoto Protocol is displayed from 15 January onwards of year (X+1);
(h) The total quantity of ERUs, CERs, AAUs and RMUs cancelled in year X following determination by the compliance committee under the Kyoto Protocol that the Party is not in compliance with its commitment under Article 3, paragraph 1 of the Kyoto Protocol is displayed from 15 January onwards of year (X+1);
(i) The total quantity of other ERUs, CERs, AAUs and RMUs, or allowances, cancelled in year X and the reference to the Article pursuant to which these Kyoto units or allowances were cancelled under Regulation (EC) No 2216/2004 of the European Commission is displayed from 15 January onwards of year (X+1);
(j) The total quantity of ERUs, CERs, AAUs, RMUs and allowances retired in year X is displayed from 15 January onwards of year (X+1);
(k) The total quantity of ERUs, CERs, AAUs carried over in year X from the previous commitment period is displayed from 15 January onwards of year (X+1);
(l) The total quantity of allowances from the previous commitment period cancelled and replaced in year X is displayed from 15 May onwards of year X;
(m)Current holdings of ERUs, CERs, AAUs and RMUs in each account (person holding, operator holding, Party holding, cancellation or retirement) on 31 December of year X are displayed from 15 January onwards of year (X+5).
The total number of CERs and ERUs which operators are allowed to use for each period pursuant to Article 11a (1) of Directive 2003/87/EC of the European Commission is available on request in accordance with Article 30 (3) of Directive 2003/87/EC of the European Commission.
The commitment period reserve, calculated in accordance with Decision 18/CP.7 of the Conference of the Parties to the UNFCCC as 90 % of the Party's assigned amount or 100 % of five times its most recently reviewed inventory, whichever is lowest, and the number of
5th NATIONAL COMMUNICATION TO THE UNFCCC 112 Kyoto units by which the Party is exceeding, and therefore in compliance with, its commitment period reserve is available on request.
In the registry interface account information provided through the corresponding Web site of CITL (http://www.ghg.greekregistry.eu/, http://ec.europa.eu/environment/ets/). The information were provided through the Web site of UNFCCC (SEF 2009) (http://www.ghg.greekregistry.eu/,http://unfccc.int/national_reports/annex_i_ghg_inventories/national_inventories_submissions/items/4771.php). The Information does not include current holdings of ERUs, CERs, AAUs and RMUs in each account because this is confidential according to EU Registry Regulation No 916/2007/EC.
3.4.6 Safeguard and Recovery of Data
The safety features comprise those characteristics that ensure the safety of the system. Hence, those features limit the possibility of damage following a software error or system failure. Therefore, the following measures are implemented:
• All database transactions are logged with database resources. These "Database-Logs" are secured together with the daily data backup and enable, after a system crash, a continuous and consistent restoration of the data stock up to the last completed transaction before the crash. Database logs reside on a different hardware RAID system. Therefore they should not be affected by a system failure on the database server itself.
• Daily incremental and weekly total backups of the whole system. This enables a fast recovery of individual servers ("Disaster Recovery").
• The backup hardware (tape robot) is located separately from the computer hardware. With that, even following a destruction of the computer room, e.g. due to fire, the data stock is protected. Based on the above described measures, the data recovery can be executed in the following way: If the database has been corrupted due to a hardware or software failure, the system and the data are recovered from the latest backup tape onto the repaired or replaced hardware. If the database logs can be restored from the RAID system, a data recovery up to the last completed transaction before the crash is carried out. Only if database logs are lost, the data can be recovered only up to the time of last night’s backup before the system crash.
The stability features comprise defined characteristics providing information about the reliability and availability of the system.
• Power supply from the public power supply network through two separate feeding points.
• Uninterruptible power supply on battery basis.
• Guarantee of the supply through diesel emergency power aggregate in the event of prolonged failure of the public power supply network.
• All servers (Database, Application Server and WEB Server) exist two-folded.
• All essential hardware components of the server are implemented with redundancy (power supply, multiprocessor, hard-disks RAID). In the event of a failure of one component, operation is still possible with reduced performance. If necessary, the components can be exchanged while the operation is in progress without any interruption of the operation.
• The interfacing to the Internet takes place via WAN Ports implemented with redundancy in different locations. The WAN Ports are connected via separate routes to two different telephone exchanges. Interconnection with the two telephone exchanges is ensured
5th NATIONAL COMMUNICATION TO THE UNFCCC 113 via backbone networks of different providers. Regarding the choice of providers, attention was paid to the fact that their back-bone networks are as independent of each other as possible.
• The database servers are operated as a cluster. This guarantees fast switchover.
• The WEB and Application servers are operated with Load Balancing and Fail Over. Therefore, in the event of a failure of one of the two servers, uninterrupted operation can be guaranteed. This con-cept also ensures simple scalability with increased demands (e.g. an increase in the number of accesses to the system).
• All important services are monitored 24 x 7 hours to permit the timely detection of errors. WEB service monitoring takes place by including the Internet interface.
3.4.7 Procedures results
The Greek registry carried out tests in the context of the connection to the International Transaction Log (ITL). On 10 September 2008, the Greek national registry received the official authorization to go-live with the ITL via e-mail (see Annex IV). In October 2008, the Greek national registry went live with the ITL within the framework of the coordinated EU ETS go-live process.
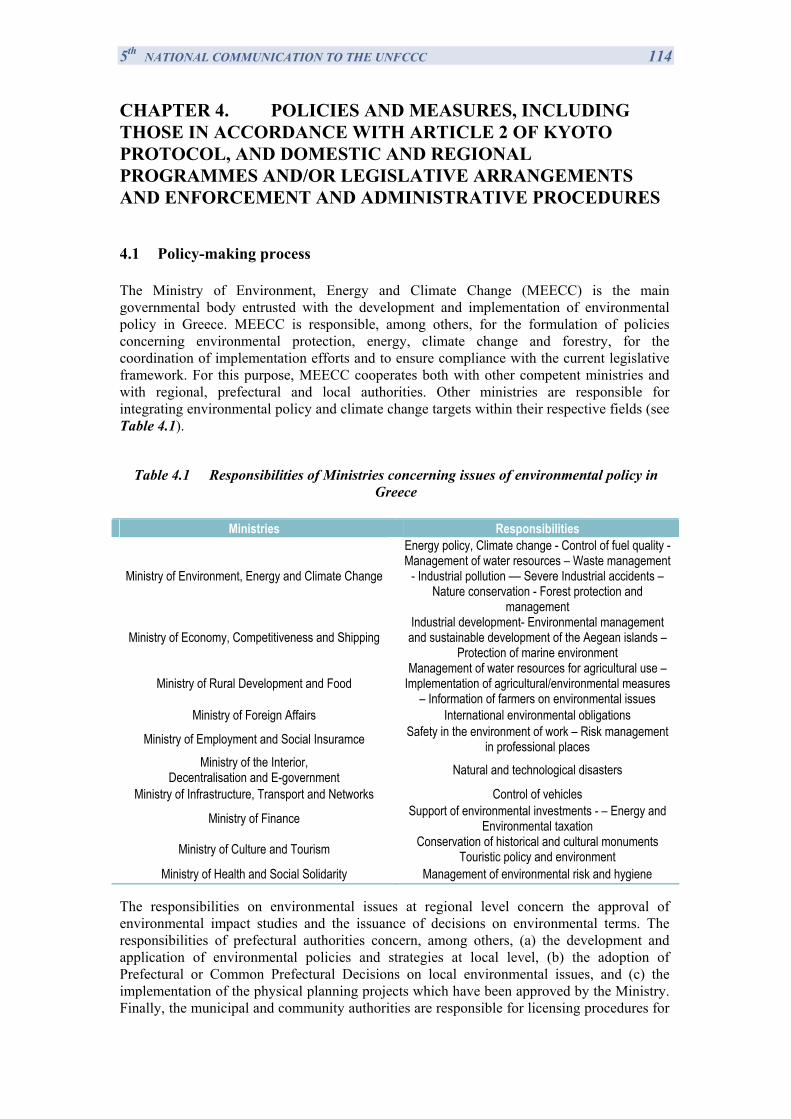
5th NATIONAL COMMUNICATION TO THE UNFCCC 114 CHAPTER 4. POLICIES AND MEASURES, INCLUDING THOSE IN ACCORDANCE WITH ARTICLE 2 OF KYOTO PROTOCOL, AND DOMESTIC AND REGIONAL PROGRAMMES AND/OR LEGISLATIVE ARRANGEMENTS AND ENFORCEMENT AND ADMINISTRATIVE PROCEDURES
4.1 Policy-making process
The Ministry of Environment, Energy and Climate Change (MEECC) is the main governmental body entrusted with the development and implementation of environmental policy in Greece. MEECC is responsible, among others, for the formulation of policies concerning environmental protection, energy, climate change and forestry, for the coordination of implementation efforts and to ensure compliance with the current legislative framework. For this purpose, MEECC cooperates both with other competent ministries and with regional, prefectural and local authorities. Other ministries are responsible for integrating environmental policy and climate change targets within their respective fields (see Table 4.1).
Table 4.1 Responsibilities of Ministries concerning issues of environmental policy in Greece
Ministries Responsibilitiesz Ministries Responsibilities
Ministry of Environment, Energy and Climate Change
Energy policy, Climate change - Control of fuel quality - Management of water resources – Waste management
- Industrial pollution –– Severe Industrial accidents – Nature conservation - Forest protection and
management
Ministry of Economy, Competitiveness and Shipping Industrial development- Environmental management and sustainable development of the Aegean islands –
Protection of marine environment
Ministry of Rural Development and Food Management of water resources for agricultural use –
Implementation of agricultural/environmental measures – Information of farmers on environmental issues
Ministry of Foreign Affairs International environmental obligations
Ministry of Employment and Social Insuramce Safety in the environment of work – Risk management in professional places
Ministry of the Interior, Decentralisation and E-government Natural and technological disasters
Ministry of Infrastructure, Transport and Networks Control of vehicles
Ministry of Finance Support of environmental investments - – Energy and Environmental taxation
Ministry of Culture and Tourism Conservation of historical and cultural monuments Touristic policy and environment
Ministry of Health and Social Solidarity Management of environmental risk and hygiene The responsibilities on environmental issues at regional level concern the approval of environmental impact studies and the issuance of decisions on environmental terms. The responsibilities of prefectural authorities concern, among others, (a) the development and application of environmental policies and strategies at local level, (b) the adoption of Prefectural or Common Prefectural Decisions on local environmental issues, and (c) the implementation of the physical planning projects which have been approved by the Ministry. Finally, the municipal and community authorities are responsible for licensing procedures for
5th NATIONAL COMMUNICATION TO THE UNFCCC 115 buildings in urban areas, including specific industrial installations, as well as for issues related to solid waste disposal on land.
Climate change mitigation is one of the main targets identified in the Greek policy for sustainable development launched by MEECC in 2002. The objective of the strategy is the development of a set of principles for the formulation of an action plan in line with international challenges, and in accordance with EU policy directions and adjusted to the specific national circumstances. The key environmental issues examined in this framework are:
Climate change mitigation
Reduction of air pollutants
Reduction and rational waste management
Rational management of water resources
Prevention of desertification
Protection of biodiversity and ecosystems
Policies and measures, as well as all other issues and actions regarding mitigation are discussed within the framework of an inter-ministerial committee, comprising representatives from all competent Ministries. Final approval of policies and measures related to climate change mitigation rests with the Council of Ministers.
4.2 Domestic and regional programmes and/or legislative arrangements and enforcement and administrative procedures
In response to the emerging evidence that climate change could have a major global impact, the United Nations Framework Convention on Climate Change (henceforth the Convention) was adopted on 9 May 1992 and was opened for signature in Rio de Janeiro in June 1992. Greece signed the Convention in Rio and ratified it in 1994 (Law 2205/94).
In that framework, the third meeting of the Conference of the Parties (COP) to the Convention, held in Kyoto (1-11 December 1997), finalised the negotiations related to the establishment of a legal instrument; the Kyoto Protocol on Climate Change. The Protocol provides a foundation upon which future action can be intensified and introduced, for the first time, legally binding commitments for developed countries to reduce emissions of greenhouse gases. Detailed rules for the implementation of the Protocol were set out at the 7th Conference of the Parties (in Marrakech) and are described in the Marrakech Accords adopted in 2001.
At the first Conference of the Parties serving as the Meeting of the Parties to the Protocol (COP/CMP) held in Montreal (December 2005), the rules for the implementation of the Protocol agreed at COP7 were adopted.
The same COP/CMP established a working group called the Ad Hoc Working Group on Further Commitments for Annex I Parties under the Kyoto Protocol (AWG-KP) to discuss future commitments for industrialized countries under the Kyoto Protocol.
The Conference of the Parties (COP) in 2007, by its decision 1/CP.13 (the Bali Action Plan) launched a comprehensive process to enable the full, effective and sustained implementation of the Convention through long-term cooperative action, now, up to and beyond 2012, to be
5th NATIONAL COMMUNICATION TO THE UNFCCC 116 conducted under a subsidiary body under the Convention, the Ad Hoc Working Group on Long-term Cooperative Action under the Convention (AWG-LCA).
The Protocol entered into force on 16 February 2005, after its ratification from 141 Parties (with the exception of USA and Australia) including developed countries with a contribution of more than 55% to global CO2 emissions in 1990.
With respect to the EU target under the Kyoto Protocol (i.e. reduction of emissions at 8% for the period 2008-2012), EU has stated that this will be achieved jointly by EU Member-States under the provisions of Article 4 of the Protocol. The Burden-Sharing agreement between all Member States was finalized during the Environment Council in June 1998 and entered into force with Decision 2002/358/EC concerning the approval, on behalf of the European Community, of the Kyoto Protocol. According to this agreement, Greece is committed to limit its GHG emissions increase for the period 2008 – 2012 to +25% compared to base year emissions (1990 for CO2, CH4 and N2O emissions – 1995 for F - gases). Since the base year emissions of Greece were 106,987,169 t CO2 eq, the assigned amount was calculated to be 668,669,806 t CO2 eq (5 * 1.25 * base year emissions).
Greece ratified the Kyoto Protocol in 2002 (Law 3017/2002) and adopted a National Programme for achieving its commitment by a decision of the Council of Ministers (DCM5/2003). By Law 3017/2002 the MEECC is designated as the governmental body responsible for the coordination, within its responsibilities, of all other competent ministries and possibly any other public and / or private entities involved, for:
3. the implementation of the provisions of the Kyoto Protocol and
4. the formulation and monitoring of the National Programme for achieving the national targets set under the Kyoto Protocol.
Moreover, with this law it is defined that all issues related to the implementation of the provisions of the Kyoto Protocol, including among others, the establishment of the necessary administrative structures and procedures, enforcement rules, etc. are to be resolved and adopted by Common Ministerial Decisions of the Minister of Environment, Energy and Climate change, and other, as appropriate, competent Ministers. The same procedure is to be followed in order to introduce into the national legislation any decisions of the COP and/or COP/MOP or any necessary modifications to the National Programme.
With the Joint Ministerial Decision 54409/2632/2004, the Directive 2003/87/EC “establishing a scheme for greenhouse gas emission allowance trading within the Community and amending Council Directive 96/61/EC” has been transposed into the Greek legislation. With this Decision, the Ministry of Environment, Energy and Climate Change is designated as the responsible authority for the implementation of the relative provisions. The co-ordination of all competent authorities is assigned to a seven-member inter-ministerial committee comprising members from the MEECC, the Ministry of Finance and the Ministry of Economy, Competitiveness and shipping). The competent authority for the monitoring of the implementation of the provisions of the Directive 2003/87/EC is assigned to the Emissions Trading Office, established in the framework of the above-mentioned Decision, and operating within the Directorate General for the Environment. Finally, with the same Decision the National Centre of Environment and Sustainable Development, an institute supervised by MEECC, is responsible for operating the National Registry. This decision also provides for penalties in the case for non conformity. Any operator who does not surrender sufficient allowances by 30 April of each year to cover its emissions during the preceding year is liable for the payment of an excess emissions penalty. The excess emissions penalty for the period 2008-2012 is100 € for each tonne of carbon dioxide equivalent emitted by that installation, for which the operator has not surrendered allowances. Payment of the excess emissions penalty does not release the operator from the obligation to surrender an amount of
5th NATIONAL COMMUNICATION TO THE UNFCCC 117 allowances equal to those excess emissions when surrendering allowances in relation to the following calendar year. Other penalties such as fines of the range of 1500 to 3000 € and / or temporary ban of operation are inflicted to operators applicable to infringements related to GHG emissions permit, emissions monitoring and submission of ETS reports, etc.
The Joint Ministerial Decision 9267/468/207 designated the Emissions Trading Office as National Authority (DNA) for CDM and Focal Point (DFP) for approving projects pursuant to Article 6, paragraph 1(a).
As already mentioned, the Ministry of Environment, Energy and Climate Change (MEECC) is responsible for the monitoring of the implementation of policies and measures for achieving of the national targets set under the Kyoto Protocol. A reporting template provided by EU (developed by the EEA's European Topic Centre on Air and Climate Change) is used for the monitoring and evaluation of policies and measures, along with additional working files in spreadsheet format. The reporting template is in a spreadsheet format and is organized in working sheets related to information and data about: GHG projections, projection parameters and indicators, policies and measures, summary of results, consistency checks, graphs, etc, as required under Article 3(2) of the Monitoring Mechanism Decision (EU Commission Decision 280/2004/EC) and elaborated in Articles 8, 9 and 10 of the Implementing Provisions (EU Commission Decision 2005/166/EC) and UNFCCC reporting guidelines for national communications (FCCC/CP/1999/7).
Information about policies and measures for the reduction of GHG emissions, GHG inventory and projections, legislative arrangements and enforcement and administrative procedures that are in place to meet the national commitments under the Kyoto Protocol are publicly accessible through the following web links:
1. http://www.minenv.gr/4/41/g4130.html (official website of Ministry of
Environment, Energy and Climate Change, containing information about national GHG inventories, legislation, emission trading system, national allocation plans, etc, available in greek language).
2. http://www.ghg.greekregistry.eu/ (official website of Greek Registry linked to EU's Community Independent Transaction Log (CITL), available in greek and english).
3. http://unfccc.int/national_reports/annex_i_ghg_inventories/national_inventories_submissions/items/4771.php (UNFCCC website, containing GHG inventories and NC).
4. Information provided through EU’s websites as
http://cdr.eionet.europa.eu/gr/eu/ghgmm http://dataservice.eea.europa.eu/PivotApp/pivot.aspx?pivotid=475, http://dataservice.eea.europa.eu/pivotapp/pivot.aspx?pivotid=473
4.2.1 Activities under articles 3.3 and 3.4 of Kyoto Protocol
The Presidential Decree of 19-11-1928 "On forest management, felling regulations, forest taxation and rent, disposal of products, resin collection and resin cultivation etc." regulates legislatively sustainable forest management. By this decree, the principle of sustainability is adopted in its simple form, i.e. sustainable yield. However, the management of Greek forests based on sustainable yield started after the Ministry of Agriculture issued circular No 120094/499/1937.
5th NATIONAL COMMUNICATION TO THE UNFCCC 118 With circular 958/1953 by the Ministry of Agriculture, sustainability in management practices extends to all functions and services derived from forests. This circular also introduces instructions on how to make a Management plan.
The 1975 Constitution of the 3rd Hellenic Republic (articles 24 and 117), Law Decree 86/1969, and Laws 998/1979 and 3208/2003 constitute the legal framework of the country for the protection and management of forest and other wooded land.
Law Decree 86/1969 codified almost all the laws that had been issued since 1928 and had been amended and completed by Law 4173/1929. This law constitutes the Forest Code of the country and regulates matters concerning protection, management, ownership rights on forest land, taxation, exploitation of state and privately-owned forests, forest improvement works etc. The Forest Code continues up to now to constitute the basic body of forestry legislation.
Law 998/1979 "On the protection of the country's forest and other wooded land" determines the specific protection measures concerning maintenance, development and improvement of country’s forests and other forest lands.
Forest law 3208/2003 stresses the principles of sustainability, conservation of biodiversity and multiple uses of forest lands. Special measures have to be taken for the protection of the landscape and conservation of biodiversity during the management planning and utilization of forest ecosystems (art. 2 par. 1).
Therefore, activities under art. 3.3 and 3.4 of Kyoto Protocol have to comply with the provisions of the above mentioned laws and thus contribute to the conservation of biodiversity and sustainable use of natural resources.
5th NATIONAL COMMUNICATION TO THE UNFCCC 119 4.3 Policies and measures and their effect
4.3.1 Supporting Policies for the restriction of GHG emissions
In this chapter a short overview of the most important supporting policies and tools which are related with the implementation of measures for the restriction of GHG emissions in Greece is presented. Emphasis is given to the 2nd National Climate Change Program which aims in the restriction of emissions in the time horizon of 2010, in the European Common and Coordinated policies and measures framework, in the establishment of emissions trading system since 2005, and in the financing mechanisms and fiscal measures that have been developed to support the implementation of projects which inter alia also contribute to the restriction of GHG emissions.
4.3.1.1 2nd National Climate Change Program
The 2nd National Climate Change Programme, that was elaborated and adopted in 2002 (approved by Act of the Ministerial Council 5/27.02.2003, Official Journal of the Hellenic Republic Α' 58 – 05.03.2003) defines the additional policies and measures necessary for Greece to meet its Kyoto target, i.e., restricting the increase of GHG emissions to 25% over the time period 2008–2012, compared to base year emissions.
The 2nd National Program has been presented in detail in the 3rd and 4th National Communication on Climate Change. The main actions foreseen include:
Further penetration of natural gas in all final demand energy sectors as well as in power generation, including co-generation.
Promotion of renewable energy sources (RES) for electricity and heat production.
Promotion of energy saving measures in industry and in the residential – tertiary sectors.
Promotion of energy efficient appliances and energy equipment in the residential – tertiary sectors.
Structural changes in agriculture and in chemical industry.
Emission reduction actions in transport and waste management sectors.
4.3.1.2 European common and coordinated policies and measures
The European common and coordinated policies and measures (CCPM) constitute a legislative framework that supports and set the targets of the respective national policies for the restriction of GHG emissions. A list of CCPM is presented in Table 4.2. Moreover, the EU adopted an integrated energy and climate change policy “package” in December 2008, including ambitious targets for 2020. It hopes to set Europe on the right track - towards a sustainable future with a low-carbon, energy-efficient economy - by:
• cutting greenhouse gases by 20% (30% if international agreement is reached)
5th NATIONAL COMMUNICATION TO THE UNFCCC 120
• reducing energy consumption by 20% through increased energy efficiency
• meeting 20% of our energy needs from renewable sources.
The package has to be adopted by 2011 at the latest. As a result the list of CCPM of Table 4.2 will be amended and new directives and /or regulations may be added.
Concerning the energy end-use efficiency and energy services directive 2006/32/EC, an Energy Efficiency National Action Plan is required. This plan constitutes a valuable supporting policy and tool for the restriction of GHG emissions, which illustrates the policies and measures that need to be implemented in order to fulfill the targets set by the directive, namely reduction of 9% of end-use energy consumption for the period 2008-2016 compared to the average of 2001-2005.
The Greek Action plan is comprised of horizontal, intersectoral and measures focusing to the residential, tertiary (public and private), non-ETS industry and transport sector. These measures are presented in Table 4.3.
Table 4.2 European common and coordinated policies and measures (CCPM)
CCPM Sector
Efficiency of hot water boilers 92/42/EEC Energy consumption
Promotion of cogeneration 2004/8/EC Energy supply
Promotion of electricity from RE sources 2001/77/EC Energy supply
Energy performance of buildings 2002/91/EC Energy consumption
Eco-management & audit scheme (EMAS) EC 761/2001 Energy consumption
Agreement with car manufacturers ACEA etc. Transport
Landfill directive 1999/31/EC Waste
Emissions trading 2003/87/EC Cross-cutting
Directives on energy labelling of appliances Energy consumption
Promotion of biofuels for transport 2003/30/EC Transport
Kyoto Protocol project mechanisms 2004/101/EC Cross-cutting
Integrated pollution prevention and control 96/61/EC Cross-cutting
Taxation of energy products 2003/96/EC Energy supply
Internal electricity market 2003/54/EC Energy supply
Internal market in natural gas 98/30/EC Energy supply
Ecodesign requirements for energy-using products 2005/32/EC Energy consumption
End-use efficiency and energy services 2006/32/EC Energy consumption
Energy labelling for office equipment 2422/2001 Energy consumption
Efficiency fluorescent lighting 2000/55/EC Energy consumption
Motor challenge, voluntary EC programme Energy consumption
Transport modal shift to rail 2001/12/EC etc. Transport
Consumer information on cars 1999/94/EC Transport
Marco Polo programme on freight transport Transport
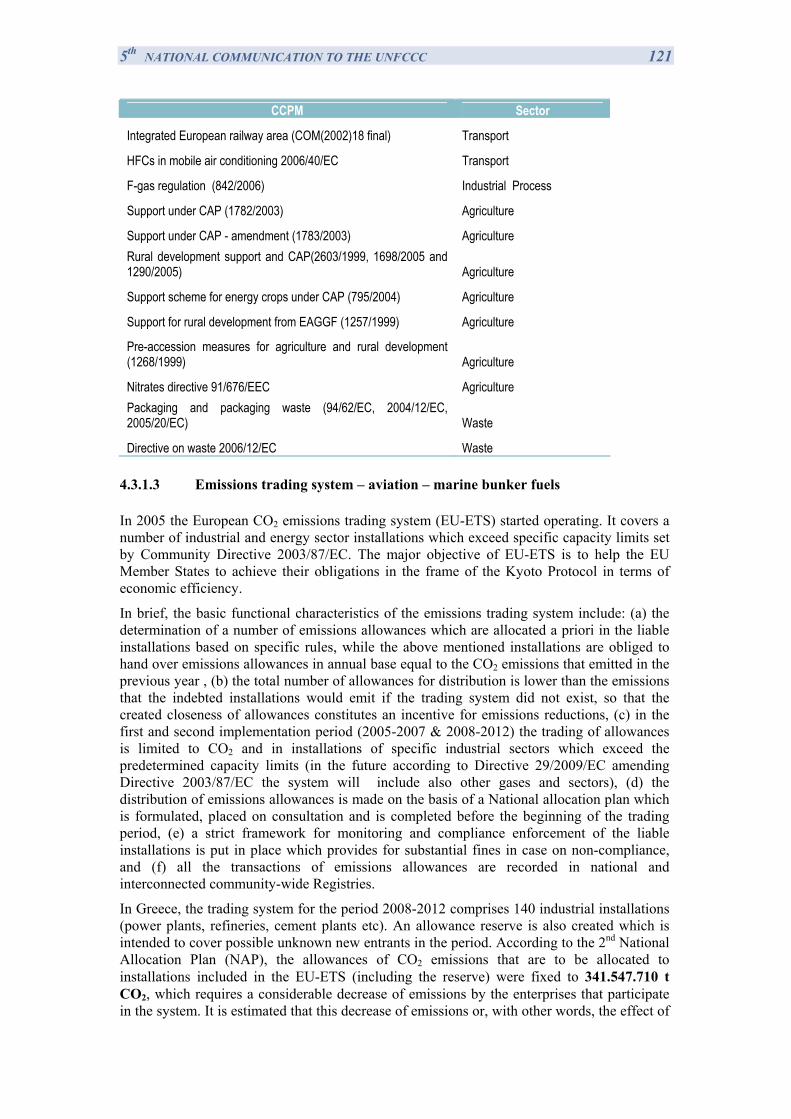
5th NATIONAL COMMUNICATION TO THE UNFCCC 121
CCPM Sector
Integrated European railway area (COM(2002)18 final) Transport
HFCs in mobile air conditioning 2006/40/EC Transport
F-gas regulation (842/2006) Industrial Process
Support under CAP (1782/2003) Agriculture
Support under CAP - amendment (1783/2003) Agriculture Rural development support and CAP(2603/1999, 1698/2005 and 1290/2005) Agriculture
Support scheme for energy crops under CAP (795/2004) Agriculture
Support for rural development from EAGGF (1257/1999) Agriculture
Pre-accession measures for agriculture and rural development (1268/1999) Agriculture
Nitrates directive 91/676/EEC Agriculture Packaging and packaging waste (94/62/EC, 2004/12/EC, 2005/20/EC) Waste
Directive on waste 2006/12/EC Waste 4.3.1.3 Emissions trading system – aviation – marine bunker fuels
In 2005 the European CO2 emissions trading system (EU-ETS) started operating. It covers a number of industrial and energy sector installations which exceed specific capacity limits set by Community Directive 2003/87/EC. The major objective of EU-ETS is to help the EU Member States to achieve their obligations in the frame of the Kyoto Protocol in terms of economic efficiency.
In brief, the basic functional characteristics of the emissions trading system include: (a) the determination of a number of emissions allowances which are allocated a priori in the liable installations based on specific rules, while the above mentioned installations are obliged to hand over emissions allowances in annual base equal to the CO2 emissions that emitted in the previous year , (b) the total number of allowances for distribution is lower than the emissions that the indebted installations would emit if the trading system did not exist, so that the created closeness of allowances constitutes an incentive for emissions reductions, (c) in the first and second implementation period (2005-2007 & 2008-2012) the trading of allowances is limited to CO2 and in installations of specific industrial sectors which exceed the predetermined capacity limits (in the future according to Directive 29/2009/EC amending Directive 2003/87/EC the system will include also other gases and sectors), (d) the distribution of emissions allowances is made on the basis of a National allocation plan which is formulated, placed on consultation and is completed before the beginning of the trading period, (e) a strict framework for monitoring and compliance enforcement of the liable installations is put in place which provides for substantial fines in case on non-compliance, and (f) all the transactions of emissions allowances are recorded in national and interconnected community-wide Registries.
In Greece, the trading system for the period 2008-2012 comprises 140 industrial installations (power plants, refineries, cement plants etc). An allowance reserve is also created which is intended to cover possible unknown new entrants in the period. According to the 2nd National Allocation Plan (NAP), the allowances of CO2 emissions that are to be allocated to installations included in the EU-ETS (including the reserve) were fixed to 341.547.710 t CO2, which requires a considerable decrease of emissions by the enterprises that participate in the system. It is estimated that this decrease of emissions or, with other words, the effect of
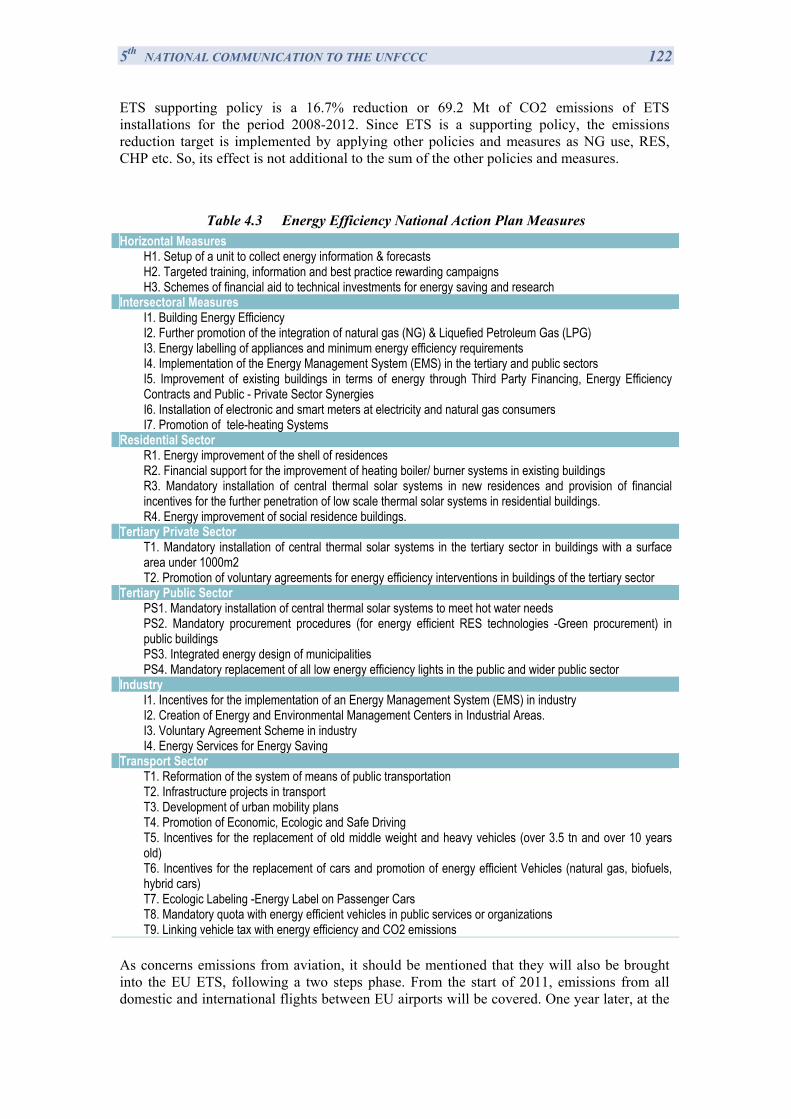
5th NATIONAL COMMUNICATION TO THE UNFCCC 122 ETS supporting policy is a 16.7% reduction or 69.2 Mt of CO2 emissions of ETS installations for the period 2008-2012. Since ETS is a supporting policy, the emissions reduction target is implemented by applying other policies and measures as NG use, RES, CHP etc. So, its effect is not additional to the sum of the other policies and measures.
Table 4.3 Energy Efficiency National Action Plan Measures Horizontal Measures
H1. Setup of a unit to collect energy information & forecasts H2. Targeted training, information and best practice rewarding campaigns H3. Schemes of financial aid to technical investments for energy saving and research
Intersectoral Measures I1. Building Energy Efficiency I2. Further promotion of the integration of natural gas (NG) & Liquefied Petroleum Gas (LPG) I3. Energy labelling of appliances and minimum energy efficiency requirements I4. Implementation of the Energy Management System (EMS) in the tertiary and public sectors I5. Improvement of existing buildings in terms of energy through Third Party Financing, Energy Efficiency Contracts and Public - Private Sector Synergies I6. Installation of electronic and smart meters at electricity and natural gas consumers I7. Promotion of tele-heating Systems
Residential Sector R1. Energy improvement of the shell of residences R2. Financial support for the improvement of heating boiler/ burner systems in existing buildings R3. Mandatory installation of central thermal solar systems in new residences and provision of financial incentives for the further penetration of low scale thermal solar systems in residential buildings. R4. Energy improvement of social residence buildings.
Tertiary Private Sector T1. Mandatory installation of central thermal solar systems in the tertiary sector in buildings with a surface area under 1000m2 T2. Promotion of voluntary agreements for energy efficiency interventions in buildings of the tertiary sector
Tertiary Public Sector PS1. Mandatory installation of central thermal solar systems to meet hot water needs PS2. Mandatory procurement procedures (for energy efficient RES technologies -Green procurement) in public buildings PS3. Integrated energy design of municipalities PS4. Mandatory replacement of all low energy efficiency lights in the public and wider public sector
Industry I1. Incentives for the implementation of an Energy Management System (EMS) in industry I2. Creation of Energy and Environmental Management Centers in Industrial Areas. I3. Voluntary Agreement Scheme in industry I4. Energy Services for Energy Saving
Transport Sector T1. Reformation of the system of means of public transportation T2. Infrastructure projects in transport T3. Development of urban mobility plans T4. Promotion of Economic, Ecologic and Safe Driving T5. Incentives for the replacement of old middle weight and heavy vehicles (over 3.5 tn and over 10 years old) T6. Incentives for the replacement of cars and promotion of energy efficient Vehicles (natural gas, biofuels, hybrid cars) T7. Ecologic Labeling -Energy Label on Passenger Cars T8. Mandatory quota with energy efficient vehicles in public services or organizations T9. Linking vehicle tax with energy efficiency and CO2 emissions
As concerns emissions from aviation, it should be mentioned that they will also be brought into the EU ETS, following a two steps phase. From the start of 2011, emissions from all domestic and international flights between EU airports will be covered. One year later, at the
5th NATIONAL COMMUNICATION TO THE UNFCCC 123 start of 2012, the scope will be expanded to cover emissions from all international flights – from or to anywhere in the world – that arrive at or depart from an EU airport. More information can be found at: http://ec.europa.eu/environment/climat/aviation_en.htm.
Regarding GHG emissions from international shipping, Greece
actively participates in all formal and informal meetings (sessions, working groups, correspondence groups and informal consultation processes), within the framework of IMO.
has submitted data and statistics, which have been taken into account in the official GHG IMO study of 2009, as regards the contribution of maritime sector.
has also participated, as a member, in the Steering Committee, which has been assigned to supervise the work of the International Consortium that carried out the above-mentioned study.
4.3.1.4 Financing mechanisms
The funding for the support of policies that either straightforward or inter alia contribute in the restriction of GHG emissions is drew from financing mechanisms that in a big extent have been developed in the frame of the Community Support Frameworks.
The Operational Programme for Energy (OPE), managed by the former Ministry of Development, drew funds from the 2nd Community Support Framework which ended on December 31, 2002, to grant public aid to projects with a total budget of Euro 1.061 billion. The European Regional Development Fund provided 33.8 per cent of that amount and national resources 45.2 percent (including the PPC’s funds) whereas private capital flows made up the remaining 21 percent. A part of the sub-programme 3 addressed the issue of RES promotion.
The Operational Programme Competitiveness (OPC) of the former Ministry of Development, which comes under the 3rd Community Support Framework for the period 2000-2006, constitutes one of the major tools for the promotion of interventions that may lead to GHG emissions reduction. The total budget of OPC amounts to €6.6 billion, of which the community contribution is 2.06 billion €, the Greek public spending €1.29 billion and the private funding €3.32 billion.
The OPC includes 9 priority sectors with 41 measures, which in turn comprise a total of 134 actions. These actions are designed to implement the corresponding policies in the Programme’s areas of intervention. A central feature of the Operational Programme is to support entrepreneurship in such areas as new technologies, the liberalized energy markets, environment, tourism but also to fund actions for business modernization, especially addressed to small and medium-sized enterprises engaged in manufacturing-processing, tourism and the service sectors. Under the OPC, projects are promoted to upgrade industrial regions, the national quality assurance system, energy infrastructures and regional structures providing information, consultation, education and management support to businesses.
As reported analytically below, the OPC aimes to finance or co-finance the further development of infrastructure for the penetration of natural gas (through interconnections with networks of natural gas of neighboring countries, further development of local networks, etc.) and RES into the electricity system (through the development of special energy infrastructures, interconnection of island grids, upgrading of electric transmission networks, etc.). It also finances specific investments for energy savings, installation of co-generation
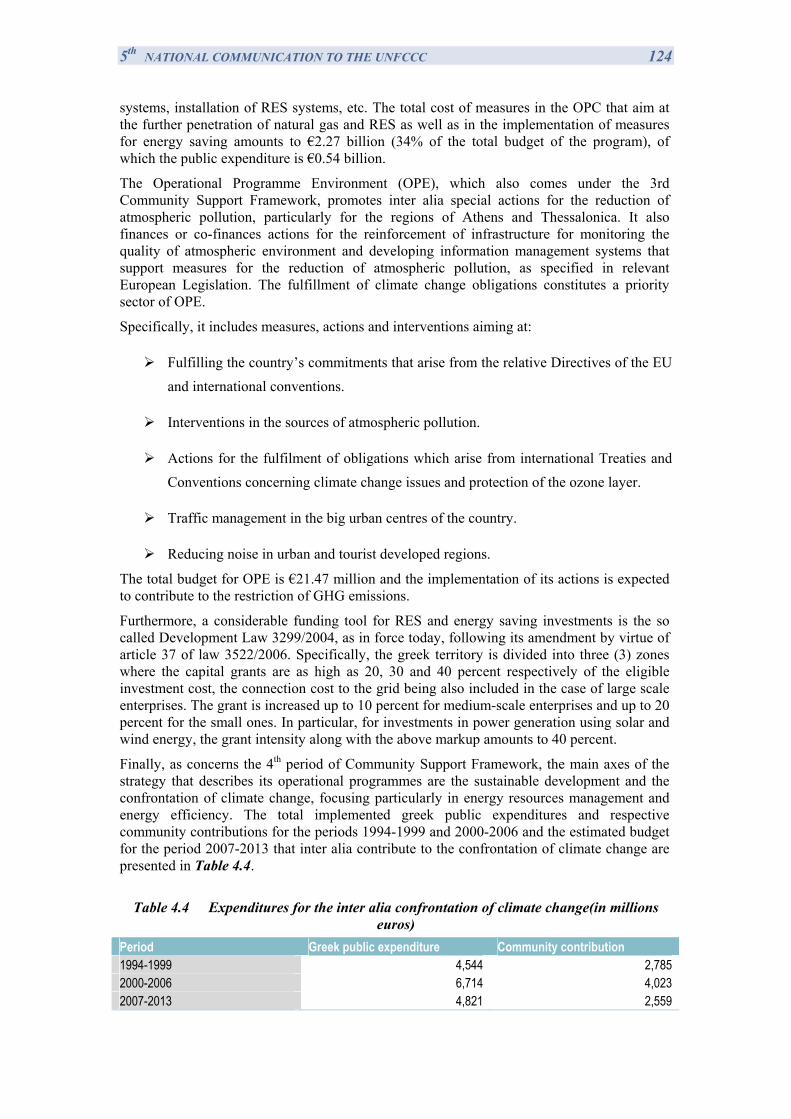
5th NATIONAL COMMUNICATION TO THE UNFCCC 124 systems, installation of RES systems, etc. The total cost of measures in the OPC that aim at the further penetration of natural gas and RES as well as in the implementation of measures for energy saving amounts to €2.27 billion (34% of the total budget of the program), of which the public expenditure is €0.54 billion.
The Operational Programme Environment (OPE), which also comes under the 3rd Community Support Framework, promotes inter alia special actions for the reduction of atmospheric pollution, particularly for the regions of Athens and Thessalonica. It also finances or co-finances actions for the reinforcement of infrastructure for monitoring the quality of atmospheric environment and developing information management systems that support measures for the reduction of atmospheric pollution, as specified in relevant European Legislation. The fulfillment of climate change obligations constitutes a priority sector of OPE.
Specifically, it includes measures, actions and interventions aiming at:
Fulfilling the country’s commitments that arise from the relative Directives of the EU and international conventions.
Interventions in the sources of atmospheric pollution.
Actions for the fulfilment of obligations which arise from international Treaties and Conventions concerning climate change issues and protection of the ozone layer.
Traffic management in the big urban centres of the country.
Reducing noise in urban and tourist developed regions.
The total budget for OPE is €21.47 million and the implementation of its actions is expected to contribute to the restriction of GHG emissions.
Furthermore, a considerable funding tool for RES and energy saving investments is the so called Development Law 3299/2004, as in force today, following its amendment by virtue of article 37 of law 3522/2006. Specifically, the greek territory is divided into three (3) zones where the capital grants are as high as 20, 30 and 40 percent respectively of the eligible investment cost, the connection cost to the grid being also included in the case of large scale enterprises. The grant is increased up to 10 percent for medium-scale enterprises and up to 20 percent for the small ones. In particular, for investments in power generation using solar and wind energy, the grant intensity along with the above markup amounts to 40 percent.
Finally, as concerns the 4th period of Community Support Framework, the main axes of the strategy that describes its operational programmes are the sustainable development and the confrontation of climate change, focusing particularly in energy resources management and energy efficiency. The total implemented greek public expenditures and respective community contributions for the periods 1994-1999 and 2000-2006 and the estimated budget for the period 2007-2013 that inter alia contribute to the confrontation of climate change are presented in Table 4.4.
Table 4.4 Expenditures for the inter alia confrontation of climate change(in millions
euros) Period Greek public expenditure Community contribution 1994-1999 4,544 2,785 2000-2006 6,714 4,023 2007-2013 4,821 2,559
5th NATIONAL COMMUNICATION TO THE UNFCCC 125 4.3.1.5 Fiscal measures
Tax regime of energy products The Directive 2003/96/EC of the Council of 27 October 2003 for restructuring the European Community framework on the taxation of energy products and electricity has been transposed into Greek legislation with Laws 3336/2005 and 3340/2005. In addition, the National Customs Code (Law 2960/2001), as applicable, makes use of the options provided for in such Directive to exonerate, totally or partially, the electricity generated by renewable energy sources, as well as natural gas or biofuel. In particular:
1. Natural gas: the collection of the excise duty is suspended until 1 January 2014.
2. Electric power: the collection of the excise duty for electric power is suspended until 1 January 2010.
3. Biofuel: certain amounts of biodiesel have been relieved from tax on the basis of an annual programme for the period 2005-2007.
The tax regime applicable to hard coal, lignite and coke specifies an excise duty rate of € 0.3/gigajoule starting from 1 January 2007. Reliefs from excise duty for such products concern the following use:
mineralogical processing
exclusively for the generation of electric power
for chemical reduction, electrolytic and metallurgical processing.
In general terms, the excise duty rates for all energy products in Greece range within the levels prescribed by the a.m. Directive. In Table 4.5 the excise duty rates for specified products during the period 2006-2009 according to the National Customs Code is shown.
In the year 2008 the Law 3634/08 amended the National Customs Code, by providing for an equal tax rate for heating gas oil and motor gas oil and introducing an automatic refund system for users of heating gas oil during the heating season, in order to tackle tax fraud.
Registration tax
According to Law 2960/2001 (Article 121), motor vehicles for private use which are imported to Greece, in order to be registered and circulate with Greek plates, are subject to registration tax. The relevant rates are determined on the basis of the cylinder capacity and the anti-pollutant technology of the vehicle. The passenger motor vehicles which are imported in the country and comply with the specifications of Directive 98/69/EC under phase B or of any subsequent Directive under phase 2 are subject to registration tax rates ranging from 5% to 50%, while those complying with the specifications under phase A are subject to rates from 14% to 142%; finally, motor vehicles which comply with the specifications of Directives 94/12/EC, 91/441/EEC, 89/458/EEC and 88/76/EEC are subject to rates from 24% to 334%. Motor vehicles of conventional technology are subject to rates from 37% to 346%.
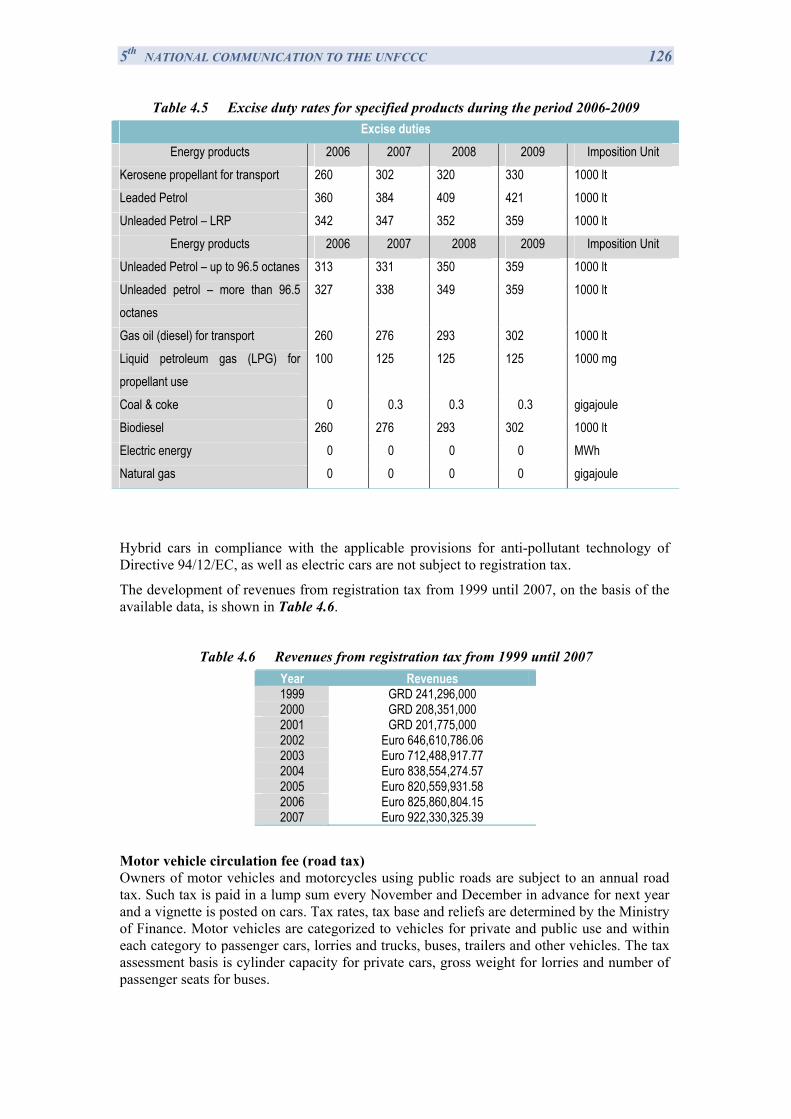
5th NATIONAL COMMUNICATION TO THE UNFCCC 126
Table 4.5 Excise duty rates for specified products during the period 2006-2009 Excise duties
Energy products 2006 2007 2008 2009 Imposition Unit Kerosene propellant for transport 260 302 320 330 1000 lt Leaded Petrol 360 384 409 421 1000 lt Unleaded Petrol – LRP 342 347 352 359 1000 lt
Energy products 2006 2007 2008 2009 Imposition Unit Unleaded Petrol – up to 96.5 octanes 313 331 350 359 1000 lt Unleaded petrol – more than 96.5 octanes
327 338 349 359 1000 lt
Gas oil (diesel) for transport 260 276 293 302 1000 lt Liquid petroleum gas (LPG) for propellant use
100 125 125 125 1000 mg
Coal & coke 0 0.3 0.3 0.3 gigajoule Biodiesel 260 276 293 302 1000 lt Electric energy 0 0 0 0 MWh Natural gas 0 0 0 0 gigajoule
Hybrid cars in compliance with the applicable provisions for anti-pollutant technology of Directive 94/12/EC, as well as electric cars are not subject to registration tax.
The development of revenues from registration tax from 1999 until 2007, on the basis of the available data, is shown in Table 4.6.
Table 4.6 Revenues from registration tax from 1999 until 2007 Year Revenues 1999 GRD 241,296,000 2000 GRD 208,351,000 2001 GRD 201,775,000 2002 Euro 646,610,786.06 2003 Euro 712,488,917.77 2004 Euro 838,554,274.57 2005 Euro 820,559,931.58 2006 Euro 825,860,804.15 2007 Euro 922,330,325.39
Motor vehicle circulation fee (road tax) Owners of motor vehicles and motorcycles using public roads are subject to an annual road tax. Such tax is paid in a lump sum every November and December in advance for next year and a vignette is posted on cars. Tax rates, tax base and reliefs are determined by the Ministry of Finance. Motor vehicles are categorized to vehicles for private and public use and within each category to passenger cars, lorries and trucks, buses, trailers and other vehicles. The tax assessment basis is cylinder capacity for private cars, gross weight for lorries and number of passenger seats for buses.
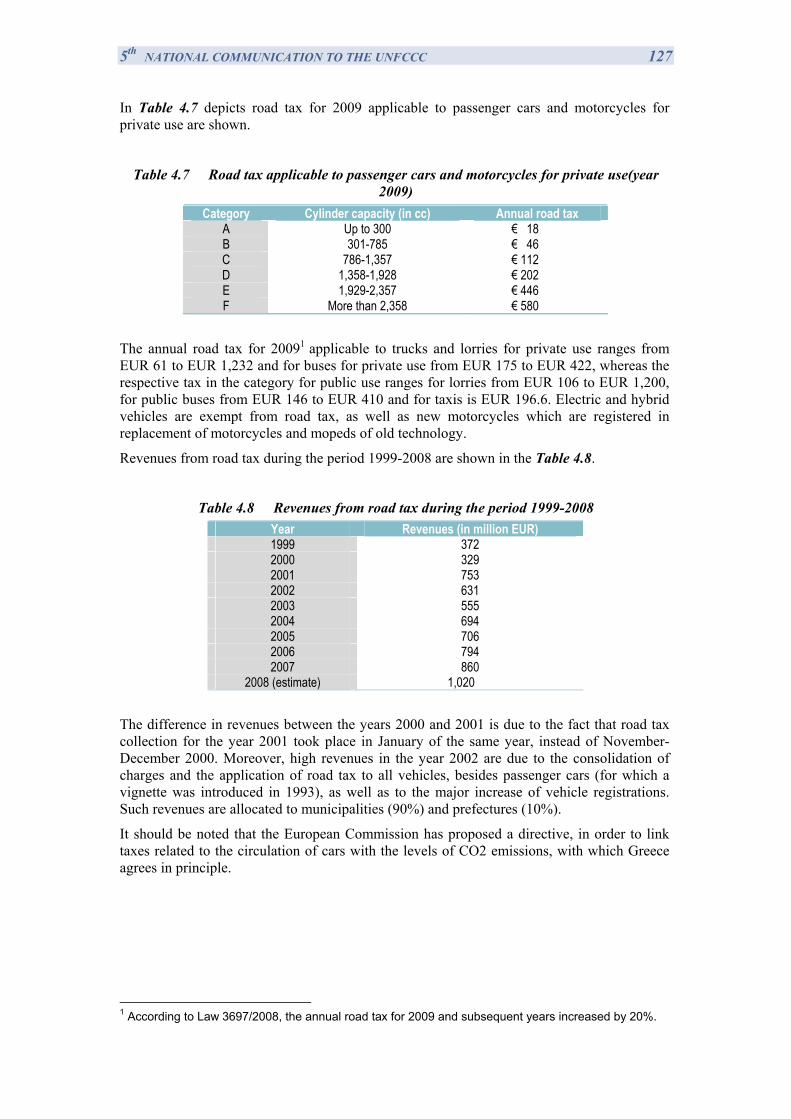
5th NATIONAL COMMUNICATION TO THE UNFCCC 127 In Table 4.7 depicts road tax for 2009 applicable to passenger cars and motorcycles for private use are shown.
Table 4.7 Road tax applicable to passenger cars and motorcycles for private use(year 2009)
Category Cylinder capacity (in cc) Annual road tax A Up to 300 € 18 B 301-785 € 46 C 786-1,357 € 112 D 1,358-1,928 € 202 E 1,929-2,357 € 446 F More than 2,358 € 580
The annual road tax for 20091 applicable to trucks and lorries for private use ranges from EUR 61 to EUR 1,232 and for buses for private use from EUR 175 to EUR 422, whereas the respective tax in the category for public use ranges for lorries from EUR 106 to EUR 1,200, for public buses from EUR 146 to EUR 410 and for taxis is EUR 196.6. Electric and hybrid vehicles are exempt from road tax, as well as new motorcycles which are registered in replacement of motorcycles and mopeds of old technology.
Revenues from road tax during the period 1999-2008 are shown in the Table 4.8.
Table 4.8 Revenues from road tax during the period 1999-2008
The difference in revenues between the years 2000 and 2001 is due to the fact that road tax collection for the year 2001 took place in January of the same year, instead of November-December 2000. Moreover, high revenues in the year 2002 are due to the consolidation of charges and the application of road tax to all vehicles, besides passenger cars (for which a vignette was introduced in 1993), as well as to the major increase of vehicle registrations. Such revenues are allocated to municipalities (90%) and prefectures (10%).
It should be noted that the European Commission has proposed a directive, in order to link taxes related to the circulation of cars with the levels of CO2 emissions, with which Greece agrees in principle.
1 According to Law 3697/2008, the annual road tax for 2009 and subsequent years increased by 20%.
Year Revenues (in million EUR) 1999 372 2000 329 2001 753 2002 631 2003 555 2004 694 2005 706 2006 794 2007 860
2008 (estimate) 1,020
5th NATIONAL COMMUNICATION TO THE UNFCCC 128 Income taxation – Relief and exemptions a) Personal income taxation Since 1 January 2005 20% of the expense paid for converting the fuel installation from oil to natural gas or the installation of natural gas, solar and photovoltaic systems is deducted from the taxpayer’s total income up to an amount of EUR 700.
In particular, such deduction is prescribed under Article 2 par. 2 of Law 3522/2006 in the following cases:
i) for converting the central heating installation from oil into natural gas or for a new natural gas installation;
ii) for replacing the oil boiler with a district heating installation or for a new district heating installation;
iii) for purchasing solar collectors and installing a central air conditioning system with the use of solar energy;
iv) for purchasing decentralized power generation systems, based on Renewable Energy Sources (photovoltaics, small air turbines) and co-generation of power and heating-cooling with the use of natural gas or renewable sources;
v) for thermal insulation in existing buildings.
b) Corporate income taxation Enterprises participating in a collective alternative disposal system (Law 2931/2001) may deduct from their gross income the duties paid by way of fees or dues for such participation. The collective disposal system is defined with a ministerial circular as the mandatory organization on a collective basis, under any legal form, of the collection works, including the warranty, transport, re-use and exploitation of used packaging or packaging waste and other products (e.g. batteries, appliances, telecommunication material etc.). For the approval of such system it is mandatory for the manager to pay a duty by way of fees or dues to the National Organization of Alternative Disposal for Packaging, which is subsequently borne by the enterprises participating in such system.
VAT The Greek VAT Code (Law 2859/2000, Article 29a, as amended by Law 3522/2006) considers the delivery of recyclable waste since 1 January 2007, under certain conditions, as an exemption from VAT, giving a right for deduction. The VAT Code includes in Annex III and, thus, to the reduced VAT rate of 9%, the supply of services related to waste disposal and recycling as well as waste processing, unless they are rendered by government or public entities.
The VAT rates on motor vehicle fuels and energy products are the following: VAT on motor vehicle fuels: 19% in all motor vehicle fuels;
13% in all motor vehicle fuels, when they are
delivered and used for transport within and
between certain islands
VAT on energy products: 9% on energy products (CN 2716) and
natural gas (CN 2711);
5th NATIONAL COMMUNICATION TO THE UNFCCC 129
6% on the above products if they are delivered in
certain islands and from these islands to
mainland Greece.
It should be mentioned that Greece would be favorable to the application of a reduced VAT rate (9%) for environment-friendly goods, provided that a relevant proposal is discussed at EU level and taking into account any special conditions and particular national interests.
4.3.1.6 Local authorities contribution to mitigation of climate change adverse effects
Local authorities have a key role in mitigating climate change, since:
Over half of greenhouse gas emissions are created in and by cities.
80% of the population lives and works in cities, where up to 80% of energy is consumed.
Local authorities, being the closest administration to the citizens are ideally positioned to understand their concerns.
For that reason, the European Commission commenced an ambitious initiative and/or voluntary effort, named “The Covenant of Mayors”, which gives the lead to Europe’s pioneering cities to mitigate climate change through the implementation of intelligent local sustainable energy policies that create stable local jobs, increase citizens’ quality of life and address crucial social issues. The Covenant of Mayors constitutes a formal commitment to go beyond the EU objectives in terms of CO2 reduction, through the implementation of sustainable energy action plans with concrete measures.
Signatories to the Covenant commit to submitting their local Sustainable Energy Action Plans (SEAPs) within the year following adhesion. These cities are then expected to provide periodic public reports outlining the progress of their Action Plans. Cities also commit to allocating sufficient human resources to the tasks, mobilising society in their geographical areas to take part in the implementation of the action plan, including organisation of local energy days, and networking with other cities.
More information about the “The Covenant of Mayors” can be found at the link: http://www.eumayors.eu/. As concerns Greece, till now 19 greek cities (Aigaleo, Ios, Kea, Korthi, Lamia, Likovrisi, Lipsi, Milos, Moudros, Nisyros, Oia, Patras, Poseidonia, Ptolemaida, Serres, Skyros, Sykies, Thermi, Trikala) and 1 supporting network of cities (Network of Aegean Islands for Sustainability, DAFNI) have joined the Covenant.
The mitigation actions of climate change that are planned and executed at a local authority level comprise of:
Traffic studies and reorganization of public transport (use of environment friendly vehicles, etc).
5th NATIONAL COMMUNICATION TO THE UNFCCC 130
Incorporation of RES projects in regional development plans. Introduction of RES systems in public buildings and/or installations running by local authorities. Use of photovoltaic lights for municipal lighting.
Close co-operation with NGOs as WWF, Greenpeace, etc in order to raise public awareness.
Replacement of conventional lamps with energy efficient ones in public buildings.
Use of eco friendly paints and solvents.
Implementation of infrastructure projects and interventions in order to improve energy efficiency in desalination plants and other installations running by local authorities (e.g. reduce consumption of reactive power, energy recovery by turbines installation etc).
Use of tertiary treatment in waste water treatment plants and re-use of effluent for irrigation of croplands instead of using water from desalination plants.
Wastewater treatment by applying non energy intensive systems as photocatalytic methods and aquatic plants.
Implementation of composting programs for household organic wastes.
Implementation of production and distribution programmes of drinking water at regions where water is in scarcity (mainly islands), in order to reduce the consumption of bottled water.
Implementation of rainwater collection programmes at areas where tap water is produced by desalination plants.
Recycling of electric appliances, batteries, wires, waste oils and packaging materials.
4.3.2 Effect of Policies and Measures
4.3.2.1 Overview
This chapter presents quantitative estimates of the expected effects of implemented, adopted and planned policies and measures in Greece, aiming at reducing GHG emissions in order to meet the Kyoto target, along with the targets set by the CC&E package and EC directives (as 2001/77/EC, 2003/30EC, 2002/91/EC, 2004/8/EC, 2006/32/EC). These policies and measures were adopted in the context of the 2nd National Climate Change Program (2000-2010), the National Action Plans of the above mentioned directives and the main targets of the National Energy Strategy, with respect to their emissions reduction potential and economic efficiency. Tables 4.13 and 4.14 present estimates of the expected effects of these policies and measures in the time horizon of the year 2010, which in addition constitutes the
5th NATIONAL COMMUNICATION TO THE UNFCCC 131 midpoint of the 1st commitment period of the Kyoto Protocol, as well as for 2015 and 2020. An ex-post estimation of the effect of policies for year 2005 is also included.
The total realistic GHG emissions reduction potential from the implemented and adopted policies and measures was estimated to be 28.6 Mt CO2eq for 2010, 37.1 Mt CO2eq for 2015 and 47.0 Mt CO2eq for 2020. The possible interferences between these implemented/adopted measures, which may restrict the estimated GHG emissions reduction potential, were taken into account as possible. Thus, it is obvious that the application of the already implemented and adopted measures for the restriction of GHG emissions contributes considerably in the restriction of the augmentative trend of emissions that characterizes the Greek economy, leading to the achievement of the Kyoto objectives exclusively with domestic measures and actions (see paragraph 5.1).
Respectively, the total GHG emissions reduction potential for the planned policies and measures was estimated to be 1.7 Mt CO2eq for 2010, 11.7 Mt CO2eq for 2015 and 18.2 Mt CO2eq for 2020, also with the interferences between them to be taken into account as possible. Planned measures have been identified with a view to ensure compliance with the target set in the framework of the Kyoto Protocol for Greece and the further commitments set by the 2020 CC&E package and EC directives concerning RES-E, CHP, end-use energy efficiency, biofuels, proposals for post 2012 ETS etc. The estimation for the emissions reduction potential in the time horizon of 2020 has been based on specific assumptions concerning further penetration/implementation of the planned policies and measures, taking into account the dynamics that will develop from the fulfilment of the targets of the 1st Commitment Period of the Protocol and EC directives.
4.3.2.2 Promotion of natural gas
The introduction of natural gas in the national energy system is one of the largest investments ever carried out in Greece and it constitutes a major priority of the national energy policy. An important part of the infrastructure, mainly the high pressure transmission system and the medium pressure network, which is necessary for the transport of natural gas to the main regions of consumption, has been completed, while the networks’ development in the cities is ongoing, financed in the framework of the Operational Program Competitiveness (OPC). Expansion projects of greek natural gas system are under way in order to link more cities and industries to the system (e.g Korinthos, Megalopolis, etc). The natural gas that is expected to be available in Greece until 2018 is around 9.2 bcm/year, of which 6.5 bcm/year can be provided for electricity generation.
According to the 2008 energy balance, the penetration of natural gas progresses with satisfactory rates in the power generation sector (112.6 PJ for main activity producer plants and 3412 TJ for auto-producers), and in the industrial sector (21.1 PJ) as well. As far as the power generation sector is concerned, the installed capacity of natural gas units was 2.82GW in year 2008. The deregulation of electricity and natural gas markets, as well as the completion of the private power generation units, are considered as the two main reasons for the increase of the penetration level of natural gas in the power generation sector in the next years. Finally, important role plays the application of the emissions trading system, which, due to the limited emission allowances distributed to the electricity producers and the industrial sector, leads to the further utilization of clean technologies and fuels.
Important increase in the penetration of natural gas in the residential and the tertiary sector is observed for 2008 compared to 2005 (69%, 15.6 PJ in 2008). However, the penetration of natural gas in these sectors remains behind the initial planning mainly because of delays in the development of networks within the cities.
Natural gas (977 TJ in 2008) is also consumed in the transport sector, where 415 natural gas moving buses have already been placed in the public transportation system of Athens. The
5th NATIONAL COMMUNICATION TO THE UNFCCC 132 measure progresses satisfactory concerning the targets that had been placed within the 2nd
National Climate Change Program. 200 buses are expected to be added in the system till 2010.
Based on the already implemented and adopted policies and measures for natural gas promotion, it is expected an increased penetration of natural gas in both the power generation sector, where in the framework of the liberalized market additional power units using natural gas as fuel will be installed in the upcoming years, and in the final demand sectors. The reductions of GHG emissions due to these interventions are estimated at 14.9 Mt CO2 eq in 2010, 18.2 Mt CO2 eq in 2015 and 21.5 Mt CO2 eq in 2020.
Regarding the planned interventions for the further promotion of natural gas it is foreseen (a) a wider exploitation of natural gas combined cycle power plants units, (b) the installation of new cogeneration units in the industrial and tertiary sectors and (c) a further penetration in the sectors of final consumption. The reduction of GHG emissions from the implementation of the above mentioned measures are estimated at 0.4 Mt CO2eq in 2010, 2.3 Mt CO2eq in 2015 and 3.2 Mt CO2eq in 2020.
4.3.2.3 Improvements in the conventional power generation system
Public Power Corporation S.A., the basic player up to now in the domestic electricity market, has been actively involved in the field of energy conservation both in its internal activities as well as in implementing demand side management projects. The main actions of PPC include: (a) efficiency improvements in the existing lignite-fired power stations through the technical enhancement of boilers, turbines, lignite mills, cooling towers and remaining equipment, (b) reduction of distribution losses through the replacement of normal loss distribution transformers and (c) implementation of a cogeneration programme in the lignite-fired power plants by setting up district heating networks in northern Greece. The implementation of these programs was estimated to decrease GHG emissions by 0.5 Mt CO2eq in 2000, while emissions reductions is expected to increase in the upcoming years, since the corporation is planning the upgrade/replacement of old units. Specifically, 3.4 GW of old thermal units is planned to be decommissioned by PPC S.A. till 2017 and 4.5GW of new units to commence operation till 2014.
4.3.2.4 Promotion of renewable energy sources
Directive 2001/77/EC on the promotion of electricity produced from renewable energy sources in the internal electricity market, in its annex, sets an indicative target for Greece to cover a part of its gross national electricity consumption by 2010 from renewable energy sources (RES) equal to 20.1 percent, with the contribution of large-scale hydroelectric plants included. The production of electric power from RES in the order of 14.45 TWh (including large-scale hydro-electric plants) is the goal for 2010.
The exploitation of the Renewable Energy Sources in the energy system constitutes one of the major energy policy priorities for Greece. The 3468/2006 law was voted from the Greek Parliament in June of 2006 in order to simplify the license process for the construction and operation of RES systems and to increase the sale prices of electric energy produced from RES. Regarding 2007, according to ministerial decision D6/F1/oik.14610/4.7.2007 “Revision of sale bills of electricity generated by producers and auto-producers in plants using renewable energy sources or through high-efficiency co-generation of electricity and heat” (Official Gazette B’ 1223), the prices of Table 4.9 are applicable. For example, for photovoltaic systems with capacity lower than 100 kW, installed in the non interconnected islands, the price reaches 500 €/MWh.
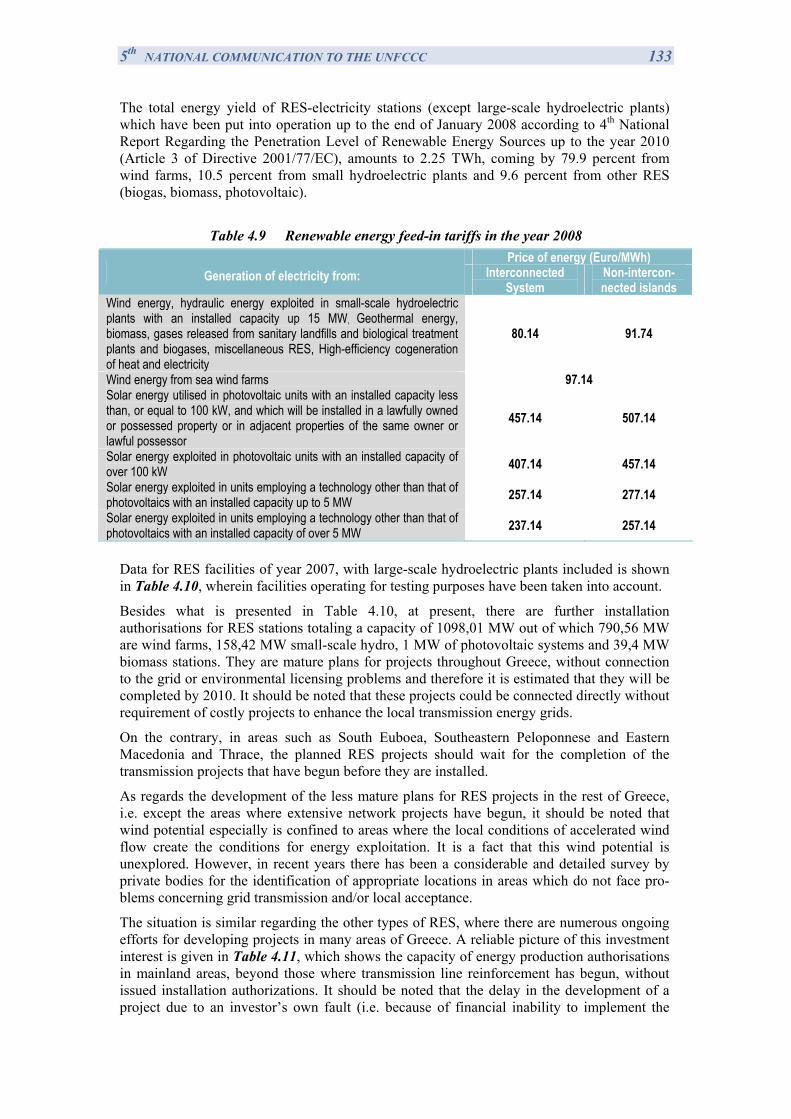
5th NATIONAL COMMUNICATION TO THE UNFCCC 133 The total energy yield of RES-electricity stations (except large-scale hydroelectric plants) which have been put into operation up to the end of January 2008 according to 4th National Report Regarding the Penetration Level of Renewable Energy Sources up to the year 2010 (Article 3 of Directive 2001/77/EC), amounts to 2.25 TWh, coming by 79.9 percent from wind farms, 10.5 percent from small hydroelectric plants and 9.6 percent from other RES (biogas, biomass, photovoltaic).
Table 4.9 Renewable energy feed-in tariffs in the year 2008
Price of energy (Euro/MWh) Generation of electricity from: Interconnected
System Non-intercon-nected islands
Wind energy, hydraulic energy exploited in small-scale hydroelectric plants with an installed capacity up 15 MW, Geothermal energy, biomass, gases released from sanitary landfills and biological treatment plants and biogases, miscellaneous RES, High-efficiency cogeneration of heat and electricity
80.14 91.74
Wind energy from sea wind farms 97.14 Solar energy utilised in photovoltaic units with an installed capacity less than, or equal to 100 kW, and which will be installed in a lawfully owned or possessed property or in adjacent properties of the same owner or lawful possessor
457.14 507.14
Solar energy exploited in photovoltaic units with an installed capacity of over 100 kW 407.14 457.14 Solar energy exploited in units employing a technology other than that of photovoltaics with an installed capacity up to 5 MW 257.14 277.14 Solar energy exploited in units employing a technology other than that of photovoltaics with an installed capacity of over 5 MW 237.14 257.14
Data for RES facilities of year 2007, with large-scale hydroelectric plants included is shown in Table 4.10, wherein facilities operating for testing purposes have been taken into account.
Besides what is presented in Table 4.10, at present, there are further installation authorisations for RES stations totaling a capacity of 1098,01 MW out of which 790,56 MW are wind farms, 158,42 MW small-scale hydro, 1 MW of photovoltaic systems and 39,4 MW biomass stations. They are mature plans for projects throughout Greece, without connection to the grid or environmental licensing problems and therefore it is estimated that they will be completed by 2010. It should be noted that these projects could be connected directly without requirement of costly projects to enhance the local transmission energy grids.
On the contrary, in areas such as South Euboea, Southeastern Peloponnese and Eastern Macedonia and Thrace, the planned RES projects should wait for the completion of the transmission projects that have begun before they are installed.
As regards the development of the less mature plans for RES projects in the rest of Greece, i.e. except the areas where extensive network projects have begun, it should be noted that wind potential especially is confined to areas where the local conditions of accelerated wind flow create the conditions for energy exploitation. It is a fact that this wind potential is unexplored. However, in recent years there has been a considerable and detailed survey by private bodies for the identification of appropriate locations in areas which do not face pro-blems concerning grid transmission and/or local acceptance.
The situation is similar regarding the other types of RES, where there are numerous ongoing efforts for developing projects in many areas of Greece. A reliable picture of this investment interest is given in Table 4.11, which shows the capacity of energy production authorisations in mainland areas, beyond those where transmission line reinforcement has begun, without issued installation authorizations. It should be noted that the delay in the development of a project due to an investor’s own fault (i.e. because of financial inability to implement the
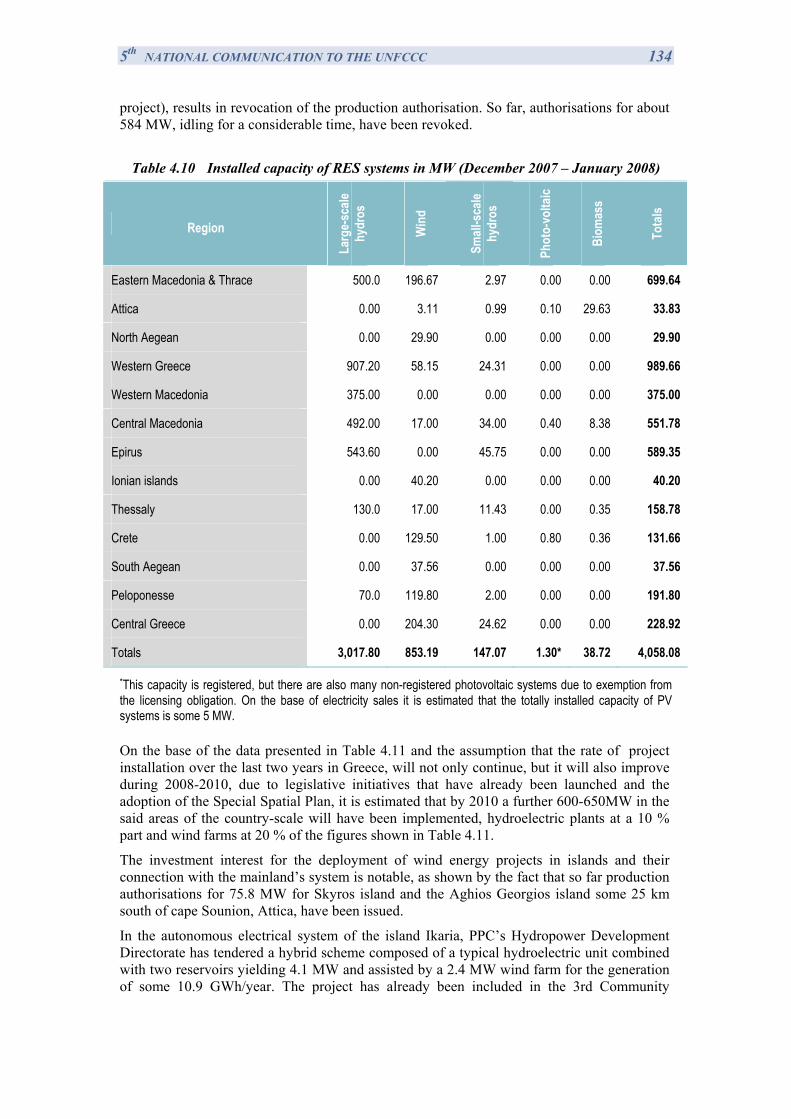
5th NATIONAL COMMUNICATION TO THE UNFCCC 134 project), results in revocation of the production authorisation. So far, authorisations for about 584 MW, idling for a considerable time, have been revoked.
Table 4.10 Installed capacity of RES systems in MW (December 2007 – January 2008)
Region
Larg
e-sc
ale
hydr
os
Win
d
Small
-sca
le hy
dros
Phot
o-vo
ltaic
Biom
ass
Tota
ls
Eastern Macedonia & Thrace 500.0 196.67 2.97 0.00 0.00 699.64
Attica 0.00 3.11 0.99 0.10 29.63 33.83
North Aegean 0.00 29.90 0.00 0.00 0.00 29.90
Western Greece 907.20 58.15 24.31 0.00 0.00 989.66
Western Macedonia 375.00 0.00 0.00 0.00 0.00 375.00
Central Macedonia 492.00 17.00 34.00 0.40 8.38 551.78
Epirus 543.60 0.00 45.75 0.00 0.00 589.35
Ionian islands 0.00 40.20 0.00 0.00 0.00 40.20
Thessaly 130.0 17.00 11.43 0.00 0.35 158.78
Crete 0.00 129.50 1.00 0.80 0.36 131.66
South Aegean 0.00 37.56 0.00 0.00 0.00 37.56
Peloponesse 70.0 119.80 2.00 0.00 0.00 191.80
Central Greece 0.00 204.30 24.62 0.00 0.00 228.92
Totals 3,017.80 853.19 147.07 1.30* 38.72 4,058.08
*This capacity is registered, but there are also many non-registered photovoltaic systems due to exemption from the licensing obligation. On the base of electricity sales it is estimated that the totally installed capacity of PV systems is some 5 MW. On the base of the data presented in Table 4.11 and the assumption that the rate of project installation over the last two years in Greece, will not only continue, but it will also improve during 2008-2010, due to legislative initiatives that have already been launched and the adoption of the Special Spatial Plan, it is estimated that by 2010 a further 600-650MW in the said areas of the country-scale will have been implemented, hydroelectric plants at a 10 % part and wind farms at 20 % of the figures shown in Table 4.11.
The investment interest for the deployment of wind energy projects in islands and their connection with the mainland’s system is notable, as shown by the fact that so far production authorisations for 75.8 MW for Skyros island and the Aghios Georgios island some 25 km south of cape Sounion, Attica, have been issued.
In the autonomous electrical system of the island Ikaria, PPC’s Hydropower Development Directorate has tendered a hybrid scheme composed of a typical hydroelectric unit combined with two reservoirs yielding 4.1 MW and assisted by a 2.4 MW wind farm for the generation of some 10.9 GWh/year. The project has already been included in the 3rd Community
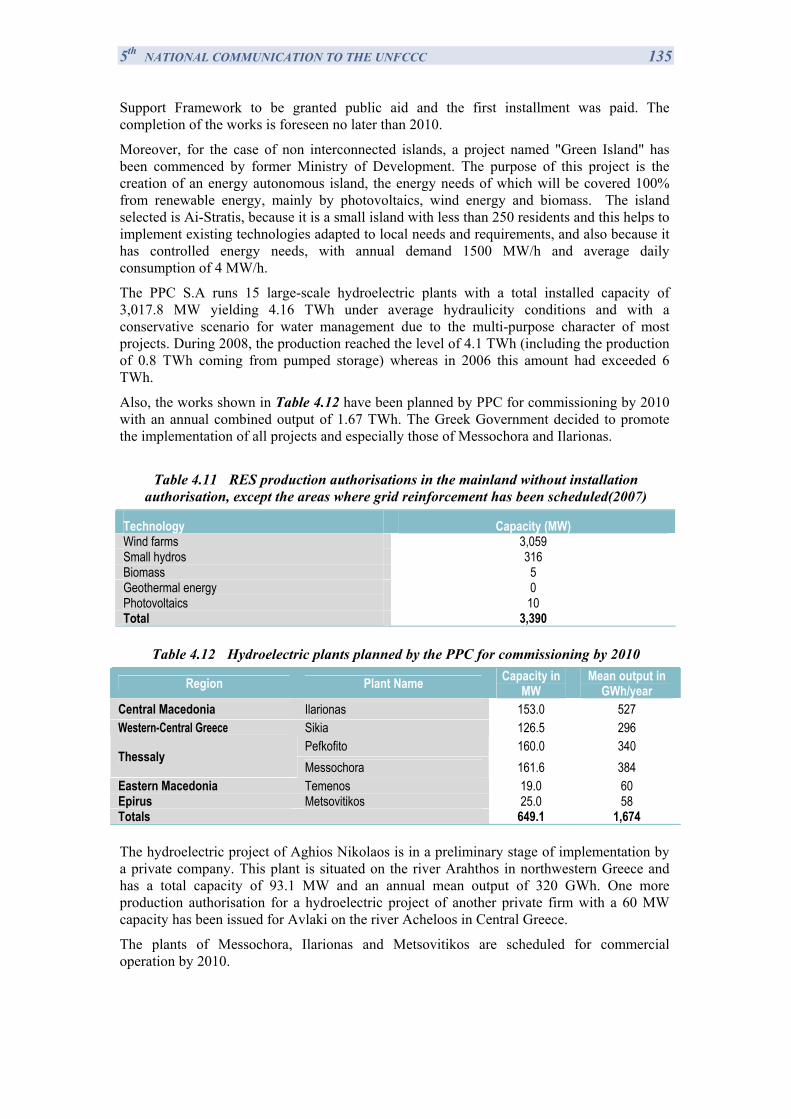
5th NATIONAL COMMUNICATION TO THE UNFCCC 135 Support Framework to be granted public aid and the first installment was paid. The completion of the works is foreseen no later than 2010.
Moreover, for the case of non interconnected islands, a project named "Green Island" has been commenced by former Ministry of Development. The purpose of this project is the creation of an energy autonomous island, the energy needs of which will be covered 100% from renewable energy, mainly by photovoltaics, wind energy and biomass. The island selected is Ai-Stratis, because it is a small island with less than 250 residents and this helps to implement existing technologies adapted to local needs and requirements, and also because it has controlled energy needs, with annual demand 1500 MW/h and average daily consumption of 4 MW/h.
The PPC S.A runs 15 large-scale hydroelectric plants with a total installed capacity of 3,017.8 MW yielding 4.16 TWh under average hydraulicity conditions and with a conservative scenario for water management due to the multi-purpose character of most projects. During 2008, the production reached the level of 4.1 TWh (including the production of 0.8 TWh coming from pumped storage) whereas in 2006 this amount had exceeded 6 TWh.
Also, the works shown in Table 4.12 have been planned by PPC for commissioning by 2010 with an annual combined output of 1.67 TWh. The Greek Government decided to promote the implementation of all projects and especially those of Messochora and Ilarionas.
Table 4.11 RES production authorisations in the mainland without installation
authorisation, except the areas where grid reinforcement has been scheduled(2007)
Technology Capacity (MW) Wind farms 3,059 Small hydros 316 Biomass 5 Geothermal energy 0 Photovoltaics 10 Total 3,390
Table 4.12 Hydroelectric plants planned by the PPC for commissioning by 2010
Region Plant Name Capacity in MW
Mean output in GWh/year
Central Macedonia Ilarionas 153.0 527 Western-Central Greece Sikia 126.5 296
Pefkofito 160.0 340 Thessaly
Messochora 161.6 384 Eastern Macedonia Temenos 19.0 60 Epirus Metsovitikos 25.0 58 Totals 649.1 1,674
The hydroelectric project of Aghios Nikolaos is in a preliminary stage of implementation by a private company. This plant is situated on the river Arahthos in northwestern Greece and has a total capacity of 93.1 MW and an annual mean output of 320 GWh. One more production authorisation for a hydroelectric project of another private firm with a 60 MW capacity has been issued for Avlaki on the river Acheloos in Central Greece.
The plants of Messochora, Ilarionas and Metsovitikos are scheduled for commercial operation by 2010.
5th NATIONAL COMMUNICATION TO THE UNFCCC 136 The penetration of photovoltaic units in the Greek energy system is still limited and the installed capacity of systems amounted in early 2008 at about 5 MW. Concerning the targets of the National Climate Change Program (10 MW for 2010 in the electricity production and 5 MW in the domestic - tertiary sector) it seems that there are important delays. The complexity of license processes and the relatively high price of photovoltaic systems are considered the most important obstacles in their growth. However, the immediate application of law 3468/2006 in RES is expected to contribute to the development of photovoltaic systems. It should be pointed out that even though the implementation of this measure does not aim at the reduction of large quantities of GHG emissions through the substitution of electricity generated in conventional plants, the acquisition of know-how for future application, when the available technologies will be also more mature in commercial terms, is a very worthwhile gain. Moreover, the PV stations, as a dispersed generation mode, do supply energy during medium and high-demand hours and therefore make redundant conventional capacity in coping with peaking loads. In addition thereto, significant is their contribution in lowering transmission grid losses.
The promotion of solar collectors’ use constitutes one of the most important measures of the National Climate Change Program for the reduction of GHG emissions. The total surface of installed solar collectors amounted 3,871,000 m2 in 2008, the majority of which is used for the production of hot water in the residential sector. The implementation of the measure progresses satisfactorily. However the installation rate of new solar heaters has decreased (at about 50,000 – 90,000 m2 per year), thus the target of the National Program for the Climate Change for 2010 (the surface of solar collectors approach 4.5 millions m2) is considered particularly difficult to be reached. The mandatory installation of central thermal solar systems to new buildings of total surface larger than 1000m2 and the provision of financial incentives to both residential and tertiary sector for the installation of such systems are supporting policies for the promotion of solar thermal energy.
Finally, the penetration of biofuels in the transport sector of the national energy balance began substantially in 2006. According to the 4th National report for the Promotion of the use of Biofuels and other Renewable Energy Resources in the Transport Sector in Greece, the consumption of biodiesel and bioethanol is expected to reach in 2010 the 5.75% of the total quantity of diesel and gasoline consumed in road transportation as indicated by directive 2003/30/EC. In order to increase the use of biofuels according to Law 3340/2005 the excise tax for these biofuels is null for the years 2005, 2006 and 2007. As far as biodiesel is concerned, 10 biodiesel production units are already in operation, with a total annual capacity of 575 kt. The distribution of bioethanol is not expected to start before early 2010.
Based on the results of the quantitative analysis that was carried out, GHG emissions reduction potential from implemented and adopted policies on RES exploitation is expected to be 8.9 Mt CO2eq in 2010, 11.2 Mt CO2eq in 2015 and 16.0 Mt CO2eq in 2020. The relative planned policies will lead to total emission reductions of 0.6 Mt CO2eq in 2010, 4.2 Mt CO2eq in 2015 and 6.6 Mt CO2eq in 2020.
4.3.2.5 Measures in the industrial sector
Energy-efficiency improvements, replacement of liquid and solid fuels by natural gas and CHP units in various areas of the industry sector have been promoted since the 1st National Climate Change Program through the provisions of the Development Assistance Acts, Law 2244/93 (for CHP plants), the OPE (Measures 2.2 and 2.3) and OPC. Also the operation of EU-ETS is expected to have a significant effect in the reduction of GHG emissions of industries (cement, lime, ceramics plants etc) as described in paragraph 4.3.1.3.
5th NATIONAL COMMUNICATION TO THE UNFCCC 137 Concerning planned interventions, apart from the further promotion of natural gas and RES (biomass, solar energy) in industry, further implementation of energy conservation programs in various industrial units is pursued due to public financial support schemes (as the Development Assistance Act). Incentives for the establishment and implementation of Energy Management Systems (EMS), creation of energy and environmental management centres in industrial areas and outsourcing of energy services are planned. Projects of voluntary agreement schemes co-financed by the EC are in a pilot phase as Motor Challenge and Greenlight, with promising results. Since the reduction of energy intensity in the Greek industry is continuous during the last fifteen years and it is projected that the decrease will be continued in the next years, the energy conservation in the small to medium-sized industrial units constitutes an additional target.
It is estimated that the emissions reductions which can be achieved from the implementation of adopted measures in industry (mainly CHP) can reach 1.2 Mt CO2 eq in 2010, 2.8 Mt CO2 eq in 2015 and 3.3 Mt CO2 eq in 2020. From the planned policies the GHG emission reduction potential is expected to be 0.7 Mt CO2 eq in 2010, 1.7 Mt CO2 eq in 2015 and 1.9 Mt CO2 eq in 2020.
4.3.2.6 Measures in transport sector
GHG emissions from the transport sector present high rates of growth both in Greece and in the European Union, and consequently the implementation of suitable policies and restriction measures is particularly critical. The main axes of intervention and implemented policies and measures in the sector, beyond the introduction of biofuels for road transport and natural gas in the public system of transport that were already described previously, are shortly presented below:
(Α) Interventions in the transport system
Public works to enhance the existing infrastructure described in the previous National Communications (road-grid improvements in the large urban centres, reconstruction of major highways, improvements in the traffic-light system) are in progress.
Programmes for the upgrading of the traffic lights system (road signaling), as well as the overall traffic management and control have been developed since 2002 in Athens. Therefore, half of the traffic lights in the region of Athens (roughly 1500) are in cooperation, while the Centre of Traffic Management, which belongs to the Ministry of Infrastructure, Transport and Networks collects traffic information from 842 traffic nodes in a daily base. According to collected information, processes for the improvement of the road signaling have been established.
(Β) Interventions in public transport
Important interventions have already been implemented or are under development aiming at the enforcement of public transport. In Athens, the two new metro lines, which were completed and started operation in 2000, are being expanded, while new metro lines are in design phase. In Thessaloniki a new metro line is under construction. The operation of suburban railway in the wider area of Athens has already started, the connection to Corinthos was completed, while the connections with Livadia and Chalcida are expected to operate in the near future. Also in 2004, a new tram started operating in Athens with 2 lines reaching from the centre of the city to the southern waterfront suburbs.
5th NATIONAL COMMUNICATION TO THE UNFCCC 138 Concerning rail transport, since 2000, more than 250 km of new rail lines have been constructed (including replacement of old single lines), while more than 220 km rail lines have been converted to electrical driven. Under construction phase are more than 300 km of new rail lines, while most part of the railway system of Greece is being converted to electrical driven. Furthermore, projects of new lines are under planning.
An extended network of bus lanes of approximately 48 km length has already been created, resulting in the increase of the average speed of buses in Athens from 16 km/h to 21 km/h. The fleet of buses has been renewed to a large extent, while approximately 415 buses use natural gas as fuel (+200 in year 2010). Moreover the renewal of the fleet of electrically driven buses (trolleys) began in 1998 with the supply of 224 vehicles and was extended with the supply of additional 142 vehicles by the end of 2004. For the years 2010-2011, 30 new electrical bases are expected to be introduced in the Greek fleet.
In addition, by Law 2963/2001 (A 268), an age limit of 23 years has been instituted for all urban, semi-urban and long distance buses. Also the limit of 11 years was set as the higher permissible age for buses in public transport. Under the provisions of the same law, economic incentives were given in the owners for the replacement of vehicles with new or used vehicles of small age. Of the 5000 semi-urban and long distance buses licensed in Greece, 1846 buses have been replaced since 2004, of which 1746 with new and 100 with used of age lower than 5 years. Moreover, the replacement of tourist coaches was encouraged by subsidies provided for in Article 31 of Law 3229/2004. By Article 7 of Law 2446/96, an age limit of 23 years has been also instituted for them. The replacement program was supervised by the Ministry of Tourism and the former Ministry of Economy and Finance.
Finally, the public transport system in Athens is being reorganized on the basis of the new metro and tram lines, with buses and trolleys also playing a complementary role of connecting the metro and tram stations with other areas of the city.
(C) Interventions in vehicles
The main regulation that aims at the restriction of GHG emissions from vehicles is the one requiring regular technical checks of vehicles, which has been mandatory since 1983 and takes place at the Centres for Technical Control of Vehicles (CTCV). The law provides for the establishment of private Centres for Technical Control, the improvement of public ones and the development of a special organization to supervise the operation of the above-mentioned Centres. Currently, according to data of the Ministry of Infrastructure, Transport and Networks, 56 public and 37 private centers operate and other 40 have been licensed and start or expected to start operation in the coming period. With the increase of the CTCV number during the next period, the essential conditions and infrastructures for an important increase of the number of checked vehicles per year are created, in accordance with the objectives of the National Program.
An equally important intervention for GHG emissions reduction from vehicles is the exhaust control card, which is required for all vehicles and should be renewed on an annual basis for private passenger cars and trucks up to 3.5 t. Certified auto-repair shops expressly certified to carry out this task and issue the control card.
Moreover, under the framework of the implementation of policies for the replacement of old vehicles, a list of actions has been taken place. The buses fleet is being renewed, aiming to the improvement of energy efficiency of vehicles. Apart from gas driven buses, Athens Urban Transport Organization and Thermal Bus Co plan to incorporate to their fleet 200 EURO IV and 10 EURO V new bases for the years 2009-2011.
According to the Law 3109/2003 the age limits for the public use cars (taxi) were revised and economic incentives were given to the taxi - owners for the replacement of their vehicles with new ones (9300 taxis have been replaced).
5th NATIONAL COMMUNICATION TO THE UNFCCC 139 The establishment of a renewal program for the fleet of motorcycles, with incentives for the final withdrawal of two-wheeled motorcycles over 50 c.c. and aged more than ten years (categorized until 1994 for motorcycles and 1996 for motorbikes) is another important intervention in the transport sector. The program was put in force with Law 3245/2004 – article 2 (A 110) and its force was extended by Law 3333/2005 (A 91). Incentives for the replacement of old middle weight and heavy vehicles, of passenger cars and promotion of energy efficient vehicles (natural gas, biofuels, hybrid cars) are either under planning phase.
The voluntary agreement between the European Commission and the European, Japanese and Korean car-manufacturers associations to improve the fuel efficiency of new cars is considered as an adopted measure aiming at the reduction of GHG emissions in conjunction with promotion of ecologic labeling – energy labeling of passenger cars. The agreement foresees the improvement of the fuel efficiency of new cars, so as the CO2 emission factor to reach down to 140gr/km in 2008. The measure is expected to have an important long-term output through the penetration of low emissions vehicles in the total fleet. The mandatory quota with energy efficient vehicles in public services or organizations and the linking of vehicle tax with energy efficiency and CO2 emissions were also adopted.
Finally, the development of urban mobility plans and the promotion of eco-driving, interventions for the safe movement of bicycles in the cities and the construction of new bicycle paths are measures that is expected to contribute to GHG emissions reduction.
(D) New planned measures for addressing air pollution from road traffic in urban centres
In July 2009, the former Ministry for the Environment, Physical Planning and Public Works (present Ministry of Environment, Energy and Climate Change) introduced a package of measures for addressing air pollution from road traffic. These measures concerned the calculation of Environmental motor vehicle circulation fee (road tax), incentives for fleet renewal and removal of vehicles, and aproposal for a Green” traffic ring. These measures are now under review by the present Ministry of Environment, Energy and Climate Change.
The planned policies and measures in the transport sector are expected to contribute GHG reductions of about 0.1 Mt CO2eq in 2010, 0.4 Mt CO2eq in 2015 and 1.1 Mt CO2eq in 2020. 4.3.2.7 Measures in residential and tertiary sector
Several actions are included in the 2nd National Climate Change Program and Energy Efficiency National Action Plan concerning the conservation and rational use of energy in the residential and tertiary sector. Apart from the introduction of natural gas and RES, the measures concern actions for the improvement of the thermal behavior of residential sector buildings and promotion of energy efficiency appliances and heating equipment. These actions are supported significantly by the incorporation in the Greek legislation of the Directive 2002/91/EC by Law 3661/08 (Official Gazette 89/A 3661 – 19/5/2008) and JMD D6/B/14826 (Official Gazette 1122B – 17/6/2008), which propose actions for energy conservation in the residential and tertiary sector, such as using a common methodology for the estimation of the energy efficiency of buildings, development of a system for the certification of new and existing buildings, inspection of boilers, mandatory replacement of all low energy efficiency lights in the public and wider public sector, financial incentives and subsidies for the replacement of low energy class household devices with new energy
5th NATIONAL COMMUNICATION TO THE UNFCCC 140 efficient ones. The adoption and application of the Regulation of Energy Performance of Buildings (REPB) specifying energy inspections, as well as energy and environmental certification of buildings, constitutes a crucial step for the realization of these interventions.
An example of the financial incentives and subsidies for the replacement of low energy class household devices is the programme “Replace air-conditioning appliance, co-funded by the 4th Community Support Framework 2007-2013, which lasted from June 2009 to August 2009. It aimed to replace air-conditioning appliances of low energy performance with high energy performance (inverter technology) appliances of energy class A or B, within the cooling range of 9000 Btu/h to 24000 Btu/h. The scheme provided a 35% subsidised price, (up to 500 Euro per appliance) for new appliances replacing old ones. A total number of 140672 air-conditioning appliances were replaced resulting in 53.01 GWh energy savings annually and a correspondingly reduction of 46.65 kt of CO2 emissions.
It is estimated that the total decrease of GHG emissions from the implemented and adopted policies and measures in the residential and tertiary sector will reach the 1.1 Mt CO2eq in 2010, while for 2015 and 2020 these reductions are estimated at 1.3 and 1.7 Mt CO2eq, respectively. The effect of planned policies in GHG emissions reduction is expected to be 3.0 Mt CO2eq in 2015 and 5.4 Mt CO2eq in 2020.
4.3.2.8 Measures in agricultural sector
The legislative framework concerning the rules for agriculture production in Greece is established mainly by the Ministerial Decision 1122/2005, which is based on the EU Directive 1782/2003. By this legislation the agricultural production is disengaged from the agricultural subsidies. Furthermore, by the implementation of Rural Development Program ‘Alexandros Mpaltatzis’ the measures for the agriculture sector for the forth programming period 2007-2013 were set.
The increase of organic farming was set as an important target of Greek policy (Joint Ministerial Decision 245090/06 according to Directive 2092/91/EC). In conjunction with the significantly increase of fertilizers’ prices, a substantial decrease of Ν2Ο emissions had occurred. According to the Ministry of Rural Development and Food records, the total land with organic farming in 2005 was 60,020 ha, representing 1.54% of the total cultivated land of the country, while in 2007 this figure increased to 1.83%. It is expected that up to 2010, the cultivations without use of synthetic fertilizers will represent approximately 2.2% of total agricultural land (approximately 85,000 ha). Further promotion of organic farming, already planned, might raise that to 115,000 ha in 2015 and 150000 ha in 2020.
Finally, the introduction of wet systems for manure management for cattle and pigs constitutes a basic measure of Ν2Ο emissions reduction. Today, most cattle breeding activity and over 10% of pig raising farms utilize dry treatment of manure. Further penetration of this practice in the sector in order to decrease Ν2Ο emissions is pursued. The Ν2Ο emission factor per unit of nitrogen excreted from animals is much smaller in wet systems.
In total, the measures in agricultural sector are expected to reduce GHG emissions by 0.6 Mt CO2eq in 2010, 0.7 Mt CO2eq in 2015 and 0.8 Mt CO2eq in 2020.
4.3.2.9 Measures in the industrial processes sector
In the industrial processes sector, Greece has incorporated directive 2002/96/EC and its modification 2003/108/EC for the recovery of f-gases from air conditioning and refrigeration equipment in the national legislation with the P.D. 117/2004 and P.D.15/2006, while the enhancement for electric and electronic equipment recycling actions has been promoted by
5th NATIONAL COMMUNICATION TO THE UNFCCC 141 the OPC (Action 2.9.4). However, the Regulation (EC) 2037/2000 of the European Parliament and of the Council adopts a time schedule for the reduction of HCFC-22 (HCFC-22 is the source of HFC-23 emissions), with specific quantitative targets for the periods 2000 – 2007, 2008 – 2013, 2014 – 2020 and 2021 – 2025 compared to 1997 production. Production of HCFC-22 is not allowed after 31 December 2025. However, the only plant producing HCFC-22 in Greece has ceased operation since 2006. Finally, the Regulation 842/2006 of the European Parliament and of the Council of 17 May 2006 on certain fluorinated greenhouse gases, which is obligatory for Greece, is aimed at reducing emissions of certain fluorinated gases (HFCs, PFCs and sulphur hexafluorides), to improve containment and monitoring of these gases and restrict their marketing and use. The Regulation should lead to a reduction in emissions of 23 million tonnes of carbon dioxide equivalent by 2010 in a European level, and an even greater reduction thereafter.
4.3.2.10 Measures in the waste sector
National policies and measures for the waste sector are related to the operation of managed solid waste disposal sites. With Decision 50910/2727 (December 2003), the measures, the terms and the processes for the rational management of waste in national and regional level have been specified. Fundamental objectives are the elimination of unmanaged solid waste disposal sites, the coverage of all urban and rural areas of the country with modern installations for final disposal and the promotion of measures for the prevention and reduction of produced waste, as well as the exploitation of materials with maximization of recycling and recovery of products and energy. In addition the necessity to reduce the quantities of biodegradable wastes landfilled through the installation of treatment facilities, was acknowledged by the Joint Ministerial Decision 29407/3508 in agreement with Directive 1999/31/EC. Therefore, the targets set for the reduction of biodegradable wastes landfilled are at 75%, 50% and 35% for the years 2010, 2013 and 2020, respectively, compared to their production in 1995. The implementation of the above mentioned policies is expected to contribute in the reduction of GHG emissions at approximately 132 kt CO2eq in 2010, 950 kt CO2eq in 2015 and at 1840 kt CO eq in 2020.
As regards wastewater, a collection network with its corresponding wastewater treatment plants has already been developed during the last five-years, covering the needs of 70% of the population in 2001 and the 90% in 2007.
Finally concerning planned measures for emissions reduction in the sector, the only measure examined is the flaring of landfill gas in all managed sites for urban centres with population more than 100,000 inhabitants. It is noted that the measure is partially integrated (managed disposal sites covering the three largest cities of Greece) in the “with measures” scenario. Emissions reductions estimated are to reduce GHG emissions in the sector by 1800 kt CO2eq in annual basis for the period 2010-2020.
4.3.2.11 Measures in LULUCF sector
The targets of the Greek policy regarding the Land Use, Land Use Change and Forestry sector are the conservation of existing forest land, its gradual increase, as well as the improvement of the degraded forests. The sustainable protection of the forest land was early legislated (Presidential Decree 19-11-1928) while the sustainability of the significant forest multi-functioning role (e.g protection from erosion, maintenance of water balance, conservation of biodiversity) has been ensured through the directive 958/1953.
The measures for the LULUCF sector are arisen from rural development actions and other financial mechanisms. The policies and measures that are expected to be adopted according to the Rural Development Program ‘Alexandros Mpaltatzis’ (concerning the forth
5th NATIONAL COMMUNICATION TO THE UNFCCC 142 programming period 2007-2013) strengthen the significant role of forests and contribute to climate change mitigation:
1. Existing forest resources restoration and introduction of preventing actions: Projects and actions are included for the protection of forests from wildfires, the restoration of burnt forests (as flood protection and erosion restoration works on mountainous areas) and reforestation of burnt forests in a total area of 180000 ha.
2. Support of non-productive investments: Studies and small projects for the control of chestnut blight and other diseases.
Furthermore, the policies and measures of the Rural Development Program ‘Alexandros Mpaltatzis’ that target on the increase of forest land are:
1. Afforestation of croplands - afforestation of non-croplands: 77284 ha of land is planned to be afforested till 2012, -including the total forested area since 1994- that is 36612 ha of new afforested land in the period 2004-2012 (average annual afforested areas rate is 4068 ha after 2003). The CO2 emissions are estimated to decrease by 3610 kt in the period 2008-2012. In case of additional measures, the above mentioned target will change to 90811 ha of total afforested area till 2012, that is 54000 ha of new afforested land in the period 2004-2012 (average annual afforested areas rate is estimated at 6000 ha after 2003). In that case, the CO2 emissions are estimated to decrease by 4115 kt for the period 2008-2012.
2. Conversion of coppices into high forests.
3. The increase, renewal, improvement, replacement and enrichment of wood stock by introducing new forest species in degraded stands.
According to the annual review report of 2007, 16340 people work in the forestry sector, of whom 3343 are permanent employees and the rest are seasonal (employed in logging works).
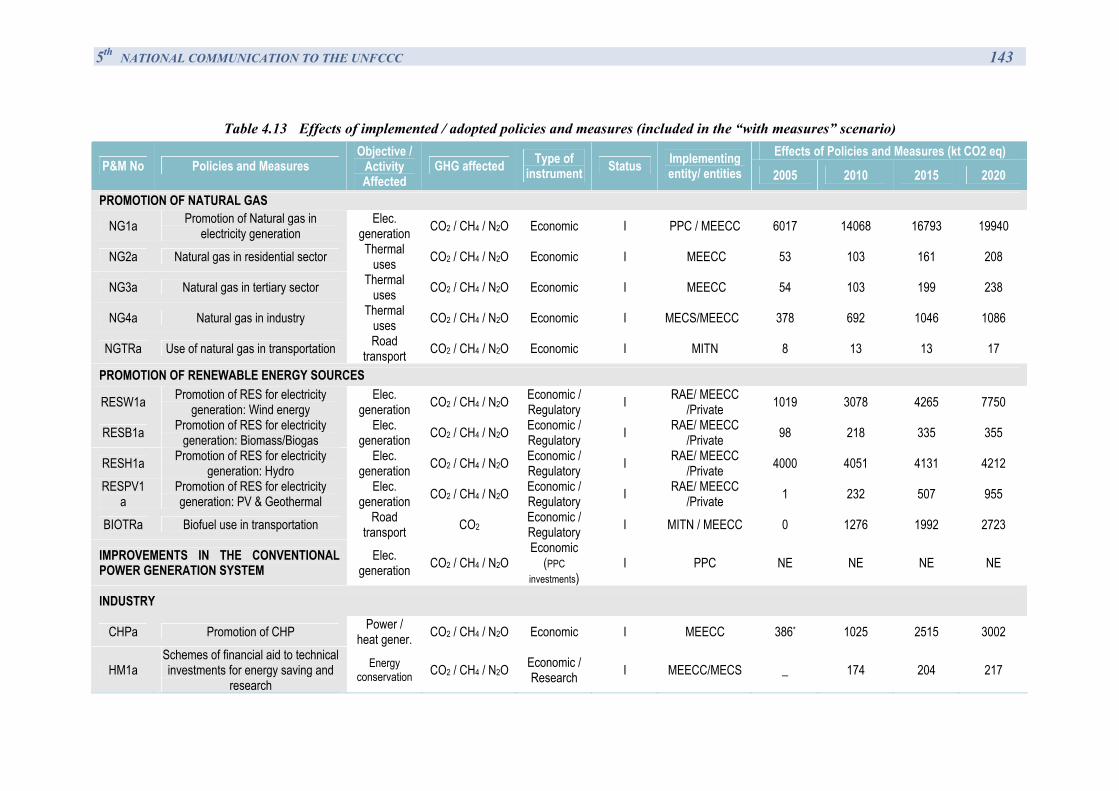
5th NATIONAL COMMUNICATION TO THE UNFCCC 143
Table 4.13 Effects of implemented / adopted policies and measures (included in the “with measures” scenario) Effects of Policies and Measures (kt CO2 eq)
P&M No Policies and Measures Objective /
Activity Affected
GHG affected Type of instrument Status Implementing
entity/ entities 2005 2010 2015 2020
PROMOTION OF NATURAL GAS
NG1a Promotion of Natural gas in electricity generation
Elec. generation CO2 / CH4 / N2O Economic I PPC / MEECC 6017 14068 16793 19940
NG2a Natural gas in residential sector Thermal uses CO2 / CH4 / N2O Economic I MEECC 53 103 161 208
NG3a Natural gas in tertiary sector Thermal uses CO2 / CH4 / N2O Economic I MEECC 54 103 199 238
NG4a Natural gas in industry Thermal uses CO2 / CH4 / N2O Economic I MECS/MEECC 378 692 1046 1086
NGTRa Use of natural gas in transportation Road transport CO2 / CH4 / N2O Economic I MΙTΝ 8 13 13 17
PROMOTION OF RENEWABLE ENERGY SOURCES
RESW1a Promotion of RES for electricity generation: Wind energy
Elec. generation CO2 / CH4 / N2O Economic /
Regulatory I RAE/ MEECC /Private 1019 3078 4265 7750
RESB1a Promotion of RES for electricity generation: Biomass/Biogas
Elec. generation CO2 / CH4 / N2O Economic /
Regulatory I RAE/ MEECC /Private 98 218 335 355
RESH1a Promotion of RES for electricity generation: Hydro
Elec. generation CO2 / CH4 / N2O Economic /
Regulatory I RAE/ MEECC /Private 4000 4051 4131 4212
RESPV1a
Promotion of RES for electricity generation: PV & Geothermal
Elec. generation CO2 / CH4 / N2O Economic /
Regulatory I RAE/ MEECC /Private 1 232 507 955
BIOTRa Biofuel use in transportation Road transport CO2 Economic /
Regulatory I MΙTΝ / MEECC 0 1276 1992 2723
IMPROVEMENTS IN THE CONVENTIONAL POWER GENERATION SYSTEM
Elec. generation CO2 / CH4 / N2O
Economic (PPC
investments) I PPC NE NE NE NE
INDUSTRY
CHPa Promotion of CHP Power / heat gener. CO2 / CH4 / N2O Economic I MEECC 386* 1025 2515 3002
HM1a Schemes of financial aid to technical investments for energy saving and
research Energy
conservation CO2 / CH4 / N2O Economic / Research I MEECC/MECS _ 174 204 217
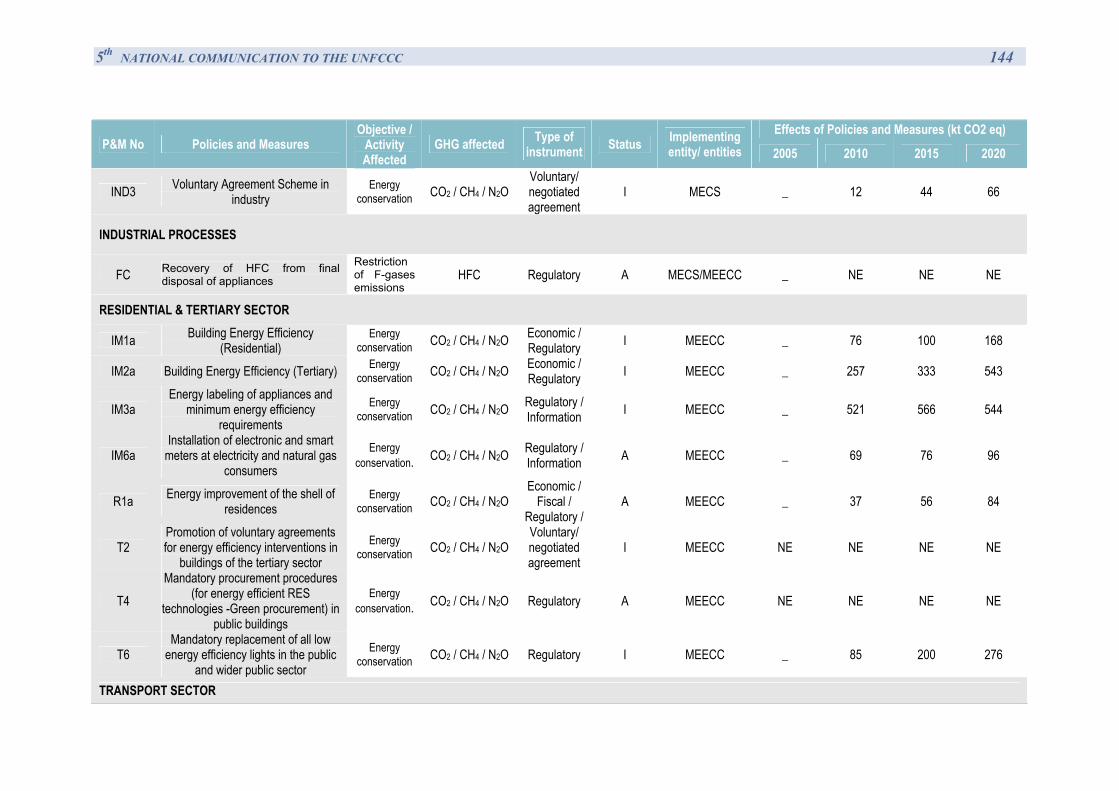
5th NATIONAL COMMUNICATION TO THE UNFCCC 144
Effects of Policies and Measures (kt CO2 eq) P&M No Policies and Measures
Objective / Activity Affected
GHG affected Type of instrument Status Implementing
entity/ entities 2005 2010 2015 2020
IND3 Voluntary Agreement Scheme in industry
Energy conservation CO2 / CH4 / N2O
Voluntary/ negotiated agreement
I MECS _ 12 44 66
INDUSTRIAL PROCESSES
FC Recovery of HFC from final disposal of appliances
Restriction of F-gases emissions
HFC Regulatory A MECS/MEECC _ NE NE NE
RESIDENTIAL & TERTIARY SECTOR
IM1a Building Energy Efficiency (Residential)
Energy conservation CO2 / CH4 / N2O Economic /
Regulatory I MEECC _ 76 100 168
IM2a Building Energy Efficiency (Tertiary) Energy conservation CO2 / CH4 / N2O Economic /
Regulatory I MEECC _ 257 333 543
IM3a Energy labeling of appliances and
minimum energy efficiency requirements
Energy conservation CO2 / CH4 / N2O Regulatory /
Information I MEECC _ 521 566 544
IM6a Installation of electronic and smart
meters at electricity and natural gas consumers
Energy conservation. CO2 / CH4 / N2O Regulatory /
Information A MEECC _ 69 76 96
R1a Energy improvement of the shell of residences
Energy conservation CO2 / CH4 / N2O
Economic / Fiscal /
Regulatory / A MEECC _ 37 56 84
T2 Promotion of voluntary agreements for energy efficiency interventions in
buildings of the tertiary sector Energy
conservation CO2 / CH4 / N2O Voluntary/ negotiated agreement
I MEECC NE NE NE NE
T4 Mandatory procurement procedures
(for energy efficient RES technologies -Green procurement) in
public buildings
Energy conservation. CO2 / CH4 / N2O Regulatory A MEECC NE NE NE NE
T6 Mandatory replacement of all low
energy efficiency lights in the public and wider public sector
Energy conservation CO2 / CH4 / N2O Regulatory I MEECC _ 85 200 276
TRANSPORT SECTOR
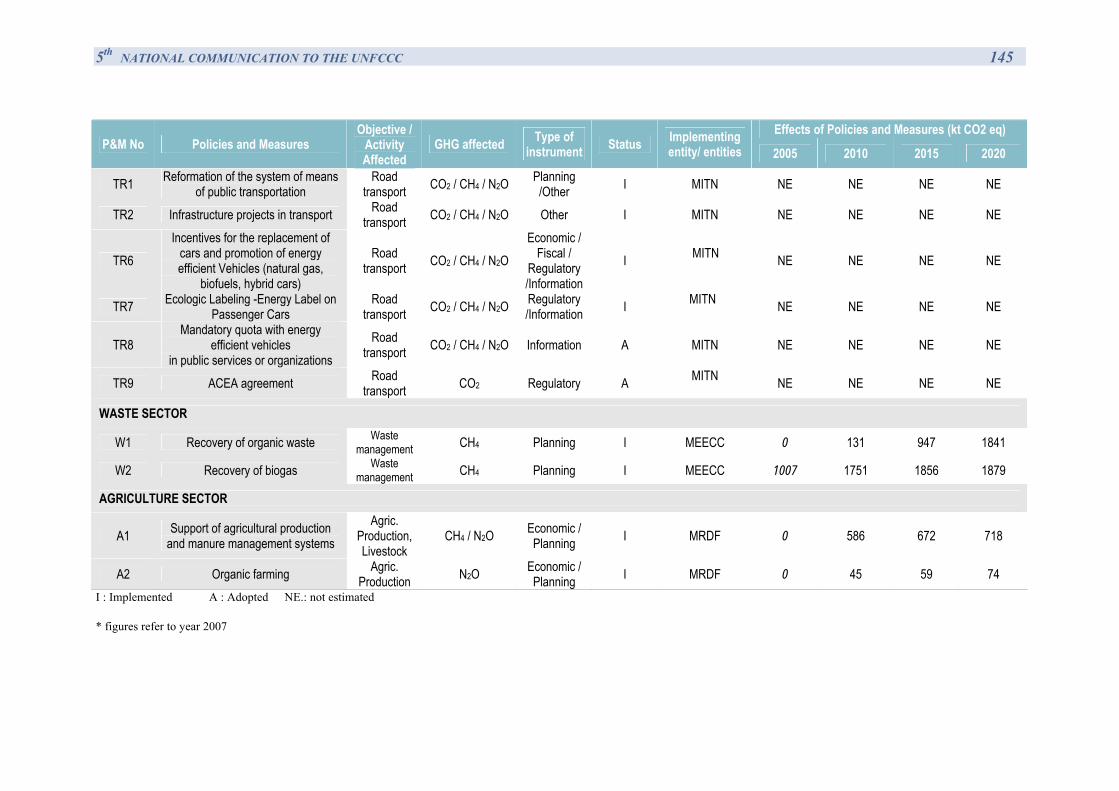
5th NATIONAL COMMUNICATION TO THE UNFCCC 145
Effects of Policies and Measures (kt CO2 eq) P&M No Policies and Measures
Objective / Activity Affected
GHG affected Type of instrument Status Implementing
entity/ entities 2005 2010 2015 2020
TR1 Reformation of the system of means of public transportation
Road transport CO2 / CH4 / N2O Planning
/Other I MΙTΝ NE NE NE NE
TR2 Infrastructure projects in transport Road transport CO2 / CH4 / N2O Other I MΙTΝ NE NE NE NE
TR6 Incentives for the replacement of
cars and promotion of energy efficient Vehicles (natural gas,
biofuels, hybrid cars)
Road transport CO2 / CH4 / N2O
Economic / Fiscal /
Regulatory /Information
I
MΙTΝ NE NE NE NE
TR7 Ecologic Labeling -Energy Label on Passenger Cars
Road transport CO2 / CH4 / N2O Regulatory
/Information I MΙTΝ NE NE NE NE
TR8 Mandatory quota with energy
efficient vehicles in public services or organizations
Road transport CO2 / CH4 / N2O Information A
MΙTΝ NE NE NE NE
TR9 ACEA agreement Road transport CO2 Regulatory A MΙTΝ NE NE NE NE
WASTE SECTOR
W1 Recovery of organic waste Waste management CH4 Planning I MEECC 0 131 947 1841
W2 Recovery of biogas Waste management CH4 Planning I MEECC 1007 1751 1856 1879
AGRICULTURE SECTOR
A1 Support of agricultural production and manure management systems
Agric. Production, Livestock
CH4 / N2O Economic / Planning I MRDF 0 586 672 718
A2 Organic farming Agric. Production N2O Economic /
Planning I MRDF 0 45 59 74 I : Implemented Α : Adopted NE.: not estimated
* figures refer to year 2007
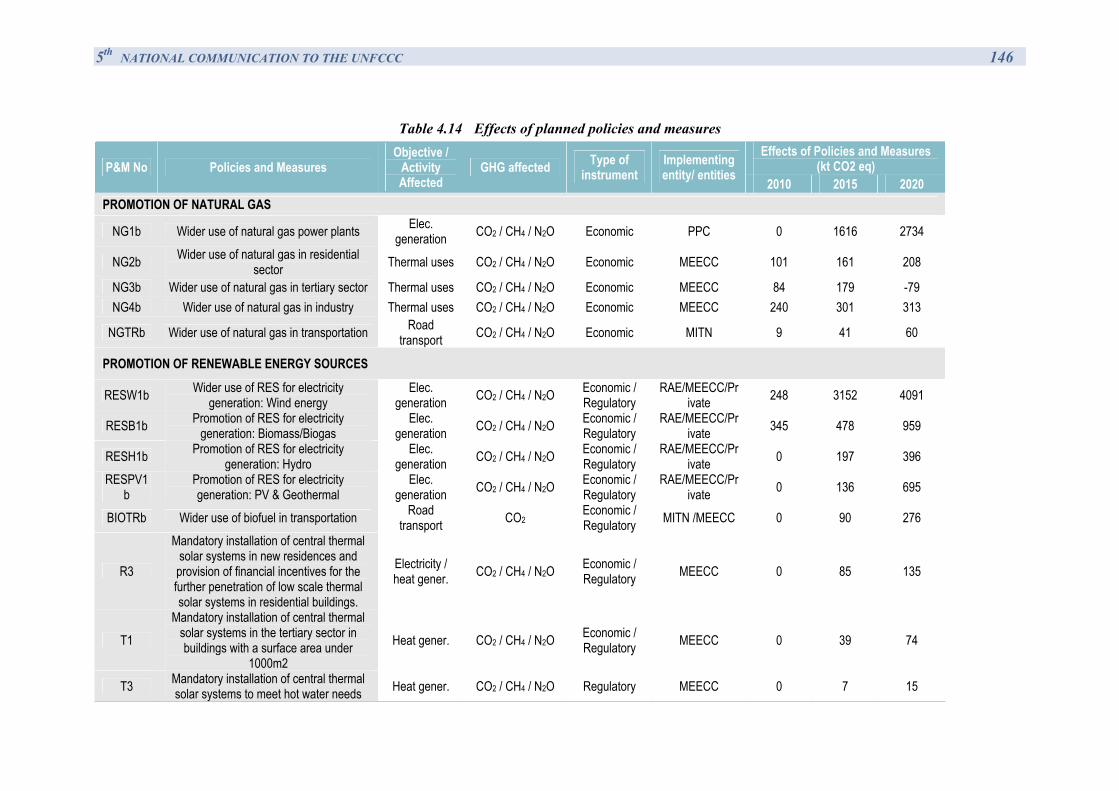
5th NATIONAL COMMUNICATION TO THE UNFCCC 146
Table 4.14 Effects of planned policies and measures Effects of Policies and Measures
(kt CO2 eq) P&M No Policies and Measures Objective /
Activity Affected
GHG affected Type of instrument
Implementing entity/ entities 2010 2015 2020
PROMOTION OF NATURAL GAS
NG1b Wider use of natural gas power plants Elec. generation CO2 / CH4 / N2O Economic PPC 0 1616 2734
NG2b Wider use of natural gas in residential sector Thermal uses CO2 / CH4 / N2O Economic MEECC 101 161 208
NG3b Wider use of natural gas in tertiary sector Thermal uses CO2 / CH4 / N2O Economic MEECC 84 179 -79 NG4b Wider use of natural gas in industry Thermal uses CO2 / CH4 / N2O Economic MEECC 240 301 313
NGTRb Wider use of natural gas in transportation Road transport CO2 / CH4 / N2O Economic MΙTΝ 9 41 60
PROMOTION OF RENEWABLE ENERGY SOURCES
RESW1b Wider use of RES for electricity generation: Wind energy
Elec. generation CO2 / CH4 / N2O Economic /
Regulatory RAE/MEECC/Pr
ivate 248 3152 4091
RESB1b Promotion of RES for electricity generation: Biomass/Biogas
Elec. generation CO2 / CH4 / N2O Economic /
Regulatory RAE/MEECC/Pr
ivate 345 478 959
RESH1b Promotion of RES for electricity generation: Hydro
Elec. generation CO2 / CH4 / N2O Economic /
Regulatory RAE/MEECC/Pr
ivate 0 197 396 RESPV1
b Promotion of RES for electricity generation: PV & Geothermal
Elec. generation CO2 / CH4 / N2O Economic /
Regulatory RAE/MEECC/Pr
ivate 0 136 695
BIOTRb Wider use of biofuel in transportation Road transport CO2 Economic /
Regulatory MΙTΝ /MEECC 0 90 276
R3
Mandatory installation of central thermal solar systems in new residences and provision of financial incentives for the further penetration of low scale thermal solar systems in residential buildings.
Electricity / heat gener. CO2 / CH4 / N2O Economic /
Regulatory MEECC 0 85 135
T1 Mandatory installation of central thermal
solar systems in the tertiary sector in buildings with a surface area under
1000m2 Heat gener. CO2 / CH4 / N2O Economic /
Regulatory MEECC 0 39 74
T3 Mandatory installation of central thermal solar systems to meet hot water needs Heat gener. CO2 / CH4 / N2O Regulatory MEECC 0 7 15
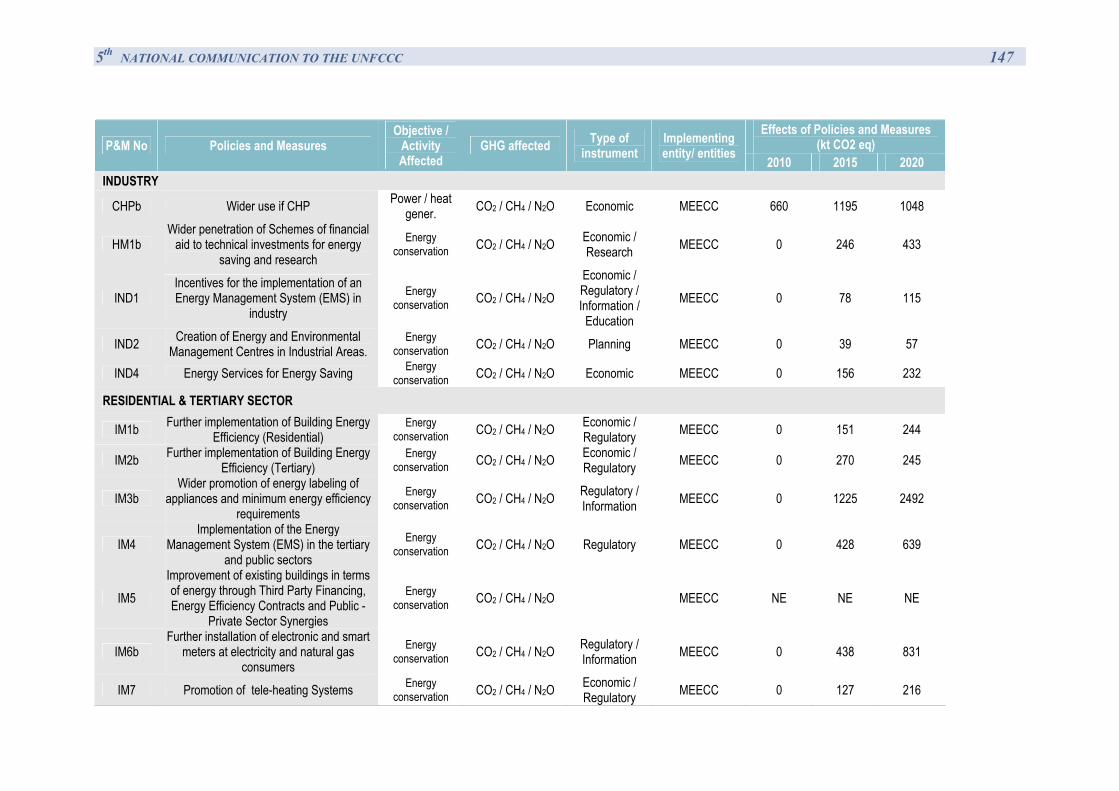
5th NATIONAL COMMUNICATION TO THE UNFCCC 147
Effects of Policies and Measures (kt CO2 eq) P&M No Policies and Measures
Objective / Activity Affected
GHG affected Type of instrument
Implementing entity/ entities 2010 2015 2020
INDUSTRY
CHPb Wider use if CHP Power / heat gener. CO2 / CH4 / N2O Economic MEECC 660 1195 1048
HM1b Wider penetration of Schemes of financial
aid to technical investments for energy saving and research
Energy conservation CO2 / CH4 / N2O Economic /
Research MEECC 0 246 433
IND1 Incentives for the implementation of an Energy Management System (EMS) in
industry Energy
conservation CO2 / CH4 / N2O Economic / Regulatory / Information /
Education MEECC 0 78 115
IND2 Creation of Energy and Environmental Management Centres in Industrial Areas.
Energy conservation CO2 / CH4 / N2O Planning MEECC 0 39 57
IND4 Energy Services for Energy Saving Energy conservation CO2 / CH4 / N2O Economic MEECC 0 156 232
RESIDENTIAL & TERTIARY SECTOR
IM1b Further implementation of Building Energy Efficiency (Residential)
Energy conservation CO2 / CH4 / N2O Economic /
Regulatory MEECC 0 151 244
IM2b Further implementation of Building Energy Efficiency (Tertiary)
Energy conservation CO2 / CH4 / N2O Economic /
Regulatory MEECC 0 270 245
IM3b Wider promotion of energy labeling of
appliances and minimum energy efficiency requirements
Energy conservation CO2 / CH4 / N2O Regulatory /
Information MEECC 0 1225 2492
IM4 Implementation of the Energy
Management System (EMS) in the tertiary and public sectors
Energy conservation CO2 / CH4 / N2O Regulatory MEECC 0 428 639
IM5 Improvement of existing buildings in terms of energy through Third Party Financing, Energy Efficiency Contracts and Public -
Private Sector Synergies
Energy conservation CO2 / CH4 / N2O MEECC NE NE NE
IM6b Further installation of electronic and smart
meters at electricity and natural gas consumers
Energy conservation CO2 / CH4 / N2O Regulatory /
Information MEECC 0 438 831
IM7 Promotion of tele-heating Systems Energy conservation CO2 / CH4 / N2O Economic /
Regulatory MEECC 0 127 216
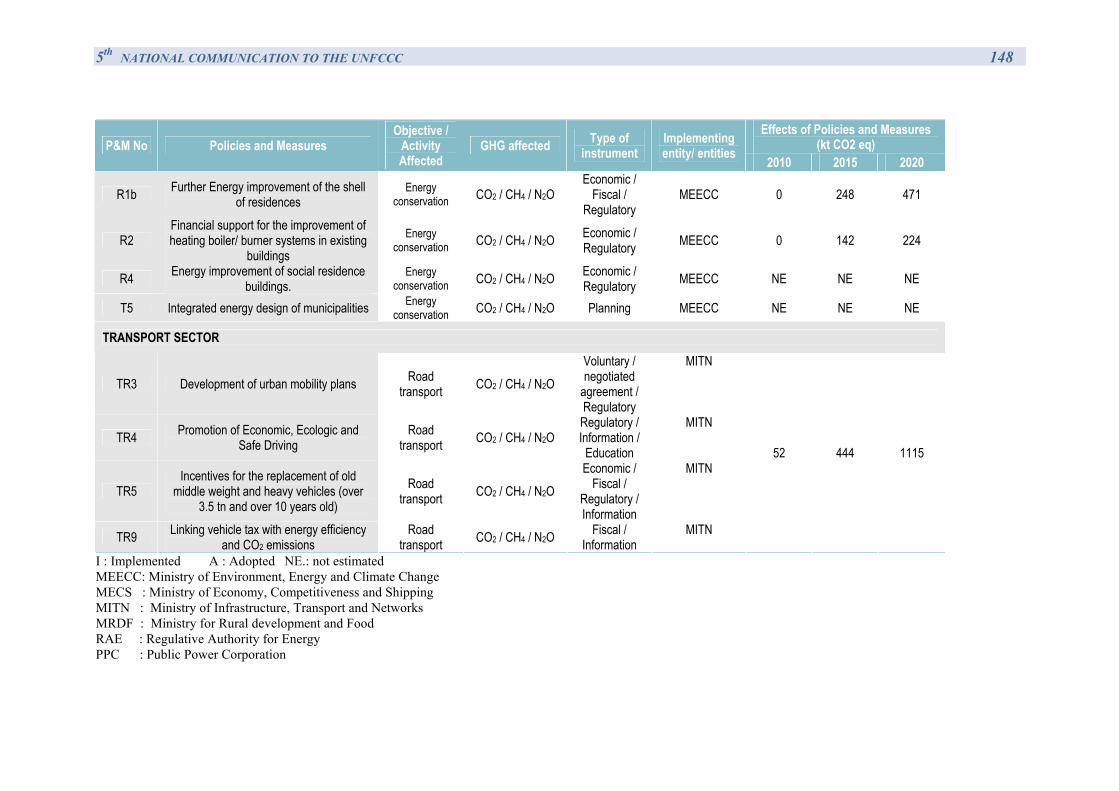
5th NATIONAL COMMUNICATION TO THE UNFCCC 148
Effects of Policies and Measures (kt CO2 eq) P&M No Policies and Measures
Objective / Activity Affected
GHG affected Type of instrument
Implementing entity/ entities 2010 2015 2020
R1b Further Energy improvement of the shell of residences
Energy conservation CO2 / CH4 / N2O
Economic / Fiscal /
Regulatory MEECC 0 248 471
R2 Financial support for the improvement of heating boiler/ burner systems in existing
buildings Energy
conservation CO2 / CH4 / N2O Economic / Regulatory MEECC 0 142 224
R4 Energy improvement of social residence buildings.
Energy conservation CO2 / CH4 / N2O Economic /
Regulatory MEECC NE NE NE
T5 Integrated energy design of municipalities Energy conservation CO2 / CH4 / N2O Planning MEECC NE NE NE
TRANSPORT SECTOR
TR3 Development of urban mobility plans Road transport CO2 / CH4 / N2O
Voluntary / negotiated
agreement / Regulatory
MΙTΝ
TR4 Promotion of Economic, Ecologic and Safe Driving
Road transport CO2 / CH4 / N2O
Regulatory / Information /
Education
MΙTΝ
TR5 Incentives for the replacement of old
middle weight and heavy vehicles (over 3.5 tn and over 10 years old)
Road transport CO2 / CH4 / N2O
Economic / Fiscal /
Regulatory / Information
MΙTΝ
TR9 Linking vehicle tax with energy efficiency and CO2 emissions
Road transport CO2 / CH4 / N2O Fiscal /
Information MΙTΝ
52 444 1115
I : Implemented Α : Adopted NE.: not estimated MEECC: Ministry of Environment, Energy and Climate Change MECS : Ministry of Economy, Competitiveness and Shipping MITN : Ministry of Infrastructure, Transport and Networks MRDF : Ministry for Rural development and Food RAE : Regulative Authority for Energy PPC : Public Power Corporation
5th NATIONAL COMMUNICATION TO THE UNFCCC 149
4.4 Minimization of adverse effects
The Kyoto Protocol aims at the implementation of effective policies and measures by Annex I Parties so as to prevent dangerous anthropogenic interference with the climate system, contributing thus in the minimisation of adverse effects of climate change on other Parties and especially developing countries. The Protocol has been designed to minimize the potential adverse effects that may be caused by the implementation of policies and measures adopted by Annex I Parties to specific sectors of economic activity, industrial sectors or other Parties to the Convention, including the adverse effects on the international trade, social, environmental and economic impacts in developing countries, etc.
The formulation of climate policy in Greece has taken into account the minimization of the adverse effects of emissions reduction policies and measures, according to Articles 4.8 and 4.9 of the Framework Convention on Climate Change and Article 2 of the Kyoto Protocol. More specific:
The implemented/adopted/planned measures concern various interventions and actions in all sectors of economic activity which are related with GHG emissions. Thus, policies and measures for the restriction of GHG emissions are applied to almost all sources of emissions, taking however at the same time into account the contribution of each source to the total GHG emissions, the existing emissions reduction potential, but also the economic attractiveness of the planned interventions.
Even though the majority of implemented/adopted/planned policies and measures aim at the restriction of CO2 emissions, nevertheless policies and measures focusing on the reduction of the non-CO2 GHG are already implemented. As a matter of fact, the reduction of CH4 emissions in accordance with the provisions of the Directive 1999/31/EC (reduction of the biodegradable wastes landfilled) as well as the reduction of f-gases emissions on the basis of the Regulation 2037/2000, are of major importance for Greece in order to meet its target under the Kyoto Protocol.
The penetration of natural gas and RES both in electricity generation and in final consumption (industry, residential – tertiary, transports) represents two fundamental policy axes for the fulfilment of the Kyoto target. Therefore, the differentiation of energy supply as well as the exploitation of domestic and environmental friendly energy resources (RES) is achieved. It is evident that the above-mentioned policies improve the safety of energy supply of the country while new commercial relationships are developed with those countries from which either natural gas is imported (e.g. Russia, Algeria, etc.) or transported through pipelines (e.g. Bulgaria, Turkey, Italy).
The EU emissions trading scheme provides the opportunity to achieve emissions reduction, at installation level, in terms of economic efficiency. Therefore, potential adverse effects are spread between the different sectors of economic activity. In addition, the possible transactions of CERs and ERUs could allow for the development of new commercial relationships between developed and developing countries, assisting sustainable development.
Greece has financed capacity building projects related to climate change in developing countries as well as in countries with economy in transition (see chapter 7,9). Special attention is given to vulnerable African countries.

5th NATIONAL COMMUNICATION TO THE UNFCCC 150
4.5 Policies and measures no longer in place
There are no policies and measures listed in previous national communications that are no longer in place.
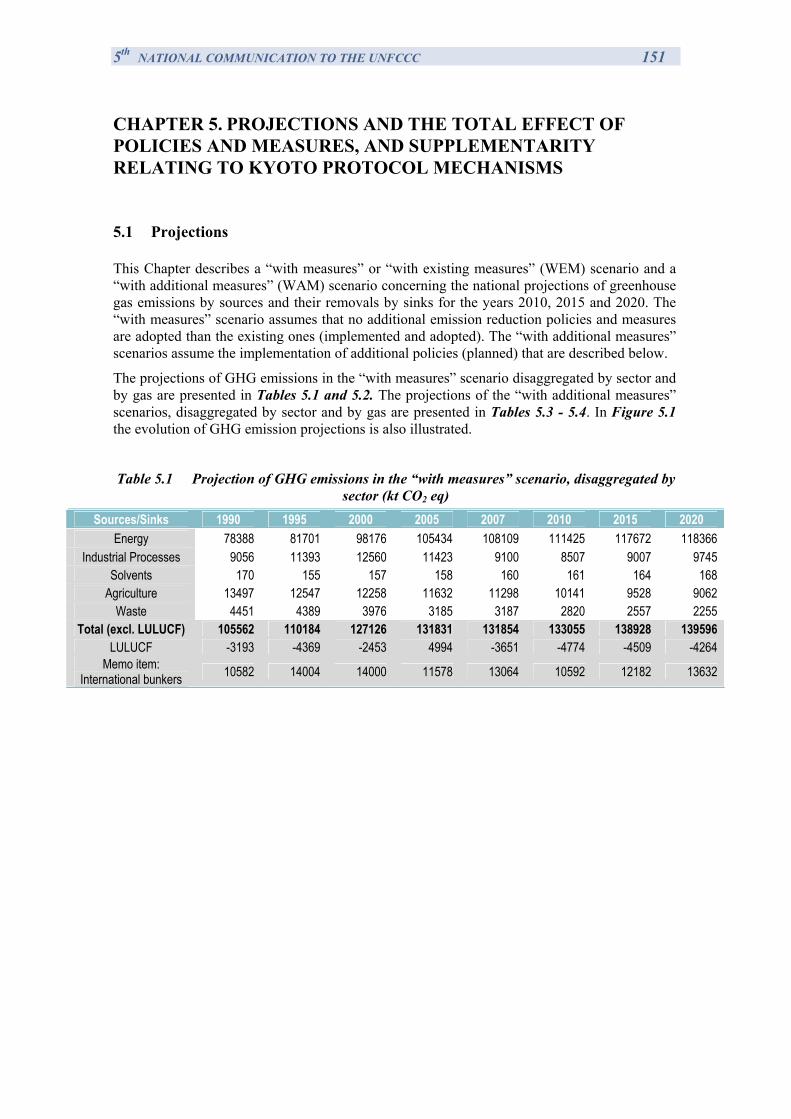
5th NATIONAL COMMUNICATION TO THE UNFCCC 151
CHAPTER 5. PROJECTIONS AND THE TOTAL EFFECT OF POLICIES AND MEASURES, AND SUPPLEMENTARITY RELATING TO KYOTO PROTOCOL MECHANISMS
5.1 Projections
This Chapter describes a “with measures” or “with existing measures” (WEM) scenario and a “with additional measures” (WAM) scenario concerning the national projections of greenhouse gas emissions by sources and their removals by sinks for the years 2010, 2015 and 2020. The “with measures” scenario assumes that no additional emission reduction policies and measures are adopted than the existing ones (implemented and adopted). The “with additional measures” scenarios assume the implementation of additional policies (planned) that are described below.
The projections of GHG emissions in the “with measures” scenario disaggregated by sector and by gas are presented in Tables 5.1 and 5.2. The projections of the “with additional measures” scenarios, disaggregated by sector and by gas are presented in Tables 5.3 - 5.4. In Figure 5.1 the evolution of GHG emission projections is also illustrated.
Table 5.1 Projection of GHG emissions in the “with measures” scenario, disaggregated by sector (kt CO2 eq)
Sources/Sinks 1990 1995 2000 2005 2007 2010 2015 2020 Energy 78388 81701 98176 105434 108109 111425 117672 118366
Industrial Processes 9056 11393 12560 11423 9100 8507 9007 9745 Solvents 170 155 157 158 160 161 164 168
Agriculture 13497 12547 12258 11632 11298 10141 9528 9062 Waste 4451 4389 3976 3185 3187 2820 2557 2255
Total (excl. LULUCF) 105562 110184 127126 131831 131854 133055 138928 139596 LULUCF -3193 -4369 -2453 4994 -3651 -4774 -4509 -4264
Memo item: International bunkers 10582 14004 14000 11578 13064 10592 12182 13632
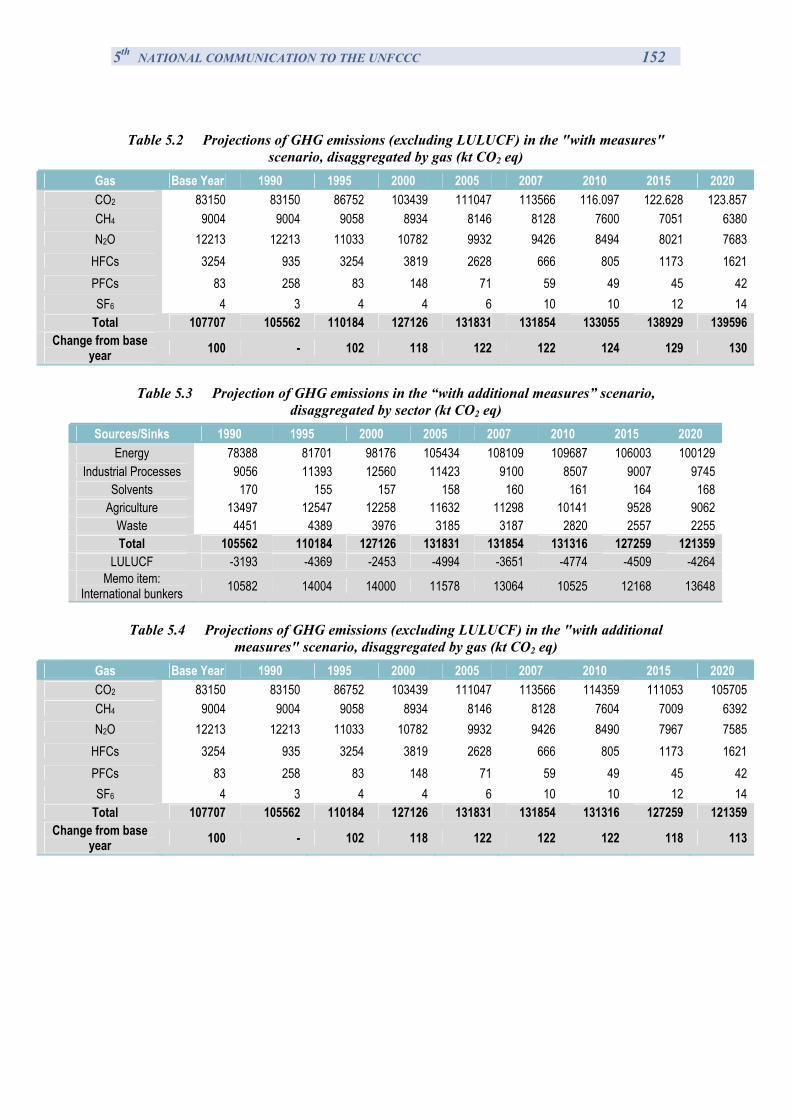
5th NATIONAL COMMUNICATION TO THE UNFCCC 152
Table 5.2 Projections of GHG emissions (excluding LULUCF) in the "with measures"
scenario, disaggregated by gas (kt CO2 eq) Gas Base Year 1990 1995 2000 2005 2007 2010 2015 2020 CO2 83150 83150 86752 103439 111047 113566 116.097 122.628 123.857 CH4 9004 9004 9058 8934 8146 8128 7600 7051 6380 N2O 12213 12213 11033 10782 9932 9426 8494 8021 7683
HFCs 3254 935 3254 3819 2628 666 805 1173 1621 PFCs 83 258 83 148 71 59 49 45 42 SF6 4 3 4 4 6 10 10 12 14
Total 107707 105562 110184 127126 131831 131854 133055 138929 139596 Change from base
year 100 - 102 118 122 122 124 129 130
Table 5.3 Projection of GHG emissions in the “with additional measures” scenario,
disaggregated by sector (kt CO2 eq) Sources/Sinks 1990 1995 2000 2005 2007 2010 2015 2020
Energy 78388 81701 98176 105434 108109 109687 106003 100129 Industrial Processes 9056 11393 12560 11423 9100 8507 9007 9745
Solvents 170 155 157 158 160 161 164 168 Agriculture 13497 12547 12258 11632 11298 10141 9528 9062
Waste 4451 4389 3976 3185 3187 2820 2557 2255 Total 105562 110184 127126 131831 131854 131316 127259 121359
LULUCF -3193 -4369 -2453 -4994 -3651 -4774 -4509 -4264 Memo item:
International bunkers 10582 14004 14000 11578 13064 10525 12168 13648
Table 5.4 Projections of GHG emissions (excluding LULUCF) in the "with additional
measures" scenario, disaggregated by gas (kt CO2 eq) Gas Base Year 1990 1995 2000 2005 2007 2010 2015 2020 CO2 83150 83150 86752 103439 111047 113566 114359 111053 105705 CH4 9004 9004 9058 8934 8146 8128 7604 7009 6392 N2O 12213 12213 11033 10782 9932 9426 8490 7967 7585
HFCs 3254 935 3254 3819 2628 666 805 1173 1621 PFCs 83 258 83 148 71 59 49 45 42 SF6 4 3 4 4 6 10 10 12 14
Total 107707 105562 110184 127126 131831 131854 131316 127259 121359 Change from base
year 100 - 102 118 122 122 122 118 113
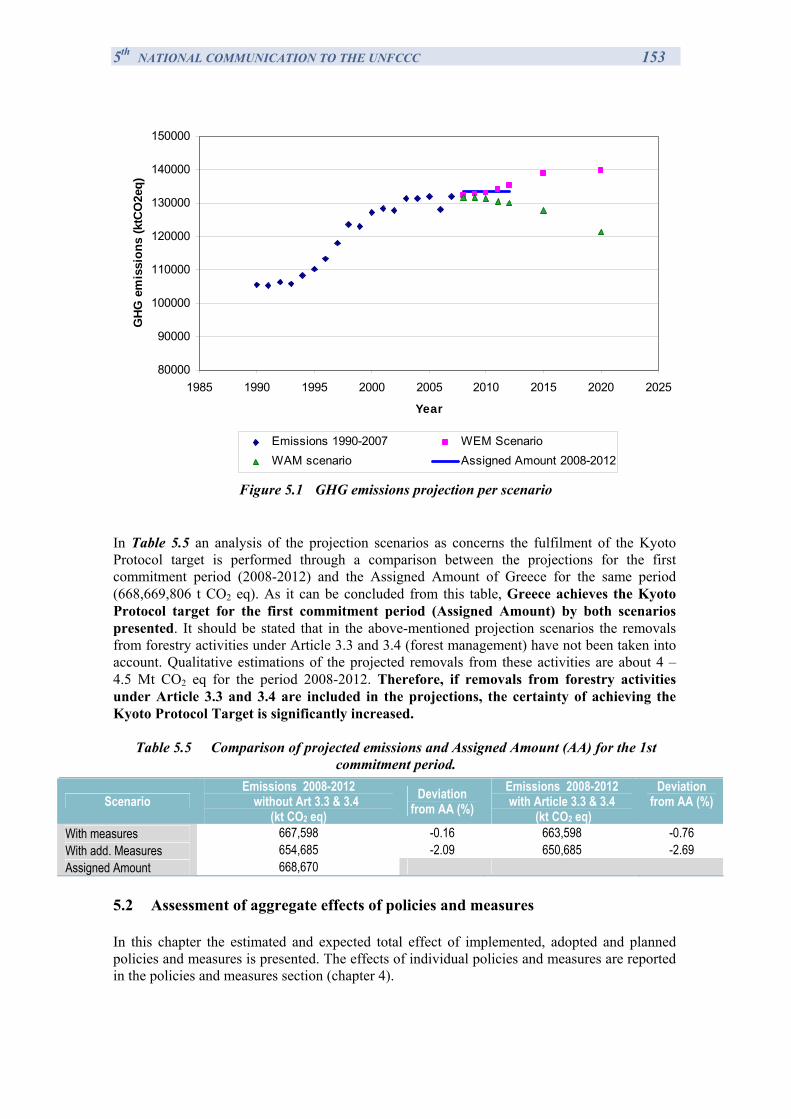
5th NATIONAL COMMUNICATION TO THE UNFCCC 153
80000
90000
100000
110000
120000
130000
140000
150000
1985 1990 1995 2000 2005 2010 2015 2020 2025
Year
GH
G e
mis
sion
s (k
tCO
2eq)
Emissions 1990-2007 WEM ScenarioWAM scenario Assigned Amount 2008-2012
Figure 5.1 GHG emissions projection per scenario
In Table 5.5 an analysis of the projection scenarios as concerns the fulfilment of the Kyoto Protocol target is performed through a comparison between the projections for the first commitment period (2008-2012) and the Assigned Amount of Greece for the same period (668,669,806 t CO2 eq). As it can be concluded from this table, Greece achieves the Kyoto Protocol target for the first commitment period (Assigned Amount) by both scenarios presented. It should be stated that in the above-mentioned projection scenarios the removals from forestry activities under Article 3.3 and 3.4 (forest management) have not been taken into account. Qualitative estimations of the projected removals from these activities are about 4 – 4.5 Mt CO2 eq for the period 2008-2012. Therefore, if removals from forestry activities under Article 3.3 and 3.4 are included in the projections, the certainty of achieving the Kyoto Protocol Target is significantly increased.
Table 5.5 Comparison of projected emissions and Assigned Amount (AA) for the 1st commitment period.
Scenario Emissions 2008-2012
without Art 3.3 & 3.4 (kt CO2 eq)
Deviation from AA (%)
Emissions 2008-2012 with Article 3.3 & 3.4
(kt CO2 eq)
Deviation from AA (%)
With measures 667,598 -0.16 663,598 -0.76 With add. Measures 654,685 -2.09 650,685 -2.69 Assigned Amount 668,670
5.2 Assessment of aggregate effects of policies and measures
In this chapter the estimated and expected total effect of implemented, adopted and planned policies and measures is presented. The effects of individual policies and measures are reported in the policies and measures section (chapter 4).
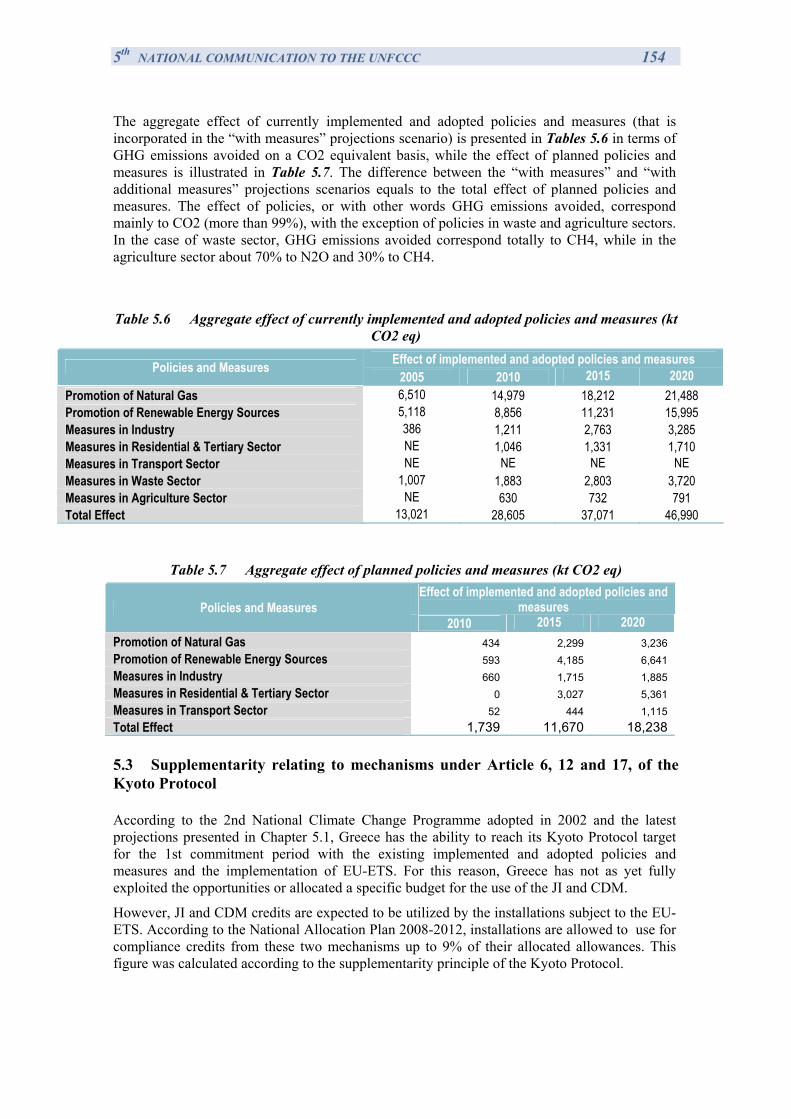
5th NATIONAL COMMUNICATION TO THE UNFCCC 154
The aggregate effect of currently implemented and adopted policies and measures (that is incorporated in the “with measures” projections scenario) is presented in Tables 5.6 in terms of GHG emissions avoided on a CO2 equivalent basis, while the effect of planned policies and measures is illustrated in Table 5.7. The difference between the “with measures” and “with additional measures” projections scenarios equals to the total effect of planned policies and measures. The effect of policies, or with other words GHG emissions avoided, correspond mainly to CO2 (more than 99%), with the exception of policies in waste and agriculture sectors. In the case of waste sector, GHG emissions avoided correspond totally to CH4, while in the agriculture sector about 70% to N2O and 30% to CH4.
Table 5.6 Aggregate effect of currently implemented and adopted policies and measures (kt
CO2 eq) Effect of implemented and adopted policies and measures Policies and Measures
2005 2010 2015 2020 Promotion of Natural Gas 6,510 14,979 18,212 21,488 Promotion of Renewable Energy Sources 5,118 8,856 11,231 15,995 Measures in Industry 386 1,211 2,763 3,285 Measures in Residential & Tertiary Sector NE 1,046 1,331 1,710 Measures in Transport Sector NE NE NE NE Measures in Waste Sector 1,007 1,883 2,803 3,720 Measures in Agriculture Sector NE 630 732 791 Total Effect 13,021 28,605 37,071 46,990
Table 5.7 Aggregate effect of planned policies and measures (kt CO2 eq) Effect of implemented and adopted policies and
measures Policies and Measures 2010 2015 2020
Promotion of Natural Gas 434 2,299 3,236 Promotion of Renewable Energy Sources 593 4,185 6,641 Measures in Industry 660 1,715 1,885 Measures in Residential & Tertiary Sector 0 3,027 5,361 Measures in Transport Sector 52 444 1,115 Total Effect 1,739 11,670 18,238 5.3 Supplementarity relating to mechanisms under Article 6, 12 and 17, of the Kyoto Protocol
According to the 2nd National Climate Change Programme adopted in 2002 and the latest projections presented in Chapter 5.1, Greece has the ability to reach its Kyoto Protocol target for the 1st commitment period with the existing implemented and adopted policies and measures and the implementation of EU-ETS. For this reason, Greece has not as yet fully exploited the opportunities or allocated a specific budget for the use of the JI and CDM.
However, JI and CDM credits are expected to be utilized by the installations subject to the EU-ETS. According to the National Allocation Plan 2008-2012, installations are allowed to use for compliance credits from these two mechanisms up to 9% of their allocated allowances. This figure was calculated according to the supplementarity principle of the Kyoto Protocol.
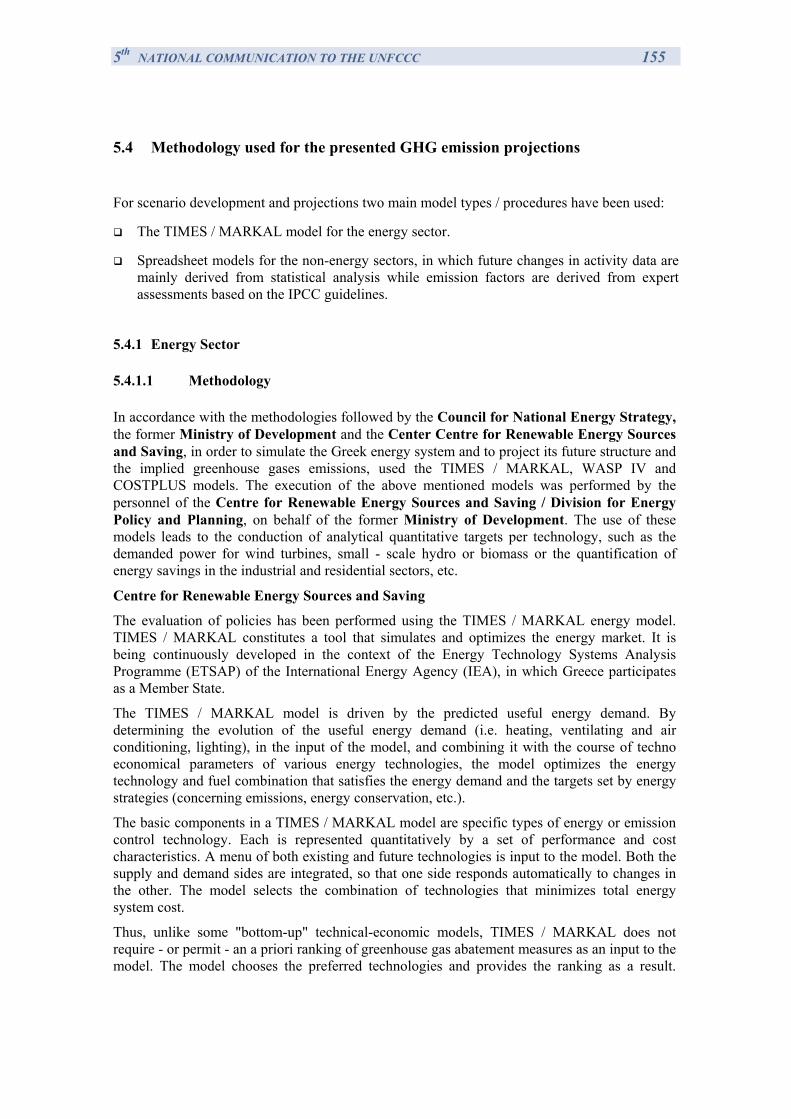
5th NATIONAL COMMUNICATION TO THE UNFCCC 155
5.4 Methodology used for the presented GHG emission projections
For scenario development and projections two main model types / procedures have been used:
The TIMES / MARKAL model for the energy sector.
Spreadsheet models for the non-energy sectors, in which future changes in activity data are mainly derived from statistical analysis while emission factors are derived from expert assessments based on the IPCC guidelines.
5.4.1 Energy Sector
5.4.1.1 Methodology
In accordance with the methodologies followed by the Council for National Energy Strategy, the former Ministry of Development and the Center Centre for Renewable Energy Sources and Saving, in order to simulate the Greek energy system and to project its future structure and the implied greenhouse gases emissions, used the TIMES / MARKAL, WASP IV and COSTPLUS models. The execution of the above mentioned models was performed by the personnel of the Centre for Renewable Energy Sources and Saving / Division for Energy Policy and Planning, on behalf of the former Ministry of Development. The use of these models leads to the conduction of analytical quantitative targets per technology, such as the demanded power for wind turbines, small - scale hydro or biomass or the quantification of energy savings in the industrial and residential sectors, etc.
Centre for Renewable Energy Sources and Saving
The evaluation of policies has been performed using the TIMES / MARKAL energy model. TIMES / MARKAL constitutes a tool that simulates and optimizes the energy market. It is being continuously developed in the context of the Energy Technology Systems Analysis Programme (ETSAP) of the International Energy Agency (IEA), in which Greece participates as a Member State.
The TIMES / MARKAL model is driven by the predicted useful energy demand. By determining the evolution of the useful energy demand (i.e. heating, ventilating and air conditioning, lighting), in the input of the model, and combining it with the course of techno economical parameters of various energy technologies, the model optimizes the energy technology and fuel combination that satisfies the energy demand and the targets set by energy strategies (concerning emissions, energy conservation, etc.).
The basic components in a TIMES / MARKAL model are specific types of energy or emission control technology. Each is represented quantitatively by a set of performance and cost characteristics. A menu of both existing and future technologies is input to the model. Both the supply and demand sides are integrated, so that one side responds automatically to changes in the other. The model selects the combination of technologies that minimizes total energy system cost.
Thus, unlike some "bottom-up" technical-economic models, TIMES / MARKAL does not require - or permit - an a priori ranking of greenhouse gas abatement measures as an input to the model. The model chooses the preferred technologies and provides the ranking as a result.
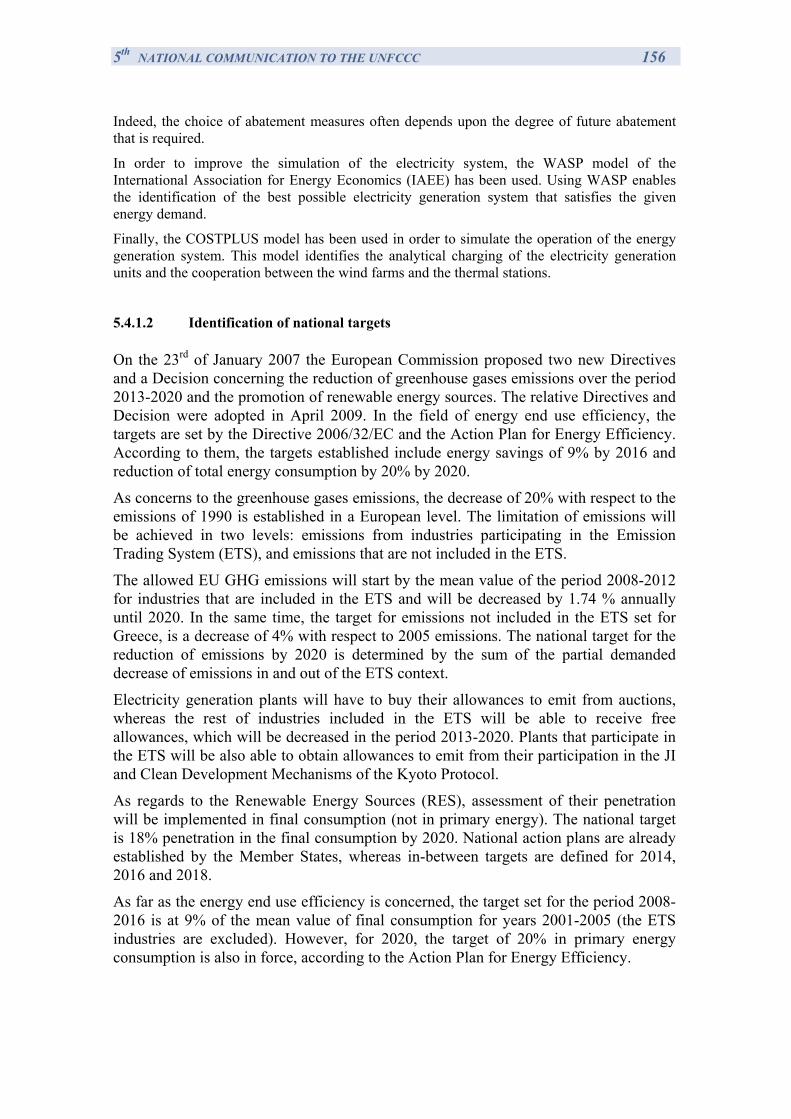
5th NATIONAL COMMUNICATION TO THE UNFCCC 156
Indeed, the choice of abatement measures often depends upon the degree of future abatement that is required.
In order to improve the simulation of the electricity system, the WASP model of the International Association for Energy Economics (IAEE) has been used. Using WASP enables the identification of the best possible electricity generation system that satisfies the given energy demand.
Finally, the COSTPLUS model has been used in order to simulate the operation of the energy generation system. This model identifies the analytical charging of the electricity generation units and the cooperation between the wind farms and the thermal stations.
5.4.1.2 Identification of national targets
On the 23rd of January 2007 the European Commission proposed two new Directives and a Decision concerning the reduction of greenhouse gases emissions over the period 2013-2020 and the promotion of renewable energy sources. The relative Directives and Decision were adopted in April 2009. In the field of energy end use efficiency, the targets are set by the Directive 2006/32/EC and the Action Plan for Energy Efficiency. According to them, the targets established include energy savings of 9% by 2016 and reduction of total energy consumption by 20% by 2020.
As concerns to the greenhouse gases emissions, the decrease of 20% with respect to the emissions of 1990 is established in a European level. The limitation of emissions will be achieved in two levels: emissions from industries participating in the Emission Trading System (ETS), and emissions that are not included in the ETS.
The allowed EU GHG emissions will start by the mean value of the period 2008-2012 for industries that are included in the ETS and will be decreased by 1.74 % annually until 2020. In the same time, the target for emissions not included in the ETS set for Greece, is a decrease of 4% with respect to 2005 emissions. The national target for the reduction of emissions by 2020 is determined by the sum of the partial demanded decrease of emissions in and out of the ETS context.
Electricity generation plants will have to buy their allowances to emit from auctions, whereas the rest of industries included in the ETS will be able to receive free allowances, which will be decreased in the period 2013-2020. Plants that participate in the ETS will be also able to obtain allowances to emit from their participation in the JI and Clean Development Mechanisms of the Kyoto Protocol.
As regards to the Renewable Energy Sources (RES), assessment of their penetration will be implemented in final consumption (not in primary energy). The national target is 18% penetration in the final consumption by 2020. National action plans are already established by the Member States, whereas in-between targets are defined for 2014, 2016 and 2018.
As far as the energy end use efficiency is concerned, the target set for the period 2008-2016 is at 9% of the mean value of final consumption for years 2001-2005 (the ETS industries are excluded). However, for 2020, the target of 20% in primary energy consumption is also in force, according to the Action Plan for Energy Efficiency.
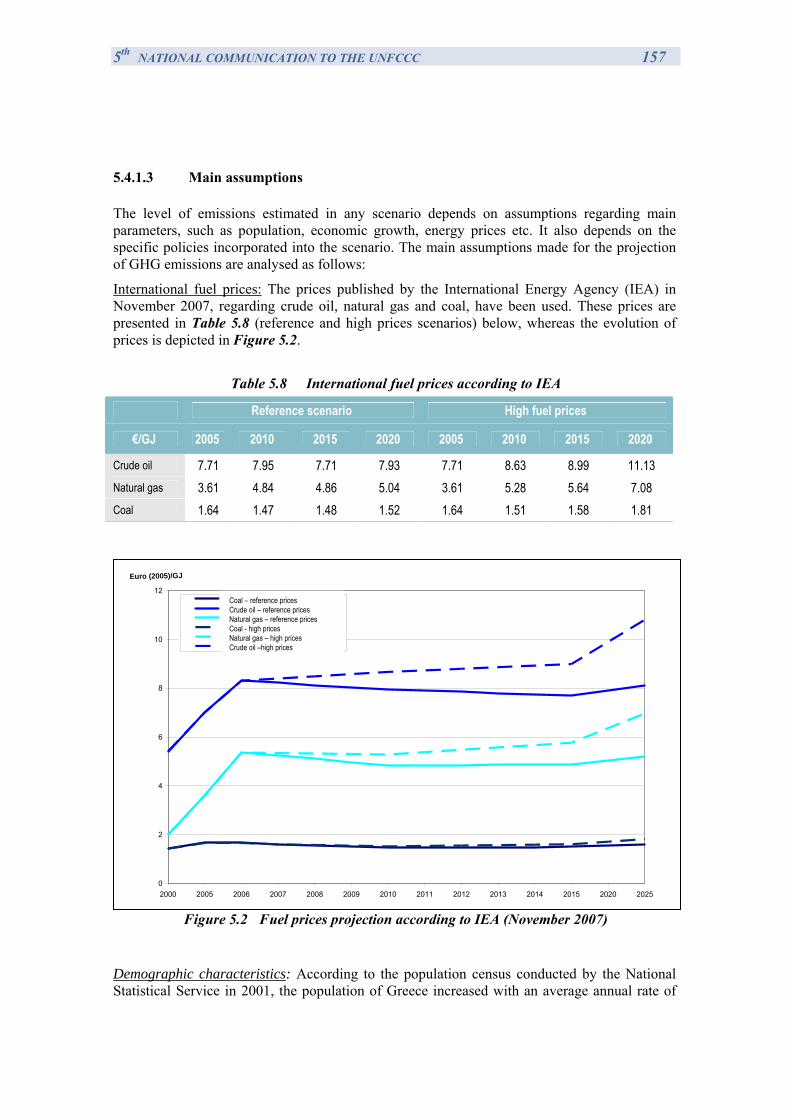
5th NATIONAL COMMUNICATION TO THE UNFCCC 157
5.4.1.3 Main assumptions
The level of emissions estimated in any scenario depends on assumptions regarding main parameters, such as population, economic growth, energy prices etc. It also depends on the specific policies incorporated into the scenario. The main assumptions made for the projection of GHG emissions are analysed as follows:
International fuel prices: The prices published by the International Energy Agency (IEA) in November 2007, regarding crude oil, natural gas and coal, have been used. These prices are presented in Table 5.8 (reference and high prices scenarios) below, whereas the evolution of prices is depicted in Figure 5.2.
Table 5.8 International fuel prices according to IEA
Reference scenario High fuel prices
€/GJ 2005 2010 2015 2020 2005 2010 2015 2020
Crude oil 7.71 7.95 7.71 7.93 7.71 8.63 8.99 11.13 Natural gas 3.61 4.84 4.86 5.04 3.61 5.28 5.64 7.08 Coal 1.64 1.47 1.48 1.52 1.64 1.51 1.58 1.81
Figure 5.2 Fuel prices projection according to IEA (November 2007)
Demographic characteristics: According to the population census conducted by the National Statistical Service in 2001, the population of Greece increased with an average annual rate of
0
2
4
6
8
10
12
2000 2005 2006 2007 2008 2009 2010 2011 2012 2013 2014 2015 2020 2025
Euro (2005)/GJ
Ανθρακας - ΑναφοράςΑργό Πετρέλαιο - Τιμές ΑναφοράςΦυσικό Αέριο - Τιμές ΑναφοράςΑνθρακας - ΥψηλόΦ. Αέριο - ΥψηλέςΑργό Πετρέλαιο - Υψηλές
Coal – reference prices Crude oil – reference prices Natural gas – reference prices Coal - high prices Natural gas – high prices Crude oil –high prices
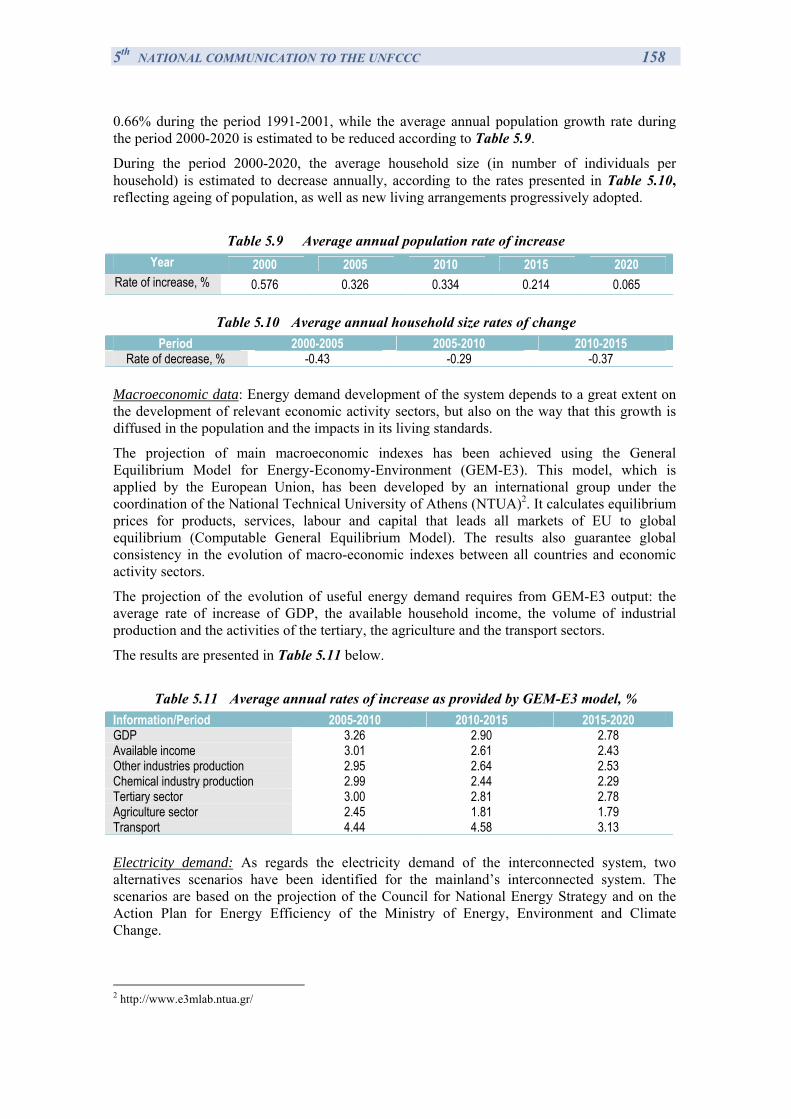
5th NATIONAL COMMUNICATION TO THE UNFCCC 158
0.66% during the period 1991-2001, while the average annual population growth rate during the period 2000-2020 is estimated to be reduced according to Table 5.9.
During the period 2000-2020, the average household size (in number of individuals per household) is estimated to decrease annually, according to the rates presented in Table 5.10, reflecting ageing of population, as well as new living arrangements progressively adopted.
Table 5.9 Average annual population rate of increase
Year 2000 2005 2010 2015 2020 Rate of increase, % 0.576 0.326 0.334 0.214 0.065
Table 5.10 Average annual household size rates of change Period 2000-2005 2005-2010 2010-2015
Rate of decrease, % -0.43 -0.29 -0.37 Macroeconomic data: Energy demand development of the system depends to a great extent on the development of relevant economic activity sectors, but also on the way that this growth is diffused in the population and the impacts in its living standards.
The projection of main macroeconomic indexes has been achieved using the General Equilibrium Model for Energy-Economy-Environment (GEM-E3). This model, which is applied by the European Union, has been developed by an international group under the coordination of the National Technical University of Athens (NTUA)2. It calculates equilibrium prices for products, services, labour and capital that leads all markets of EU to global equilibrium (Computable General Equilibrium Model). The results also guarantee global consistency in the evolution of macro-economic indexes between all countries and economic activity sectors.
The projection of the evolution of useful energy demand requires from GEM-E3 output: the average rate of increase of GDP, the available household income, the volume of industrial production and the activities of the tertiary, the agriculture and the transport sectors.
The results are presented in Table 5.11 below.
Table 5.11 Average annual rates of increase as provided by GEM-E3 model, %
Information/Period 2005-2010 2010-2015 2015-2020 GDP 3.26 2.90 2.78 Available income 3.01 2.61 2.43 Other industries production 2.95 2.64 2.53 Chemical industry production 2.99 2.44 2.29 Tertiary sector 3.00 2.81 2.78 Agriculture sector 2.45 1.81 1.79 Transport 4.44 4.58 3.13 Electricity demand: As regards the electricity demand of the interconnected system, two alternatives scenarios have been identified for the mainland’s interconnected system. The scenarios are based on the projection of the Council for National Energy Strategy and on the Action Plan for Energy Efficiency of the Ministry of Energy, Environment and Climate Change.
2 http://www.e3mlab.ntua.gr/
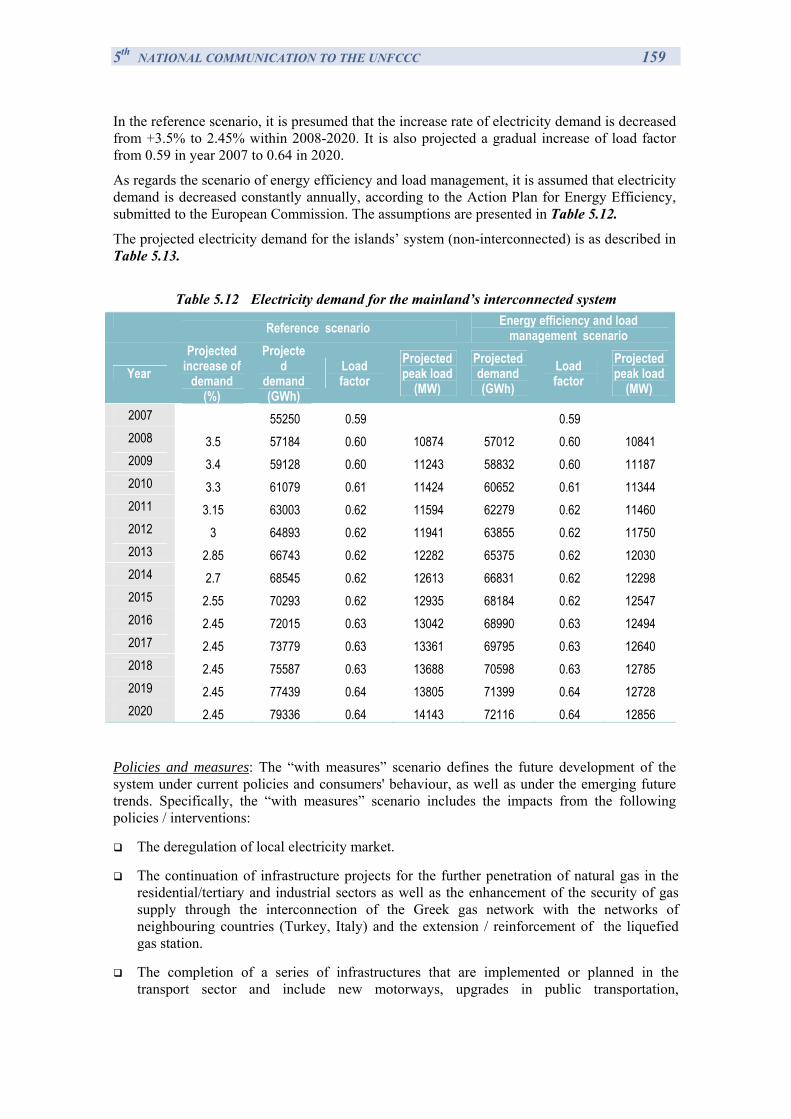
5th NATIONAL COMMUNICATION TO THE UNFCCC 159
In the reference scenario, it is presumed that the increase rate of electricity demand is decreased from +3.5% to 2.45% within 2008-2020. It is also projected a gradual increase of load factor from 0.59 in year 2007 to 0.64 in 2020.
As regards the scenario of energy efficiency and load management, it is assumed that electricity demand is decreased constantly annually, according to the Action Plan for Energy Efficiency, submitted to the European Commission. The assumptions are presented in Table 5.12.
The projected electricity demand for the islands’ system (non-interconnected) is as described in Table 5.13.
Table 5.12 Electricity demand for the mainland’s interconnected system
Reference scenario Energy efficiency and load management scenario
Year Projected
increase of demand
(%)
Projected
demand (GWh)
Load factor
Projected peak load
(MW)
Projected demand (GWh)
Load factor
Projected peak load
(MW)
2007 55250 0.59 0.59 2008 3.5 57184 0.60 10874 57012 0.60 10841 2009 3.4 59128 0.60 11243 58832 0.60 11187 2010 3.3 61079 0.61 11424 60652 0.61 11344 2011 3.15 63003 0.62 11594 62279 0.62 11460 2012 3 64893 0.62 11941 63855 0.62 11750 2013 2.85 66743 0.62 12282 65375 0.62 12030 2014 2.7 68545 0.62 12613 66831 0.62 12298 2015 2.55 70293 0.62 12935 68184 0.62 12547 2016 2.45 72015 0.63 13042 68990 0.63 12494 2017 2.45 73779 0.63 13361 69795 0.63 12640 2018 2.45 75587 0.63 13688 70598 0.63 12785 2019 2.45 77439 0.64 13805 71399 0.64 12728 2020 2.45 79336 0.64 14143 72116 0.64 12856
Policies and measures: The “with measures” scenario defines the future development of the system under current policies and consumers' behaviour, as well as under the emerging future trends. Specifically, the “with measures” scenario includes the impacts from the following policies / interventions:
The deregulation of local electricity market.
The continuation of infrastructure projects for the further penetration of natural gas in the residential/tertiary and industrial sectors as well as the enhancement of the security of gas supply through the interconnection of the Greek gas network with the networks of neighbouring countries (Turkey, Italy) and the extension / reinforcement of the liquefied gas station.
The completion of a series of infrastructures that are implemented or planned in the transport sector and include new motorways, upgrades in public transportation,
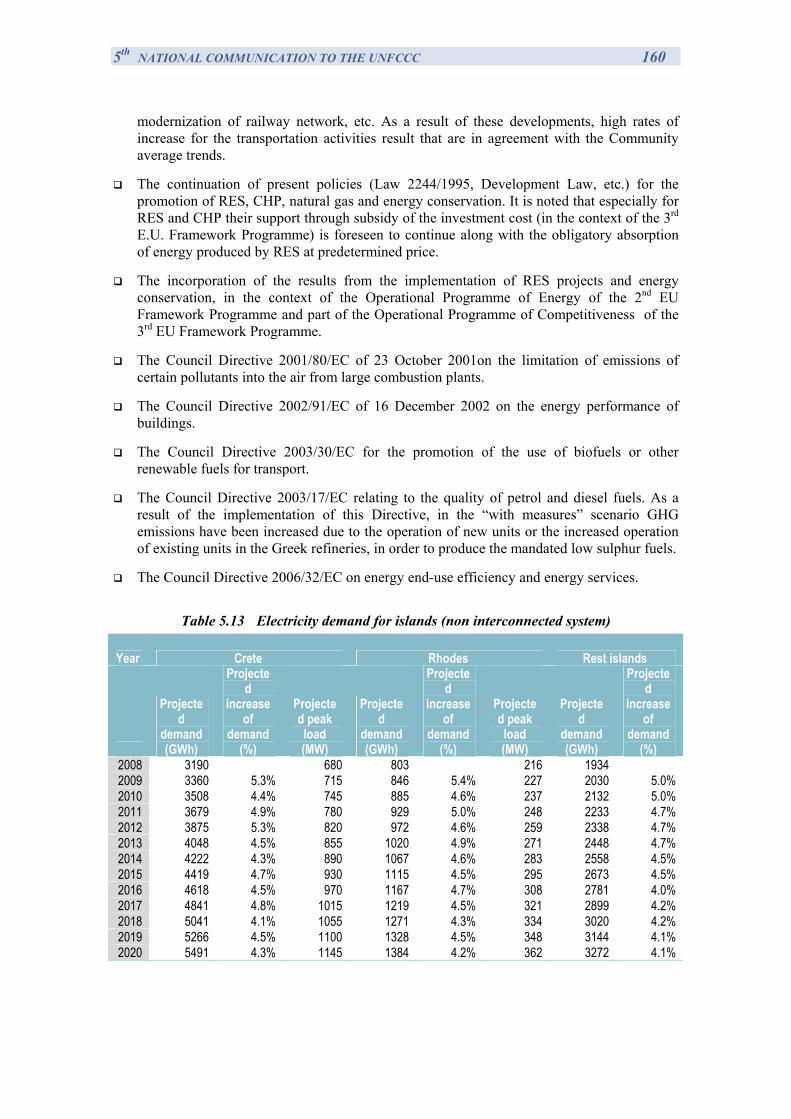
5th NATIONAL COMMUNICATION TO THE UNFCCC 160
modernization of railway network, etc. As a result of these developments, high rates of increase for the transportation activities result that are in agreement with the Community average trends.
The continuation of present policies (Law 2244/1995, Development Law, etc.) for the promotion of RES, CHP, natural gas and energy conservation. It is noted that especially for RES and CHP their support through subsidy of the investment cost (in the context of the 3rd E.U. Framework Programme) is foreseen to continue along with the obligatory absorption of energy produced by RES at predetermined price.
The incorporation of the results from the implementation of RES projects and energy conservation, in the context of the Operational Programme of Energy of the 2nd EU Framework Programme and part of the Operational Programme of Competitiveness of the 3rd EU Framework Programme.
The Council Directive 2001/80/EC of 23 October 2001on the limitation of emissions of certain pollutants into the air from large combustion plants.
The Council Directive 2002/91/EC of 16 December 2002 on the energy performance of buildings.
The Council Directive 2003/30/ΕC for the promotion of the use of biofuels or other renewable fuels for transport.
The Council Directive 2003/17/ΕC relating to the quality of petrol and diesel fuels. As a result of the implementation of this Directive, in the “with measures” scenario GHG emissions have been increased due to the operation of new units or the increased operation of existing units in the Greek refineries, in order to produce the mandated low sulphur fuels.
The Council Directive 2006/32/EC on energy end-use efficiency and energy services.
Table 5.13 Electricity demand for islands (non interconnected system)
Year Crete Rhodes Rest islands
Projected
demand (GWh)
Projected
increase of
demand (%)
Projected peak load (MW)
Projected
demand (GWh)
Projected
increase of
demand (%)
Projected peak load (MW)
Projected
demand (GWh)
Projected
increase of
demand (%)
2008 3190 680 803 216 1934 2009 3360 5.3% 715 846 5.4% 227 2030 5.0% 2010 3508 4.4% 745 885 4.6% 237 2132 5.0% 2011 3679 4.9% 780 929 5.0% 248 2233 4.7% 2012 3875 5.3% 820 972 4.6% 259 2338 4.7% 2013 4048 4.5% 855 1020 4.9% 271 2448 4.7% 2014 4222 4.3% 890 1067 4.6% 283 2558 4.5% 2015 4419 4.7% 930 1115 4.5% 295 2673 4.5% 2016 4618 4.5% 970 1167 4.7% 308 2781 4.0% 2017 4841 4.8% 1015 1219 4.5% 321 2899 4.2% 2018 5041 4.1% 1055 1271 4.3% 334 3020 4.2% 2019 5266 4.5% 1100 1328 4.5% 348 3144 4.1% 2020 5491 4.3% 1145 1384 4.2% 362 3272 4.1%
5th NATIONAL COMMUNICATION TO THE UNFCCC 161
5.4.1.4 Projections
In the current paragraph the structure and results of two alternative scenarios will be presented, the “with measures” and “with additional measures” scenarios.
The “with measures” scenario encompasses currently implemented and adopted policies and measures and includes evolution in the energy sector, not taking into account the new measures - policies. It assumes a cost of emissions of 40 €/t for electricity generation plants, high international price of oil and RES penetration according to the current rate. Measures for energy efficiency or for load management have been excluded. Electricity demand in the interconnected system is 79336 GWh in 2020, using a load factor from 0.59 in year 2007 to 0.64 in 2020. Decommissioning of old public electricity plants is taken into account and the operation of interconnections is simulated. The use of lignite is simulated according to the operation schedule of the Public Power Corporation (PPC) (4.8 GW) and a limit of 2.4 GW coal use has been considered. As concerns natural gas, the installed capacity is 6GW in the mainland system and 6.8GW in the whole country (in 2020). RES are being exploited as follows: 4GW of wind farms, 3.8GW of hydros, 100 MW of biogas and 600 MW of other RES (photovoltaics, geothermal etc). Cogeneration in the industry and the tertiary sectors is projected to be 1.4 GW.
The assumptions of the “with additional measures” scenario are the following:
Simulation of ETS operation assuming a cost of CO2 emissions for ETS industries of 40 €/tn CO2 after 2013.
Emissions not included in the ETS will be decreased by 4% compared to 2005 levels.
The evolution of energy efficiency targets will be according to the national action plan of energy efficiency, which is based on decision 2006/32/EC. The national action plan includes energy savings of 9% by 2016 compared to the average of years 2001-2005. For the year 2020 a projection of the target was applied.
The energy conservation of primary energy will evolve according to European target of 20% of 2005 level.
Electricity demand in the mainland’s interconnected system is projected to be 72116 GWh for 2020 and the load factor is altered from 59% to 64%.
As regards to power generation, thermal plants decommissioning, as planned by the PPC, has been taken into consideration and interconnections are being simulated.
RES penetration in final energy consumption will be about 18%.
RES penetration in power production will be about 30 %.
The high fuel prices scenario is considered.
Biofuels are considered to contribute at about 10 % of liquid fuels final consumption in the transport sector.
Therefore, for the “with additional measures” scenario, the installed power of lignite plants will be decreased from 4.9GW in year 2010 to 4GW in year 2020. Natural gas plants will be about 7GW and cogeneration plants about 1.5GW in year 2020. RES are being exploited as follows: 5.5 GW and 800MW of wind farms in the mainland’s system and in the islands, respectively, 600 and 200MW of photovoltaic systems in the mainland’s system and in the islands, respectively, 3.9GW of hydros of which 200MW corresponds to small scale hydros, 200 MW of biogas and 200MW of biomass. Considering that Milos will be interconnected to Cyclades, it
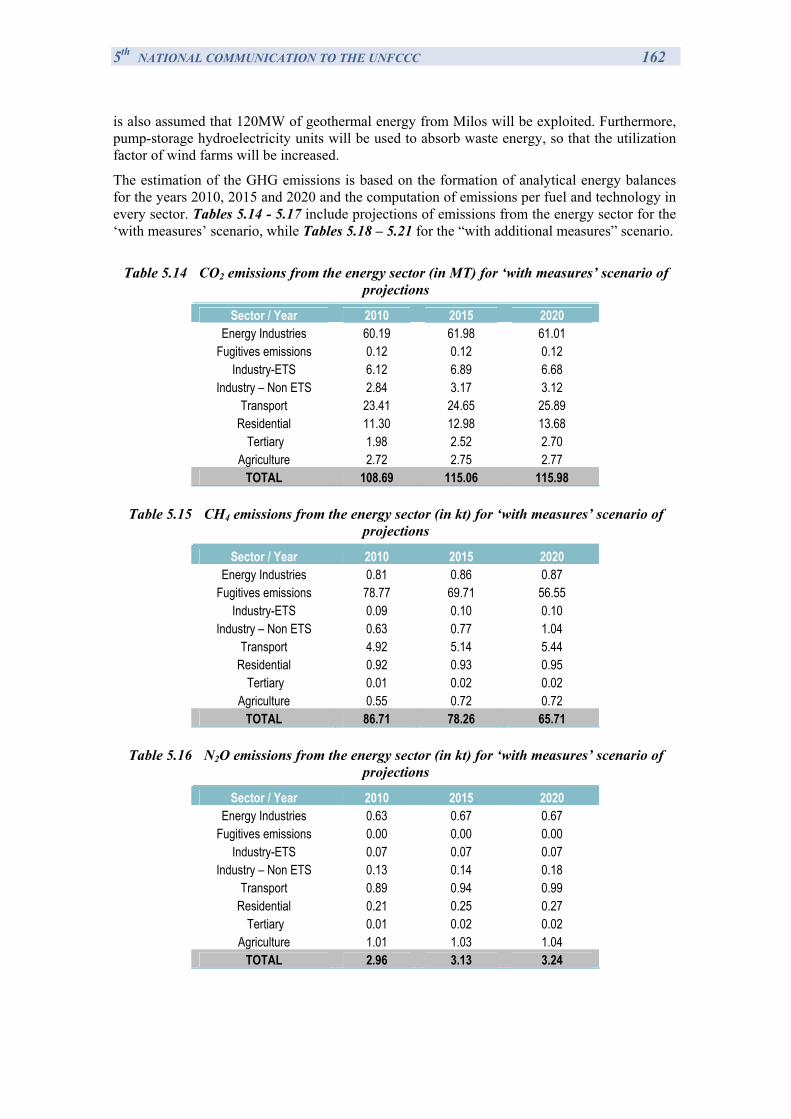
5th NATIONAL COMMUNICATION TO THE UNFCCC 162
is also assumed that 120MW of geothermal energy from Milos will be exploited. Furthermore, pump-storage hydroelectricity units will be used to absorb waste energy, so that the utilization factor of wind farms will be increased.
The estimation of the GHG emissions is based on the formation of analytical energy balances for the years 2010, 2015 and 2020 and the computation of emissions per fuel and technology in every sector. Tables 5.14 - 5.17 include projections of emissions from the energy sector for the ‘with measures’ scenario, while Tables 5.18 – 5.21 for the “with additional measures” scenario.
Table 5.14 CO2 emissions from the energy sector (in MT) for ‘with measures’ scenario of
projections
Sector / Year 2010 2015 2020 Energy Industries 60.19 61.98 61.01
Fugitives emissions 0.12 0.12 0.12 Industry-ETS 6.12 6.89 6.68
Industry – Non ETS 2.84 3.17 3.12 Transport 23.41 24.65 25.89
Residential 11.30 12.98 13.68 Tertiary 1.98 2.52 2.70
Agriculture 2.72 2.75 2.77 TOTAL 108.69 115.06 115.98
Table 5.15 CH4 emissions from the energy sector (in kt) for ‘with measures’ scenario of
projections
Sector / Year 2010 2015 2020 Energy Industries 0.81 0.86 0.87
Fugitives emissions 78.77 69.71 56.55 Industry-ETS 0.09 0.10 0.10
Industry – Non ETS 0.63 0.77 1.04 Transport 4.92 5.14 5.44
Residential 0.92 0.93 0.95 Tertiary 0.01 0.02 0.02
Agriculture 0.55 0.72 0.72 TOTAL 86.71 78.26 65.71
Table 5.16 N2O emissions from the energy sector (in kt) for ‘with measures’ scenario of
projections
Sector / Year 2010 2015 2020 Energy Industries 0.63 0.67 0.67
Fugitives emissions 0.00 0.00 0.00 Industry-ETS 0.07 0.07 0.07
Industry – Non ETS 0.13 0.14 0.18 Transport 0.89 0.94 0.99
Residential 0.21 0.25 0.27 Tertiary 0.01 0.02 0.02
Agriculture 1.01 1.03 1.04 TOTAL 2.96 3.13 3.24
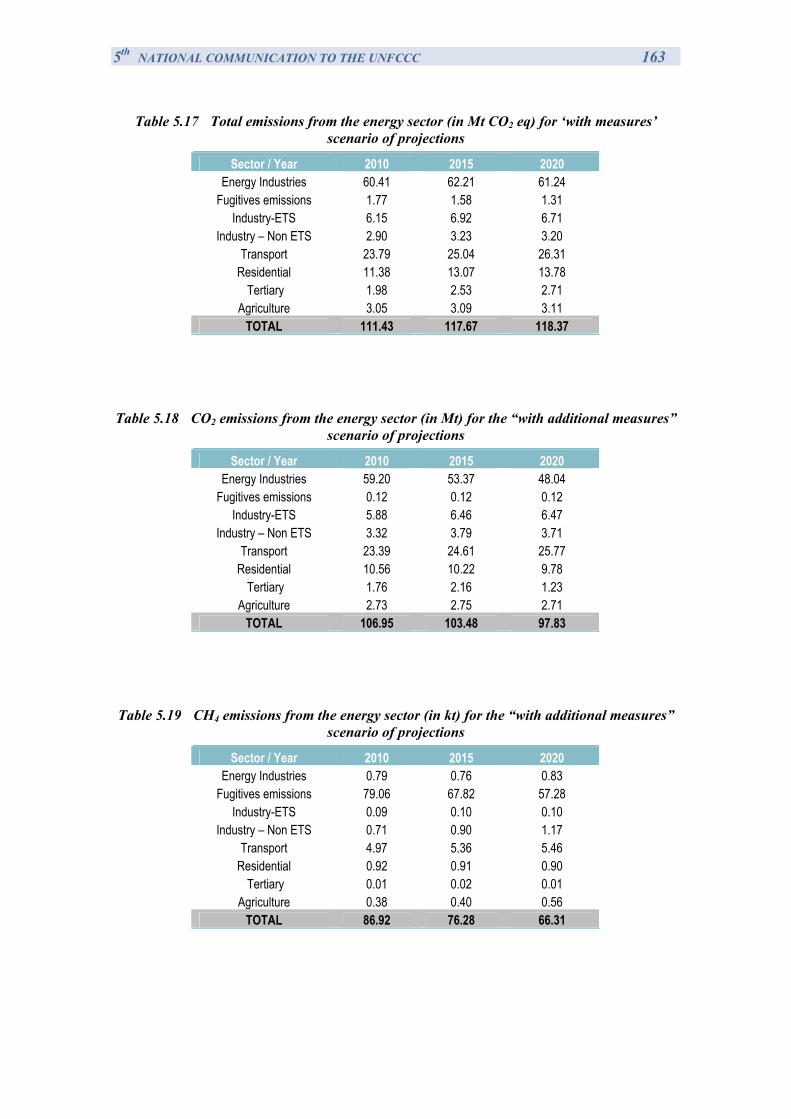
5th NATIONAL COMMUNICATION TO THE UNFCCC 163
Table 5.17 Total emissions from the energy sector (in Mt CO2 eq) for ‘with measures’ scenario of projections
Sector / Year 2010 2015 2020 Energy Industries 60.41 62.21 61.24
Fugitives emissions 1.77 1.58 1.31 Industry-ETS 6.15 6.92 6.71
Industry – Non ETS 2.90 3.23 3.20 Transport 23.79 25.04 26.31
Residential 11.38 13.07 13.78 Tertiary 1.98 2.53 2.71
Agriculture 3.05 3.09 3.11 TOTAL 111.43 117.67 118.37
Table 5.18 CO2 emissions from the energy sector (in Mt) for the “with additional measures”
scenario of projections
Sector / Year 2010 2015 2020 Energy Industries 59.20 53.37 48.04
Fugitives emissions 0.12 0.12 0.12 Industry-ETS 5.88 6.46 6.47
Industry – Non ETS 3.32 3.79 3.71 Transport 23.39 24.61 25.77
Residential 10.56 10.22 9.78 Tertiary 1.76 2.16 1.23
Agriculture 2.73 2.75 2.71 TOTAL 106.95 103.48 97.83
Table 5.19 CH4 emissions from the energy sector (in kt) for the “with additional measures”
scenario of projections
Sector / Year 2010 2015 2020 Energy Industries 0.79 0.76 0.83
Fugitives emissions 79.06 67.82 57.28 Industry-ETS 0.09 0.10 0.10
Industry – Non ETS 0.71 0.90 1.17 Transport 4.97 5.36 5.46
Residential 0.92 0.91 0.90 Tertiary 0.01 0.02 0.01
Agriculture 0.38 0.40 0.56 TOTAL 86.92 76.28 66.31
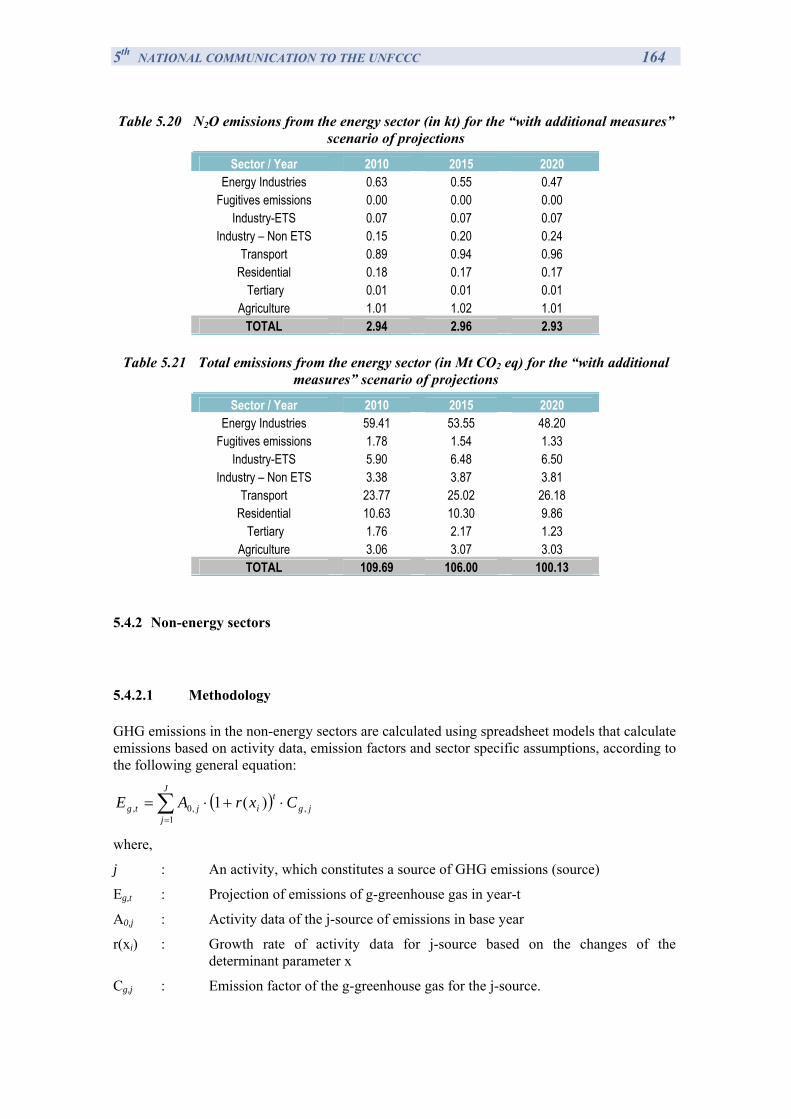
5th NATIONAL COMMUNICATION TO THE UNFCCC 164
Table 5.20 N2O emissions from the energy sector (in kt) for the “with additional measures” scenario of projections
Sector / Year 2010 2015 2020 Energy Industries 0.63 0.55 0.47
Fugitives emissions 0.00 0.00 0.00 Industry-ETS 0.07 0.07 0.07
Industry – Non ETS 0.15 0.20 0.24 Transport 0.89 0.94 0.96
Residential 0.18 0.17 0.17 Tertiary 0.01 0.01 0.01
Agriculture 1.01 1.02 1.01 TOTAL 2.94 2.96 2.93
Table 5.21 Total emissions from the energy sector (in Mt CO2 eq) for the “with additional
measures” scenario of projections
Sector / Year 2010 2015 2020 Energy Industries 59.41 53.55 48.20
Fugitives emissions 1.78 1.54 1.33 Industry-ETS 5.90 6.48 6.50
Industry – Non ETS 3.38 3.87 3.81 Transport 23.77 25.02 26.18
Residential 10.63 10.30 9.86 Tertiary 1.76 2.17 1.23
Agriculture 3.06 3.07 3.03 TOTAL 109.69 106.00 100.13
5.4.2 Non-energy sectors
5.4.2.1 Methodology
GHG emissions in the non-energy sectors are calculated using spreadsheet models that calculate emissions based on activity data, emission factors and sector specific assumptions, according to the following general equation:
( )∑=
⋅+⋅=J
jjg
tijtg CxrAE
1,,0, )(1
where,
j : An activity, which constitutes a source of GHG emissions (source)
Εg,t : Projection of emissions of g-greenhouse gas in year-t
A0,j : Activity data of the j-source of emissions in base year
r(xi) : Growth rate of activity data for j-source based on the changes of the determinant parameter x
Cg,j : Emission factor of the g-greenhouse gas for the j-source.
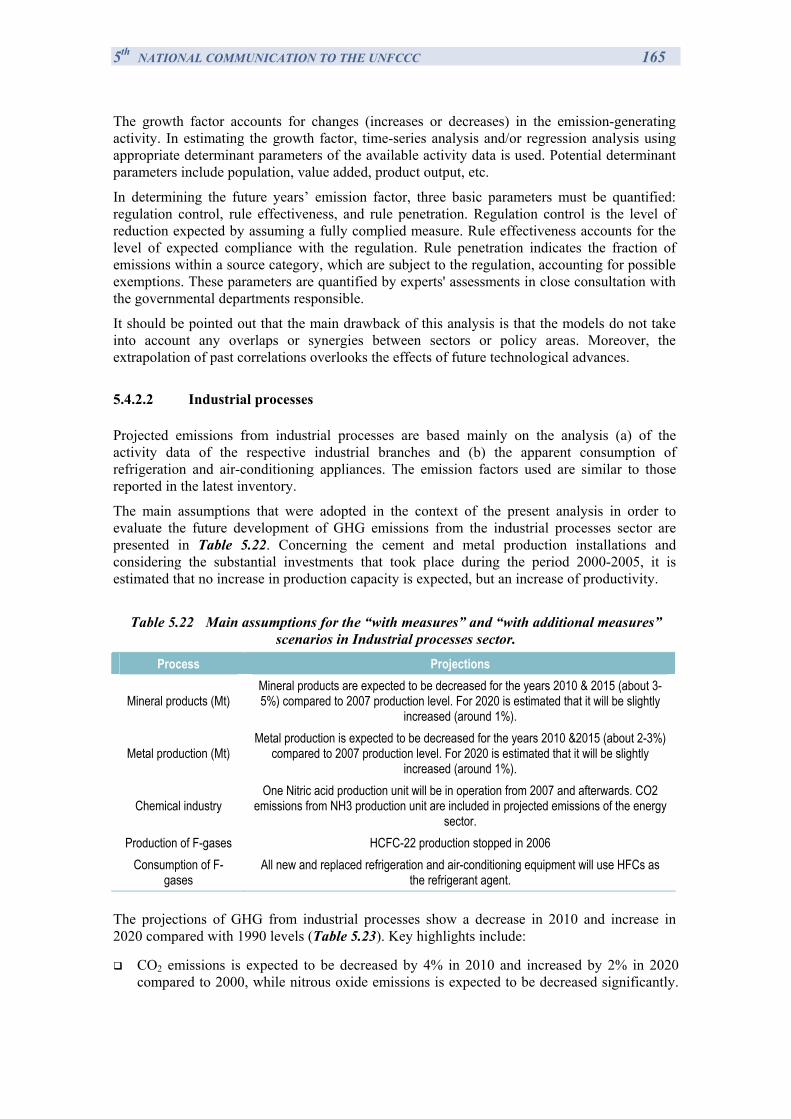
5th NATIONAL COMMUNICATION TO THE UNFCCC 165
The growth factor accounts for changes (increases or decreases) in the emission-generating activity. In estimating the growth factor, time-series analysis and/or regression analysis using appropriate determinant parameters of the available activity data is used. Potential determinant parameters include population, value added, product output, etc.
In determining the future years’ emission factor, three basic parameters must be quantified: regulation control, rule effectiveness, and rule penetration. Regulation control is the level of reduction expected by assuming a fully complied measure. Rule effectiveness accounts for the level of expected compliance with the regulation. Rule penetration indicates the fraction of emissions within a source category, which are subject to the regulation, accounting for possible exemptions. These parameters are quantified by experts' assessments in close consultation with the governmental departments responsible.
It should be pointed out that the main drawback of this analysis is that the models do not take into account any overlaps or synergies between sectors or policy areas. Moreover, the extrapolation of past correlations overlooks the effects of future technological advances.
5.4.2.2 Industrial processes
Projected emissions from industrial processes are based mainly on the analysis (a) of the activity data of the respective industrial branches and (b) the apparent consumption of refrigeration and air-conditioning appliances. The emission factors used are similar to those reported in the latest inventory.
The main assumptions that were adopted in the context of the present analysis in order to evaluate the future development of GHG emissions from the industrial processes sector are presented in Table 5.22. Concerning the cement and metal production installations and considering the substantial investments that took place during the period 2000-2005, it is estimated that no increase in production capacity is expected, but an increase of productivity.
Table 5.22 Main assumptions for the “with measures” and “with additional measures”
scenarios in Industrial processes sector.
Process Projections
Mineral products (Mt) Mineral products are expected to be decreased for the years 2010 & 2015 (about 3-5%) compared to 2007 production level. For 2020 is estimated that it will be slightly
increased (around 1%).
Metal production (Mt) Metal production is expected to be decreased for the years 2010 &2015 (about 2-3%)
compared to 2007 production level. For 2020 is estimated that it will be slightly increased (around 1%).
Chemical industry One Nitric acid production unit will be in operation from 2007 and afterwards. CO2
emissions from NH3 production unit are included in projected emissions of the energy sector.
Production of F-gases HCFC-22 production stopped in 2006 Consumption of F-
gases All new and replaced refrigeration and air-conditioning equipment will use HFCs as
the refrigerant agent. The projections of GHG from industrial processes show a decrease in 2010 and increase in 2020 compared with 1990 levels (Table 5.23). Key highlights include:
CO2 emissions is expected to be decreased by 4% in 2010 and increased by 2% in 2020 compared to 2000, while nitrous oxide emissions is expected to be decreased significantly.
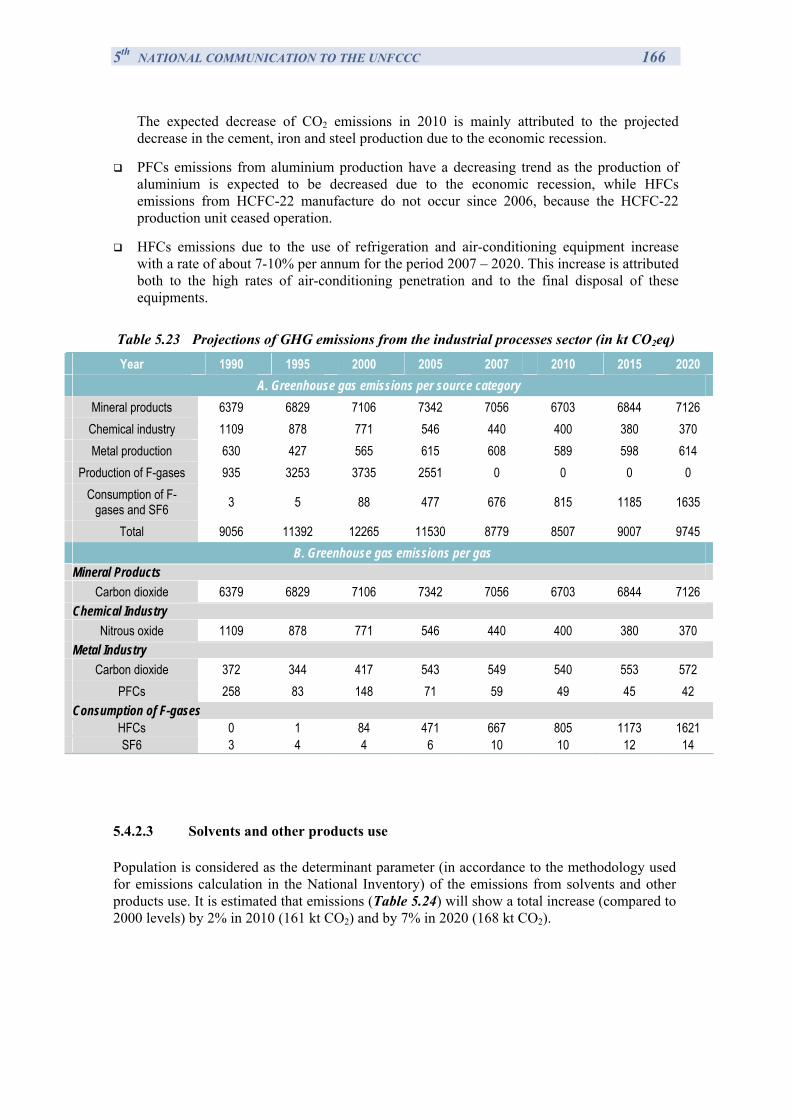
5th NATIONAL COMMUNICATION TO THE UNFCCC 166
The expected decrease of CO2 emissions in 2010 is mainly attributed to the projected decrease in the cement, iron and steel production due to the economic recession.
PFCs emissions from aluminium production have a decreasing trend as the production of aluminium is expected to be decreased due to the economic recession, while HFCs emissions from HCFC-22 manufacture do not occur since 2006, because the HCFC-22 production unit ceased operation.
HFCs emissions due to the use of refrigeration and air-conditioning equipment increase with a rate of about 7-10% per annum for the period 2007 – 2020. This increase is attributed both to the high rates of air-conditioning penetration and to the final disposal of these equipments.
Table 5.23 Projections of GHG emissions from the industrial processes sector (in kt CO2eq)
Year 1990 1995 2000 2005 2007 2010 2015 2020 A. Greenhouse gas emissions per source category
Mineral products 6379 6829 7106 7342 7056 6703 6844 7126 Chemical industry 1109 878 771 546 440 400 380 370 Metal production 630 427 565 615 608 589 598 614
Production of F-gases 935 3253 3735 2551 0 0 0 0 Consumption of F-
gases and SF6 3 5 88 477 676 815 1185 1635
Total 9056 11392 12265 11530 8779 8507 9007 9745 B. Greenhouse gas emissions per gas
Mineral Products Carbon dioxide 6379 6829 7106 7342 7056 6703 6844 7126
Chemical Industry Nitrous oxide 1109 878 771 546 440 400 380 370
Metal Industry Carbon dioxide 372 344 417 543 549 540 553 572
PFCs 258 83 148 71 59 49 45 42 Consumption of F-gases
HFCs 0 1 84 471 667 805 1173 1621 SF6 3 4 4 6 10 10 12 14
5.4.2.3 Solvents and other products use
Population is considered as the determinant parameter (in accordance to the methodology used for emissions calculation in the National Inventory) of the emissions from solvents and other products use. It is estimated that emissions (Table 5.24) will show a total increase (compared to 2000 levels) by 2% in 2010 (161 kt CO2) and by 7% in 2020 (168 kt CO2).
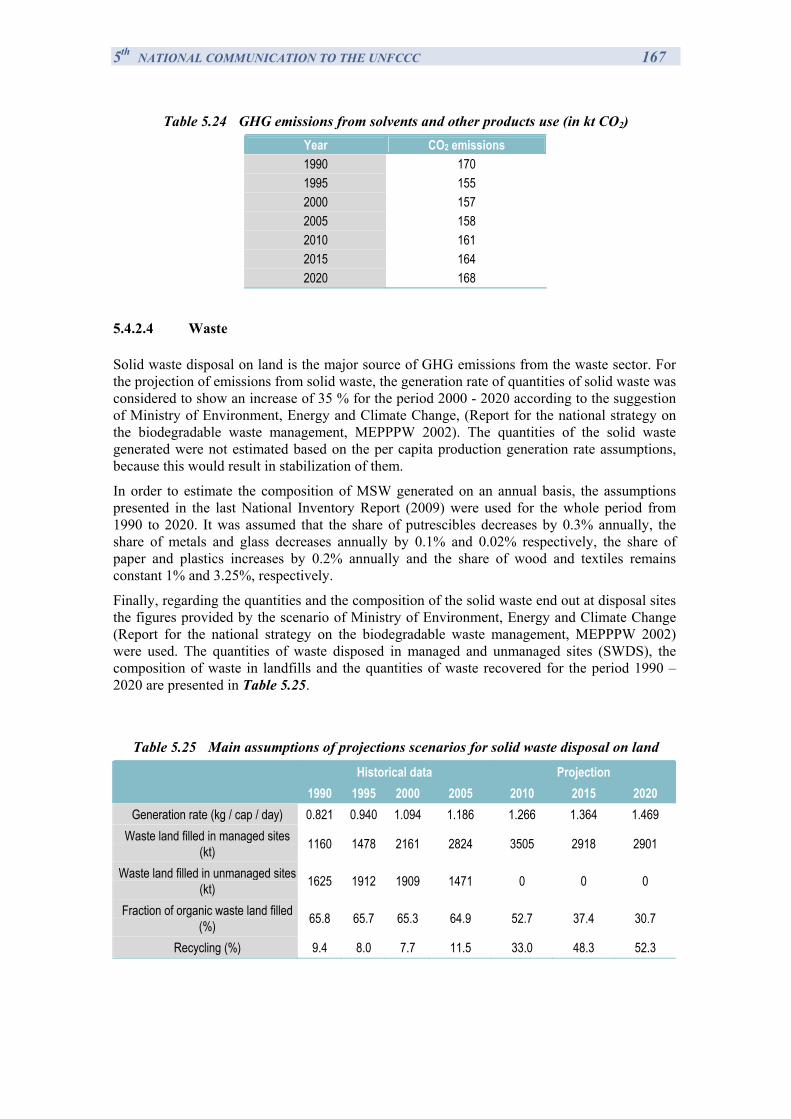
5th NATIONAL COMMUNICATION TO THE UNFCCC 167
Table 5.24 GHG emissions from solvents and other products use (in kt CO2) Year CO2 emissions 1990 170 1995 155 2000 157 2005 158 2010 161 2015 164 2020 168
5.4.2.4 Waste
Solid waste disposal on land is the major source of GHG emissions from the waste sector. For the projection of emissions from solid waste, the generation rate of quantities of solid waste was considered to show an increase of 35 % for the period 2000 - 2020 according to the suggestion of Ministry of Environment, Energy and Climate Change, (Report for the national strategy on the biodegradable waste management, MEPPPW 2002). The quantities of the solid waste generated were not estimated based on the per capita production generation rate assumptions, because this would result in stabilization of them.
In order to estimate the composition of MSW generated on an annual basis, the assumptions presented in the last National Inventory Report (2009) were used for the whole period from 1990 to 2020. It was assumed that the share of putrescibles decreases by 0.3% annually, the share of metals and glass decreases annually by 0.1% and 0.02% respectively, the share of paper and plastics increases by 0.2% annually and the share of wood and textiles remains constant 1% and 3.25%, respectively.
Finally, regarding the quantities and the composition of the solid waste end out at disposal sites the figures provided by the scenario of Ministry of Environment, Energy and Climate Change (Report for the national strategy on the biodegradable waste management, MEPPPW 2002) were used. The quantities of waste disposed in managed and unmanaged sites (SWDS), the composition of waste in landfills and the quantities of waste recovered for the period 1990 – 2020 are presented in Table 5.25.
Table 5.25 Main assumptions of projections scenarios for solid waste disposal on land
Historical data Projection 1990 1995 2000 2005 2010 2015 2020
Generation rate (kg / cap / day) 0.821 0.940 1.094 1.186 1.266 1.364 1.469 Waste land filled in managed sites
(kt) 1160 1478 2161 2824 3505 2918 2901
Waste land filled in unmanaged sites (kt) 1625 1912 1909 1471 0 0 0
Fraction of organic waste land filled (%) 65.8 65.7 65.3 64.9 52.7 37.4 30.7
Recycling (%) 9.4 8.0 7.7 11.5 33.0 48.3 52.3
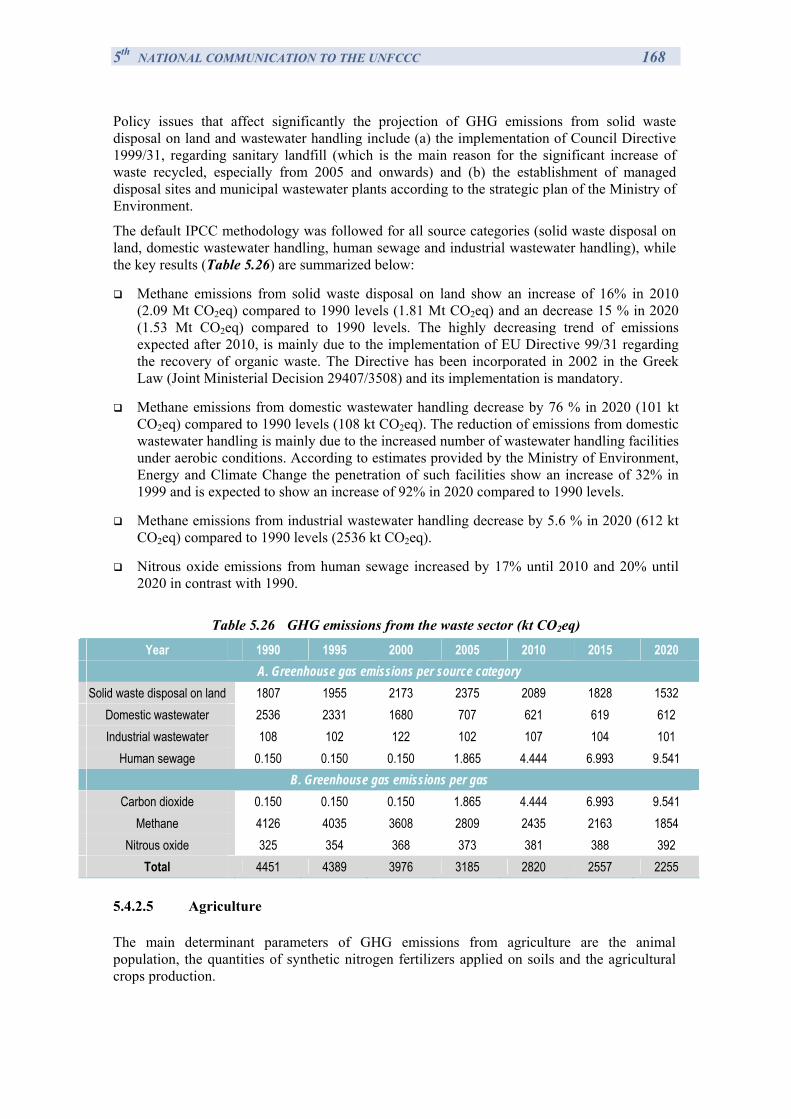
5th NATIONAL COMMUNICATION TO THE UNFCCC 168
Policy issues that affect significantly the projection of GHG emissions from solid waste disposal on land and wastewater handling include (a) the implementation of Council Directive 1999/31, regarding sanitary landfill (which is the main reason for the significant increase of waste recycled, especially from 2005 and onwards) and (b) the establishment of managed disposal sites and municipal wastewater plants according to the strategic plan of the Ministry of Environment.
The default IPCC methodology was followed for all source categories (solid waste disposal on land, domestic wastewater handling, human sewage and industrial wastewater handling), while the key results (Table 5.26) are summarized below:
Methane emissions from solid waste disposal on land show an increase of 16% in 2010 (2.09 Mt CO2eq) compared to 1990 levels (1.81 Mt CO2eq) and an decrease 15 % in 2020 (1.53 Mt CO2eq) compared to 1990 levels. The highly decreasing trend of emissions expected after 2010, is mainly due to the implementation of EU Directive 99/31 regarding the recovery of organic waste. The Directive has been incorporated in 2002 in the Greek Law (Joint Ministerial Decision 29407/3508) and its implementation is mandatory.
Methane emissions from domestic wastewater handling decrease by 76 % in 2020 (101 kt CO2eq) compared to 1990 levels (108 kt CO2eq). The reduction of emissions from domestic wastewater handling is mainly due to the increased number of wastewater handling facilities under aerobic conditions. According to estimates provided by the Ministry of Environment, Energy and Climate Change the penetration of such facilities show an increase of 32% in 1999 and is expected to show an increase of 92% in 2020 compared to 1990 levels.
Methane emissions from industrial wastewater handling decrease by 5.6 % in 2020 (612 kt CO2eq) compared to 1990 levels (2536 kt CO2eq).
Nitrous oxide emissions from human sewage increased by 17% until 2010 and 20% until 2020 in contrast with 1990.
Table 5.26 GHG emissions from the waste sector (kt CO2eq)
Year 1990 1995 2000 2005 2010 2015 2020 A. Greenhouse gas emissions per source category
Solid waste disposal on land 1807 1955 2173 2375 2089 1828 1532 Domestic wastewater 2536 2331 1680 707 621 619 612 Industrial wastewater 108 102 122 102 107 104 101
Human sewage 0.150 0.150 0.150 1.865 4.444 6.993 9.541 B. Greenhouse gas emissions per gas
Carbon dioxide 0.150 0.150 0.150 1.865 4.444 6.993 9.541 Methane 4126 4035 3608 2809 2435 2163 1854
Nitrous oxide 325 354 368 373 381 388 392 Total 4451 4389 3976 3185 2820 2557 2255
5.4.2.5 Agriculture
The main determinant parameters of GHG emissions from agriculture are the animal population, the quantities of synthetic nitrogen fertilizers applied on soils and the agricultural crops production.
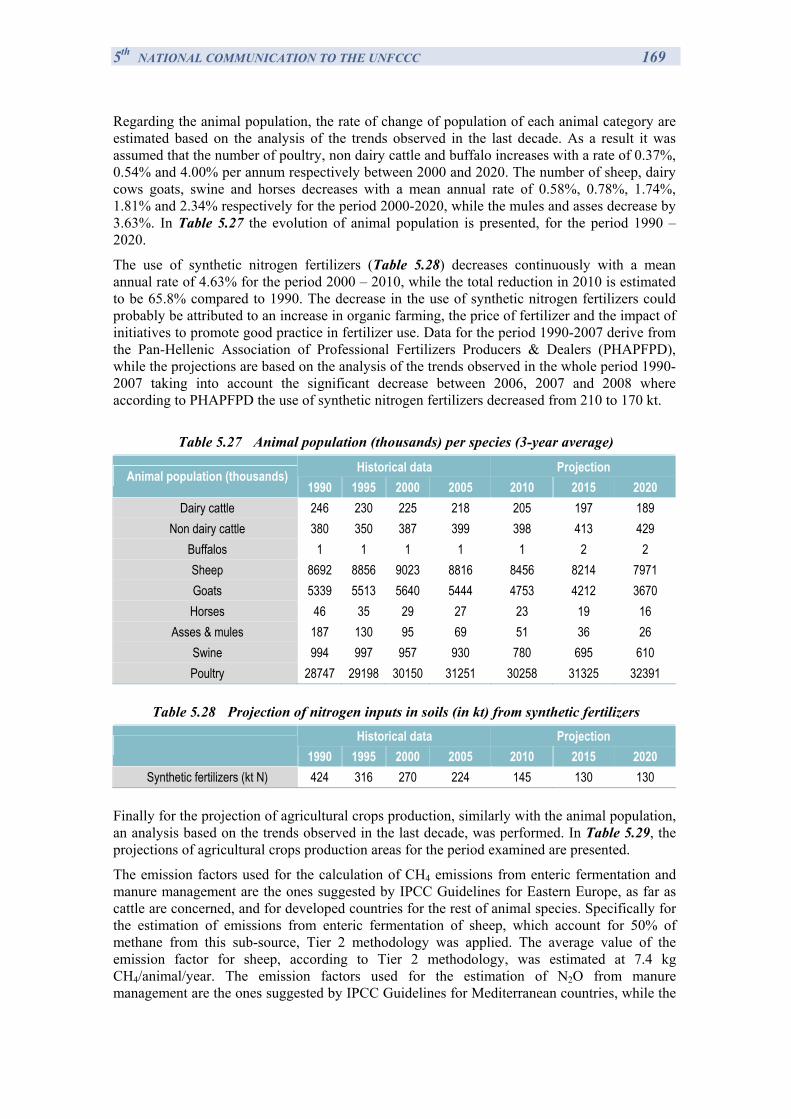
5th NATIONAL COMMUNICATION TO THE UNFCCC 169
Regarding the animal population, the rate of change of population of each animal category are estimated based on the analysis of the trends observed in the last decade. As a result it was assumed that the number of poultry, non dairy cattle and buffalo increases with a rate of 0.37%, 0.54% and 4.00% per annum respectively between 2000 and 2020. The number of sheep, dairy cows goats, swine and horses decreases with a mean annual rate of 0.58%, 0.78%, 1.74%, 1.81% and 2.34% respectively for the period 2000-2020, while the mules and asses decrease by 3.63%. In Table 5.27 the evolution of animal population is presented, for the period 1990 – 2020.
The use of synthetic nitrogen fertilizers (Table 5.28) decreases continuously with a mean annual rate of 4.63% for the period 2000 – 2010, while the total reduction in 2010 is estimated to be 65.8% compared to 1990. The decrease in the use of synthetic nitrogen fertilizers could probably be attributed to an increase in organic farming, the price of fertilizer and the impact of initiatives to promote good practice in fertilizer use. Data for the period 1990-2007 derive from the Pan-Hellenic Association of Professional Fertilizers Producers & Dealers (PHAPFPD), while the projections are based on the analysis of the trends observed in the whole period 1990-2007 taking into account the significant decrease between 2006, 2007 and 2008 where according to PHAPFPD the use of synthetic nitrogen fertilizers decreased from 210 to 170 kt.
Table 5.27 Animal population (thousands) per species (3-year average)
Historical data Projection Animal population (thousands) 1990 1995 2000 2005 2010 2015 2020
Dairy cattle 246 230 225 218 205 197 189 Non dairy cattle 380 350 387 399 398 413 429
Buffalos 1 1 1 1 1 2 2 Sheep 8692 8856 9023 8816 8456 8214 7971 Goats 5339 5513 5640 5444 4753 4212 3670 Horses 46 35 29 27 23 19 16
Asses & mules 187 130 95 69 51 36 26 Swine 994 997 957 930 780 695 610 Poultry 28747 29198 30150 31251 30258 31325 32391
Table 5.28 Projection of nitrogen inputs in soils (in kt) from synthetic fertilizers
Historical data Projection
1990 1995 2000 2005 2010 2015 2020 Synthetic fertilizers (kt N) 424 316 270 224 145 130 130
Finally for the projection of agricultural crops production, similarly with the animal population, an analysis based on the trends observed in the last decade, was performed. In Table 5.29, the projections of agricultural crops production areas for the period examined are presented.
The emission factors used for the calculation of CH4 emissions from enteric fermentation and manure management are the ones suggested by IPCC Guidelines for Eastern Europe, as far as cattle are concerned, and for developed countries for the rest of animal species. Specifically for the estimation of emissions from enteric fermentation of sheep, which account for 50% of methane from this sub-source, Tier 2 methodology was applied. The average value of the emission factor for sheep, according to Tier 2 methodology, was estimated at 7.4 kg CH4/animal/year. The emission factors used for the estimation of Ν2Ο from manure management are the ones suggested by IPCC Guidelines for Mediterranean countries, while the
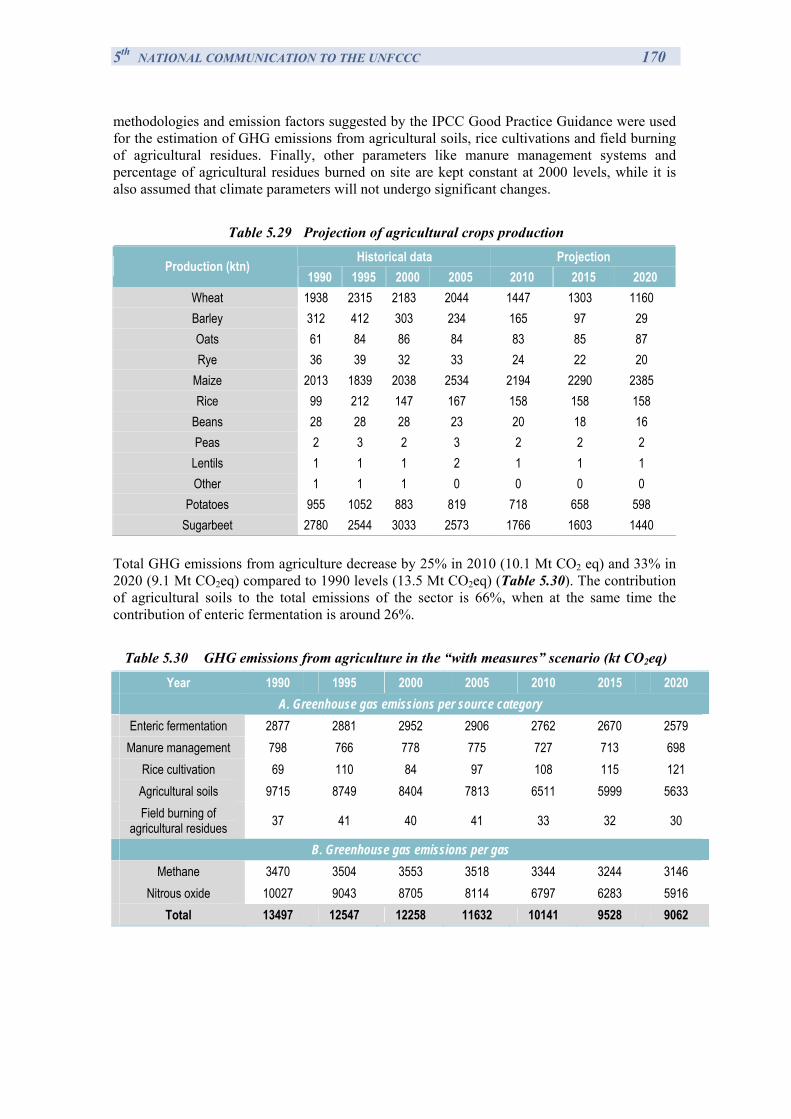
5th NATIONAL COMMUNICATION TO THE UNFCCC 170
methodologies and emission factors suggested by the IPCC Good Practice Guidance were used for the estimation of GHG emissions from agricultural soils, rice cultivations and field burning of agricultural residues. Finally, other parameters like manure management systems and percentage of agricultural residues burned on site are kept constant at 2000 levels, while it is also assumed that climate parameters will not undergo significant changes.
Table 5.29 Projection of agricultural crops production
Historical data Projection Production (ktn)
1990 1995 2000 2005 2010 2015 2020 Wheat 1938 2315 2183 2044 1447 1303 1160 Barley 312 412 303 234 165 97 29 Oats 61 84 86 84 83 85 87 Rye 36 39 32 33 24 22 20
Maize 2013 1839 2038 2534 2194 2290 2385 Rice 99 212 147 167 158 158 158
Beans 28 28 28 23 20 18 16 Peas 2 3 2 3 2 2 2
Lentils 1 1 1 2 1 1 1 Other 1 1 1 0 0 0 0
Potatoes 955 1052 883 819 718 658 598 Sugarbeet 2780 2544 3033 2573 1766 1603 1440
Total GHG emissions from agriculture decrease by 25% in 2010 (10.1 Mt CO2 eq) and 33% in 2020 (9.1 Mt CO2eq) compared to 1990 levels (13.5 Mt CO2eq) (Table 5.30). The contribution of agricultural soils to the total emissions of the sector is 66%, when at the same time the contribution of enteric fermentation is around 26%.
Table 5.30 GHG emissions from agriculture in the “with measures” scenario (kt CO2eq)
Year 1990 1995 2000 2005 2010 2015 2020 A. Greenhouse gas emissions per source category
Enteric fermentation 2877 2881 2952 2906 2762 2670 2579 Manure management 798 766 778 775 727 713 698
Rice cultivation 69 110 84 97 108 115 121 Agricultural soils 9715 8749 8404 7813 6511 5999 5633 Field burning of
agricultural residues 37 41 40 41 33 32 30
B. Greenhouse gas emissions per gas Methane 3470 3504 3553 3518 3344 3244 3146
Nitrous oxide 10027 9043 8705 8114 6797 6283 5916 Total 13497 12547 12258 11632 10141 9528 9062
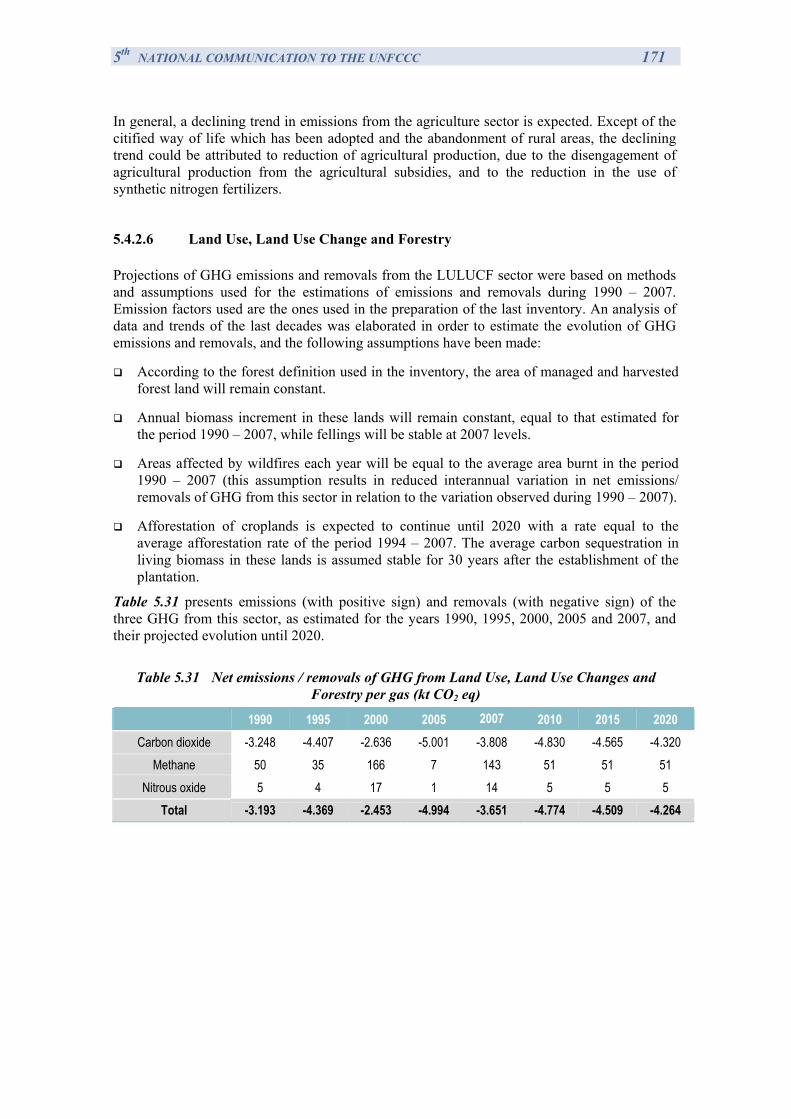
5th NATIONAL COMMUNICATION TO THE UNFCCC 171
In general, a declining trend in emissions from the agriculture sector is expected. Except of the citified way of life which has been adopted and the abandonment of rural areas, the declining trend could be attributed to reduction of agricultural production, due to the disengagement of agricultural production from the agricultural subsidies, and to the reduction in the use of synthetic nitrogen fertilizers.
5.4.2.6 Land Use, Land Use Change and Forestry
Projections of GHG emissions and removals from the LULUCF sector were based on methods and assumptions used for the estimations of emissions and removals during 1990 – 2007. Emission factors used are the ones used in the preparation of the last inventory. An analysis of data and trends of the last decades was elaborated in order to estimate the evolution of GHG emissions and removals, and the following assumptions have been made:
According to the forest definition used in the inventory, the area of managed and harvested forest land will remain constant.
Annual biomass increment in these lands will remain constant, equal to that estimated for the period 1990 – 2007, while fellings will be stable at 2007 levels.
Areas affected by wildfires each year will be equal to the average area burnt in the period 1990 – 2007 (this assumption results in reduced interannual variation in net emissions/ removals of GHG from this sector in relation to the variation observed during 1990 – 2007).
Afforestation of croplands is expected to continue until 2020 with a rate equal to the average afforestation rate of the period 1994 – 2007. The average carbon sequestration in living biomass in these lands is assumed stable for 30 years after the establishment of the plantation.
Table 5.31 presents emissions (with positive sign) and removals (with negative sign) of the three GHG from this sector, as estimated for the years 1990, 1995, 2000, 2005 and 2007, and their projected evolution until 2020.
Table 5.31 Net emissions / removals of GHG from Land Use, Land Use Changes and
Forestry per gas (kt CO2 eq)
1990 1995 2000 2005 2007 2010 2015 2020 Carbon dioxide -3.248 -4.407 -2.636 -5.001 -3.808 -4.830 -4.565 -4.320
Methane 50 35 166 7 143 51 51 51 Nitrous oxide 5 4 17 1 14 5 5 5
Total -3.193 -4.369 -2.453 -4.994 -3.651 -4.774 -4.509 -4.264
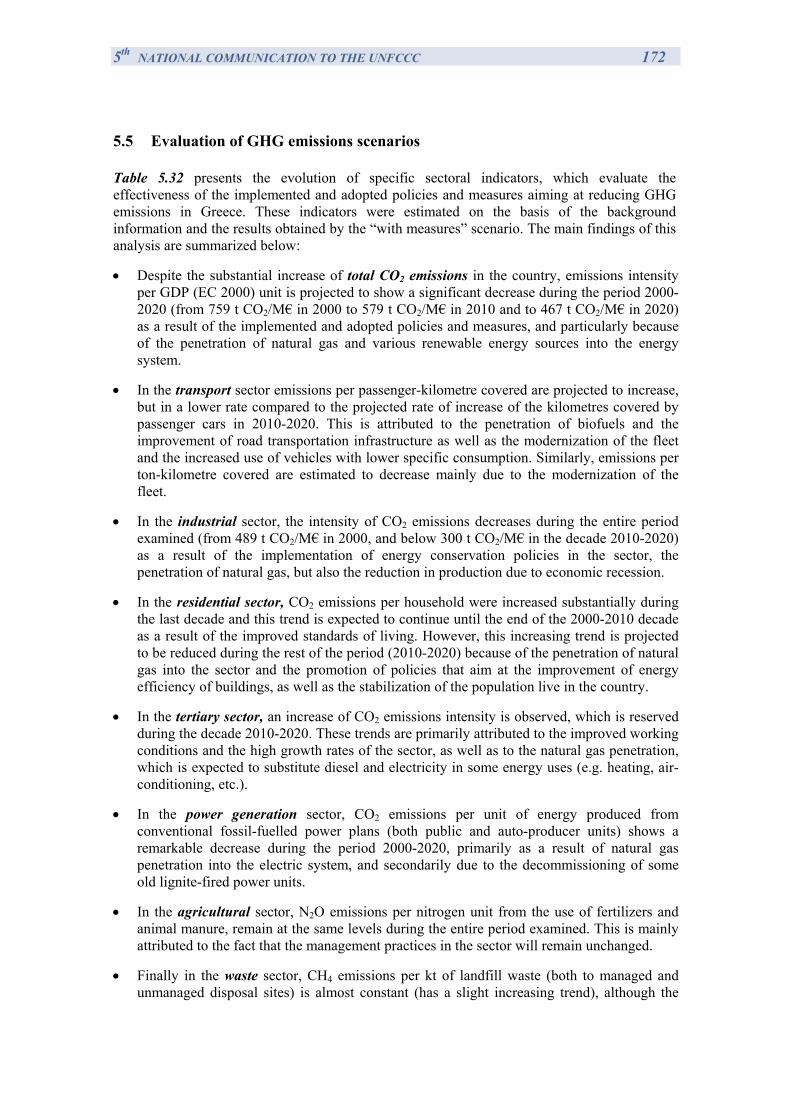
5th NATIONAL COMMUNICATION TO THE UNFCCC 172
5.5 Evaluation of GHG emissions scenarios
Table 5.32 presents the evolution of specific sectoral indicators, which evaluate the effectiveness of the implemented and adopted policies and measures aiming at reducing GHG emissions in Greece. These indicators were estimated on the basis of the background information and the results obtained by the “with measures” scenario. The main findings of this analysis are summarized below:
• Despite the substantial increase of total CO2 emissions in the country, emissions intensity per GDP (EC 2000) unit is projected to show a significant decrease during the period 2000-2020 (from 759 t CO2/M€ in 2000 to 579 t CO2/M€ in 2010 and to 467 t CO2/M€ in 2020) as a result of the implemented and adopted policies and measures, and particularly because of the penetration of natural gas and various renewable energy sources into the energy system.
• In the transport sector emissions per passenger-kilometre covered are projected to increase, but in a lower rate compared to the projected rate of increase of the kilometres covered by passenger cars in 2010-2020. This is attributed to the penetration of biofuels and the improvement of road transportation infrastructure as well as the modernization of the fleet and the increased use of vehicles with lower specific consumption. Similarly, emissions per ton-kilometre covered are estimated to decrease mainly due to the modernization of the fleet.
• In the industrial sector, the intensity of CO2 emissions decreases during the entire period examined (from 489 t CO2/M€ in 2000, and below 300 t CO2/M€ in the decade 2010-2020) as a result of the implementation of energy conservation policies in the sector, the penetration of natural gas, but also the reduction in production due to economic recession.
• In the residential sector, CO2 emissions per household were increased substantially during the last decade and this trend is expected to continue until the end of the 2000-2010 decade as a result of the improved standards of living. However, this increasing trend is projected to be reduced during the rest of the period (2010-2020) because of the penetration of natural gas into the sector and the promotion of policies that aim at the improvement of energy efficiency of buildings, as well as the stabilization of the population live in the country.
• In the tertiary sector, an increase of CO2 emissions intensity is observed, which is reserved during the decade 2010-2020. These trends are primarily attributed to the improved working conditions and the high growth rates of the sector, as well as to the natural gas penetration, which is expected to substitute diesel and electricity in some energy uses (e.g. heating, air-conditioning, etc.).
• In the power generation sector, CO2 emissions per unit of energy produced from conventional fossil-fuelled power plans (both public and auto-producer units) shows a remarkable decrease during the period 2000-2020, primarily as a result of natural gas penetration into the electric system, and secondarily due to the decommissioning of some old lignite-fired power units.
• In the agricultural sector, N2O emissions per nitrogen unit from the use of fertilizers and animal manure, remain at the same levels during the entire period examined. This is mainly attributed to the fact that the management practices in the sector will remain unchanged.
• Finally in the waste sector, CH4 emissions per kt of landfill waste (both to managed and unmanaged disposal sites) is almost constant (has a slight increasing trend), although the
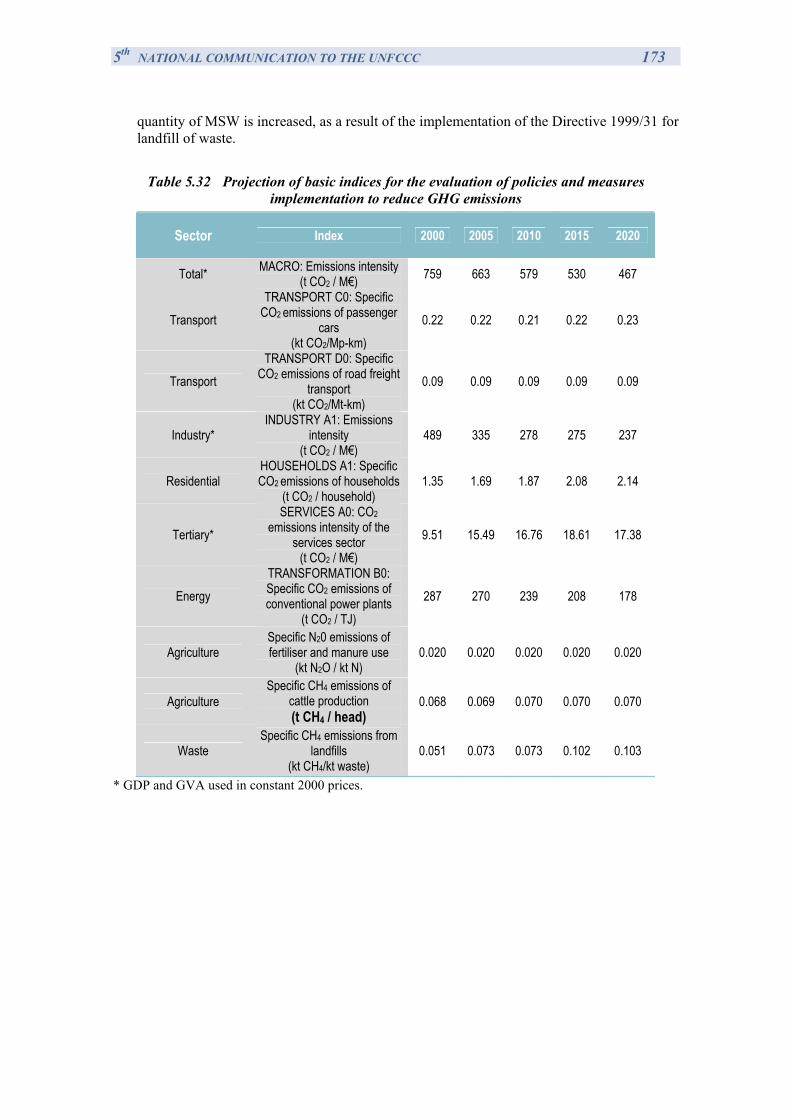
5th NATIONAL COMMUNICATION TO THE UNFCCC 173
quantity of MSW is increased, as a result of the implementation of the Directive 1999/31 for landfill of waste.
Table 5.32 Projection of basic indices for the evaluation of policies and measures
implementation to reduce GHG emissions
Sector Index 2000 2005 2010 2015 2020
Total* MACRO: Emissions intensity (t CO2 / M€) 759 663 579 530 467
Transport TRANSPORT C0: Specific
CO2 emissions of passenger cars
(kt CO2/Mp-km) 0.22 0.22 0.21 0.22 0.23
Transport TRANSPORT D0: Specific
CO2 emissions of road freight transport
(kt CO2/Mt-km) 0.09 0.09 0.09 0.09 0.09
Industry* INDUSTRY A1: Emissions
intensity (t CO2 / M€)
489 335 278 275 237
Residential HOUSEHOLDS A1: Specific CO2 emissions of households
(t CO2 / household) 1.35 1.69 1.87 2.08 2.14
Tertiary* SERVICES A0: CO2
emissions intensity of the services sector
(t CO2 / Μ€) 9.51 15.49 16.76 18.61 17.38
Energy TRANSFORMATION B0: Specific CO2 emissions of conventional power plants
(t CO2 / TJ) 287 270 239 208 178
Agriculture Specific N20 emissions of fertiliser and manure use
(kt N2O / kt N) 0.020 0.020 0.020 0.020 0.020
Agriculture Specific CH4 emissions of
cattle production (t CH4 / head)
0.068 0.069 0.070 0.070 0.070
Waste Specific CH4 emissions from
landfills (kt CH4/kt waste)
0.051 0.073 0.073 0.102 0.103
* GDP and GVA used in constant 2000 prices.
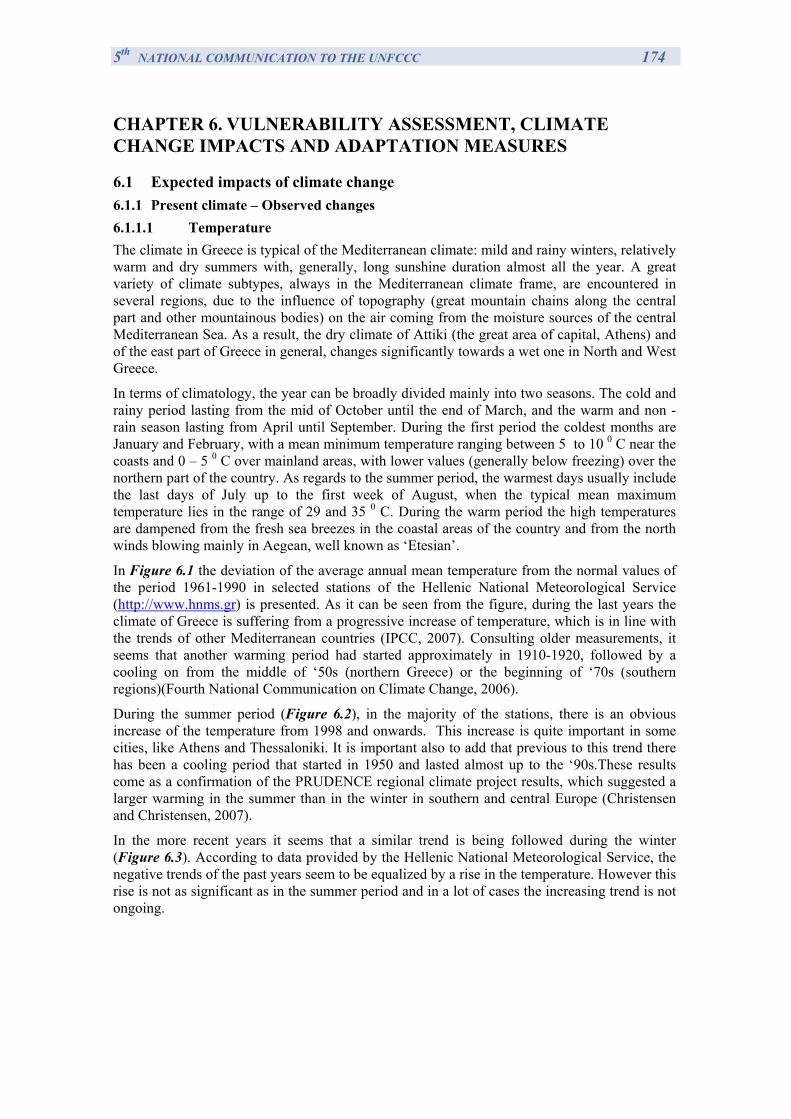
5th NATIONAL COMMUNICATION TO THE UNFCCC 174
CHAPTER 6. VULNERABILITY ASSESSMENT, CLIMATE CHANGE IMPACTS AND ADAPTATION MEASURES
6.1 Expected impacts of climate change 6.1.1 Present climate – Observed changes 6.1.1.1 Temperature The climate in Greece is typical of the Mediterranean climate: mild and rainy winters, relatively warm and dry summers with, generally, long sunshine duration almost all the year. A great variety of climate subtypes, always in the Mediterranean climate frame, are encountered in several regions, due to the influence of topography (great mountain chains along the central part and other mountainous bodies) on the air coming from the moisture sources of the central Mediterranean Sea. As a result, the dry climate of Attiki (the great area of capital, Athens) and of the east part of Greece in general, changes significantly towards a wet one in North and West Greece.
In terms of climatology, the year can be broadly divided mainly into two seasons. The cold and rainy period lasting from the mid of October until the end of March, and the warm and non -rain season lasting from April until September. During the first period the coldest months are January and February, with a mean minimum temperature ranging between 5 to 10 0 C near the coasts and 0 – 5 0 C over mainland areas, with lower values (generally below freezing) over the northern part of the country. As regards to the summer period, the warmest days usually include the last days of July up to the first week of August, when the typical mean maximum temperature lies in the range of 29 and 35 0 C. During the warm period the high temperatures are dampened from the fresh sea breezes in the coastal areas of the country and from the north winds blowing mainly in Aegean, well known as ‘Etesian’.
In Figure 6.1 the deviation of the average annual mean temperature from the normal values of the period 1961-1990 in selected stations of the Hellenic National Meteorological Service (http://www.hnms.gr) is presented. As it can be seen from the figure, during the last years the climate of Greece is suffering from a progressive increase of temperature, which is in line with the trends of other Mediterranean countries (IPCC, 2007). Consulting older measurements, it seems that another warming period had started approximately in 1910-1920, followed by a cooling on from the middle of ‘50s (northern Greece) or the beginning of ‘70s (southern regions)(Fourth National Communication on Climate Change, 2006).
During the summer period (Figure 6.2), in the majority of the stations, there is an obvious increase of the temperature from 1998 and onwards. This increase is quite important in some cities, like Athens and Thessaloniki. It is important also to add that previous to this trend there has been a cooling period that started in 1950 and lasted almost up to the ‘90s.These results come as a confirmation of the PRUDENCE regional climate project results, which suggested a larger warming in the summer than in the winter in southern and central Europe (Christensen and Christensen, 2007).
In the more recent years it seems that a similar trend is being followed during the winter (Figure 6.3). According to data provided by the Hellenic National Meteorological Service, the negative trends of the past years seem to be equalized by a rise in the temperature. However this rise is not as significant as in the summer period and in a lot of cases the increasing trend is not ongoing.
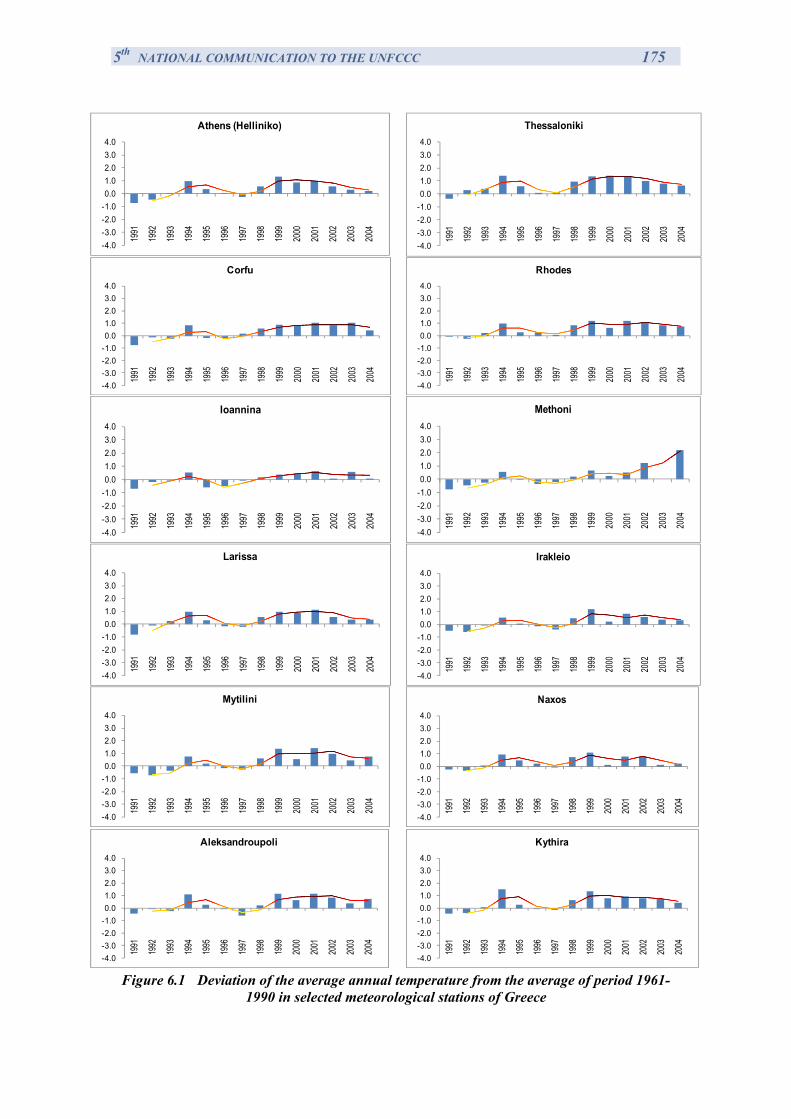
5th NATIONAL COMMUNICATION TO THE UNFCCC 175
-4.0-3.0-2.0-1.00.01.02.03.04.0
1991
1992
1993
1994
1995
1996
1997
1998
1999
2000
2001
2002
2003
2004
Athens (Helliniko)
-4.0-3.0-2.0-1.00.01.02.03.04.0
1991
1992
1993
1994
1995
1996
1997
1998
1999
2000
2001
2002
2003
2004
Thessaloniki
-4.0-3.0-2.0-1.00.01.02.03.04.0
1991
1992
1993
1994
1995
1996
1997
1998
1999
2000
2001
2002
2003
2004
Corfu
-4.0-3.0-2.0-1.00.01.02.03.04.0
1991
1992
1993
1994
1995
1996
1997
1998
1999
2000
2001
2002
2003
2004
Rhodes
-4.0-3.0-2.0-1.00.01.02.03.04.0
1991
1992
1993
1994
1995
1996
1997
1998
1999
2000
2001
2002
2003
2004
Ioannina
-4.0-3.0-2.0-1.00.01.02.03.04.0
1991
1992
1993
1994
1995
1996
1997
1998
1999
2000
2001
2002
2003
2004
Methoni
-4.0-3.0-2.0-1.00.01.02.03.04.0
1991
1992
1993
1994
1995
1996
1997
1998
1999
2000
2001
2002
2003
2004
Larissa
-4.0-3.0-2.0-1.00.01.02.03.04.0
1991
1992
1993
1994
1995
1996
1997
1998
1999
2000
2001
2002
2003
2004
Irakleio
-4.0-3.0-2.0-1.00.01.02.03.04.0
1991
1992
1993
1994
1995
1996
1997
1998
1999
2000
2001
2002
2003
2004
Mytilini
-4.0-3.0-2.0-1.00.01.02.03.04.0
1991
1992
1993
1994
1995
1996
1997
1998
1999
2000
2001
2002
2003
2004
Naxos
-4.0-3.0-2.0-1.00.01.02.03.04.0
1991
1992
1993
1994
1995
1996
1997
1998
1999
2000
2001
2002
2003
2004
Aleksandroupoli
-4.0-3.0-2.0-1.00.01.02.03.04.0
1991
1992
1993
1994
1995
1996
1997
1998
1999
2000
2001
2002
2003
2004
Kythira
Figure 6.1 Deviation of the average annual temperature from the average of period 1961-
1990 in selected meteorological stations of Greece
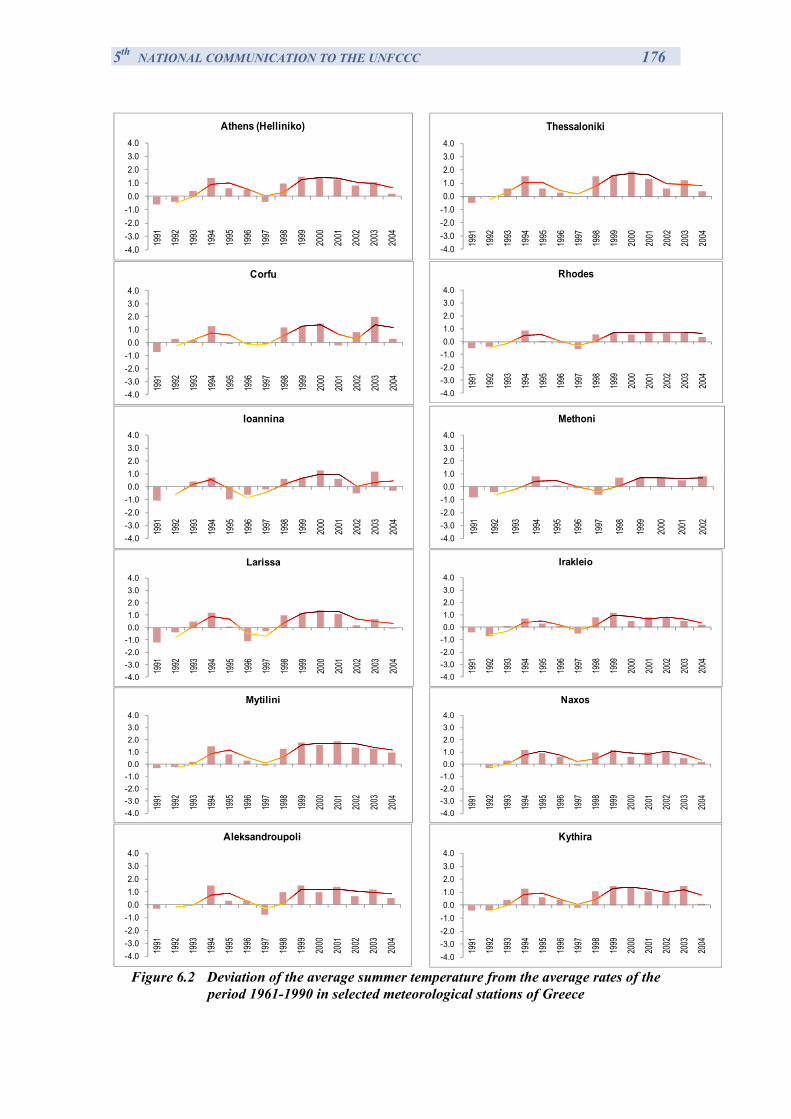
5th NATIONAL COMMUNICATION TO THE UNFCCC 176
-4.0-3.0-2.0-1.00.01.02.03.04.0
1991
1992
1993
1994
1995
1996
1997
1998
1999
2000
2001
2002
2003
2004
Athens (Helliniko)
-4.0-3.0-2.0-1.00.01.02.03.04.0
1991
1992
1993
1994
1995
1996
1997
1998
1999
2000
2001
2002
2003
2004
Thessaloniki
-4.0-3.0-2.0-1.00.01.02.03.04.0
1991
1992
1993
1994
1995
1996
1997
1998
1999
2000
2001
2002
2003
2004
Corfu
-4.0-3.0-2.0-1.00.01.02.03.04.0
1991
1992
1993
1994
1995
1996
1997
1998
1999
2000
2001
2002
2003
2004
Rhodes
-4.0-3.0-2.0-1.00.01.02.03.04.0
1991
1992
1993
1994
1995
1996
1997
1998
1999
2000
2001
2002
2003
2004
Ioannina
-4.0-3.0-2.0-1.00.01.02.03.04.0
1991
1992
1993
1994
1995
1996
1997
1998
1999
2000
2001
2002
Methoni
-4.0-3.0-2.0-1.00.01.02.03.04.0
1991
1992
1993
1994
1995
1996
1997
1998
1999
2000
2001
2002
2003
2004
Larissa
-4.0-3.0-2.0-1.00.01.02.03.04.0
1991
1992
1993
1994
1995
1996
1997
1998
1999
2000
2001
2002
2003
2004
Irakleio
-4.0-3.0-2.0-1.00.01.02.03.04.0
1991
1992
1993
1994
1995
1996
1997
1998
1999
2000
2001
2002
2003
2004
Mytilini
-4.0-3.0-2.0-1.00.01.02.03.04.0
1991
1992
1993
1994
1995
1996
1997
1998
1999
2000
2001
2002
2003
2004
Naxos
-4.0-3.0-2.0-1.00.01.02.03.04.0
1991
1992
1993
1994
1995
1996
1997
1998
1999
2000
2001
2002
2003
2004
Aleksandroupoli
-4.0-3.0-2.0-1.00.01.02.03.04.0
1991
1992
1993
1994
1995
1996
1997
1998
1999
2000
2001
2002
2003
2004
Kythira
Figure 6.2 Deviation of the average summer temperature from the average rates of the
period 1961-1990 in selected meteorological stations of Greece
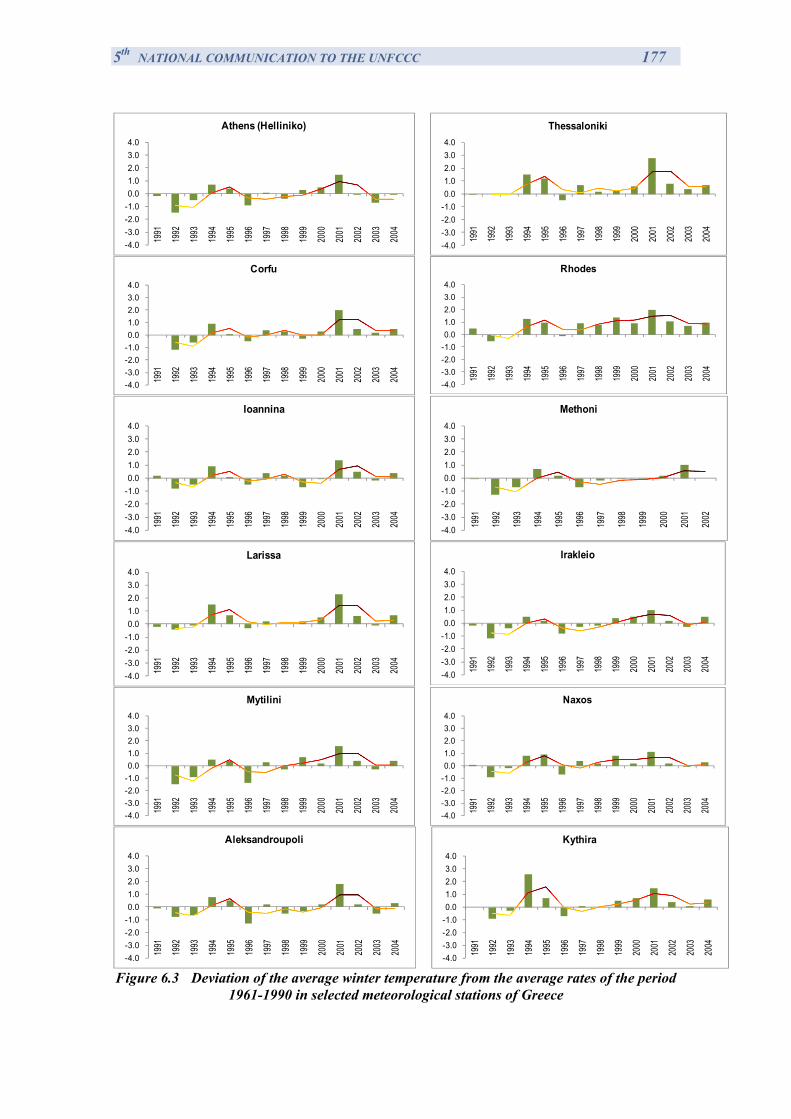
5th NATIONAL COMMUNICATION TO THE UNFCCC 177
-4.0-3.0-2.0-1.00.01.02.03.04.0
1991
1992
1993
1994
1995
1996
1997
1998
1999
2000
2001
2002
2003
2004
Athens (Helliniko)
-4.0-3.0-2.0-1.00.01.02.03.04.0
1991
1992
1993
1994
1995
1996
1997
1998
1999
2000
2001
2002
2003
2004
Thessaloniki
-4.0-3.0-2.0-1.00.01.02.03.04.0
1991
1992
1993
1994
1995
1996
1997
1998
1999
2000
2001
2002
2003
2004
Corfu
-4.0-3.0-2.0-1.00.01.02.03.04.0
1991
1992
1993
1994
1995
1996
1997
1998
1999
2000
2001
2002
2003
2004
Rhodes
-4.0-3.0-2.0-1.00.01.02.03.04.0
1991
1992
1993
1994
1995
1996
1997
1998
1999
2000
2001
2002
2003
2004
Ioannina
-4.0-3.0-2.0-1.00.01.02.03.04.0
1991
1992
1993
1994
1995
1996
1997
1998
1999
2000
2001
2002
Methoni
-4.0-3.0-2.0-1.00.01.02.03.04.0
1991
1992
1993
1994
1995
1996
1997
1998
1999
2000
2001
2002
2003
2004
Larissa
-4.0-3.0-2.0-1.00.01.02.03.04.0
1991
1992
1993
1994
1995
1996
1997
1998
1999
2000
2001
2002
2003
2004
Irakleio
-4.0-3.0-2.0-1.00.01.02.03.04.0
1991
1992
1993
1994
1995
1996
1997
1998
1999
2000
2001
2002
2003
2004
Mytilini
-4.0-3.0-2.0-1.00.01.02.03.04.0
1991
1992
1993
1994
1995
1996
1997
1998
1999
2000
2001
2002
2003
2004
Naxos
-4.0-3.0-2.0-1.00.01.02.03.04.0
1991
1992
1993
1994
1995
1996
1997
1998
1999
2000
2001
2002
2003
2004
Aleksandroupoli
-4.0-3.0-2.0-1.00.01.02.03.04.0
1991
1992
1993
1994
1995
1996
1997
1998
1999
2000
2001
2002
2003
2004
Kythira
Figure 6.3 Deviation of the average winter temperature from the average rates of the period 1961-1990 in selected meteorological stations of Greece
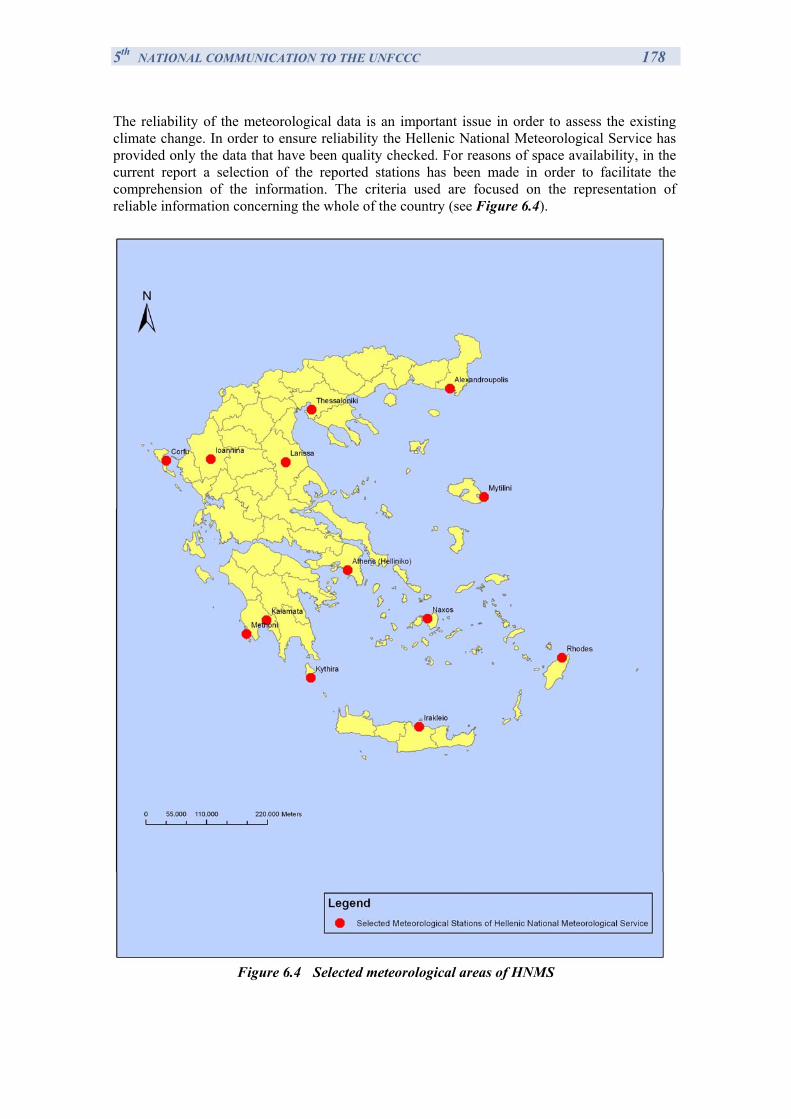
5th NATIONAL COMMUNICATION TO THE UNFCCC 178
The reliability of the meteorological data is an important issue in order to assess the existing climate change. In order to ensure reliability the Hellenic National Meteorological Service has provided only the data that have been quality checked. For reasons of space availability, in the current report a selection of the reported stations has been made in order to facilitate the comprehension of the information. The criteria used are focused on the representation of reliable information concerning the whole of the country (see Figure 6.4).
Figure 6.4 Selected meteorological areas of HNMS
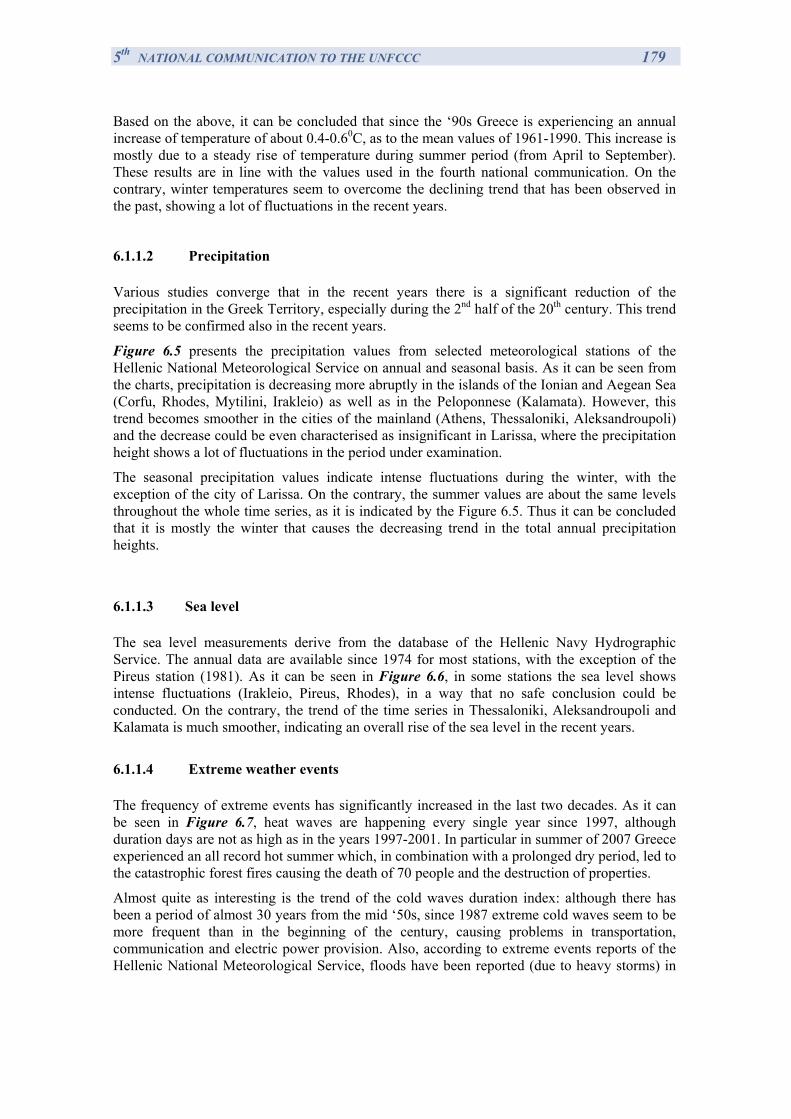
5th NATIONAL COMMUNICATION TO THE UNFCCC 179
Based on the above, it can be concluded that since the ‘90s Greece is experiencing an annual increase of temperature of about 0.4-0.60C, as to the mean values of 1961-1990. This increase is mostly due to a steady rise of temperature during summer period (from April to September). These results are in line with the values used in the fourth national communication. On the contrary, winter temperatures seem to overcome the declining trend that has been observed in the past, showing a lot of fluctuations in the recent years.
6.1.1.2 Precipitation
Various studies converge that in the recent years there is a significant reduction of the precipitation in the Greek Territory, especially during the 2nd half of the 20th century. This trend seems to be confirmed also in the recent years.
Figure 6.5 presents the precipitation values from selected meteorological stations of the Hellenic National Meteorological Service on annual and seasonal basis. As it can be seen from the charts, precipitation is decreasing more abruptly in the islands of the Ionian and Aegean Sea (Corfu, Rhodes, Mytilini, Irakleio) as well as in the Peloponnese (Kalamata). However, this trend becomes smoother in the cities of the mainland (Athens, Thessaloniki, Aleksandroupoli) and the decrease could be even characterised as insignificant in Larissa, where the precipitation height shows a lot of fluctuations in the period under examination.
The seasonal precipitation values indicate intense fluctuations during the winter, with the exception of the city of Larissa. On the contrary, the summer values are about the same levels throughout the whole time series, as it is indicated by the Figure 6.5. Thus it can be concluded that it is mostly the winter that causes the decreasing trend in the total annual precipitation heights.
6.1.1.3 Sea level
The sea level measurements derive from the database of the Hellenic Navy Hydrographic Service. The annual data are available since 1974 for most stations, with the exception of the Pireus station (1981). As it can be seen in Figure 6.6, in some stations the sea level shows intense fluctuations (Irakleio, Pireus, Rhodes), in a way that no safe conclusion could be conducted. On the contrary, the trend of the time series in Thessaloniki, Aleksandroupoli and Kalamata is much smoother, indicating an overall rise of the sea level in the recent years.
6.1.1.4 Extreme weather events
The frequency of extreme events has significantly increased in the last two decades. As it can be seen in Figure 6.7, heat waves are happening every single year since 1997, although duration days are not as high as in the years 1997-2001. In particular in summer of 2007 Greece experienced an all record hot summer which, in combination with a prolonged dry period, led to the catastrophic forest fires causing the death of 70 people and the destruction of properties.
Almost quite as interesting is the trend of the cold waves duration index: although there has been a period of almost 30 years from the mid ‘50s, since 1987 extreme cold waves seem to be more frequent than in the beginning of the century, causing problems in transportation, communication and electric power provision. Also, according to extreme events reports of the Hellenic National Meteorological Service, floods have been reported (due to heavy storms) in
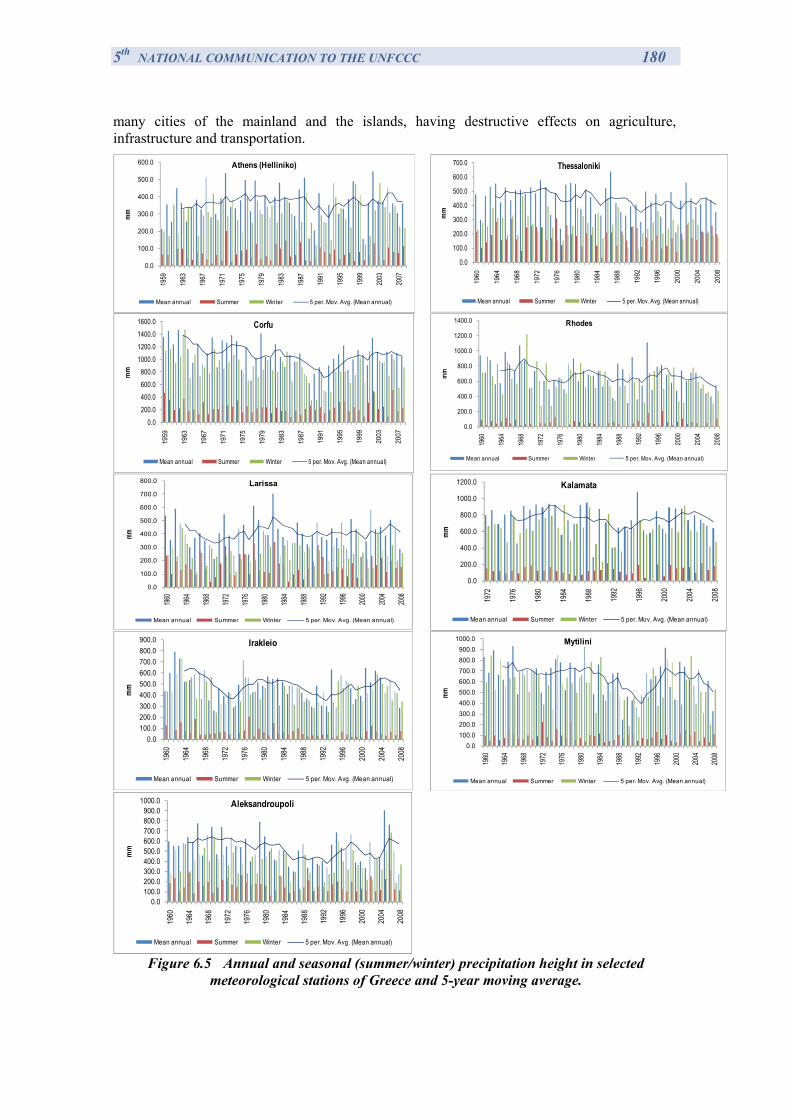
5th NATIONAL COMMUNICATION TO THE UNFCCC 180
many cities of the mainland and the islands, having destructive effects on agriculture, infrastructure and transportation.
0.0
100.0
200.0
300.0
400.0
500.0
600.019
59
1963
1967
1971
1975
1979
1983
1987
1991
1995
1999
2003
2007
mm
Athens (Helliniko)
Mean annual Summer Winter 5 per. Mov. Avg. (Mean annual)
0.0
100.0
200.0
300.0
400.0
500.0
600.0
700.0
1960
1964
1968
1972
1976
1980
1984
1988
1992
1996
2000
2004
2008
mm
Thessaloniki
Mean annual Summer Winter 5 per. Mov. Avg. (Mean annual)
0.0200.0400.0600.0800.0
1000.01200.01400.01600.0
1959
1963
1967
1971
1975
1979
1983
1987
1991
1995
1999
2003
2007
mm
Corfu
Mean annual Summer Winter 5 per. Mov. Avg. (Mean annual)
0.0
200.0
400.0
600.0
800.0
1000.0
1200.0
1400.0
1960
1964
1968
1972
1976
1980
1984
1988
1992
1996
2000
2004
2008
mm
Rhodes
Mean annual Summer Winter 5 per. Mov. Avg. (Mean annual)
0.0
100.0
200.0
300.0
400.0
500.0
600.0
700.0
800.0
1960
1964
1968
1972
1976
1980
1984
1988 1992
1996
2000
2004
2008
mm
Larissa
Mean annual Summer Winter 5 per. Mov. Avg. (Mean annual)
0.0
200.0
400.0
600.0
800.0
1000.0
1200.019
72
1976
1980
1984
1988
1992
1996
2000
2004
2008
mm
Kalamata
Mean annual Summer Winter 5 per. Mov. Avg. (Mean annual)
0.0100.0200.0300.0400.0500.0600.0700.0800.0900.0
1960
1964
1968
1972
1976
1980
1984
1988
1992
1996
2000
2004
2008
mm
Irakleio
Mean annual Summer Winter 5 per. Mov. Avg. (Mean annual)
0.0100.0200.0300.0400.0500.0600.0700.0800.0900.0
1000.0
1960
1964
1968
1972
1976
1980
1984
1988
1992
1996
2000
2004
2008
mm
Mytilini
Mean annual Summer Winter 5 per. Mov. Avg. (Mean annual)
0.0100.0200.0300.0400.0500.0600.0700.0800.0900.0
1000.0
1960
1964
1968
1972
1976
1980
1984
1988
1992
1996
2000
2004
2008
mm
Aleksandroupoli
Mean annual Summer Winter 5 per. Mov. Avg. (Mean annual)
Figure 6.5 Annual and seasonal (summer/winter) precipitation height in selected meteorological stations of Greece and 5-year moving average.
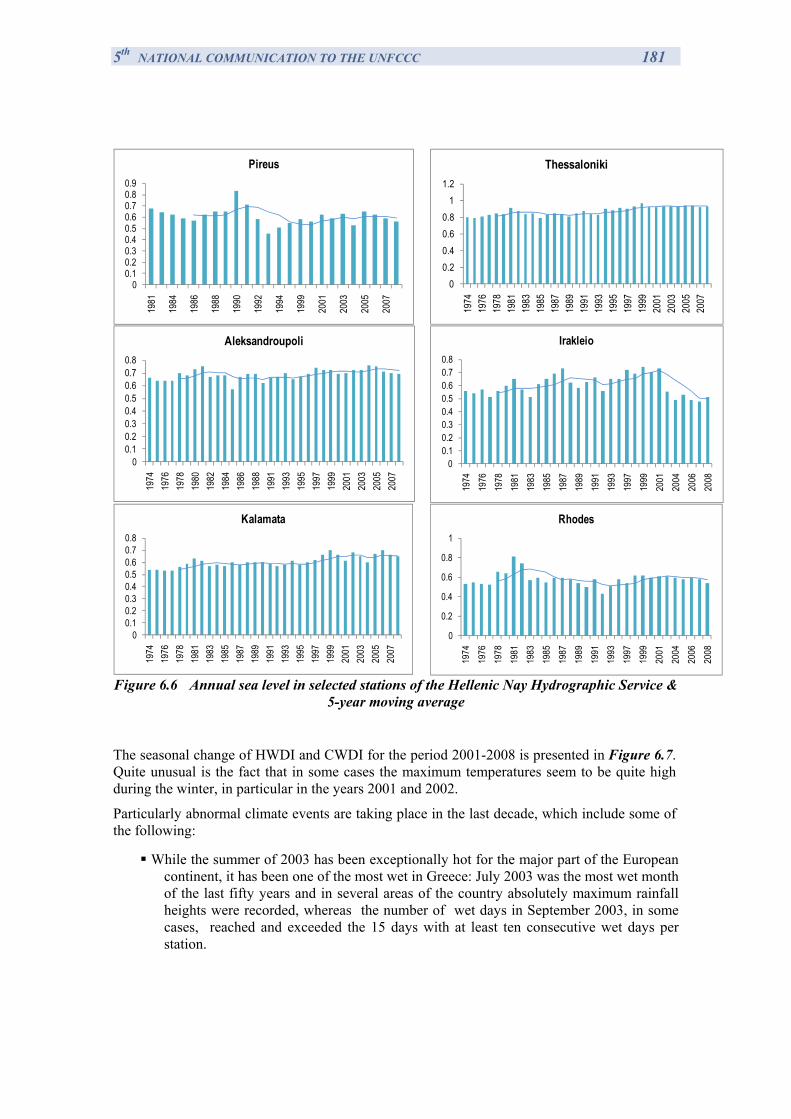
5th NATIONAL COMMUNICATION TO THE UNFCCC 181
00.10.20.30.40.50.60.70.80.9
1981
1984
1986
1988
1990
1992
1994
1999
2001
2003
2005
2007
Pireus
00.20.40.60.8
11.2
1974
1976
1978
1981
1983
1985
1987
1989
1991
1993
1995
1997
1999
2001
2003
2005
2007
Thessaloniki
00.10.20.30.40.50.60.70.8
1974
1976
1978
1980
1982
1984
1986
1988
1991
1993
1995
1997
1999
2001
2003
2005
2007
Aleksandroupoli
00.10.20.30.40.50.60.70.8
1974
1976
1978
1981
1983
1985
1987
1989
1991
1993
1997
1999
2001
2004
2006
2008
Irakleio
00.10.20.30.40.50.60.70.8
1974
1976
1978
1981
1983
1985
1987
1989
1991
1993
1995
1997
1999
2001
2003
2005
2007
Kalamata
0
0.2
0.4
0.6
0.8
1
1974
1976
1978
1981
1983
1985
1987
1989
1991
1993
1997
1999
2001
2004
2006
2008
Rhodes
Figure 6.6 Annual sea level in selected stations of the Hellenic Nay Hydrographic Service &
5-year moving average
The seasonal change of HWDI and CWDI for the period 2001-2008 is presented in Figure 6.7. Quite unusual is the fact that in some cases the maximum temperatures seem to be quite high during the winter, in particular in the years 2001 and 2002.
Particularly abnormal climate events are taking place in the last decade, which include some of the following:
While the summer of 2003 has been exceptionally hot for the major part of the European continent, it has been one of the most wet in Greece: July 2003 was the most wet month of the last fifty years and in several areas of the country absolutely maximum rainfall heights were recorded, whereas the number of wet days in September 2003, in some cases, reached and exceeded the 15 days with at least ten consecutive wet days per station.
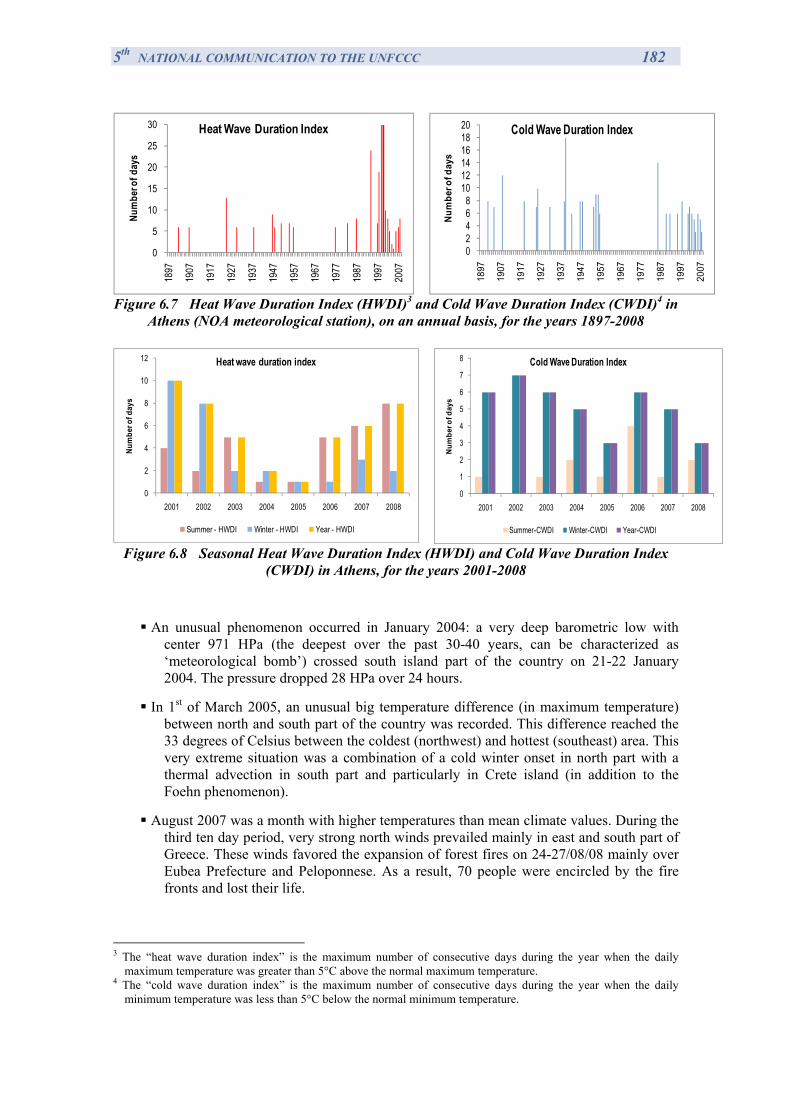
5th NATIONAL COMMUNICATION TO THE UNFCCC 182
0
5
10
15
20
25
30
1897
1907
1917
1927
1937
1947
1957
1967
1977
1987
1997
2007
Num
ber o
f day
sHeat Wave Duration Index
02468
101214161820
1897
1907
1917
1927
1937
1947
1957
1967
1977
1987
1997
2007
Num
ber o
f day
s
Cold Wave Duration Index
Figure 6.7 Heat Wave Duration Index (HWDI)3 and Cold Wave Duration Index (CWDI)4 in Athens (NOA meteorological station), on an annual basis, for the years 1897-2008
0
2
4
6
8
10
12
2001 2002 2003 2004 2005 2006 2007 2008
Num
ber o
f day
s
Heat wave duration index
Summer - HWDI Winter - HWDI Year - HWDI
0
1
2
3
4
5
6
7
8
2001 2002 2003 2004 2005 2006 2007 2008
Num
ber o
f day
s
Cold Wave Duration Index
Summer-CWDI Winter-CWDI Year-CWDI
Figure 6.8 Seasonal Heat Wave Duration Index (HWDI) and Cold Wave Duration Index (CWDI) in Athens, for the years 2001-2008
An unusual phenomenon occurred in January 2004: a very deep barometric low with
center 971 HPa (the deepest over the past 30-40 years, can be characterized as ‘meteorological bomb’) crossed south island part of the country on 21-22 January 2004. The pressure dropped 28 HPa over 24 hours.
In 1st of March 2005, an unusual big temperature difference (in maximum temperature) between north and south part of the country was recorded. This difference reached the 33 degrees of Celsius between the coldest (northwest) and hottest (southeast) area. This very extreme situation was a combination of a cold winter onset in north part with a thermal advection in south part and particularly in Crete island (in addition to the Foehn phenomenon).
August 2007 was a month with higher temperatures than mean climate values. During the third ten day period, very strong north winds prevailed mainly in east and south part of Greece. These winds favored the expansion of forest fires on 24-27/08/08 mainly over Eubea Prefecture and Peloponnese. As a result, 70 people were encircled by the fire fronts and lost their life.
3 The “heat wave duration index” is the maximum number of consecutive days during the year when the daily
maximum temperature was greater than 5°C above the normal maximum temperature. 4 The “cold wave duration index” is the maximum number of consecutive days during the year when the daily
minimum temperature was less than 5°C below the normal minimum temperature.
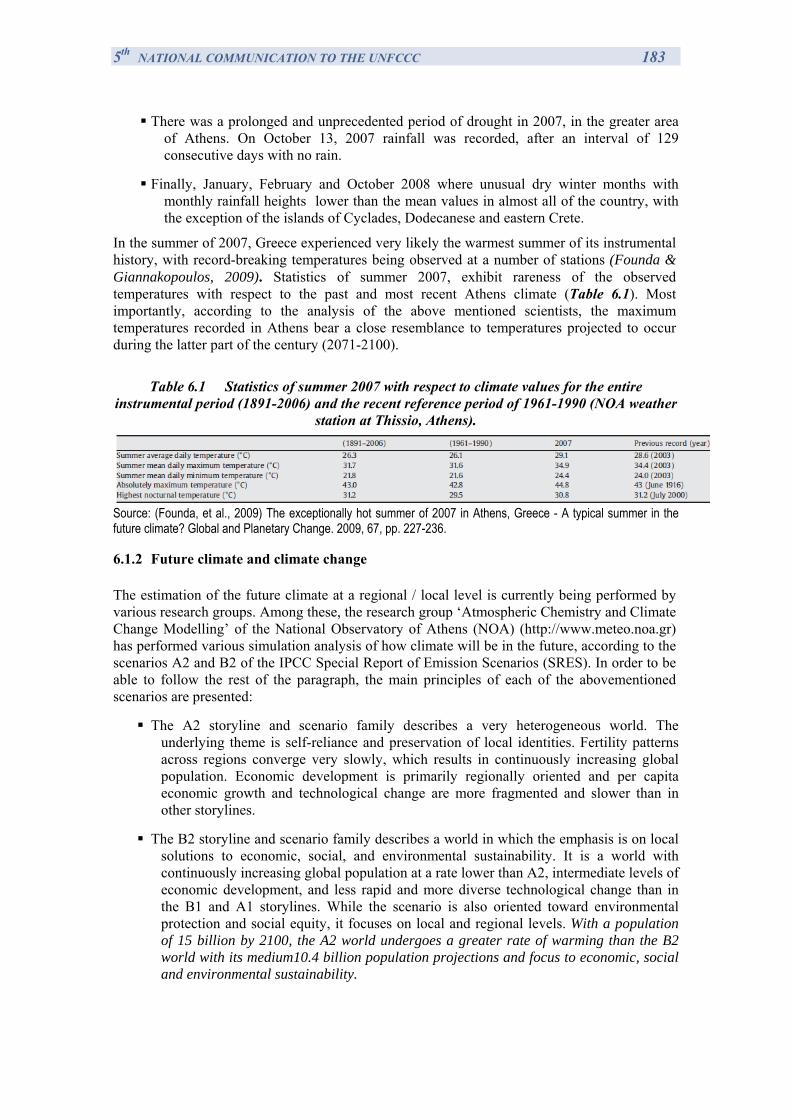
5th NATIONAL COMMUNICATION TO THE UNFCCC 183
There was a prolonged and unprecedented period of drought in 2007, in the greater area of Athens. On October 13, 2007 rainfall was recorded, after an interval of 129 consecutive days with no rain.
Finally, January, February and October 2008 where unusual dry winter months with monthly rainfall heights lower than the mean values in almost all of the country, with the exception of the islands of Cyclades, Dodecanese and eastern Crete.
In the summer of 2007, Greece experienced very likely the warmest summer of its instrumental history, with record-breaking temperatures being observed at a number of stations (Founda & Giannakopoulos, 2009). Statistics of summer 2007, exhibit rareness of the observed temperatures with respect to the past and most recent Athens climate (Table 6.1). Most importantly, according to the analysis of the above mentioned scientists, the maximum temperatures recorded in Athens bear a close resemblance to temperatures projected to occur during the latter part of the century (2071-2100).
Table 6.1 Statistics of summer 2007 with respect to climate values for the entire
instrumental period (1891-2006) and the recent reference period of 1961-1990 (NOA weather station at Thissio, Athens).
Source: (Founda, et al., 2009) The exceptionally hot summer of 2007 in Athens, Greece - A typical summer in the future climate? Global and Planetary Change. 2009, 67, pp. 227-236. 6.1.2 Future climate and climate change
The estimation of the future climate at a regional / local level is currently being performed by various research groups. Among these, the research group ‘Atmospheric Chemistry and Climate Change Modelling’ of the National Observatory of Athens (NOA) (http://www.meteo.noa.gr) has performed various simulation analysis of how climate will be in the future, according to the scenarios A2 and B2 of the IPCC Special Report of Emission Scenarios (SRES). In order to be able to follow the rest of the paragraph, the main principles of each of the abovementioned scenarios are presented:
The A2 storyline and scenario family describes a very heterogeneous world. The underlying theme is self-reliance and preservation of local identities. Fertility patterns across regions converge very slowly, which results in continuously increasing global population. Economic development is primarily regionally oriented and per capita economic growth and technological change are more fragmented and slower than in other storylines.
The B2 storyline and scenario family describes a world in which the emphasis is on local solutions to economic, social, and environmental sustainability. It is a world with continuously increasing global population at a rate lower than A2, intermediate levels of economic development, and less rapid and more diverse technological change than in the B1 and A1 storylines. While the scenario is also oriented toward environmental protection and social equity, it focuses on local and regional levels. With a population of 15 billion by 2100, the A2 world undergoes a greater rate of warming than the B2 world with its medium10.4 billion population projections and focus to economic, social and environmental sustainability.
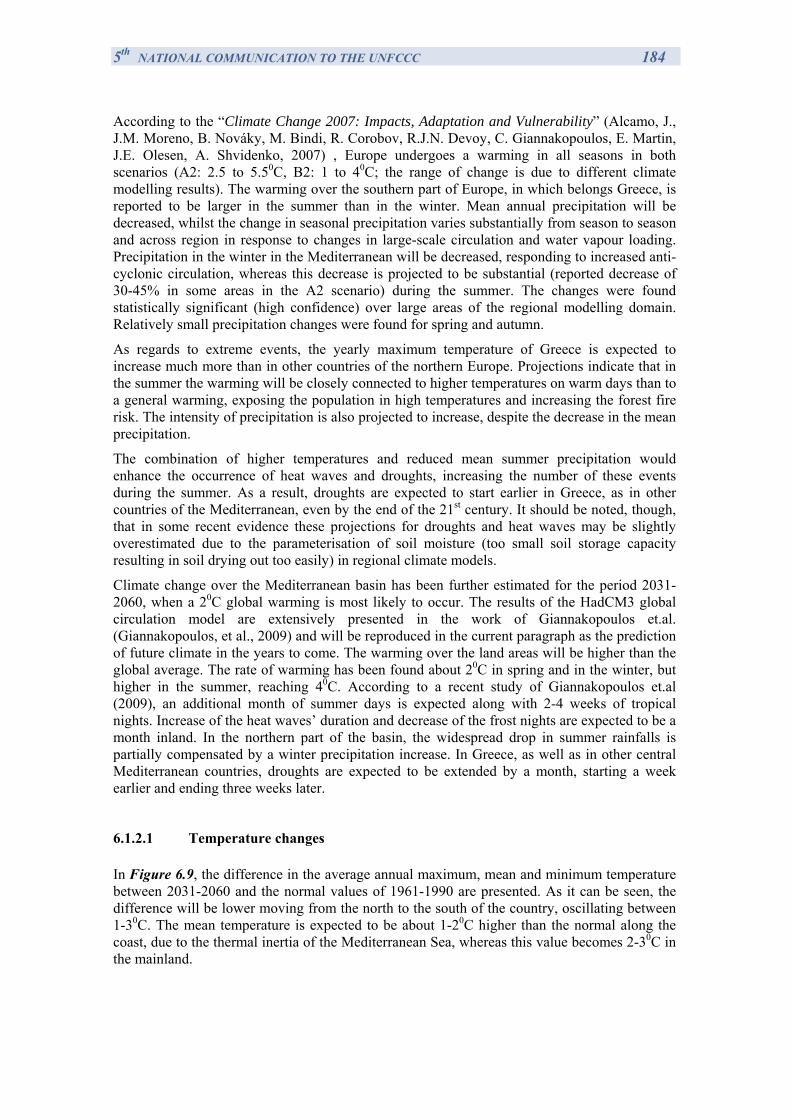
5th NATIONAL COMMUNICATION TO THE UNFCCC 184
According to the “Climate Change 2007: Impacts, Adaptation and Vulnerability” (Alcamo, J., J.M. Moreno, B. Nováky, M. Bindi, R. Corobov, R.J.N. Devoy, C. Giannakopoulos, E. Martin, J.E. Olesen, A. Shvidenko, 2007) , Europe undergoes a warming in all seasons in both scenarios (A2: 2.5 to 5.50C, B2: 1 to 40C; the range of change is due to different climate modelling results). The warming over the southern part of Europe, in which belongs Greece, is reported to be larger in the summer than in the winter. Mean annual precipitation will be decreased, whilst the change in seasonal precipitation varies substantially from season to season and across region in response to changes in large-scale circulation and water vapour loading. Precipitation in the winter in the Mediterranean will be decreased, responding to increased anti-cyclonic circulation, whereas this decrease is projected to be substantial (reported decrease of 30-45% in some areas in the A2 scenario) during the summer. The changes were found statistically significant (high confidence) over large areas of the regional modelling domain. Relatively small precipitation changes were found for spring and autumn.
As regards to extreme events, the yearly maximum temperature of Greece is expected to increase much more than in other countries of the northern Europe. Projections indicate that in the summer the warming will be closely connected to higher temperatures on warm days than to a general warming, exposing the population in high temperatures and increasing the forest fire risk. The intensity of precipitation is also projected to increase, despite the decrease in the mean precipitation.
The combination of higher temperatures and reduced mean summer precipitation would enhance the occurrence of heat waves and droughts, increasing the number of these events during the summer. As a result, droughts are expected to start earlier in Greece, as in other countries of the Mediterranean, even by the end of the 21st century. It should be noted, though, that in some recent evidence these projections for droughts and heat waves may be slightly overestimated due to the parameterisation of soil moisture (too small soil storage capacity resulting in soil drying out too easily) in regional climate models.
Climate change over the Mediterranean basin has been further estimated for the period 2031-2060, when a 20C global warming is most likely to occur. The results of the HadCM3 global circulation model are extensively presented in the work of Giannakopoulos et.al. (Giannakopoulos, et al., 2009) and will be reproduced in the current paragraph as the prediction of future climate in the years to come. The warming over the land areas will be higher than the global average. The rate of warming has been found about 20C in spring and in the winter, but higher in the summer, reaching 40C. According to a recent study of Giannakopoulos et.al (2009), an additional month of summer days is expected along with 2-4 weeks of tropical nights. Increase of the heat waves’ duration and decrease of the frost nights are expected to be a month inland. In the northern part of the basin, the widespread drop in summer rainfalls is partially compensated by a winter precipitation increase. In Greece, as well as in other central Mediterranean countries, droughts are expected to be extended by a month, starting a week earlier and ending three weeks later.
6.1.2.1 Temperature changes
In Figure 6.9, the difference in the average annual maximum, mean and minimum temperature between 2031-2060 and the normal values of 1961-1990 are presented. As it can be seen, the difference will be lower moving from the north to the south of the country, oscillating between 1-30C. The mean temperature is expected to be about 1-20C higher than the normal along the coast, due to the thermal inertia of the Mediterranean Sea, whereas this value becomes 2-30C in the mainland.
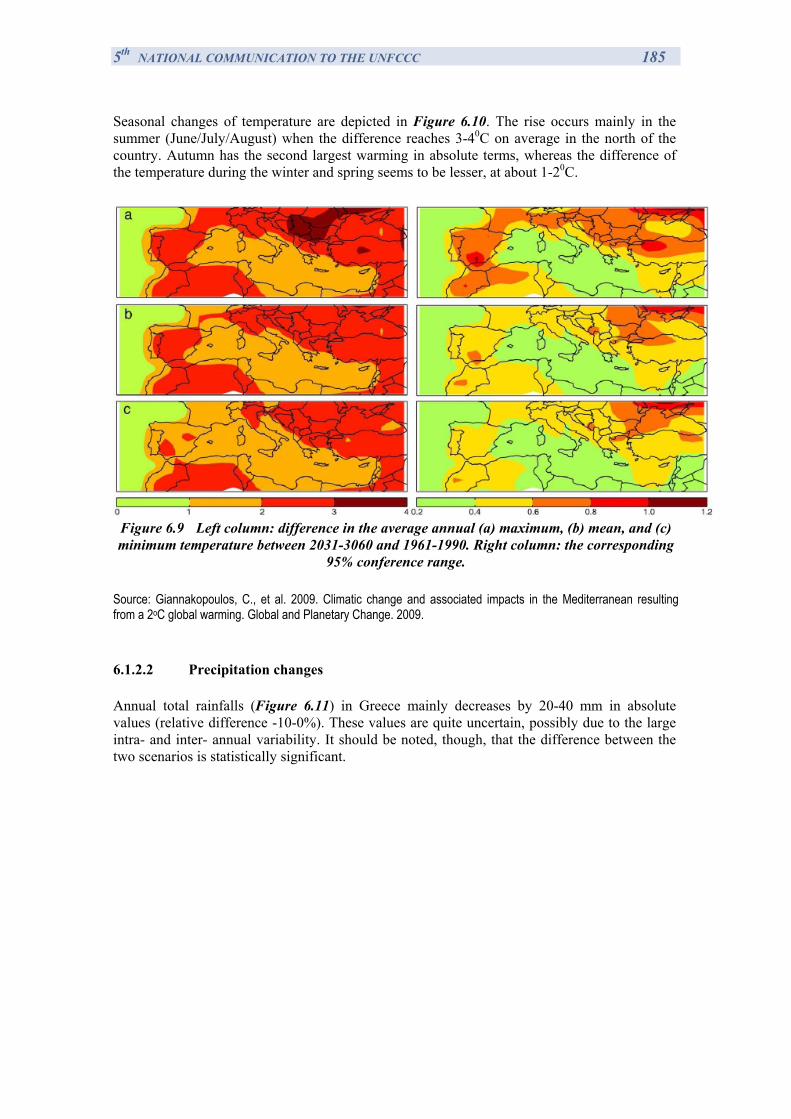
5th NATIONAL COMMUNICATION TO THE UNFCCC 185
Seasonal changes of temperature are depicted in Figure 6.10. The rise occurs mainly in the summer (June/July/August) when the difference reaches 3-40C on average in the north of the country. Autumn has the second largest warming in absolute terms, whereas the difference of the temperature during the winter and spring seems to be lesser, at about 1-20C.
Figure 6.9 Left column: difference in the average annual (a) maximum, (b) mean, and (c) minimum temperature between 2031-3060 and 1961-1990. Right column: the corresponding
95% conference range.
Source: Giannakopoulos, C., et al. 2009. Climatic change and associated impacts in the Mediterranean resulting from a 2oC global warming. Global and Planetary Change. 2009.
6.1.2.2 Precipitation changes
Annual total rainfalls (Figure 6.11) in Greece mainly decreases by 20-40 mm in absolute values (relative difference -10-0%). These values are quite uncertain, possibly due to the large intra- and inter- annual variability. It should be noted, though, that the difference between the two scenarios is statistically significant.
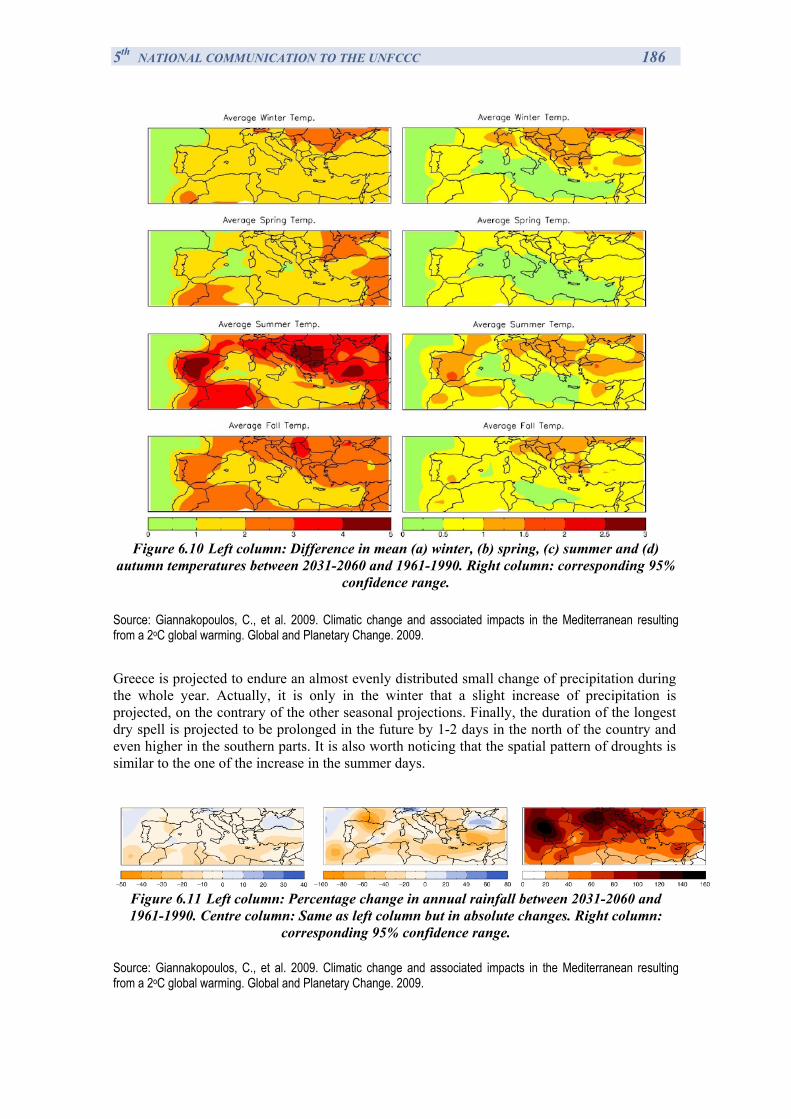
5th NATIONAL COMMUNICATION TO THE UNFCCC 186
Figure 6.10 Left column: Difference in mean (a) winter, (b) spring, (c) summer and (d)
autumn temperatures between 2031-2060 and 1961-1990. Right column: corresponding 95% confidence range.
Source: Giannakopoulos, C., et al. 2009. Climatic change and associated impacts in the Mediterranean resulting from a 2oC global warming. Global and Planetary Change. 2009.
Greece is projected to endure an almost evenly distributed small change of precipitation during the whole year. Actually, it is only in the winter that a slight increase of precipitation is projected, on the contrary of the other seasonal projections. Finally, the duration of the longest dry spell is projected to be prolonged in the future by 1-2 days in the north of the country and even higher in the southern parts. It is also worth noticing that the spatial pattern of droughts is similar to the one of the increase in the summer days.
Figure 6.11 Left column: Percentage change in annual rainfall between 2031-2060 and 1961-1990. Centre column: Same as left column but in absolute changes. Right column:
corresponding 95% confidence range.
Source: Giannakopoulos, C., et al. 2009. Climatic change and associated impacts in the Mediterranean resulting from a 2oC global warming. Global and Planetary Change. 2009.
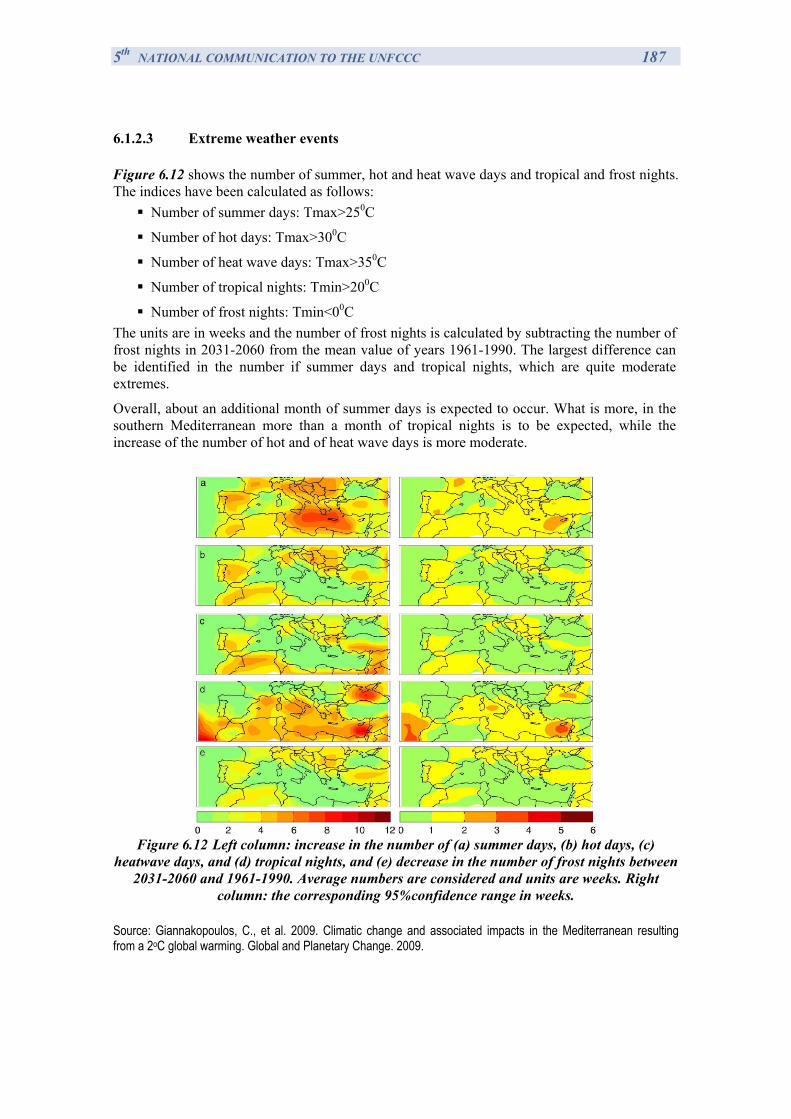
5th NATIONAL COMMUNICATION TO THE UNFCCC 187
6.1.2.3 Extreme weather events
Figure 6.12 shows the number of summer, hot and heat wave days and tropical and frost nights. The indices have been calculated as follows:
Number of summer days: Tmax>250C
Number of hot days: Tmax>300C
Number of heat wave days: Tmax>350C
Number of tropical nights: Tmin>200C
Number of frost nights: Tmin<00C The units are in weeks and the number of frost nights is calculated by subtracting the number of frost nights in 2031-2060 from the mean value of years 1961-1990. The largest difference can be identified in the number if summer days and tropical nights, which are quite moderate extremes.
Overall, about an additional month of summer days is expected to occur. What is more, in the southern Mediterranean more than a month of tropical nights is to be expected, while the increase of the number of hot and of heat wave days is more moderate.
Figure 6.12 Left column: increase in the number of (a) summer days, (b) hot days, (c)
heatwave days, and (d) tropical nights, and (e) decrease in the number of frost nights between 2031-2060 and 1961-1990. Average numbers are considered and units are weeks. Right
column: the corresponding 95%confidence range in weeks.
Source: Giannakopoulos, C., et al. 2009. Climatic change and associated impacts in the Mediterranean resulting from a 2oC global warming. Global and Planetary Change. 2009.
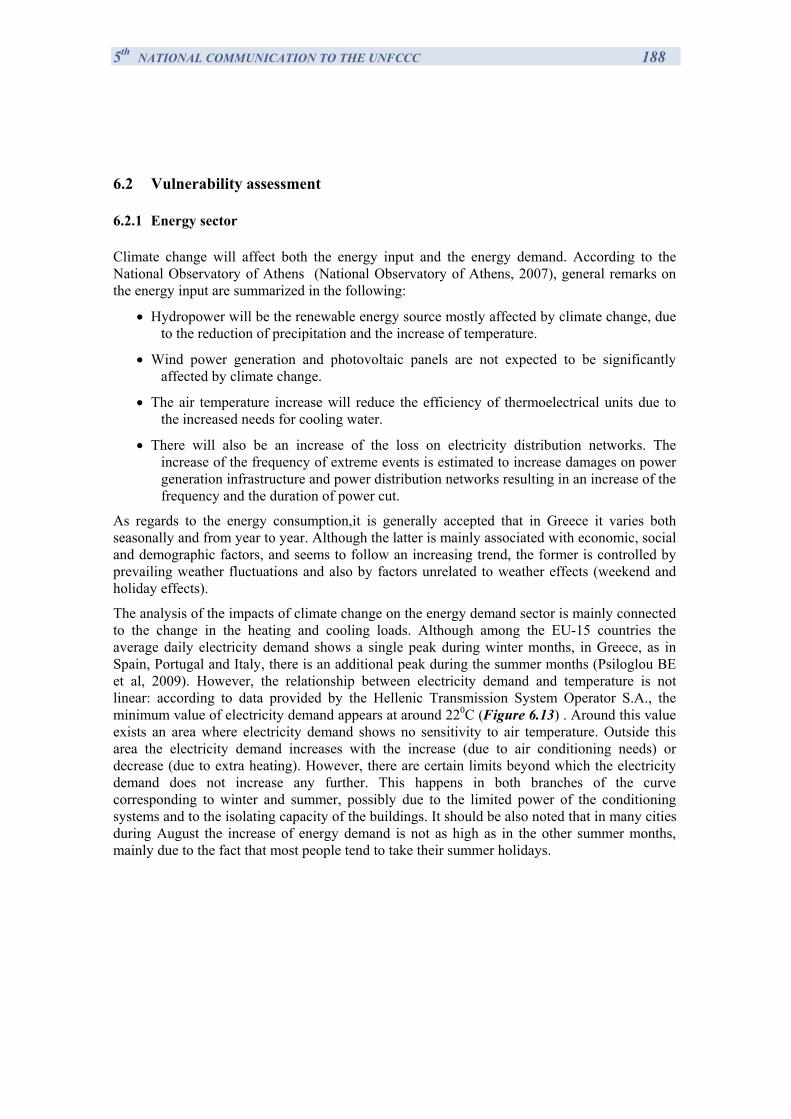
5th NATIONAL COMMUNICATION TO THE UNFCCC 188
6.2 Vulnerability assessment
6.2.1 Energy sector
Climate change will affect both the energy input and the energy demand. According to the National Observatory of Athens (National Observatory of Athens, 2007), general remarks on the energy input are summarized in the following:
• Hydropower will be the renewable energy source mostly affected by climate change, due to the reduction of precipitation and the increase of temperature.
• Wind power generation and photovoltaic panels are not expected to be significantly affected by climate change.
• The air temperature increase will reduce the efficiency of thermoelectrical units due to the increased needs for cooling water.
• There will also be an increase of the loss on electricity distribution networks. The increase of the frequency of extreme events is estimated to increase damages on power generation infrastructure and power distribution networks resulting in an increase of the frequency and the duration of power cut.
As regards to the energy consumption,it is generally accepted that in Greece it varies both seasonally and from year to year. Although the latter is mainly associated with economic, social and demographic factors, and seems to follow an increasing trend, the former is controlled by prevailing weather fluctuations and also by factors unrelated to weather effects (weekend and holiday effects).
The analysis of the impacts of climate change on the energy demand sector is mainly connected to the change in the heating and cooling loads. Although among the EU-15 countries the average daily electricity demand shows a single peak during winter months, in Greece, as in Spain, Portugal and Italy, there is an additional peak during the summer months (Psiloglou BE et al, 2009). However, the relationship between electricity demand and temperature is not linear: according to data provided by the Hellenic Transmission System Operator S.A., the minimum value of electricity demand appears at around 220C (Figure 6.13) . Around this value exists an area where electricity demand shows no sensitivity to air temperature. Outside this area the electricity demand increases with the increase (due to air conditioning needs) or decrease (due to extra heating). However, there are certain limits beyond which the electricity demand does not increase any further. This happens in both branches of the curve corresponding to winter and summer, possibly due to the limited power of the conditioning systems and to the isolating capacity of the buildings. It should be also noted that in many cities during August the increase of energy demand is not as high as in the other summer months, mainly due to the fact that most people tend to take their summer holidays.
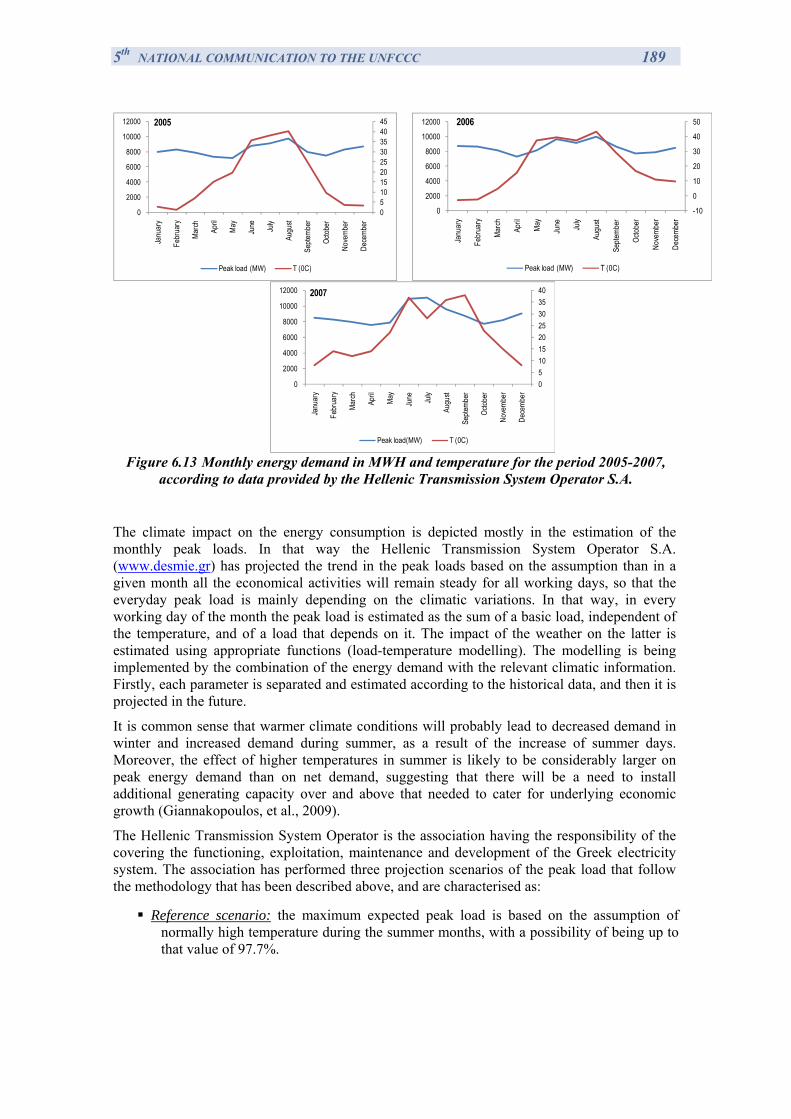
5th NATIONAL COMMUNICATION TO THE UNFCCC 189
051015202530354045
0
2000
4000
6000
8000
10000
12000
Janu
ary
Febr
uary
March Ap
ril
May
June July
Augu
st
Septe
mber
Octob
er
Nove
mber
Dece
mber
2005
Peak load (MW) T (0C)
-10
0
10
20
30
40
50
0
2000
4000
6000
8000
10000
12000
Janu
ary
Febr
uary
Marc
h
April
May
June July
Augu
st
Septe
mber
Octo
ber
Nove
mber
Dece
mber
2006
Peak load (MW) T (0C)
0510152025303540
0
2000
4000
6000
8000
10000
12000
Janu
ary
Febr
uary
March Ap
ril
May
June July
Augu
st
Sept
embe
r
Octob
er
Nove
mber
Dece
mber
2007
Peak load(MW) T (0C)
Figure 6.13 Monthly energy demand in MWH and temperature for the period 2005-2007, according to data provided by the Hellenic Transmission System Operator S.A.
The climate impact on the energy consumption is depicted mostly in the estimation of the monthly peak loads. In that way the Hellenic Transmission System Operator S.A. (www.desmie.gr) has projected the trend in the peak loads based on the assumption than in a given month all the economical activities will remain steady for all working days, so that the everyday peak load is mainly depending on the climatic variations. In that way, in every working day of the month the peak load is estimated as the sum of a basic load, independent of the temperature, and of a load that depends on it. The impact of the weather on the latter is estimated using appropriate functions (load-temperature modelling). The modelling is being implemented by the combination of the energy demand with the relevant climatic information. Firstly, each parameter is separated and estimated according to the historical data, and then it is projected in the future.
It is common sense that warmer climate conditions will probably lead to decreased demand in winter and increased demand during summer, as a result of the increase of summer days. Moreover, the effect of higher temperatures in summer is likely to be considerably larger on peak energy demand than on net demand, suggesting that there will be a need to install additional generating capacity over and above that needed to cater for underlying economic growth (Giannakopoulos, et al., 2009).
The Hellenic Transmission System Operator is the association having the responsibility of the covering the functioning, exploitation, maintenance and development of the Greek electricity system. The association has performed three projection scenarios of the peak load that follow the methodology that has been described above, and are characterised as:
Reference scenario: the maximum expected peak load is based on the assumption of normally high temperature during the summer months, with a possibility of being up to that value of 97.7%.
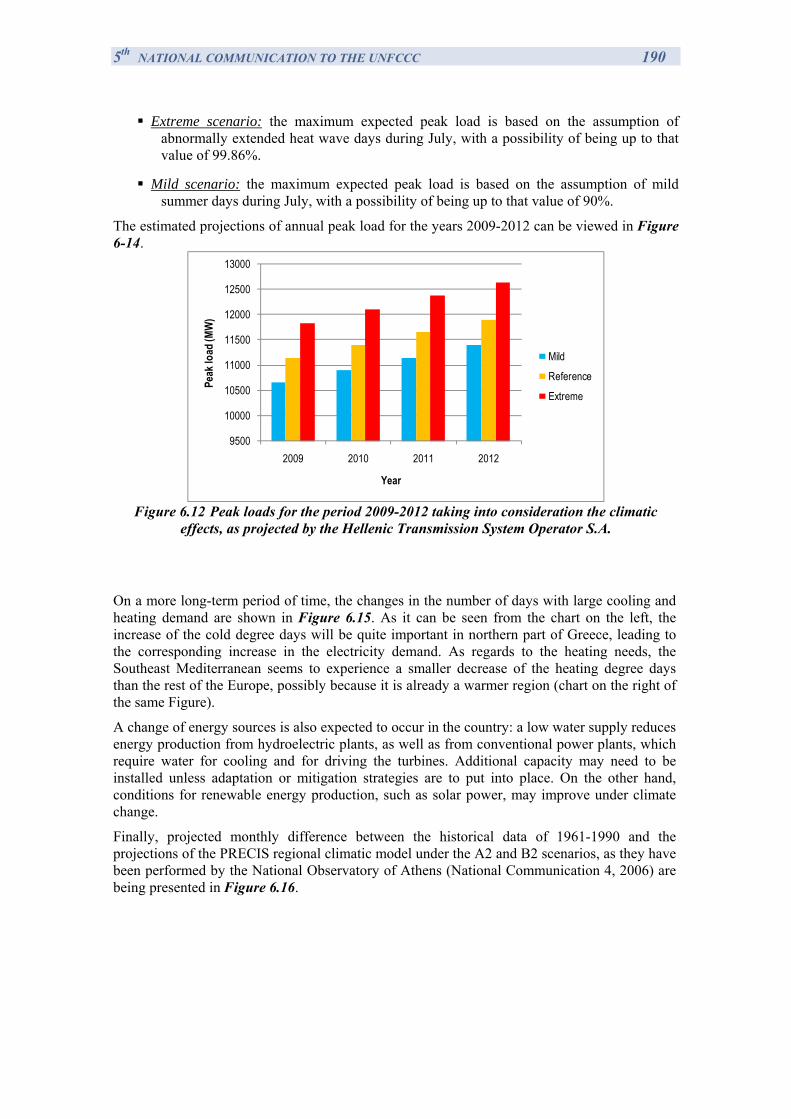
5th NATIONAL COMMUNICATION TO THE UNFCCC 190
Extreme scenario: the maximum expected peak load is based on the assumption of abnormally extended heat wave days during July, with a possibility of being up to that value of 99.86%.
Mild scenario: the maximum expected peak load is based on the assumption of mild summer days during July, with a possibility of being up to that value of 90%.
The estimated projections of annual peak load for the years 2009-2012 can be viewed in Figure 6-14.
9500
10000
10500
11000
11500
12000
12500
13000
2009 2010 2011 2012
Peak
load
(MW
)
Year
Mild
Reference
Extreme
Figure 6.12 Peak loads for the period 2009-2012 taking into consideration the climatic
effects, as projected by the Hellenic Transmission System Operator S.A.
On a more long-term period of time, the changes in the number of days with large cooling and heating demand are shown in Figure 6.15. As it can be seen from the chart on the left, the increase of the cold degree days will be quite important in northern part of Greece, leading to the corresponding increase in the electricity demand. As regards to the heating needs, the Southeast Mediterranean seems to experience a smaller decrease of the heating degree days than the rest of the Europe, possibly because it is already a warmer region (chart on the right of the same Figure).
A change of energy sources is also expected to occur in the country: a low water supply reduces energy production from hydroelectric plants, as well as from conventional power plants, which require water for cooling and for driving the turbines. Additional capacity may need to be installed unless adaptation or mitigation strategies are to put into place. On the other hand, conditions for renewable energy production, such as solar power, may improve under climate change.
Finally, projected monthly difference between the historical data of 1961-1990 and the projections of the PRECIS regional climatic model under the A2 and B2 scenarios, as they have been performed by the National Observatory of Athens (National Communication 4, 2006) are being presented in Figure 6.16.
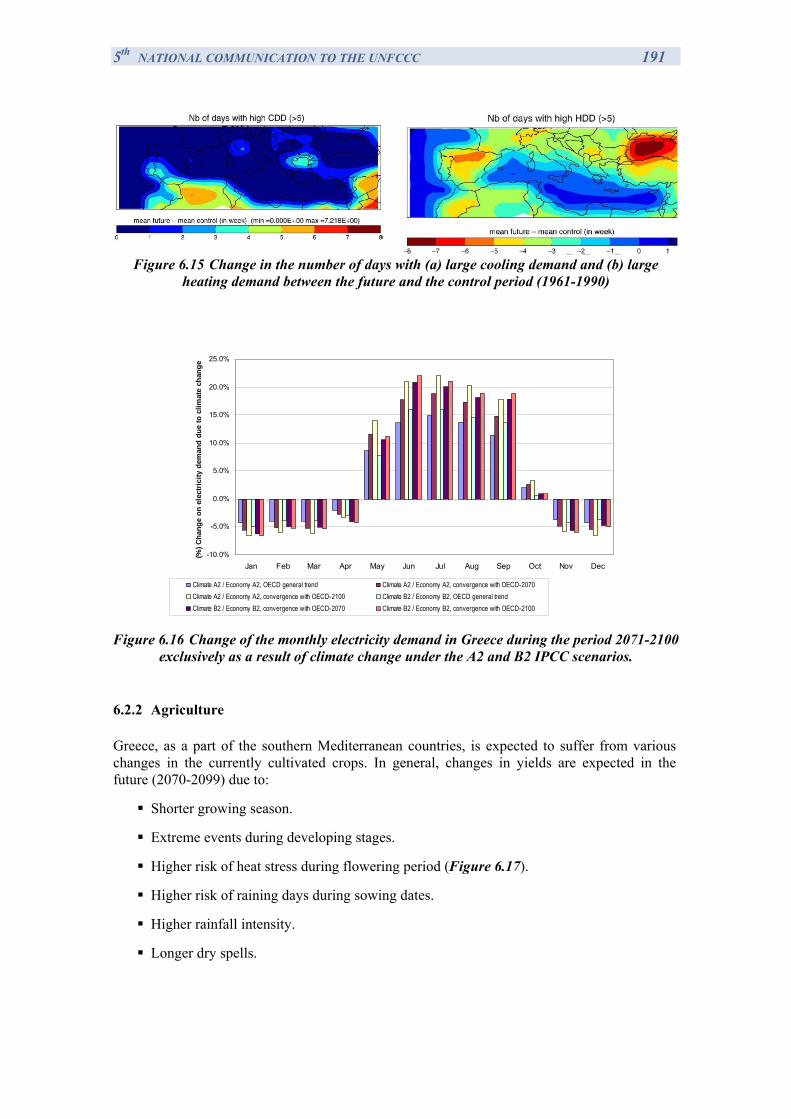
5th NATIONAL COMMUNICATION TO THE UNFCCC 191
Figure 6.15 Change in the number of days with (a) large cooling demand and (b) large heating demand between the future and the control period (1961-1990)
-10.0%
-5.0%
0.0%
5.0%
10.0%
15.0%
20.0%
25.0%
Jan Feb Mar Apr May Jun Jul Aug Sep Oct Nov Dec
(%) C
hang
e on
ele
ctric
ity d
eman
d du
e to
clim
ate
chan
ge
Climate A2 / Economy A2, OECD general trend Climate A2 / Economy A2, convergence with OECD-2070Climate A2 / Economy A2, convergence with OECD-2100 Climate B2 / Economy B2, OECD general trendClimate B2 / Economy B2, convergence with OECD-2070 Climate B2 / Economy B2, convergence with OECD-2100
Figure 6.16 Change of the monthly electricity demand in Greece during the period 2071-2100
exclusively as a result of climate change under the A2 and B2 IPCC scenarios.
6.2.2 Agriculture
Greece, as a part of the southern Mediterranean countries, is expected to suffer from various changes in the currently cultivated crops. In general, changes in yields are expected in the future (2070-2099) due to:
Shorter growing season.
Extreme events during developing stages.
Higher risk of heat stress during flowering period (Figure 6.17).
Higher risk of raining days during sowing dates.
Higher rainfall intensity.
Longer dry spells.
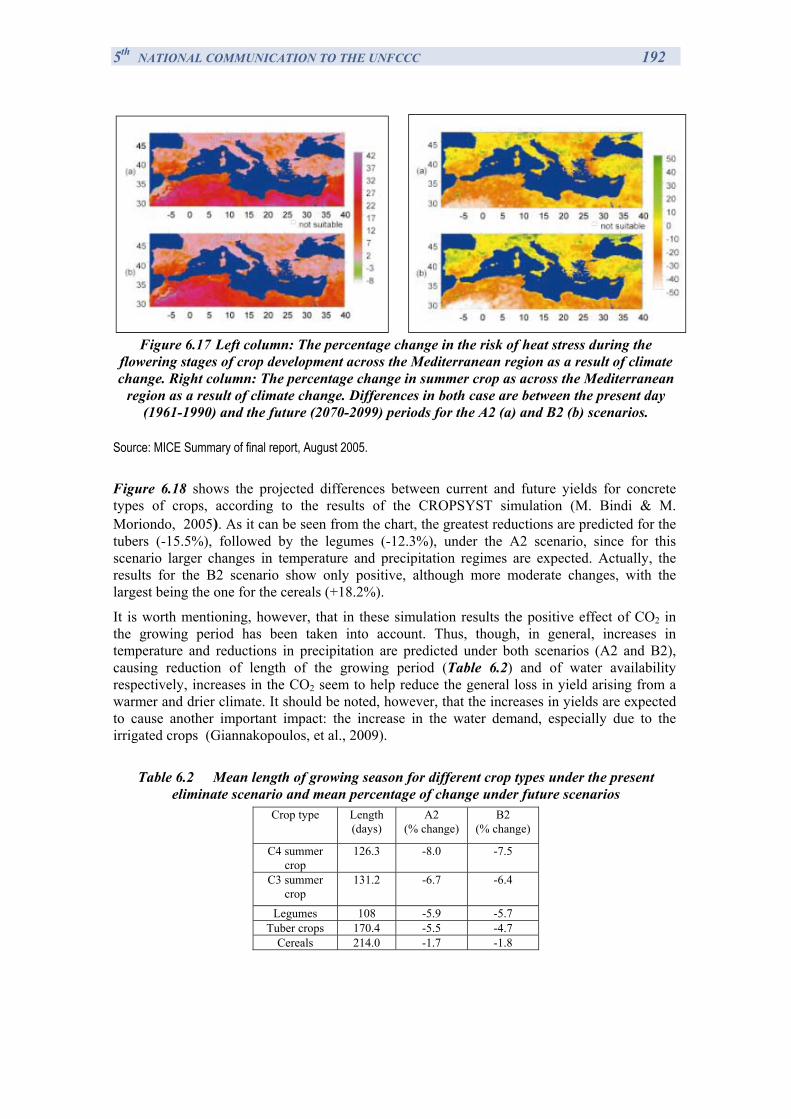
5th NATIONAL COMMUNICATION TO THE UNFCCC 192
Figure 6.17 Left column: The percentage change in the risk of heat stress during the
flowering stages of crop development across the Mediterranean region as a result of climate change. Right column: The percentage change in summer crop as across the Mediterranean
region as a result of climate change. Differences in both case are between the present day (1961-1990) and the future (2070-2099) periods for the A2 (a) and B2 (b) scenarios.
Source: MICE Summary of final report, August 2005.
Figure 6.18 shows the projected differences between current and future yields for concrete types of crops, according to the results of the CROPSYST simulation (M. Bindi & M. Moriondo, 2005). As it can be seen from the chart, the greatest reductions are predicted for the tubers (-15.5%), followed by the legumes (-12.3%), under the A2 scenario, since for this scenario larger changes in temperature and precipitation regimes are expected. Actually, the results for the B2 scenario show only positive, although more moderate changes, with the largest being the one for the cereals (+18.2%).
It is worth mentioning, however, that in these simulation results the positive effect of CO2 in the growing period has been taken into account. Thus, though, in general, increases in temperature and reductions in precipitation are predicted under both scenarios (A2 and B2), causing reduction of length of the growing period (Table 6.2) and of water availability respectively, increases in the CO2 seem to help reduce the general loss in yield arising from a warmer and drier climate. It should be noted, however, that the increases in yields are expected to cause another important impact: the increase in the water demand, especially due to the irrigated crops (Giannakopoulos, et al., 2009).
Table 6.2 Mean length of growing season for different crop types under the present
eliminate scenario and mean percentage of change under future scenarios Crop type Length
(days) A2
(% change) B2
(% change)
C4 summer crop
126.3 -8.0 -7.5
C3 summer crop
131.2 -6.7 -6.4
Legumes 108 -5.9 -5.7 Tuber crops 170.4 -5.5 -4.7
Cereals 214.0 -1.7 -1.8
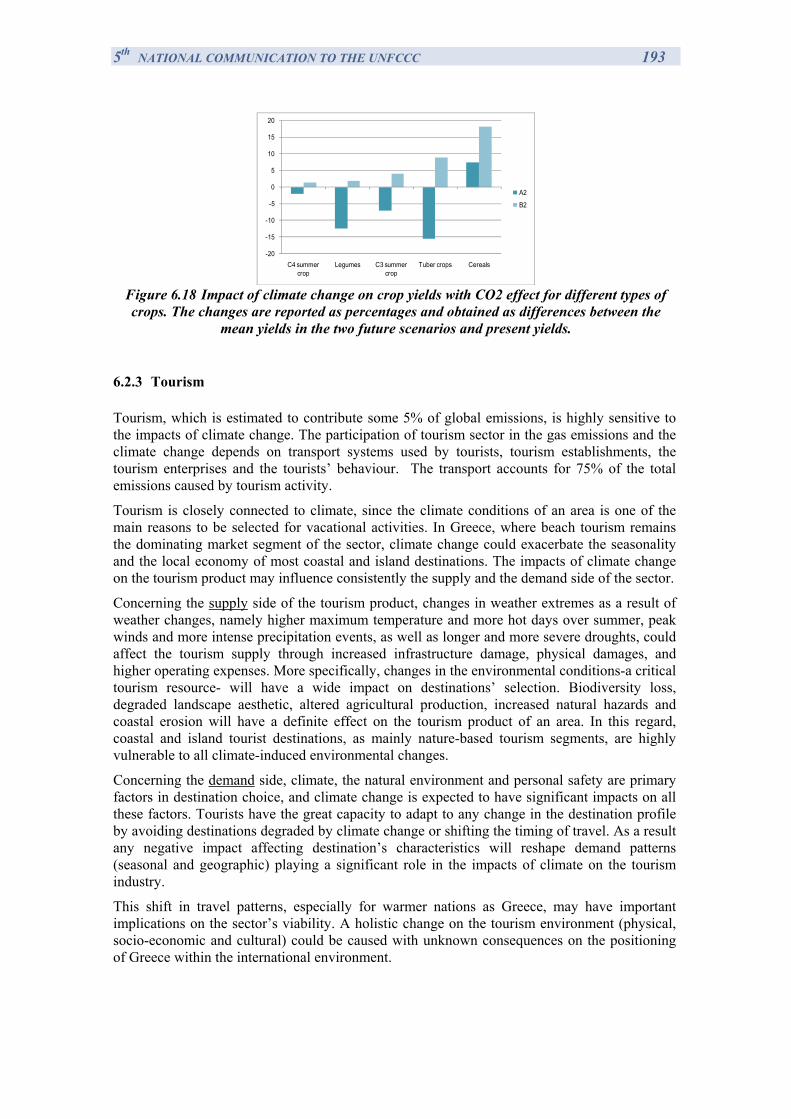
5th NATIONAL COMMUNICATION TO THE UNFCCC 193
-20
-15
-10
-5
0
5
10
15
20
C4 summer crop
Legumes C3 summer crop
Tuber crops Cereals
A2
B2
Figure 6.18 Impact of climate change on crop yields with CO2 effect for different types of crops. The changes are reported as percentages and obtained as differences between the
mean yields in the two future scenarios and present yields.
6.2.3 Tourism
Tourism, which is estimated to contribute some 5% of global emissions, is highly sensitive to the impacts of climate change. The participation of tourism sector in the gas emissions and the climate change depends on transport systems used by tourists, tourism establishments, the tourism enterprises and the tourists’ behaviour. The transport accounts for 75% of the total emissions caused by tourism activity.
Tourism is closely connected to climate, since the climate conditions of an area is one of the main reasons to be selected for vacational activities. In Greece, where beach tourism remains the dominating market segment of the sector, climate change could exacerbate the seasonality and the local economy of most coastal and island destinations. The impacts of climate change on the tourism product may influence consistently the supply and the demand side of the sector.
Concerning the supply side of the tourism product, changes in weather extremes as a result of weather changes, namely higher maximum temperature and more hot days over summer, peak winds and more intense precipitation events, as well as longer and more severe droughts, could affect the tourism supply through increased infrastructure damage, physical damages, and higher operating expenses. More specifically, changes in the environmental conditions-a critical tourism resource- will have a wide impact on destinations’ selection. Biodiversity loss, degraded landscape aesthetic, altered agricultural production, increased natural hazards and coastal erosion will have a definite effect on the tourism product of an area. In this regard, coastal and island tourist destinations, as mainly nature-based tourism segments, are highly vulnerable to all climate-induced environmental changes.
Concerning the demand side, climate, the natural environment and personal safety are primary factors in destination choice, and climate change is expected to have significant impacts on all these factors. Tourists have the great capacity to adapt to any change in the destination profile by avoiding destinations degraded by climate change or shifting the timing of travel. As a result any negative impact affecting destination’s characteristics will reshape demand patterns (seasonal and geographic) playing a significant role in the impacts of climate on the tourism industry.
This shift in travel patterns, especially for warmer nations as Greece, may have important implications on the sector’s viability. A holistic change on the tourism environment (physical, socio-economic and cultural) could be caused with unknown consequences on the positioning of Greece within the international environment.
5th NATIONAL COMMUNICATION TO THE UNFCCC 194
The increase of temperature can lead to the gradual movement of touristic centres towards the northern Europe and mountainous areas, decreasing the preference of west European tourists for the Mediterranean. For instance, the mountainous regions could easily become more popular during summer, due to the coolness of the climate. The increased temperatures during summer can lead to the gradual decrease of summer tourism in the Mediterranean, but in increase during spring and autumn. It is expected that climate change will lead to the prolongation of the touristic period in Greece and Spain up to 2030, in a way that the arrival of tourists can be allocated more homogenously, decreasing the intensity of the water scarcity and energy consumption issues in the islands during summer.
Attica and Heraclio (Crete) are the touristic areas that will experience the higher rate of water change that might result to shortages that would affect touristic activities, while the islands of the Aegean, and especially the Cyclades, seem to keep their cool climate, indicating that the impact of the sea is very important in the moderation of increased temperatures.
6.2.4 Water resources
6.2.4.1 General situation
Greece is characterized by a number of small-size hydrological/hydro-geological regions and by an intense seasonal variation of the water resources availability. In the same time, groundwater is widely used in order to cover the special local needs. The distribution of water resources shows important dispersion, with limited resources and increased concentration of water demand in the coastal zone and in the larger plains of the country, especially in the historical development axis of Thessalonica-Athens-Patra. The trend of the time series shows that water demand is highly dependent on the type of use and shows a seasonal increase from May to September, with a peak in July.
The quantity of water constitutes in Greece a quite more intense problem compared to the situation of other European countries, especially the ones in the central and north Europe, due to the important seasonal variation of the resources. The average run-off in east-southern European rivers is projected to decrease due to increasing temperature and decreasing precipitation. In particular, some river basins, which already face water stress, may see marked decreases of water availability (Morrocco, Spain & Greece. with the contribution of the MED EUWI Secretariat, 2008)
Quantity and quality water problems caused by climate change are mainly attributed to the projected decrease of precipitation during the summer months and also to the salinisation of the water as a result of coming in contact with the sea. The geomorphology of the country, and especially the large number of islands, is responsible for an additional problem: in many cases the large demand of water of special large hydrological regions is of the same order of the sum of smaller hydrological and dispersed areas. In the same time, the water supply centres are equally dispersed and the estimation of their availability depends on the construction of hydrological balances for a large number of small hydrological basins.
Major drought episodes are projected to become more frequent with particularly intense summer droughts. This may be further exacerbated because of an increasing demand for water as a result of elevated temperatures. Greece is among the countries that are expected to be worst hit by an increase in frequency and severity of droughts and water scarcity. Heat waves will affect tourism activities as well as people’ health and enhance energy consumption for cooling purposes.
The country has been suffering, also, major damaging floods in the recent years. Although the floods cannot be attributed to global climate change alone - since changes in river management,
5th NATIONAL COMMUNICATION TO THE UNFCCC 195
the increased urbanisation of former floodplains and deforestation of upstream mountainous areas further enhancing local rainfall run-off also affect flood generation -, an increasing risk of flooding in the region is expected due to climate change. Intensity of extreme weather events, such as storms and associated surges are additional pressures.
With water resources becoming even scarcer and population increasing due to the immigration rates from neighbor countries, in most of the region there will be even less water per capita. The situation is projected to be more intense during the summer months in the islands, as a result of the increased number of tourists. At the same time, as in other Mediterranean countries with rapidly growing economies and living standards, serious impacts on the economic development is to be expected in Greece.
6.2.4.2 Sectoral issues
The National Programme on Management and Protection of Water Resources, prepared by the National Technical University of Athens and published by the Central Water Agency in February 2008, describes the problems that different sectors are prone to face in the years to come. Some of the main impacts are briefly outlined as follows:
Irrigation
The largest percentage of consuming water needs in Greece is occupied by irrigation (84%). This high percentage- one of the highest in Europe- should not be viewed as an indicator of dominance of agricultural production sector, as it is mainly attributed to the different physical, and more precisely climatological, circumstances of the country. In Greece the evapotranspiration during summer is particularly high (close to 1 m), while the precipitation is minimizing. As a result there is an increase of water demand for the majority of agricultural soils. The issue is more intense in the last years, since the absence of summer precipitation has a negative impact on water available for irrigation. In addition, the projections of droughts ensure the increased intensity of the problem for the years to come. According to the National Program of Management and Protection of Water Resources, the total coverage of the irrigation demands will not be possible in one out of five years. However, this is not projected to cause food security or additional economy problems, provided that droughts are not projected to occur in the same time in the whole of the country or in all the neighboring countries. There is, however, the issue of agricultural insurances and compensation that arises and that is very important for the agricultural population hit by the droughts. In many regions the agricultural activities that are related to the water management have already caused important problems to the aquifers, which, in view of the climate change impacts, have, and will continue to worsen the situation in the years to come in the following ways:
1. Quantified reduction of water resources as a result of over-exploitation. This is a very important impact that leads to the minimization of resources, soil degradation and constitutes an additional burden for the economic and the energy balance of the country.
2. Quality degradation: Destruction of an important percentage of the coastal aquifiers due to the advance of the sea water in the land.
5th NATIONAL COMMUNICATION TO THE UNFCCC 196
Water supply system in urban areas:
The water supply needs are traditionally covered using groundwater, from springs or from drills via pumping. In most cases groundwater is preferable to cover the water supply, since the water system in this case is less expensive, while the demanded water treatment is simpler (includes just decontamination procedures). However, in large cities, especially in Athens, the groundwater is not enough to cover the needs, leading to the additional exploitation of surface water which demands more complicated and expensive systems of transport, treatment and storage. In the current years and the years that are coming, the increase of water demand, the distress of groundwater deposits as a result of overexploitation and the quality degradation will inevitably lead to the exploitation of surface resources in other urban areas of the country (Thessaloniki, Patra, Heraklio, and Rhodes).
Water supply in the Greek islands and in touristic areas:
The increase of the number of tourists and the decrease of precipitation that is projected in the island areas of the country are projected to cause important problems in the water supply balances. An additional problem is that every region constitutes a different case, demanding the construction of the local water balance. The adaptation measures that are common in all the areas concern the fact that all the alternative water resources should be considered, including water transport from other regions, reuse of treated wastewater and operation of desalination units. Additionally, the development of touristic areas should take into account the scarcity of water resources in areas that are prone to droughts.
Protection from floods and rainwater:
One of the most important problems regarding water management in urban areas is the issue of rainwater management. Historically, the urban development of Greece has not been combined with the construction of suitable rainwater storage infrastructures, probably due to their high cost. On the contrary, it was the urbanization that caused additional problems to the water currents, which are the physical receivers of rainwater, since the dense urban layout was characterized by a decreased number of green areas, resulting in the abrupt increase of the impenetrable surface and of the time available for the run-offs of the rainwater. In this way currently the Greek cities are suffering from intense floods during the period of high precipitation load, whereas in the future the intensity and frequency of floods is expected to rise as a result of the projected intensification of extreme weather events.
6.2.4.3 Water balances per Region
The difference between the quantity of the known water resources and the quantity that is currently used is not always reflecting a real surplus, since it is not the total of known water that can be totally exploited because of technico-economical and quality limitations, as well as to the continuously rising water demand in specific areas and time seasons.
The National Programme on Management and Protection of Water Resources presents three scenarios of water balances, following the current, the medium-term and the long-term situation
5th NATIONAL COMMUNICATION TO THE UNFCCC 197
of water demand and supply, respectively. The scenarios refer to the values of water supply-demand during July, since this is the worse season as regards water balances (increased demand, minimum supply). Each of the water regions of the country have been characterized, using the following terminology:
Superfluous: if the supply exceeds demand by more than 110%.
Marginally superfluous: if the supply exceeds demand by a percentage oscillating between 100% and 110%.
Marginally unbalanced: if the supply is oscillating between the 90% and 100% of the demand.
Unbalanced: If the supply is less than 90% of the demand.
The results for each scenario are presented in the following tables:
Table 6.3 Comparison of water supply and demand during July (in hm3): Current situation
by water region. No Water Regions Supply Demand Observations 1 Western Peloponnese 73 55 Superfluous 2 Northern Peloponnese 122 104 Superfluous 3 Eastern Peloponnese 56 67 Unbalanced 4 Western Sterea Ellada 417 82 Superfluous 5 Epirus 206 39 Superfluous 6 Attica 64 64 Marginally superfluous(1)
7 Eastern Sterea Ellada 128 176 Unbalanced(2)
8 Thessaly 223 337 Unbalanced 9 Western Macedonia 159 136 Superfluous 10 Central Macedonia 137 130 Marginally superfluous 11 Eastern Macedonia 354 132 Superfluous 12 Thrace 424 253 Superfluous 13 Crete 130 133 Marginally unbalanced(3)
14 Islands of the Aegean Sea 7 25 Unbalanced TOTAL 2500 1733
(1)Water resources are principally transported by neighboring water regions. (2)The number of irrigated areas as reported by NSSG is considered overestimated. As a result while the particular region is currently marginally sufficient, it is presented here as unbalanced. (3)Like it is happening at present, the demand is expected to be met by water springs and drills. Source: National Programme on Management and Protection of Water Resources, 2008. In the current circumstances, an important water quantity (in particular, groundwater) is accepted by the water region 1 (8% of its potential). This quantity corresponds to the 9% of the region 2, from which is exported. In absolute values the most important internal water transport between regions is the one from the region 4 mainly to region 6 (Attica). This is an example of the urban water deficiency, as all this imported water is used for the water supply of Athens.
In the medium and long term scenarios, the current situation is different due to the completetion of the works regarding the diversion of the Aheloos River towards the region of Thessaly (8). In that way, the water region 4 will export 13% of its potential towards the regions 6 and 8 and the region of Thessaly, which is currently unbalanced, will receive about 16% of its water potential. It is important to note that in order to avoid water stress in some areas of the country the percentage of internal water transport is projected to be doubled.
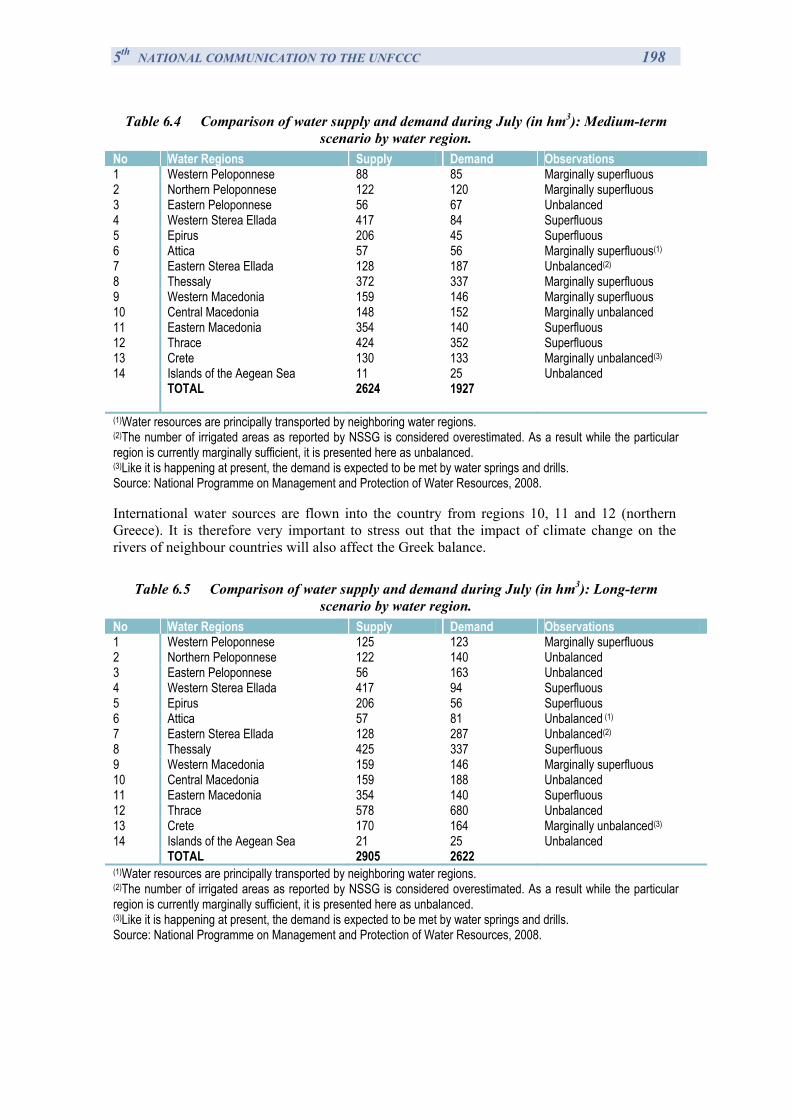
5th NATIONAL COMMUNICATION TO THE UNFCCC 198
Table 6.4 Comparison of water supply and demand during July (in hm3): Medium-term scenario by water region.
No Water Regions Supply Demand Observations 1 Western Peloponnese 88 85 Marginally superfluous 2 Northern Peloponnese 122 120 Marginally superfluous 3 Eastern Peloponnese 56 67 Unbalanced 4 Western Sterea Ellada 417 84 Superfluous 5 Epirus 206 45 Superfluous 6 Attica 57 56 Marginally superfluous(1)
7 Eastern Sterea Ellada 128 187 Unbalanced(2)
8 Thessaly 372 337 Marginally superfluous 9 Western Macedonia 159 146 Marginally superfluous 10 Central Macedonia 148 152 Marginally unbalanced 11 Eastern Macedonia 354 140 Superfluous 12 Thrace 424 352 Superfluous 13 Crete 130 133 Marginally unbalanced(3)
14 Islands of the Aegean Sea 11 25 Unbalanced TOTAL 2624 1927
(1)Water resources are principally transported by neighboring water regions. (2)The number of irrigated areas as reported by NSSG is considered overestimated. As a result while the particular region is currently marginally sufficient, it is presented here as unbalanced. (3)Like it is happening at present, the demand is expected to be met by water springs and drills. Source: National Programme on Management and Protection of Water Resources, 2008. International water sources are flown into the country from regions 10, 11 and 12 (northern Greece). It is therefore very important to stress out that the impact of climate change on the rivers of neighbour countries will also affect the Greek balance.
Table 6.5 Comparison of water supply and demand during July (in hm3): Long-term
scenario by water region. No Water Regions Supply Demand Observations 1 Western Peloponnese 125 123 Marginally superfluous 2 Northern Peloponnese 122 140 Unbalanced 3 Eastern Peloponnese 56 163 Unbalanced 4 Western Sterea Ellada 417 94 Superfluous 5 Epirus 206 56 Superfluous 6 Attica 57 81 Unbalanced (1)
7 Eastern Sterea Ellada 128 287 Unbalanced(2)
8 Thessaly 425 337 Superfluous 9 Western Macedonia 159 146 Marginally superfluous 10 Central Macedonia 159 188 Unbalanced 11 Eastern Macedonia 354 140 Superfluous 12 Thrace 578 680 Unbalanced 13 Crete 170 164 Marginally unbalanced(3)
14 Islands of the Aegean Sea 21 25 Unbalanced TOTAL 2905 2622 (1)Water resources are principally transported by neighboring water regions. (2)The number of irrigated areas as reported by NSSG is considered overestimated. As a result while the particular region is currently marginally sufficient, it is presented here as unbalanced. (3)Like it is happening at present, the demand is expected to be met by water springs and drills. Source: National Programme on Management and Protection of Water Resources, 2008.
5th NATIONAL COMMUNICATION TO THE UNFCCC 199
6.2.5 Biodiversity
The impacts of climate change on the Greek biodiversity have mostly been estimated for the marine ecosystems and fisheries, whereas studies on different types of ecosystems are less common and far more fragmentary. It should be mentioned however that recently the Greek ministries seem to recognize the importance of the issue. To this spirit, in the “National Strategy for Biodiversity”, that has been prepared and is currently under further evaluation in view of the new Public Administration structure and the priorities of the new Government, one of the main aims is the “Confrontation of and the adaptation to climate change, reduction of negative impacts on biodiversity by taking actions against climate change” (see also Section 6.3.4).
In the following paragraphs some aspects of the vulnerability of Greek biodiversity as a result of climate change will be described. Emphasis will be put on the marine ecosystems and fisheries and the forests.
6.2.5.1 Marine ecosystem and fisheries
In Greece, just as in the rest of the Mediterranean sea, “changes in bio-chemical and physical seawater properties resulting from global warming are likely to alter marine biodiversity and productivity, trigger trophic web mismatches and encourage diseases, toxic algal bloom and propagation of thermophilic species” (Gambaiani, et al., 2008). Some of these aspects are going to be analysed briefly in the following paragraphs.
Climate change has a very important impact on the marine environment of Greece. Many of the environmental mechanisms controlling growth, abundance, distribution, composition, diversity and recruitment success of Mediterranean species that are quite abundant in the Greek seas, like anchovy (Engraulis encrasicolus) or sardine (Sardinella aurita and Sardina pilchardus), include: regional temperature variations, riverine inputs and wind-induced mixing, which influences sea surface temperature and salinity, hydrographical features as well as nutrient enrichment and planktonic production.
One of the most important characteristics of the Mediterranean sea is that it is considered an oligotrophic one, in a way that oceanographic features’ change (i.e. upwelling phenomena etc.), as a result of climatic variability may affect nutrient availability. Increasing temperatures are likely to trigger stronger thermal stratification and deepen the thermocline, preventing or modifying the mixing of water masses and cold and nutrient-rich deep waters upwelling. On the other hand, extreme weather events and sea level rise will release abundant terrestrial suspended solids and pollutants into the marine environment, which may negatively affect the coastal biocenoses. In Greece, this is possible to happen in the fragile biotopes of endemic Posidonia oceanica, one of the most important and complicated sea plant that forms sea grass medows in the coastal areas. According to the Hellenic Centre for Marine Research (Siakavara, 2008), the particular species are already experiencing lower rates of development as a result of harbour works, eutrophication etc., and the above mentioned aspects of climate change is projected to worsen the situation.
Changes that have been related to global warming also include the high abundance of Centropages typicus at the expense of Temora stylifera, which is happening in Greece (Saronikos Golf) as in the rest of the Mediterranean Sea (Mazzocchi, et al., 2007). Jellyfish, which feed on fish lavrae, eggs and copepods, can strongly affect plankton communitites, which, in turn, affect the fluxes of matter and energy in the marine ecosystem, supply a biological pump of carbon into the deep ocean and strongly influence fish recruitement (Gambaiani, et al., 2008).
5th NATIONAL COMMUNICATION TO THE UNFCCC 200
Another aspect strongly related to the climatic changes is the invasion of new exotic, thermophilic species in the Mediterranean seas. The obvious impact is that the increase of alien species can cause endemic species to rapidly decrease their number and to be displaced. An extensive record keeping and characterization of the invasive species has been performed by Streftaris and Zenetos (Streftaris, et al., 2006). According to the specific review article, some of the invasive species in Greece include Caulerpa racemosa var. Cylindracea, the Scleractinian coral Oculina patagonica and others. Interesting is also the case of the round sardine (Sardinella aurita), which used to appear occasionaly in the northern Aegean sea about 50 years ago, but is experiencing a wider expansion and population increase in the recent years most possibly due to the increase of temperature, leading to the deplacement of the anchovy (Engraulis encrasicolus)stocks (Tsikliras, et al., 2006). Areas of high endemic biodiversity are likely to be less subject to non-indigenous species invasion. Therefore sparse and declining population such as Posidonia oceanica medows are more vulnerable to be overgrown and replaced by invasive macroalgae like Caulerpa taxifolia and Caulerpa racemosa. Furthermore, some cold-water species that are situated at the northern limit of each tolerance will be more vulnerable to invasion, which is the case for many taxa in the eastern Mediterranean Sea (Gambaiani, et al., 2008).
Meteorological anomalies can significantly alter ecosystems and cause mass mortality episodes. During the Eastern Mediterranean Transient of in the 1990’s5 , the modification of the physic-chemical characteristics of the deep waters rapidly affected deep-sea nematode diversity. Following the 1994-1995 period only some marine faunal species have been able to recover, showing to us the potential large-scale consequences of global warming.
Climate change will also have impacts on the cetaceans. One of the most obvious ones is the limited prey availability, especially in the confined habitat of these species. This fact can subsequently affect the health, physical strength and abundance of the cetacean population, and has already been observed in the bottlenose dolphins of the Ionian Sea (Gambaiani, et al., 2008). Moreover, global warming is likely to encourage the spreading of viruses and pathogens and may promote epizootic events like morbillivitus infections, which have also been identified in the endangered Mediterranean monk seal (Monachus Monachus). It should be outlined here that today the Mediterranean monk seal is one of the rarest seal species and one of the six most critically endangered mammals on our planet. According to available data, the largest global population of the species lives and breeds in Greek seas while accounting for approximately 90% of the European population of the species. The monk seal is, also, one of the species that breeds, feeds and calves in the coastal areas, being in that way more vulnerable to climate change and to the generation of coastal inundations and reduced water quality.
5 One of the most dramatic ones, that took by surprise the oceanographic community in the 1990s, is the Eastern
Mediterranean Transient (EMT). While the classic view of the oceanic circulation in the Mediterranean Sea had the Adriatic Sea as the major source of the deep waters, observations from two cruises in 1987 and 1995 south of Crete revealed a dramatic change of the vertical structure of the deep water column of the Eastern Mediterranean. New, highly saline and rich in oxygen waters filled the bottom layers of the Ionian and the Levantine basins. The new observations shook the physical oceanographic community of the Mediterranean, as they have shown that significant changes in the functioning of the thermohaline circulation could occur rapidly. More astonishingly, after the mid-nineties, the Cretan sea returned to the pre-EMT condition of exporting small amounts of dense water that does not reach the bottom of the Ionian and Levantine basins, while the main contributor of dense waters for the Eastern Mediterranean is once again the Adriatic Sea (Tsimplis, et al., 2005)
5th NATIONAL COMMUNICATION TO THE UNFCCC 201
6.2.5.2 Forests
The main impacts of climate change on the forest biodiversity in Greece are linked to the forest increase of temperature and decrease of precipitation and to the forest fires6 .
According to information received by the Hellenic Ministry of Rural Development and Food, in Greece the most vulnerable forest ecosystems are the ones whose spreading is spatially limited. These forests include the forests of islands and coastal zones and the forests in the mountains of South Greece, like Taigetos and Parnonas. However, the summer of 2007 has shown that apart from the mountain forests of South Greece, even the ones in the North of the country are becoming more vulnerable due to climate change.
The predicted increase of the mean minimum winter temperature could affect forests that are used in a colder climate. The new climate situation might become prohibitive for some species, like firs (Abies amabilis7) that need water and air humidity in order to develop. To make things worse, some of these species are being burnt in the forest fires. Indeed, Abies cephalonica has been identified in the species burnt in the forest fires of June 2007 in Parnitha (2049 ha of Albies cephalonica have been burnt, about 70% of the total burnt area).
The national parks8 of the country will be also affected by the rise in the temperature, while the projected rise, especially during summer, will be higher in the forests of Vikos Aoos, Pindus, Prespes, Parnassus and Olympus. However, in forests that are influenced by the sea breeze, like Lefka Ori in Crete, Ainos in Cephalonia, Sounio and Parnitha, temperature rise is projected to be significantly lower.
Another important impact of climate change on the forests is forest fires. Most of the areas in the Greek territory show a generally increasing trend of the extreme risk of forest fires by 10 days. This value is higher for the national parks of Iti and Parnitha (increase by 15 days).
The disastrous impacts of 2007 forest fires on biodiversity have been estimated by scientific teams of the Agricultural University of Athens in the context of the “Study on the rehabilitation and development of the agricultural and forestrial sectors and on the environmental protection in the areas touched by the fires of the summer 2007” (Agricultural University of Athens, 2007). The main findings include the following:
Important surface of the areas touched by fires have been occupied by deciduous trees like chestnuts, oaks (Quercus ilex) and planes (Platanus aceriolia). As regards to grazing forest areas, the main species include evergreen broad-leaved species of bushes. The latter ones constitute the main type of grazing areas for agricultural animals. The evergreen broad-leaved in general have been adapted to a constitute of repetitive forest fires and are experiencing revegetation in a quite short period after the fire, in a way that after two or five years they can be used again as grazing areas. Of course, this is always dependent on the area, the climate, the ground and the topography. With reference to conifers forests that prosper in low temperatures (Pinus halepensis and Pinus pinea), the largest area burnt is in the Prefecture of Ilia, in Peloponnese (61.6% of the total burnt area of conifers). Also, the Prefectures of Ilia and Arcadia are the ones that experienced the biggest distraction of deciduous broad-leaved forests.
The disturbance of Greek biodiversity due to forest fires includes other species too, like olive trees, fig trees, vineyards, nuts, while beekeeping has been also affected, since a lot of hives have been burnt and for the rest the flora destruction makes difficult the discovery of food. 6 Using the average burnt surface per fire as an index, Greece is facing the most severe forest fire issue among the
countries of the E.U. (394 acres per fire). 7 In Greece there are three species of Abies Amabilis: Abies cephalonica, Abies alba and Abies borisii regis. 8 The designation “National Park” refers to areas which, under the international forest legislation, display special
ecological interest due to the rare and variegated indigenous flora and fauna, their geomorphologic formations, subsoil, water and atmosphere.
5th NATIONAL COMMUNICATION TO THE UNFCCC 202
Finally, as regards to livestock, destructions include animals (sheep, goats, cattle, equine), habitats and grazing lands.
According to experts from the Greek Biotope/Wetland Centre that is functioning under the Goulandris Natural History Museum (Kakouros, 2008), in Greece, due to the implementation of natural forestry and the implementation of the sustainability of yields, the adaptation of forests to climate change will depend on the species and the area. Main findings report that the aquatic forests are confronting significant pressures, especially those that are situated by the river beds. The restoring of old forests is expensive, due to the fact that the majority of the appropriate areas are already used by agricultural yields. The most important efforts are being performed in protected areas (Delta of Nestos river, Rodia of Amvrakikos Gulf). It should be noted, also, that among the factors that must be examined in the context of a future national regulation, the experts suggest the creation of provisions for the safe emigration of specific vulnerable species (like Abies amabilis and Picea Abies) to higher or northern areas.
6.2.5.3 Alpine zone of the Lefka Ori, Crete
The estimations that are presented in this paragraph, are based on the scientific article “Vascular plant diversity and climate change in the alpine zone of Lefka Ori, Crete” that has been published in the Biodiversity and Conservation Journal, in 2009 (Kazakis, et al., 2007).
The study is based on the analysis of the vascular flora and the local climate along the altitudinal gradient in the Lefka Ori of Crete. On the basis of the fact that the altitudinal gradient is characterized by different temperatures, the writers are estimating the potential change in the biodiversity as a result of climate alternation.
The main characteristics of the possible future biodiversity on the summits of Lefka Ori include the following:
The first process to be recorded will concern the shift of more thermophilous species towards higher bioclimatic zones; therefore there will be an increase of species richness in higher altitudes. For many alpine species chilling is required for germination, therefore any changes in frost pattern will in turn affect their reproductive abilities. The results from Lefka Ori indicate that in the highest zones the southern exposures will probably be affected first by the arrival of new species, whereas the northern exposures will be the most resistant to changes.
The decrease in species number along the elevation gradient studied support the hypothesis that species richness decreases with altitude. This decrease reflects limited habitat diversity and harsh conditions due to environmental stress. Although the number of endemics follow the same pattern, their percentage contribution to the overall flora shows an increase which is in agreement with other studies for Lefka Ori. This confirms the hypothesis that such taxa are more susceptible to bioclimatic zone shifting and therefore extinction. Future changes will first affect local endemics of the massif’s highest alpine zone. These comprise in particular the populations of already endangered species such as Nepeta sphaciotica, Ranunculus radinotrichus and Alyssum sphacioticum. Nepeta sphaciotica in particular is confined to the northern slopes of Svourichti mountain in Central Lefka Ori at an altitude of 2200–2300 m. Although under a warming scenario it might face extinction since it occurs at a northern aspect, it might resist changes longer than other species on more susceptible exposures as temperature data for the area indicate. Other nonendemic species with a distribution restricted to the uppermost parts of the massif such as Peucedanum alpinum, Festuca sipylea, Arabis alpina will be equally affected.
5th NATIONAL COMMUNICATION TO THE UNFCCC 203
Species turnover in the study showed the highest values between 1664 and 1965 m a.s.l. This altitude overlaps more or less with the sub-alpine zone, which is the transition between montane - mediterranean and the alpine zone. This high turnover should be attributed to the loss of montane - mediterranean species and the gain of more alpine species, in combination with the relatively low species richness in these altitudes. Another possibility could be the patchy vegetation occurring generally in mountain areas. Therefore, in terms of climate change these middle zones (ecotones) are of great importance for identifying possible future boundary shifts and predicting the fate of species in the higher altitudes.
Finally, although changes in vegetation physiognomy are among the most common responses expected in Lefka Ori the geomorphology of the highest zones, which comprises mainly screes, has also a role to play. Plants occurring on rocks and screes are light-requiring species which would not be able to compete for resources under a dense growth. Most of these plants have developed various adaptive strategies in this hostile environment. Therefore, it is more likely that vegetation composition will change with species which are more thermophilous but at the same time able to adapt to life in screes.
6.2.6 Desertification
The potential desertification risk in Greece is estimated primarily by the National Committee for Combating Desertification. The Committee has published various national reports regarding the implementation of the United Nations Convention to Combat Desertification. According to the latest available information, the map of potential desertification risk can be found in Figure 6.19.
As it can be seen in the map, the main reasons for the desertification are soil erosion and salinisation. According to Yassoglou (Yassoglou N., 2000) the pressures that are associated to climate change and lead to soil desertification are drought, over-exploitation of land (including over-grazing) and water resources, irrational irrigational schemes, forest fires and land abandonment. On the other hand, salinization is also associated(though not uniquely) with climate change. In particular, some of the effects of climate change include soil salinization and also secondary salinization through irrigation and sea water level rises. In combination with the higher evapotranspiration rates, the lack of sufficient water resources and the increased irrigation that is generally experienced in the recent years, as it has been already mentioned, may force farmers to apply new irrigation schemes that will lead to secondary salinization of valuable lands. According to Yassoglou, this will have tremendous negative socioeconomic effects.
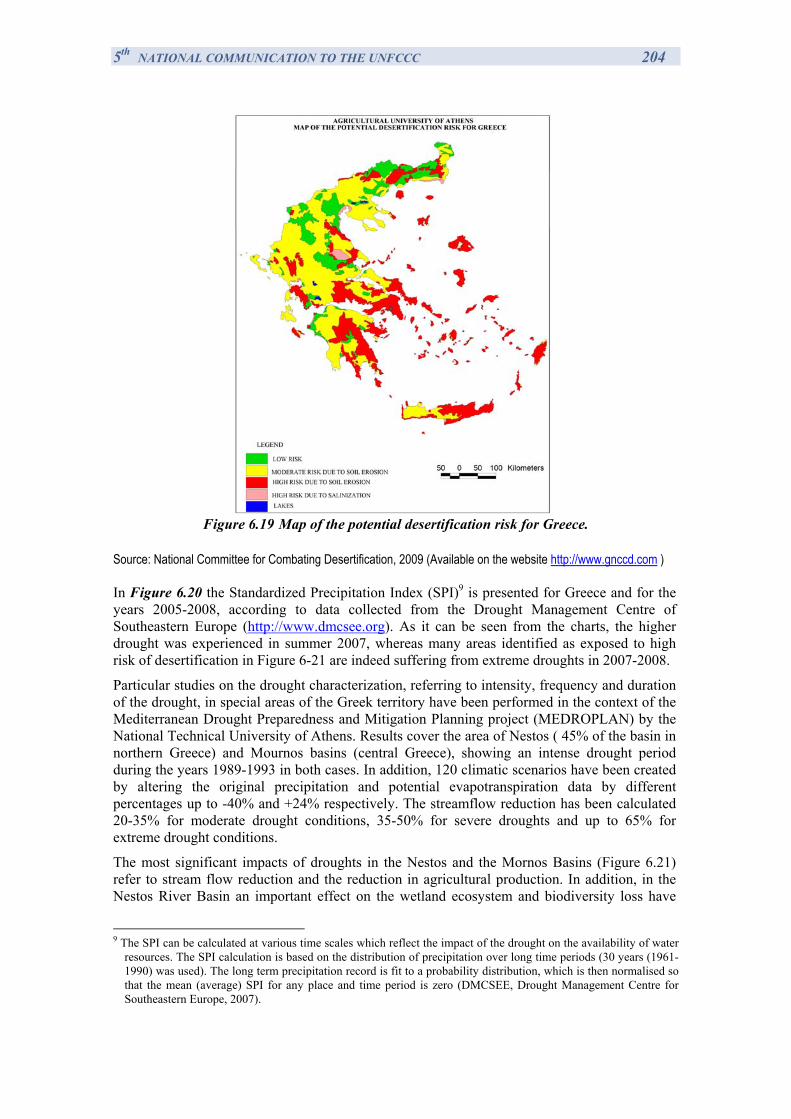
5th NATIONAL COMMUNICATION TO THE UNFCCC 204
Figure 6.19 Map of the potential desertification risk for Greece.
Source: National Committee for Combating Desertification, 2009 (Available on the website http://www.gnccd.com ) In Figure 6.20 the Standardized Precipitation Index (SPI)9 is presented for Greece and for the years 2005-2008, according to data collected from the Drought Management Centre of Southeastern Europe (http://www.dmcsee.org). As it can be seen from the charts, the higher drought was experienced in summer 2007, whereas many areas identified as exposed to high risk of desertification in Figure 6-21 are indeed suffering from extreme droughts in 2007-2008.
Particular studies on the drought characterization, referring to intensity, frequency and duration of the drought, in special areas of the Greek territory have been performed in the context of the Mediterranean Drought Preparedness and Mitigation Planning project (MEDROPLAN) by the National Technical University of Athens. Results cover the area of Nestos ( 45% of the basin in northern Greece) and Mournos basins (central Greece), showing an intense drought period during the years 1989-1993 in both cases. In addition, 120 climatic scenarios have been created by altering the original precipitation and potential evapotranspiration data by different percentages up to -40% and +24% respectively. The streamflow reduction has been calculated 20-35% for moderate drought conditions, 35-50% for severe droughts and up to 65% for extreme drought conditions.
The most significant impacts of droughts in the Nestos and the Mornos Basins (Figure 6.21) refer to stream flow reduction and the reduction in agricultural production. In addition, in the Nestos River Basin an important effect on the wetland ecosystem and biodiversity loss have
9 The SPI can be calculated at various time scales which reflect the impact of the drought on the availability of water
resources. The SPI calculation is based on the distribution of precipitation over long time periods (30 years (1961-1990) was used). The long term precipitation record is fit to a probability distribution, which is then normalised so that the mean (average) SPI for any place and time period is zero (DMCSEE, Drought Management Centre for Southeastern Europe, 2007).
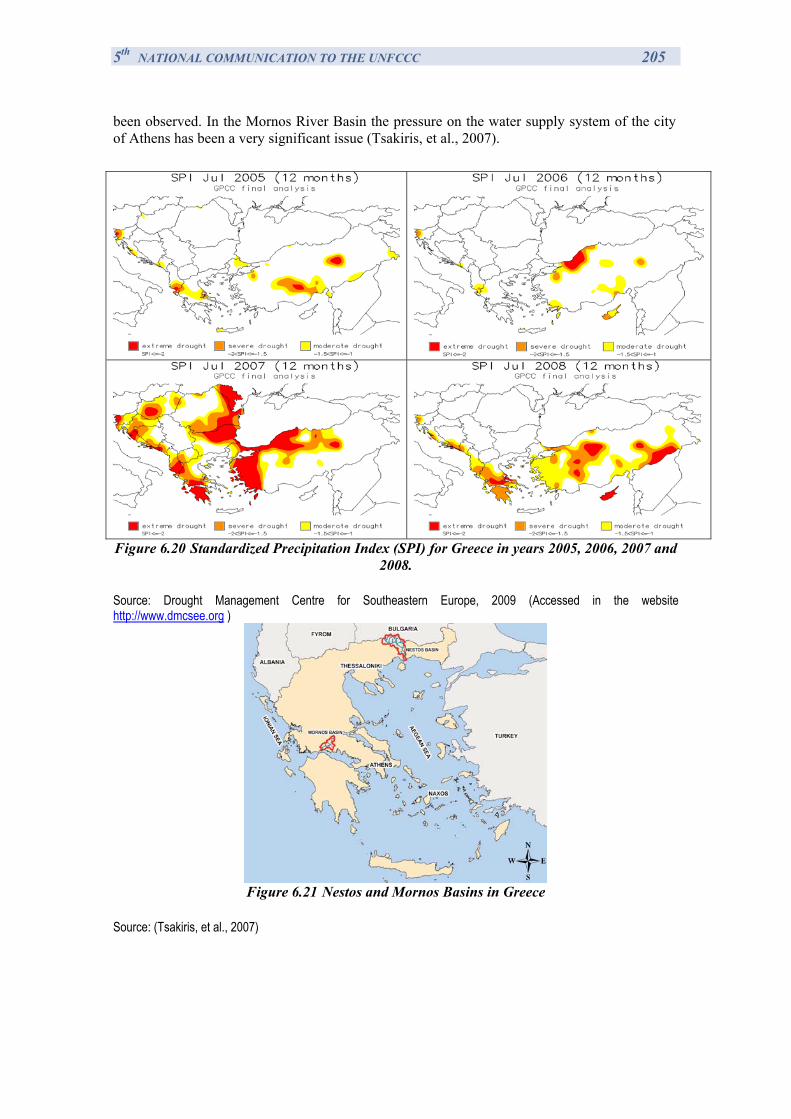
5th NATIONAL COMMUNICATION TO THE UNFCCC 205
been observed. In the Mornos River Basin the pressure on the water supply system of the city of Athens has been a very significant issue (Tsakiris, et al., 2007).
Figure 6.20 Standardized Precipitation Index (SPI) for Greece in years 2005, 2006, 2007 and
2008.
Source: Drought Management Centre for Southeastern Europe, 2009 (Accessed in the website http://www.dmcsee.org )
Figure 6.21 Nestos and Mornos Basins in Greece
Source: (Tsakiris, et al., 2007)
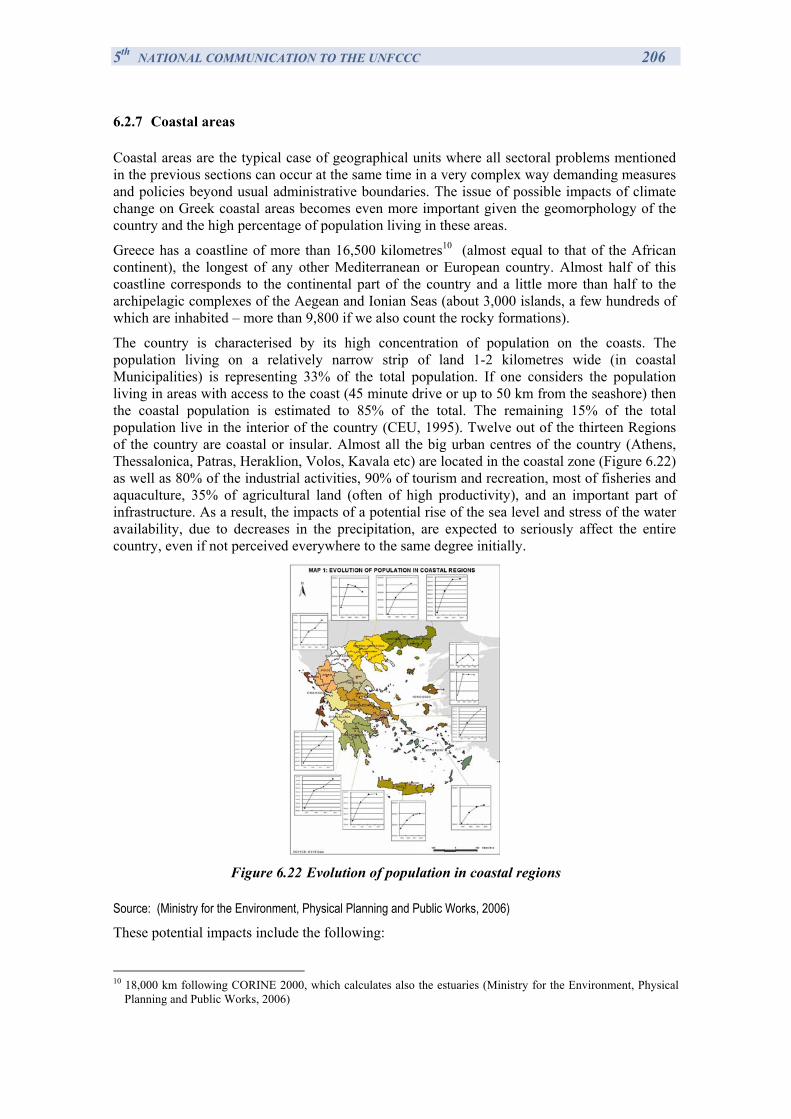
5th NATIONAL COMMUNICATION TO THE UNFCCC 206
6.2.7 Coastal areas
Coastal areas are the typical case of geographical units where all sectoral problems mentioned in the previous sections can occur at the same time in a very complex way demanding measures and policies beyond usual administrative boundaries. The issue of possible impacts of climate change on Greek coastal areas becomes even more important given the geomorphology of the country and the high percentage of population living in these areas.
Greece has a coastline of more than 16,500 kilometres10 (almost equal to that of the African continent), the longest of any other Mediterranean or European country. Almost half of this coastline corresponds to the continental part of the country and a little more than half to the archipelagic complexes of the Aegean and Ionian Seas (about 3,000 islands, a few hundreds of which are inhabited – more than 9,800 if we also count the rocky formations).
The country is characterised by its high concentration of population on the coasts. The population living on a relatively narrow strip of land 1-2 kilometres wide (in coastal Municipalities) is representing 33% of the total population. If one considers the population living in areas with access to the coast (45 minute drive or up to 50 km from the seashore) then the coastal population is estimated to 85% of the total. The remaining 15% of the total population live in the interior of the country (CEU, 1995). Twelve out of the thirteen Regions of the country are coastal or insular. Almost all the big urban centres of the country (Athens, Thessalonica, Patras, Heraklion, Volos, Kavala etc) are located in the coastal zone (Figure 6.22) as well as 80% of the industrial activities, 90% of tourism and recreation, most of fisheries and aquaculture, 35% of agricultural land (often of high productivity), and an important part of infrastructure. As a result, the impacts of a potential rise of the sea level and stress of the water availability, due to decreases in the precipitation, are expected to seriously affect the entire country, even if not perceived everywhere to the same degree initially.
Figure 6.22 Evolution of population in coastal regions
Source: (Ministry for the Environment, Physical Planning and Public Works, 2006)
These potential impacts include the following:
10 18,000 km following CORINE 2000, which calculates also the estuaries (Ministry for the Environment, Physical
Planning and Public Works, 2006)
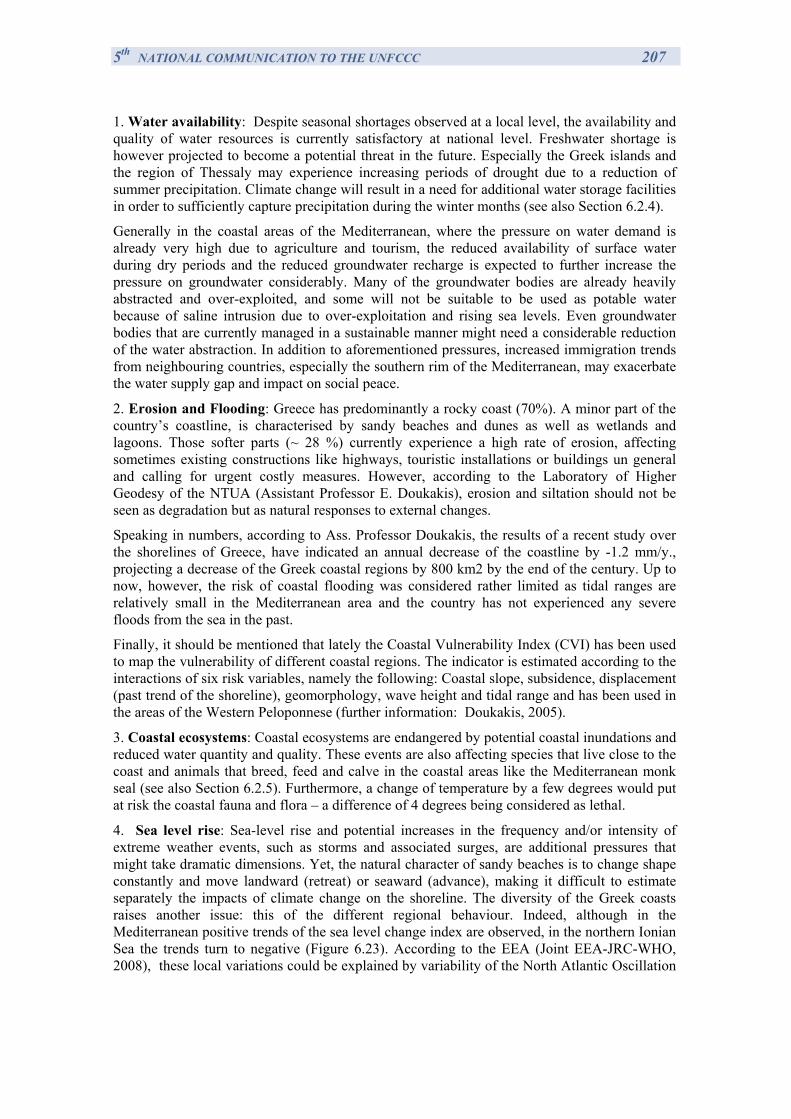
5th NATIONAL COMMUNICATION TO THE UNFCCC 207
1. Water availability: Despite seasonal shortages observed at a local level, the availability and quality of water resources is currently satisfactory at national level. Freshwater shortage is however projected to become a potential threat in the future. Especially the Greek islands and the region of Thessaly may experience increasing periods of drought due to a reduction of summer precipitation. Climate change will result in a need for additional water storage facilities in order to sufficiently capture precipitation during the winter months (see also Section 6.2.4).
Generally in the coastal areas of the Mediterranean, where the pressure on water demand is already very high due to agriculture and tourism, the reduced availability of surface water during dry periods and the reduced groundwater recharge is expected to further increase the pressure on groundwater considerably. Many of the groundwater bodies are already heavily abstracted and over-exploited, and some will not be suitable to be used as potable water because of saline intrusion due to over-exploitation and rising sea levels. Even groundwater bodies that are currently managed in a sustainable manner might need a considerable reduction of the water abstraction. In addition to aforementioned pressures, increased immigration trends from neighbouring countries, especially the southern rim of the Mediterranean, may exacerbate the water supply gap and impact on social peace.
2. Erosion and Flooding: Greece has predominantly a rocky coast (70%). A minor part of the country’s coastline, is characterised by sandy beaches and dunes as well as wetlands and lagoons. Those softer parts (~ 28 %) currently experience a high rate of erosion, affecting sometimes existing constructions like highways, touristic installations or buildings un general and calling for urgent costly measures. However, according to the Laboratory of Higher Geodesy of the NTUA (Assistant Professor E. Doukakis), erosion and siltation should not be seen as degradation but as natural responses to external changes.
Speaking in numbers, according to Ass. Professor Doukakis, the results of a recent study over the shorelines of Greece, have indicated an annual decrease of the coastline by -1.2 mm/y., projecting a decrease of the Greek coastal regions by 800 km2 by the end of the century. Up to now, however, the risk of coastal flooding was considered rather limited as tidal ranges are relatively small in the Mediterranean area and the country has not experienced any severe floods from the sea in the past.
Finally, it should be mentioned that lately the Coastal Vulnerability Index (CVI) has been used to map the vulnerability of different coastal regions. The indicator is estimated according to the interactions of six risk variables, namely the following: Coastal slope, subsidence, displacement (past trend of the shoreline), geomorphology, wave height and tidal range and has been used in the areas of the Western Peloponnese (further information: Doukakis, 2005).
3. Coastal ecosystems: Coastal ecosystems are endangered by potential coastal inundations and reduced water quantity and quality. These events are also affecting species that live close to the coast and animals that breed, feed and calve in the coastal areas like the Mediterranean monk seal (see also Section 6.2.5). Furthermore, a change of temperature by a few degrees would put at risk the coastal fauna and flora – a difference of 4 degrees being considered as lethal.
4. Sea level rise: Sea-level rise and potential increases in the frequency and/or intensity of extreme weather events, such as storms and associated surges, are additional pressures that might take dramatic dimensions. Yet, the natural character of sandy beaches is to change shape constantly and move landward (retreat) or seaward (advance), making it difficult to estimate separately the impacts of climate change on the shoreline. The diversity of the Greek coasts raises another issue: this of the different regional behaviour. Indeed, although in the Mediterranean positive trends of the sea level change index are observed, in the northern Ionian Sea the trends turn to negative (Figure 6.23). According to the EEA (Joint EEA-JRC-WHO, 2008), these local variations could be explained by variability of the North Atlantic Oscillation
5th NATIONAL COMMUNICATION TO THE UNFCCC 208
(NAO), inter-annual wind variability, changes in global ocean calculation circulation patterns, or specific local structures of the circulation.
Figure 6.23 Sea-level changes in Europe, October 1992 - May 2007
Source: (Joint EEA-JRC-WHO, 2008)
Depending on the range of sea level rise (0,5m to 2m), land loss is estimated to be about 0, 2% - 0, 4% of total area of Greece. The 90-93% of the above mentioned area consists of rivers delta and lagoons. Land use of lost areas varies among deltas and lagoons (41-47%), cropland (16-27%), grassland (6-9%) for all scenarios (0,5m, 1m, 2m sea level rise) (National Observatory of Athens, 2007).
6.3 Adaptation measures
In most of the cases, the adaptation measures that are currently under implementation in Greece are part of a broader network of measures that applies to the specific areas of identified vulnerabilities. However, the Ministry of Environment, Energy and Climate Change has suggested that, in the context of the National Strategic Reference Framework for the period 2007-2013, the following projects shall be implemented:
• Study of the vulnerability of the Greek coastal areas & proposals of appropriate adaptation policies and measures.
• Study of the impacts of climate change per geographical prefecture.
• Elaboration of a National Strategy for the Adaptation to Climate Change.
In particular, the elaboration of the national adaptation strategy is in line with the suggestion performed by the ERT in the centralized in-depth review of the 4th National Communication.
The Operational Programme “Environment – Sustainable Development” (former Ministry for the Environment, Physical Planning and Public Works, September 2007), that has already been approved by the European Commission in 2007, includes the following priority axis that are related to adaptation to climate change:
1. Protection of the Atmospheric Environment & Response to climate change – Renewable Energy Sources:
a. Energy savings in public and broadly public sector
5th NATIONAL COMMUNICATION TO THE UNFCCC 209
b. Encouragement and spreading of the RES use via exemplary projects
c. Promotion of the viable regional development based on the utilization of the regional energy potential
d. Reduction of the intensity of energy consumption in selected users that operate with high energy cost
2. Water resources management and protection:
This specific priority axis aims, among others and in combination with the Integrated Water Resources Management of the country, to ensure the provision of sufficient potable water in quantity and quality in selected urban centres and in regions that are projected to or already experience intense water scarcity. Specific aims that could be also considered as adaptation measures include:
a. Covering the needs for potable water in selected regions of the country that are famous touristic areas like Corfu, Chalkidiki, Cyclades and Dodekanese.
b. Response in drought situations of regions that face water resources scarcity (leakage reduction works in problematic water networks, desalination and distribution of potable water in islands that face water scarcity)
c. Reuse of urban wastewater for multiple uses, with priority in deficient regions.
d. Operational incorporation of the Directive 2000/60
3. Prevention and response to environmental danger:
a. Contribution to covering of the infrastructure needs and of flood-preventing works in large urban centres and in regions of the country that have frequently experienced floods in the last years (i.e. Attica, Thessaloniki).
b. Recovering of areas that have been degraded due to experiencing flooding events frequently.
c. Contribution to the confrontation of flooding events and of soil degradation that is caused in forest ecosystems which have experienced forest fires.
d. Improvement (decrease) of the time needed to approach and intervene in case of forest fires.
e. Improvement of the coordination between all the available and indispensable means for the prevention and response to environmental risk (provision of fire-preventive equipment and development of supportive studies).
f. Improvement of response of the population in emergencies in order to respond to the environmental risks and extreme weather events (reinforcement of civil protection infrastructures, development of systems for the timely management and notification of environmental risks, informative training in special civil units like students in schools or disabled citizens).
4. Protection of the natural environment and of Biodiversity:
Although the actions that are mentioned below do not refer explicitly to climate change, many of them apply also in case of species/areas that are endangered by climate change (or are expected to be so in the future).
5th NATIONAL COMMUNICATION TO THE UNFCCC 210
a. Protection and conservation of the endangered species, of flora, fauna and ecosystems in the entire country, as well as conservation of biodiversity in general.
b. Ensuring the monitoring of the conservation status of species and ecosystems.
c. Integrated management of the areas that are part of the NATURA 2000 network, and adoption of appropriate measures (preventive or curative) to ensure that degradation of natural ecological areas and species is prevented.
d. Reinforcement of the environmental awareness and public participation in actions related to the importance of biodiversity to its protection.
In line with this spirit, the General National Framework for Spatial Planning and Sustainable Development (National Gazette 128 A/3.7.2008) includes the following measures that could be considered as adaptive to climate change:
− Rapid promotion of the RES use
− Infrastructure for the promotion of natural gas use (esp. in the field of electricity production)
− Energy saving measures
− Forest fire prevention measures and reforestation measures
− Implementation of bioclimatic architecture
− Reinforcement of the natural regeneration mechanisms (forests, wetlands etc.) and of their biodiversity.
It should be also noted that some policy orientations going through the entire General Framework Spatial Plan could be considered as indirect adaptation measures. These orientations mainly refer to the following:
− The territorial organization of the very important infrastructure and energy service networks (Art. 6)
− The management of the national resources, the protection of the atmosphere and the prevention/response to natural disasters (Art. 10)
In addition to the above mentioned, one could refer to the following adaptation actions related to particular areas and sectors.
6.3.1 Coastal Zone Management
So far, no over-arching national plan or coastal defence policy exists in Greece. At operational level, measures are mainly undertaken on an ad-hoc basis.
Spatial Planning
Part of the strategy to cope with the consequences of climate change in coastal zones is already embedded in the law concerning the creation of new settlements or the expansion of existing ones. It provides for the following:
5th NATIONAL COMMUNICATION TO THE UNFCCC 211
• Avoid the expansion of existing settlements, especially along the coast; • Define boundaries of areas which could be built up; • Encourage expansion in the areas where population density permits it; • Protect beaches and natural coastal areas, assure public access. Additional useful provisions exist in the Specific Framework Spatial Plans that were published in the Government Gazette in the first semester of 2009 and refer to Tourism and Industry. The provisions of the Specific Framework Spatial Plan for Tourism include specific commitments for the coastal zones, in order to reduce potential impacts of climate change. Furthermore, in order to promote the management of coastal zones that are exposed to particular and complex pressures, including the climate change impacts, a Specific Framework Spatial Plan of Coastal Areas and Islands has been elaborated and presented to the public. This draft Specific Framework Spatial Plan reflects the principles of the EU Recommendation on ICZM, specifies and adapts the Mediterranean Protocol on ICZM to the national conditions and also includes an action programme for the next years. Active involvement of Greece in the HENCORA project of the EU has allowed – among other things – to create a network of experts and institutions active in the field.
Operational initiatives to protect against flooding and erosion
In general, protection measures against coastal erosion and flooding so far refer mostly to hard protection measures (mainly breakwaters). Certainly, measures are taken on an ad-hoc basis and are initiated by different authorities. The draft Specific Framework Spatial Plan of Coastal Areas includes an action programme that addresses the risk of flooding and erosion by proposing a “non-edificandi” set-back zone of 50 to 100 m (depending on the altitude), in which building will be prohibited.
6.3.2 Water resources
The changing conditions, the devastating forest fires of the summer of 2007 due to a prolonged drought, very high temperatures and arson as well as the increasing water scarcity incidents have made Greece more determined to ensure that policies and actions are more proactive. To this direction, apart from the Framework for Spatial Planning, that has been already mentioned, Water Scarcity and Drought Management Strategies are being implemented. Integrated Water Resources Management has been placed in the centre of priorities. In parallel, the uneven spatial and seasonal distribution of water resources in Greece is being addressed more effectively than in the past, aiming at adapting to prolonged droughts by elaborating and implementing Regional Strategies that are compatible with the EU Water Framework Directive,11 while the preparation of the implementation of the EU Marine Strategy Framework Directive is underway.
11 The Water Framework Directive establishes a legal framework to protect and restore clean water across Europe
and ensure its long-term and sustainable use. (Its official title is Directive 2000/60/EC of the European Parliament and of the Council of 23 October 2000 establishing a framework for Community action in the field of water policy.) The directive establishes an innovative approach for water management based on river basins, the natural geographical and hydrological units, and sets specific deadlines for Member States to achieve ambitious environmental objectives for aquatic ecosystems. The directive addresses inland surface waters, transitional and coastal waters and groundwater. Directive 2007/60/EC on the assessment and management of flood risks entered into force on 26 November 2007.
5th NATIONAL COMMUNICATION TO THE UNFCCC 212
Institutions and Legislation
One of the main problems Greece had to deal with first, is the lack of coordination within the water sector. To overcome the lack of coordination within the water sector, especially in the islands, the Central Water Agency has been established in 2006 in accordance with the European Water Framework Directive. This agency has been tasked to define a national water policy for Greece and to coordinate the activities of regional directorates. The steps taken to address this issue include the designation of the following authorities:
A new Central Water Agency was established within the Ministry of Environment in 2006, with responsibilities of definition and supervision of the national water policy; the Central Water Agency reports directly to the Environment minister (instead of the director-general of the ministry, as was the case previously), showing the importance that water management is receiving currently in the country.
The National Water Committee is a political body consisting of six ministers and responsible for setting water policy and overseeing implementation; the Committee meets once a year.
The National Water Council assists the Committee; it consists of 24 members, including representatives from political parties and Municipal Water Supply and Sewerage corporations.
At the regional level, Regional Water Directorates in each of Greece's 13 regions are responsible for the formulation and implementation of the basin plans. A Regional Water Council, consisting of about 30 members (stakeholders, NGOs), provides a consultative function in each region.
Greece updated its water management framework by adopting first a new water law (Law 3199/2003) in December 2003, and then the measures and procedures for integrated water resource management in 2007 (Presidential Decree 51/2007). The new legislation is based on the EU Water Framework Directive, with emphasis on:
ecological functions of water
river basin management approach
economic evaluation and full-cost pricing of water services.
As regards to national objectives Greece has not formulated separate national water goals, so the objectives are exclusively focussed on the implementation of the various EU water-related directives. The National Strategy for the Management of Water Resources aims, among others to the sustainable use of existing water reserves. Regional objectives will be set out in the 14 river basin management plans, to be finalised by the end of 2009 (as required by the WFD). Also, the pre-mentioned measures in the context of the Operational Programme for Environment and Sustainable Development 2007-2013, are considered as a main framework to address water management issues raised by different pressures, including climate change.
Operational initiatives to counteract water stress
During the period 1992-1994, Athens suffered from periods of intense drought. This has been an incentive for the national government to take actions in the field of freshwater supply.
Ever since, the national government has initiated awareness raising campaigns. With the aim of raising the storage capacity of the freshwater reservoirs, the MEECC also started with the
5th NATIONAL COMMUNICATION TO THE UNFCCC 213
construction of dams. In addition, a first pilot project on using recycled wastewater for irrigation purposes is currently on-going in Thessaly.
One of the most ambiguous projects aiming at the adaptation of water scarcity in the area of Thessaly is the Acheloos water transfer project. For the past 20 years, the Acheloos water transfer project has sparked long and lively debates, while maintaining support from the Parliament’s majority. The proponents of the scheme, many of them Thessaly farmers, have pointed to the more secure and regular yearly agricultural yields that would result from the project. They also claim that the project is needed to: i) supply water to towns in Thessaly and to mitigate the high water deficit of the plain; ii) save the river Pinios, which often dries up during summer; iii) halt saline intrusion, and protect and restore groundwater reserves; iv) minimize land subsidence due to groundwater depletion; and v) change farming practices. According to some studies (e.g. the 2006 water management study for the Pinios and the Acheloos river basins; the 2008 water management study for Epirus, Central Greece and Thessaly) the water transfer will not have any serious adverse effect neither on the Acheloos river’s ecosystem nor on the ability to meet water demand in the river basin and the Prefectures of Aetolia and Acarnania.
However, the opponents of the scheme, mainly national and international NGOs, have argued that the dams and reduced flows in the Acheloos will change the habitats of several endangered and internationally protected species irreversibly and that others will suffer serious disturbance both during and after the construction work. They also fear that the Ramsar site at Messolongi would suffer from a critical reduction in freshwater input, which would fundamentally alter its character. In addition, NGOs claim the scheme will have adverse socio-economic and cultural impacts, including the destruction of important monuments, such as the 11th century monastery of St George of Myrophyllo.
In March 2008, the Greek government released a national water management programme that renewed its commitment to the Acheloos project. The current plan for the Acheloos diversion project includes the construction of four major dams and reservoirs, a 17.4 km long diversion channel to Thessaly and two tunnels. The system is designed to take 600 million cubic metres of water (instead of 1 100 million cubic metres of the original project) annually from the Acheloos basin to the other side of the Pindos mountains. This volume is close to 11% of the mean annual yield of the Acheloos and enough to irrigate between 240 000 ha and 380 000 ha. On the Thessaly side, the design and construction of extensive infrastructure are required, including on the irrigation network. Works on some infrastructure are in progress, including the Gyrtoni barrage dam and the Smokovo pressure pipe irrigation network. As of end 2008, construction was still underway, as were the efforts to stop it.
Other adaptation measures include the pricing of municipal water services. Up to now, tariff structures typically include a progressive volumetric rate for different consumer categories, in addition to a fixed monthly standing charge that depends on the diameter of the pipe connecting the consumer to the network. Households pay a disproportionally high price compared to commercial users, which after 2010 will be in violation of the Water Framework Directive. Hence, Greece has established rational pricing policies for municipal water services, including incentives for water conservation. Progress is being made towards full cost recovery from household billing and on average amounts to about 60%. According to information received by the Central Water Agency of the MEECC, there is quite a variation among basins, with Attica and Thrace showing a cost recovery of 108% and 103%, respectively, whereas at the other end of the scale Thessaly and East Peloponnese only achieve 34% and 38%, respectively.
Finally, it should be also mentioned that Greece, as leader of the Mediterranean Component of the EU Water Initiative, has taken up various actions to assist the efforts of the Mediterranean countries in building adaptation measures. All the actions are described in Chapter 7, section 7.5.1.1 (Mediterranean Component of the EU’s Initiative ‘Water for Life’ (MED EUWI)).
5th NATIONAL COMMUNICATION TO THE UNFCCC 214
6.3.3 Agriculture & Forests
Responsibility for agricultural issues in Greece falls under the Hellenic Ministry of Rural Development and Food (MRDF) while there is a close cooperation / co-competency on several issues including biodiversity, water resources, GMOs, land-use planning etc with the Hellenic Ministry of Environment, Energy and Climate Change, as well as with other Ministries on other specific topics, e.g. with Ministry of Finance on financing policies, instruments and subsidies etc.
The National Strategic Plan of Rural Development 2007-2013 identifies the priorities of Greece for the period 2007-2013. The national strategy is implemented via the Program of Rural Development 2007-2013 “ Aleksandros Mpaltatzis” (Hellenic Ministry of Rural Development and Food, November 2007).
6.3.3.1 Priorities
According to information received by the Hellenic Ministry of Rural Development and Food, the following priorities have been set in order to adapt to climate change:
Agriculture
Study for the identification of the vulnerable areas and sectors and evaluation of the needs and potential for changing the crops as a response to climate change.
Co-evaluation of the adaptation and water management measures in the national strategies and rural development programs for the period 2007-2013.
Study over the means of incorporation of the adaptation in the 3 axis of rural development12 and the respective support, including the way in which the Common Agricultural Policy13 can contribute in the rational water use.
Examination of the potential of the system of agricultural advising provision in order to reinforce the knowledge regarding new technologies that facilitate adaptation.
Reinforcement of the adaptability of agricultural infrastructure: Agriculture, as any productive system, is dependable on fixed factors, like equipment, buildings and machineries, and infrastructures that can be hit by extreme weather events. The financial losses that may be caused by these events can become a serious source of anxiety to the sector, in a way that it is indispensable to continue the development of
12 Improvement of competitiveness – improvement of the environment and the countryside – improvement of life
quality in rural areas and diversification of agricultural economy. 13 The common agricultural policy is an area in which competence is shared between the European Union (EU) and
the Member States. Its aims are to ensure reasonable prices for Europe's consumers and fair incomes for farmers, in particular through the common organisation of agricultural markets and by ensuring compliance with the principles adopted at the Stresa Conference in 1958, namely single prices, financial solidarity and Community preference. The most recent reform, in June 2003, constituted a major development in the CAP. It brought the following innovations: (1) a single payment per holding for EU farmers, independent of production ("decoupling" of support); (2) linking of these payments to compliance with standards relating to the environment, food safety, animal and plant health and animal welfare ("cross-compliance"); (3) a reinforced rural development policy, with reduction of direct payments to large farms in order to fund the new policy ("modulation"); (4) a financial discipline mechanism (placing a ceiling on market support expenditure and direct aid between 2007 and 2013).
5th NATIONAL COMMUNICATION TO THE UNFCCC 215
provisional measures and means that are adapted to the regional characteristics in order to response to potential losses.
Reinforcement of the biodiversity, of the ecosystems and of water resources: As regards to ecosystems, the impacts of climate change in the management of the Natura 2000 Network shall be evaluated, in order to reassure the diversity of natural areas and the connections between them, and to be able to accomplish the emigration and survival of species under a different climate.
Forests
Operation of the System for the Protection of Forests from fires, apparition of harmful pests and sites of diseases that will have effects on forests and their production. It should be pointed out that the impacts of climate change, that join the already existing pressures of the Mediterranean forests, push the forest ecosystems to their limits.
Development of an information system regarding forests.
Additionally to the adaptation priorities, the Ministry is also considering that the following research areas are of major importance:
Research on the protection of livestock, using the introduction of species that are more tolerant to heat and the adjustment of its diet under stressed conditions due to high temperatures.
Research on the more effective use of water resources, by the means of reduction of losses, improvement of the irrigation techniques and recycling/storage of water.
Research on the adaptation of crops, by the means of the existing biological diversity and the new potential that biotechnology has to offer.
Research on the improvement of the soil management via the increase of water retention of the conservation of the soil moisture.
Research on the improvement of the systems of ventilation and cooling in the areas of animal accommodation.
It is very important to demand for sectoral solutions that shall be adjusted to the local and regional agricultural diversity, and that will be conducted by the public authorities in a way that the broader network of adaptation measures shall be coordinated, and inadequate adaptation measures shall be avoided.
All the above mentioned constitutes priorities of the Expert Management Service of the Program of Rural Development and of the Operational Programme of Sustainable Development.
6.3.3.2 Indicative actions regarding adaptation to climate change
All the selected actions of Action 1 (“Improvement of the prevention conditions for the fire protection of forests and of forest yields”), Measure 226 (“Restoration of forestry potential and preventive measures” ) of the Program of Rural Development are related to the prevention of forest fires and of natural disasters and that are related to climate change. Some selected actions include the following:
Studies regarding fire protection for prevention of forest fires
5th NATIONAL COMMUNICATION TO THE UNFCCC 216
Construction fire preventing forest roads in forests where the approach of fire extinguishing means is not possible due to lack of road system. Also, opening of dirt roads and pathways in order to improve the forestry road network of forest fire extinction.
Small technical works for the improvement and the repairing of accessibility of fire preventive roads, so that the fire extinguishing means can easily access the fire.
Construction of water supply centres (water tanks etc) and the indispensable works to improve the network of water provision for the refill of fire extinguishing means.
Cleaning of the flora that is close to the ground along forest roads and other regions of high risk.
Preventive forestry works, like forestry actions of moderation of the combustible material and diversification of its structure, rarefaction of bushy plantation and of small and old degraded tufts, aiming at the reduction of consequences in case of fire. Trimming and removal of a part of the flammable plantation are also included as measures that will prevent a fire to be transmitted by the tree summits and will reduce the rapidness of the fire transmission tree by tree.
Cultivating interventions in conifer forests in order to remove the flammable biomass.
Construction and improvement of the permanent forest fire surveillance systems (observatories, innovative systems of fire tracing and timely notification, supply of technical equipment).
Supply of instruments of communication.
In addition to these measures, actions have been undertaken to increase forest area, mainly by restoration of the fire hit areas. All these actions are part of the Action 3 (“Reforestation works – Mountainous flood preventing and corrosion preventive systems for restoration of burnt regions”), Measure 226 of the Program of Rural Development. Selectable actions include the following:
Reforestation studies for the restoration of burnt areas.
Restoration works (reforestations) of forestry potential that has experienced destruction during the fires.
Woodcutting, carriage and removal of burnt trees.
Horticultural works (reforestation, manufacture of soil gradient, etc) and planting along gradients mostly with hydrophile species (planes, poplars, alders, osiers)
Corrosion preventive works in small erosion gullies using wood, stone, cement dust, wire etc.
Works in watersheds, for the limitation of soil degradation and the restraint of water, construction of dikes for the confinement of rain waters etc.
Drainage works for the soil sliding
Works aiming at the prevention of decay and precipitation of soil and at the restraint of produced materials in the appropriate positions of the watershed.
A wide variety of technical works, like water damns, works for the watercourse formulation etc., are also implemented in order to mitigate the damage caused by the forest fires. The total
5th NATIONAL COMMUNICATION TO THE UNFCCC 217
area of the restoration works and the works aiming at the prevention from floods and from soil degradation in forests amounts to 180000 hectares. Also, in the context of the First Afforestation of Agricultural and Non Agricultural Soils, 36612 ha are to be afforestated in the period 2004-2012. Finally, in the Program of Rural Development 2007-2013, actions concerning the reduction of coppice forests to high forests and the increase, renewal, improvement, replacement and enhancement of the wood stock with the introduction of new species in degraded stands are also included.
6.3.4 Other areas of concern
In this paragraph, other sectors and the state of other adaptation measures that are being implemented, will be briefly described. The summary of impacts and adaptation measures is presented in Table 6.6.
Tourism
According to the Davos declaration the following actions are required:
• Reducing Greenhouse Gas Emissions (GHG) derived especially from transport and accommodation activities
• Adapting tourism businesses and destinations to changing climate conditions
• Applying existing and new technologies to improve energy efficiency
• Securing financial resources to help poor regions to achieve these objectives
Equally “The Roadmap for Recovery”, including both the “Global Green New Deal” and the “Seal the Deal Campaign”, as well as the “European Sustainable Development Strategy” which expresses these global processes at the European level, was developed to evaluate the ways in which tourism can contribute to sustainable development.
Individual tourism destinations need first of all to interpret and adapt these global processes in the context of their own localities. It seems fundamental that the tourism industry should implicate NTO’s, local authorities and international agencies – in joined initiatives to evaluate the implications of climate change.
Government policies on climate change cover all sectors of the economy and require cooperation between several public authorities.
The following measures promoted by the tourism sector are to be defined by the Ministry of Culture and Tourism and the Greek National Tourism Organisation in cooperation with other Ministries and national bodies:
• Strengthening the assessment of tourism investments and leading them to sustainable development in order to ensure the positive role of tourism on the other related economic sectors.
• Empowering legislative tools in cooperation with the Ministry of Environment, Energy and Climate Change regarding appropriate land use, coastal zoning and spatial management and aiming to deal with the climate change consequences.
5th NATIONAL COMMUNICATION TO THE UNFCCC 218
• Introducing fiscal incentives to encourage efficient energy use and/or renewable energy, water and waste management as well as the construction of “green buildings” for the tourism industry.
• Promoting dialogue in order to engage on the sustainability issue all stake holders of the tourism supply chain
• Activating the Tourism Satellite Account and the Observatory of Tourism for the enhancement of the economic and qualitative data of the tourism activity as a tool for the planning and the implementation of the relative policies.
Priorities of the Greek National Tourism Organization include:
• Adaption of an appropriate marketing strategy aiming at diversification through the development of new tourism product and distinctive destination brands
• Promotion of sustainable tourism (ecotourism, nature based tourism, rural tourism)
• Promotion of Green Destinations (i.e. the “European Destinations of Excellence”) and areas where alternative forms of tourism and sustainable management of the whole tourism supply chain are implemented.
• Motivation of entrepreneurs through awareness-raising and through incentives for applying certification and quality systems
• Encouragment of sustainable business practices, providing tools and guidance to the tourism industry and investors and new technologies to improve energy efficiency
• Encouragment of clusters, i.e. public-private networks and partnerships
The Organisation of Tourism Education and Training (OTEK) aims to enhance tourism companies’ staff awareness on the consequences of climate change and engage them in appropriate actions.
According to each destination’s characteristics specific measures can also be taken for:
a) Coastal and inland destinations
• Developing plans for water conservation techniques (i.e. rainwater storage, use of water-saving devices and waste water recycling)
• Raising awareness among tourists and residents and educating businesses and their staff in environmental issues.
• Promoting drainage and watershed management to reduce flood and erosion
• Enhancing siting, design and planning guidelines for tourism establishments in order to ensure the conservation of the coastal ecosystem and the quality of landscape
• Promoting alternative and more environmental-friendly forms of tourism
b) Nature-based and traditional settlements-based destinations
• Establishing monitoring survey programmes to assess changes on the ecosystem, the landscape and the human heritage
• Applying integrated tourism carrying capacity assessment techniques considering physical, economic, environmental and socio-cultural aspects
• Facing and removing external stresses, human interventions and overuse of sites that are likely to degrade the destination
5th NATIONAL COMMUNICATION TO THE UNFCCC 219
• Ensure local communities’ active participation in management processes
Biodiversity
Although Greece has a long-standing conservation policy (the legislation on nature conservation dates back to the 1930s, with the laws providing for protection of mainland national parks and forests), it was not until recently that special concern has been given to the impacts of climate change to biodiversity and to the adaptation potential/procedures of the latter. For the time being Greece continues to extend the protected areas network, holding a large variety of Mediterranean habitats included in the reference list of the Natura 2000 initiative (EU Bird Directive 79/409/EEC and Habitat Directive 92/43/EEC): from open sea, tidal areas and sea dunes, to several types of shrubs and grasslands and Mediterranean mountainous forests of coniferous. Since 1999, additional areas of 105000 hectares (ha) and 1075000 ha have been designated as Sites of Community Importance (SCI) and Special Protection Areas (SPA), respectively. As of 2008, the Greek list includes 239 SCIs and 163 SPAs. When overlapping is excluded, the Natura 2000 network covers 21% of the Greek land surface and 5.5% of the territorial waters. In the same time studies regarding bird habitats have been delivered and are currently being under evaluation in order to additionally designate 42 new areas as SPAs.
Greek legislation provides for protection of a large number of native flora and wildlife species (916 plants, 139 vertebrates and 82 invertebrates), and for strict controls over international trade of species. In the last decade, the number of species involved in protection projects considerably increased, including the grey wolf, the brown bear, the monk seal, and the loggerhead sea turtle, as well as several vascular plants. Major projects have been financed by the EU financial instrument LIFE-Nature and national funding sources (e.g. ETERPS Fund). Financial support has mostly been allocated to research institutes, development companies and NGOs.
Protected areas represent an instrument for species conservation: the National Marine Park of Alonissos contributes to the protection of the monk seal, and the National Marine Park of Zakynthos is the natural habitat of the rare and threatened loggerhead sea turtle; protected forests contribute to the protection of tree-nesting birds of prey (e.g. the black vulture). Outside protected areas, measures for species protection include regulation on the hunting period, a binding fishing code, access restrictions, limited user rights, and compensations for income loss.
Various are also the interactions between biodiversity protection and other sectors like Agriculture, Foresty and Fisheries. Especially in the Fisheries areas many of the affected from climate change species, like Posidonia oceanica14 and Mediterranean monk seal15 are being protected.
Last but not least, the National Biodiversity Strategy is currently being re-evaluated by the new Public Administration structure (mainly the Ministry of Environment, Energy and Climate Change) and based on the priorities of the new government. The existing text includes the objective of “Confrontation of and adaptation to climate change; reduction of negative impacts on biodiversity by taking actions against climate change.”. In the specific objective the suggested action axis are the following:
14 The Regulation 1967/2006 of the European Union introduces the prohibition of fishery with trawls etc. over sea
beds with sea vegetation, especially Posidonia Oceanica. 15 The Hellenic Society for the Study and Protection of the Monk Seal promoted a 2005-09 project (co-funded under
the EU LIFE-Nature programme) to draft and implement an action plan to mitigate the seal-fisheries conflict, with the active participation of fishermen. The project also aims at evaluating and revising the National Conservation Strategy for the Mediterranean Monk Seal.
5th NATIONAL COMMUNICATION TO THE UNFCCC 220
1. Protection of forest and of forested areas: restoration measures. 2. Increase, to the level possible, of the forested areas(afforestation/reforestation). 3. Conservation of the wetland and marine ecosystems at an acceptable level. 4. Assessment and augmentation of cohesion of the Natura 2000 site network. 5. Adoption of the appropriate measures to support the reconciliance of biodiversity to
climate change. 6. Limitation, to the level possible, of the impacts on biodiversity during the energy
production from Renewable sources. 7. Limitation, to the level possible, of the impacts on biodiversity during various
mitigation/adaptation actions through the environmental impact evaluation of projects, plans and programmes.
Floods
Floods are an important impact that is indirectly caused by climate change. In Greece the problem is quite severe, since the catastrophic forest fires (of 2007 and also the recent ones of summer 2009) have caused additional soil erosion. Various preventive adaptation measures have been planned and are currently implemented, as part of a wider flood-preventive policy as described in the previous sections.
In addition to the above, the General Secretariat of Civil Protection (http://www.gscp.gr) has issued in September 2009 a circular regarding the Civil Protection planning and actions for facing the risk of flooding events. Apart from the enumeration of adaptation measures that are currently implemented in the country, the obligations of several authorities before, during and after a flood in the whole of the Greek territory are explicitly defined in the circular. Also, the Civil Protection Secretaries of the Prefectures that are responsible for the public awareness in case of heavy precipitation and floods are also responsible for providing further advisory services to special groups of citizens, like stock farmers and peasants.
Desertification
As described in the 4th National Communication, the National Action Plan for Combating Desertification has been approved since 2001 through a Common Ministerial Decision (996005/31719). The implementation of the plan is co-ordinated by the National Committee to Combat Desertification. The Ministry of Rural Development and Food ensures secretarial and technical support to the committee, which brings together relevant ministries, universities and research institutes and NGOs to: formulate proposals for combating desertification; co-ordinate national, regional and local action plans; pursue co-operation with the EU and other international bodies on desertification programmes; promote research; and raise public awareness.
Since 2003, a wide array of desertification-specific projects have been carried out to better assess the extent and impacts of desertification within the country, estimate the effectiveness of policies and measures already undertaken, and propose new remedial and preventative steps. In addition, substantial levels of funding are being allocated to other projects that contribute to the anti-desertification fight, but which are not designated as desertification-related activities in the budgets of the implementing ministries and institutes. For example: EUR 650 million have been allocated by the Greek government for re-establishment of lands impacted by forest fires over the 2007-10 period; in 2006, expenditure to support early retirement of aged farmers and afforestation of agricultural land amounted to EUR 236 million and EUR 19 million, respectively (including contribution from the EU); over the period 2000-06, EUR 122 million were spent to support organic farming. Also, in the recent years, the Committee for Combating
5th NATIONAL COMMUNICATION TO THE UNFCCC 221
Desertification has oriented its actions to broadening the public awareness on the problem. To this end the Committee has created a website that contains all available information over the desertification issue in Greece (http://www.gnccd.com) and has organized a meeting on the 16th of June 2007 (World Day to Combat Desertification and Drought), from which very useful conclusions have been drawn. Greece has also been one of the founding members of the Drought Management Centre for South Eastern Europe (2007) while it has founded a focal point to ensure the implementation of the National Plan. Various projects have also been undertaken by Greek Universities and Institutes, such as the Xerochore project16, undertaken by the Environmental & Energy Management Research Unit of the National Technical University of Athens and the update of desertification maps that is being performed by the Agricultural University of Athens.
Table 6.6 Summary of information on vulnerability and adaptation to Climate Change Vulnerable Area Vulnerability / Adaptation Agriculture and food security Vulnerability: Shorter growing season; higher risk of heat stress
during flowering period; extreme events during developing period; higher risk of raining days during sowing days; higher rainfall intensity; longer dry spells. Adaptation: Program of Rural Development 2007-2013
Biodiversity and natural ecosystems
Vulnerability: Mainly decrease of species population and variety, invasion of alien species Adaptation: National Biodiversity Strategy (evaluation under the new governmental authorities); specific measures for touristic destinations
Coastal zones Vulnerability: Flooding and erosion; freshwater shortage; coastal ecosystems Adaptation: Specific Framework for Spatial Planning Plans in thefor Tourism sectorand for Coastal Areas; National Strategy for the Management of Water Resources; Societies for the protection of Species / National marine parks; specific measures for touristic destinations
Drought Vulnerability: Soil degradation, salinisation Adaptation: National Action Plan for Combating Desertification
Fisheries Vulnerability: Fluctuation of marine species population Adaptation: Binding fishing code
Forests Vulnerability: Forest fires, floods, losing of forest biodiversity Adaptation: Program of Rural Development 2007-2013, Circular of the General Secretariat of Civil protection regarding floods
Human health Vulnerability: Up to the moment mainly danger because of forest fires and floods, as well as air pollution aggravated in cases of extreme heat waves Adaptation: Circular of the General Secretariat of Civil protection regarding floods and air pollution, public awareness
Infrastructure and economy Vulnerability: NA, potential effect on tourism, loss of properties in cases of erosion, forest fires and floods Adaptation: NA
Water resources Vulnerability: Water quantity and quality Adaptation: National Strategy for the Management of Water Resources (regional objectives to be finalized by the end of 2009), National Biodiversity Strategy (under public consultation)
16 XEROCHORE is a Support Action aimed at assisting in the development of a European Drought Policy in
accordance with the EU-Water Framework Directive (EU-WFD). The Support Action is financed by the 7th Framework Programme (Grant Agreement Number: 211837) and spans a duration of 18 months (May 2008 - November 2009).
5th NATIONAL COMMUNICATION TO THE UNFCCC 222
CHAPTER 7. FINANCIAL RESOURCES AND TRANSFER OF TECHNOLOGY
7.1 Introduction
This chapter contains information related to measures taken by Greece to give effect to its commitments under Article 4, paragraph 3 (financial resources), paragraph 4 (assistance in meeting costs of adaptation), and paragraph 5 (transfer of technologies). Paragraphs 7.2 to 7.4 contain information related to:
A. Provision of “new and additional” financial resources.
B. Assistance to developing country Parties that are particularly vulnerable to climate change.
C. Provision of financial resources, including financial resources under Article 11 of the Kyoto Protocol.
while paragraph 7.5 contains information related to:
D. Activities related to transfer of technology.
E. Information under Article 10 of the Kyoto Protocol (related to transfer of technology issues).
Greece is committed, as both a UN and an EU Member State, to the global partnership to eradicate extreme poverty and contributes financially to the achievement of the Millennium Development Goals (MDGs). Through its bilateral and multilateral development cooperation, Greece provides financial resources to support national development initiatives and to address global developmental issues in the fields of sustainable development, health, environment, etc. A substantial part of Greece’s ODA is channelled directly to institutions and/or policies aiming to address environmental issues at the global or regional level, while environmental sustainability is a cross-cutting objective of the programmes, projects and policies financed.
Overall responsibility for development cooperation lies with the Ministry of Foreign Affairs, where the General Directorate for International Development Cooperation (Hellenic Aid /“YDAS”) coordinates programming, allocation and monitoring of development cooperation multilateral and bilateral funding.
Development cooperation funds are also channelled through other public bodies: the Ministry of Economy is responsible for Greece’s contributions to multilateral institutions, such as the Global Environmental Facility (GEF), the World Bank, the European Bank for Reconstruction and Development (EBRD), UNDP etc, while line Ministries are responsible for sectoral/thematic contributions to related United Nations Conventions and their Secretariats, i.e. the Hellenic Ministry of Environment, Energy and Climate Change (MEECC) is responsible for the allocation of annual official multilateral and multi-bilateral contributions to International Organisations, UN Convention Secretariats, Trust Funds and Agencies related to environmental issues.
7.2 ODA general trends
Greece’s net bilateral and multilateral Official Development Aid (ODA) disbursements have indicated increasing trends in absolute terms and, in 2008, also as a percentage of the GNI. Greece's current goal is to progressively increase its ODA/GNI ratio to 0.51% by 2012.
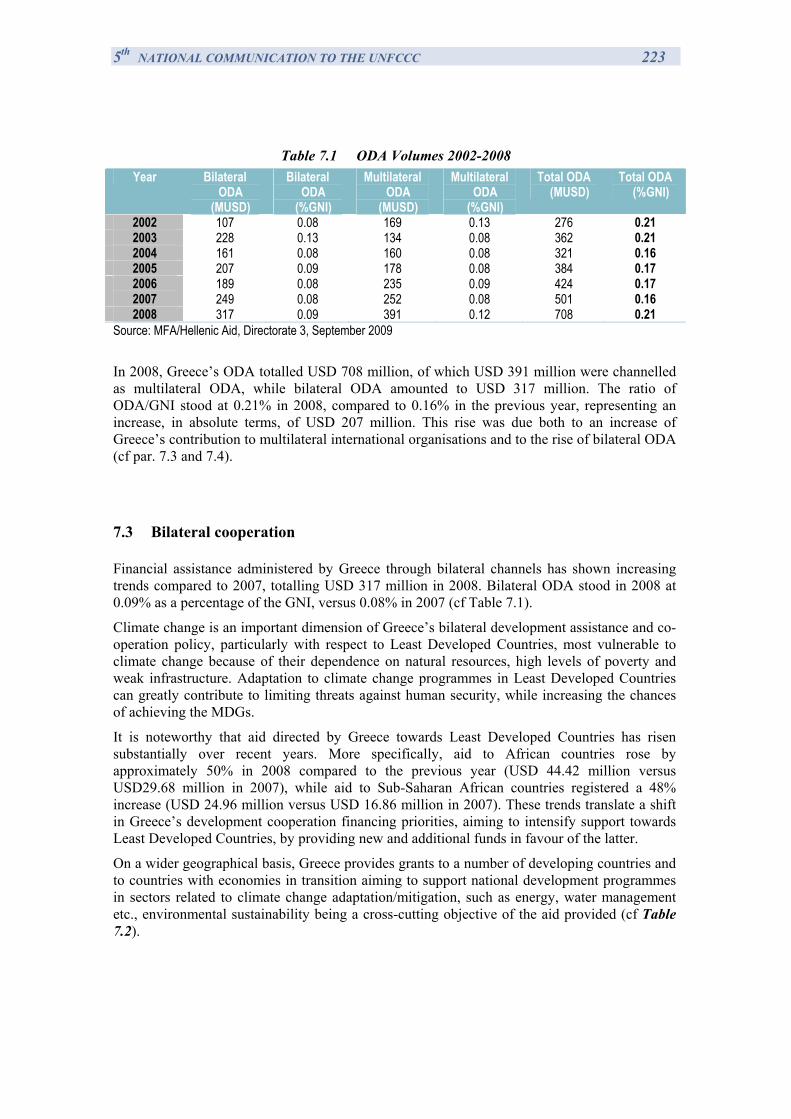
5th NATIONAL COMMUNICATION TO THE UNFCCC 223
Table 7.1 ODA Volumes 2002-2008 Year Bilateral
ODA (MUSD)
Bilateral ODA
(%GNI)
Multilateral ODA
(MUSD)
Multilateral ODA
(%GNI)
Total ODA (MUSD)
Total ODA (%GNI)
2002 107 0.08 169 0.13 276 0.21 2003 228 0.13 134 0.08 362 0.21 2004 161 0.08 160 0.08 321 0.16 2005 207 0.09 178 0.08 384 0.17 2006 189 0.08 235 0.09 424 0.17 2007 249 0.08 252 0.08 501 0.16 2008 317 0.09 391 0.12 708 0.21
Source: MFA/Hellenic Aid, Directorate 3, September 2009
In 2008, Greece’s ODA totalled USD 708 million, of which USD 391 million were channelled as multilateral ODA, while bilateral ODA amounted to USD 317 million. The ratio of ODA/GNI stood at 0.21% in 2008, compared to 0.16% in the previous year, representing an increase, in absolute terms, of USD 207 million. This rise was due both to an increase of Greece’s contribution to multilateral international organisations and to the rise of bilateral ODA (cf par. 7.3 and 7.4).
7.3 Bilateral cooperation
Financial assistance administered by Greece through bilateral channels has shown increasing trends compared to 2007, totalling USD 317 million in 2008. Bilateral ODA stood in 2008 at 0.09% as a percentage of the GNI, versus 0.08% in 2007 (cf Table 7.1).
Climate change is an important dimension of Greece’s bilateral development assistance and co-operation policy, particularly with respect to Least Developed Countries, most vulnerable to climate change because of their dependence on natural resources, high levels of poverty and weak infrastructure. Adaptation to climate change programmes in Least Developed Countries can greatly contribute to limiting threats against human security, while increasing the chances of achieving the MDGs.
It is noteworthy that aid directed by Greece towards Least Developed Countries has risen substantially over recent years. More specifically, aid to African countries rose by approximately 50% in 2008 compared to the previous year (USD 44.42 million versus USD29.68 million in 2007), while aid to Sub-Saharan African countries registered a 48% increase (USD 24.96 million versus USD 16.86 million in 2007). These trends translate a shift in Greece’s development cooperation financing priorities, aiming to intensify support towards Least Developed Countries, by providing new and additional funds in favour of the latter.
On a wider geographical basis, Greece provides grants to a number of developing countries and to countries with economies in transition aiming to support national development programmes in sectors related to climate change adaptation/mitigation, such as energy, water management etc., environmental sustainability being a cross-cutting objective of the aid provided (cf Table 7.2).
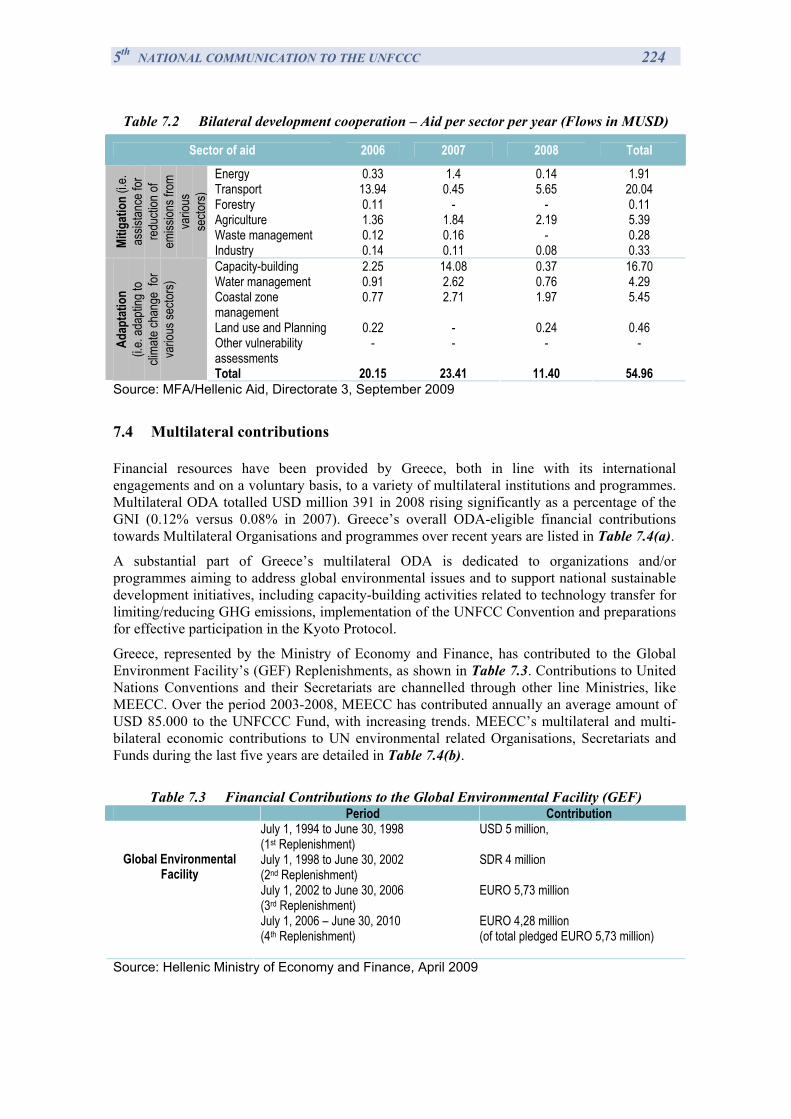
5th NATIONAL COMMUNICATION TO THE UNFCCC 224
Table 7.2 Bilateral development cooperation – Aid per sector per year (Flows in MUSD)
Sector of aid 2006 2007 2008 Total
Energy 0.33 1.4 0.14 1.91 Transport 13.94 0.45 5.65 20.04 Forestry 0.11 - - 0.11 Agriculture 1.36 1.84 2.19 5.39 Waste management 0.12 0.16 - 0.28 Mi
tigat
ion
(i.e.
assis
tance
for
redu
ction
of
emiss
ions f
rom
vario
us
secto
rs)
Industry 0.14 0.11 0.08 0.33 Capacity-building 2.25 14.08 0.37 16.70 Water management 0.91 2.62 0.76 4.29 Coastal zone management
0.77 2.71 1.97 5.45
Land use and Planning 0.22 - 0.24 0.46 Other vulnerability assessments
- - - - Adap
tatio
n
(i.e. a
dapti
ng to
cli
mate
chan
ge fo
r va
rious
secto
rs)
Total 20.15 23.41 11.40 54.96 Source: MFA/Hellenic Aid, Directorate 3, September 2009
7.4 Multilateral contributions
Financial resources have been provided by Greece, both in line with its international engagements and on a voluntary basis, to a variety of multilateral institutions and programmes. Multilateral ODA totalled USD million 391 in 2008 rising significantly as a percentage of the GNI (0.12% versus 0.08% in 2007). Greece’s overall ODA-eligible financial contributions towards Multilateral Organisations and programmes over recent years are listed in Table 7.4(a).
A substantial part of Greece’s multilateral ODA is dedicated to organizations and/or programmes aiming to address global environmental issues and to support national sustainable development initiatives, including capacity-building activities related to technology transfer for limiting/reducing GHG emissions, implementation of the UNFCC Convention and preparations for effective participation in the Kyoto Protocol.
Greece, represented by the Ministry of Economy and Finance, has contributed to the Global Environment Facility’s (GEF) Replenishments, as shown in Table 7.3. Contributions to United Nations Conventions and their Secretariats are channelled through other line Ministries, like MEECC. Over the period 2003-2008, MEECC has contributed annually an average amount of USD 85.000 to the UNFCCC Fund, with increasing trends. MEECC’s multilateral and multi-bilateral economic contributions to UN environmental related Organisations, Secretariats and Funds during the last five years are detailed in Table 7.4(b).
Table 7.3 Financial Contributions to the Global Environmental Facility (GEF)
Period Contribution July 1, 1994 to June 30, 1998 (1st Replenishment)
USD 5 million,
July 1, 1998 to June 30, 2002 (2nd Replenishment)
SDR 4 million
July 1, 2002 to June 30, 2006 (3rd Replenishment)
EURO 5,73 million
Global Environmental Facility
July 1, 2006 – June 30, 2010 (4th Replenishment)
EURO 4,28 million (of total pledged EURO 5,73 million)
Source: Hellenic Ministry of Economy and Finance, April 2009
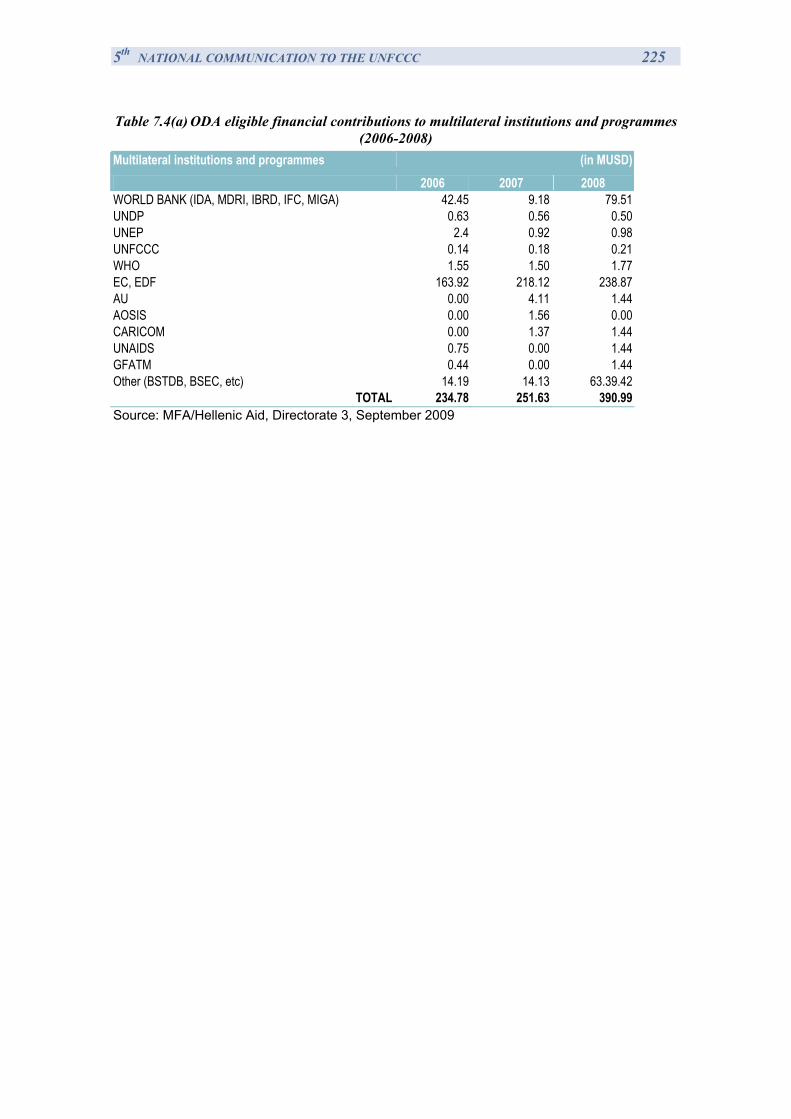
5th NATIONAL COMMUNICATION TO THE UNFCCC 225
Table 7.4(a) ODA eligible financial contributions to multilateral institutions and programmes (2006-2008)
Multilateral institutions and programmes (in MUSD) 2006 2007 2008
WORLD BANK (IDA, MDRI, IBRD, IFC, MIGA) 42.45 9.18 79.51 UNDP 0.63 0.56 0.50 UNEP 2.4 0.92 0.98 UNFCCC 0.14 0.18 0.21 WHO 1.55 1.50 1.77 EC, EDF 163.92 218.12 238.87 AU 0.00 4.11 1.44 AOSIS 0.00 1.56 0.00 CARICOM 0.00 1.37 1.44 UNAIDS 0.75 0.00 1.44 GFATM 0.44 0.00 1.44 Other (BSTDB, BSEC, etc) 14.19 14.13 63.39.42
TOTAL 234.78 251.63 390.99 Source: MFA/Hellenic Aid, Directorate 3, September 2009
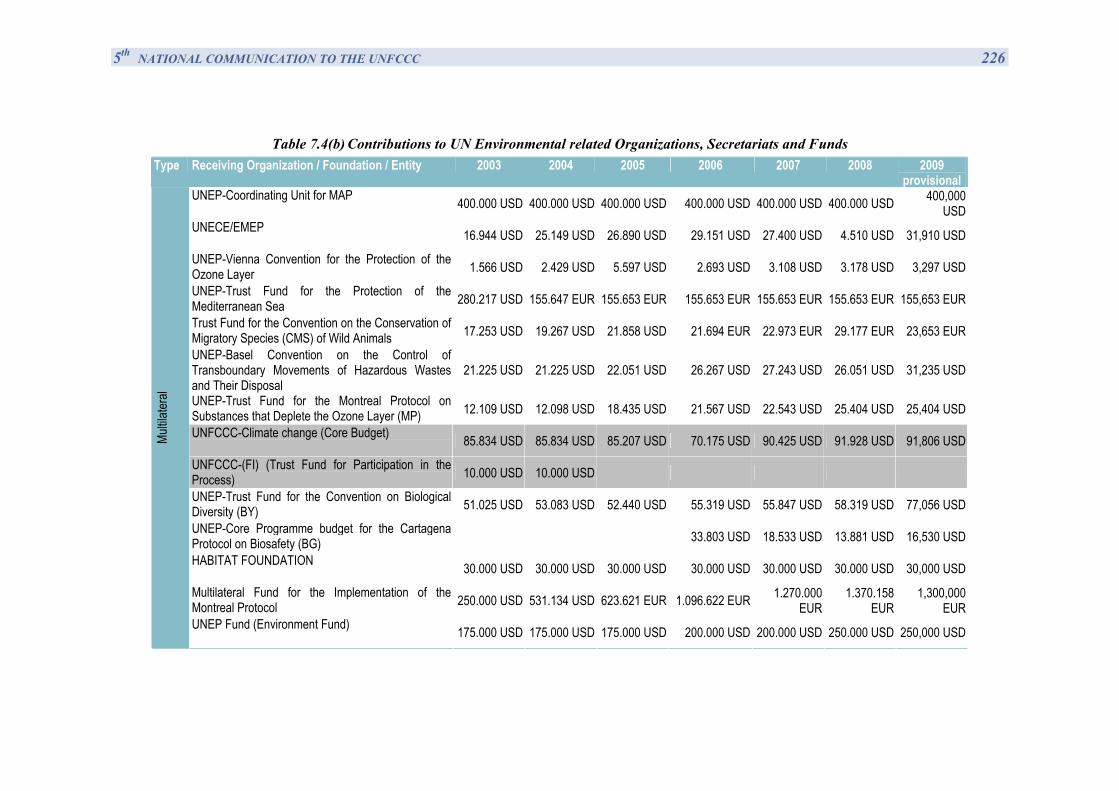
5th NATIONAL COMMUNICATION TO THE UNFCCC 226
Table 7.4(b) Contributions to UN Environmental related Organizations, Secretariats and Funds
Type Receiving Organization / Foundation / Entity 2003 2004 2005 2006 2007 2008 2009 provisional
UNEP-Coordinating Unit for MAP 400.000 USD 400.000 USD 400.000 USD 400.000 USD 400.000 USD 400.000 USD 400,000 USD
UNECE/EMEP 16.944 USD 25.149 USD 26.890 USD 29.151 USD 27.400 USD 4.510 USD 31,910 USD
UNEP-Vienna Convention for the Protection of the Οzone Layer 1.566 USD 2.429 USD 5.597 USD 2.693 USD 3.108 USD 3.178 USD 3,297 USD
UNEP-Trust Fund for the Protection of the Mediterranean Sea 280.217 USD 155.647 EUR 155.653 EUR 155.653 EUR 155.653 EUR 155.653 EUR 155,653 EUR
Trust Fund for the Convention on the Conservation of Migratory Species (CMS) of Wild Animals 17.253 USD 19.267 USD 21.858 USD 21.694 EUR 22.973 EUR 29.177 EUR 23,653 EUR
UNEP-Basel Convention on the Control of Transboundary Movements of Hazardous Wastes and Their Disposal
21.225 USD 21.225 USD 22.051 USD 26.267 USD 27.243 USD 26.051 USD 31,235 USD
UNEP-Trust Fund for the Montreal Protocol on Substances that Deplete the Ozone Layer (MP) 12.109 USD 12.098 USD 18.435 USD 21.567 USD 22.543 USD 25.404 USD 25,404 USD
UNFCCC-Climate change (Core Budget) 85.834 USD 85.834 USD 85.207 USD 70.175 USD 90.425 USD 91.928 USD 91,806 USD
UNFCCC-(FI) (Trust Fund for Participation in the Process) 10.000 USD 10.000 USD
UNEP-Trust Fund for the Convention on Biological Diversity (ΒΥ) 51.025 USD 53.083 USD 52.440 USD 55.319 USD 55.847 USD 58.319 USD 77,056 USD
UNEP-Core Programme budget for the Cartagena Protocol on Biosafety (BG) 33.803 USD 18.533 USD 13.881 USD 16,530 USD
HABITAT FOUNDATION 30.000 USD 30.000 USD 30.000 USD 30.000 USD 30.000 USD 30.000 USD 30,000 USD
Multilateral Fund for the Implementation of the Montreal Protocol 250.000 USD 531.134 USD 623.621 EUR 1.096.622 EUR 1.270.000
EUR 1.370.158
EUR 1,300,000
EUR
Multil
atera
l
UNEP Fund (Environment Fund) 175.000 USD 175.000 USD 175.000 USD 200.000 USD 200.000 USD 250.000 USD 250,000 USD
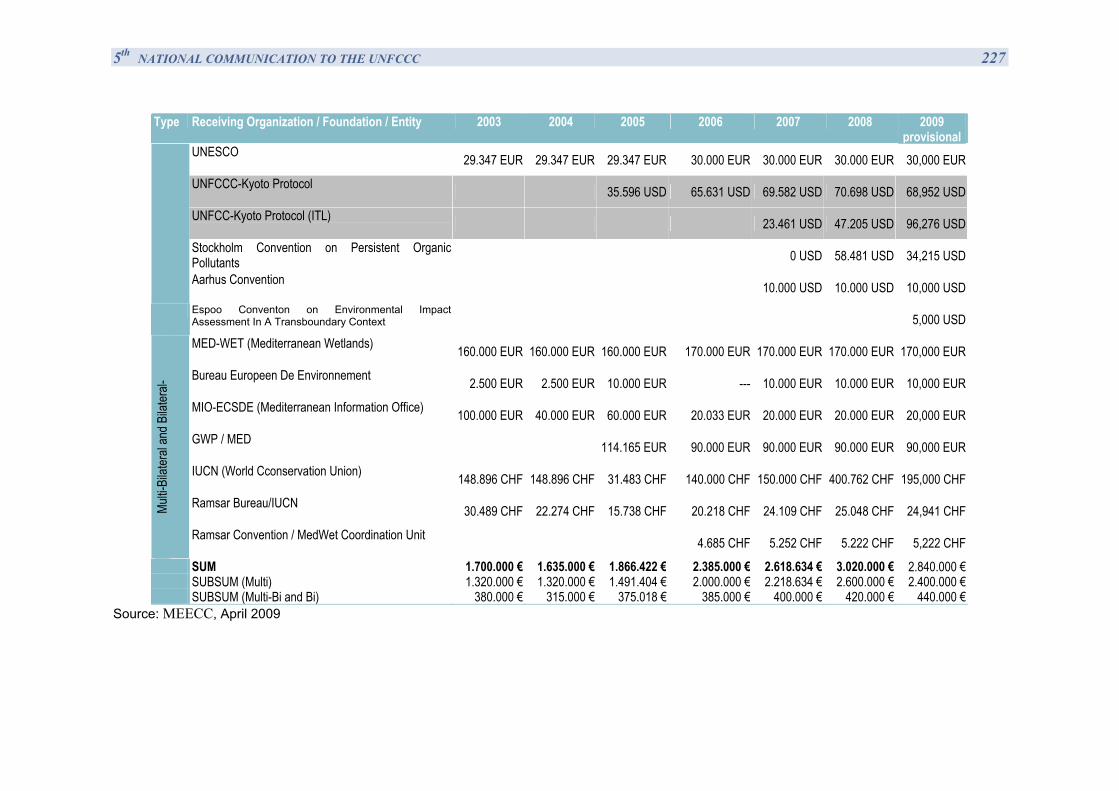
5th NATIONAL COMMUNICATION TO THE UNFCCC 227
Type Receiving Organization / Foundation / Entity 2003 2004 2005 2006 2007 2008 2009 provisional
UNESCO 29.347 EUR 29.347 EUR 29.347 EUR 30.000 EUR 30.000 EUR 30.000 EUR 30,000 EUR
UNFCCC-Kyoto Protocol 35.596 USD 65.631 USD 69.582 USD 70.698 USD 68,952 USD
UNFCC-Kyoto Protocol (ITL) 23.461 USD 47.205 USD 96,276 USD
Stockholm Convention on Persistent Organic Pollutants 0 USD 58.481 USD 34,215 USD
Aarhus Convention 10.000 USD 10.000 USD 10,000 USD
Espoo Conventon on Environmental Impact Assessment In A Transboundary Context 5,000 USD
MED-WET (Mediterranean Wetlands) 160.000 EUR 160.000 EUR 160.000 EUR 170.000 EUR 170.000 EUR 170.000 EUR 170,000 EUR
Bureau Europeen De Environnement 2.500 EUR 2.500 EUR 10.000 EUR --- 10.000 EUR 10.000 EUR 10,000 EUR
MIO-ECSDE (Mediterranean Information Office) 100.000 EUR 40.000 EUR 60.000 EUR 20.033 EUR 20.000 EUR 20.000 EUR 20,000 EUR
GWP / MED 114.165 EUR 90.000 EUR 90.000 EUR 90.000 EUR 90,000 EUR
ΙUCN (World Cconservation Union) 148.896 CHF 148.896 CHF 31.483 CHF 140.000 CHF 150.000 CHF 400.762 CHF 195,000 CHF
Ramsar Bureau/IUCN 30.489 CHF 22.274 CHF 15.738 CHF 20.218 CHF 24.109 CHF 25.048 CHF 24,941 CHF Multi-
Bilat
eral
and B
ilater
al-
Ramsar Convention / MedWet Coordination Unit 4.685 CHF 5.252 CHF 5.222 CHF 5,222 CHF
SUM 1.700.000 € 1.635.000 € 1.866.422 € 2.385.000 € 2.618.634 € 3.020.000 € 2.840.000 € SUBSUM (Multi) 1.320.000 € 1.320.000 € 1.491.404 € 2.000.000 € 2.218.634 € 2.600.000 € 2.400.000 € SUBSUM (Multi-Bi and Bi) 380.000 € 315.000 € 375.018 € 385.000 € 400.000 € 420.000 € 440.000 €
Source: MEECC, April 2009
5th NATIONAL COMMUNICATION TO THE UNFCCC 228
Through its multilateral ODA, Greece is currently intensifying its efforts on financing adaptation to climate change programmes in Least Developed Countries and in regions that, due to their geographical location, are most vulnerable to climate change (Sub Saharan Africa and Small Island Developing States). In order to ensure optimal use of funds and prioritization of funding needs in the threatened regions, programmes financed by Greece are to be demand driven and implemented in coordination with regional organizations of the beneficiary countries concerned. In line with the Aid Effectiveness Agenda requirements, emphasis is given to predictability of funding on a medium term basis (2-4 years) and to ownership and accountability on behalf of development partners:
Greece entered into a four year funding arrangement with the African Union (AU) (signed in New York, in September 2008) for climate change adaptation and mitigation programmes in African countries, proposed and implemented by the African Union, for a total amount of EUR 12 million to be disbursed on an annual basis. Financial contributions to the AU have started since 2007 [cf Table 7.4(a)].
Greece entered into a four year funding arrangement with the Caribbean Community Climate Change Centre (CARICOM CCC) (signed in New York, in September 2008) for climate change risk assessment, adaptation and mitigation programmes for a total amount of EUR 4 million to be disbursed on annual basis. Financial contributions to the CARICOM have started since 2007 [cf Table 7.4(a)].
A similar funding arrangement was signed in 2009 (New York, September 18) with the Indian Ocean Committee (IOC) with a total budget of EUR 4 million, to be disbursed annually, over four years.
Greece has agreed (New York, September 22) to contribute EUR 2 million in 2010-2011 to the World Meteorological Organisation (WMO) for a programme of improved climate information services for climate change adaptation in East and Central Africa.
An ad hoc contribution of MUSD 1.56 for programmes related to climate change adaptation/mitigation was also made to the Alliance Of Small Island States (AOSIS) in 2007 (cf Table 7.4).
All aforementioned funds represent new funding for climate change adaptation/mitigation programmes in favour of developing countries, which has been made available by Greece since 2007. Financing of these programmes does not imply a diversion of funds in Greece’s ODA budget, since the total volume of the latter has registered an increase in 2008, both in absolute terms and as a percentage of the GNI (cf Table 7.1).
Finally, in the follow up of the World Summit on Sustainable Development (WSSD) Type II initiatives and the Johannesburg Plan of Implementation, Greece leads, funds, coordinates and participates in the assessment of climate change impacts in African countries. This Type II initiative promoted by Greece (with a start up budget by MEECC of EUR 125.000) and implemented by the National Observatory of Athens (N.O.A), aims to contribute to the implementation of the UNFCCC in Africa. In addition, Greece has granted the amount of EUR 160.000 to three more Type II initiatives related to integrated water resources management and capacity building, in the Mediterranean, thus contributing to adaptation efforts of partner countries.
5th NATIONAL COMMUNICATION TO THE UNFCCC 229
7.5 Environmental cooperation and transfer of technology:
7.5.1 Multilateral/Regional cooperation:
7.5.1.1 Mediterranean Component of the EU’s Initiative ‘Water for Life’ (MED EUWI)
In the follow up of the World Summit for Sustainable Development (WSSD), the Greek Government (Hellenic Ministry of Environment, Energy and Climate Change – MoE - and Hellenic Ministry of Foreign Affairs – MoFA), supported by the ‘Global Water Partnership-Mediterranean’ (GWP-Med’) Secretariat, has undertaken responsibility of leading the Mediterranean Component of the EU’s Initiative ‘Water for Life’ (MED EUWI), launched in Johannesburg, in 2002.
The MED EUWI represents a strategic partnership among all related stakeholders in the Mediterranean region, aiming at contributing to the implementation of the water-related MDGs and WSSD targets in the region, complementing at the same time all other relevant regional on-going processes and initiatives. In this regard, it aims to assist national efforts and strategies of the Mediterranean partner countries (N.Africa, East Mediterranean, SE Europe) to achieve their commitments under the Millennium Development Goals (MDGs) and Johannesburg targets on water supply and sanitation (WSS) and on integrated water resources management (IWRM) by 2015.
The MED EUWI is an open ended partnership, open to all actors in the region sharing the same visions and goals and wishing to practically and actively contribute to the achievement of the water related MDG and WSSD targets in the Mediterranean, a unique but also vulnerable area both from an environmental and a political point of view. Cooperation between countries, within the MED EUWI, can thus significantly contribute to poverty eradication, enhancement of livelihoods and sustainable economic development, providing a catalyst for peace and security in the region.
Its main aim is to assist the design of better, demand-driven and output-oriented water programmes in the region, and to facilitate the effective coordination of water programmes and projects, targeting more effective use of existing funds, through identification of gaps.
In this respect, synergies and complementarity are systematically sought and ensured between MED EUWI and any other related new Initiatives that are launched in the Mediterranean; To this end, MED EUWI represents the ‘water pillar’ of the new Initiative launched by the European Commission in 2005 to “De-pollute the Mediterranean by 2020 – Horizon 2020” which represents, consequently, an instrument for the EU to identify funding priorities in the Mediterranean countries for the period 2007-2013. Moreover, coordination and cooperation is also ensured with the new GEF Strategic Partnership for the Mediterranean (2007-2012).
So far, the MED EUWI has managed to receive a very wide acceptance as it is acknowledged by all Mediterranean partners as a key “platform” in the region aiming to meet the international commitments on water ensuring at the same time aid effectiveness.
The means to achieve its targets mainly rely on the achievement of effective “donor coordination” at country level. In this regard, a strategic process entitled “Country Dialogues” was initiated in late 2005 with Lebanon. This process constitutes a multi-stakeholder one, led by the countries themselves and aiming to assist formulation of national Roadmaps for meeting the MDG and WSSD water targets, as well as defining and prioritizing the interventions required and the funding needed. In this process, Greece and the EU Commission are in close collaboration with OECD’s EAP Task Force. In this respect, the implementation of MED EUWI and in particular the “Country Dialogues” are directly linked to the implementation to
5th NATIONAL COMMUNICATION TO THE UNFCCC 230
the Decisions of the Joint OECD EPOC/DAC Ministerial Meeting of April 2006 (i.e. the adopted ‘Framework for Common Action Around Shared Goals’). In particular, the Country Dialogue of Egypt initiated in November 2006, is also referenced as one of the key elements included in the Protocol on economic and technical cooperation between the Arab Republic of Egypt and the Hellenic Republic, singed at Ministerial level in June 2006.
In terms of funding, MEECC supports the MED EUWI with a core annual budget reaching approximately 100.000 € το cover “horizontal” activities. In 2006, a co-funding by the EU Commission (EuropeAid Cooperation Office) was activated to financially support selected MED EUWI activities, for 2 years (2006-2008), with the amount of approximately 1,070 million €. Moreover, the MED EUWI has managed to mobilize and coordinate considerable additional funding for the region. Key contributors in the process include, apart from the EC, bilateral EU ODA, the World Bank, the GEF, Development Banks, UNEP UCC etc.
In the context of the MED EUWI, increasing emphasis is being given to assisting the efforts of Mediterranean countries to build their adaptation capacities to the changing climate conditions in the Region. More specifically, Greece/MEECC, through the MED EUWI, has:
- Prepared a Position Paper on “Climate Change Adaptation and Integrated Water Resources Management in the Mediterranean” in December 2007 that has been widely distributed and discussed among Med partners aiming to provide a background of the current condition regarding impacts of climate change in the Mediterranean with emphasis on water resources, to assist Med countries with a systematic framework for developing national adaptation strategies linked with national IWRM plans as well as to promote a harmonised regional approach to address adaptation to climate change, under the MED EUWI umbrella.
- Organised, together with the European Commission, the Mediterranean Action Plan/United Nations Environment Programme, the Global Water Partnership – Mediterranean (GWP-Med) and the Mediterranean Information Office for Environment, Culture and Sustainable Development (MIO-ECSDE), a Side-Event on “Addressing Climate Change Adaptation Challenges in the Mediterranean” during the 16th Session of the UN Commission for Sustainable Development. The Side-Event, that was attended by more than 40 participants, aimed at addressing issues pertaining to the specificities of the Mediterranean which, already a water-scarce region, is expected to face even more challenges with regard to its water resources in the near future due to the looming climate crisis (e.g. increasing frequency and severity of droughts, floods and other extreme weather conditions that lead to increased water supply-demand gap, desertification, infrastructure damage, loss of land due to landslides, saltwater intrusion due to sea-level rise, health issues, etc.), jeopardising the region’s overall well-being.
- Organised, in the context of MED EUWI, an International Workshop on “Water and Climate Change in Southeastern Europe: Understanding Impacts & Planning for Adaptation” in June 2008, in Tirana, Albania, targeting SE European Countries.
- Submitted a project proposal in the context of the “Barcelona Process: Union for the Mediterranean” that was launched at the Paris Summit on 14 July 2008, that aims to support a “Multistakeholder Cooperation for the promotion of Sustainable Development in the Mediterranean with emphasis on water”. This project proposal focuses, inter alia, on assisting, in practical terms, Mediterranean countries to build greater resilience of their water resources to climate change impacts.
- Prepared a detailed Technical Background paper on “Climate Change Adaptation and Integrated Water Resources Management in the Mediterranean” that was presented to and discussed with Water Directors of Euro-Mediterranean countries during their Meeting organised by Greece/MED EUWI in Athens in July 2009. Consequently this Technical paper was presented and adopted by Euro-Mediterranean Water Ministers at their Ministerial Conference on Water, in Jordan (Dead Sea), in 22 December 2008. This Ministerial Euro-
5th NATIONAL COMMUNICATION TO THE UNFCCC 231
Mediterranean Conference on Water decided to elaborate a “Mediterranean Strategy on Water” to be adopted by the next Conference to take place in Barcelona, 12-14 April 2010. Following up to this decision, it was agreed by the first Meeting of the “Water Expert Group” (Athens, 7-8.9.09) that MED EUWI will provide the technical support for the elaboration of the Strategy’s text that will focus on four themes, i.e. water governance, water demand management, financing and adaptation of water resources to climate change.
- Actively participated, during the 5th World Water Forum in Istanbul (16-22.3.09) at the Ministerial Roundtables on “Water and Climate” and “Integrated Management of Coastal Strips in relation with IWRM” where it made several practical proposals for achieving adaptation to climate change by operationally linking integrated water resources management with national adaptation strategies using as a catalyst education, public awareness and changes in consumption patterns.
- Aiming to additionally contribute to the elaboration of the above mentioned Strategy for Water in the Mediterranean as well as to produce a “Mediterranean Statement” that will be fed and submitted to the UNFCCC COP15 in Copenhagen, December 2009, Greece/MED EUWI technically assists the organisation of the Joint Egyptian-Dutch Water Conference entitled “Towards the new Long Term Strategy for Water in the Mediterranean”, that will be held 2-3 November 2009, in Cairo, Egypt. The Conference, inter alia, will address the four themes of the Strategy, i.e. short water governance, water and climate change, water financing, and water demand management.
7.5.1.2 Regional cooperation on environmental protection within the Black Sea Economic Cooperation (BSEC) Organisation
On the regional level, Greece, as a member of the Black Sea Economic Cooperation Organization (BSEC), is actively engaged in efforts made by BSEC member states in order to promote cooperation and exchange of best practises for the protection of the Black Sea marine and coastal environment. To this end, BSEC Member States have elaborated a general cooperation framework, the BSEC Action Plan for Cooperation in the Field of Environmental Protection, the main directions of which include:
Harmonizing environmental legislation among the BSEC Member States, based on best practices and transfer of technology and taking into account the EU relevant legislative framework;
Strengthening cooperation in the Black Sea basin in the fields of pollution prevention and biodiversity conservation, with particular attention to the areas not covered by the Bucharest Convention;
Promoting the use of economic incentives and tools in the field of environmental protection, in order to leverage funding for projects of mutual interest;
Promoting the development of innovative, environmentally friendly and resource saving technologies;
Environmental Cooperation between BSEC member states is promoted through high level meetings but also through the nomination of national focal points with the participation of experts on environmental protection, as well as investment programmes directed at the preservation of the region’s environment and the development of green technologies. Cooperation also aims at intensifying control of the transboundary spreading of dangerous substances in the environment of the Black Sea region and at providing state-of-the-art mechanisms for integrated management of river ecosystems in the BSEC region. In this respect,
5th NATIONAL COMMUNICATION TO THE UNFCCC 232
joint scientific-technical research programmes and projects, exchange of officials, experts, researchers and members of the civil society, as well as training programmes, meetings, conferences and symposia are regularly organised.
On the international level, the BSEC Working Group on Environmental Protection cooperates with international organisations such as UNEP and International Maritime Organization (IMO), as well as with the European Commission’s General Directorate Environment (i.e., in relation to the EU Water Initiative). The BSEC Working Group on Environment also closely follows regional environmental initiatives, supporting the activities of the International Commission for the Protection of the Danube River (ICPDR) and of the Commission on the Protection of the Black Sea against Pollution (the Black Sea Commission-BSC), in implementing the Bucharest Convention (1992) requirements on the protection of the Black Sea environment.
Programmes and projects currently implemented in the field of environmental protection within the BSEC include:
The BSEC Information Exchange System on Environmental Protection (since April 2007). The issue remains on the agenda of the Working Group on Environmental Protection and the system is soon expected to be operational.
A working paper on Possible Means of Strengthening Cooperation between the BSEC and other International Organizations on Issues related to the Protection and Rehabilitation of the Black Sea Marine Environment, elaborated by the International Centre for Black Sea Studies (ICBSS)
A number of projects approved by the BSEC Working Group on Environmental Protection, which have been funded by the BSEC Project Development Fund, including:
“Improvement of the scientific background for assuring sustainable development in the Black Sea coastal zone – pre-feasibility study”;
“Revitalization of urban ecosystems through vascular plants: assessment of technogenic pollution impact – Garden City”;
“Study of the capabilities and requirements of the operational monitoring of air pollution levels
Financing projects in the fields of RES and environmental protection through the BSEC
Hellenic Development Fund (BSEC-HDF):
In addition to the aforementioned initiatives undertaken by the BSEC, Greece will be financing RES and EE projects and projects in the field of environmental protection through the BSEC Hellenic Development Fund (BSEC-HDF).
The BSEC-HDF is a special fund, established in April 2008, as a voluntary contribution from the Hellenic Republic. The BSEC-HDF will be endowed with an initial amount of 2.000.000 Euros for a period of four years, as of 2008. The Fund aims at supporting BSEC efforts to strengthen regional cooperation among its member states and enhance its project-oriented approach, targeting the following specific key areas: transport, renewable energy sources (RES), environmental protection, business cooperation and trade facilitation, tourism and culture. Grant financing provided by the BSEC-HDF will be considered as BSEC grants.
The first call for proposals of the BSEC-HDF, to be launched before end 2009, will be exclusively focused in the area of RES and EE. Proposals eligible to be funded by the BSEC-
5th NATIONAL COMMUNICATION TO THE UNFCCC 233
HDF could include small scale infrastructure projects, networks and capacity building initiatives that promote innovation and regional cooperation in the specific area.
7.5.2 Bilateral cooperation
Hellenic Aid finances projects in a number of developing countries, aiming to facilitate the access to, or transfer of environmentally sound technologies and to promote the use of RES in developing countries as well as in countries with economies in transition. A number of such on-going projects are listed, on an indicative basis, in Table 7.5.
Table 7.5 Description of selected projects or programmes that promoted practicable steps to facilitate and/or finance the transfer of, or access to, environmentally-sound technologies
Project title: “SYN-ENERGY” Recipient countries: Albania, Bosnia-Herzegovina, Croatia, FYROM, Moldavia, Montenegro, Serbia, Georgia,
Ukraine Total funding: Hellenic Aid: 4.000.000 €/ USAID: 4.000.000€ Implementation: Hellenic Center for Renewable Energy Sources (CRES) / International Resources Group/Alliance
to Save Energy (IRG/ASE) Project description:
Regional assessment of RES
E.E. in residential and public buildings
Strategic planning for RES and E.E.
Capacity building and institutional network development Technology transferred: EE and solar equipment, transfer of knowhow in RES and EE
Project title: Applications of Renewable Energy and Energy Saving methods Recipient Country: Lebanon Total funding: 700.000 € Implementation: Hellenic Center for Renewable Energy Sources (CRES) Project description: • Promotion of the use of RES in households, decrease of energy consumption, protection of the
environment and strengthening of the national/local economy. • Enhancement of business and scientific co-operation between Greece and Lebanon in the sector of RES
Technologies. Technology transferred: Solar systems and energy saving lighting equipment for household use in affected regions
of South Lebanon, supply and installation of testing and measurement equipment for solar collectors, aiming at the creation of a permanent centre for solar testing.
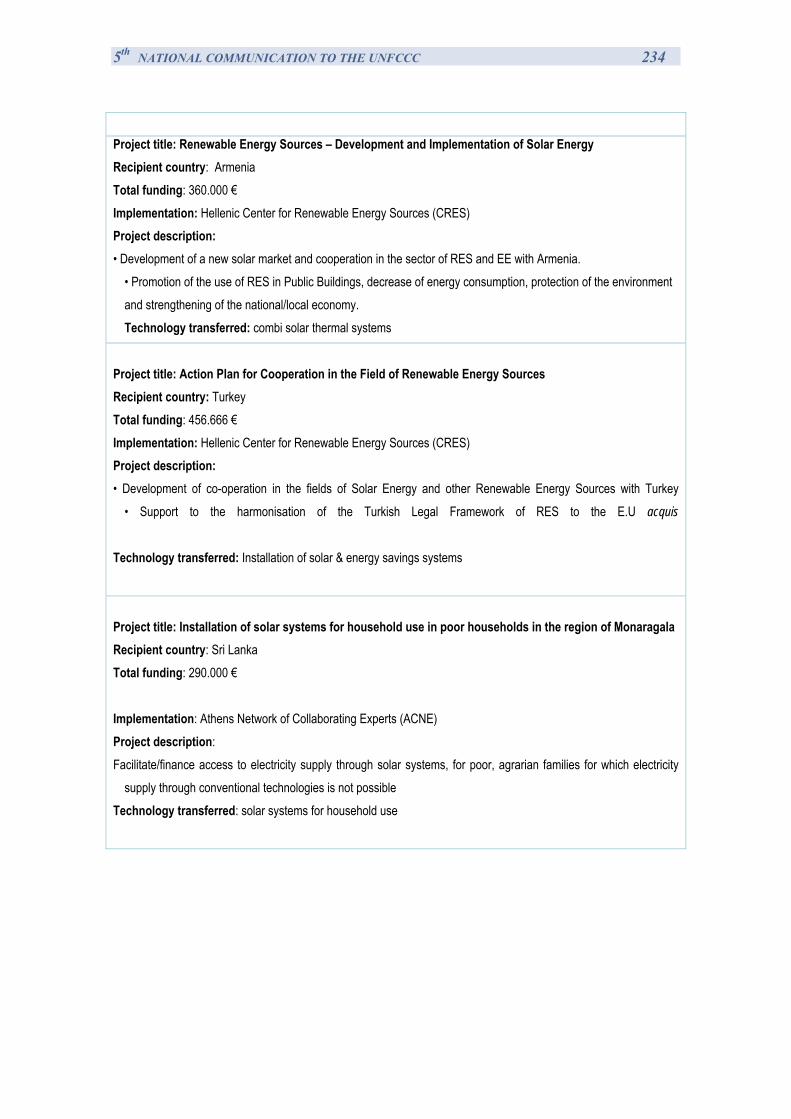
5th NATIONAL COMMUNICATION TO THE UNFCCC 234
Project title: Renewable Energy Sources – Development and Implementation of Solar Energy Recipient country: Armenia Total funding: 360.000 € Implementation: Hellenic Center for Renewable Energy Sources (CRES) Project description: • Development of a new solar market and cooperation in the sector of RES and EE with Armenia.
• Promotion of the use of RES in Public Buildings, decrease of energy consumption, protection of the environment and strengthening of the national/local economy. Technology transferred: combi solar thermal systems
Project title: Action Plan for Cooperation in the Field of Renewable Energy Sources Recipient country: Turkey Total funding: 456.666 € Implementation: Hellenic Center for Renewable Energy Sources (CRES) Project description: • Development of co-operation in the fields of Solar Energy and other Renewable Energy Sources with Turkey
• Support to the harmonisation of the Turkish Legal Framework of RES to the E.U acquis
Technology transferred: Installation of solar & energy savings systems
Project title: Installation of solar systems for household use in poor households in the region of Monaragala Recipient country: Sri Lanka Total funding: 290.000 € Implementation: Athens Network of Collaborating Experts (ACNE) Project description: Facilitate/finance access to electricity supply through solar systems, for poor, agrarian families for which electricity
supply through conventional technologies is not possible Technology transferred: solar systems for household use
5th NATIONAL COMMUNICATION TO THE UNFCCC 235
CHAPTER 8. RESEARCH AND SYSTEMATIC OBSERVATION
8.1 General policy on research and systematic observation
8.1.1 Summary information on GCOS activities
Systematic observations of the Greek environment started immediately after the Revolution of 1821 and the foundation of the modern Greek state in 1829. In 1842, the National Observatory of Athens (NOA) was established, aiming at the promotion of observations of astronomical and other parameters of natural science. The first observations taken in 1842 concerned meteorological rather than astronomical parameters. NOA collects and classifies in a systematic fashion environmental data since 1862. In an attempt to cover all areas of the physical environment, the Meteorological and Seismological Institutes were founded in 1896 and followed much later, in 1954, by the Ionospheric Institute.
The Hellenic National Meteorological Service (HNMS) was founded in 1931 under the Ministry of Aviation and its mission was to cover all the meteorological and climatological needs of our country. Today, according to the law in force, the HNMS is a National Service under the subordination of Ministry of Defence and the auspices of the Hellenic Air Force General Staff.
In 1954, NOA starts the first program to measure solar radiation parameters, and in 1965 establishes an air pollution monitoring network for Athens, which continued operation till 1975 when it was transferred to the newly founded air pollution directorate of the Ministry of Environment, Energy and Climate Change (MEECC).
Greece is among the countries with very high earthquake activity because of its location at the confluence of 3 tectonic major plates. Measurements of the seismic activity in the Greek territory began in 1896 by the newly founded Seismological Institute (now the Institute of Geodynamics), which continues to provide the Greek state with advice and official information on all parameters of seismic activity in the land.
To cover the needs of telecommunication, the Ionospheric Institute (now Institute for Space Applications and Remote Sensing) was founded in 1954, aiming primarily at the study and observation of ionosphere. The institute has since expanded to include research in the magnetosphere and remote sensing techniques of the earth’s surface.
In view of the geography of Greece (18400 km of coastline, 9835 islands), and the historical preoccupation with the sea (fishing, trading and shipping), a Hydrographic Office is founded in 1905 under the General Navy Staff which begins systematic observations of currents, salinity, sea surface temperature and other sea state marine parameters. In 1920 the Hydrographic Office is upgraded to form the Hellenic Navy Hydrographic Service (HNHS), which is responsible, among others, for the establishment and operation of a network of permanent stations for measuring and collecting hydrographic, oceanographic and marine information.
In 1945, the Hydrobiological Institute is founded in the Academy of Athens, and in 1970, it forms the core of an independent Institute for Oceanography and Fishing, which in 2003 is converted to the today’s Hellenic Centre for Marine Research (HCMR).
In 2001, Greece became associated and then, in 2005, full member of the European Space Agency (ESA), participating in all the core activities of the Agency, including those of Global Monitoring of Environment and Security (GMES). The ESA activities are at present coordinated by the General Secretariat for Research and Technology (GSRT) of the Ministry of Education.
5th NATIONAL COMMUNICATION TO THE UNFCCC 236
The network of systematic observation of climatic parameters in Greece includes the Hellenic National Meteorological Service (HNMS), services of the Greek Armed Forces, the Ministry of Rural Development and Food, the Ministry of Environment, Energy and Climate Change, the School of Civil Engineering in the NTUA, as well as a number of national research centres. Furthermore, the Public Power Corporation of Greece (PPC) operates a network of meteorological stations in the vicinity of its thermal and hydro power plants and dams for electricity production.
8.1.2 General policy on and funding of research (and systematic observation)
The General Secretariat of Research and Technology of the Ministry of Education, Lifelong Learning and Religious Affairs (before October 2009 the Secretariat was working under the Ministry of Development) is the responsible institution for supporting and promoting research in Greece. Currently, the main strategic priorities that have been set out for the area of R&T summarize in the following:
1. Increasing the demand for new knowledge and research results:
For both business and the public sector (central and local services, organizations), in practice, this regards the following activities:
(a) Increasing investment in knowledge-intensive sectors of Greece, and re-orientating the productive forces towards high added value products and services that require the support of research and technology (including defence systems)
(b) Creating new business activities through mainly young, highly educated entrepreneurs in order to exploit knowledge and research results
(c) Attracting business activities from abroad, exploiting the new knowledge and producing high added value products and services
(d) Increasing the employment of research personnel in businesses
(e) Improving the collaboration of public research organizations with businesses and manufacturing organizations in general: collaboration may be on the basis of long-term agreements for programmes providing services and knowledge-intensive products or on the basis of specific projects, where the results of which would be of interest to business
(f) Helping the understanding of scientific and technological developments and their impact on everyday life - projecting of positive models of science and technology to the public
2. Reorganization of the research system and provision of knowledge in Greece:
(a) Re-orientating the priorities of the research organisations that function under the General Secretariat for Research and Technology (GSRT) towards efforts on economic and social development: distinguishing between the research mission of the GSRT bodies and the Higher Educational Institutions, and selecting goals in accordance with the medium and long-term needs of businesses and public bodies.
5th NATIONAL COMMUNICATION TO THE UNFCCC 237
(b) Strengthening academic research in universities to support the education process (Ministry of Education, Lifelong Learning and Religious Affairs) and the training of young researchers
(c) Increasing the "critical mass" of research units in supervised organisations through restricting on the number of organisations and centralizing resources in the most appropriate ones
(d) Improving the quality of research being carried out and ensuring "excellence" at a global level
(e) Improving the management of the effectiveness of research organisations
3. Emancipation of the Greek research system and further opening to the international field:
(a) Increase of the collaboration of Greek research teams from public research foundations and businesses background with responsive organisations from other countries
(b) On-going qualitative improvement of the participation of Greek organisations in projects within the European Union Framework Programme and opening up of national programmes to international collaboration
(c) Increasing the participation of Greek research teams and organisations in the activities of European and international scientific and technological bodies (ESA, ESF, etc.).
4. Development and Technological Infrastructure in the context of a policy for science and technology
(a) Ongoing modernisation of electronic networks and procedures for access to networks and databases, as well as improvement of other material infrastructures (buildings, instruments, etc.)
(b) Upgrade of the system for granting patents and other industrial property rights, adoption of Community Patents, facilitation of access of the researchers and the public to the information contained in international patents
(c) Upgrade of the standardisation certification validation system (General Secretariat for Industry- Ministry of Economy, Competitiveness and Shipping/Ministry of Development, Lifelong Learning and Religious Affairs)
5. Thematic/Sectoral priorities for a policy on Science and Technology
(a) Selection of sectors for public financing on criteria, which combine Greek financial and social interests with the global perspectives for scientific and technological development. The sectors that were chosen for financing by the 3rd Community Support Framework are: renewable energy sources; food and hydro culture; knowledge-intensive culture and tourism; sport; sea transport; health, biomedical, diagnostic and therapeutic methods; natural environment (atmospheric, sea, water dynamic, forest fires, recycling etc.); structured environment and earthquake protection; new forms of organisation for businesses; labour and training; e-learning; e-business.
5th NATIONAL COMMUNICATION TO THE UNFCCC 238
(b) Creation of stable organisational structures for technological forecast research activities (technology foresight) and selection of priorities through social consent.
The main funding sources in the research sector in Greece include public and private funds. Public funds include the funds provided by the national budget, funds by the Programme of Public Investments, Structural Funds and also the European Commission’s funds. The Gross Domestic Expenditure on R&D (percentage of GDP) is estimated at 0.57% for 2007, while in 2005 the 46.8% has been funded by the State and the 31.1% by the Business Enterprise sector (EUROSTAT, 2009).
Funds that derive from the regular national budget, on an annual basis and a more limited range than the ones of the Programme of Public Investments, concern principally the covering of the operational need of Universities and National Research Centres (including the conservation and operation of the GCOS network whenever applicable).
Programmes that are funded from Structural Funds are included in the European Commission’s Support Frameworks and are managed by the Ministry of Economy.
The main means of European Funds in the area of Research are the Framework Programmes. The 6th Framework Programme (6th FP) started in 2002 and completed in 2006, providing about 419 MEuros to the Greek research. The sector of “Sustainable Development, Global Change and Ecosystems” has been one of the more successful in Greece and received more than 59 MEuros.
The 7th Framework Programme for Research and Technological Development (7th FP), has started in 2007 and will be completed in 2013. Until October of 2008 the Greek research organisations have obtained contributions of about 121MEuros, through the 7th FP. According to information from the European Commission (European Commission - Europen Research Area, 2009), up to now the 3.3% of signed grant agreements regard the sector of “Energy and Environment (including Climate Change).
Regional development is substantial for the increase of the research potential in the EU. Greece is recieving this kind of support in the Research sector, in the context of the ‘Convergence’ objective, that is financed by the European Regional Development Fund. To this end, the national Operational Programme 'Competitiveness and Entrepreneurship’ will be financed by more than 190 M Euros by the EU, for the “Creation and Development of Innovation with the support of Research and Technological Development”.
Finally, the objective of “European Territorial Cooperation” is also offering an important support to research and innovation. Three programmes of the cross-border regions of Greece are aimed to research and are co - financed by Greece and the European Regional Development Fund: “Southeastern Europe”, “Mediterranean” and “Greece – Italy”.
8.1.3 International cooperation
International cooperation in the field of research is ensured by the implementation of projects. Greece in the past has participated in a number of bilateral and cross-border programmes.
During the new programming period, the Community Initiative Programmes are replaced by the Programmes of Goal III "European Territorial Cooperation".
The total budget of Goal III programmes amounts to EUR 8.7 billion, of which EUR 210 million from the European Regional Development Fund (ERDF) have been earmarked for
5th NATIONAL COMMUNICATION TO THE UNFCCC 239
Greece. Thus, also including national resources, nearly EUR 300 million of Community and national resources will be allocated to European Territorial Cooperation Programmes.
To date, 3 of the 6 programmes managed by Greece (Greece–Cyprus, Greece–Bulgaria and Greece–Italy) as well as 7 of the 9 in which it is participating have gained approval. The final ratification of the Greece–Albania and Greece–FYROM programmes is expected..
Territorial Cooperation Programmes - Cross-border Programmes
In this framework and in regard to the cross-border cooperation programmes, Greece participates in six Programmes, with a total budget that exceeds EUR 320,000,000, for which it retains the Managing Authority. The Programmes are as follows:
“Greece-Bulgaria” European territorial cooperation programme [28/3/2008] , with a budget of EUR 110,735,958
“Greece-Italy” European territorial cooperation programme [28/3/2008], with a budget of EUR 88,955,170
“Greece-Cyprus” European territorial cooperation programme [28/3/2008], with a budget of EUR 41,633,290
“Greece-Albania” Cross-border IPA programme [5/9/2008], co-funded by the Instrument for Pre Accession Assistance (IPA) with a budget of EUR 22,143,015
“Greece-FYROM” Cross-border IPA programme [5/9/2008], co-funded by IPA with a budget of EUR 24,810,005
“Greece-Turkey” Programme, co-funded by IPA with a budget of EUR 34,088,992
Greece also participates in three (3) multilateral cross-border cooperation Programmes: Adriatic Programme, with eligible territories being those of the Prefectures of Corfu and
Thesprotia in Greece, as well as regions in Italy, Bosnia-Herzegovina, Montenegro, Albania, Serbia and Slovenia. The Programme is co-funded by IPA, while Greece contributes EUR 5,659,992.
Mediterranean Sea Basin, with eligible territories being those of all countries located around the Mediterranean Sea. The total programme Budget exceeds EUR 170,000,000.
Black Sea, with the Regions of Central and Eastern Macedonia–Thrace in Greece, as well as regions in Bulgaria, Romania, Russia, Turkey, Azerbaijan, the Ukraine, Georgia, Romania and Moldavia as eligible territories. The contribution of Greece amounts to EUR 1,132,000 and will have a reinforced role, as it has been decided that it will designate the First Consultant of the Managing Authority, which is being hosted in Romania.
Transnational Programmes Greece participates in two transnational programmes. These are:
MEDA Programme, in which Greece, Spain, Italy, France, Portugal, United Kingdom–Gibraltar, Malta, Cyprus, Slovenia, Croatia and Bosnia–Herzegovina participate. The Programme resulted from the merger of the INTERREG ARCHIMED and MEDOCC Programmes. One of the Programme’s two Liaison Offices will be located in Thessalonica, which will be responsible, among others, for supporting candidate partners and Final Beneficiaries from among the candidate and potential candidate
5th NATIONAL COMMUNICATION TO THE UNFCCC 240
countries for accession to the European Union participating in the Programme. The Programme Budget amounts to EUR 193,191,331.
Southeast Europe Area, in which eight (8) E.U. Member States participate (Italy, Austria, Hungary, Slovakia, Slovenia, Romania, Bulgaria and Greece), as well as Moldavia, Croatia, Serbia, Montenegro, Bosnia-Herzegovina, Albania, FYROM and the Ukraine. The Programme resulted from the division of the CADSES programme into two different zones, north and south. Its budget amounts to EUR 206,691,645.
Interregional Programme
Greece participates in the INTERREG IV C interregional programme, in which all E.U. Member States –with the exception of Germany– participate, as well as Norway and Switzerland. Its Budget amounts to EUR 321,321,762.
Networks Greece also participates in the INTERACT, ESPON and URBACT networks. Climate Change issues
The above mentioned programmes are including various projects that are directly or indirectly related to climate change observation, mitigation and adaptation actions. Although an extensive list including all the relevant projects is not available, some indicative are mentioned in Table 8.1.
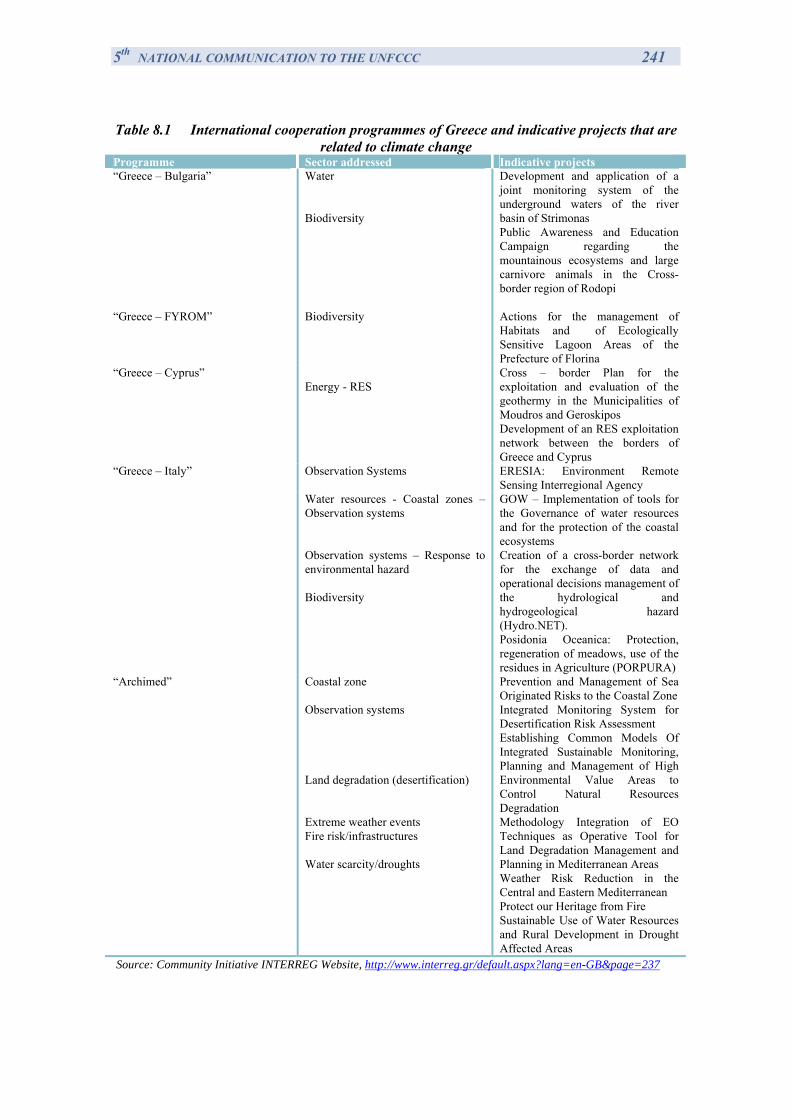
5th NATIONAL COMMUNICATION TO THE UNFCCC 241
Table 8.1 International cooperation programmes of Greece and indicative projects that are
related to climate change Programme Sector addressed Indicative projects “Greece – Bulgaria” Water
Biodiversity
Development and application of a joint monitoring system of the underground waters of the river basin of Strimonas Public Awareness and Education Campaign regarding the mountainous ecosystems and large carnivore animals in the Cross-border region of Rodopi
“Greece – FYROM” Biodiversity Actions for the management of Habitats and of Ecologically Sensitive Lagoon Areas of the Prefecture of Florina
“Greece – Cyprus” Energy - RES
Cross – border Plan for the exploitation and evaluation of the geothermy in the Municipalities of Moudros and Geroskipos Development of an RES exploitation network between the borders of Greece and Cyprus
“Greece – Italy” Observation Systems ERESIA: Environment Remote Sensing Interregional Agency
Water resources - Coastal zones – Observation systems Observation systems – Response to environmental hazard Biodiversity
GOW – Implementation of tools for the Governance of water resources and for the protection of the coastal ecosystems Creation of a cross-border network for the exchange of data and operational decisions management of the hydrological and hydrogeological hazard (Hydro.NET). Posidonia Oceanica: Protection, regeneration of meadows, use of the residues in Agriculture (PORPURA)
“Archimed” Coastal zone Observation systems Land degradation (desertification) Extreme weather events Fire risk/infrastructures Water scarcity/droughts
Prevention and Management of Sea Originated Risks to the Coastal Zone Integrated Monitoring System for Desertification Risk Assessment Establishing Common Models Of Integrated Sustainable Monitoring, Planning and Management of High Environmental Value Areas to Control Natural Resources Degradation Methodology Integration of EO Techniques as Operative Tool for Land Degradation Management and Planning in Mediterranean Areas Weather Risk Reduction in the Central and Eastern Mediterranean Protect our Heritage from Fire Sustainable Use of Water Resources and Rural Development in Drought Affected Areas
Source: Community Initiative INTERREG Website, http://www.interreg.gr/default.aspx?lang=en-GB&page=237
5th NATIONAL COMMUNICATION TO THE UNFCCC 242
8.2 Research
The main institutes that perform research in the sector of climate change in Greece are:
the National Observatory of Athens,
the Academy of Athens,
the Hellenic Centre for Marine Research,
the National Technical University of Athens,
the National & Kapodistrian University of Athens,
the Aristotle University of Thessaloniki,
the University of the Aegean,
the National Agricultural Research Foundation.
In addition, there are other institutes in Greece that are working on research areas that are related to climate change (i.e., forest fires, water management, coastal zones, biodiversity new energy technologies), like the Agricultural University of Athens, the University of Patras, the Technical University of Crete, the Greek Biotope/Wetland Centre, the Centre for Renewable Energy Sources and Saving CRES etc.
The National Observatory of Athens (NOA), along with the Hellenic National Meteorological Service (HNMS) and the Aristotle University of Thessaloniki, are the institutes that perform the main analysis of the current climate in Greece.
HNMS is currently covering all the meteorological and climatological needs of the country. In the same time, the Service participates in international networks and represents Greece in the following meteorological organisations: WMO, ECMWF, EUMETSAT, EUMETNET, ECOMET, ICAO, NATO.
In NOA, the Institute of Environmental Research and Sustainable Development (IERSD, http://www.meteo.noa.gr/) aims to promote environmental science and engineering, through different activities that include among others meteorology and weather forecast, climatology and climate change and water resources engineering. NOA is also the focal point in the IPCC and in the management committee of GEOSS.
The Department of Meteorology – Climatology of Aristotle University of Thessaloniki (AUTh, http://www.geo.auth.gr/en_ereyna.htm#metewrologia) has also worked on climate change issues, while equally important is the contribution of the University of Athens Climate Research Group (http://env.mg.uoa.gr/index.php?option=com_content&view=article&id=57&Itemid=72&lang=en ).
It should be also noted that currently NOA is using the global circulation model of the Hadley Centre (Meteorological Office, UK) HadCM3, while the research team of the AUTh has worked on evaluating the differences between the results of different circulation models, in the context of the ENSEMBLES project.
The Hellenic Centre for Marine Research (HCMR) is mainly focused on the impacts of climate change on the marine ecosystems, due to the rise of sea level and the rise of temperature. The Centre is also the main coordinator of the SESAME project, in which the University of Aegean, the University of Crete and the Athens University of Economics are also participating.
5th NATIONAL COMMUNICATION TO THE UNFCCC 243
The research areas in the National Technical University of Athens (NTUA) are closely connected to the impacts of climate change in significant sectors, such as water scarcity, desertification and extreme weather events (mainly floods). The Laboratory of Hydrology and Water Resources Management of the School of Civil Engineering has participated in a number of international and national projects regarding the water scarcity issue and flood risk, while the Environmental & Energy Management Research Unit in the School of Chemical Engineering (http://environ.chemeng.ntua.gr/en/Default.aspx?t=53) is focused on the mitigation of water stress and the research of needs and policy choices in areas of drought (ie. Aquastress project, the Xerochore project etc.).
Finally, some of the research activities of Greek institutes are oriented in the development of new technologies regarding mitigation and adaptation activities. The University of Patras is among the partners of the ECLAT project (Electrocatalytic Gas-Phase Conversion of CO2 in Confined Catalysts, http://www.ist-world.org/ProjectDetails.aspx?ProjectId=7f546ab0e43c4d60a6705ca35a48e40b) that aims to prove the feasibility of the technical conversion of a part of CO2 into fuel, again, with a potential global CO2 reduction of 5%. Also, the Centre for Renewable Energy Sources and Saving is the coordinator in the “High solar fraction heating and cooling systems with combination of innovative components and methods” (HIGH-COMBI) (http://www.highcombi.eu/) that is projected to end in 2011. The project aims at developing high solar fraction systems by an innovative combination of optimized solar heating, cooling and storage technologies. Also, the CASTOR, "CO2 from Capture to Storage" project), is an European initiative grouping 30 partners (industries, research institutes and universities) that aims at the developing and validation of all innovative technologies needed to capture and store CO2 in a reliable and safe way. The Greek partner of the project is the Public Power Company of Greece.
Especially regarding the CRES research activities, it is worth mentioning that, over the years, the Centre has participated in more than 600 European, national and international projects. These include applied research projects and development, demonstration projects, energy policy studies, development of energy information systems and energy modelling, investment feasibility studies, technical and economic studies, environmental impact assessments, market research as well as activities for the promotion of RES/RUE/ES. Through these projects, CRES has developed co-operation with numerous public and private organisations, at a national, European and international level. It is also worth mentioning that the project GROUNDHIT "Ground Coupled Heat Pumps of High Technology", that has been coordinated by the CRES, received the Energy Globe Award - one of the most prestigious international environmental awards - as the best environmental project in Greece in 2008. The project GROUNDHIT (http://www.groundhit.eu/) aims at improving the cost-effectiveness, competitiveness and market penetration of ground coupled heat pumps. The Ground Coupled Heat Pumps are a reliable and environmentally friendly technology that utilises the soil temperature,which is near-constant irrespective of the external weather conditions, and provides buildings with efficient heating, cooling and warm water.
The participation of Greek institutes in indicative international and national research programmes is also presented in Table 8.2.
5th NATIONAL COMMUNICATION TO THE UNFCCC 244
Table 8.2 Selected projects that are directly or indirectly related to climate change and to which Greece is a partner
Project Greek Institute Source Ensemble-based predictions of climate changes and their impacts (ENSEMBLES)
1. IERSD, National Observatory of Athens (NOA) 2. School of Geology, Aristotle University of Thessaloniki (AUTh)
http://ensembles-eu.metoffice.com/participants.html#partners
A surveillance system for assessing and monitoring of desertification (DeSurvey)
1. IERSD, NOA 2. Laboratory of Forest Utilisation, AUTh 3. Department of Natural Resources, Agricultural University of Athens (AUA) 4. National Agricultural Research Foundation (NAGREF)
http://www.desurvey.net/
Southern European seas: Assessing and Modelling Ecosystems Changes (SESAME Project)
1. Hellenic Centre for Marine Research (HCMR) 2. University of the Aegean (UoA) 3. Athens University of Economics and Business - Research Center (AUEB) 4. University of Crete (UoC)
http://www.sesame-ip.eu/scientist/who-we-are
Climate Change and Impact Research (CIRCE)
1. Environmental Chemical Processes Laboratory (UoC) 2. Institute of accelerating systems and applications, School of Physics, National & Capodistrian University of Athens (NCUA) 3. IERSD (NOA) 4. Dept. Of Hygiene and Epidemiology, Medical School and Laboratory of Climatology and Atmospheric Environment (NCUA) 5. Department of Geography (UoA) 6. Institute of Oceanography (HNMC) 7. Energy - Economics - Environment Modelling Laboratory Research and Policy Analysis, National Technical University of Athens (NTUA)
http://www.circeproject.eu/index.php?option=com_content&task=view&id=67&Itemid=1
Paleo- and current climate change in the Eastern Mediterranean, using biochemical indexes and stable isotopes: Can we predict future changes? [National]
Hellenic Centre for Marine Research http://www.hcmr.gr/listview3.php?id=40
Monitoring, forcasting and best practices for FLOOD mitigation and prevention in the CADSES region (FLOODMED)
1. Laboratory of Hydrology and Water Resources Management (NTUA) 2. Department of civil protection, Prefecture of Chania 3. Department of Environmental Enginnering, Technical University of Crete (TUC)
http://www.floodmed.org/partners.html
Integrated water resources management, development and comparison of common transnational methodologies to combat drought in the MEDOCC regions (MEDDMAN)
1. Laboratory of Hydrology and Water Resources Management (NTUA) 2. Department of Hydraulics, land and agricultural science (AUTh) 3. Prefecture of Pieria
http://www.meddman.org/partners.html
Prevention and restoration actions to combat desertification. An integrated assessment (PRACTICE)
Aristotle University of Thessaloniki http://cordis.europa.eu/fetch?CALLER=FP7_PROJ_EN&ACTION=D&DOC=2&CAT=PROJ&QUERY=01245f7f4691:3930:76ae2057&RCN=92041
Living with landslide risk in Europe: Assessment, effects of global change, and risk management strategies (SAFELAND)
Aristotle University of Thessaloniki http://cordis.europa.eu/fetch?CALLER=FP7_PROJ_EN&ACTION=D&DOC=7&CAT=PROJ&QUERY=01245f7f4691:3930:76ae2057&RCN=91248
5th NATIONAL COMMUNICATION TO THE UNFCCC 245
Project Greek Institute Source Marine ecosystem evolution in a changing environment (MEECE)
Hellenic Centre for Marine Research http://cordis.europa.eu/fetch?CALLER=FP7_PROJ_EN&ACTION=D&DOC=16&CAT=PROJ&QUERY=01245f7f4691:3930:76ae2057&RCN=89307
Integrated project to evaluate impacts of global change on European freshwater ecosystems (EUROLIMPACTS)
Greek Biotope/Wetland Centre, Soil and Water Resources Department
http://www.eurolimpacs.ucl.ac.uk/oldsite/publicarea/partners.php
8.3 Systematic Observation
8.3.1 Atmospheric essential climate variables
8.3.1.1 Measurements of meteorological parameters
The Hellenic National Meteorological Service (HNMS) operates a network of 88 surface and 3 upper air measurement stations, along with 22 automated meteorological stations. 69 of them (66 and 3 of surface and upper air, respectively) provide meteorological data on a continuous basis to international networks. In addition, all of them (113) are registered to World Meteorological Organization (WMO). The available data time series cover a period of 35-40 years. The majority of the stations have been in operation since 1955.
The Ministry of Rural Development and Food has been operating a large network of agrometeorological stations, some of which have been operating for more than 50 years. In the last years, after a complete refurbishment, 40 of these stations are operating under the supervision of the Department for Agricultural Research of the Ministry, and provide a full and continuous set of data, which are collected and stored centrally. Another 120 agrometeorological stations are operated by three different Departments of the Ministry (80 of them by the Department of Plant Protection with the rest divided between the Departments of Forests and Land Reclamation). Measurements are taken automatically every minute and averages are recorded every hour (except for precipitation which is recorded every 10 minutes in order to capture intensity).
The Institute of Mediterranean Forestry Ecosystems and Forestry Products Technology, part of the National Agricultural Research Foundation (NAGREF), operates a network of 21 additional agrometeorological stations since 1960, which was refurbished in 1994 so as to become fully automated. The stations cover mostly forest areas, while the data are fed into a database of meteorological information that covers a period of 40 years.
The National Observatory of Athens (NOA) also operates two 1st class meteorological stations in Athens (in Thissio since 1842 and Penteli since 1998). These stations measure, on a continuous basis, air temperature, barometric pressure, rainfall, relative humidity, wind direction and velocity, along with a full set of solar radiation parameters. The availability of data time series varies from 10 to 50 years in relation to the respective station and measured parameter. Since early 2006, NOA has started the installation of automated meteorological stations along the country. Till September 2008, 79 stations have been installed, 65 of which belong to NOA. These stations measure and record every 10 minutes temperature, relative humidity, pressure, rainfall, wind direction and velocity.
A number of national research centres, namely the National Centre for Research in Physical Scientific Research ‘Demokritos’, the Centre for Renewable Energy Sources and Saving
5th NATIONAL COMMUNICATION TO THE UNFCCC 246
(CRES) and universities (National Technical University of Athens, Universities of Athens and Thessaloniki), also operate meteorological stations. The time series of these stations vary in length from a few years to a few decades, and their data are widely available:
• National Centre of Scientific Research "DEMOKRITOS" operates two meteorological stations, one of which measures aerosol parameters.
• In the wider area of Athens (687 km2), 10 fully automatic telemetric hydrometeorological stations are installed and already operating in the framework of the METEONET network. This network was developed by members of the Laboratory of Hydrology and Water Resources Management of the National Technical University of Athens (School of Civil Engineering). The measurements performed by the METEONET network concern air temperature and precipitation, wind speed and direction and surface radiation, whereas the Zografou station performs also measurements of air pressure and water vapour. All data measurements are publicly available at the webpage of the METEONET project (http://meteonet.chi.civil.ntua.gr/en/divs.html). The data are collected every ten minutes and updated (in the webpage) every 8 hours on a daily basis. Historical data, concerning the period of operation of each station (2005-now) are available on demand. These data are not provided to any international data centre and are used for national purposes only at the moment.
The Ministry of Rural Development and Food and the Ministry of Environment, Energy and Climate Change operate a large network of rain gages and snow gages. The network consists of more than 250 rain gages and 1000 snow tables.
8.3.1.2 Measurements of atmospheric electricity discharges
The National Observatory of Athens (NOA) has been operating a network of stations aimed at detecting lightning strikes. The network consists of 6 recording stations, located in the UK, Denmark, Romania, Italy, Cyprus, Portugal and Greece. It has been in operation (detection and recording) since 2005, covering a major part of Europe, whole Mediterranean Sea area and part of northern Africa. The lightning-strike data provide real-time information regarding the location of thunder cells and severe rainstorm activity. This is crucial information for predicting floods and providing more accurate local forecasts. This information is provided to the meteorological community via the Internet (www.noa.gr/forecast/lightning.gif).
8.3.1.3 Meteorological RADAR
HNMS has a network of meteorological radars • 4 C-band Doppler
• 2 C-band Doppler / dual polarization
• 2 S-band Doppler
The above-mentioned network is fully automated, covers the major part of the territory of Greece (limited coverage of south west area), carries out two kinds of scanning (short range: 150km and long range: 300km), with a frequency of 15 min. The network is to operate in full scale as from October 2008.
5th NATIONAL COMMUNICATION TO THE UNFCCC 247
Moreover, NOA operates a mobile X-band / dual polarization meteorological radar. This radar is used for research purposes.
8.3.1.4 Wind Measurements
The Centre of Renewable Energy Sources (CRES) and several companies have established and operate wind measurement masts, usually of 30m height, for the collection of data to estimate wind energy potential and identify possible locations for the establishment of wind parks. The number of masts varies with the needs of possible wind park developers. The number of stations that are in operation are 55. Data collected, apart from the ones collected by CRES, are not available free of charge.
8.3.1.5 Ozone and UV-radiation measurements
The Universities of Thessaloniki and Athens have been monitoring the total (column) ozone amount at two locations on a continuous basis for more than 30 years. Since 2005 total ozone is derived also at the 9 stations of UVNET (described in this section) from multifilter radiometer data.
The University of Thessaloniki-Laboratory of Atmospheric Physics hosts the World Ozone Mapping Center, which utilizes measurements from the 90 stations of WMO Global Ozone System (part of GAW) and of TOMS (Total Ozone Mapping Spectrometer) to generate and archive global maps of total ozone column (http://lap.physics.auth.gr/ozonemaps/ ). Furthermore, the Institute of Mediterranean Forestry Ecosystems and Forestry Products Technology of NAGREF, also measures (since April 2000) average monthly ozone concentration in 3 forest areas (in Vatada near the town of Amfilohia at 350 m height, St Nicolas in the Evrytania province at 1120 m height and on Ossa mountain at 740 m height).
At the station of Thessaloniki (AUTH-LAP) solar UV radiation is monitored since the beginning of the 1990s with 2 spectroradiometers providing spectral irradiance measurements several times during the day. The UV-A, erythemal irradiance (UV-B) and total solar radiation are measured continuously since 1981, 1991 and 1993 respectively.
However, since 2004 a team effort coordinated by the Atmospheric Physics Laboratory of the Aristotle University of Thessaloniki (AUTH) resulted in the establishment of the National Network for Monitoring of Solar UV Solar Radiation, UVNET (www.uvnet.gr), that aims at the long-term monitoring of solar ultraviolet radiation over Greece and Cyprus, with the following goals:
Studying of the effects of UV exposure on human beings and the ecosystem, as well as the short-term forecast of UV radiation levels.
The awareness of the public concerning their protection from the biological effects from their exposure to ultraviolet radiation.
Providing of continuous and reliable information to all relevant public organizations, national or international organizations, health services and also to any citizen for the actual level and the possible effects from the exposure to the biologically effective UV rays of the sun.
In the framework of this network, 9 stations have been installed at Thessaloniki, Mytilene, Ioannina, Athens, Patras, Heraklion, Nicosia, Rhodes and Xanthi using state of the art
5th NATIONAL COMMUNICATION TO THE UNFCCC 248
instrumentation and technology for obtaining the measurements and the dissemination and exploitation of the results.
The instruments that are used are the NILU-UV multi-filter radiometers, which measure solar irradiance at 5 narrow bands in the UVB (280-315 nm) and UVA (315-400 nm), and the Photosynthetically Active Radiation (PAR, 400-700 nm). The instruments are connected on-line with a central data base maintained at AUTH, enabling immediate recording and display of the measurements. Based on appropriate methodologies and software the following products are derived from the network measurements:
The solar spectral irradiance at specific wavelengths (305, 312, 320, 340 and 380 nm)
The total column of ozone.
The transmittance of the atmosphere in the UV and visible part of the spectrum
The cloud optical depth
The photolysis rates of ozone, nitrogen dioxide and formaldehyde
The UV-B and UV-A irradiance and the PAR
Biologically relevant doses related to the influence of UV radiation to humans and plants.
In collaboration with the Team of Atmospheric Models and Weather Forecast of the University of Athens and the National Centre of Protection of the Environment in U.S.A. (NCEP), forecasts of the UV index are provided for Greece and Cyprus.
Since 2006, aerosol optical properties are monitored with a Cimel sunphotometer which is part of the AERONET. Finally, LAP operates broadband radiometers for the measurement of UV-B, UV-A and total solar radiation since the beginning of 1990s.
The National Observatory of Athens’ station in Thissio (Athens) measure UV total since 1989, UV-B since 1995 and total solar radiation components since 1989, 1995 and 1953, respectively.
8.3.1.6 Ground level air pollutants
The Ministry of Environment, Energy and Climate Change operates local networks for monitoring air pollution in the major urban areas of Greece. In the greater Athens area, the network consists of 19 stations that measure air pollutants of which 16 measure ground level ozone and 12 also measure standard meteorological parameters). The greater Thessalonica area network consists of 8 stations, 7 of which measure ozone. Eight additional stations, all of which measure ozone, are located in other cities. The data are available to the public through the National Environmental Data Center of Ministry of Environment, Energy and Climate Change and through the European Environmental Agency.
In addition, the Public Power Corporation of Greece operates 30 air quality stations (+2 which are under construction) near its power plants that monitor air pollutants (SO2, NOx, PM10 and O3) and meteorological parameters (wind direction and velocity, temperature and relative humidity). All stations are automated, operating continuously. Data are gathered and kept in a centralised database.
Details about on the contribution of Greece in international systems and networks are presented in Tables 8.1a, 8.1b and 8.1c. The abbreviations in brackets next to the number of stations correspond to the organization that operates the respective station(s). Thus, HNMS stands for Hellenic National Meteorological Service, NTUA for National Technical University of Athens,
5th NATIONAL COMMUNICATION TO THE UNFCCC 249
NOA for National Observatory of Athens, NCSR for National Centre of Scientific Research "DEMOKRITOS", NAGREF for National Agricultural Research Foundation, HNMS Hellenic National Meteorological Service.
8.3.1.7 Satellite observations
Greece is a member of the European organization for the exploitation of Meteorological Satellites (EUMETSAT), the consortium that operates the meteorological observation satellite METEOSAT, and is represented in EUMETSAT by HNMS. For more details it is recommended to visit the EUMETSAT home page (http://www.eumetsat.int). It should be noted that EUMETSAT has a decentralised network of Satellite Application Facilities (SAFs) for the generation of products from EUMETSAT satellite data.
In addition, Greece is a member of ESA and participates in basic, as well as in optional, research projects. Greece also participates in three actions of the Global Monitoring for Environment and Stability (GMES) program of ESA. The first one concerns the monitoring of the Eastern Mediterranean Sea through satellites ERS-2, ENVISAT and RADARSAT-2, for the timely tracking of oil spills from ships, the second one, ICAROS-NET, the measurement and monitoring of air pollution and mostly of particulate matters and the third one the estimation of forest land change and of forest carbon reserves (GMS-Forest Monitoring).
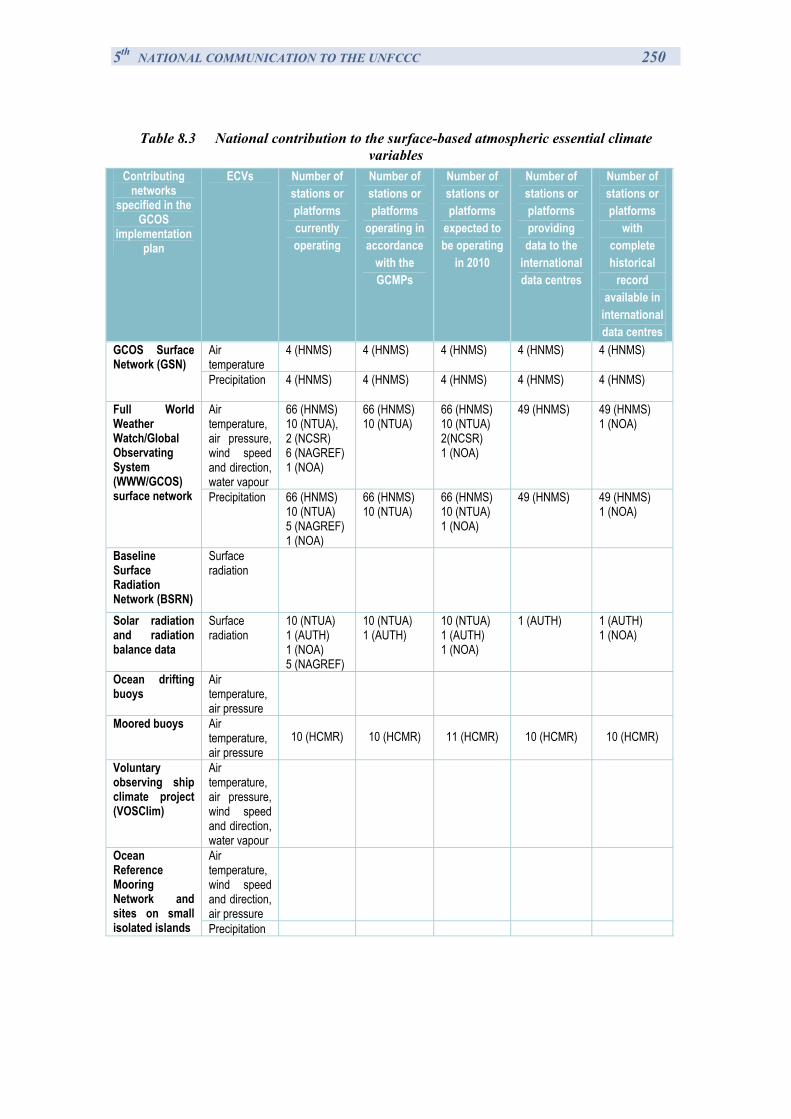
5th NATIONAL COMMUNICATION TO THE UNFCCC 250
Table 8.3 National contribution to the surface-based atmospheric essential climate
variables Contributing
networks specified in the
GCOS implementation
plan
ECVs Number of stations or platforms currently operating
Number of stations or platforms
operating in accordance
with the GCMPs
Number of stations or platforms
expected to be operating
in 2010
Number of stations or platforms providing data to the
international data centres
Number of stations or platforms
with complete historical
record available in
international data centres
Air temperature
4 (HNMS) 4 (HNMS) 4 (HNMS) 4 (HNMS)
4 (HNMS) GCOS Surface Network (GSN)
Precipitation 4 (HNMS) 4 (HNMS) 4 (HNMS) 4 (HNMS)
4 (HNMS)
Air temperature, air pressure, wind speed and direction, water vapour
66 (HNMS) 10 (NTUA), 2 (NCSR) 6 (NAGREF) 1 (NOA)
66 (HNMS) 10 (NTUA)
66 (HNMS) 10 (NTUA) 2(NCSR) 1 (NOA)
49 (HNMS)
49 (HNMS) 1 (NOA)
Full World Weather Watch/Global Observating System (WWW/GCOS) surface network Precipitation 66 (HNMS)
10 (NTUA) 5 (NAGREF) 1 (NOA)
66 (HNMS) 10 (NTUA)
66 (HNMS) 10 (NTUA) 1 (NOA)
49 (HNMS) 49 (HNMS) 1 (NOA)
Baseline Surface Radiation Network (BSRN)
Surface radiation
Solar radiation and radiation balance data
Surface radiation
10 (NTUA) 1 (AUTH) 1 (NOA) 5 (NAGREF)
10 (NTUA) 1 (AUTH)
10 (NTUA) 1 (AUTH) 1 (NOA)
1 (AUTH)
1 (AUTH) 1 (NOA)
Ocean drifting buoys
Air temperature, air pressure
Moored buoys Air temperature, air pressure
10 (HCMR) 10 (HCMR) 11 (HCMR) 10 (HCMR) 10 (HCMR)
Voluntary observing ship climate project (VOSClim)
Air temperature, air pressure, wind speed and direction, water vapour
Air temperature, wind speed and direction, air pressure
Ocean Reference Mooring Network and sites on small isolated islands Precipitation
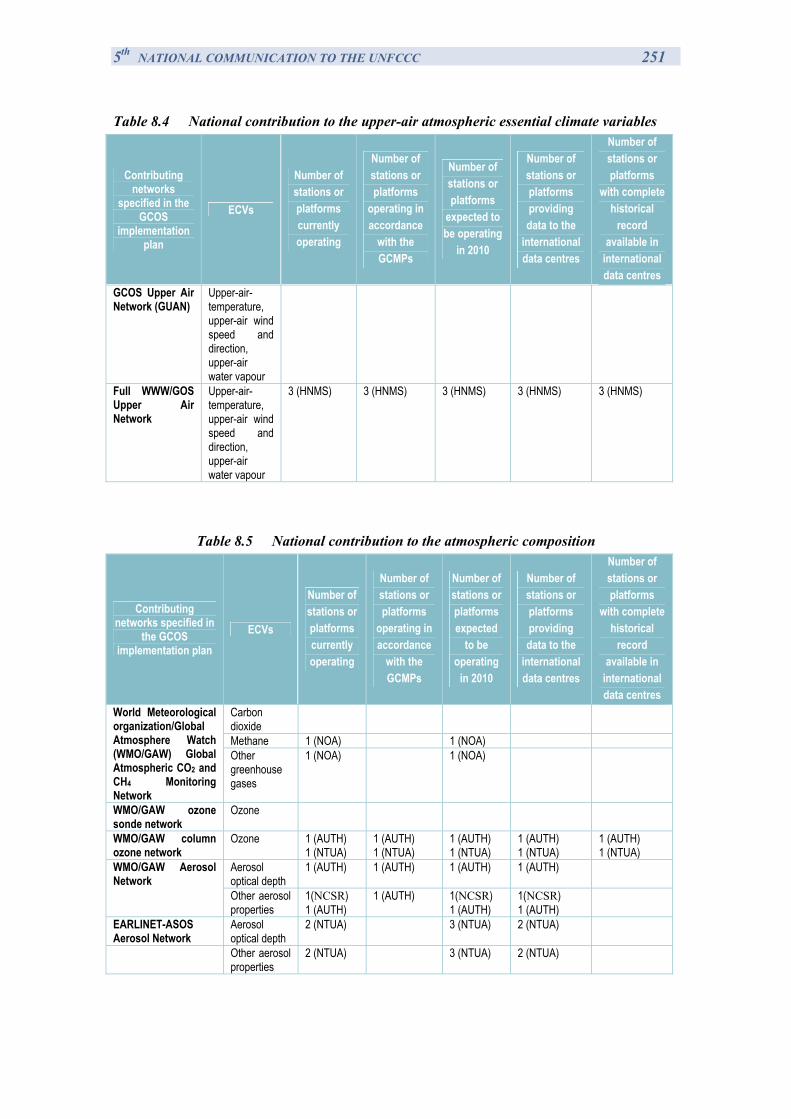
5th NATIONAL COMMUNICATION TO THE UNFCCC 251
Table 8.4 National contribution to the upper-air atmospheric essential climate variables
Contributing networks
specified in the GCOS
implementation plan
ECVs
Number of stations or platforms currently operating
Number of stations or platforms
operating in accordance
with the GCMPs
Number of stations or platforms
expected to be operating
in 2010
Number of stations or platforms providing data to the
international data centres
Number of stations or platforms
with complete historical
record available in
international data centres
GCOS Upper Air Network (GUAN)
Upper-air-temperature, upper-air wind speed and direction, upper-air water vapour
Full WWW/GOS Upper Air Network
Upper-air-temperature, upper-air wind speed and direction, upper-air water vapour
3 (HNMS)
3 (HNMS)
3 (HNMS)
3 (HNMS)
3 (HNMS)
Table 8.5 National contribution to the atmospheric composition
Contributing networks specified in
the GCOS implementation plan
ECVs
Number of stations or platforms currently operating
Number of stations or platforms
operating in accordance
with the GCMPs
Number of stations or platforms expected
to be operating
in 2010
Number of stations or platforms providing data to the
international data centres
Number of stations or platforms
with complete historical
record available in
international data centres
Carbon dioxide
Methane 1 (NOA) 1 (NOA)
World Meteorological organization/Global Atmosphere Watch (WMO/GAW) Global Atmospheric CO2 and CH4 Monitoring Network
Other greenhouse gases
1 (NOA) 1 (NOA)
WMO/GAW ozone sonde network
Ozone
WMO/GAW column ozone network
Ozone 1 (AUTH) 1 (NTUA)
1 (AUTH) 1 (NTUA)
1 (AUTH) 1 (NTUA)
1 (AUTH) 1 (NTUA)
1 (AUTH) 1 (NTUA)
Aerosol optical depth
1 (AUTH) 1 (AUTH) 1 (AUTH) 1 (AUTH) WMO/GAW Aerosol Network
Other aerosol properties
1(NCSR) 1 (AUTH)
1 (AUTH) 1(NCSR) 1 (AUTH)
1(NCSR) 1 (AUTH)
EARLINET-ASOS Aerosol Network
Aerosol optical depth
2 (NTUA) 3 (NTUA) 2 (NTUA)
Other aerosol properties
2 (NTUA) 3 (NTUA) 2 (NTUA)
5th NATIONAL COMMUNICATION TO THE UNFCCC 252
8.3.2 Oceanic essential climate variables
8.3.2.1 Overview
The main institutions that contribute to the national oceanic observations are the Hellenic Centre for Marine Research (HCMR, http://www.hcmr.gr/) and the Hellenic Navy Hydrographic Service (HNHS, http://www.hnhs.gr/en/enindex.htm).
8.3.2.2 Hellenic Centre for Marine Research (HCMR)
The Hellenic Centre for Marine Research (HCMR) was set up as a single institution in order to integrate government-funded marine science research in Greece. Formally established by government decree on June 3 2003, it combines the former research institutes NCMR and IMBC, together with their respective field stations.
Its present structure consists of five institutes, which carry out research into specific thematic areas.
Institute of Oceanography
Institute of Aquaculture
Institute of Marine Biological Resources
Institute of Inland Waters
Institute of Marine Biology and Genetics
It enjoys top-level scientific support from its two research vessels, the RV AEGAEO and RV PHILIA, its state-of-the-art 2-man submersible THETIS as well as two deepwater ROVs, named the MAX ROVER and the SUPER ACHILLES.
The global scientific community can also access the HCMR Journal of Mediterranean Marine Science, HCMR publications, Collected Reprints abstracts, and data-rich projects such as HNODC, IASON and ELNAIS.
The HCMR is a member of the European Global Ocean Observating System (Eur-GOOS). In the previous years the HCMR has participated in the following operational oceanography R&D projects:
MFSPP (1998-2001): Development of multiparametric M3A station, VOS Measurements, High resolution regional and coastal models
MFSTEP (2002-2004): Consolidation of MFS observing system
MARSAIS (2001-2003): Synergy between SAR and buoy data, Validation of Algorithms, Detection and forecasting of oil-spills
FerryBox (2002-2005): Implementation of a European network for FerryBox measurements, Operational phase: 2002-2003
MAMA (2002-2004): Coordination on Mediterranean Scale, Capacity building
MERSEA_S1 (2003-2004): GMES Initial phase
5th NATIONAL COMMUNICATION TO THE UNFCCC 253
ROSES (2003-2004): ESA GSE
EPAN/ESPEN (2003-2005): Improved wave monitoring and forecasting products – oil spill risk assessment
MERSEA-IP (2004-2008): Global monitoring and forecasting. HCMR: Coordination of Mediterranean Observations, M3A system
MARCOAST (2005-2008): ESA GMES service network
The following paragraphs include some information over the projects currently run by the HCMR, concerning the observation of ECVs.
The TELEFOS project
TELEFOS (Telephonic monitored drifters for ecological studies) is a state of the art system for measuring currents and calculating dispersion (e.g. pollutants) in the near surface waters. Its concept is based on a new design on an old idea, i.e. of using drifters to monitor the circulation in aquatic bodies.
The system consists of a monitoring station (which may be placed either on land or aboard the deployment/retrieval vessel), and the drifter fleet. The drifters’ positioning exploits the highly accurate GPS system.
By 2010 five drifting buoy arrays are going to be used for the observation of position-change-based currents, under the context of the above described project (TELEFOS). These arrays have already finished their pilot implementation, and will be used for the observation of waste dispersion (0-50m).
The POSEIDON System
The main monitoring, forecasting and information system is the POSEIDON System, developed by HCMR. By establishing a network of observation buoys and the creation of a specialized operational centre for the processing of the data collected and the production of forecasts, POSEIDON system is an infrastructure at the leading edge of modern oceanography in Europe.
The network of observation buoys records continuously the physical, biological and chemical parameters of the Greek seas. These data are then transmitted to the operational center where they are sorted and fed into forecasting models. The ten stations providing atmospheric and sea data are presented in Table 8.2. The observation buoys are equipped with sensors that monitor:
Air-pressure
Air-temperature
Wind speed and direction
Wave height, period and direction
Sea surface salinity and temperature
Surface current speed and direction
Sea surface dissolved oxygen
Light attenuation with fluorescence
Salinity and temperature in depths 0-50 m
5th NATIONAL COMMUNICATION TO THE UNFCCC 254
Chlorophyll-A
Nutrients
Radioactivity
All the stations report data on air temperature and pressure, wind speed (mean and gust) and direction, as well as sea surface temperature, waves (significant and maximum height, direction) and current (speed and direction) data. These data are online available in the POSEIDON webpage (http://www.poseidon.hcmr.gr/) either as time series graphs or as text based format for the latest transmission.
Currently, there are five buoys (located in Athos, Lesvos, Mykonos, Santorini and Kalamata) capable to measure standard atmospheric and marine parameters up to 50 meters depth and two buoys equipped with extra sensors for recording a number of parameters up to 1000 meters depth. These multi-sensor buoys are located in Cretan Sea (E1M3A) and in Ionian Sea (close to Strofades island).
Concerning the future of the Poseidon system, among the main goals of POSEIDON-II project (2005-2008), which is funded by EFTA (75%) and Hellenic Ministry of National Economy (25%), are the following:
-The complete upgrade of the existing buoys with next generation atmospheric and oceanographic sensors and state of the art communication devices
-The extension of the network coverage to the Ionian Sea.
Table 8.6 Location of the buoys network of the POSEIDON System Name/Location SE of mount Athos Lesvos Skyros Saronikos Mykonos Santorini Kalamata Cretan sea (E1M3A) Pylos Zakynthos
Participation in the Euro-Argo Network
The HCMR has already submitted to the Ministry of Development the proposal and detailed implementation plan for the participation of Greece in the European component of the global ARGO network.
The EURO-ARGO network will constitute an important asset of the ARGO network. The ARGO network is a global network of autonomous instruments-drifting buoys- which can continuously measure, throughout their lifetime, important variables that characterize the ocean (column distribution of temperature, salinity, oxygen etc.) and report it, using satellite connections, to data gathering and processing centres.
The expected benefits in scientific and socioeconomic level include:
Use of measurements for scientific purposes (climate research)
5th NATIONAL COMMUNICATION TO THE UNFCCC 255
Data use for the operational oceanography in Greece (POSEIDON system), taking into consideration that these data also concern the Ionian sea. In any case, ARGO data will be systematically used (via the system for the assimilation of observation data) by the forecasting model for the Mediterranean Sea (which is part of the POSEIDON system).
Participation in the global/European programme concerning continuous observation of the ocean.
Participation in the decision making processes regarding the identification of the European strategy for measurements (esp. the locations covered).
The Greek team has not participated yet in the Argo network, in opposition to other countries that have an active role in the global buoy network. Greece, Bulgaria, Portugal and Poland are the newly-entered Parties in the measuring network and will focus on examining the possibility of continuous financing for their participation in the EURO-ARGO. More specifically the Greek team will:
examine the structural and legal structure of the EURO-ARGO (in cooperation with the other teams)
investigate the possibility of long-term national financing for the Greek participation
co-operate with the other teams for the configuration of the final implementation plan for the EURO-ARGO network.
Voluntary Observation Ships
As regards to voluntary observing ships, in general there are 18 ships cooperating with the HCMR, although their use is not organized on a regular basis. These ships cooperate with HCMR under the context of various programs. However, in the present there is no such program running.
8.3.2.3 The Hellenic Navy Hydrographic Service
The Mission of the Hellenic Navy Hydrographic Service is the collection, elaboration and utilization of the elements and information concerning the Greek and adjacent waters in the fields of Hydrography, Oceanography, Cartography and Navigation with the aim to:
(a) Support the operational requirements of the Hellenic Navy and the Hellenic Forces in general.
(b) Contribution to the safety of Navigation. Promotion on Hydrography, Oceanography, Cartography and other Marine sciences.
(c) Support, in case of request, of public services and private sector.
Responsibilities
The Hellenic Navy Hydrographic Service has the following responsibilities: (a) Rendering of elements and information for the operational requirements of the Hellenic
Navy and the Hellenic Forces in general.
(b) Hydrographic and oceanographic surveying, nautical charting and maritime works and studies as well as application of new research programs for the collection of elements and information.
5th NATIONAL COMMUNICATION TO THE UNFCCC 256
(c) Publication and distribution of nautical charts, special naval charts and nautical publications.
(d) Issue of Notices to Mariners for the updating of the charts and other nautical publications
(e) Issue and promulgation of Radio Navigational Warnings
(f) National co-ordinator in the international NAVTEX service for promulgation of Maritime Safety Information in co-operation with the ministry of Mercantile Marine/Joint Rescue Co-ordination Centre, the Hellenic Meteorological Service and the Hellenic Telecommunication Organization for the briefing of seamen in accordance with the GMDSS
(g) Designation of channels, safety anchorages, restricted areas, dangers to navigation as well as the way of their marking.
(h) Maritime study on the installation of lights, lighted or not lighted buoys, landmarks, mooring buoys and navigational radio-aids.
(i) Pronouncement over the determination of fore and back shore boundaries, terrestrial port zones, port works and installations of aquacultures (sea farms).
(j) installation of networks of permanent measuring stations for the collection of hydrographic, oceanographic and navigational information.
Hydrography and Operations Division
The mission of the division is: Performance of hydrographic, geodetic and topographic surveys for the collection of data
and other related information for the compilation and updating of nautical charts and publications.
Installation, control and maintenance of Hellenic tide gauges network.
More specifically the Division: 1. Plans and executes hydrographic surveys, geodetic and topographic projects that are
required for the compilation and updating of nautical charts, special nautical charts, sailing instructions for the Hellenic waters, list of lighthouses and other publications.
2. Executes hydrographic surveys, geodetic and topographic campaigns that are necessary to meet the demands of the Hellenic Navy, as well as of public and private companies for the compilation of bathymetric sheets and studies.
3. Installs controls and maintains the network of tide gauge stations measuring the sea level changes.
4. Executes special measurements for the control of arming systems in the Hellenic Navy vessels.
5. Elaborates technical specifications and watches the developments in the areas of Hydrography /Topology.
6. Materializes the operational requirements of various Administrations within the Hellenic Navy.
7. Participates in different national and international programs in order to support the growth of geosciences (Geodesy, Hydrography, Topography), such as:
5th NATIONAL COMMUNICATION TO THE UNFCCC 257
a. 2nd and 4th Seapower Symposium
b. GAVDOS Pilot Programme
The Hellenic Navy Hydrographic Service maintains a quite dense network of permanent tide gauge stations equipped with instruments for measuring sea surface temperature. In some locations tide data are observed for more than 20 years. Seven out of 21 stations of sea level measurements are equipped with a sensor for measure sea temperature, which permits the possibility of direct and wireless transmission of the measurements.
All the tide gauges have been connected by levelling with tide poles which located close to them and frequently supervised by the Service's personnel, cooperating with coast guard or port authorities.
Three stations provide data in the European Sea Level Service, whereas all 21 stations report completed historical data in the Permanent Service of Mean Sea Level.
8.3.2.4 National Contribution
In Tables 8.3a and 8.3b the total national contribution to oceanic essential climate variables are reported. The climate of Greece does not justify the participation in some networks (ie global tropical moored buoy network). In this case the relevant cells are shaded grey.
Table 8.7 National Contributions to oceanic essential climate variables - surface
Contributing networks
specified in the GCOS
implementation plan
ECVs
Number of stations or platforms currently operating
Number of stations or platforms
operating in accordance
with the GCMPs
Number of stations or platforms
expected to be
operating in 2010
Number of stations or platforms providing data to the
international data centres
Number of stations or platforms with
complete historical record available in international data
centres
Global surface drifting buoy array on 5x5 degree resolution
Sea surface temperature, sea level pressure, position-change-based current
0 N.A. 5 0 0
GLOSS Core sea-level framework
Sea level 21 N.A. 21 3 22
Voluntary observing ships (VOS)
All feasible surface ECVs 25 N.A. 25 0 0
Ship of opportunity programme
All feasible surface ECVs 0 N.A. 1 0 0
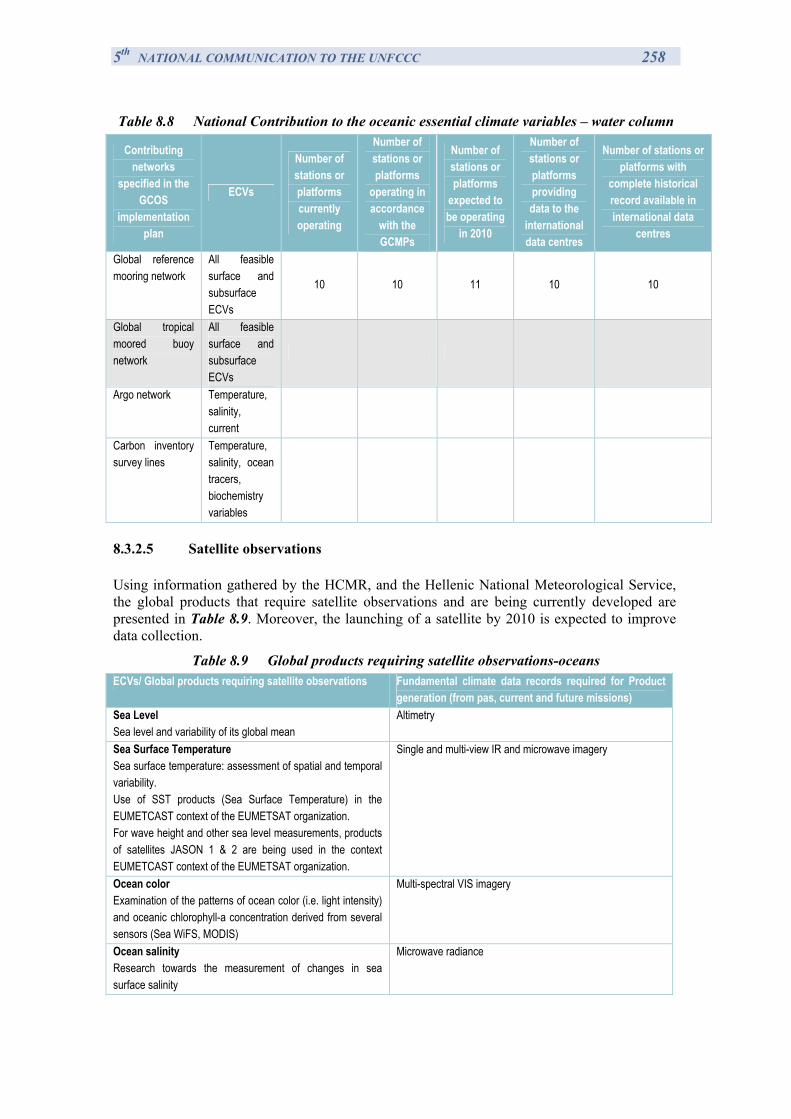
5th NATIONAL COMMUNICATION TO THE UNFCCC 258
Table 8.8 National Contribution to the oceanic essential climate variables – water column
Contributing networks
specified in the GCOS
implementation plan
ECVs
Number of stations or platforms currently operating
Number of stations or platforms
operating in accordance
with the GCMPs
Number of stations or platforms
expected to be operating
in 2010
Number of stations or platforms providing data to the
international data centres
Number of stations or platforms with
complete historical record available in international data
centres
Global reference mooring network
All feasible surface and subsurface ECVs
10 10 11 10 10
Global tropical moored buoy network
All feasible surface and subsurface ECVs
Argo network Temperature, salinity, current
Carbon inventory survey lines
Temperature, salinity, ocean tracers, biochemistry variables
8.3.2.5 Satellite observations
Using information gathered by the HCMR, and the Hellenic National Meteorological Service, the global products that require satellite observations and are being currently developed are presented in Table 8.9. Moreover, the launching of a satellite by 2010 is expected to improve data collection.
Table 8.9 Global products requiring satellite observations-oceans ECVs/ Global products requiring satellite observations Fundamental climate data records required for Product
generation (from pas, current and future missions) Sea Level Sea level and variability of its global mean
Altimetry
Sea Surface Temperature Sea surface temperature: assessment of spatial and temporal variability. Use of SST products (Sea Surface Temperature) in the EUMETCAST context of the EUMETSAT organization. For wave height and other sea level measurements, products of satellites JASON 1 & 2 are being used in the context EUMETCAST context of the EUMETSAT organization.
Single and multi-view IR and microwave imagery
Ocean color Examination of the patterns of ocean color (i.e. light intensity) and oceanic chlorophyll-a concentration derived from several sensors (Sea WiFS, MODIS)
Multi-spectral VIS imagery
Ocean salinity Research towards the measurement of changes in sea surface salinity
Microwave radiance
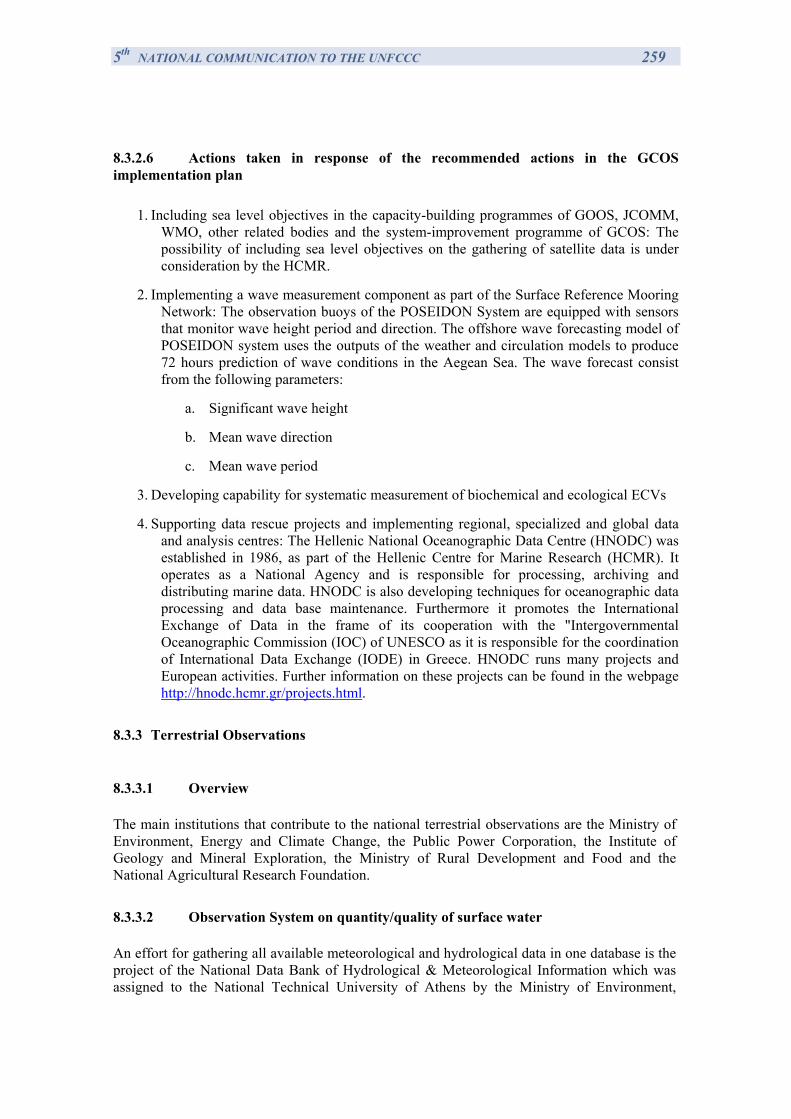
5th NATIONAL COMMUNICATION TO THE UNFCCC 259
8.3.2.6 Actions taken in response of the recommended actions in the GCOS implementation plan
1. Including sea level objectives in the capacity-building programmes of GOOS, JCOMM, WMO, other related bodies and the system-improvement programme of GCOS: The possibility of including sea level objectives on the gathering of satellite data is under consideration by the HCMR.
2. Implementing a wave measurement component as part of the Surface Reference Mooring Network: The observation buoys of the POSEIDON System are equipped with sensors that monitor wave height period and direction. The offshore wave forecasting model of POSEIDON system uses the outputs of the weather and circulation models to produce 72 hours prediction of wave conditions in the Aegean Sea. The wave forecast consist from the following parameters:
a. Significant wave height
b. Mean wave direction
c. Mean wave period
3. Developing capability for systematic measurement of biochemical and ecological ECVs
4. Supporting data rescue projects and implementing regional, specialized and global data and analysis centres: The Hellenic National Oceanographic Data Centre (HNODC) was established in 1986, as part of the Hellenic Centre for Marine Research (HCMR). It operates as a National Agency and is responsible for processing, archiving and distributing marine data. HNODC is also developing techniques for oceanographic data processing and data base maintenance. Furthermore it promotes the International Exchange of Data in the frame of its cooperation with the "Intergovernmental Oceanographic Commission (IOC) of UNESCO as it is responsible for the coordination of International Data Exchange (IODE) in Greece. HNODC runs many projects and European activities. Further information on these projects can be found in the webpage http://hnodc.hcmr.gr/projects.html.
8.3.3 Terrestrial Observations
8.3.3.1 Overview
The main institutions that contribute to the national terrestrial observations are the Ministry of Environment, Energy and Climate Change, the Public Power Corporation, the Institute of Geology and Mineral Exploration, the Ministry of Rural Development and Food and the National Agricultural Research Foundation.
8.3.3.2 Observation System on quantity/quality of surface water
An effort for gathering all available meteorological and hydrological data in one database is the project of the National Data Bank of Hydrological & Meteorological Information which was assigned to the National Technical University of Athens by the Ministry of Environment,
5th NATIONAL COMMUNICATION TO THE UNFCCC 260
Energy and Climate Change. This project provides the required infrastructure for the implementation of the E.U. Water Framework Directive for the protection, rational management and exploitation of the water resources in the national level.
The core of the project is the development of a Data Bank which will contain the total amount of hydrometeorological and hydrogeological data covering the whole country. The data are acquired from 1000 stations which are distributed in Greece and are placed by the participating organisations:
The Ministry of Environment, Energy and Climate Change
The National Meteorological Service
The Public Power Corporation
The Ministry of Rural Development and Food
The National Observatory of Athens
Various software applications are linked to the central Database of the project supporting thus the data entry, analysis and data processing. The distributed structure of the database allows a continuous online operation and exchange of data between the participating organisations.
Furthermore, the Ministry of Rural Development and Food and the Ministry of Environment, Energy and Climate Change, PPC and NAGREF operate an extended network of rainfall and snowfall gages. The network consists of more than 250 rain gages and more than 1000 tables to measure the height of snow. Furthermore, the Institute of Geology and Mineral Exploration (IGME) operates a large network of surface and ground water measurements.
Among these stations, only 47 hydrometric stations, supervised by PPC, meet international specifications so as to be able to contribute quality controlled data to the corresponding databases. The Ministry of Rural Development and Food also operates 220 stations for the measurement of surface water quantities. Of those, 120 (90 of which for river-stream flows and 30 for river water quality) operate during the whole year producing monthly measurements, and the rest operate only during the irrigation period. IGME has established a network of 27 stations (monitoring frequency one time per ten years as geological services of Greece proposed) for the observation of the quality of surface water as far as its chemical composition.
Finally, groundwater quality and quantity measurements are carried out by the Ministry of Rural Development and Food (250 stations mostly in rural areas, such as Thessalia, and by IGME (approximately 505 stations, which are placed in wells, springs and boreholes in 14 different areas with frequency monitoring 4 times per year). Several stations among them measure parameters related to water pollution such as ammonia, nitric and pH, mostly caused by agricultural activities.
8.3.3.3 Observation System on quantity/quality of ground
IGME in corporation with the other Geological Institutes of Europe (www.eurogeosurveys.org) have prepared the «Geochemical Atlas of Europe» using the Global Geochemical Baselines (a program of International Union of Geological Sciences, IUGS, and International Association of GeoChemistry, IAGC). In the framework of this program, the following stations operate in Greece:
41 stations for the observation of residual soil
5th NATIONAL COMMUNICATION TO THE UNFCCC 261
41 stations for the observation of floodplain sediments or alluvial soil of large catchment areas.
41 stations for the observation of overbank sediments or alluvial soil of small catchment areas.
Moreover, NAGREF operates three stations for the observation of ground temperature in two depths and another one is going to be established. The data from these stations are provided to the respective European Union services.
8.3.3.4 Forest ecosystem health observation
In the scope of the country’s participation in the International Co-operative Programme on Assessment and Monitoring of Air Pollution Effects on Forests, (ICP Forests) and the European Union Scheme for the Protection of Forests against Atmospheric Pollution, the Institute of Mediterranean Forestry Ecosystems and Forestry Products Technology of NAGREF has established in 1988 and operates since 91 observation stations of Level I and 7 of Level II. Of the 91 Level I stations, 75 have been placed in high canopy forests and in 16 in maquis areas to provide information on tree conditions. The Level II stations have been placed (4 in 1994 and 3 in 2004) in forest ecosystems of typical terrestrial and geological types aiming at the study of the relations between the ecological and physical parameters (meteorological characteristics, vegetation, soil, plant nutrition and air pollution) as they affect forest development.
8.3.3.5 CO2 flux measurements
A station for CO2 vertical flux measurements has been established and operated for a number of years in Kalamata by NAGREF, in the frame of the research project MEDFLUX of the European Commission. 8.3.3.6 National Contribution
In Table 8.10 the national contribution to the terrestrial domain essential climate variables is reported. 8.3.3.7 Satellite observations
Greece is a member of ESA and participates in basic, as well as in optional, research projects. Greece also participates in three actions of the Global Monitoring for Environment and Stability (GMES) program of ESA. In the framework of this program estimation of forest land change and of forest carbon reserves (GMS-Forest Monitoring) is performed.
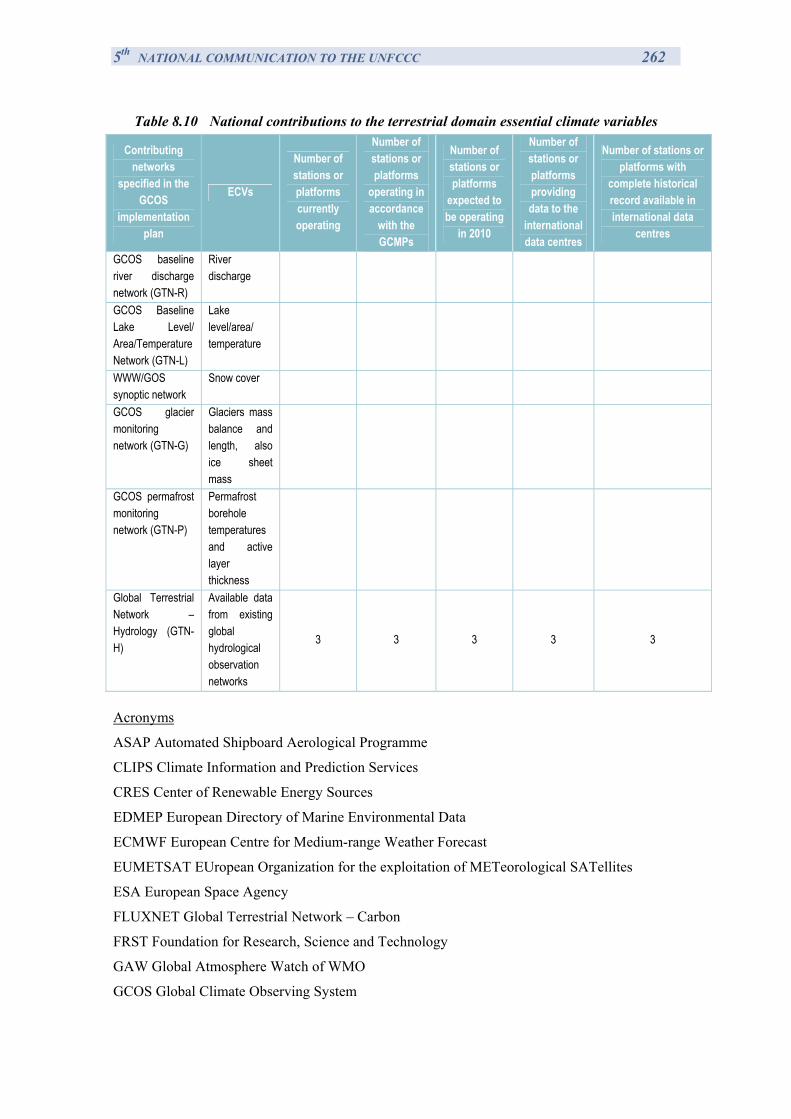
5th NATIONAL COMMUNICATION TO THE UNFCCC 262
Table 8.10 National contributions to the terrestrial domain essential climate variables
Contributing networks
specified in the GCOS
implementation plan
ECVs
Number of stations or platforms currently operating
Number of stations or platforms
operating in accordance
with the GCMPs
Number of stations or platforms
expected to be operating
in 2010
Number of stations or platforms providing data to the
international data centres
Number of stations or platforms with
complete historical record available in international data
centres
GCOS baseline river discharge network (GTN-R)
River discharge
GCOS Baseline Lake Level/ Area/Temperature Network (GTN-L)
Lake level/area/ temperature
WWW/GOS synoptic network
Snow cover
GCOS glacier monitoring network (GTN-G)
Glaciers mass balance and length, also ice sheet mass
GCOS permafrost monitoring network (GTN-P)
Permafrost borehole temperatures and active layer thickness
Global Terrestrial Network – Hydrology (GTN-H)
Available data from existing global hydrological observation networks
3 3 3 3 3
Acronyms
ASAP Automated Shipboard Aerological Programme
CLIPS Climate Information and Prediction Services
CRES Center of Renewable Energy Sources
EDMEP European Directory of Marine Environmental Data
ECMWF European Centre for Medium-range Weather Forecast
EUMETSAT EUropean Organization for the exploitation of METeorological SATellites
ESA European Space Agency
FLUXNET Global Terrestrial Network – Carbon
FRST Foundation for Research, Science and Technology
GAW Global Atmosphere Watch of WMO
GCOS Global Climate Observing System
5th NATIONAL COMMUNICATION TO THE UNFCCC 263
GMES Global Monitoring of Environment and Security
GMS Geostationary Meteorological Satellite
GOOS Global Ocean Observing System
GSN GCOS Surface Network
GSRT General Secretariat for Research and Technology
GTN-G Global Terrestrial Network – Glaciers
GTN-L Global Terrestrial Network – Lakes
GTN-P Global Terrestrial Network – Permafrost
GTN-R Global Terrestrial Network – Rivers
GTOS Global Terrestrial Observation System
GUAN GCOS Upper Air Network
HCMR Hellenic Centre for Marine Research
HNHS Hellenic Navy Hydrographic Service
HNMS Hellenic National Meteorological Service
HNODC Hellenic National Oceanographic Data Center
IGME Institute of Geology and Mineral Exploration
IOC Intergovernmental Oceanographic Commission of UNESCO
LCDB Land Cover Data Base
LTER Long Term Ecological Research
MAMA Mediterranean network to Assess and upgrade Monitoring and forecasting Activity
MEDATLAS Mediterranean Hydrographic Atlas
MedGOOS Ocean Observing System for the Mediterranean
MEECC Ministry of Environment, Energy and Climate Change
MFSPP Mediterranean Forecasting System Pilot Project
MFSTEP Mediterranean Forecasting Systems Towards Environmental Predictions
NAGREF National Agricultural Research Foundation
NOA National Observatory of Athens
ΝΟΑΑ National Oceanographic and Atmospheric Agency (USA)
NSA NIWA SST Archive
NCSR National Centre of Scientific Research "DEMOKRITOS"
NTUA National Technical University of Athens
NVS National Vegetation System
PPC Public Power Corporation
SFC Surface
SOOP Ship of Opportunity Programme
SST Sea Surface Temperature
5th NATIONAL COMMUNICATION TO THE UNFCCC 264
Sub-SFC Sub-surface
TIROS Television Infrared Observation Satellite
TOMS Total Ozone Mapping Spectrometer
UNEP United Nations Environment Programme
UNESCO United Nations Educational, Scientific and Cultural Organization
VOS Volunteer Observing Ship
WCRP World Climate Research Programme
WHYCOS World Hydrological Cycle Observing System
WMO World Meteorological Organization
WWW World Weather Watch of WMO
5th NATIONAL COMMUNICATION TO THE UNFCCC 265
CHAPTER 9 EDUCATION, TRAINING AND PUBLIC AWARENESS
It is generally acknowledged that combating climate change will be a success only if the danger is widely known and understood by the public and especially by those who have to undertake mitigation and adaptation measures. This can be accomplished with intensive education, awareness and training efforts at all levels.
For this purpose, as part of the programme for the implementation of the Convention and the New Delhi Programme, and the relevant provisions of the Kyoto Protocol, Greece has carried out a series of actions, which are presented below, aiming at the integration of climate change issues at all educational levels and disciplines, the dissemination of information and promotion of participation of youth, stakeholders, and public, as well as the enhancement of cooperation and co-ordination at regional and international level to promote capacity building.
9.1 General policy towards education, training and public awareness
According to Law 1982/90 article 11 par 13, the Environmental Education is part of the programs of secondary schools. A year later, the law extends to primary education. The purpose of Environmental Education is to make pupils realise the relationship between man and the natural and social environment, to raise awareness about the problems associated with it and to engage them in specific projects in order to contribute to the overall effort to address these problems. The same law provides for the operation of the institution of the Responsible for environmental education and the establishment of Environmental Education Centers (EEC). The Educational Institute, with the Unified Cross Curriculum Framework (DEPPS), introduces the interdisciplinary approach to knowledge, the enrichment of curriculum with environmental issues and the link of the school with society. In the configuration of this framework, the pilot implementation of the "Flexible Zone" programme is included, where the Environmental Education takes its own time to the curricula of schools for teachers and students who want to link Environmental Education with natural, humanitarian and socio-economic sciences through exploratory cross-cutting approaches. The themes of the Environmental Education stems from the necessity of protecting the natural, historical and social environment, through the enhancement of critical issues in accordance with local, national and global priorities, such as those made at the Summit on Environment and Development (Agenda 21, Rio De Janeiro 1992). As key priorities are proposed:
Climate change - Protection of the atmosphere The air (air pollution in cities, etc.) Water (pollution and depletion of surface and groundwater, etc.) The soil (desertification, erosion, etc.) Energy (depletion of non renewable energy sources, overexploitation of natural
resources etc.) Forests (protection and sustainable management of forests, etc.) Biodiversity / Extinction of species Waste management Human activities (structured spaces and the functions performed in those in urban and
suburban green etc.) Human relations (social and economic dimensions of development and environmental
issues, gender equality, human values, the problems of minorities, etc.)
5th NATIONAL COMMUNICATION TO THE UNFCCC 266
Access of environmental information to the public is provided through the websites of the relevant Ministries and other governmental agencies. With the ratification of the Aarhus Convention by Law 3422/2005, Greece has posed legal obligations for the access of information regarding the state of the Environment. In addition, JMD 11764/653/2006 by which Greece incorporated the Directive 2003/4/EC on “public access to environmental information” into national legislation, seeks to increase public access and dissemination of information, contributing to a greater public awareness in decision making and environmental protection. According to this joint ministerial decision, “environmental information” includes information related to climate change such as : state of elements (among others air, atmosphere, water, coastal areas, biological diversity, and the interactions among them), factors (e.g emissions, energy), policies and measures, reports, cost-benefit analyses. The Greek Government gives high priority to public consultation and awareness. Draft legislation related to climate change, energy and environmental issues are open to public consultation before their adoption. A circular dated 1-12-2009 (No 7156) by the Minister of Environment, Energy and Climate Change reminds to the Ministry’s services the obligation to conform with the above legislation, and to enhance their actions to ensure the dissemination and easy public access to the information. 9.2 Education
9.2.1 The structure of the education system
Education in Greece is compulsory for all children 6-15 years old; namely, it includes Primary and Lower Secondary Education. The school life of the students, however, can start from the age of 2.5 years (pre-school education) in appropriate institutions (private and public) (creches). In some creches there are also nursery classes which operate along with the kindergartens.
Attendance at Primary Education lasts for six years, and children are admitted at the age of 6. Along with the regular kindergartens and the Primary schools, all-day primary schools are in operation, with an extended timetable and an enriched curriculum.
Post-compulsory Secondary Education, according to the reform of 1997, consists of two school types: Unified Upper Secondary Schools and the Technical Vocational Educational Schools. The duration of studies in the first is three years and two years (a' level) or three years (b' level) in the Technical Vocational Educational Schools (TEE). Mutual student transfer from one type of school to the other is possible.
Along with the mainstream schools of Primary and Secondary Education, Special Kindergartens, Primary, Lower Secondary and Upper Secondary classes are in operation, which admit students with special educational needs. Musical, Ecclesiastical and Physical Education Lower and Higher Secondary education schools are also in operation.
Post-compulsory Secondary Education also includes the Vocational Training Institutes (IEK) , which provide formal but unclassified level of education. These Institutes are not classified as an educational level, because they accept both lower secondary school and upper secondary school graduates according to the relevant specializations they provide.
Public higher education is divided into Universities and Technological Education Institutes. Students are admitted to these Institutes according to their performance at national level examinations taking place at the third grade of upper secondary education schools. Additionally, students are admitted to the Hellenic Open University upon the completion of the 22 year of age by drawing lots.
5th NATIONAL COMMUNICATION TO THE UNFCCC 267
9.2.2 School education
The environmental education has been considered a priority in the Greek educational system as early as the beginning of 1980’s. In the Greek schools it is implemented in three forms:
(a) Standard environmental education that is included in the school programmes. In the first 4 classes of primary school (ages 6-10) a special course named “Study of the Environment” is focused on natural and human environment, while environmental issues are also included in the material of other courses of the primary and secondary school (mainly physics, biology and chemistry). In addition, in all the school courses the development of conscious environmental behaviour is set out explicitly as an aim (for instance the Geography book of the 6th grade includes chapters that are dedicated to the climatic zones, the natural disasters and the effect of human activities on the terrestrial surface, while in the 5th grade pupils are well introduced to the natural geography and ecology of the country).
(b) Optional activities include the study of special environmental issues, usually from the school natural or social environment. These activities are on a voluntary basis and do not belong to the obligatory programme of school courses. They might include long-term (i.e. homework) or short-term (i.e. environmental visits) organised studies with the support of central or local educational authorities. The long-term activities (5th grade of Primary School-age of 10) are usually implemented through the formation of environmental teams of students that undertake, under the supervision of one or more teachers, the study of a concrete issue.
(c) Informal activities that reflect the environmental culture of each concrete school and of the school environment.
9.2.2.1 Ministry of Education, Lifelong Learning and Religious Affairs (M.E.)
The Ministry of Education, Lifelong Learning and Religious Affairs (M.E.) published in October 2007 and in October 2009 two circulars regarding the Planning and Implementation of School Activities Programmes including, among others, the environmental education for the school years 2007-2008 and 2009-2010 respectively.
The first circular was mostly focused on forests, that has been considered as a crucial issue after the catastrophic fires of 2007. The main axes in the school activities programmes were:
1. Forest and terrestrial ecosystems
2. Forest and water resources
3. Forest and human activity
4. Protection of forests
5. Forest and quality of life
6. Forest and human health
7. Forest and culture
5th NATIONAL COMMUNICATION TO THE UNFCCC 268
The most recent circular (this of 2009) includes the following special issues of environmental education:
1. Management of natural resources
2. Conservation of natural environment
3. Environmental degradation
4. Environmental hazards
5. Space, spatial management and use
6. Human environment – parameters and degradation
7. Quality of life
The issue of climate change is especially treated in the Environmental Hazards category, while other categories include various aspects of climate change (ie. forests, energy, renewable energy sources, biodiversity and endangered species etc).
Both circulars provide the necessary information for supporting the planning of school activities, while all the proposals are submitted to the local Educational Directorates in order to approve their financing.
Under the M.E., the Educational Institute of Greece is providing substantial guidance on environmental education to teachers. In the respective website, entitled “Environmental Education”, the Institute suggests specific projects of environmental issues that could be applied by teachers regarding the climate, the forests and the energy forms (http://www.pi-schools.gr/perivalontiki/). In addition the ministry has published guides addressing to the teachers with regards to environmental education. Some of them are:
Melas D, Asonitis G. & Amoiridis B., Climate change – Guide for teachers, Ministry of National Education, Athens 2000
The book consists of three main chapters in which guidance is given for the education on the understanding of the climate system (Greenhouse effect, Greenhouse gases etc), the impacts of climate change (extreme events, sea level rise, water resources, biodiversity etc.) and adaptation to climate change (new circumstances, energy technology and policy, the UN convention on climate change etc.). The book addresses to teachers of both the Primary and the Secondary education.
Fermeli G., Roussomoustakaki-Theodoraki M., Chatzikosta Kl., Gaidlich M., Development guide of environmental educational activities, Athens 2008
The book consists of two parts. The first part addresses the theoretical approach to the environmental education and includes a section dedicated to “Air, Atmosphere, Climate Change”. In the second part of the guide, practical and laboratorial activities are suggested to help the comprehension by the students. Special attention has been given to the measures that have been adopted to reduce GHG emissions and their impacts to the everyday life and to biodiversity.
A. Programmes of Environmental Education
During the school year 2008-2009, 15 programmes were implemented in the Directorates of Secondary Education by 389 students and 34 teachers. These programmes are presented in Table 9.1.
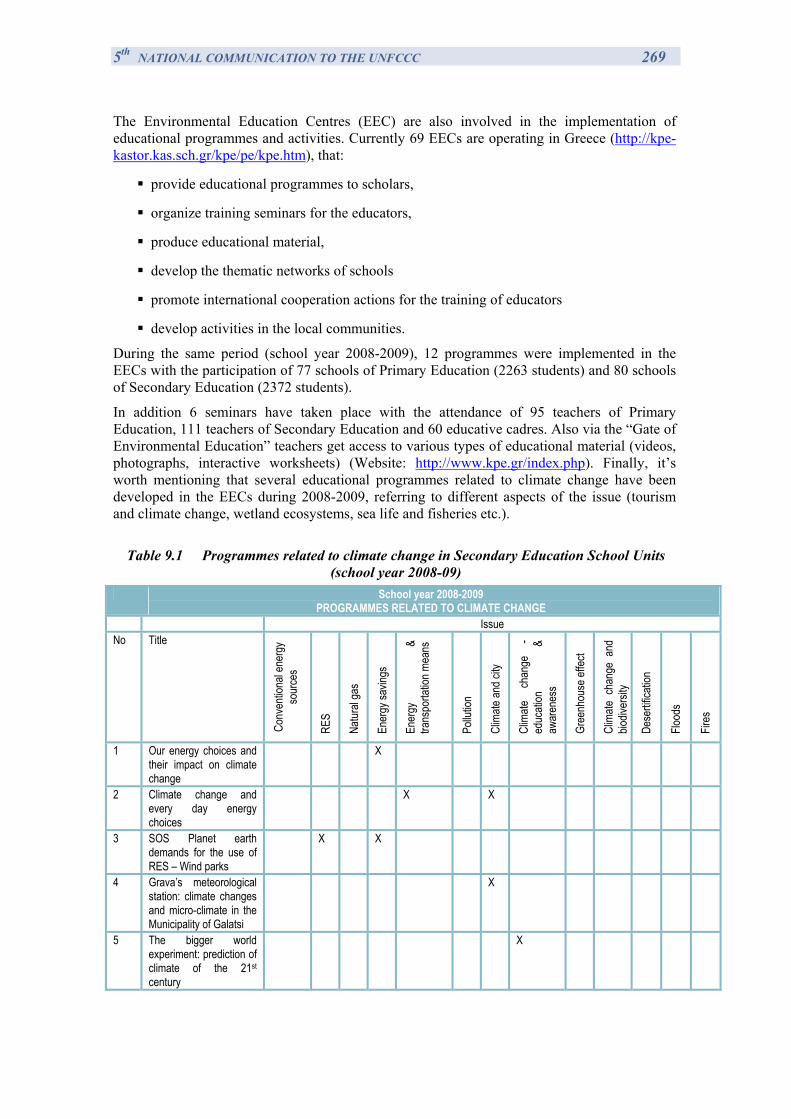
5th NATIONAL COMMUNICATION TO THE UNFCCC 269
The Environmental Education Centres (EEC) are also involved in the implementation of educational programmes and activities. Currently 69 EECs are operating in Greece (http://kpe-kastor.kas.sch.gr/kpe/pe/kpe.htm), that:
provide educational programmes to scholars,
organize training seminars for the educators,
produce educational material,
develop the thematic networks of schools
promote international cooperation actions for the training of educators
develop activities in the local communities.
During the same period (school year 2008-2009), 12 programmes were implemented in the EECs with the participation of 77 schools of Primary Education (2263 students) and 80 schools of Secondary Education (2372 students).
In addition 6 seminars have taken place with the attendance of 95 teachers of Primary Education, 111 teachers of Secondary Education and 60 educative cadres. Also via the “Gate of Environmental Education” teachers get access to various types of educational material (videos, photographs, interactive worksheets) (Website: http://www.kpe.gr/index.php). Finally, it’s worth mentioning that several educational programmes related to climate change have been developed in the EECs during 2008-2009, referring to different aspects of the issue (tourism and climate change, wetland ecosystems, sea life and fisheries etc.).
Table 9.1 Programmes related to climate change in Secondary Education School Units
(school year 2008-09) School year 2008-2009
PROGRAMMES RELATED TO CLIMATE CHANGE Issue No Title
Conv
entio
nal e
nerg
y so
urce
s
RES
Natur
al ga
s
Ener
gy sa
vings
Ener
gy
& tra
nspo
rtatio
n mea
ns
Pollu
tion
Clim
ate an
d city
Clim
ate
chan
ge
- ed
ucati
on
& aw
aren
ess
Gree
nhou
se ef
fect
Clim
ate c
hang
e an
d bio
diver
sity
Dese
rtifica
tion
Flood
s
Fires
1 Our energy choices and their impact on climate change
X
2 Climate change and every day energy choices
X X
3 SOS Planet earth demands for the use of RES – Wind parks
X X
4 Grava’s meteorological station: climate changes and micro-climate in the Municipality of Galatsi
X
5 The bigger world experiment: prediction of climate of the 21st century
X
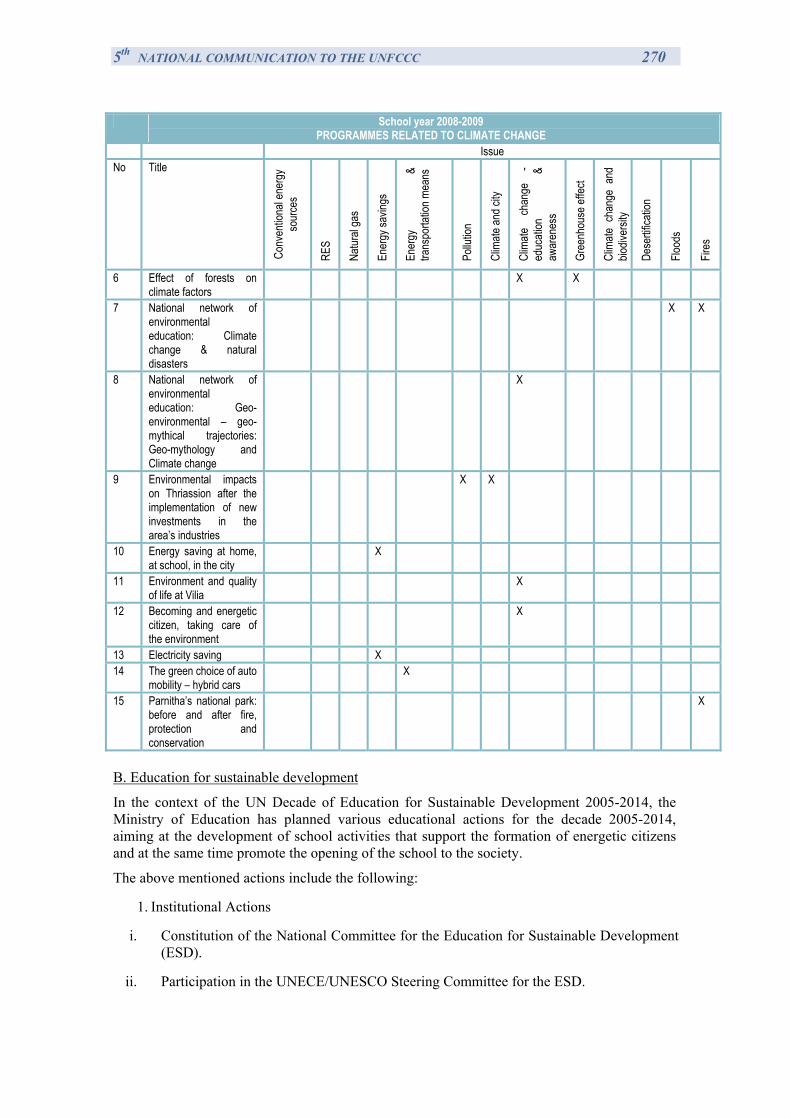
5th NATIONAL COMMUNICATION TO THE UNFCCC 270
School year 2008-2009 PROGRAMMES RELATED TO CLIMATE CHANGE
Issue No Title
Conv
entio
nal e
nerg
y so
urce
s
RES
Natur
al ga
s
Ener
gy sa
vings
Ener
gy
& tra
nspo
rtatio
n mea
ns
Pollu
tion
Clim
ate an
d city
Clim
ate
chan
ge
- ed
ucati
on
& aw
aren
ess
Gree
nhou
se ef
fect
Clim
ate c
hang
e an
d bio
diver
sity
Dese
rtifica
tion
Flood
s
Fires
6 Effect of forests on climate factors
X X
7 National network of environmental education: Climate change & natural disasters
X X
8 National network of environmental education: Geo-environmental – geo-mythical trajectories: Geo-mythology and Climate change
X
9 Environmental impacts on Thriassion after the implementation of new investments in the area’s industries
X X
10 Energy saving at home, at school, in the city
X
11 Environment and quality of life at Vilia
X
12 Becoming and energetic citizen, taking care of the environment
X
13 Electricity saving X 14 The green choice of auto
mobility – hybrid cars X
15 Parnitha’s national park: before and after fire, protection and conservation
X
B. Education for sustainable development
In the context of the UN Decade of Education for Sustainable Development 2005-2014, the Ministry of Education has planned various educational actions for the decade 2005-2014, aiming at the development of school activities that support the formation of energetic citizens and at the same time promote the opening of the school to the society.
The above mentioned actions include the following:
1. Institutional Actions
i. Constitution of the National Committee for the Education for Sustainable Development (ESD).
ii. Participation in the UNECE/UNESCO Steering Committee for the ESD.
5th NATIONAL COMMUNICATION TO THE UNFCCC 271
iii. Identification of the national strategy for ESD, on the basis of international strategies – recording of indexes
iv. Introduction of the “Thematic Years” institution. In specific, each year has been dedicated to a specific issue as follows:
2006: Water – Blue Planet 2007: Consumerism & Environment 2008: Forest – Green Planet 2009: Agriculture, Alimentation & Life Quality 2010: Energy – Renewable Energy Sources & Local Communities 2011: Education over Human Rights 2012: Health and Productive Activities 2013: Human Environment & Sustainable Management 2014: Energetic Citizens It should be noted that especially for the current school year (2009-2010) [Energy – Renewable Energy Sources & Local Communities], the Ministry has already suggested the thematic axis of educational activities. In particular the main axes are four, including the “Energy and climate change” axis.
2. Exploitation and development of administrative educational structures
i. Development of the national network of Environmental Education Centres
ii. Support of coordinators per administrative structure at a national level: teachers/ responsible persons for the Environmental Education per prefecture and educational level.
3. Training
i. Education/Training of teachers
For each thematic year training seminars are taking place in the EECs. The seminars are referring to the particular subject of the year (in 2006-2007 this was Consumerism & Environment, in 2007-2008 Forests and in 2008-2009 Agriculture, Alimentation and Life Quality). At national level, additional training of the teachers included:
a. Organisation of an action entitled “Seminars 2005-2006” that addressed to the pedagogic units of the EECs and to the responsible for environmental education: Ten (10) centralized seminars were organized with the participation of 400 teachers. The seminars referred to the training over sustainability and environmental education, the methodological issues and teaching approaches, suggestive educational material and co operational actions as well as to the environmental education at a local level.
b. Training of teachers on issues of education and sustainable development. In the context of the Operational Programme “Education and Initial Professional Training” the NTUA has trained 12000 educators in the period 2007-2008.
ii. Development of e-learning programmes
4. Awareness
i. 6000 school activity programmes per year
ii. National, regional and local thematic networks of school activities (Biodiversity, energy, rivers etc.)
5th NATIONAL COMMUNICATION TO THE UNFCCC 272
iii. Production of educational material at a regional and a national level.
iv. Pilot regional programmes
v. Cooperation activities with public institutions (ministries, secretariats, Centre for Renewable Energy Sources and Savings etc.), universities, NGOs (Hellenic Association for the Protection of Nature, WWF, Mom etc.), local communities.
5. Horizontal actions
Organization and coordination of school thematic activities and events at a national level (i.e. school competitions for recycling, conjectural laboratories of the thematic year, informational activities for climate change). Especially for climate change a competition for the writing of the best essay took place in the school year 2006-2007.
6. International actions of coordination and Promotion
1 Official opening of the UN Decade for Sustainable Development in the Mediterranean, 2005.
2 Presentation of the Greek example in the International Congresses of Environmental Education (3rd World Environmental Education Congress, 2005, 4th WEEC 2007).
7. Publication of the Scientific Journal of EECs
C. Other Environmental Education Activities
School Programmes of Environmental Education. The project has been implemented in the period 2002-2006 by the University of the Aegean. It involved the application of 4725 “School Programs for Environmental Education” to a substantial sample of school units all over the country with the participation of a large number of educators (approximately 14,000) and pupils (approximately 160,000) of primary and secondary education. The budget was 13.100.000.000 €, with a national contribution of 25%. It is worth mentioning that the project has been included in the Best Practices of the Community Support Framework in Greece (http://www.hellaskps.gr/bestpractices/proj_en.asp?pId=76).
The School Programmes of Environmental Education continue to be implemented in Greece, including the programmes that have been described above (circulars published by the M.E.).
National Thematic Networks of Environmental Education 2005-2009. Every national network consists of 120 schools, while Regional School Networks are operating for the coordination of more than 300 schools on particular issues. The developed actions that are related to climate change are presented in Table 9.2.
Pilot and experimental programme regarding recycling. The programme is operating in the Prefecture of Attica (500 schools) and in the Prefecture of Central Macedonia via the four EECs of the area (each EEC is coordinating 50 school units).
Finally the M.E., in cooperation with the Centre of Educational Research, is updating and creating a new software of environmental education, based on the material that has been elaaborated in the context of the Operational Programme “Education and Initial Professional Training”.
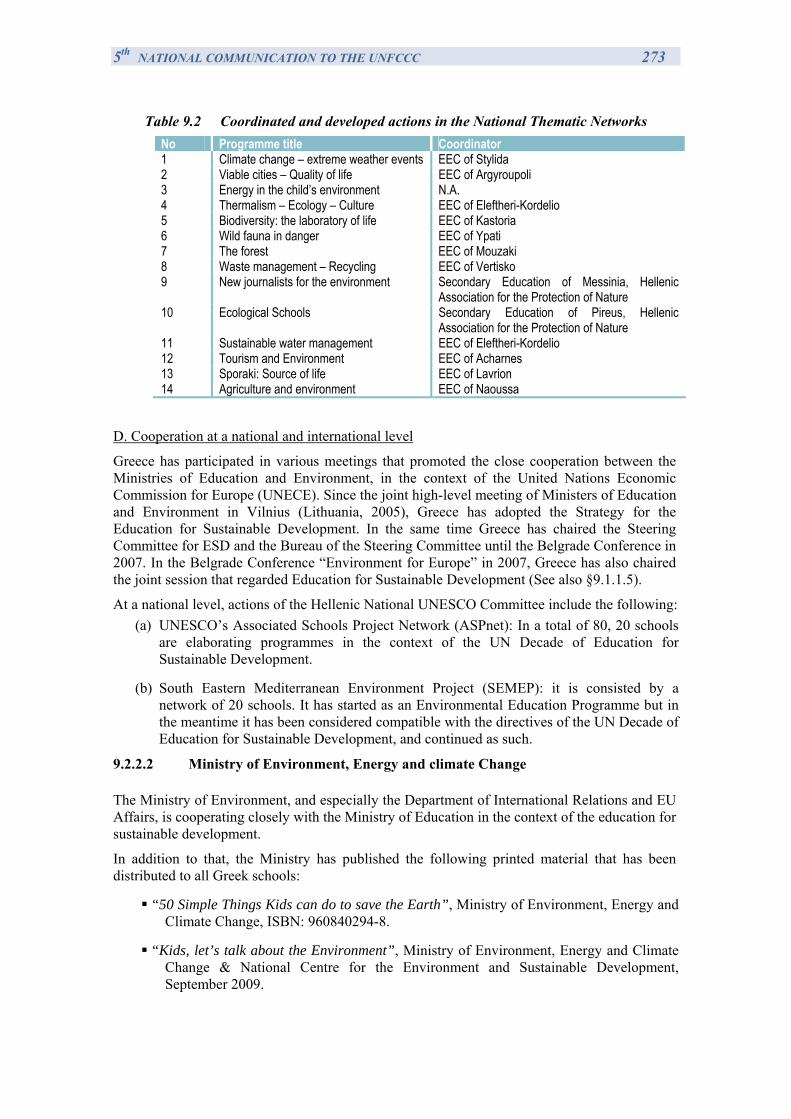
5th NATIONAL COMMUNICATION TO THE UNFCCC 273
Table 9.2 Coordinated and developed actions in the National Thematic Networks No Programme title Coordinator 1 Climate change – extreme weather events EEC of Stylida 2 Viable cities – Quality of life EEC of Argyroupoli 3 Energy in the child’s environment N.A. 4 Thermalism – Ecology – Culture EEC of Eleftheri-Kordelio 5 Biodiversity: the laboratory of life EEC of Kastoria 6 Wild fauna in danger EEC of Ypati 7 The forest EEC of Mouzaki 8 Waste management – Recycling EEC of Vertisko 9 New journalists for the environment Secondary Education of Messinia, Hellenic
Association for the Protection of Nature 10 Ecological Schools Secondary Education of Pireus, Hellenic
Association for the Protection of Nature 11 Sustainable water management EEC of Eleftheri-Kordelio 12 Tourism and Environment EEC of Acharnes 13 Sporaki: Source of life EEC of Lavrion 14 Agriculture and environment EEC of Naoussa
D. Cooperation at a national and international level
Greece has participated in various meetings that promoted the close cooperation between the Ministries of Education and Environment, in the context of the United Nations Economic Commission for Europe (UNECE). Since the joint high-level meeting of Ministers of Education and Environment in Vilnius (Lithuania, 2005), Greece has adopted the Strategy for the Education for Sustainable Development. In the same time Greece has chaired the Steering Committee for ESD and the Bureau of the Steering Committee until the Belgrade Conference in 2007. In the Belgrade Conference “Environment for Europe” in 2007, Greece has also chaired the joint session that regarded Education for Sustainable Development (See also §9.1.1.5).
At a national level, actions of the Hellenic National UNESCO Committee include the following: (a) UNESCO’s Associated Schools Project Network (ASPnet): In a total of 80, 20 schools
are elaborating programmes in the context of the UN Decade of Education for Sustainable Development.
(b) South Eastern Mediterranean Environment Project (SEMEP): it is consisted by a network of 20 schools. It has started as an Environmental Education Programme but in the meantime it has been considered compatible with the directives of the UN Decade of Education for Sustainable Development, and continued as such.
9.2.2.2 Ministry of Environment, Energy and climate Change
The Ministry of Environment, and especially the Department of International Relations and EU Affairs, is cooperating closely with the Ministry of Education in the context of the education for sustainable development.
In addition to that, the Ministry has published the following printed material that has been distributed to all Greek schools:
“50 Simple Things Kids can do to save the Earth”, Ministry of Environment, Energy and Climate Change, ISBN: 960840294-8.
“Kids, let’s talk about the Environment”, Ministry of Environment, Energy and Climate Change & National Centre for the Environment and Sustainable Development, September 2009.
5th NATIONAL COMMUNICATION TO THE UNFCCC 274
9.2.2.3 Hellenic Association of Teachers for Environmental Education
The Hellenic Association of Teachers for Environmental Education (HATEE) has been established in 1992, and since then it aims at the mutual support, the exchange of views and the coordination between teachers within the framework of environmental education activities. HATEE is a scientific non profit organization with a memorandum of association officially recognized by the Court of First Instance of Athens, which foresees the operation of branches in the greater regions of Greece (see also http://www.peekpe.gr/katastatiko.htm). Its members are teachers from all educational stages who are involved in environmental education activities. The objectives of HATEE are the following:
Communication and collaboration between teachers who deal with environmental education
Exchange of information and experiences between teachers in Greece and abroad
Promotion and support of environmental education programmes in schools
Support of the Environmental Education Centres
Studies, research activities and planning dealing with environmental problems in Greece
HATEE has organized conferences, workshops, meetings and seminars on issues related to environmental education. In specific, in November 2007 the 3rd Hellenic Seminar on Environmental Education has been held by the HATEE regarding the “Education for the Sustainability and Environmental Education: Society – Economy – Environment – Civilization” (http://www.peekpe.gr/Syn3.htm), followed by the 4th Hellenic Seminar on Environmental Education in December 2008 (http://www.peekpe.gr/Syn4.htm). There is an increasing specialization of presentations given on issues such as climate change within the framework of HATEE activities, reflecting the intensifying knowledge requirements posed by environmental education on these technical issues. Also, the website of the HATEE provides a special area for further suggestions for school activities, including the climate change issue approach.
9.2.2.4 Non-governmental organizations
A substantial number of environmental non-governmental organisations (NGOs) are active on environmental education issues, promoting at the same time awareness on specific environmental issues. For instance, there are ‘thematic’ NGOs such as the Sea Turtle Protection Society of Greece ARCHELON, the Hellenic Society for the Study and Protection of the Monk Seal MOm and the Hellenic Ornithology Society, ‘inter-sectoral’ NGOs such as the Greek Association for the Protection of the Environment and Cultural Heritage (EEPECH), Greenpeace and WWF, as well as institutions of international cooperation between NGOs, such as the Mediterranean Information Office for the Environment, Culture and Sustainable Development (MIO-ECSDE) and the Mediterranean Network SOS.
One of the most active NGOs in Greece is the Hellenic Society for the Protection of Nature (HSPN), with more than 50 years of action, which focuses a large part of its activity on environmental education, developing and supporting networks of schools and student groups (see http://www.eepf.gr/). The HSPN has been active in international and national networks of environmental education, in which almost a million of students and tens of thousands educators
5th NATIONAL COMMUNICATION TO THE UNFCCC 275
are participating. Environmental education is being implemented via six integrated Programmes:
“Ecological schools”
“New journalists for the environment”
“Nature without rubbish”
“Green corners in my neighbourhood”
“I learn about forests”
“Our friends, storks!”
Some of the above programmes are internationally coordinated by the Foundation for Environmental Education (FEE). In July 2007, 1321 schools were participating in the above mentioned programmes.
In particular the “ecological schools” programme is related to energy, water and waste issues and includes the connection between the environmental education and the analytical official school schedule. Up to February 2009 (1-2-2009) 417 Greek schools have participated in the programme. Also, in the context of the “New journalists for the environment” programme, secondary education students are asked to participate in a simulated news agency that deals with environmental issues, such as waste, water, energy, coasts, cities and agriculture.
WWF has also worked extensively on environmental education, with actions that are specifically referring to climate change. In the webpage of the institution material can be found on the basis of the school education level (primary, secondary etc). In addition to the above, integrated programmes are offered to schools, namely the “Climate: it’s up to you” or the “Schools for the Climate” and the “Climate Chaos” that suggest particular activities via computerised material (cd roms). Seminars are also organised by the organization aiming at the training of educators over the above mentioned programmes. A list of the available school material can be found in the website of the organisation (http://www.wwf.gr).
The Mediterranean Network SOS is also active on the environmental education area. The school programmes performed aim at the information and awareness of students, the organisation of student competitions and exhibitions and the training of educators and teachers, with various activities being concentrated on the climate change issue (i.e. literary competition “Climate changes, our world changes. Do we change?” – 2008, competition for climate change advertising campaign – 2008).
The MedSOS network is also responsible for the implementation of the educational programme “Action for climate” in the period 2009-2010, which is supported by the corporate social responsibility programme “Our home our planet” of RECKITT BECKINSER. The campaign has been initiated in the summer of 2007 and the first implementation stage will be completed in 2009-2010. Several public information events and educational programmes have been implemented in 8 central cities of Greece: Athens, Thessaloniki, Patra, Bolos, Chania, Heraklio, Nafplio and Syros. Up to June 2008 12,000 students of primary and secondary education schools have attended about 250 presentations, while 15,000 citizens have received information via special meetings.
9.2.2.5 The MEdIES programme
Since the WSSD in 2002, Greece has been very active on promoting Education for Sustainable Development (ESD), also encompassing climate change issues, on the regional and
5th NATIONAL COMMUNICATION TO THE UNFCCC 276
international levels. Greece launched in the WSSD and is leading the implementation of the Mediterranean Educational Initiative for Environment & Sustainability - MEdIES. MEdIES is a Type II Initiative on ESD, supported financially by the Hellenic Ministry of Environment and officially approved by the Hellenic Ministry of Education. Leading partners are also MIO-ECSDE together with UNEP/MAP and UNESCO. Its confirmed partners include several Ministries of Environment, Universities, IGOs and NGOs as well as schools.
MEdIES aims to facilitate the educational community -educators and students- of the Mediterranean to contribute in a systematic and concrete way to the implementation of Agenda 21 and the Millennium Development Goals, through the application of innovative Educational Programmes for Environmental Education and ESD, addressing mainly water issues as well as other related aspects such as waste, consumption and production patterns and climate change with emphasis on adaptation.
The core of this initiative is an e-network of Educators who implement the common integrated educational programmes, in countries around the Mediterranean basin, on cross-cutting themes that are used as a vehicle to approach sustainable development. The Scope of MEdIES is pursued through concrete activities such as: Publications & educational material, Training seminars, and the use and promotion of Information & Communication Technologies (ICTs) though its interactive webpage (www.medies.net ).
Examples of concrete activities, in the field, implemented in the context of MEdIES since 2002, that are related to climate change, with funding, inter alia, from the Hellenic Ministry of Environment, include indicatively:
(a) Educational projects in schools on energy and climate change topics based on the MEdIES educational materials:
a. Water in the Mediterranean (Water, energy & industries; Let's make a water mill; Dams; Hydroelectric plant)
b. The YouthXchange Guide (sustainable consumption and sustainable lifestyles; means of transport; CO2 emissions; climate change, etc.).
c. Waste in our life (waste disposal and management, Bio-gas production, Recycle)
d. The Mediterranean food (The environmental impact of our eating choices: From field to fork; Sustainable practices in food processing & production; Sustainable patterns of agriculture; Sustainable patterns in cooking).
(b) Experiential Workshops for educators on the theme of climate change:
a. “Using movies & films within ESD, based on Al Gore's film on climate change entitled ‘An inconvenient truth”;
b. “Experiential educational activities about Transportations – Consumption - Energy Footprint”.
The workshops took place within a Seminar organized by the Environmental Education Centre (EEC) of Amfissa-Greece. (Training seminar on the topic of Climate Change & the Environment, organized by the Environmental Education Centre (EEC) of Amfissa, on 27-29 March 2009).
5th NATIONAL COMMUNICATION TO THE UNFCCC 277
(c) Lesson Plans related to climate change topics uploaded in the MEdIES webpage available for educators i.e. “The Greenhouse effect project”; “The climate change game”, etc.
Additionally, Greece played a key role in the elaboration and adoption of the UNECE Strategy on Education on Sustainable Development (ESD) that was adopted at Ministerial level in Vilnius, March 2005. Since then, Greece is chairing the UNECE Steering Group on ESD responsible for the follow up of the implementation of the ESD Strategy by UNECE countries. Greece participated also in the Expert Group on Indicators for the implementation of the Strategy.
9.2.3 Education in universities and technical education centres
The establishment of new departments dealing with environmental issues, and the enlargement of the scientific content of many existing ones during the recent years, have created a significant technical knowledge on climate change issues and their causes, both at the level of research as well as - progressively - at the level of higher education.
It should be noted that many of the particular issues related to climate change are new and evolving. Consequently, the provision of education on these issues requires a permanent link between research and the educational process, with respect to both the content of education, as well as to the wider interdisciplinary approach into which this content is inevitably integrated.
New thematic issues such as
active and passive systems in buildings,
bioclimatic architecture,
incorporation of renewable energy sources in energy planning,
investigation and analysis of the relation of the human community with the environment (artificial, social, cultural, natural),
emerge, since it is recognized that the effective confrontation of climate change is linked to the provision of a number of services and products – such as accommodation, transport and supply of consumable materials - with new methods presenting lower negative environmental impacts.
According to the database created in the context of the ESTIA Programme (Centres of Environmental Information) by the Ministry of Environment, the Greek universities, polytechnic schools and technical education centres, that are related to environmental issues, amount to 36. The list of institutes can be found in the webpage: http://www.ekke.gr/estia/eng_pages/eng_index.htm , while by clicking on each institution’s name, further information can be accessed over the departments, courses and postgraduate programmes that are related to the issue.
9.2.4 Continuous education
The aims set for life-long education are the activation of citizens and teams for private and social development, the promotion of active participation and the increase of the social incorporation and occupation potential. The main mean to succeed in this area is the education of adults.
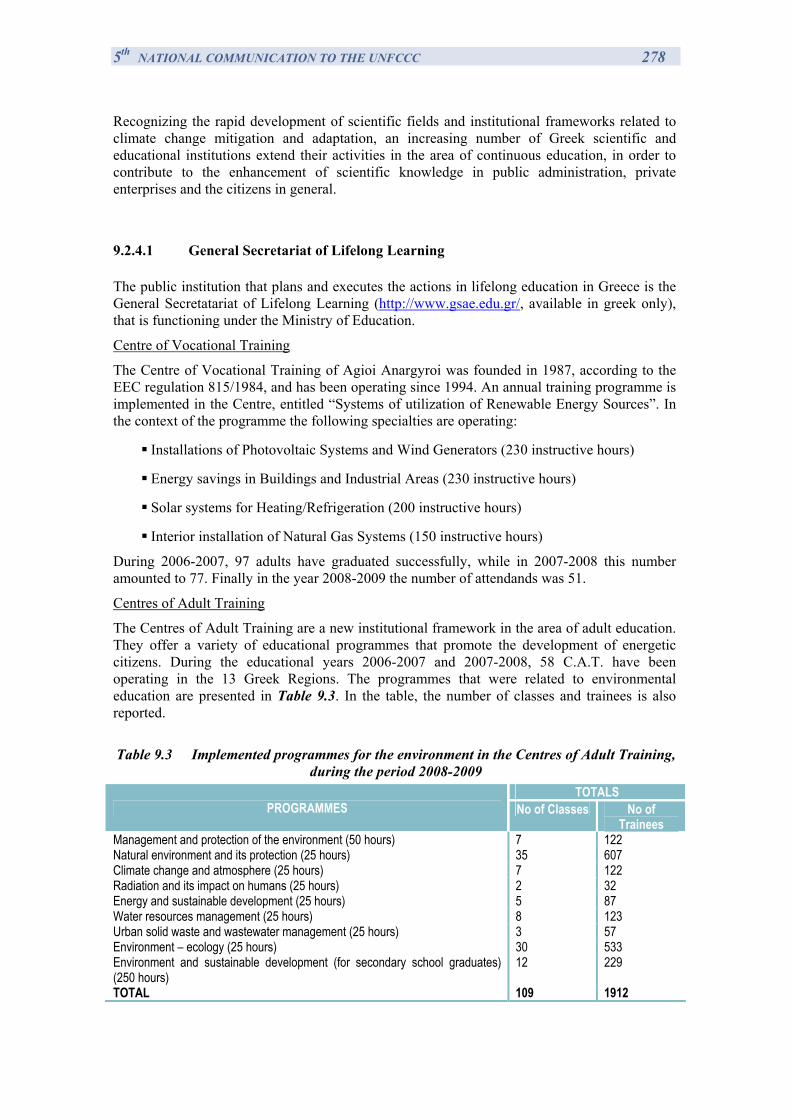
5th NATIONAL COMMUNICATION TO THE UNFCCC 278
Recognizing the rapid development of scientific fields and institutional frameworks related to climate change mitigation and adaptation, an increasing number of Greek scientific and educational institutions extend their activities in the area of continuous education, in order to contribute to the enhancement of scientific knowledge in public administration, private enterprises and the citizens in general.
9.2.4.1 General Secretariat of Lifelong Learning
The public institution that plans and executes the actions in lifelong education in Greece is the General Secretatariat of Lifelong Learning (http://www.gsae.edu.gr/, available in greek only), that is functioning under the Ministry of Education.
Centre of Vocational Training
The Centre of Vocational Training of Agioi Anargyroi was founded in 1987, according to the EEC regulation 815/1984, and has been operating since 1994. An annual training programme is implemented in the Centre, entitled “Systems of utilization of Renewable Energy Sources”. In the context of the programme the following specialties are operating:
Installations of Photovoltaic Systems and Wind Generators (230 instructive hours)
Energy savings in Buildings and Industrial Areas (230 instructive hours)
Solar systems for Heating/Refrigeration (200 instructive hours)
Interior installation of Natural Gas Systems (150 instructive hours)
During 2006-2007, 97 adults have graduated successfully, while in 2007-2008 this number amounted to 77. Finally in the year 2008-2009 the number of attendands was 51.
Centres of Adult Training
The Centres of Adult Training are a new institutional framework in the area of adult education. They offer a variety of educational programmes that promote the development of energetic citizens. During the educational years 2006-2007 and 2007-2008, 58 C.A.T. have been operating in the 13 Greek Regions. The programmes that were related to environmental education are presented in Table 9.3. In the table, the number of classes and trainees is also reported.
Table 9.3 Implemented programmes for the environment in the Centres of Adult Training,
during the period 2008-2009 TOTALS
PROGRAMMES No of Classes No of Trainees
Management and protection of the environment (50 hours) 7 122 Natural environment and its protection (25 hours) 35 607 Climate change and atmosphere (25 hours) 7 122 Radiation and its impact on humans (25 hours) 2 32 Energy and sustainable development (25 hours) 5 87 Water resources management (25 hours) 8 123 Urban solid waste and wastewater management (25 hours) 3 57 Environment – ecology (25 hours) 30 533 Environment and sustainable development (for secondary school graduates) (250 hours)
12 229
TOTAL 109 1912
5th NATIONAL COMMUNICATION TO THE UNFCCC 279
Training Programme of Voluntary Action for the Management of Hazards and Crisis and the Confrontation of Emergencies
The Programme is operating with the participation and cooperation of various institutions (General Secretariat of Civil Protection, Fire Service, Ministry of Defense etc). The main thematic areas include, among others, emergencies that could be caused by climate change extreme events (forest fires, extreme weather events and floods). Since the first operation of the programme in 2001, about 5000 voluntaries have been trained in various aspects of civil protection (strategies of decision making and problem resolving, information management, participation in teams, psycho-social support of affected/hurt people, panic management etc.), while the programme has run in 145 Municipalities of Greece.
Second Chance Schools
The General Secretariat of Lifelong Learning, through the Institute of Continuous Training of Adults, has the responsibility for the operation of 57 Second Chance Schools (SCS) and of 59 classes in the country.
The SCS are addressed to adults that have graduated from Primary School but have not completed the compulsory education. In the SCS, after a two-year attendance, the graduates receive a title that is equivalent to the Lower Secondary Education Certificate. The education methods in the SCS follows the principles of the adult education (participation of students, cooperation in teams, case studies, cross-thematic action planning, educational visits etc.).
Environmental Education is one of the 8 courses of the SCS and is being instructed for 2 hours per week during both years of attendance. In addition, in the framework of the cross sectional Projects and Laboratories, the participants have the chance to further work on Environmental Education Issues. The course is supported by the elaboration of specific educational material that aims at:
• The awareness of participants over environmental issues
• The acquisition of variable experiences and basic knowledge on environmental issues
• The modulation of principles and the development of interest on the environment, further enhancing the participation in environmental protection and improvement actions
• The acquisition of the appropriate capacities to identify and solve environmental issues
• The acquisition of the capacity to take action and participate to all the available levels of prevention of environmental issues.
During the academic year 2008-2009, 5300 adults have been graduated by the SCSs.
9.2.4.2 Summer schools
Several summer schools are being implemented in the recent years in the Greek territory with reference to environmental issues. The Sivitanideios Public School of Trades and Vocations has organized the Summer Schools of Youth Entrepreneurship for the students of Technical Vocational Educational Schools (http://www.therina.gr/default_uk.htm ). The financed summer schools that have been held in Athens included, among others, the following:
5th NATIONAL COMMUNICATION TO THE UNFCCC 280
“Green house”: Bioclimatic and environmentally sound approach for the study and planning of houses and installations with the use of software.
“Green roof services”
“Presentation of an original technological study of bioclimatic and ecologically sound applications in habitations of Athens and presentation in small scale model”.
The summer schools were held between the 6th July and 2nd of August 2008 in three 14-day periods.
Also, based on the need of pure climatological knowledge (real sense of climate), the Department of Meteorology-Climatology of the Aristotle University of Thessaloniki (AUTH) in collaboration with the Institute of Environmental Research and Sustainable Development of the National Observatory of Athens (NOA), organized a Summer School entitled “Climatology-Climate change-Impacts”, founded by John S. Latsis Public Benefit Foundation. The school has been held in Athens from 8 to 15 of July 2009 and has been principally focused on:
Climatology; the climate parameters, their influence on planet’s climate, European and Mediterranean Climates
Modern/recent/current (statistical techniques applied to climatological data) climatological methods of analysis on meteorological and climatological data
Use of modern climatological databases in studying the mechanisms and parameters which may drive changes in climate
Future climate changes on account of the intensity of Greenhouses effects
Study on climate extremes
Study on General Climate Models (GCMs)
Dynamical and Statistical downscaling models
Impacts of climate change to eco-systems, agriculture, water resources, tourism and in other fields of human activities.
Further information is available in the webpage of the Summer School (http://latsissummerschoolclimate.geo.auth.gr/).
9.2.4.3 Centre for Renewable Energy Sources and Saving
The Centre for Renewable Energy Sources and Saving (CRES) is the Greek organisation for Renewable Energy Sources (RES), Rational Use of Energy (RUE) and Energy Saving (ES). CRES has been appointed as the national co-ordination centre in its areas of activity, and its main goal is the research and promotion of RES/RUE/ES applications at a national and international level, as well as the support of related activities taking into consideration the principles of sustainable development.
In this frame, CRES systematically undertakes educational and training activities addressed both to professionals who are active in these thematic fields, as well as to pupils and students in all educational stages. The educational activities include inter alia the production of printed, electronic and audiovisual material, which is distinguished in training material and educational material (http://www.cres.gr/kape/education.htm).
5th NATIONAL COMMUNICATION TO THE UNFCCC 281
Apart from that, CRES has developed the Park of Energy Awareness (PENA), in order to present RES technologies through real small scale energy systems and to offer its guests the opportunity to be informed about the potentialities and the benefits of the environmental friendly energy technologies. PENA (http://www.penaproject.gr/) was developed in the 3.01 MW Demonstration Wind Farm that CRES operates since 1998. The project was co-funded by the O. P. “Competitiveness” of the Greek Ministry of Development and the Greek State.
The boundary of the park is marked by a wooden pathway lit by photovoltaic cells. Along the route, visitors encounter educational displays and energy demonstration displays on the various forms of renewable energy. Two electric vehicles are also available for the use of visitors with special needs. PENA is the first integrated installation in Greece that offers a successful combination of informational, demonstrative and educational activities in RES.
9.2.5 Other organizations
Non-educational institutions play an important role in producing educational material and in organizing activities of continuous education on issues related to climate change. In many cases, due to the specialization of these institutions, the educational material produced represents a reference material for other scientific activities.
The activities of such institutions are briefly presented below by means of indicative examples of their activities.
9.2.5.1 Interdisciplinary Institute for Environmental Research (INIER)
The Interdisciplinary Institute for Environmental Research (INIER) is a non-profit organization for the environment. Its objectives are the elaboration of policies and the development of tools for the promotion of sustainable development, the provision of information and stimulation of public awareness on environmental issues and the contribution to the development of an institutional framework for environmental protection (http://www.dipe.gr/). Since 1998 the INIER is organizing cycles of training seminars that are entitled “Summer Ecological University” and address to adults with regard to ecology and environmental sciences.
In 2009, the Summer Ecological University was specialized on the “Eco-nomy of Water: history, natural ecosystems and management” and was held in Hydra from 6 to 24 of July.
9.2.5.2 Hellenic Association for the Protection of Environment and Cultural Heritage
The Hellenic Association for the Protection of Environment and Cultural Heritage (http://www.ellinikietairia.gr/) is a non-profit organization aiming at highlighting the value of the Greek cultural heritage, the importance of the protection of ecosystems and ecological balance in Greece, as well as the aesthetic value of landscape and the importance of the natural environment of the country. Furthermore, it aims at promoting the concept and practices of sustainable development so that human activities coexist harmoniously with the natural and cultural heritage.
The environmental educational activities of the association include the running of 6 school programmes, the organization of Panhellenic Symposiums (the 4th one will be held in January 2010 and is entitled “Sustainable schools of the present and the future”) and the production of school activities material (publication of the book “Realization, Awareness, Action for Sustainability”, 2008, ISBN: 978-960-88435-5-4).
5th NATIONAL COMMUNICATION TO THE UNFCCC 282
9.3 Environmental information and awareness
9.3.1 Governmental Initiatives
9.3.1.1 Hellenic Parliament
The Permanent Special Committee on Environmental Protection of the Parliament has been founded in 2004 and comprises representatives from all the parliamentary parties. The activities of Committee are focused on the observance and evaluation of the status of the environment status of the country, and of the impacts derived from various actions over it. The Committee is also providing consulting services in the designation of national strategies regarding the environmental protection.
During 2008 the Committee has had various meetings with representatives from NGOs (WWF, Greenpeace, etc.). The issue of climate change and energy has been considered as a key one and various objectives have been set out including the elaboration of an adaptation plan, the promotion of RES and energy savings etc. The issue of environmental awareness has also been considered as a very important, and meetings have been dedicated to discuss the results of a study regarding the public opinion over the environmental consciousness of Greeks conducted by the Hellenic Association for the Protection of Environment and Cultural Heritage (2007).
The Hellenic Parliament has also been informed over the WWF study: “Solutions for climate change: Sustainability vision for Greece of 2050” and participated in the “Hour of Earth” event, that aimed at the energy saving and decrease of air emissions. Also, the Parliament has adopted environmental measures and actions, such as the reuse of used material, the installation of a photovoltaic system, the use of hybrid and antipollution technology cars.
Finally, to enhance public awareness, the Parliament is periodically publishing the “Environmental Bulletin of the Parliament”, where all its actions are explicitly mentioned.
9.3.1.2 Ministry of Environment
The Ministry of Environment, Energy and Climate Change (former Ministry for the Environment, Physical Planning and Public Works) has participated in various actions to help the access of the public to environmental information. Some of these actions are included in the following:
Creation of “Centres for Environmental Information” for environmental protection and administration Institutions in Balkan countries, on issues of environmental politics and administration (DAC/OECD)
The Programme has been approved by the Ministry in the framework of DAC/OECD and aimed at the creation of the necessary requirements for a broad and systematic collaboration of the institutions which are concerned with the environmental problems of Balkan countries. The programme’s main objectives were the creation of a database – its content will be further analysed in the following paragraphs – and the creation of the “Centres for Environmental Information; plural Esties” (we shall call them Estia) in Greece, Yugoslavia and Rumania. During the programme’s implementation Cyprus was also included (without this being a conventional requirement of the collaborating institutions).
The principal aim is that Esties will function as coordinating and intermediate centres among the Non Governmental Ecological-Environmental Organisations (NGO’s), private and public institutions and scientific research teams with similar interests. Each country’s data base will be
5th NATIONAL COMMUNICATION TO THE UNFCCC 283
the mean of achieving or fulfilling a broader information and dissemination of the programme’s results.
The creation of each country’s database in unified structure was based in the former experience of the Environmental Team of the Institute of Urban and Rural Sociology (IURS) of the National Centre for Social Research (EKKE). Data base content is divided into two basic units:
(a) Database of the Non Governmental Ecological - Environmental Organisations (NGO’s): The data concern all the activities, the relations and the way environmental organizations function, from their establishment until present.
(b) Database of the Institutions that are related to the Environment: The Institutions include Ministries, research centres, public organizations and enterprises, prefectures, municipalities, municipal enterprises and other environmental institutions.
All the collected information is available to the public via the webpage of the project: http://www.ekke.gr/estia/eng_pages/eng_index.htm. Also, data can be given, under demand, to the public in printed and electronic format.
National Network for Environmental Information
The National Network for Environmental Information (NNEI) is an integrated information system for the registration and processing of information related to the state of the environment in local, regional and national level. The network is foreseen to stand as the main mechanism for the storage and management of all information on environmental issues which is of national importance.
A significant part of input data is available through the internet (http://hermes.edpp.gr/ ) where the environmental data are presented through a Geographical Information System (GIS).
National Centre for the Environment and Sustainable Development – NCESD
The National Centre for the Environment and Sustainable Development (NCESD) (http://www.ekpaa.gr/) was established in 2001, under the supervision of the Ministry for the Environment, Physical Planning and Public Works, in order to provide consultancy to the Greek State on environmental and sustainable development issues. Through the provision of permanent, reliable and objective information, technical knowledge and proposals, NCESD supports training and implementation of effective policies in the above mentioned issues. It contributes, as a knowhow mechanism, in the integration of the environmental dimension in sectoral development policies and, through this, to a horizontal coordination of public policies which have a direct or indirect influence in spatial and environmental management.
More specifically, currently the compilation and publication of reports and studies regarding climate change issues, includes the following:
Greece: The State of the Environment – Report 2008 (ISBN: 978-960-99033-0-1)
National Report on Sustainability Indicators (to be published in 2009)
Special Service of Environmental Inspectors – SSEI
The Special Service of Environmental Inspectors (SSEI) was established in 2003 and since then Greece has a control mechanism for the enforcement of environmental legislation and the protection of environment. This need had been foreseen many years ago by the Environmental Law 1650/86.
The mission of SSEI is centralized in the provision of effective and integrated environmental protection that aims, among others, to the achievement of sustainable development of the country’s regions. The means used to achieve this mission include:
5th NATIONAL COMMUNICATION TO THE UNFCCC 284
Provision of suitable guidelines and directives for the best behaviour of operators and other citizens
Proper operation, that is based on transparency, justice and decent administration.
The Ministry of Environment is also organizing public competitions in special issues regarding adaptation and mitigation techniques. Such an example is the National Architecture Competition “Consideration of Ideas for the Plantation of Roofs in Dwellings and Pilot Implementations”, performed by the General Secretariat of Spatial Planning (2nd of May 2008).
9.3.1.3 Ministry of Foreign Affairs
On May 18th 2007, Greece undertook the rotating annual Chairmanship of the Human Security Network (HSN). The HSN is an informal international forum in co-operation with international organizations, civil society and the academia, aiming at raising awareness at the international level regarding new forms of threats that endanger peoples’ security. Member states of the HSN include: Canada, Norway, Switzerland, Ireland, Austria, Slovenia, Jordan, Mali, Chile, Costa Rica, Thailand, as well as South Africa with observer status.
The Hellenic Chairmanship-in-office chose to focus its activities on the human security implications of climate change in developing countries. The objective of the Hellenic Chairmanship was to raise, at a global level, awareness on the impacts that changing living conditions (caused by the climatic change) can have on peoples’ security in developing countries, with a special emphasis on the implications that these circumstances can have on three particularly vulnerable groups, namely women, children and populations fleeing their homes as a result of climate change.
Seeking to actively contribute to the international dialogue for adequate policy planning so as to confront climate change implications on human security, the Hellenic Chairmanship proceeded, in co-operation with competent International Organizations, to the elaboration of a number of relevant policy texts. To this end, the Hellenic Chairmanship of the HSN, in co-operation with the Hellenic Foundation for European and Foreign Policy (ELIAMEP), collected and then presented an overview of existing studies on the impact of climate change on human security of vulnerable groups in the developing world. Based on the former, and in collaboration with prominent Greek and International Research Centres, the Hellenic Chairmanship began preparing in 2008, policy papers on the impact of climate change on the three aforementioned vulnerable groups: a policy paper on the impact of climate change on children, drafted in collaboration with UNICEF, a policy paper on Climate change and Women, drafted in collaboration with the Women’s Environment and Development Organization (WEDO) and a policy paper on persons fleeing their homes as a result of climate change, in collaboration with the United Nations University. Finally, a comprehensive policy paper was elaborated in co-operation with the International Institute for Environment and Development and under the supervision of leading climate change expert, Dr. Saleemul Huq, on Development Co-operation and the Impact of Climate Change on Human Security. The main findings and policy proposals of these papers were presented at a High-Level International Conference (Athens, May 2008) concluding the works of the Hellenic HSN Chairmanship.
A series of events, highlighting the issue of climate change impact on human security, were organized on the Hellenic Chairmanship’s initiative, in co-operation with International Organisations and other members of the H.S. Network:
5th NATIONAL COMMUNICATION TO THE UNFCCC 285
Climate Change and Human Security (Athens, November 27th 2007), in co-operation with UNEP/MAP: Launching event, first presentation of UNDP’s “Human Development Report 2007/2008 Fighting climate change: Human solidarity in a divided world”. The event also hosted a poster exhibition and a children paintings’ exhibition, in co-operation with UNEP/MAP.
Climate Change Human Security Implications on Children (Bali, December 10th 2007/New York, December 12th 2007), in cooperation with UNICEF: side events of the International Conference on Climate Change in Bali and the UN General Assembly’s Special Session on Children, in New York.
Climate Change, Environmental Degradation and Migration: Addressing Vulnerabilities and Harnessing Opportunities”, (Geneva, February 19th 2008) in cooperation with the International Organisation for Migration (IOM).
Climate Change and Human Security: Women, a most vulnerable group, (Vienna, March 13th 2008), in co-operation with the Austrian Ministry of Foreign Affairs.
International Conference on Climate Change – Annual Ministerial Meeting of the Human Security Network (Athens, May 29th – 30th 2008).
Finally, the Greek MFA sponsored the translation, publication and presentation to the Greek public (November 2008) of the Stern report: “The economics of Climate Change” (extended synopsis), a report which has played a considerable role on international public awareness regarding the impact of climate change on all sectors of the economy.
9.3.1.4 Other public sector bodies
Other ministries have also undertaken initiatives in order to promote public awareness on the issue of climate change:
Ministry of Infrastructure, Transport and Networks
The Ministry has adopted some actions regarding the change of attitude towards the GHG emissions. The main elements are the introduction of the ecological driving perception in the training of new drivers and the introduction of cycling in the Greek cities.
Ecological driving:
In 1996-1997 and in the specialty of driving educators of the Institutes of Professional Training (IEK), the introduction of the course “Environmental protection and energy saving” has been performed, in order to develop the ecological consciousness, the respect towards the environment during the use of vehicles, and the training of new drivers in the ecological driving. In 2003-2004 several seminars took place for the education of older drivers on the same subjects. Also, new additions regarding ecological driving have been introduced in 2009 in the questionnaires of the formal examination for driving licence.
Cycling in the city:
According to the decision 33523/7564/10-6-2002 of the Ministry, the project “Introduction of bicycle in the Greek cities” has been included in the National Programme of Road Safety. The project has been focused on the materialization of interventions for the safe use of bicycles and the construction of bicycle paths (road marking, parking positions, interventions in the road network including widening of
5th NATIONAL COMMUNICATION TO THE UNFCCC 286
roads and sidewalks etc.). In this framework, the Ministry has assigned the NTUA’s school of Rural and Surveying Engineering the elaboration of research over the introduction of bicycle in the Greek cities and the structure of policy for the motor bicycle. Studies have been performed for 17 Greek cities, while about 80 cities have been interested in the project. Three joint ministerial decisions have been approved for the construction of bicycle paths in the Municipalities of Karditsa, Larissa, Mesologgi, N. Psychiko, Thessaloniki, Heraklion (Crete), Patra, Athens and Bolos, with the financing of the Ministry. In addition to the above, the NTUA has compiled the “Guidance for Studies regarding bicycles”, that is at the disposal of local governments and constitutes the first guide that giving specific instructions on how to plan the bicycle infrastructure under the Greek circumstances.
Ministry of Rural Development and Food
The General Secretariat of Development and Protection of Forests and of Natural Environment has planned the publication of printed material regarding the role of the forests on climate change, as a mitigation of impacts mechanism, but also for the adaptation to it. In the information material, the importance of the sustainable management and biodiversity protection of the forests will also be highlighted.
Also, the Secretariat is planning to participate in the organization of training seminars addressing to forest employees, who will, in turn, educate and inform schools and other kind of teams on the role of the forest in climate change and other issues.
Municipalities
In the recent years many municipalities are becoming more interested in the climate change issue, and relative local activities and events are becoming much more often than in the past. Examples of such initiatives are the following:
Creation of Thematic RES Park and Environmental Observatory at the Municipality of Portaria, aiming at:
o The presentation of energy saving means in the infrastructure, the bioclimatic architecture and the techniques of energy efficiency of the buildings using RES
o The observation and archiving of the microclimate of the area and of the RES use
o The raising of public awareness in environmental protection and RES use issues
o The elaboration of a educational software entitled “e-Energy School” that can be used by all levels of interested citizens (students, professionals, institutional bodies).
Organization of a conference entitled “Energy and local government” by the Municipality of Nigrita. Also, organization of a festival that included various activities for the raising of public awareness on energy savings and RES and foundation of Environmental Education Centres.
Support and implementation of solar and wind energy systems, especially in the islands (i.e. Syros, Santorini etc.)
5th NATIONAL COMMUNICATION TO THE UNFCCC 287
9.3.2 Non-governmental Organisations Initiatives
9.3.2.1 Greenpeace
The action on climate change constitutes one of the basic thematic campaigns of the Greek office of Greenpeace. Within this framework, Greenpeace has undertaken a number of initiatives which address two main directions:
1. Highlighting policies and behaviours which generated and intensify the climate change problem, e.g. dependence from fossil fuels, non-rational energy use, degradation of forests, disproportionate facilitation of the use of private cars, etc. and
2. Presenting alternative solutions aiming at eliminating the above mentioned factors and at following a totally different approach with respect to relevant development processes .
The website of the organisation (http://www.greenpeace.org/greece/campaigns/climate-change) offers plenty of information on climate change issues and suggests ways of reducing the atomic energy consumption (e.g. “10+1 ways of saving the climate” – test in electronic format, “Greenfreeze guidance”- guidance on the refrigerators that use R600a), while it also provides data on the campaigns performed by the organisation (support of the operation of two wind parks in Eyboia and Crete, lower taxation on the purchase and installation of RES systems etc). Also, the website provides continuous information on the progress of major international UNFCCC and EU agreements.
9.3.2.2 Mediterranean SOS Network
MEDITERRANEAN SOS Network (http://medsos.gr) is a non-profitable, non-governmental organization active since 1990, that comprises of 120 'Full Members' who form its annual General Assembly and approximately 3000 'Supporting Members'. The main aims of the Network include:
1. Raising public awareness and encouraging changes in citizens' -especially youth- everyday behaviour that impact on the environment
2. Advocating, lobbying and promoting cooperation among social partners, stakeholders and policy-makers at local, national, regional level
3. Promoting active public participation in sustainable development strategies and demonstrating alternative solutions in local communities
4. Promoting intercultural exchanges and balanced international cooperation among European - Mediterranean partners.
The main actions that regard the climate change issue in the recent years are:
(a) 2007-2009 : Information & awareness campaign “Climate action!”. Presentations in schools in 8 of the largest cities n Greece (attended by 14.000 pupils) and public events, focusing on raising the awareness of pupils in schools. Educational-informational package for teachers and special magazine edition developed under the campaign.
(b) 2005-2008 : Project Partner in INTERREG IIB MEDOCC project “Med Eco-Quartiers” (Lead partner Municipality of Pezenas, France, www.med-ecoquartiers.org)
(c) Ongoing information and awareness-raising on energy and climate change issues and relevant local, national and international policies
5th NATIONAL COMMUNICATION TO THE UNFCCC 288
(d) 2004-2007: Partner in LIFE-Environment project 'Sun and Wind' (beneficiary: Commune di Palermo, Italia) on applications of traditional Mediterranean bioclimatic practices in contemporary architecture.
(e) 2006 : Implementation of youth meeting in Lesvos in August 2006 under EU’s YOUTH Program titled “Re-turn to Renewable Energy” with the participation of 42 young people from 8 Mediterranean countries.
(f) 2006 : Conference “Climate Change and Policy for energy efficiency and renewable energy: the role of local authorities and social partners”, together with the Central Union of Greek Municipalities.
(g) Lobbying governments and international organizations through the participation in international networks of NGOs active in climate issues (INFORSE - International Network for Sustainable Energy and CAN - Climate Action Network)
(h) Partner in E.C. Youth project: 'It's time to be a critical consumer!' with young NGO members from Greece, Italia, Belgium, Portugal, Turkey, Lebanon, Jordan, Tunisia
(i) Cooperation with municipalities and local authorities for the promotion of energy efficiency and climate protection policies and measures.
9.3.2.3 WWF Hellas
The WWF Hellas organisation is part of the global WWF Network. The organisation is aiming at the conservation of the Greek biodiversity as part of the Mediterranean and at the constrain - and even overturn, in the long term – of the environmental degradation, in order to achieve the harmonic coexistence of human and nature.
The main means that are currently used by the organisation in order to achieve its objectives are:
Implementation of scientific actions and promotion/enforcement of such indispensable actions that are being implemented by other bodies.
Implementation of projects of natural environment management.
Cooperation with NGOs, operators of the public sector, local government and academic environment
Cooperation with companies
Elaboration and publication of opinions relative to environmental policy
Contribution in corporate consultation bodies and committees/working groups of experts
Criticism of the practices in the public and/or private sector
Materialization of campaigns aiming at imposing pressure and mobilizing the public
Communication and public awareness actions
Training and scientific knowledge distribution actions
Environmental education actions
5th NATIONAL COMMUNICATION TO THE UNFCCC 289
Actions aiming at the public participation, voluntarism and reinforcement of the Civil Society
The website of the organization offers information on what citizens and companies can do to contribute to the mitigation of climate change. At the same time WWF Hellas is cooperating with other research centres, such as the National Observatory of Athens, to the elaboration of important scientific reports (“Tommorow of Greece: Climate change impacts in Greece in the short term future” (Athens 2009), “Solutions for climate change: A sustainability vision for Greece in 2050” (Athens, 2008), etc.).
Also, the organization is supporting various public participation actions, like the “Hour of the Earth” event (in 2009 the event has been supported by 489 Municipalities, 1649 enterprises, 845 schools and 325 institutions in Greece).
9.3.2.4 Institute of Energy for South East Europe (IENE)
The Institute of Energy of South East Europe (ΙΕΝΕ) is a non-profit organization whose main activity is the study of energy matters and the provision of quality information to professionals and to the public in general. IENE aspires to become the focus around which energy matters can be discussed, analysed, compiled and presented to the scientific-technical communities and to the representatives of social, business and economic life in Greece and SE Europe. The Institute also aspires to playing a significant role in providing factual and unbiased information in Greece and internationally on matters concerning energy, the environment and sustainable development. At the same time, the it hopes to provide a suitable platform for discussion and analysis on the critical subjects of energy and the environment which are of a broader concern to society.
The means for achieving its goals include the following:
1. Information/publicity: One of the basic activities of the IENE is the provision of the necessary information and updating on the energy situation and related activities in Greece as well as in the South East Europe. This information is provided on a regular basis through the publication of articles, research papers, conference proceedings studies and books as well as via the specialist internet sites supported and controlled by the Institute. In the field of communication the Institute organizes frequent conferences, meetings, educational seminars, workshops and public discussions on the subjects of energy, environment and sustainable development relative to Greece and to the adjacent area of S.E. Europe.
One of the more known events of the IENE is the annual national conference "Energy and Development" organized every autumn in Athens with the participation of both Greek and foreign speakers and participants from all over the world. Another important event is the "Oil and the Economy" conference first organized in April 2003, and now scheduled in as a regular Institute activity. IENE’s plans include the organizing of meetings on a wide range of energy related subjects including natural gas, solid fuels, the electricity market, renewable every sources, energy conservation and new energy technologies such as hydrogen. Also, among the plans of IENE is the organisation of a regional conference, at S.E. European level, that will cover the activities of the various countries in the area and be directed at senior government and business executives responsible for the laying-down of economic and energy policies. The IENE participates actively in the promotion and diffusion of new energy technologies, the transfer of "know-how" and the implementation of E.U. policies and directives. Within this framework, the IENE co-operates with corresponding bodies, both domestic and foreign, in promoting these goals and activities. The Institute aims at
5th NATIONAL COMMUNICATION TO THE UNFCCC 290
organising on a regular basis specialist events, as well as meetings of a more general nature for the public at large.
2. Education: As part of its activities, the IENE organizes meetings, lectures, seminars, workshops and task forces and promotes exchanges and general educational activities and programmes which have the objective of promoting knowledge and experience on energy and environmental and development matters. The establishment of scholarship programmes for post-graduate studies in the fields of energy, and environment, in Greece and abroad, constitutes one of the basic goals of the IENE. The educational goals of the Institute include the promulgation of methods, tools and practices for the protection of the environment, the utilisation and promotion of renewable sources of energy, new forms of energy and new technologies (e.g. Hydrogen and Fuel Cells), as well as the use of clean and effective technologies based on traditional fuels.
3. Research and Technological Development
4. Documentation
5. Co-operation with the Institutional Organs of the European Union and other National and International Institutions: The Institute, in accordance with its Articles of Association, may submitt proposals to the European Commission and other International Organisations (e.g. UN bodies, World Bank) participate in the management of EU programmes, resources and initiatives, co-operate with the European Parliament, the Regional Commission and other national or international bodies and organisations. Also, it aims to co-ordinate activities with other Institutes and organizations, national and foreign universities, take part in common programmes, research oriented or not, and also participate in dissemination/briefing and other associated activities. IENE will maintain a pool of scientists ready to offer consultancy services and also to act as evaluators in the E.U projects.
6. Co-operation with S.E. Europe: Particular emphasis has been given to networking and co-operation with energy companies, institutional bodies and organizations, research centres and scientific institutions active in the field of energy and the environment in the countries of S.E. Europe. The Institute is prepared to contribute to the elaboration of policies normally required as part of international obligations and transitional phases. The IENE aspires to act as a bridge of communication and promotion on the energy issue between Greece and the countries of S.E. Europe.
An extended list of the IENE’s activities can be found in the website of the organization (http://www.iene.gr/index.php?pid=1&lid=2). 9.3.2.5 Law+Nature
The civil non-profit society Nomos+Physis (Law+Nature) specializes in the fields of law, institutions and policy for environmental protection and sustainable development. Its mission is to contribute to the development of environmental law (in Greece, as well as in its neighbouring countries) and to raise public awareness regarding the legal and institutional aspects of environmental protection and sustainable development.
Between its scientific and informative activities that are related to climate change, one should mention the organization of the meeting “Climate changes and energy policy in Greece” on the 8th of February 2006.
5th NATIONAL COMMUNICATION TO THE UNFCCC 291
9.3.3 Environmental information-awareness and a civil society
Apart for the NGOs, a number of institutions of the civil society show an increasing interest on energy, climate change and environmental issues. These institutions can contribute to the awareness and promotion of good practices, either due to their large membership (Greek General Confederation of Labour -GSEE, Technical Chamber of Greece - TEE), or due to their sectoral representation (Hellenic Association of Photovoltaic Companies, Greek Association of RES Electricity Producers), or finally, due to the specialization of their members in issues critical for the application of solutions for climate change mitigation (Alumni Association of Greek Environmental Scientists, Hellenic Environmental Law Society).
9.3.4 International cooperation
Apart from the cooperating actions that have been already mentioned above (Steering Committee of the Ministry of Education, the MEdIES programme and activities of the IENE) that are mainly referring to the European, and principally Mediterranean level, the following actions should be additionally mentioned:
9.3.4.1 Governmental initiatives: Countries of the Africa Region
Greece’s long-standing cooperation with countries of the African region is channelled through a number of different processes and is especially characterized by the social, economic, commercial, cultural and environmental links induced by sharing the Mediterranean sea. The different levels of cooperation between Greece and the African countries can be summarized as cooperation at international level, cooperation at regional level, with emphasis on the Mediterranean region, and cooperation at bilateral level. It should be noted that there also exists cooperation between the European Union (EU) and African countries, especially at the international level but also at the regional level, where Greece, as a Member State of the EU, is also actively involved.
(a) Political relations:
Greece holds good political relations with countries in the African region and especially with countries in North Africa, due to their proximity and the increased collaboration, commercial relations and cultural links. Good political relations between Greece and countries in the region are expressed both through bilateral cooperation as well as through cooperation in international fora, especially the United Nations as well as the Euro-Mediterranean Partnership, Francophonie etc. Furthermore, in many cases there is mutual support between Greece and African countries for candidacies in various international organisations.
(b) Institutional framework:
Regarding the Institutional framework and bilateral Treaties, Greece has established inter-governmental Agreements with a number of African countries on several sectors, such as:
economic/scientific/technical cooperation (e.g. Ethiopia, D.R. Kongo, Kenya, Nigeria, Mautiritius, Burundi, Nigeria, S. Africa, Uganda, Tunisia, Morocco, Algeria, Libya, Egypt);
cooperation on tourism (e.g. Ethiopia, Kenya, Mautiritius, S. Africa, Uganda, Tunisia, Morocco, Egypt),
5th NATIONAL COMMUNICATION TO THE UNFCCC 292
cooperation on health issues (e.g Ethiopia, S. Africa, Seychelles);
commercial / trade cooperation (e.g. D.R. Kongo, Nigeria, Rwanda, Ethiopia, Madagascar, Burundi, Tunisia, Morocco);
education / cultural cooperation (e.g. Ethiopia, Burundi, Nigeria, S. Africa, Seychelles, Tunisia, Morocco, Algeria, Egypt);
air transport cooperation (e.g. Ethiopia, D.R. Kongo, S. Africa, Uganda, Tanzania, Morocco, Libya, Egypt);
agricultural cooperation (e.g. Mautiritius);
maritime cooperation (e.g. Nigeria, Madagascar, S. Africa, Tunisia, Morocco, Egypt);
cooperation on legal issues (e.g. Kenya, S. Africa); cooperation on promotion / mutual protection of investments (e.g. S. Africa,
Tunisia, Morocco, Algeria, Egypt); cooperation on taxation issues (e.g. S. Africa, Morocco, Egypt); sports cooperation (e.g. Tunisia) etc.
(c) Economic / commercial relations and Official Development Assistance (ODA):
Greece has developed bilateral economic and commercial relations with a number of African countries. Greek exports to African and Middle East countries for 2007 (latest data available) were of the order of EURO 1,112 million. Furthermore Greece has provided development assistance to many countries in the region. The total Greek ODA granted to African countries for 2007 was EURO 22.84 million. The main sectors at which development assistance aimed, include environment and climate change, education and training, health, culture, water, employment and food/humanitarian aid. Further information on the financial funding can be found in Chapter 7.
Cooperation on environmental issues: Climate change
Africa is a region particularly vulnerable to environmental changes. A fundamental issue related to environmental changes is currently climate change and its related consequences in terms of water scarcity, land degradation and desertification. The capacity of Africa to deal with the consequences of environmental changes is to a large extent limited. Within a globalised world, international cooperation should put emphasis in assisting African countries to meet their special needs and emerging global challenges, particularly within the context of achieving the MDGs.
Collaboration with Africa is of increased importance in relation to the issues of climate change and water. Especially regarding climate change, it is necessary for the developed states to provide sufficient support to Africa in order to prevent further damage, which can lead to human and environmental crises with far reaching consequences. Africa is expected to be substantially affected by climate change, but its own ability to adapt to climate change consequences is insufficient. It is imperative that appropriate tools for Africa’s adaptation to climate change are set up and put into operation.
Mediterranean Sea: Linking Greece with North Africa
Greece is linked to the North African region through the Mediterranean sea. Due to this link, a long-standing collaboration exists between Greece and the North African countries on environmental and sustainable development issues, both bilaterally and through multilateral processes, such as the Barcelona Convention and the Mediterranean Action Plan of the United
5th NATIONAL COMMUNICATION TO THE UNFCCC 293
Nations Environment Programme (UNEP/MAP), the Mediterranean Commission for Sustainable Development (MCSD) and the “Barcelona Process: Union for the Mediterranean”.
Specific sectors of cooperation
International level
i. UN System
Greece is a member to several international organisations through which engages in cooperation and mutual support with African countries in promoting environmental protection and sustainable development. In the UN system, such organisations mainly include the UN Commission on Sustainable Development, the United Nations Development Programme (UNDP) and the United Nations Environment Programme (UNEP).
ii. Human Security Network
Greece, as the chairmanship-in-office of the Human Security Network during the period 2007-2008, has chosen to focus its activities on the human security implications of climate change with emphasis on its impact on the vulnerable population groups of children, women and persons fleeing their homes due to climate change as well as to the adaptation opportunities (see also§ 9.2.1.3). A main consideration of the Hellenic Chairmanship of the Human Security Network was that adaptation programs to climate change in developing countries will greatly contribute to limiting the threats against human security, while increasing the chances for achieving the MDGs. Emphasis in European development assistance should therefore be given to addressing climate change impacts on vulnerable regions. In this respect, Greece has already started setting, in cooperation with international and regional organisations, special trust funds for adaptation programs to climate change in Africa and Small Island States.
iii. EU-Africa cooperation
Greece, as a Member State of the EU actively participates in the EU-Africa cooperation. In the framework of implementing the Cairo Declaration as a follow-up of the 2000 EU-Africa Conference, Greece (through the Hellenic Ministry of Environment, Energy and Climate Change - http://www.minenv.gr) and Finland (through the Ministry of Environment) undertook the role of “Chef de file” for the subject “Environmental protection, including drought and desertification”. In this framework, the Ministry developed four documents that were used as a basis for the bilateral discussions between EU and Africa on this issue.
iv. Global Environment Facility (GEF):
GEF is an independent financial mechanism, which provides developing countries with grants for programs aiming at the improvement of the environment globally and promotes sustainability to local communities. The vast majority of GEF’s projects concern African countries. GEF’s programs deal with 6 complicate environmental subjects: Biodiversity, Climate Change, International Waters, Land Degradation, Ozone Depletion and Persistent Organic Pollutants (POPs). Greece participates to the GEF’s budget since its First Replenishment.
v. EU - Africa Infrastructure Trust Fund
Greece participates as a Donor country in the EU–Africa Infrastructure Trust Fund with the amount of EURO 1 million. The purpose of the Fund is to co-finance infrastructural projects in the sector of transportation, energy, water and information technology. Criteria for assessing the environmental impact of the eligible projects are not only included in the selection criteria, but are also integrated into the main feasibility studies. Financing mainly aims to secure the viability of the projects from the environmental aspect. For example, in the energy sector this principle is translated into financing hydropower factories that are expensive (vis-à-vis coal factories) but environmentally cleaner.
5th NATIONAL COMMUNICATION TO THE UNFCCC 294
Cooperation at a regional level
i. Barcelona Convention and UNEP/MAP
Greece has assigned especially high priority to the 1976 Barcelona Convention concerning the Protection of the Mediterranean Sea against Pollution and its implementing programme. The Mediterranean Action Plan of UNEP, the first-ever plan adopted as a Regional Seas Programme under UNEP's umbrella, involves 21 countries bordering the Mediterranean Sea (as well as the EU), including the five North African Mediterranean Countries. Seven Protocols addressing specific aspects of Mediterranean environmental conservation complete the legal framework of the Barcelona Convention. Through MAP, the Contracting Parties to the Barcelona Convention and its Protocols are joining efforts to meet the challenges of protecting the marine and coastal environment while boosting regional and national plans to achieve sustainable development. Greece is very active within the UNEP/MAP - Barcelona Convention system, especially as UNEP/MAP Coordination Unit is based in Athens since 1981.
ii. Mediterranean Commission on Sustainable Development (MCSD)
The MCSD, created in 1996 by the Contracting Parties of the Barcelona Convention, is made up of 46 members. The UNEP/MAP Coordination Unit, based in Athens, ensures the role of MCSD Secretariat and coordinates the different working groups on a permanent basis. In addition to the recommendations presented to the Contracting Parties on specific Mediterranean challenges (e.g. energy and climate change; information and communication; integrated coastal zone management; management of water demand, marine pollution; sustainable development indicators; sustainable tourism; trade agreements; urban development; etc) the MCSD has provided major inputs to the formulation of the Mediterranean Strategy for Sustainable Development (MSSD) and spearheads its implementation at the country level. Greece is actively involved in the work of the MCSD and the development and implementation of the MSSD.
iii. EU Water Initiative – Mediterranean Component
In the framework of the MED EUWI, Country Dialogues are organised in selected Mediterranean countries, involving water stakeholders which include government authorities and agencies, local authorities, water users associations, civil society, academia, the private sector as well as international and national donors. More specifically:
Egypt: Activities of the running Phase I (until April 2009) support the preparation of the new 30-year Egyptian National Master Plan for Water and Wastewater and the Rural Sanitation Strategy (that is under development), within the Integrated Water Resource Management (IWRM) framework of the Egyptian National Water Resources Plan 2017. Activities include (i) an affordability assessment component, that develops financing scenarios that are socially and politically acceptable and (ii) a financing strategy component that offers different financing scenarios for discussion among stakeholders. Activities in Egypt are led by the Egyptian Holding Company for Water and Wastewater, following an agreement between the Ministers of Housing and of Water Resources and Irrigation. The Dialogue’s activities are implemented in close cooperation and under the technical coordination of OECD with the MED EUWI Secretariat. Related assessments and scenarios have been elaborated in 2008 and a set of public, multilateral and bilateral consultation events and meetings with the participation of authorities, stakeholders and donors were organized. A foreseen Phase II of the Dialogue (2009-2010/11) would be based on the results of Phase I. Overall, Phase II will aim to assist with: (i) building consensus in further identifying financially realistic water supply and sanitation and IWRM targets and the policies that will support their achievement, (ii) strengthening the co-ordination of activities taken by different parties involved in the water sector in Egypt, and (iii) further identifying governance and capacity development needs. For Phase II, core resources for dialogue activities have been secured through the Hellenic Ministry of Foreign Affairs and the
5th NATIONAL COMMUNICATION TO THE UNFCCC 295
GEF Strategic Partnership for the Mediterranean. Resources for consultants’ work are under negotiation with donors at the country level. The EUWI Thematic Budget may also contribute to activities, if so decided.
Libya: Targeted consultation activities on water governance in Libya were launched in 2007. Activities undertaken facilitated the establishment of an IWRM process in the country, through a structured approach with the collaboration of key national and regional institutions. An agreement with the Libyan General Water Authority and the African Water Facility on the implementation of elements of the Libyan Water Strategy is under discussion while additional technical activities are explored within the MED EUWI framework after request of the General Water Authority. Actions also contribute to the linked Rabat Declaration on IWRM Planning in North Africa (a sub-regional process launched in 2006 together with the UNEP Collaborating Centre on Water and Environment and the African Development Bank). Envisaged follow-up activities would aim to assist key stakeholders in Libya to develop a common understanding on critical IWRM planning issues with an emphasis on institutional settings. Financial support is discussed with the African Water Facility. The EUWI Thematic Budget (in case Libya is eligible and if so decided) and donors may contribute to activities.
Morocco: Morocco has also requested the organisation of a country dialogue. More Country Dialogues are currently implemented in the Middle East, i.e. with Lebanon, Palestine and Syria.
iv. “Barcelona Process: Union for the Mediterranean”
Within the framework of the Euro-Mediterranean Partnership (“Barcelona Process”), launched in 1995, Greece has been active and remains engaged in cooperation with Mediterranean partners on several environmental issues including on marine pollution control for the Mediterranean Sea. In 2005, “Horizon 2020” was launched, with Greece and the other partners agreeing to co-operate to de-pollute the Mediterranean by 2020, drawing on core EU funding to support the venture. The “Union for the Mediterranean” launched in July 2008, builds on the “Barcelona Process”, extends co-operation between the EU countries and Mediterranean countries and includes the de-pollution of the Mediterranean as one of its 6 priority action projects. In this context, Greece has submitted a project proposal officially incorporated in the context of the “Barcelona Process: Union for the Mediterranean”, aiming to support a “Multistakeholder Cooperation for the promotion of Sustainable Development in the Mediterranean with emphasis on water” with the intention to effectively support the elaboration of a new “Mediterranean Strategy on Water”.
Cooperation at a bilateral level
In 1999, the Ministry of Environment began a Bilateral Development Assistance Programme within the framework of the overall national programme. It was built on priorities and obligations associated with OECD DAC, UN institutions, the Rio Conventions of Biodiversity, Climate Change and Desertification, and Greece's bilateral environmental Memoranda of Understanding with neighbouring countries. The Ministry’s efforts focused on capacity building, and promoted the principles of demand-driven projects and local ownership. Thematic priorities included water and natural resources management, wastewater and solid waste management, climate change, and establishment of transboundary networks and monitoring mechanisms.
The targets set at the WSSD, as described in the Johannesburg Plan of Implementation (JPoI), together with the MDGs, set an integrated and detailed framework for the promotion of important issues related to the environment and sustainable development regarding the bilateral cooperation of Greece with Mediterranean countries of North Africa as well as with other African countries. Greece, through the Ministry of Environment, financed the initial phase of four Type II Initiative Partnerships, which were launched during WSSD and involved NGOs and other stakeholders as implementation actors. These four Type II Initiative Partnerships are:
5th NATIONAL COMMUNICATION TO THE UNFCCC 296
i. The “Euro-Mediterranean Water and Poverty Facility”
This initiative involves cooperation between Mediterranean countries, mainly Greece and Egypt, with Global Water Partnership-Mediterranean acting as implementation actor and financing from the Hellenic Ministry of Environment.
ii.“Mediterranean Education Initiative for Environment and Sustainability with Emphasis on Water and Waste (MEDIES - http://www.medies.net)”
This initiative involves cooperation between Mediterranean countries with the Mediterranean Information Office (ΜΙΟ-ECSDE) acting as implementation actor and financing from the Hellenic Ministry of Environment. This action is being effectively promoted in Mediterranean countries and has been included as a sub-programme in the framework of the National Strategy for Education on Sustainable Development of Greece, which is implemented through the Hellenic Ministry of National Education and Religious Affairs (http://www.ypepth.gr), as it has already been mentioned in the previous sections.
iii.“Initiative on the assessment of climate change impacts in African developing countries”
This initiative involves cooperation with Egypt during the first stage of the initiative and with Ghana and Senegal during the second stage of the initiative, with the National Observatory of Athens acting as an implementation actor and EURO 125,000 financing from the Hellenic Ministry of Environment.
iv.“Sustainable Water Management in the Balkan and Southeast Mediterranean area”
This initiative involves cooperation with countries of North Africa/Mediterranean, with the Region of Crete acting as an implementation actor and financing from the Hellenic Ministry of Environment.
Greece is currently further intensifying its efforts regarding ODA focusing at climate change adaptation. For example, Greece is currently financing programmes for adaptation to climate change in Least Developed Countries and in regions that, due to their geographical location, are under severe danger from climate change which mainly include Africa and Small Island States. In order to ensure the best possible utilisation of funds and distribution to programmes according to the most significant needs of the threatened regions, the Hellenic development assistance plan is implemented in coordination with regional organisations of the areas under consideration, such as the African Union.
9.3.4.2 NGOs initiatives: Mediterranean SOS Network
Apart from the projects that have been mentioned in Section 9.2.2.2, the Mediterranean SOS Network is participating in various projects that support and promote the cooperation between the Mediterranean countries.
Such indicative cooperation projects, aiming at the EuroMed cooperation, Civil Society and Intercultural Dialogue, include the following:
2008-2009: Project Partner in Lifelong Learning Programme “LAUTC-Learning About Us Through Culture”(Lead partner NGO CESIE, Italy, www.lautc.eu)
2007: Intercultural Youth Exchange Programme " Environment and Human Interactions: Practices from the past... Solutions for the future!",with the participation of 32 young people from six partner organizations from EuroMed Region, 26 July - 6 August, at Sifnos island, Greece - Financed by the European Commission programme YOUTH IN
5th NATIONAL COMMUNICATION TO THE UNFCCC 297
ACTION, Action 3.1,through the Greek General Secretariat for Youth, supported by the Municipality of Sifnos.
2006: Intercultural Youth Exchange Programme Med-Youth Creating a Sustainable Med-Future, with the participation of 27 young people from eight partner organizations from EuroMed Region, 20 - 31 July at Naxos Island, Greece - Supported by Anna Lindh Euro-Mediterranean Foundation for the Dialogue between Cultures.
Organized many international MEDA YOUTH projects involving orgs, trainers and youth leaders from all areas of the Mediterranean basin
2001: Establishment and development of MARE Social-Ecological Youth Network (supported by E.C, UNEP/MAP) - Sifnos, Cyclades, 16-25 August 2001 'Training for trainers on Euro-Med Co-operation and sustainability', with 75 young NGO members from 28 countries of the Euro-Med area.
5th NATIONAL COMMUNICATION TO THE UNFCCC 298
BIBLIOGRAPHY
A summary of the PRUDENCE model projections of changes in European climate during this century. Christensen & Christensen. 2007. 2007, Climatic Change, Vol. 81, pp. 7-30.
Agricultural University of Athens. 2007. Study on the rehabilitation and development of the agricultural and forestrial sectors and on the environmental protection in the areas touched by the fires of the summer 2007 - Synopsis. Study. Athens : Agricultural University of Athens, 2007. The study has been assigned to the Agricultural University of Athens by the Ministry of Rural Development and Food..
Alcamo, J., J.M. Moreno, B. Nováky, M. Bindi, R. Corobov, R.J.N. Devoy, C. Giannakopoulos, E. Martin, J.E. Olesen, A. Shvidenko. 2007. Europe. [ed.] O.F. Canziani, J.P. Palutikof, P.J. van der Linden and C.E. Hanson, Eds M.L. Parry. Climate Change 2007: Impacts, Adaptation and Vulnerability. Contribution of Working Group II to the Fourth Assessment Report. Cambridge, UK : Cambridge University Press, 2007, pp. 541-580.
DMCSEE, Drought Management Centre for Southeastern Europe. 2007. Drought Monitor. DMCSEE, Drought Management Centre for Southeastern Europe. [Online] 2007. [Cited: 15 September 2009.] http://www.dmcsee.org/en/drought_monitor/.
Doukakis, E. 2005. Coastal vulnerability and Risk Parameters. European Water. 2005, 11/12.
Founda, D. and Giannakopoulos, C. 2009. The exceptionally hot summer of 2007 in Athens, Greece - A typical summer in the future climate? Global and Planetary Change. 2009, 67, pp. 227-236.
Gambaiani, D. D., et al. 2008. Potential impacts of climate change and greenhouse gas emissions on Mediterranean marine ecosystems and ceteans. Review. United Kingdom : Marine Biological Association of the United Kingdom, 2008. doi: 10.1017/S0025315408002476.
Giannakopoulos, C., et al. 2005. Climate change impacts in the Mediterranean resulting from a 2oC global temperature rise. Gland, Switzerland : WWF, 2005.
Giannakopoulos, C., et al. 2009. Climatic change and associated impacts in the Mediterranean resulting from a 2oC global warming. Global and Planetary Change. 2009.
Hellenic Ministry of Rural Development and Food. November 2007. Programme of Rural Development of Greece 2007-2013 "Aleksandros Mpaltatzis". 4th edition Athens : Hellenic Republic, November 2007. Available in Greek..
Hellenic Transmission System Operator S.A. July 2008. Report on development of the Transmission System for the period 2008-2012. Athens : Hellenic Transmission System Operator S.A., July 2008. Available only in greek..
Joint EEA-JRC-WHO. 2008. Impacts of Europe's changing climate — 2008 indicator-based assessment. Copenhagen : Office for Official Publications of the European Communities, 2008. 978-92-9167-372-8.
Kakouros, Petros. 2008. Adaptation of the management of forests to climate change. Amfibion. Greek Biotope/Wetland Centre, 2008, 77. Available only in Greek..
Kazakis, G., et al. 2007. Vascular plant diversity and climate change in the alpine zone of the Lefka Ori, Crete. Biodiversity Conservation. 2007, 16.
Mazzocchi, Maria Grazia, et al. 2007. Temporal variability of Centropages typicus inthe Mediterranean Sea over seasonal-to-decadal scales. Progress in Oceanography. 2007, 72.
5th NATIONAL COMMUNICATION TO THE UNFCCC 299
Ministry for the Environment, Physical Planning and Public Works. December 2008. National Reporting to the Seventeenth Session of the Commission for Sustainable Development of the United Nations (UNCSD 17). Athens : Hellenic Republic, December 2008.
—. September 2007. Operational Programme Environment - Sustainable Development 2007-2013. Official Submission. Athens : Hellenic Republic, European Union, September 2007. CCI: 2007GR161PO005.
Ministry for the Environment, Spatial Planning and Public Works. February 2009. National Biodiversity Strategy. Athens : Ministry for the Environment, Spatial Planning and Public Works, February 2009. Compiled by the Greek Biotope/Wetland Centre (Goulandri Museum of Natural History). The document is under public consultation.
Ministry of Interior, Department of Natural Disasters Planning, Protection and Response. September 2009. Planning and Actions of Civil Protection for facing the risk of flooding events. Circular. Athens : Ministry of Interior, September 2009. Available in Greek only..
Ministry for the Environment, Physical Planning and Public Works. 2006. Report of Greece on Coastal Zone Management. Athens : Ministry for the Environment, Physical Planning and Public Works, 2006.
Morrocco, Spain & Greece. with the contribution of the MED EUWI Secretariat. 2008. Integrating the Climate Change Dimension into Water Resources Management in the Mediterranean. Theme Paper. 2008. This paper is presented by Morocco, Spain and Greece, with the contribution of the MED EUWI Secretariat.
National Observatory of Athens. 2007. Report on the results of climate change impact assessment in Greece, April 2007.
Siakavara, Aikaterini. 2008. Posidonia Medows: An oasis in the Mediterranean. Cretaquiarium - Thalassocosmos. [Online] 20 November 2008. [Cited: 6 October 2009.] Available only in Greek. http://www.cretaquarium.gr/article_view_photo.php?id=361.
Streftaris, N. and Zenetos, A. 2006. Alien Marine Species in the Mediterranean - the 100 ‘Worst Invasives’ and their Impact. Mediterranean Marine Science. 2006, Vol. 7, 1. Review Article..
The Climate of Greece. Hellenic National Meteorological Service. [Online] http://www.hnms.gr/hnms/english/climatology/climatology_html.
Tsakiris, D., et al. 2007. Application of the Drought Management Guidelines in Greece. [ed.] M. Moneo, A.Lopez-Francos A. Iglesias. Drought Management Guidelines Technical Annex. Zaragoza : CIHEAM (Centre International de Hautes Études Agronomiques Méditerranéennes) / EC MEDAWater (Euro-Mediterranean Regional Programme for Local Water Management of the European Commission), 2007, 16. Published in Series B : Etudes et Recherches, No. 58, Options Méditerranéennes.
—. 2007. Greece. Drought Management Guidelines: Examples of applications in Mediterranean countries. Zaragoza : European Commission - EuropeAid Co-operation Office, Euro-Mediterranean Regional Programme for Local Water Management (MEDA Water), Mediterranean Drought Preparedness and Mitigation Planning (MEDROPLAN), 2007.
Tsikliras, Athanassios C. and Stergiou, Konstantinos I. 2006. The effect of climate change on round sardinella (Sardinella aurita Valenciennes, 1847) landings. Thessaloniki : Hellenic Centre for Marine Research, 2006. Available in Greek only.
Tsimplis, M., et al. 2005. When humanities meet ecology:historic changes in Mediterranean and Black Sea marine biodiversity and ecosystems since the Roman period until nowadays.

5th NATIONAL COMMUNICATION TO THE UNFCCC 300
Languages, methodologies and perspectives. Summer school - Trieste - 2009. [Online] 30 June 2005. [Cited: 6 October 2009.] http://www.hmap-medbs-summerschool2009.org/index.html.
Yassoglou N. 2000. Climate change and soil. s.l. : EEA, 2000.
5th NATIONAL COMMUNICATION TO THE UNFCCC 301
ANNEXES

5th NATIONAL COMMUNICATION TO THE UNFCCC 302
A.I Summary tables on emission trends
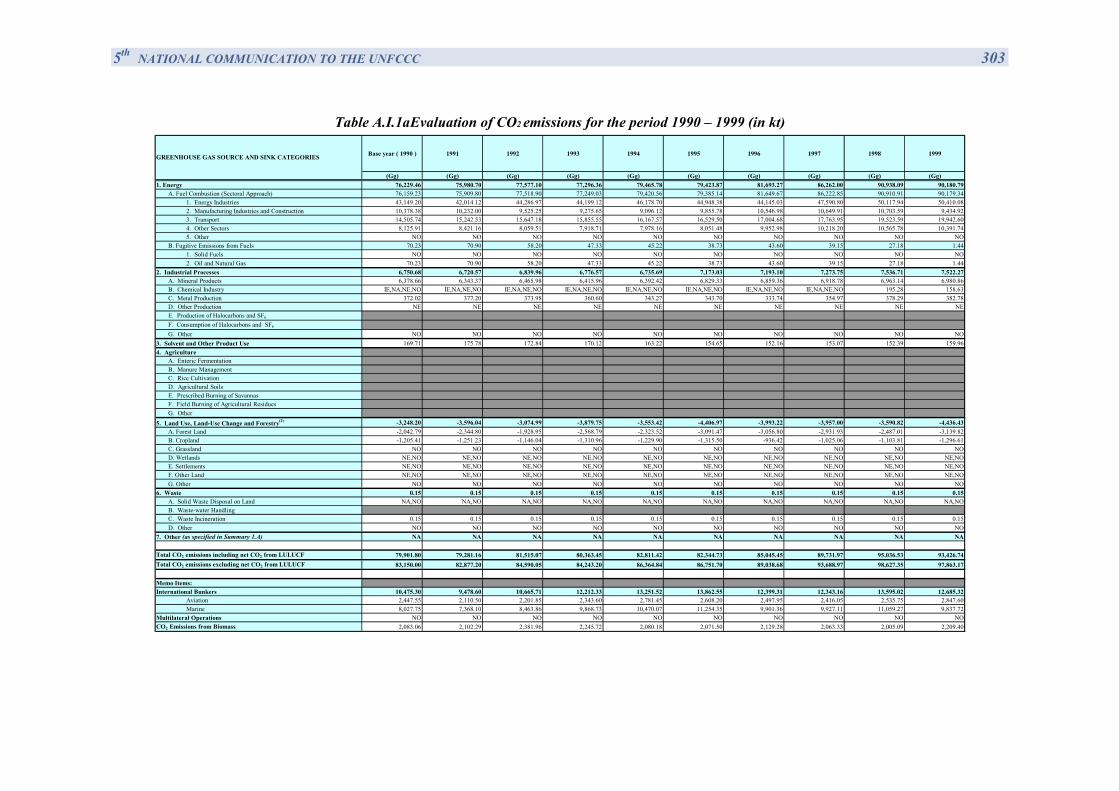
5th NATIONAL COMMUNICATION TO THE UNFCCC 303
Table A.Ι.1a Evaluation of CO2 emissions for the period 1990 – 1999 (in kt)
Base year ( 1990 ) 1991 1992 1993 1994 1995 1996 1997 1998 1999
(Gg) (Gg) (Gg) (Gg) (Gg) (Gg) (Gg) (Gg) (Gg) (Gg)1. Energy 76,229.46 75,980.70 77,577.10 77,296.36 79,465.78 79,423.87 81,693.27 86,262.00 90,938.09 90,180.79
A. Fuel Combustion (Sectoral Approach) 76,159.23 75,909.80 77,518.90 77,249.03 79,420.56 79,385.14 81,649.67 86,222.85 90,910.91 90,179.341. Energy Industries 43,149.20 42,014.12 44,286.97 44,199.12 46,178.70 44,948.38 44,145.03 47,590.80 50,117.94 50,410.082. Manufacturing Industries and Construction 10,378.38 10,232.00 9,525.25 9,275.65 9,096.12 9,855.78 10,546.98 10,649.91 10,703.59 9,434.923. Transport 14,505.74 15,242.53 15,647.18 15,855.55 16,167.57 16,529.50 17,004.68 17,763.95 19,523.59 19,942.604. Other Sectors 8,125.91 8,421.16 8,059.51 7,918.71 7,978.16 8,051.48 9,952.98 10,218.20 10,565.78 10,391.745. Other NO NO NO NO NO NO NO NO NO NO
B. Fugitive Emissions from Fuels 70.23 70.90 58.20 47.33 45.22 38.73 43.60 39.15 27.18 1.441. Solid Fuels NO NO NO NO NO NO NO NO NO NO2. Oil and Natural Gas 70.23 70.90 58.20 47.33 45.22 38.73 43.60 39.15 27.18 1.44
2. Industrial Processes 6,750.68 6,720.57 6,839.96 6,776.57 6,735.69 7,173.03 7,193.10 7,273.75 7,536.71 7,522.27A. Mineral Products 6,378.66 6,343.37 6,465.98 6,415.96 6,392.42 6,829.33 6,859.36 6,918.78 6,963.14 6,980.86B. Chemical Industry IE,NA,NE,NO IE,NA,NE,NO IE,NA,NE,NO IE,NA,NE,NO IE,NA,NE,NO IE,NA,NE,NO IE,NA,NE,NO IE,NA,NE,NO 195.28 158.63C. Metal Production 372.02 377.20 373.98 360.60 343.27 343.70 333.74 354.97 378.29 382.78D. Other Production NE NE NE NE NE NE NE NE NE NEE. Production of Halocarbons and SF6
F. Consumption of Halocarbons and SF6
G. Other NO NO NO NO NO NO NO NO NO NO3. Solvent and Other Product Use 169.71 175.78 172.84 170.12 163.22 154.65 152.16 153.07 152.39 159.964. Agriculture
A. Enteric FermentationB. Manure ManagementC. Rice CultivationD. Agricultural Soils E. Prescribed Burning of SavannasF. Field Burning of Agricultural ResiduesG. Other
5. Land Use, Land-Use Change and Forestry(2) -3,248.20 -3,596.04 -3,074.99 -3,879.75 -3,553.42 -4,406.97 -3,993.22 -3,957.00 -3,590.82 -4,436.43A. Forest Land -2,042.79 -2,344.80 -1,928.95 -2,568.79 -2,323.52 -3,091.47 -3,056.80 -2,931.93 -2,487.01 -3,139.82B. Cropland -1,205.41 -1,251.23 -1,146.04 -1,310.96 -1,229.90 -1,315.50 -936.42 -1,025.06 -1,103.81 -1,296.61C. Grassland NO NO NO NO NO NO NO NO NO NOD. Wetlands NE,NO NE,NO NE,NO NE,NO NE,NO NE,NO NE,NO NE,NO NE,NO NE,NOE. Settlements NE,NO NE,NO NE,NO NE,NO NE,NO NE,NO NE,NO NE,NO NE,NO NE,NOF. Other Land NE,NO NE,NO NE,NO NE,NO NE,NO NE,NO NE,NO NE,NO NE,NO NE,NOG. Other NO NO NO NO NO NO NO NO NO NO
6. Waste 0.15 0.15 0.15 0.15 0.15 0.15 0.15 0.15 0.15 0.15A. Solid Waste Disposal on Land NA,NO NA,NO NA,NO NA,NO NA,NO NA,NO NA,NO NA,NO NA,NO NA,NOB. Waste-water HandlingC. Waste Incineration 0.15 0.15 0.15 0.15 0.15 0.15 0.15 0.15 0.15 0.15D. Other NO NO NO NO NO NO NO NO NO NO
7. Other (as specified in Summary 1.A) NA NA NA NA NA NA NA NA NA NA
Total CO2 emissions including net CO2 from LULUCF 79,901.80 79,281.16 81,515.07 80,363.45 82,811.42 82,344.73 85,045.45 89,731.97 95,036.53 93,426.74Total CO2 emissions excluding net CO2 from LULUCF 83,150.00 82,877.20 84,590.05 84,243.20 86,364.84 86,751.70 89,038.68 93,688.97 98,627.35 97,863.17
Memo Items:International Bunkers 10,475.30 9,478.60 10,665.71 12,212.33 13,251.52 13,862.55 12,399.31 12,343.16 13,595.02 12,685.32
Aviation 2,447.55 2,110.50 2,201.85 2,343.60 2,781.45 2,608.20 2,497.95 2,416.05 2,535.75 2,847.60Marine 8,027.75 7,368.10 8,463.86 9,868.73 10,470.07 11,254.35 9,901.36 9,927.11 11,059.27 9,837.72
Multilateral Operations NO NO NO NO NO NO NO NO NO NOCO2 Emissions from Biomass 2,083.06 2,102.29 2,381.96 2,245.72 2,080.18 2,071.50 2,129.28 2,063.33 2,005.09 2,209.40
GREENHOUSE GAS SOURCE AND SINK CATEGORIES
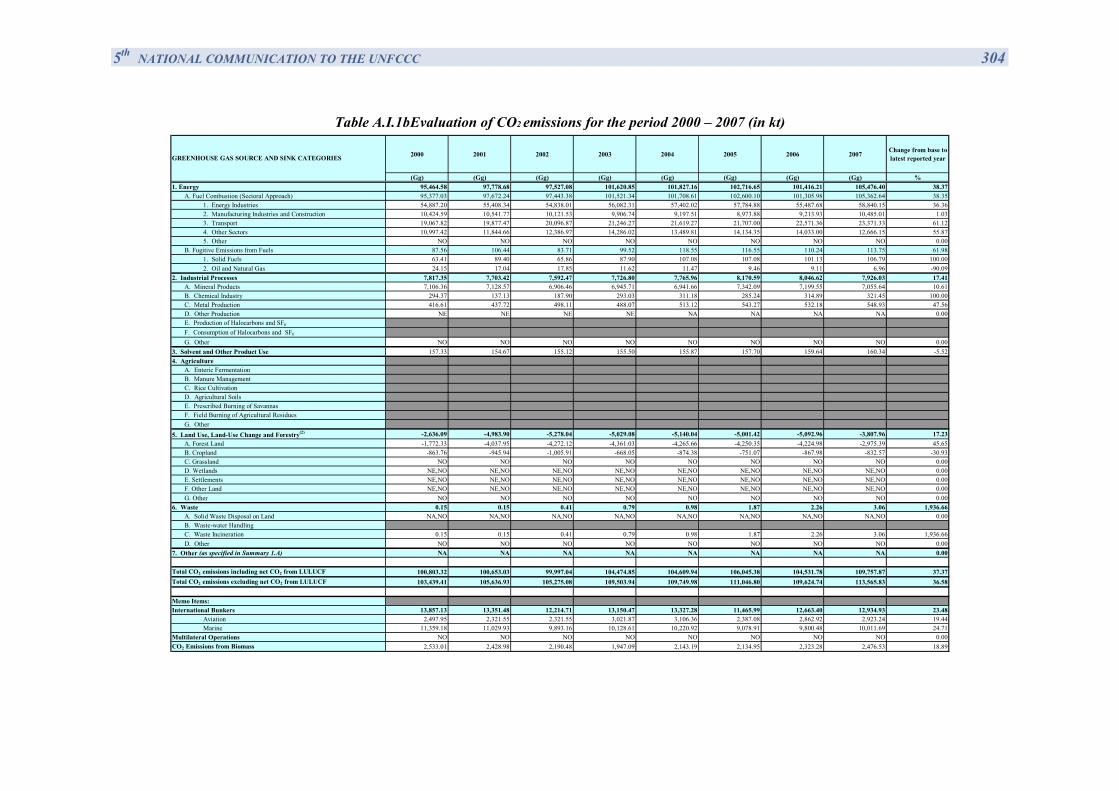
5th NATIONAL COMMUNICATION TO THE UNFCCC 304
Table A.Ι.1b Evaluation of CO2 emissions for the period 2000 – 2007 (in kt)
2000 2001 2002 2003 2004 2005 2006 2007Change from base to latest reported year
(Gg) (Gg) (Gg) (Gg) (Gg) (Gg) (Gg) (Gg) %1. Energy 95,464.58 97,778.68 97,527.08 101,620.85 101,827.16 102,716.65 101,416.21 105,476.40 38.37
A. Fuel Combustion (Sectoral Approach) 95,377.03 97,672.24 97,443.38 101,521.34 101,708.61 102,600.10 101,305.98 105,362.64 38.351. Energy Industries 54,887.20 55,408.34 54,838.01 56,082.31 57,402.02 57,784.88 55,487.68 58,840.15 36.362. Manufacturing Industries and Construction 10,424.59 10,541.77 10,121.53 9,906.74 9,197.51 8,973.88 9,213.93 10,485.01 1.033. Transport 19,067.82 19,877.47 20,096.87 21,246.27 21,619.27 21,707.00 22,571.36 23,371.33 61.124. Other Sectors 10,997.42 11,844.66 12,386.97 14,286.02 13,489.81 14,134.35 14,033.00 12,666.15 55.875. Other NO NO NO NO NO NO NO NO 0.00
B. Fugitive Emissions from Fuels 87.56 106.44 83.71 99.52 118.55 116.55 110.24 113.75 61.981. Solid Fuels 63.41 89.40 65.86 87.90 107.08 107.08 101.13 106.79 100.002. Oil and Natural Gas 24.15 17.04 17.85 11.62 11.47 9.46 9.11 6.96 -90.09
2. Industrial Processes 7,817.35 7,703.42 7,592.47 7,726.80 7,765.96 8,170.59 8,046.62 7,926.03 17.41A. Mineral Products 7,106.36 7,128.57 6,906.46 6,945.71 6,941.66 7,342.09 7,199.55 7,055.64 10.61B. Chemical Industry 294.37 137.13 187.90 293.03 311.18 285.24 314.89 321.45 100.00C. Metal Production 416.61 437.72 498.11 488.07 513.12 543.27 532.18 548.93 47.56D. Other Production NE NE NE NE NA NA NA NA 0.00E. Production of Halocarbons and SF6
F. Consumption of Halocarbons and SF6
G. Other NO NO NO NO NO NO NO NO 0.003. Solvent and Other Product Use 157.33 154.67 155.12 155.50 155.87 157.70 159.64 160.34 -5.524. Agriculture
A. Enteric FermentationB. Manure ManagementC. Rice CultivationD. Agricultural Soils E. Prescribed Burning of SavannasF. Field Burning of Agricultural ResiduesG. Other
5. Land Use, Land-Use Change and Forestry(2) -2,636.09 -4,983.90 -5,278.04 -5,029.08 -5,140.04 -5,001.42 -5,092.96 -3,807.96 17.23A. Forest Land -1,772.33 -4,037.95 -4,272.12 -4,361.03 -4,265.66 -4,250.35 -4,224.98 -2,975.39 45.65B. Cropland -863.76 -945.94 -1,005.91 -668.05 -874.38 -751.07 -867.98 -832.57 -30.93C. Grassland NO NO NO NO NO NO NO NO 0.00D. Wetlands NE,NO NE,NO NE,NO NE,NO NE,NO NE,NO NE,NO NE,NO 0.00E. Settlements NE,NO NE,NO NE,NO NE,NO NE,NO NE,NO NE,NO NE,NO 0.00F. Other Land NE,NO NE,NO NE,NO NE,NO NE,NO NE,NO NE,NO NE,NO 0.00G. Other NO NO NO NO NO NO NO NO 0.00
6. Waste 0.15 0.15 0.41 0.79 0.98 1.87 2.26 3.06 1,936.66A. Solid Waste Disposal on Land NA,NO NA,NO NA,NO NA,NO NA,NO NA,NO NA,NO NA,NO 0.00B. Waste-water HandlingC. Waste Incineration 0.15 0.15 0.41 0.79 0.98 1.87 2.26 3.06 1,936.66D. Other NO NO NO NO NO NO NO NO 0.00
7. Other (as specified in Summary 1.A) NA NA NA NA NA NA NA NA 0.00
Total CO2 emissions including net CO2 from LULUCF 100,803.32 100,653.03 99,997.04 104,474.85 104,609.94 106,045.38 104,531.78 109,757.87 37.37Total CO2 emissions excluding net CO2 from LULUCF 103,439.41 105,636.93 105,275.08 109,503.94 109,749.98 111,046.80 109,624.74 113,565.83 36.58
Memo Items:International Bunkers 13,857.13 13,351.48 12,214.71 13,150.47 13,327.28 11,465.99 12,663.40 12,934.93 23.48
Aviation 2,497.95 2,321.55 2,321.55 3,021.87 3,106.36 2,387.08 2,862.92 2,923.24 19.44Marine 11,359.18 11,029.93 9,893.16 10,128.61 10,220.92 9,078.91 9,800.48 10,011.69 24.71
Multilateral Operations NO NO NO NO NO NO NO NO 0.00CO2 Emissions from Biomass 2,533.01 2,428.98 2,190.48 1,947.09 2,143.19 2,134.95 2,323.28 2,476.53 18.89
GREENHOUSE GAS SOURCE AND SINK CATEGORIES
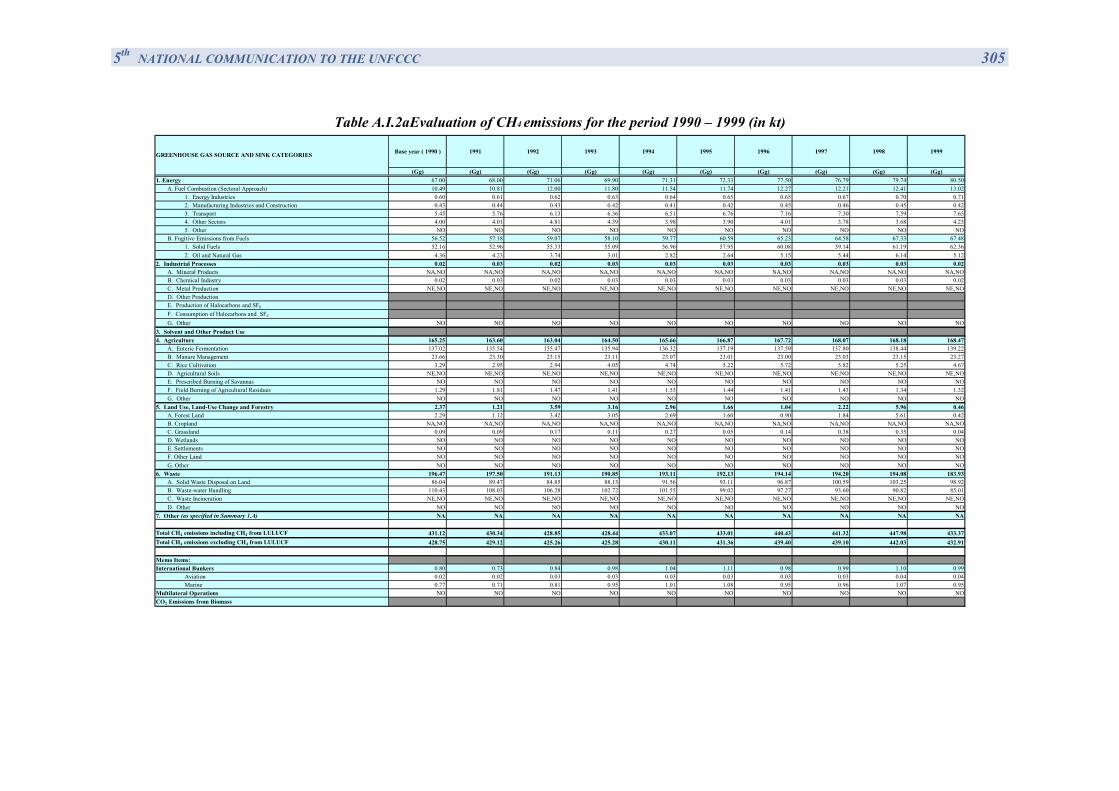
5th NATIONAL COMMUNICATION TO THE UNFCCC 305
Table A.Ι.2a Evaluation of CH4 emissions for the period 1990 – 1999 (in kt)
Base year ( 1990 ) 1991 1992 1993 1994 1995 1996 1997 1998 1999
(Gg) (Gg) (Gg) (Gg) (Gg) (Gg) (Gg) (Gg) (Gg) (Gg)1. Energy 67.00 68.00 71.06 69.90 71.31 72.33 77.50 76.79 79.74 80.50
A. Fuel Combustion (Sectoral Approach) 10.49 10.81 12.00 11.80 11.54 11.74 12.27 12.21 12.41 13.021. Energy Industries 0.60 0.61 0.62 0.63 0.64 0.65 0.65 0.67 0.70 0.712. Manufacturing Industries and Construction 0.43 0.44 0.43 0.42 0.41 0.42 0.45 0.46 0.45 0.423. Transport 5.45 5.76 6.13 6.36 6.51 6.76 7.16 7.30 7.59 7.654. Other Sectors 4.00 4.01 4.81 4.39 3.98 3.90 4.01 3.78 3.68 4.235. Other NO NO NO NO NO NO NO NO NO NO
B. Fugitive Emissions from Fuels 56.52 57.18 59.07 58.10 59.77 60.59 65.23 64.58 67.33 67.481. Solid Fuels 52.16 52.96 55.33 55.09 56.96 57.95 60.08 59.14 61.19 62.362. Oil and Natural Gas 4.36 4.23 3.74 3.01 2.82 2.64 5.15 5.44 6.14 5.12
2. Industrial Processes 0.02 0.03 0.02 0.03 0.03 0.03 0.03 0.03 0.03 0.02A. Mineral Products NA,NO NA,NO NA,NO NA,NO NA,NO NA,NO NA,NO NA,NO NA,NO NA,NOB. Chemical Industry 0.02 0.03 0.02 0.03 0.03 0.03 0.03 0.03 0.03 0.02C. Metal Production NE,NO NE,NO NE,NO NE,NO NE,NO NE,NO NE,NO NE,NO NE,NO NE,NOD. Other ProductionE. Production of Halocarbons and SF6
F. Consumption of Halocarbons and SF6
G. Other NO NO NO NO NO NO NO NO NO NO3. Solvent and Other Product Use 4. Agriculture 165.25 163.60 163.04 164.50 165.66 166.87 167.72 168.07 168.18 168.47
A. Enteric Fermentation 137.02 135.54 135.47 135.94 136.32 137.19 137.59 137.80 138.44 139.22B. Manure Management 23.66 23.30 23.15 23.11 23.07 23.01 23.00 23.03 23.15 23.27C. Rice Cultivation 3.29 2.95 2.94 4.05 4.74 5.22 5.72 5.82 5.25 4.67D. Agricultural Soils NE,NO NE,NO NE,NO NE,NO NE,NO NE,NO NE,NO NE,NO NE,NO NE,NOE. Prescribed Burning of Savannas NO NO NO NO NO NO NO NO NO NOF. Field Burning of Agricultural Residues 1.29 1.81 1.47 1.41 1.53 1.44 1.41 1.43 1.34 1.32G. Other NO NO NO NO NO NO NO NO NO NO
5. Land Use, Land-Use Change and Forestry 2.37 1.21 3.59 3.16 2.96 1.66 1.04 2.22 5.96 0.46A. Forest Land 2.29 1.12 3.42 3.05 2.69 1.60 0.90 1.84 5.61 0.42B. Cropland NA,NO NA,NO NA,NO NA,NO NA,NO NA,NO NA,NO NA,NO NA,NO NA,NOC. Grassland 0.09 0.09 0.17 0.11 0.27 0.05 0.14 0.38 0.35 0.04D. Wetlands NO NO NO NO NO NO NO NO NO NOE. Settlements NO NO NO NO NO NO NO NO NO NOF. Other Land NO NO NO NO NO NO NO NO NO NOG. Other NO NO NO NO NO NO NO NO NO NO
6. Waste 196.47 197.50 191.13 190.85 193.11 192.13 194.14 194.20 194.08 183.93A. Solid Waste Disposal on Land 86.04 89.47 84.85 88.13 91.56 93.11 96.87 100.59 103.25 98.92B. Waste-water Handling 110.43 108.03 106.28 102.72 101.55 99.02 97.27 93.60 90.82 85.01C. Waste Incineration NE,NO NE,NO NE,NO NE,NO NE,NO NE,NO NE,NO NE,NO NE,NO NE,NOD. Other NO NO NO NO NO NO NO NO NO NO
7. Other (as specified in Summary 1.A) NA NA NA NA NA NA NA NA NA NA
Total CH4 emissions including CH4 from LULUCF 431.12 430.34 428.85 428.44 433.07 433.01 440.43 441.32 447.98 433.37Total CH4 emissions excluding CH4 from LULUCF 428.75 429.12 425.26 425.28 430.11 431.36 439.40 439.10 442.03 432.91
Memo Items:International Bunkers 0.80 0.73 0.84 0.98 1.04 1.11 0.98 0.99 1.10 0.99
Aviation 0.02 0.02 0.03 0.03 0.03 0.03 0.03 0.03 0.04 0.04Marine 0.77 0.71 0.81 0.95 1.01 1.08 0.95 0.96 1.07 0.95
Multilateral Operations NO NO NO NO NO NO NO NO NO NOCO2 Emissions from Biomass
GREENHOUSE GAS SOURCE AND SINK CATEGORIES
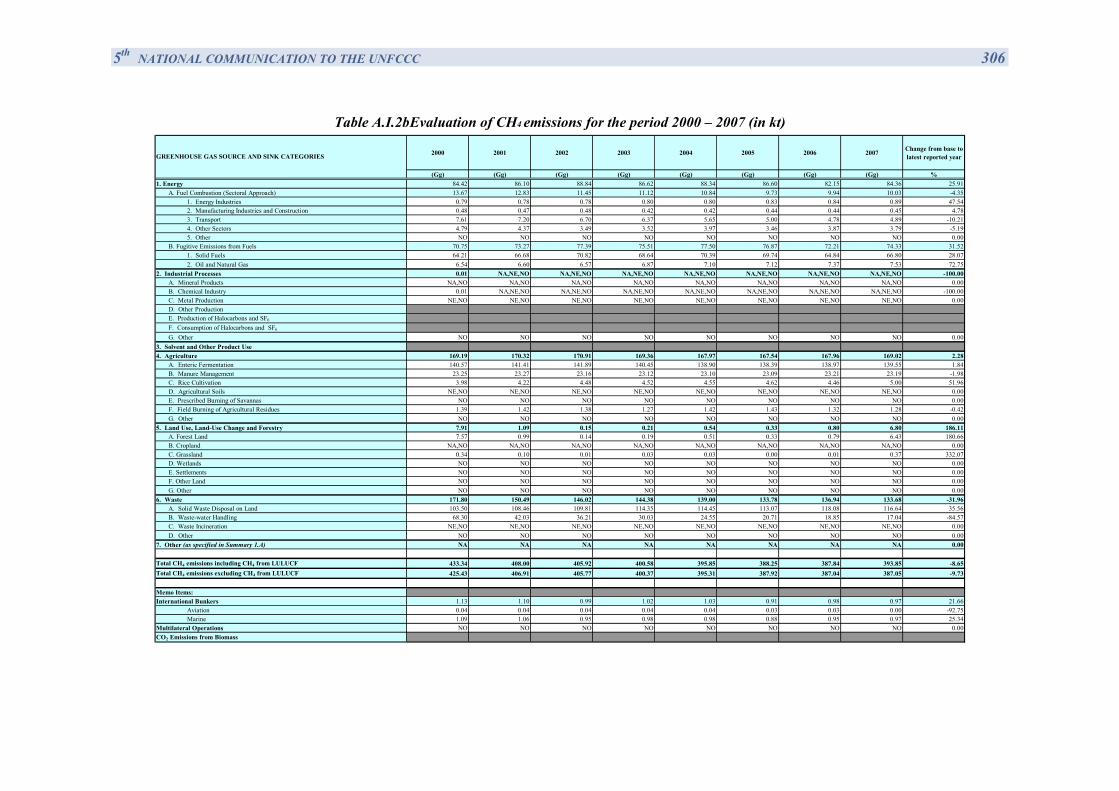
5th NATIONAL COMMUNICATION TO THE UNFCCC 306
Table A.Ι.2b Evaluation of CH4 emissions for the period 2000 – 2007 (in kt)
2000 2001 2002 2003 2004 2005 2006 2007 Change from base to latest reported year
(Gg) (Gg) (Gg) (Gg) (Gg) (Gg) (Gg) (Gg) %1. Energy 84.42 86.10 88.84 86.62 88.34 86.60 82.15 84.36 25.91
A. Fuel Combustion (Sectoral Approach) 13.67 12.83 11.45 11.12 10.84 9.73 9.94 10.03 -4.351. Energy Industries 0.79 0.78 0.78 0.80 0.80 0.83 0.84 0.89 47.542. Manufacturing Industries and Construction 0.48 0.47 0.48 0.42 0.42 0.44 0.44 0.45 4.783. Transport 7.61 7.20 6.70 6.37 5.65 5.00 4.78 4.89 -10.214. Other Sectors 4.79 4.37 3.49 3.52 3.97 3.46 3.87 3.79 -5.195. Other NO NO NO NO NO NO NO NO 0.00
B. Fugitive Emissions from Fuels 70.75 73.27 77.39 75.51 77.50 76.87 72.21 74.33 31.521. Solid Fuels 64.21 66.68 70.82 68.64 70.39 69.74 64.84 66.80 28.072. Oil and Natural Gas 6.54 6.60 6.57 6.87 7.10 7.12 7.37 7.53 72.75
2. Industrial Processes 0.01 NA,NE,NO NA,NE,NO NA,NE,NO NA,NE,NO NA,NE,NO NA,NE,NO NA,NE,NO -100.00A. Mineral Products NA,NO NA,NO NA,NO NA,NO NA,NO NA,NO NA,NO NA,NO 0.00B. Chemical Industry 0.01 NA,NE,NO NA,NE,NO NA,NE,NO NA,NE,NO NA,NE,NO NA,NE,NO NA,NE,NO -100.00C. Metal Production NE,NO NE,NO NE,NO NE,NO NE,NO NE,NO NE,NO NE,NO 0.00D. Other ProductionE. Production of Halocarbons and SF6
F. Consumption of Halocarbons and SF6
G. Other NO NO NO NO NO NO NO NO 0.003. Solvent and Other Product Use 4. Agriculture 169.19 170.32 170.91 169.36 167.97 167.54 167.96 169.02 2.28
A. Enteric Fermentation 140.57 141.41 141.89 140.45 138.90 138.39 138.97 139.55 1.84B. Manure Management 23.25 23.27 23.16 23.12 23.10 23.09 23.21 23.19 -1.98C. Rice Cultivation 3.98 4.22 4.48 4.52 4.55 4.62 4.46 5.00 51.96D. Agricultural Soils NE,NO NE,NO NE,NO NE,NO NE,NO NE,NO NE,NO NE,NO 0.00E. Prescribed Burning of Savannas NO NO NO NO NO NO NO NO 0.00F. Field Burning of Agricultural Residues 1.39 1.42 1.38 1.27 1.42 1.43 1.32 1.28 -0.42G. Other NO NO NO NO NO NO NO NO 0.00
5. Land Use, Land-Use Change and Forestry 7.91 1.09 0.15 0.21 0.54 0.33 0.80 6.80 186.11A. Forest Land 7.57 0.99 0.14 0.19 0.51 0.33 0.79 6.43 180.66B. Cropland NA,NO NA,NO NA,NO NA,NO NA,NO NA,NO NA,NO NA,NO 0.00C. Grassland 0.34 0.10 0.01 0.03 0.03 0.00 0.01 0.37 332.07D. Wetlands NO NO NO NO NO NO NO NO 0.00E. Settlements NO NO NO NO NO NO NO NO 0.00F. Other Land NO NO NO NO NO NO NO NO 0.00G. Other NO NO NO NO NO NO NO NO 0.00
6. Waste 171.80 150.49 146.02 144.38 139.00 133.78 136.94 133.68 -31.96A. Solid Waste Disposal on Land 103.50 108.46 109.81 114.35 114.45 113.07 118.08 116.64 35.56B. Waste-water Handling 68.30 42.03 36.21 30.03 24.55 20.71 18.85 17.04 -84.57C. Waste Incineration NE,NO NE,NO NE,NO NE,NO NE,NO NE,NO NE,NO NE,NO 0.00D. Other NO NO NO NO NO NO NO NO 0.00
7. Other (as specified in Summary 1.A) NA NA NA NA NA NA NA NA 0.00
Total CH4 emissions including CH4 from LULUCF 433.34 408.00 405.92 400.58 395.85 388.25 387.84 393.85 -8.65Total CH4 emissions excluding CH4 from LULUCF 425.43 406.91 405.77 400.37 395.31 387.92 387.04 387.05 -9.73
Memo Items:International Bunkers 1.13 1.10 0.99 1.02 1.03 0.91 0.98 0.97 21.66
Aviation 0.04 0.04 0.04 0.04 0.04 0.03 0.03 0.00 -92.75Marine 1.09 1.06 0.95 0.98 0.98 0.88 0.95 0.97 25.34
Multilateral Operations NO NO NO NO NO NO NO NO 0.00CO2 Emissions from Biomass
GREENHOUSE GAS SOURCE AND SINK CATEGORIES
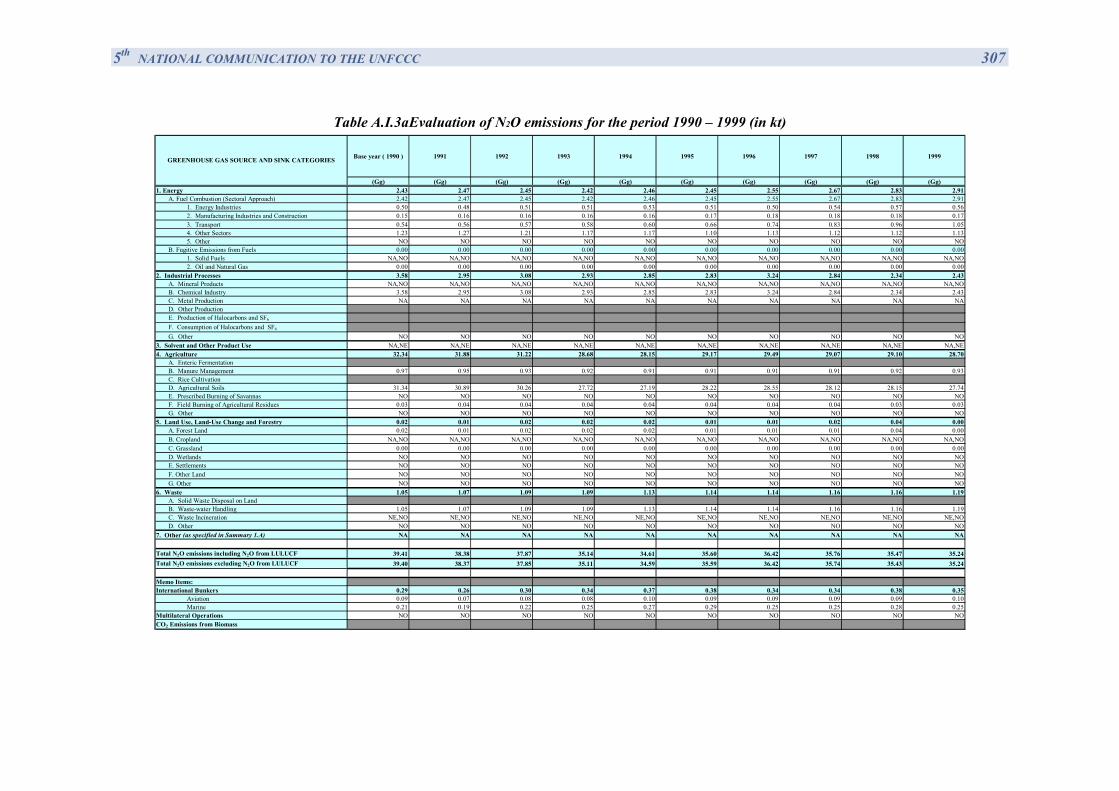
5th NATIONAL COMMUNICATION TO THE UNFCCC 307
Table A.Ι.3a Evaluation of Ν2Ο emissions for the period 1990 – 1999 (in kt)
Base year ( 1990 ) 1991 1992 1993 1994 1995 1996 1997 1998 1999
(Gg) (Gg) (Gg) (Gg) (Gg) (Gg) (Gg) (Gg) (Gg) (Gg)1. Energy 2.43 2.47 2.45 2.42 2.46 2.45 2.55 2.67 2.83 2.91
A. Fuel Combustion (Sectoral Approach) 2.42 2.47 2.45 2.42 2.46 2.45 2.55 2.67 2.83 2.911. Energy Industries 0.50 0.48 0.51 0.51 0.53 0.51 0.50 0.54 0.57 0.562. Manufacturing Industries and Construction 0.15 0.16 0.16 0.16 0.16 0.17 0.18 0.18 0.18 0.173. Transport 0.54 0.56 0.57 0.58 0.60 0.66 0.74 0.83 0.96 1.054. Other Sectors 1.23 1.27 1.21 1.17 1.17 1.10 1.13 1.12 1.12 1.135. Other NO NO NO NO NO NO NO NO NO NO
B. Fugitive Emissions from Fuels 0.00 0.00 0.00 0.00 0.00 0.00 0.00 0.00 0.00 0.001. Solid Fuels NA,NO NA,NO NA,NO NA,NO NA,NO NA,NO NA,NO NA,NO NA,NO NA,NO2. Oil and Natural Gas 0.00 0.00 0.00 0.00 0.00 0.00 0.00 0.00 0.00 0.00
2. Industrial Processes 3.58 2.95 3.08 2.93 2.85 2.83 3.24 2.84 2.34 2.43A. Mineral Products NA,NO NA,NO NA,NO NA,NO NA,NO NA,NO NA,NO NA,NO NA,NO NA,NOB. Chemical Industry 3.58 2.95 3.08 2.93 2.85 2.83 3.24 2.84 2.34 2.43C. Metal Production NA NA NA NA NA NA NA NA NA NAD. Other ProductionE. Production of Halocarbons and SF6
F. Consumption of Halocarbons and SF6
G. Other NO NO NO NO NO NO NO NO NO NO3. Solvent and Other Product Use NA,NE NA,NE NA,NE NA,NE NA,NE NA,NE NA,NE NA,NE NA,NE NA,NE4. Agriculture 32.34 31.88 31.22 28.68 28.15 29.17 29.49 29.07 29.10 28.70
A. Enteric FermentationB. Manure Management 0.97 0.95 0.93 0.92 0.91 0.91 0.91 0.91 0.92 0.93C. Rice CultivationD. Agricultural Soils 31.34 30.89 30.26 27.72 27.19 28.22 28.55 28.12 28.15 27.74E. Prescribed Burning of Savannas NO NO NO NO NO NO NO NO NO NOF. Field Burning of Agricultural Residues 0.03 0.04 0.04 0.04 0.04 0.04 0.04 0.04 0.03 0.03G. Other NO NO NO NO NO NO NO NO NO NO
5. Land Use, Land-Use Change and Forestry 0.02 0.01 0.02 0.02 0.02 0.01 0.01 0.02 0.04 0.00A. Forest Land 0.02 0.01 0.02 0.02 0.02 0.01 0.01 0.01 0.04 0.00B. Cropland NA,NO NA,NO NA,NO NA,NO NA,NO NA,NO NA,NO NA,NO NA,NO NA,NOC. Grassland 0.00 0.00 0.00 0.00 0.00 0.00 0.00 0.00 0.00 0.00D. Wetlands NO NO NO NO NO NO NO NO NO NOE. Settlements NO NO NO NO NO NO NO NO NO NOF. Other Land NO NO NO NO NO NO NO NO NO NOG. Other NO NO NO NO NO NO NO NO NO NO
6. Waste 1.05 1.07 1.09 1.09 1.13 1.14 1.14 1.16 1.16 1.19A. Solid Waste Disposal on LandB. Waste-water Handling 1.05 1.07 1.09 1.09 1.13 1.14 1.14 1.16 1.16 1.19C. Waste Incineration NE,NO NE,NO NE,NO NE,NO NE,NO NE,NO NE,NO NE,NO NE,NO NE,NOD. Other NO NO NO NO NO NO NO NO NO NO
7. Other (as specified in Summary 1.A) NA NA NA NA NA NA NA NA NA NA
Total N2O emissions including N2O from LULUCF 39.41 38.38 37.87 35.14 34.61 35.60 36.42 35.76 35.47 35.24Total N2O emissions excluding N2O from LULUCF 39.40 38.37 37.85 35.11 34.59 35.59 36.42 35.74 35.43 35.24
Memo Items:International Bunkers 0.29 0.26 0.30 0.34 0.37 0.38 0.34 0.34 0.38 0.35
Aviation 0.09 0.07 0.08 0.08 0.10 0.09 0.09 0.09 0.09 0.10Marine 0.21 0.19 0.22 0.25 0.27 0.29 0.25 0.25 0.28 0.25
Multilateral Operations NO NO NO NO NO NO NO NO NO NOCO2 Emissions from Biomass
GREENHOUSE GAS SOURCE AND SINK CATEGORIES
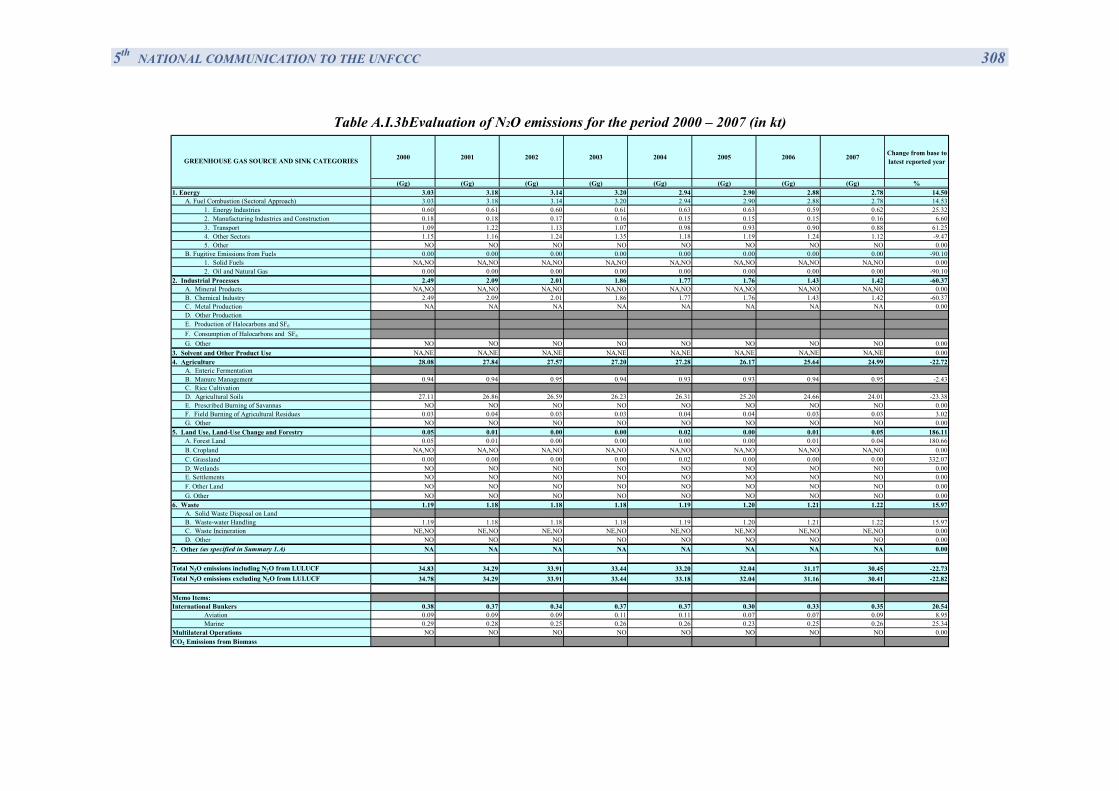
5th NATIONAL COMMUNICATION TO THE UNFCCC 308
Table A.Ι.3b Evaluation of Ν2Ο emissions for the period 2000 – 2007 (in kt)
2000 2001 2002 2003 2004 2005 2006 2007 Change from base to latest reported year
(Gg) (Gg) (Gg) (Gg) (Gg) (Gg) (Gg) (Gg) %1. Energy 3.03 3.18 3.14 3.20 2.94 2.90 2.88 2.78 14.50
A. Fuel Combustion (Sectoral Approach) 3.03 3.18 3.14 3.20 2.94 2.90 2.88 2.78 14.531. Energy Industries 0.60 0.61 0.60 0.61 0.63 0.63 0.59 0.62 25.322. Manufacturing Industries and Construction 0.18 0.18 0.17 0.16 0.15 0.15 0.15 0.16 6.603. Transport 1.09 1.22 1.13 1.07 0.98 0.93 0.90 0.88 61.254. Other Sectors 1.15 1.16 1.24 1.35 1.18 1.19 1.24 1.12 -9.475. Other NO NO NO NO NO NO NO NO 0.00
B. Fugitive Emissions from Fuels 0.00 0.00 0.00 0.00 0.00 0.00 0.00 0.00 -90.101. Solid Fuels NA,NO NA,NO NA,NO NA,NO NA,NO NA,NO NA,NO NA,NO 0.002. Oil and Natural Gas 0.00 0.00 0.00 0.00 0.00 0.00 0.00 0.00 -90.10
2. Industrial Processes 2.49 2.09 2.01 1.86 1.77 1.76 1.43 1.42 -60.37A. Mineral Products NA,NO NA,NO NA,NO NA,NO NA,NO NA,NO NA,NO NA,NO 0.00B. Chemical Industry 2.49 2.09 2.01 1.86 1.77 1.76 1.43 1.42 -60.37C. Metal Production NA NA NA NA NA NA NA NA 0.00D. Other ProductionE. Production of Halocarbons and SF6
F. Consumption of Halocarbons and SF6
G. Other NO NO NO NO NO NO NO NO 0.003. Solvent and Other Product Use NA,NE NA,NE NA,NE NA,NE NA,NE NA,NE NA,NE NA,NE 0.004. Agriculture 28.08 27.84 27.57 27.20 27.28 26.17 25.64 24.99 -22.72
A. Enteric FermentationB. Manure Management 0.94 0.94 0.95 0.94 0.93 0.93 0.94 0.95 -2.43C. Rice CultivationD. Agricultural Soils 27.11 26.86 26.59 26.23 26.31 25.20 24.66 24.01 -23.38E. Prescribed Burning of Savannas NO NO NO NO NO NO NO NO 0.00F. Field Burning of Agricultural Residues 0.03 0.04 0.03 0.03 0.04 0.04 0.03 0.03 3.02G. Other NO NO NO NO NO NO NO NO 0.00
5. Land Use, Land-Use Change and Forestry 0.05 0.01 0.00 0.00 0.02 0.00 0.01 0.05 186.11A. Forest Land 0.05 0.01 0.00 0.00 0.00 0.00 0.01 0.04 180.66B. Cropland NA,NO NA,NO NA,NO NA,NO NA,NO NA,NO NA,NO NA,NO 0.00C. Grassland 0.00 0.00 0.00 0.00 0.02 0.00 0.00 0.00 332.07D. Wetlands NO NO NO NO NO NO NO NO 0.00E. Settlements NO NO NO NO NO NO NO NO 0.00F. Other Land NO NO NO NO NO NO NO NO 0.00G. Other NO NO NO NO NO NO NO NO 0.00
6. Waste 1.19 1.18 1.18 1.18 1.19 1.20 1.21 1.22 15.97A. Solid Waste Disposal on LandB. Waste-water Handling 1.19 1.18 1.18 1.18 1.19 1.20 1.21 1.22 15.97C. Waste Incineration NE,NO NE,NO NE,NO NE,NO NE,NO NE,NO NE,NO NE,NO 0.00D. Other NO NO NO NO NO NO NO NO 0.00
7. Other (as specified in Summary 1.A) NA NA NA NA NA NA NA NA 0.00
Total N2O emissions including N2O from LULUCF 34.83 34.29 33.91 33.44 33.20 32.04 31.17 30.45 -22.73Total N2O emissions excluding N2O from LULUCF 34.78 34.29 33.91 33.44 33.18 32.04 31.16 30.41 -22.82
Memo Items:International Bunkers 0.38 0.37 0.34 0.37 0.37 0.30 0.33 0.35 20.54
Aviation 0.09 0.09 0.09 0.11 0.11 0.07 0.07 0.09 8.95Marine 0.29 0.28 0.25 0.26 0.26 0.23 0.25 0.26 25.34
Multilateral Operations NO NO NO NO NO NO NO NO 0.00CO2 Emissions from Biomass
GREENHOUSE GAS SOURCE AND SINK CATEGORIES
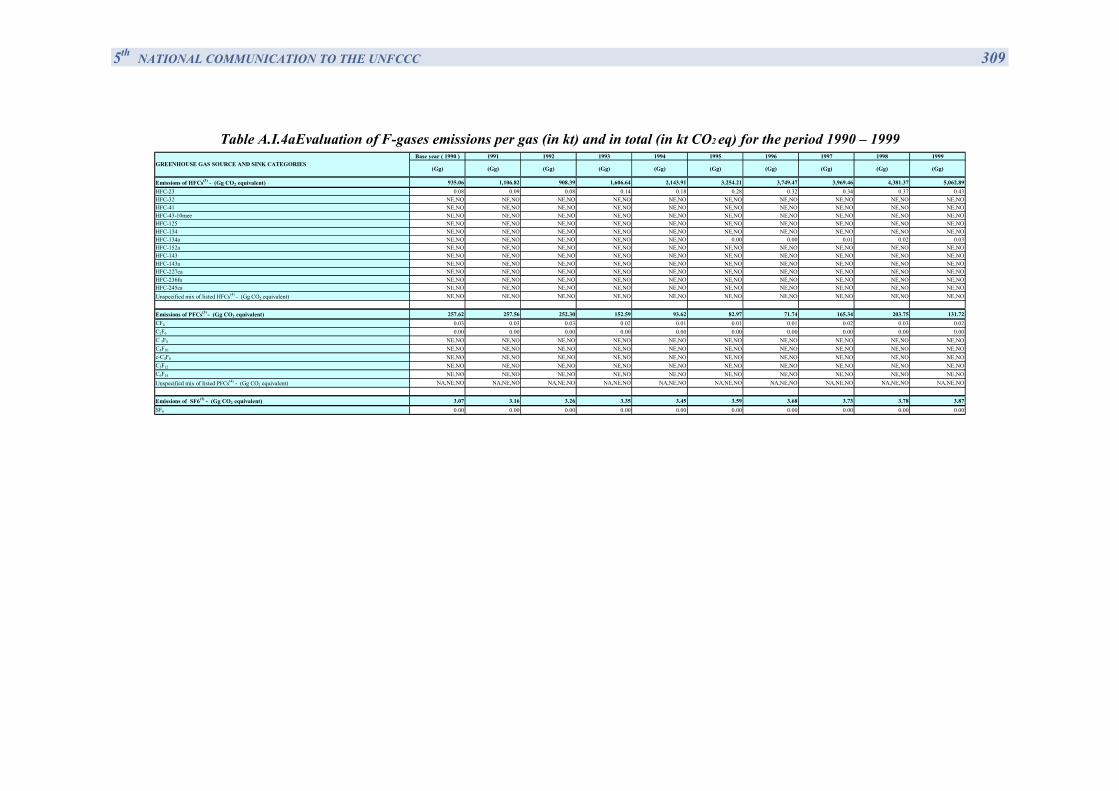
5th NATIONAL COMMUNICATION TO THE UNFCCC 309
Table A.Ι.4a Evaluation of F-gases emissions per gas (in kt) and in total (in kt CO2 eq) for the period 1990 – 1999
Base year ( 1990 ) 1991 1992 1993 1994 1995 1996 1997 1998 1999
(Gg) (Gg) (Gg) (Gg) (Gg) (Gg) (Gg) (Gg) (Gg) (Gg)
Emissions of HFCs(3) - (Gg CO2 equivalent) 935.06 1,106.82 908.39 1,606.64 2,143.91 3,254.21 3,749.47 3,969.46 4,381.37 5,062.89HFC-23 0.08 0.09 0.08 0.14 0.18 0.28 0.32 0.34 0.37 0.43HFC-32 NE,NO NE,NO NE,NO NE,NO NE,NO NE,NO NE,NO NE,NO NE,NO NE,NOHFC-41 NE,NO NE,NO NE,NO NE,NO NE,NO NE,NO NE,NO NE,NO NE,NO NE,NOHFC-43-10mee NE,NO NE,NO NE,NO NE,NO NE,NO NE,NO NE,NO NE,NO NE,NO NE,NOHFC-125 NE,NO NE,NO NE,NO NE,NO NE,NO NE,NO NE,NO NE,NO NE,NO NE,NOHFC-134 NE,NO NE,NO NE,NO NE,NO NE,NO NE,NO NE,NO NE,NO NE,NO NE,NOHFC-134a NE,NO NE,NO NE,NO NE,NO NE,NO 0.00 0.00 0.01 0.02 0.03HFC-152a NE,NO NE,NO NE,NO NE,NO NE,NO NE,NO NE,NO NE,NO NE,NO NE,NOHFC-143 NE,NO NE,NO NE,NO NE,NO NE,NO NE,NO NE,NO NE,NO NE,NO NE,NOHFC-143a NE,NO NE,NO NE,NO NE,NO NE,NO NE,NO NE,NO NE,NO NE,NO NE,NOHFC-227ea NE,NO NE,NO NE,NO NE,NO NE,NO NE,NO NE,NO NE,NO NE,NO NE,NOHFC-236fa NE,NO NE,NO NE,NO NE,NO NE,NO NE,NO NE,NO NE,NO NE,NO NE,NOHFC-245ca NE,NO NE,NO NE,NO NE,NO NE,NO NE,NO NE,NO NE,NO NE,NO NE,NOUnspecified mix of listed HFCs(4) - (Gg CO2 equivalent) NE,NO NE,NO NE,NO NE,NO NE,NO NE,NO NE,NO NE,NO NE,NO NE,NO
Emissions of PFCs(3) - (Gg CO2 equivalent) 257.62 257.56 252.30 152.59 93.62 82.97 71.74 165.34 203.75 131.72CF4 0.03 0.03 0.03 0.02 0.01 0.01 0.01 0.02 0.03 0.02C2F6 0.00 0.00 0.00 0.00 0.00 0.00 0.00 0.00 0.00 0.00C 3F8 NE,NO NE,NO NE,NO NE,NO NE,NO NE,NO NE,NO NE,NO NE,NO NE,NOC4F10 NE,NO NE,NO NE,NO NE,NO NE,NO NE,NO NE,NO NE,NO NE,NO NE,NOc-C4F8 NE,NO NE,NO NE,NO NE,NO NE,NO NE,NO NE,NO NE,NO NE,NO NE,NOC5F12 NE,NO NE,NO NE,NO NE,NO NE,NO NE,NO NE,NO NE,NO NE,NO NE,NOC6F14 NE,NO NE,NO NE,NO NE,NO NE,NO NE,NO NE,NO NE,NO NE,NO NE,NOUnspecified mix of listed PFCs(4) - (Gg CO2 equivalent) NA,NE,NO NA,NE,NO NA,NE,NO NA,NE,NO NA,NE,NO NA,NE,NO NA,NE,NO NA,NE,NO NA,NE,NO NA,NE,NO
Emissions of SF6(3) - (Gg CO2 equivalent) 3.07 3.16 3.26 3.35 3.45 3.59 3.68 3.73 3.78 3.87SF6 0.00 0.00 0.00 0.00 0.00 0.00 0.00 0.00 0.00 0.00
GREENHOUSE GAS SOURCE AND SINK CATEGORIES
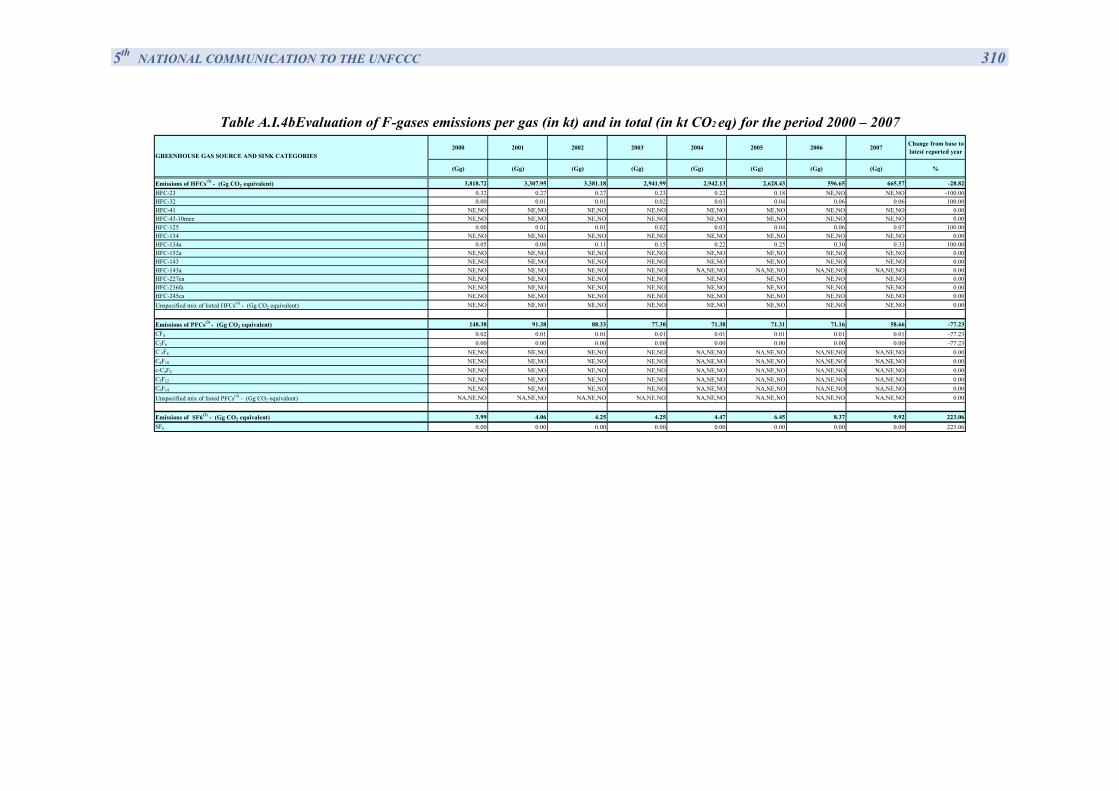
5th NATIONAL COMMUNICATION TO THE UNFCCC 310
Table A.Ι.4b Evaluation of F-gases emissions per gas (in kt) and in total (in kt CO2 eq) for the period 2000 – 2007
2000 2001 2002 2003 2004 2005 2006 2007 Change from base to latest reported year
(Gg) (Gg) (Gg) (Gg) (Gg) (Gg) (Gg) (Gg) %
Emissions of HFCs(3) - (Gg CO2 equivalent) 3,818.72 3,307.95 3,381.18 2,941.99 2,942.13 2,628.43 596.65 665.57 -28.82HFC-23 0.32 0.27 0.27 0.23 0.22 0.18 NE,NO NE,NO -100.00HFC-32 0.00 0.01 0.01 0.02 0.03 0.04 0.06 0.06 100.00HFC-41 NE,NO NE,NO NE,NO NE,NO NE,NO NE,NO NE,NO NE,NO 0.00HFC-43-10mee NE,NO NE,NO NE,NO NE,NO NE,NO NE,NO NE,NO NE,NO 0.00HFC-125 0.00 0.01 0.01 0.02 0.03 0.04 0.06 0.07 100.00HFC-134 NE,NO NE,NO NE,NO NE,NO NE,NO NE,NO NE,NO NE,NO 0.00HFC-134a 0.05 0.08 0.11 0.15 0.22 0.25 0.30 0.33 100.00HFC-152a NE,NO NE,NO NE,NO NE,NO NE,NO NE,NO NE,NO NE,NO 0.00HFC-143 NE,NO NE,NO NE,NO NE,NO NE,NO NE,NO NE,NO NE,NO 0.00HFC-143a NE,NO NE,NO NE,NO NE,NO NA,NE,NO NA,NE,NO NA,NE,NO NA,NE,NO 0.00HFC-227ea NE,NO NE,NO NE,NO NE,NO NE,NO NE,NO NE,NO NE,NO 0.00HFC-236fa NE,NO NE,NO NE,NO NE,NO NE,NO NE,NO NE,NO NE,NO 0.00HFC-245ca NE,NO NE,NO NE,NO NE,NO NE,NO NE,NO NE,NO NE,NO 0.00Unspecified mix of listed HFCs(4) - (Gg CO2 equivalent) NE,NO NE,NO NE,NO NE,NO NE,NO NE,NO NE,NO NE,NO 0.00
Emissions of PFCs(3) - (Gg CO2 equivalent) 148.38 91.38 88.33 77.30 71.38 71.31 71.16 58.66 -77.23CF4 0.02 0.01 0.01 0.01 0.01 0.01 0.01 0.01 -77.23C2F6 0.00 0.00 0.00 0.00 0.00 0.00 0.00 0.00 -77.23C 3F8 NE,NO NE,NO NE,NO NE,NO NA,NE,NO NA,NE,NO NA,NE,NO NA,NE,NO 0.00C4F10 NE,NO NE,NO NE,NO NE,NO NA,NE,NO NA,NE,NO NA,NE,NO NA,NE,NO 0.00c-C4F8 NE,NO NE,NO NE,NO NE,NO NA,NE,NO NA,NE,NO NA,NE,NO NA,NE,NO 0.00C5F12 NE,NO NE,NO NE,NO NE,NO NA,NE,NO NA,NE,NO NA,NE,NO NA,NE,NO 0.00C6F14 NE,NO NE,NO NE,NO NE,NO NA,NE,NO NA,NE,NO NA,NE,NO NA,NE,NO 0.00Unspecified mix of listed PFCs(4) - (Gg CO2 equivalent) NA,NE,NO NA,NE,NO NA,NE,NO NA,NE,NO NA,NE,NO NA,NE,NO NA,NE,NO NA,NE,NO 0.00
Emissions of SF6(3) - (Gg CO2 equivalent) 3.99 4.06 4.25 4.25 4.47 6.45 8.37 9.92 223.06SF6 0.00 0.00 0.00 0.00 0.00 0.00 0.00 0.00 223.06
GREENHOUSE GAS SOURCE AND SINK CATEGORIES
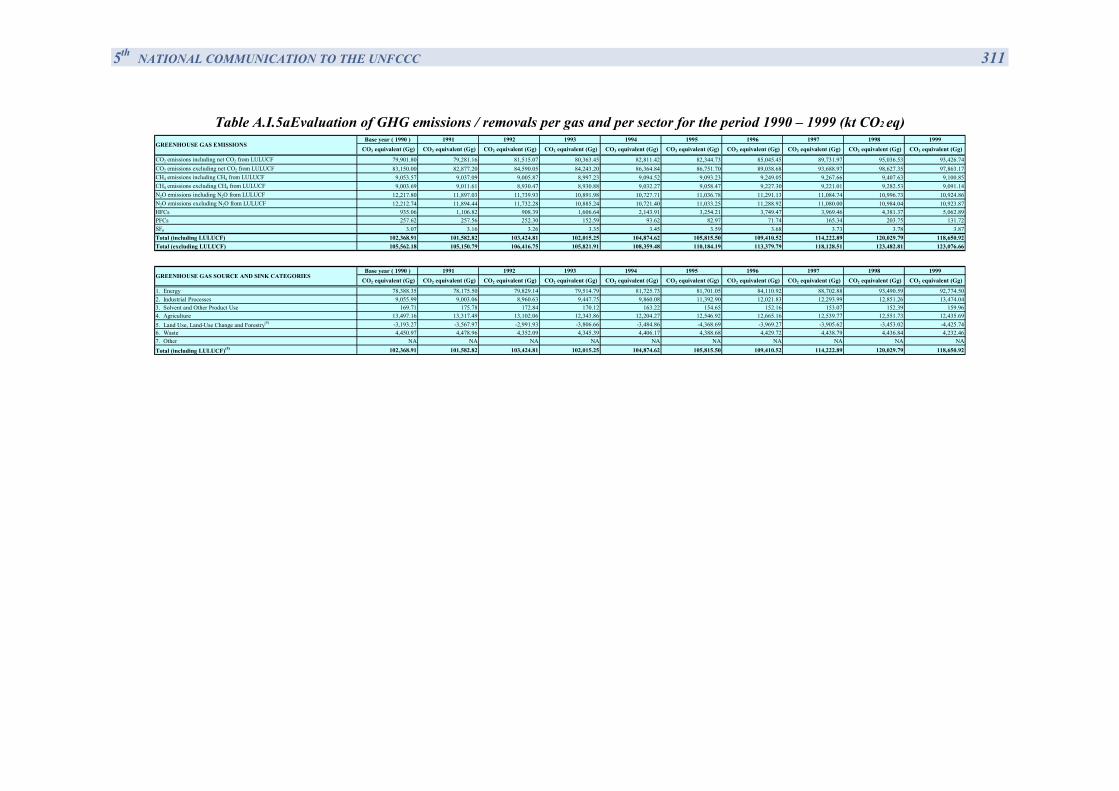
5th NATIONAL COMMUNICATION TO THE UNFCCC 311
Table A.Ι.5a Evaluation of GHG emissions / removals per gas and per sector for the period 1990 – 1999 (kt CO2 eq) Base year ( 1990 ) 1991 1992 1993 1994 1995 1996 1997 1998 1999
CO2 equivalent (Gg) CO2 equivalent (Gg) CO2 equivalent (Gg) CO2 equivalent (Gg) CO2 equivalent (Gg) CO2 equivalent (Gg) CO2 equivalent (Gg) CO2 equivalent (Gg) CO2 equivalent (Gg) CO2 equivalent (Gg)
CO2 emissions including net CO2 from LULUCF 79,901.80 79,281.16 81,515.07 80,363.45 82,811.42 82,344.73 85,045.45 89,731.97 95,036.53 93,426.74CO2 emissions excluding net CO2 from LULUCF 83,150.00 82,877.20 84,590.05 84,243.20 86,364.84 86,751.70 89,038.68 93,688.97 98,627.35 97,863.17CH4 emissions including CH4 from LULUCF 9,053.57 9,037.09 9,005.87 8,997.23 9,094.52 9,093.23 9,249.05 9,267.66 9,407.63 9,100.85CH4 emissions excluding CH4 from LULUCF 9,003.69 9,011.61 8,930.47 8,930.88 9,032.27 9,058.47 9,227.30 9,221.01 9,282.53 9,091.14N2O emissions including N2O from LULUCF 12,217.80 11,897.03 11,739.93 10,891.98 10,727.71 11,036.78 11,291.13 11,084.74 10,996.73 10,924.86N2O emissions excluding N2O from LULUCF 12,212.74 11,894.44 11,732.28 10,885.24 10,721.40 11,033.25 11,288.92 11,080.00 10,984.04 10,923.87HFCs 935.06 1,106.82 908.39 1,606.64 2,143.91 3,254.21 3,749.47 3,969.46 4,381.37 5,062.89PFCs 257.62 257.56 252.30 152.59 93.62 82.97 71.74 165.34 203.75 131.72SF6 3.07 3.16 3.26 3.35 3.45 3.59 3.68 3.73 3.78 3.87Total (including LULUCF) 102,368.91 101,582.82 103,424.81 102,015.25 104,874.62 105,815.50 109,410.52 114,222.89 120,029.79 118,650.92Total (excluding LULUCF) 105,562.18 105,150.79 106,416.75 105,821.91 108,359.48 110,184.19 113,379.79 118,128.51 123,482.81 123,076.66
Base year ( 1990 ) 1991 1992 1993 1994 1995 1996 1997 1998 1999 CO2 equivalent (Gg) CO2 equivalent (Gg) CO2 equivalent (Gg) CO2 equivalent (Gg) CO2 equivalent (Gg) CO2 equivalent (Gg) CO2 equivalent (Gg) CO2 equivalent (Gg) CO2 equivalent (Gg) CO2 equivalent (Gg)
1. Energy 78,388.35 78,175.50 79,829.14 79,514.79 81,725.73 81,701.05 84,110.92 88,702.88 93,490.59 92,774.502. Industrial Processes 9,055.99 9,003.06 8,960.63 9,447.75 9,860.08 11,392.90 12,021.83 12,293.99 12,851.26 13,474.043. Solvent and Other Product Use 169.71 175.78 172.84 170.12 163.22 154.65 152.16 153.07 152.39 159.964. Agriculture 13,497.16 13,317.49 13,102.06 12,343.86 12,204.27 12,546.92 12,665.16 12,539.77 12,551.73 12,435.695. Land Use, Land-Use Change and Forestry(5) -3,193.27 -3,567.97 -2,991.93 -3,806.66 -3,484.86 -4,368.69 -3,969.27 -3,905.62 -3,453.02 -4,425.746. Waste 4,450.97 4,478.96 4,352.09 4,345.39 4,406.17 4,388.68 4,429.72 4,438.79 4,436.84 4,232.467. Other NA NA NA NA NA NA NA NA NA NATotal (including LULUCF)(5) 102,368.91 101,582.82 103,424.81 102,015.25 104,874.62 105,815.50 109,410.52 114,222.89 120,029.79 118,650.92
GREENHOUSE GAS EMISSIONS
GREENHOUSE GAS SOURCE AND SINK CATEGORIES
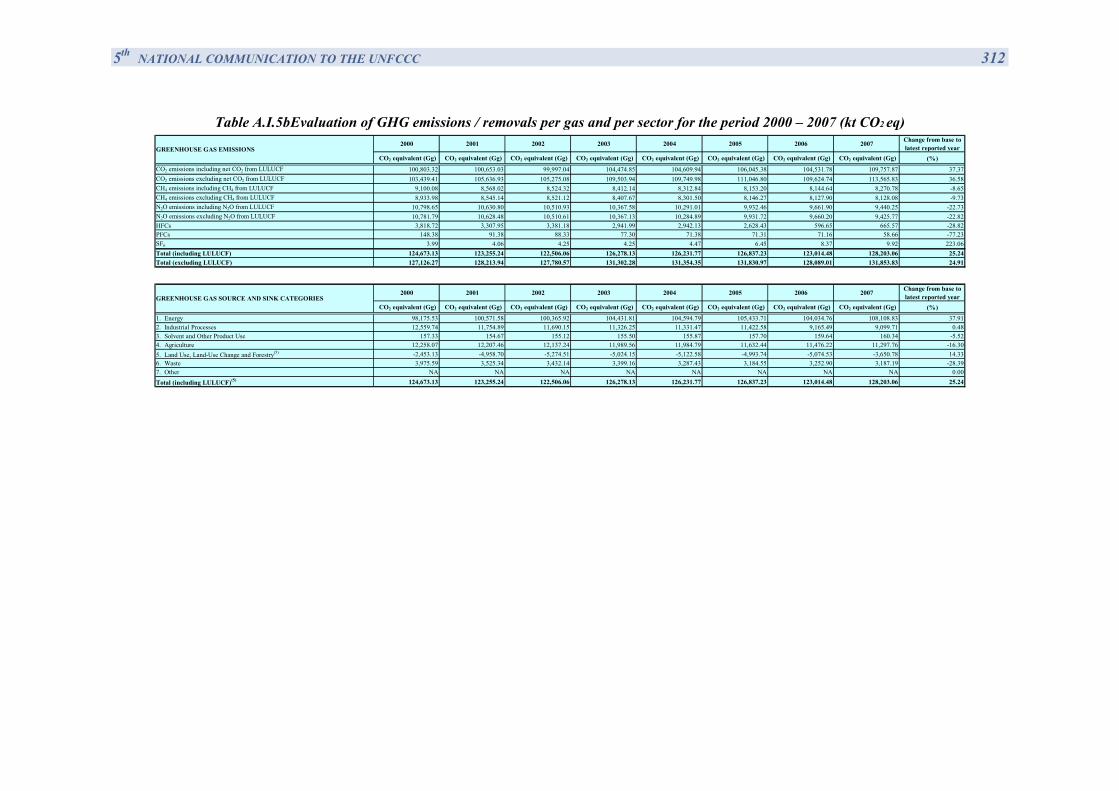
5th NATIONAL COMMUNICATION TO THE UNFCCC 312
Table A.Ι.5b Evaluation of GHG emissions / removals per gas and per sector for the period 2000 – 2007 (kt CO2 eq) 2000 2001 2002 2003 2004 2005 2006 2007 Change from base to
latest reported year CO2 equivalent (Gg) CO2 equivalent (Gg) CO2 equivalent (Gg) CO2 equivalent (Gg) CO2 equivalent (Gg) CO2 equivalent (Gg) CO2 equivalent (Gg) CO2 equivalent (Gg) (%)
CO2 emissions including net CO2 from LULUCF 100,803.32 100,653.03 99,997.04 104,474.85 104,609.94 106,045.38 104,531.78 109,757.87 37.37CO2 emissions excluding net CO2 from LULUCF 103,439.41 105,636.93 105,275.08 109,503.94 109,749.98 111,046.80 109,624.74 113,565.83 36.58CH4 emissions including CH4 from LULUCF 9,100.08 8,568.02 8,524.32 8,412.14 8,312.84 8,153.20 8,144.64 8,270.78 -8.65CH4 emissions excluding CH4 from LULUCF 8,933.98 8,545.14 8,521.12 8,407.67 8,301.50 8,146.27 8,127.90 8,128.08 -9.73N2O emissions including N2O from LULUCF 10,798.65 10,630.80 10,510.93 10,367.58 10,291.01 9,932.46 9,661.90 9,440.25 -22.73N2O emissions excluding N2O from LULUCF 10,781.79 10,628.48 10,510.61 10,367.13 10,284.89 9,931.72 9,660.20 9,425.77 -22.82HFCs 3,818.72 3,307.95 3,381.18 2,941.99 2,942.13 2,628.43 596.65 665.57 -28.82PFCs 148.38 91.38 88.33 77.30 71.38 71.31 71.16 58.66 -77.23SF6 3.99 4.06 4.25 4.25 4.47 6.45 8.37 9.92 223.06Total (including LULUCF) 124,673.13 123,255.24 122,506.06 126,278.13 126,231.77 126,837.23 123,014.48 128,203.06 25.24Total (excluding LULUCF) 127,126.27 128,213.94 127,780.57 131,302.28 131,354.35 131,830.97 128,089.01 131,853.83 24.91
2000 2001 2002 2003 2004 2005 2006 2007 Change from base to latest reported year
CO2 equivalent (Gg) CO2 equivalent (Gg) CO2 equivalent (Gg) CO2 equivalent (Gg) CO2 equivalent (Gg) CO2 equivalent (Gg) CO2 equivalent (Gg) CO2 equivalent (Gg) (%)
1. Energy 98,175.53 100,571.58 100,365.92 104,431.81 104,594.79 105,433.71 104,034.76 108,108.83 37.912. Industrial Processes 12,559.74 11,754.89 11,690.15 11,326.25 11,331.47 11,422.58 9,165.49 9,099.71 0.483. Solvent and Other Product Use 157.33 154.67 155.12 155.50 155.87 157.70 159.64 160.34 -5.524. Agriculture 12,258.07 12,207.46 12,137.24 11,989.56 11,984.79 11,632.44 11,476.22 11,297.76 -16.305. Land Use, Land-Use Change and Forestry(5) -2,453.13 -4,958.70 -5,274.51 -5,024.15 -5,122.58 -4,993.74 -5,074.53 -3,650.78 14.336. Waste 3,975.59 3,525.34 3,432.14 3,399.16 3,287.43 3,184.55 3,252.90 3,187.19 -28.397. Other NA NA NA NA NA NA NA NA 0.00Total (including LULUCF)(5) 124,673.13 123,255.24 122,506.06 126,278.13 126,231.77 126,837.23 123,014.48 128,203.06 25.24
GREENHOUSE GAS EMISSIONS
GREENHOUSE GAS SOURCE AND SINK CATEGORIES
5th NATIONAL COMMUNICATION TO THE UNFCCC 313
A.II Responsibilities / roles per entity involved in the National GHG Inventory System
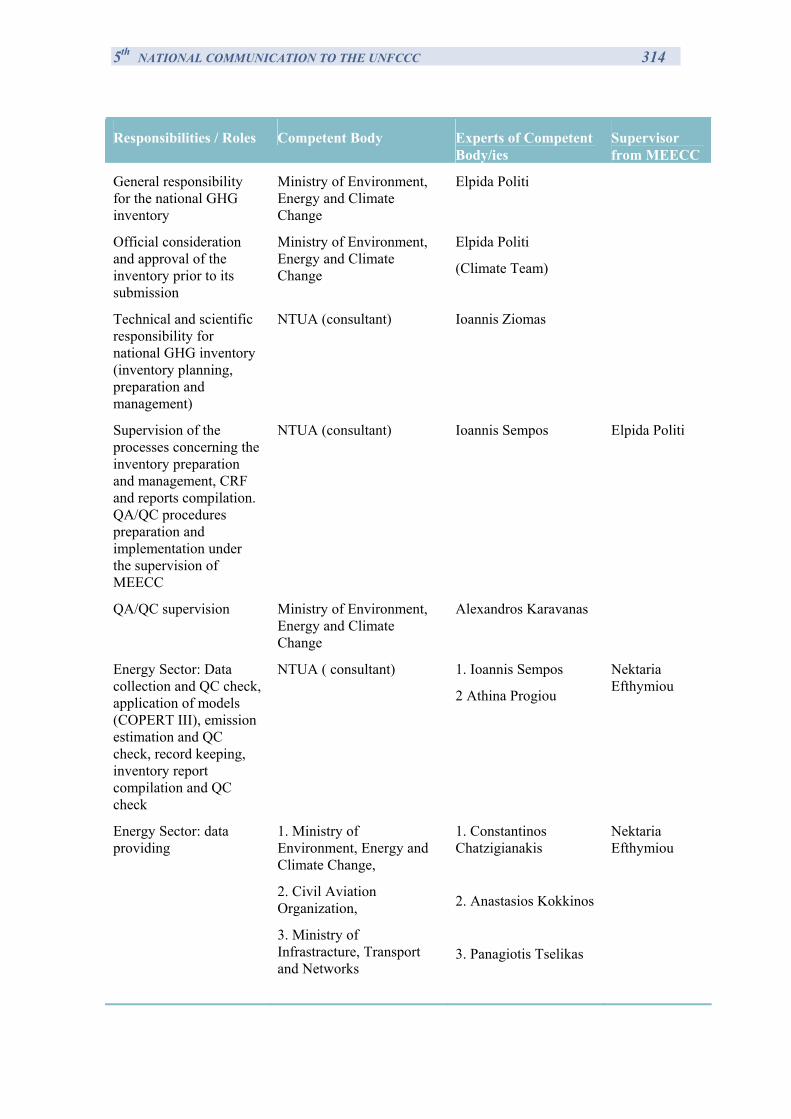
5th NATIONAL COMMUNICATION TO THE UNFCCC 314
Responsibilities / Roles Competent Body Experts of Competent Body/ies
Supervisor from MEECC
General responsibility for the national GHG inventory
Ministry of Environment, Energy and Climate Change
Elpida Politi
Official consideration and approval of the inventory prior to its submission
Ministry of Environment, Energy and Climate Change
Elpida Politi
(Climate Team)
Technical and scientific responsibility for national GHG inventory (inventory planning, preparation and management)
NTUA (consultant) Ioannis Ziomas
Supervision of the processes concerning the inventory preparation and management, CRF and reports compilation. QA/QC procedures preparation and implementation under the supervision of MEECC
NTUA (consultant) Ioannis Sempos
Elpida Politi
QA/QC supervision Ministry of Environment, Energy and Climate Change
Alexandros Karavanas
Energy Sector: Data collection and QC check, application of models (COPERT III), emission estimation and QC check, record keeping, inventory report compilation and QC check
NTUA ( consultant) 1. Ioannis Sempos
2 Athina Progiou
Nektaria Efthymiou
Energy Sector: data providing
1. Ministry of Environment, Energy and Climate Change,
2. Civil Aviation Organization,
3. Ministry of Infrastracture, Transport and Networks
1. Constantinos Chatzigianakis
2. Anastasios Kokkinos
3. Panagiotis Tselikas
Nektaria Efthymiou
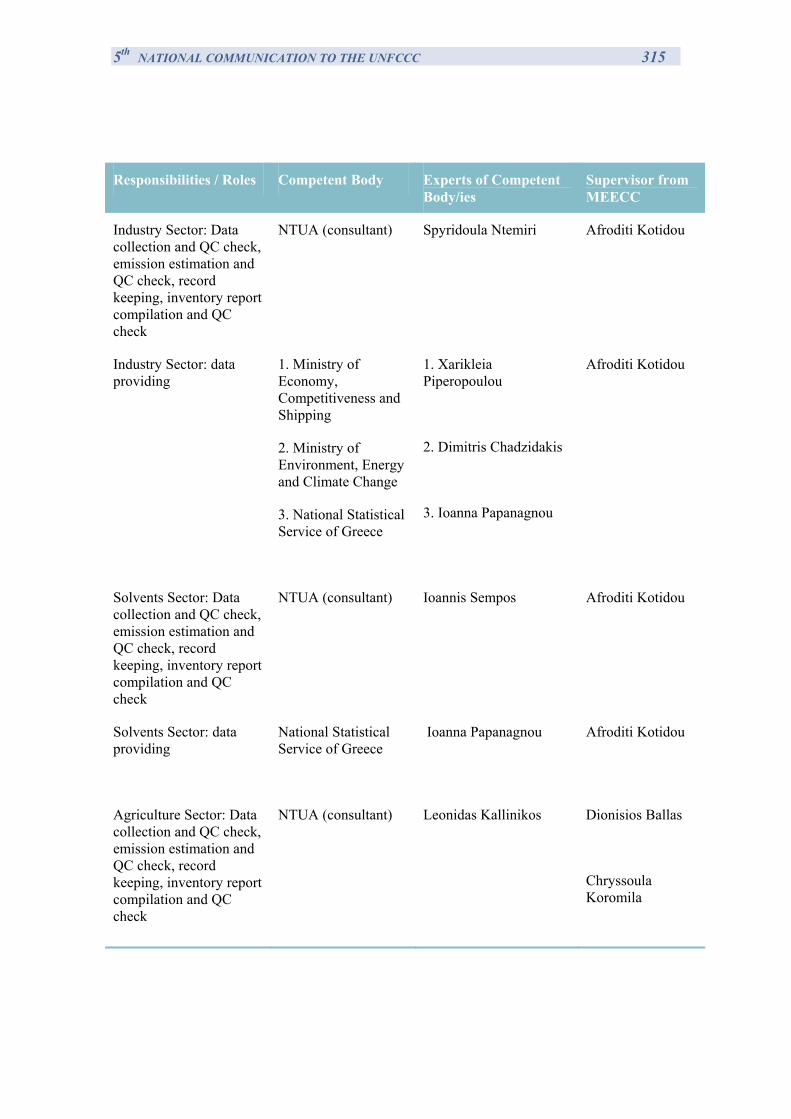
5th NATIONAL COMMUNICATION TO THE UNFCCC 315
Responsibilities / Roles Competent Body Experts of Competent Body/ies
Supervisor from MEECC
Industry Sector: Data collection and QC check, emission estimation and QC check, record keeping, inventory report compilation and QC check
NTUA (consultant) Spyridoula Ntemiri
Afroditi Kotidou
Industry Sector: data providing
1. Ministry of Economy, Competitiveness and Shipping
2. Ministry of Environment, Energy and Climate Change
3. National Statistical Service of Greece
1. Xarikleia Piperopoulou
2. Dimitris Chadzidakis
3. Ioanna Papanagnou
Afroditi Kotidou
Solvents Sector: Data collection and QC check, emission estimation and QC check, record keeping, inventory report compilation and QC check
NTUA (consultant) Ioannis Sempos
Afroditi Kotidou
Solvents Sector: data providing
National Statistical Service of Greece
Ioanna Papanagnou Afroditi Kotidou
Agriculture Sector: Data collection and QC check, emission estimation and QC check, record keeping, inventory report compilation and QC check
NTUA (consultant) Leonidas Kallinikos Dionisios Ballas
Chryssoula Koromila
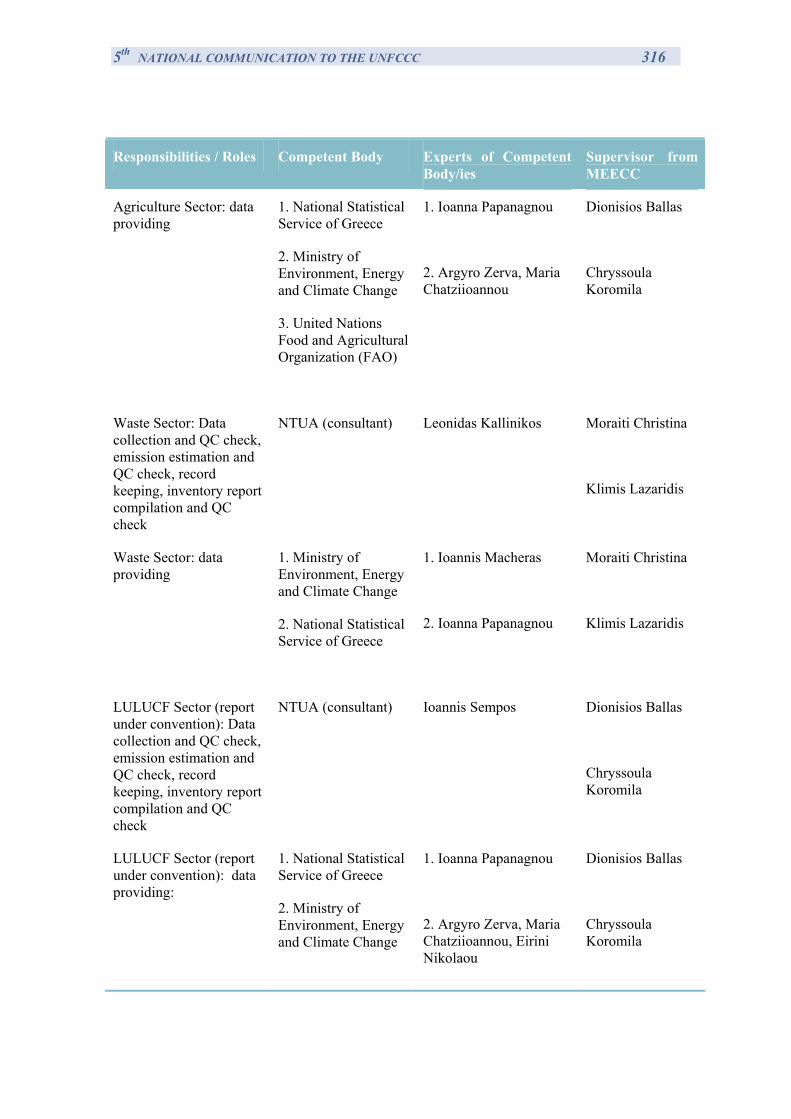
5th NATIONAL COMMUNICATION TO THE UNFCCC 316
Responsibilities / Roles Competent Body Experts of Competent Body/ies
Supervisor from MEECC
Agriculture Sector: data providing
1. National Statistical Service of Greece
2. Ministry of Environment, Energy and Climate Change
3. United Nations Food and Agricultural Organization (FAO)
1. Ioanna Papanagnou
2. Argyro Zerva, Maria Chatziioannou
Dionisios Ballas
Chryssoula Koromila
Waste Sector: Data collection and QC check, emission estimation and QC check, record keeping, inventory report compilation and QC check
NTUA (consultant) Leonidas Kallinikos Moraiti Christina
Klimis Lazaridis
Waste Sector: data providing
1. Ministry of Environment, Energy and Climate Change
2. National Statistical Service of Greece
1. Ioannis Macheras
2. Ioanna Papanagnou
Moraiti Christina
Klimis Lazaridis
LULUCF Sector (report under convention): Data collection and QC check, emission estimation and QC check, record keeping, inventory report compilation and QC check
NTUA (consultant) Ioannis Sempos
Dionisios Ballas
Chryssoula Koromila
LULUCF Sector (report under convention): data providing:
1. National Statistical Service of Greece
2. Ministry of Environment, Energy and Climate Change
1. Ioanna Papanagnou
2. Argyro Zerva, Maria Chatziioannou, Eirini Nikolaou
Dionisios Ballas
Chryssoula Koromila
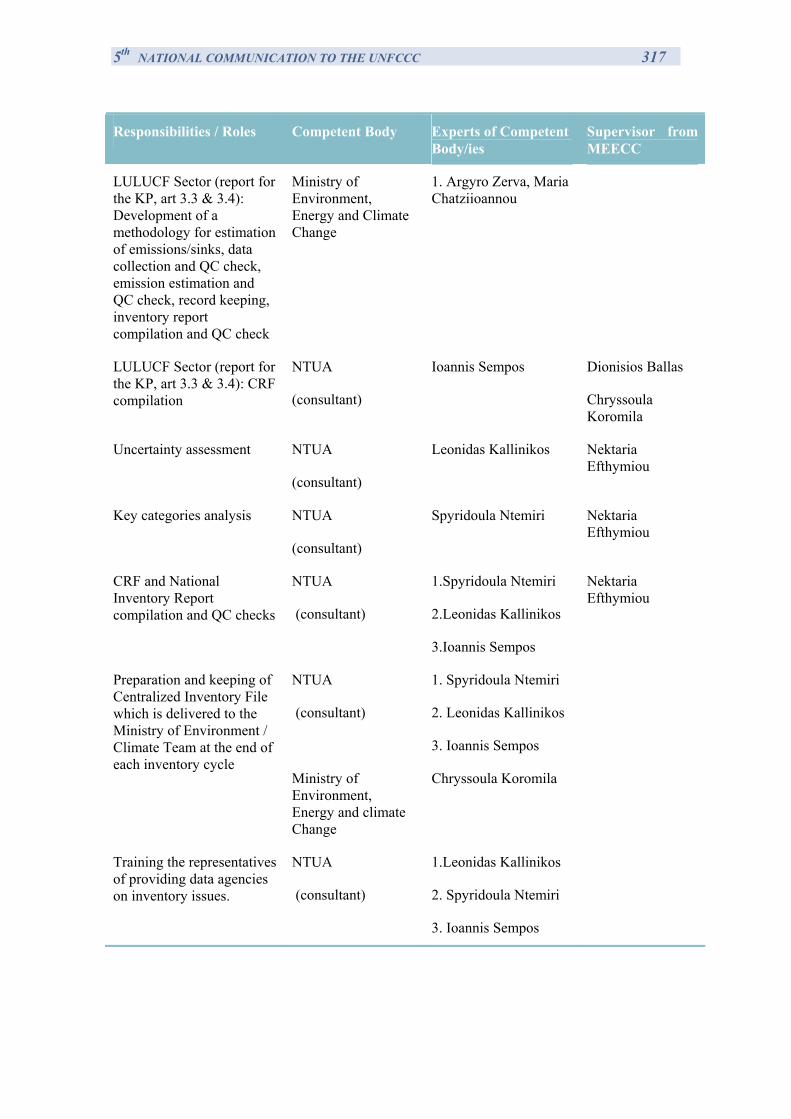
5th NATIONAL COMMUNICATION TO THE UNFCCC 317
Responsibilities / Roles Competent Body Experts of Competent Body/ies
Supervisor from MEECC
LULUCF Sector (report for the KP, art 3.3 & 3.4): Development of a methodology for estimation of emissions/sinks, data collection and QC check, emission estimation and QC check, record keeping, inventory report compilation and QC check
Ministry of Environment, Energy and Climate Change
1. Argyro Zerva, Maria Chatziioannou
LULUCF Sector (report for the KP, art 3.3 & 3.4): CRF compilation
NTUA
(consultant)
Ioannis Sempos Dionisios Ballas
Chryssoula Koromila
Uncertainty assessment NTUA
(consultant)
Leonidas Kallinikos
Nektaria Efthymiou
Key categories analysis NTUA
(consultant)
Spyridoula Ntemiri
Nektaria Efthymiou
CRF and National Inventory Report compilation and QC checks
NTUA
(consultant)
1.Spyridoula Ntemiri
2.Leonidas Kallinikos
3.Ioannis Sempos
Nektaria Efthymiou
Preparation and keeping of Centralized Inventory File which is delivered to the Ministry of Environment / Climate Team at the end of each inventory cycle
NTUA
(consultant)
Ministry of Environment, Energy and climate Change
1. Spyridoula Ntemiri
2. Leonidas Kallinikos
3. Ioannis Sempos
Chryssoula Koromila
Training the representatives of providing data agencies on inventory issues.
NTUA
(consultant)
1.Leonidas Kallinikos
2. Spyridoula Ntemiri
3. Ioannis Sempos
5th NATIONAL COMMUNICATION TO THE UNFCCC 318
A.III Inventory preparation details
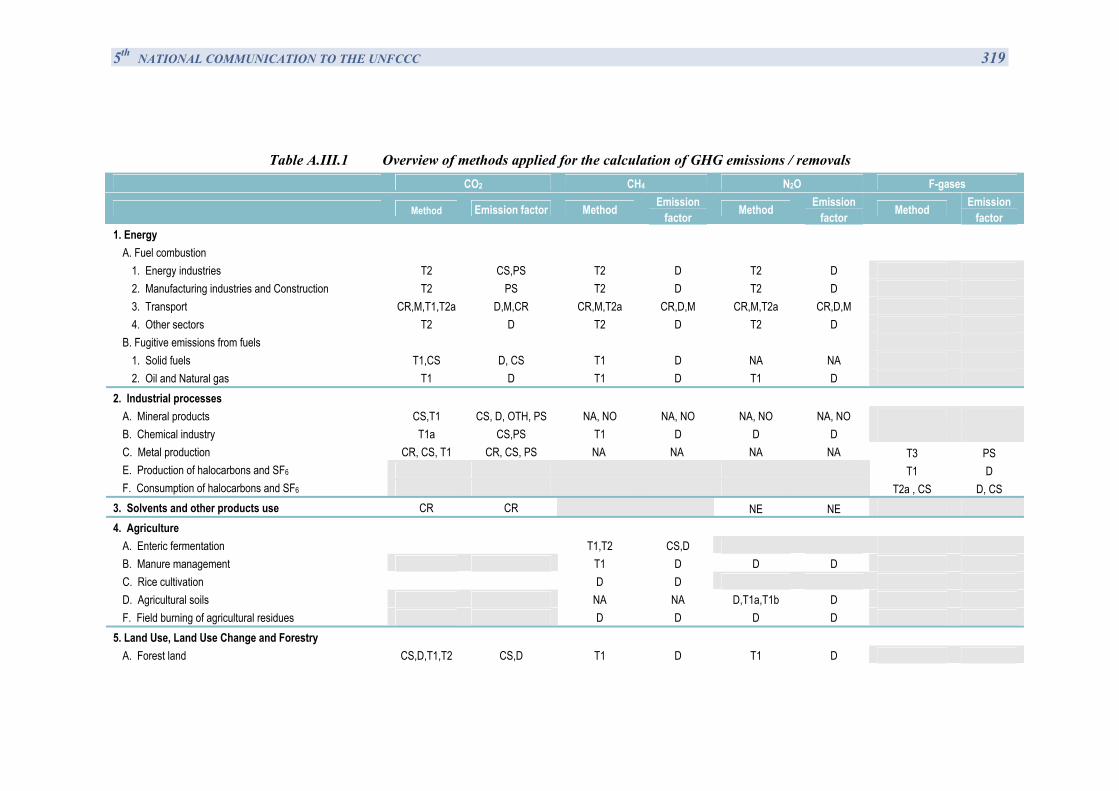
5th NATIONAL COMMUNICATION TO THE UNFCCC 319
Table A.III.1 Overview of methods applied for the calculation of GHG emissions / removals CO2 CH4 N2O F-gases
Method Emission factor Method Emission factor Method Emission
factor Method Emission factor
1. Energy A. Fuel combustion
1. Energy industries T2 CS,PS T2 D T2 D 2. Manufacturing industries and Construction T2 PS T2 D T2 D 3. Transport CR,M,T1,T2a D,M,CR CR,M,T2a CR,D,M CR,M,T2a CR,D,M 4. Other sectors T2 D T2 D T2 D
B. Fugitive emissions from fuels 1. Solid fuels T1,CS D, CS T1 D NA NA 2. Oil and Natural gas T1 D T1 D T1 D
2. Industrial processes A. Mineral products CS,T1 CS, D, OTH, PS NA, NO NA, NO NA, NO NA, NO B. Chemical industry T1a CS,PS T1 D D D C. Metal production CR, CS, T1 CR, CS, PS NA NA NA NA T3 PS E. Production of halocarbons and SF6 T1 D F. Consumption of halocarbons and SF6 T2a , CS D, CS
3. Solvents and other products use CR CR NE NE 4. Agriculture
A. Enteric fermentation T1,T2 CS,D B. Manure management T1 D D D C. Rice cultivation D D D. Agricultural soils NA NA D,T1a,T1b D F. Field burning of agricultural residues D D D D
5. Land Use, Land Use Change and Forestry A. Forest land CS,D,T1,T2 CS,D T1 D T1 D
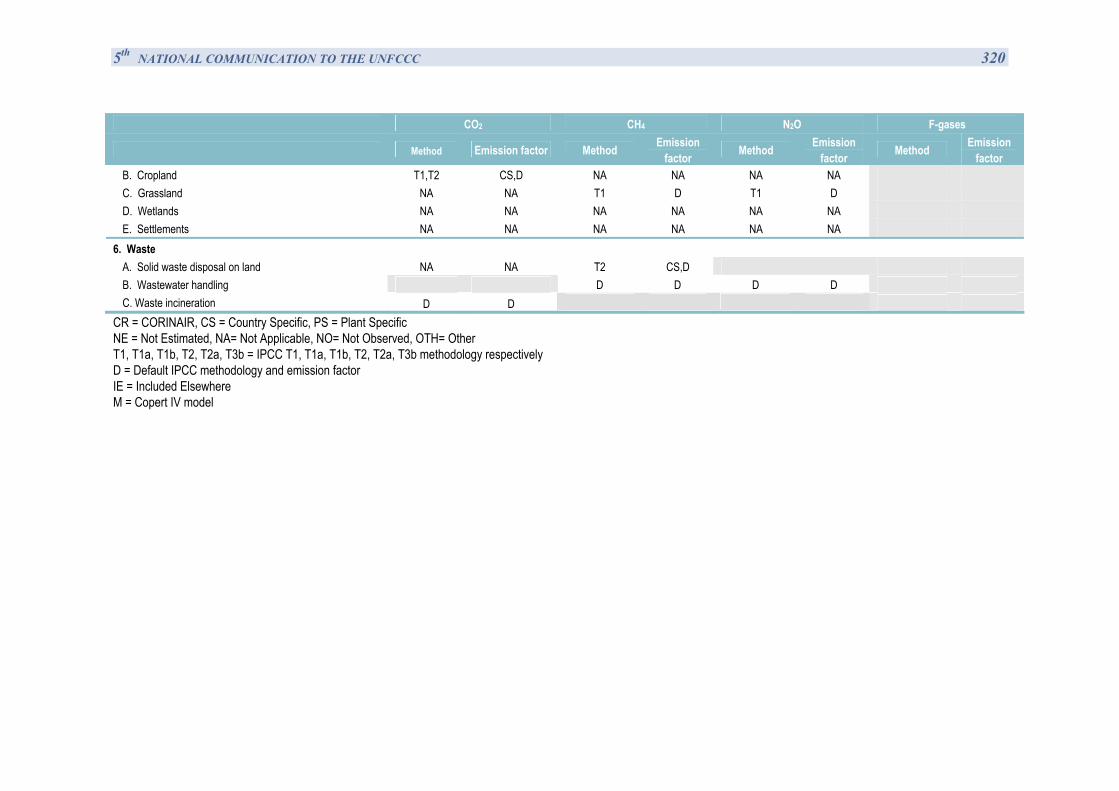
5th NATIONAL COMMUNICATION TO THE UNFCCC 320
CO2 CH4 N2O F-gases
Method Emission factor Method Emission factor Method Emission
factor Method Emission factor
B. Cropland T1,T2 CS,D NA NA NA NA C. Grassland NA NA T1 D T1 D D. Wetlands NA NA NA NA NA NA E. Settlements NA NA NA NA NA NA
6. Waste A. Solid waste disposal on land NA NA T2 CS,D B. Wastewater handling D D D D C. Waste incineration D D
CR = CORINAIR, CS = Country Specific, PS = Plant Specific ΝΕ = Not Estimated, NA= Not Applicable, NO= Not Observed, OTH= Other T1, T1a, T1b, T2, T2a, T3b = IPCC T1, T1a, T1b, T2, T2a, T3b methodology respectively D = Default IPCC methodology and emission factor IE = Included Elsewhere M = Copert IV model
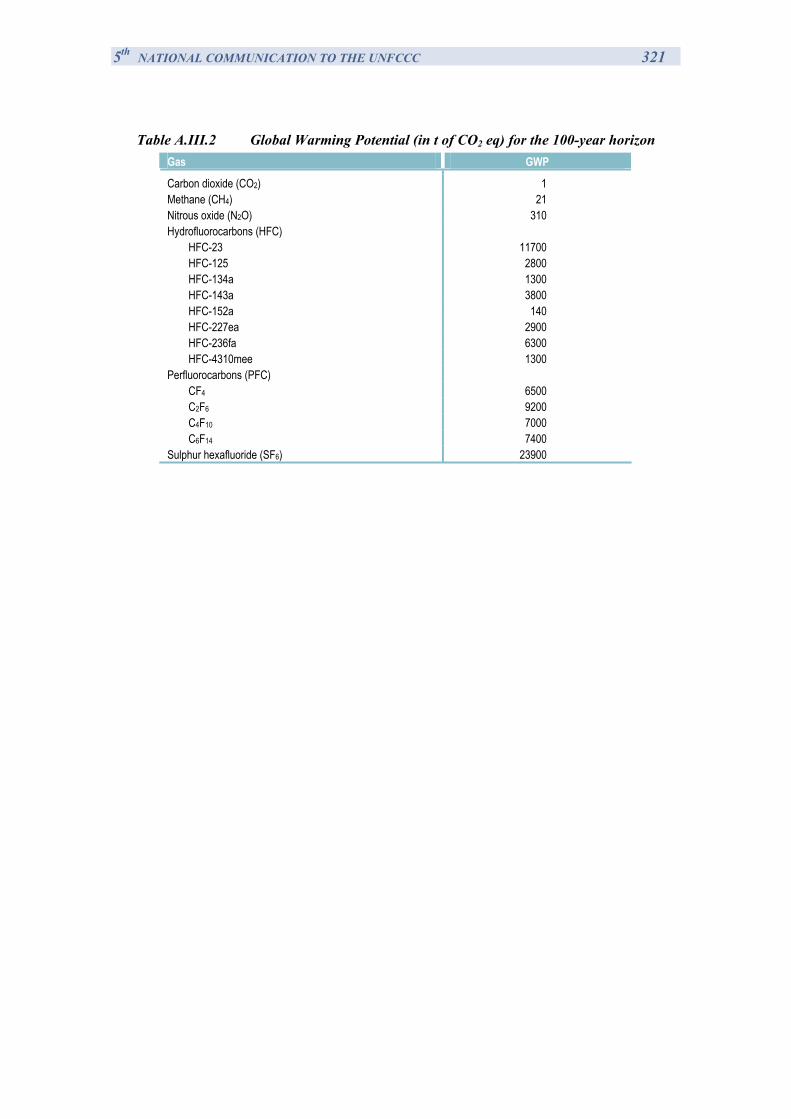
5th NATIONAL COMMUNICATION TO THE UNFCCC 321
Table A.III.2 Global Warming Potential (in t of CO2 eq) for the 100-year horizon
Gas GWP
Carbon dioxide (CO2) 1 Methane (CH4) 21 Nitrous oxide (N2O) 310 Hydrofluorocarbons (HFC)
HFC-23 11700 HFC-125 2800 HFC-134a 1300 HFC-143a 3800 HFC-152a 140 HFC-227ea 2900 HFC-236fa 6300 HFC-4310mee 1300
Perfluorocarbons (PFC) CF4 6500 C2F6 9200 C4F10 7000 C6F14 7400
Sulphur hexafluoride (SF6) 23900
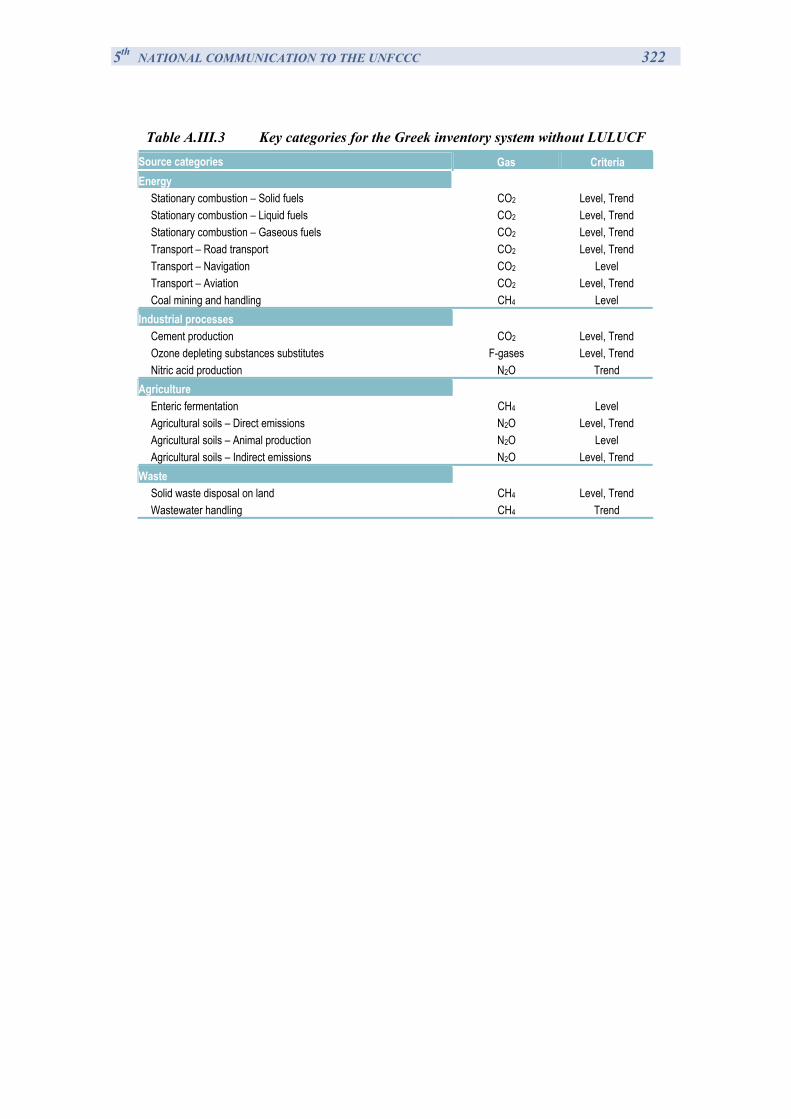
5th NATIONAL COMMUNICATION TO THE UNFCCC 322
Table A.III.3 Key categories for the Greek inventory system without LULUCF
Source categories Gas Criteria Energy
Stationary combustion – Solid fuels CO2 Level, Trend Stationary combustion – Liquid fuels CO2 Level, Trend Stationary combustion – Gaseous fuels CO2 Level, Trend Transport – Road transport CO2 Level, Trend Transport – Navigation CO2 Level Transport – Aviation CO2 Level, Trend Coal mining and handling CH4 Level
Industrial processes Cement production CO2 Level, Trend Ozone depleting substances substitutes F-gases Level, Trend Nitric acid production N2O Trend
Agriculture Enteric fermentation CH4 Level Agricultural soils – Direct emissions N2O Level, Trend Agricultural soils – Animal production N2O Level Agricultural soils – Indirect emissions N2O Level, Trend
Waste Solid waste disposal on land CH4 Level, Trend Wastewater handling CH4 Trend
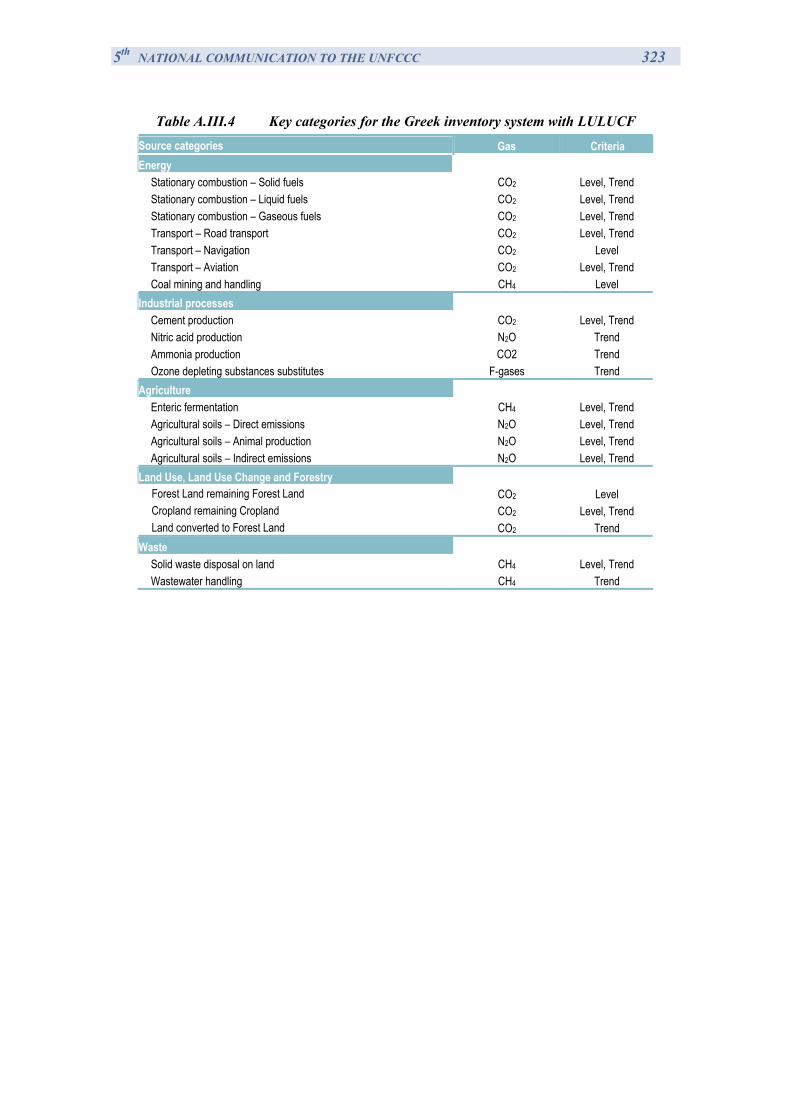
5th NATIONAL COMMUNICATION TO THE UNFCCC 323
Table A.III.4 Key categories for the Greek inventory system with LULUCF Source categories Gas Criteria Energy
Stationary combustion – Solid fuels CO2 Level, Trend Stationary combustion – Liquid fuels CO2 Level, Trend Stationary combustion – Gaseous fuels CO2 Level, Trend Transport – Road transport CO2 Level, Trend Transport – Navigation CO2 Level Transport – Aviation CO2 Level, Trend Coal mining and handling CH4 Level
Industrial processes Cement production CO2 Level, Trend Nitric acid production N2O Trend Ammonia production CO2 Trend Ozone depleting substances substitutes F-gases Trend
Agriculture Enteric fermentation CH4 Level, Trend Agricultural soils – Direct emissions N2O Level, Trend Agricultural soils – Animal production N2O Level, Trend Agricultural soils – Indirect emissions N2O Level, Trend
Land Use, Land Use Change and Forestry Forest Land remaining Forest Land CO2 Level Cropland remaining Cropland CO2 Level, Trend Land converted to Forest Land CO2 Trend
Waste Solid waste disposal on land CH4 Level, Trend Wastewater handling CH4 Trend

5th NATIONAL COMMUNICATION TO THE UNFCCC 324
A.IV Greek national registry official authorization
5th NATIONAL COMMUNICATION TO THE UNFCCC 325
Subject Go live authorization for the national registry of Greece
From Heidi McKenna <[email protected]> ; on behalf of; International TranLog <[email protected]>
Date Wednesday, September 10, 2008 18:38
To [email protected] , [email protected]
After reviewing the ITL-Operator's recommendation in light of the materials
submitted by the national registry of Greece, including test report and
documentation of successful testing of the registry with the ITL and CITL,
the ITL- Administrator is pleased to authorise the registry of Greece to
commence live operation with the production environment of the ITL.
Congratulations, and thank you for the hard work and careful preparation.
Best Regards,
Heidi McKenna
On behalf of the
International Transaction Log Administrator
Climate Change Secretariat UNFCCC
PO Box 260124
53153 Bonn, Germany
Tel: +49 228 815 1000
Fax: +49 228 815 1999
Web: www.unfccc.int
Email: [email protected]

5th NATIONAL COMMUNICATION TO THE UNFCCC 326
A.V Summary of reporting of the Supplementary information under Article 7, paragraph 2, of the Kyoto Protocol in the NC5
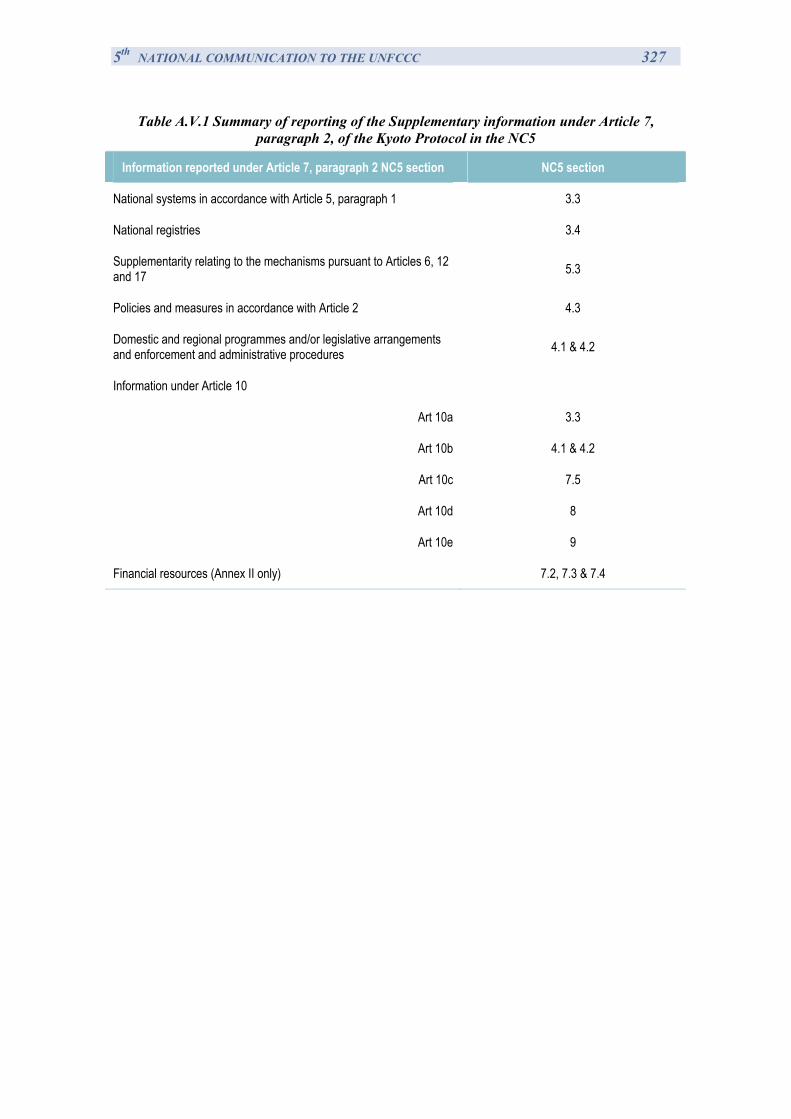
5th NATIONAL COMMUNICATION TO THE UNFCCC 327
Table A.V.1 Summary of reporting of the Supplementary information under Article 7, paragraph 2, of the Kyoto Protocol in the NC5
Information reported under Article 7, paragraph 2 NC5 section NC5 section
National systems in accordance with Article 5, paragraph 1 3.3
National registries 3.4
Supplementarity relating to the mechanisms pursuant to Articles 6, 12 and 17 5.3
Policies and measures in accordance with Article 2 4.3
Domestic and regional programmes and/or legislative arrangements and enforcement and administrative procedures 4.1 & 4.2
Information under Article 10
Art 10a
Art 10b
Art 10c
Art 10d
Art 10e
3.3
4.1 & 4.2
7.5
8
9
Financial resources (Annex II only) 7.2, 7.3 & 7.4
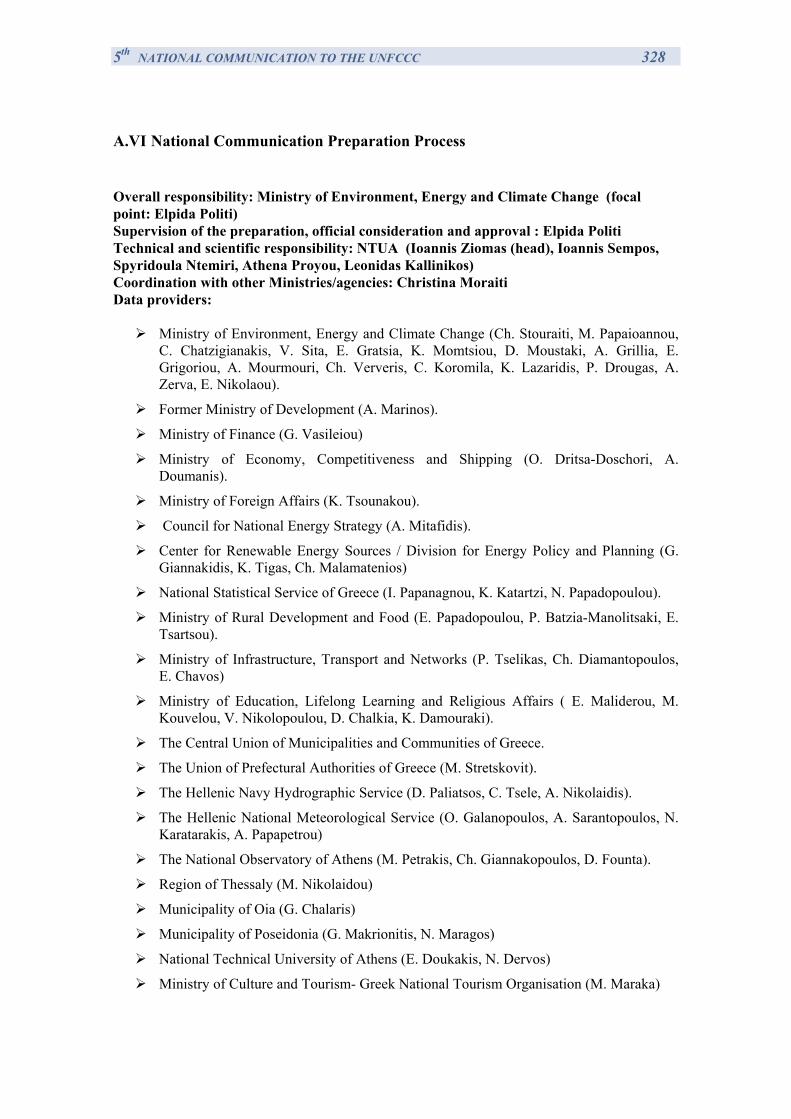
5th NATIONAL COMMUNICATION TO THE UNFCCC 328
A.VI National Communication Preparation Process
Overall responsibility: Ministry of Environment, Energy and Climate Change (focal point: Elpida Politi) Supervision of the preparation, official consideration and approval : Elpida Politi Technical and scientific responsibility: NTUA (Ioannis Ziomas (head), Ioannis Sempos, Spyridoula Ntemiri, Athena Proyou, Leonidas Kallinikos) Coordination with other Ministries/agencies: Christina Moraiti Data providers:
Ministry of Environment, Energy and Climate Change (Ch. Stouraiti, M. Papaioannou, C. Chatzigianakis, V. Sita, E. Gratsia, K. Momtsiou, D. Moustaki, A. Grillia, E. Grigoriou, A. Mourmouri, Ch. Ververis, C. Koromila, K. Lazaridis, P. Drougas, A. Zerva, E. Nikolaou).
Former Ministry of Development (A. Marinos).
Ministry of Finance (G. Vasileiou)
Ministry of Economy, Competitiveness and Shipping (O. Dritsa-Doschori, A. Doumanis).
Ministry of Foreign Affairs (K. Tsounakou).
Council for National Energy Strategy (A. Mitafidis).
Center for Renewable Energy Sources / Division for Energy Policy and Planning (G. Giannakidis, K. Tigas, Ch. Malamatenios)
National Statistical Service of Greece (I. Papanagnou, K. Katartzi, N. Papadopoulou).
Ministry of Rural Development and Food (E. Papadopoulou, P. Batzia-Manolitsaki, E. Tsartsou).
Ministry of Infrastructure, Transport and Networks (P. Tselikas, Ch. Diamantopoulos, E. Chavos)
Ministry of Education, Lifelong Learning and Religious Affairs ( E. Maliderou, M. Kouvelou, V. Nikolopoulou, D. Chalkia, K. Damouraki).
The Central Union of Municipalities and Communities of Greece.
The Union of Prefectural Authorities of Greece (M. Stretskovit).
The Hellenic Navy Hydrographic Service (D. Paliatsos, C. Tsele, A. Nikolaidis).
The Hellenic National Meteorological Service (O. Galanopoulos, A. Sarantopoulos, N. Karatarakis, A. Papapetrou)
The National Observatory of Athens (M. Petrakis, Ch. Giannakopoulos, D. Founta).
Region of Thessaly (M. Nikolaidou)
Municipality of Oia (G. Chalaris)
Municipality of Poseidonia (G. Makrionitis, N. Maragos)
National Technical University of Athens (E. Doukakis, N. Dervos)
Ministry of Culture and Tourism- Greek National Tourism Organisation (M. Maraka)

5th NATIONAL COMMUNICATION TO THE UNFCCC 329
Hellenic Centre for Marine Research ( A. Zampelis)
National Committee for Combatting Desertification (K. Kosmas)
Global Water Partnership (A. Brouma)
Related Documents


