HF-7761DE_C (2012-12) HELLA Investor Update Q1 2015/16 Conference Call on September 25th, 2015 Dr. Wolfgang Ollig, Chief Financial Officer Carl Pohlschmidt, Finance Director

Welcome message from author
This document is posted to help you gain knowledge. Please leave a comment to let me know what you think about it! Share it to your friends and learn new things together.
Transcript

HF-7761DE_C (2012-12)
HELLA Investor Update Q1 2015/16
Conference Call on September 25th, 2015
Dr. Wolfgang Ollig, Chief Financial Officer
Carl Pohlschmidt, Finance Director

Disclaimer
This document was prepared with reasonable care. However, no responsibility can be assumed for the correctness of the provided information. In addition, this document contains summary information only and does not purport to be comprehensive and is not intended to be (and should not be construed as) a basis of any analysis or other evaluation. No representation or warranty (express or implied) is made as to, and no reliance should be placed on, any information, including projections, targets, estimates and opinions contained herein.
This document may contain forward-looking statements and information on the markets in which the HELLA Group is active as well as on the business development of the HELLA Group. These statements are based on various assumptions relating, for example, to the development of the economies of individual countries, and in particular of the automotive industry. Various known and unknown risks, uncertainties and other factors (including those discussed in HELLA’s public reports) could lead to material differences between the actual future results, financial situation, development or performance of the HELLA Group and/or relevant markets and the statements and estimates given here. We do not update forward-looking statements and estimates retrospectively. Such statements and estimates are valid on the date of publication and can be superseded.
This document contains an English translation of the accounts of the Company and its subsidiaries. In the event of a discrepancy between the English translation herein and the official German version of such accounts, the official German version is the legal valid and binding version of the accounts and shall prevail.
22

HELLA Investor Update Q1 2015/16Outline
3
� HELLA Group Key Achievements
� Outlook
� Q&A
� Annex

HELLA Group Key AchievementsFinancial Highlights Q1 2015/16
� HELLA Group sales up 13.5% YoY to 1.5 bill. EUR, thereof 4.0%-points FX effects (mainly USD and CNY)
� Third party sales development per segment compared to previous year:− Automotive: +15% driven by product launches in innovative LED technologies, electronic
components for industry megatrends as well as strong position in premium segments− Aftermarket: +10% driven by recovering independent aftermarket in Europe after
consolidation phase especially
− Special Applications: -2% driven by continuing market weakness in the agricultural sector
� Gross Profit margin at 25.1% (-1.5%-point YoY) driven by supplier default, excluding one-offs margin at 26.7%, especially driven by automotive product mix and hedge costs
� R&D cost ratio at 9.3% (+0.4%-points YoY) as temporary effect, Distribution expenses at 7.9% (-0.2%-points YoY), administrative expenses at 3.5% (+/-0%-points YoY)
� EBIT at 69 mill. EUR (- 26 mill. EUR), margin at 4.6% (-2.6%-points YoY), excluding supplier case EBIT at 98 mill. EUR, margin at 6.6%
� Adjusted EBIT at 101 mill. EUR, margin at 6.8%, excluding supplier case and 3 mill. EUR restructuring expense
� Operative Free Cash Flow at 65 mill. EUR compared to 9 mill. EUR in Q1 FY14/15
Hella Investor Update Q1 2015/16, Conference Call on September 25, 2015
FINANCIAL HIGHLIGHTS
Sales
Profitability
Liquidity
4

1,318 1,443
53
Q1 FY14/15 Q1 FY15/16
HELLA Group Key AchievementsSales (I) – Outperforming Markets Q1 2015/16
Source: HELLA; VDA Research
New passenger car registration (registrations in millions; growth in %)
5
Global Europe Asia/RoW North/South America
HELLA revenue2 (in EUR millions, growth in %)
1. Approximation including only most important markets; 2. Regional market coverage by end customers
+24%
364
Q1 FY 14/15
Q1 FY 15/16
294
+14%
280
Q1 FY 14/15
Q1 FY 15/16
246
Q1 FY 15/16
483439
+10%
Q1 FY 14/15
Global1 Europe China USA
+14%(o/w 4%FX)
GROUP Automotive
1,496
Hella Investor Update Q1 2015/16, Conference Call on September 25, 2015
-3%
Q1 FY 15/16
4.0
Q1 FY 14/15
4.1
+3%
Q1 FY 15/16
4.5
Q1 FY 14/15
4.4
Q1 FY 15/16
3.4
Q1 FY 14/15
+12%
3.014.6
0%
Q1 FY 15/16
Q1 FY 14/15
14.5

73 73
5 5
6.2% 7.5%
-1.0%1.0%3.0%5.0%7.0%9.0%11.0%13.0%15.0%
01020304050607080
FY 14/15 FY 15/16
Sales EBIT EBIT Margin
7.3%4.2%
-1.0%
1.0%
3.0%
5.0%
7.0%
9.0%
11.0%
13.0%
15.0%
-
200
400
600
800
1,000
1,200
1,400
FY 14/15 FY 15/16
Electronics Lighting EBIT Margin
HELLA Group Key AchievementsSegment Highlights – Q1 2014/15 to Q1 2015/16
6
Aftermarket*Automotive* Special Applications*in mill. EUR** and in % sales
* Total sales including intersegment sales** Sales figures for Lighting & Electronics do not add up to Automotive sales due to sales between those two business divisions*** Supplier failure effect; 6.8% margin ex. supplier failure
� Strong demand for innovative electronics and lighting products based on megatrends
� Positive demand in Europe, NAFTA, new product launches in China
� Tech roll-out of complex productswith LED technology affects margin
� Non-recurring charges after supplier failure decrease EBIT by 29 mill. EUR
1.044**1,147**
� Recovery in independent aftermarket in Europe
� Wholesale and workshop equipment business positive
� Negative product mix-effect compensated by increased distribution efficiency
� Further weak demand in Agriculture sector, however stabilization
� Outdoor lighting sales reduced
� Positive product mix affects margin
76 48
EBIT
563517
537
in mill. EUR and in % sales in mill. EUR and in % sales
279307
15 17
5.5% 5.5%
-1.0%
1.0%
3.0%
5.0%
7.0%
9.0%
11.0%
13.0%
15.0%
0
50
100
150
200
250
300
350
FY 14/15 FY 15/16
Sales EBIT EBIT Margin
Hella Investor Update Q1 2015/16, Conference Call on September 25, 2015
646
29***
6.8%***

7.2%
6.2% 4.6%
6.6%
4.5% 4.6%
-0.1%-0.4%
-0.5% 0.2%
-2.0%
Q1 FY 14/15 GPMimprovment
R&D JV income Disribution & other
Q1 FY15/16ex.
Supplierdefault
Q1 FY 15/16
26.6% 26.7%
25.1%
+0.5% -0.4%
-1.6%
Q1 FY 14/15 Operational Hedge costs Q1 FY 15/16ex.
Supplierdefault
Q1 FY 15/16
HELLA Group Key AchievementsP&L (I) – Q1 2014/15 to Q1 2015/16
Comment� Excluding one-off charges from the supplier default,
positive gross profit margin development by +0.5%-points due to operational improvements
� Negative impact of hedging costs by -0.4% YoY
� Gross profit margin improvement of 0.1%-point YoY
� Extraordinary expenses increases COGS by around 24 mill. EUR, including 12 mill. EUR asset impairment
� Gross profit margin after one-off charges at 25.1%
Preliminary EBIT development Commentin mill. EUR and in % of sales*
� Excl. one-offs, EBIT growth of around 4% expected, leading to a EBIT margin of 6.6%
� Decline by 0.6%-points mainly caused by higher R&D expenses and lower JV earnings.
� JV income declined by 5 mill. EUR to 8 mill EUR due to less positive sales development in Korea and additional tax payment in one JV
� Supplier failure caused 29 mill. EUR one-off charges, negative margin impact of 2.0%-points
� EBIT Q1 FY15/16 declined by ~27% to approx. 69 mill EUR, EBIT margin declined by 2.6%-points to 4.6%
95
69
Gross Profit margin in % of sales*
7
* Differences in the presentation may arise as a result of commercial rounding
Hella Investor Update Q1 2015/16, Conference Call on September 25, 2015
-0.6%

� Adjusted EBIT (excluding restructuring costs and supplier failure) increased 4% to 101 mill. EUR, margin decreased by 0.6%-points to 6.8% in FY15/16
� Supplier failure in China leads to one-off charges of 29 mill. EUR
� EBIT decreased 27% to 69 mill. EUR, margin decreased by 2.6%-points to 4.6%
� Restructuring expenses on prior year level 3 mill. EUR
HELLA Group Key AchievementsP&L (II) – Q1 2014/15 to Q1 2015/16
EBIT and Adj. EBITin mill. EUR and % of sales
Comment
97+4%101
-27%
Q1 FY15/16
69
Q1 FY14/15
95
EBIT
Adj EBIT7.4%
6.8%7.2%
4.6%
� R&D expenses increased by 23 mill. EUR to 140 mill. EUR driven by high-tech product launches, R&D effort for high order intake and a low comparable basis Q1 FY 14/15: shift of development costs in Q2 FY 14/15. R&D ratio increased by 0.4%-points to 9.3% to level of previous full year
� Administrative expenses with constant ratio of 3.5% after realized efficiency gains and continuing restructuring initiatives in FY15/16
� Distribution expenses ratio decreased by 0.2%-points to 7.9% due to leverage of the existing aftermarket distribution network
Comments to main cost driver
Hella Investor Update Q1 2015/16, Conference Call on September 25, 20158

HELLA Group Key AchievementsOperative CF - Q1 2014/15 to Q1 2015/16
9
Operative CF development Comment
� Operative CF* increased by 56 mill. EUR to 65 mill. EUR, whereby cashsettlements for restructurings of 3 mill. EUR (3 mill. EUR in FY 14/15) are excluded
t
� Cash conversion ratio** increased by 55.3%-points to 64.8%
d
� After two years of globalization initiative strong increase in line with expectations driven by profitable top-line growth and reduced net CAPEX9
65
FY 2015/16
+56
FY 2014/15
9.5% Op. CF / adj. EBIT
64.8% Op. CF / adj. EBIT
* Excl. restructuring costs and one-off effect from supplier default** Operative Cash Flow before dividends and net capital expenditure on financial assets or shares in associates (excluding cash restructuring payments and one-off effect from supplier default)
in mill. EUR and cash conversion ratio (Operative Cash Flow / adj. EBIT*)
Hella Investor Update Q1 2015/16, Conference Call on September 25, 2015
HELLA Investor Update Q1 2015/16Outline
10
� HELLA Group Key Achievements
� Outlook
� Q&A
� Annex

RegionOutlook Automotive Sales
(in m pieces)Comment
Germany
• Positive development of new car registrations in the first months of 2015
• Modest expected economic growth of approx. 1% for 2015
WesternEurope incl. Germany
• Positive growth to or above pre-crises levels in most Western European countries
• Recovery gaining momentum in the fist 8 months of 2015
USA
• Positive growth in the first months of the calendar year 2015 of around 4%
• Favorable economic environment and solid domestic demand based on low fuel prices
China
• Decline in economic growth during 2015, uncertainty on full year development
• Impairment of economic situation could influence consumption and demand for automobiles negatively
TOTAL• Overall growing expectations with significant regional
differences. Assumed growth includes risk assessment on global economic development
3.03.1
2014 2015
11
OutlookMarket specific outlook
Source: VDA, HELLA own analysis
+2%
+5%
+6%
12.1 12.8
2014 2015
18.419.1
2014 2015
16.416.9
2014 2015
75 ∼76
+6%
+2%
+3%
+4%
+2% ∼1%
11
+13%
2014 2015
Hella Investor Update Q1 2015/16, Conference Call on September 25, 2015

12
OutlookCompany specific outlook FY 2015/16
12
Presuming no serious economic turmoil, we assume a further positive development of the operative HELLA business, however a decline in EBIT due to one-off charges in the FY 2015/16:
Hella Investor Update Q1 2015/16, Conference Call on September 25, 2015
Growth in medium to high one-digit percentage rangeSales
Guidance
One-off charges(supplier failure)
Up to 50 mill. EUR
EBIT Below previous year
� Sales still expected to grow in the middle to high single-digit percentage range over the full financial year
� Extraordinary strains predominantly in COGS also in remaining quarters, particularly Q2 FY 15/16
� Drag on EBIT in the first quarter and the remainder of the year cannot be offset by strong sales development
Comment

HELLA Investor Update Q1 2015/16Outline
13
� HELLA Group Key Achievements
� Financial Report
� Outlook
� Q&A
� Annex

HELLA Investor Update Q1 2015/16Outline
14
� HELLA Group Key Achievements
� Financial Report
� Outlook
� Q&A
� Annex

15
AnnexKey figures
Key Financial MetricsFiguresin mill. EUR if not otherwise stated
* Interest coverage and Gearing are covenants for Syn Loan
******
Hella Investor Update Q1 2015/16, Conference Call on September 25, 2015
16
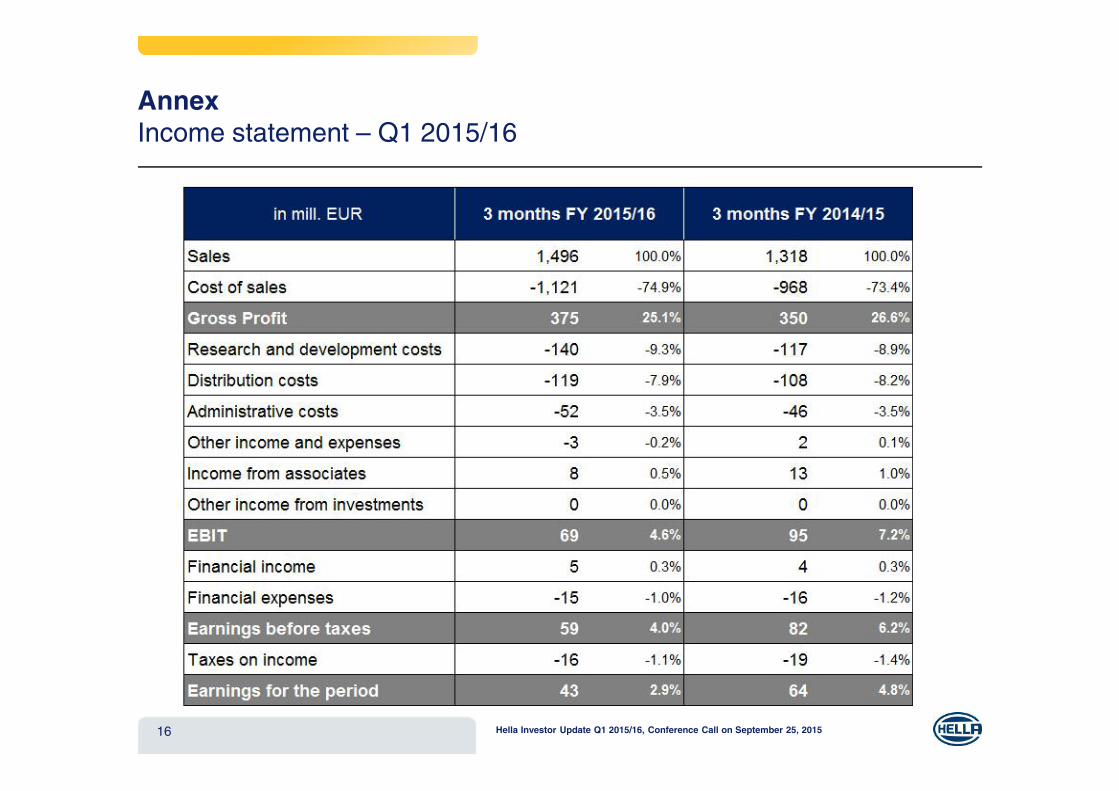
AnnexIncome statement – Q1 2015/16
**
Hella Investor Update Q1 2015/16, Conference Call on September 25, 2015

17
AnnexBalance sheet – Assets: August 31, 2015
*
17 Hella Investor Update Q1 2015/16, Conference Call on September 25, 2015

18
AnnexBalance sheet – Equity and liabilities: August 31, 2015
**
18 Hella Investor Update Q1 2015/16, Conference Call on September 25, 2015

19
AnnexCash Flow – Q1 2015/16
**
*Includes gross capital expenditures, less revenue from sale of assets, and less payments received for serial production
• Higher operative Cash Flow mainly due to lower gross capital expenditures
• Decrease in net capex* from 159 mill. EUR to 106 mill. EUR; customer payments exceeding previous year’s level (23 vs 15 mill. EUR)
• Operative Free Cash Flow of 65 mill. EUR
Hella Investor Update Q1 2015/16, Conference Call on September 25, 2015

20
Annex Financial Debt Structure – August 31, 2014 vs. August 31, 2015
Financial Debt Structure August 2014 vs. August 2015Figuresin mill. EUR
• Increase of other financial debt, accruals and revaluation (+31 mill. EUR) including also additional external loans of 44 mill. EUR in China
• EIB Loan repayment (150 mill. EUR) in January 2015 and redemption of 200 mill. EUR for a bond maturing in October
• Refinancing and reduction of synloan facility to 450 mill. EUR in June
Changes
* hedged value ** nominal amount
Maturity Aug 31, 2014 Deviation Aug 31, 2015
AFLAC Notes and Loan* 2032/33 175 0 1757.25% Notes 2009/2014** 2014 200 -200 02.375% Notes 2013/2020** 2020 500 0 5001.25% Notes 2014/2017** 2017 300 0 300Loan European Investment Bank 2015 150 -150 0Other Financial Debt, Accruals and Revaluation 112 31 143
Gross Financial Debt 1,437 -319 1,118
Cash and cash equivalents 646 77 723Financial Assets 367 -41 327
Net Debt 423 -355 68
Revolving credit facility (2015-2020) of 450 mill. EUR
Net Debt / EBITDA (LTM) 0,6x 0,1x
Hella Investor Update Q1 2015/16, Conference Call on September 25, 2015

Thanks for your attention
Dr. Kerstin DodelInvestor Relations
Office phone +49 2941 38 - 1349 Facsimile +49 2941 38 - 471349 Mobile phone +49 174 3343454 E-Mail [email protected] Internet www.hella.com
Related Documents