HF-7761DE_C (2012-12) HELLA Investor Update H1 FY 2017/18 Conference Call on January 11, 2018 Dr. Rolf Breidenbach, CEO Bernard Schäferbarthold, CFO

Welcome message from author
This document is posted to help you gain knowledge. Please leave a comment to let me know what you think about it! Share it to your friends and learn new things together.
Transcript

HF-7761DE_C (2012-12)
HELLA Investor Update H1 FY 2017/18
Conference Call on January 11, 2018
Dr. Rolf Breidenbach, CEOBernard Schäferbarthold, CFO

Disclaimer
This document was prepared with reasonable care. However, no responsibility can be assumed for the correctness of the provided information. In addition, this document contains summary information only and does not purport to be comprehensive and is not intended to be (and should not be construed as) a basis of any analysis or other evaluation. No representation or warranty (express or implied) is made as to, and no reliance should be placed on, any information, including projections, targets, estimates and opinions contained herein.
This document may contain forward-looking statements and information on the markets in which the HELLA Group is active as well as on the business development of the HELLA Group. These statements are based on various assumptions relating, for example, to the development of the economies of individual countries, and in particular of the automotive industry. Various known and unknown risks, uncertainties and other factors (including those discussed in HELLA’s public reports) could lead to material differences between the actual future results, financial situation, development or performance of the HELLA Group and/or relevant markets and the statements and estimates given here. We do not update forward-looking statements and estimates retrospectively. Such statements and estimates are valid on the date of publication and can be superseded.
This document contains an English translation of the accounts of the Company and its subsidiaries. In the event of a discrepancy between the English translation herein and the official German version of such accounts, the official German version is the legal valid and binding version of the accounts and shall prevail.
22 HELLA Investor Update H1 FY 2017/18, Conference Call on January 11th, 2018

HELLA Investor Update H1 FY 2017/18Outline
3
■ HELLA Financial Highlights H1 FY 2017/18
■ HELLA Financial Results H1 FY 2017/18
■ Outlook
■ Q&A
HELLA Investor Update H1 FY 2017/18, Conference Call on January 11th, 2018

Positive sales growth and EBIT increase in H1 FY 2017/18 Financial Highlights H1 FY 2017/18
■ Adj. Gross Profit margin at 28.1% (+0.3%-points YoY)■ Adj. EBIT +25 mill. EUR (+9.3% YoY) at 293 mill. EUR■ Adjusted EBIT margin +0.1pp to 8.5%
Sales
Profitability
4
■ HELLA Group currency adjusted sales grew by 9.3% YoY to 3.5 bill. EUR
Note: Adjustments of profitability figures include restructuring expenses in Germany and in previous yeas adjustment for provision in context with the EU cartel proceeding. Please note that where sums and percentages in the presentation have been rounded, differences may arise as a result of commercial rounding.
Liquidity ■ Adjusted Free Cash Flow from operating activities increased by17 mill. EUR (+23% YoY) to 91 mill. EUR
HELLA Investor Update H1 FY 2017/18, Conference Call on January 11th, 2018

HELLA top line growth with strong development in H1 FY 17/18Financial Highlights H1 FY 2017/18
HELLA Group sales (EUR millions) Comment
297
H1 FY 17/18
3,452
FX
+9.3% 8.0%
H1 FY 16/17
3,198
-42
adj. growth
5
■ Currency adjusted growth HELLA Group at 9.3%
■ Reported sales growth HELLA Groupat 8.0% (increased by 255 mill. EUR to 3,452 mill. EUR)− Automotive +9.1% to 2,650 mill. EUR.
Demand for energy management products, radar solutions and advanced lighting systems drives business.
− Aftermarket external sales +3.6%, positive demand from Independent Aftermarket and Wholesale
− Special Applications +13.0% to 211 mill. EUR, positive development in agriculture and constructions
HELLA Investor Update H1 FY 2017/18, Conference Call on January 11th, 2018

Automotive outperforming LVP in all regions Financial Highlights H1 FY 2017/18
537 646
-3.7%
1,619
+11.5%
H1 FY 17/18
H1 FY 16/17
1,629
+4.4%
1,560
H1 FY 15/16
H1 FY 14/15
1,452
Europe Asia & RoW462
+14.3%
404
+11.1%
364
+14.5%
H1 FY 17/18
H1 FY 16/17
H1 FY 15/16
H1 FY 14/15
318
533
+20.4%
442
+8.0%
409
+14.4%
H1 FY 17/18
H1 FY 16/17
H1 FY 15/16
H1 FY 14/15
358
North & South America2,623
+9.0%
2,406
+0.6%
2,392
+12.4%
H1 FY 17/18
H1 FY 16/17
H1 FY 15/16
H1 FY 14/15
2,128
Global
10.7
+2.0%
11.1
+3.5%10.5
+6.0%
H1 FY 17/18
H1 FY 16/17
H1 FY 15/16
H1 FY 14/15
9.9 10.2
-3.3%
10.6
+0.1%
10.5
-0.6%
H1 FY 17/18
H1 FY 16/17
H1 FY 15/16
H1 FY 14/15
10.6
+1.3%
47.847.1
+7.0%
44.1
+1.8%
H1 FY 17/18
H1 FY 16/17
H1 FY 15/16
H1 FY 14/15
43.3
25.5
+1.8%
25.1
+11.7%
22.4
H1 FY 17/18
H1 FY 16/17
+1.6%
H1 FY 15/16
H1 FY 14/15
22.1
+10.6%
HELLA Automotive external sales by region (in EUR millions)
Source: HELLA; IHS (as of December 2017)
Light vehicle production (in million units)
Europe Asia & RoWNorth & South AmericaGlobal
HELLA Automotive growth vs. market (Light vehicle production growth):
-6.4% +7.7% +5.5% -5.7% +0.9% +15.1% +7.9% +23.6% +12.9% -0.6% +12.5%
6 HELLA Investor Update H1 FY 2017/18, Conference Call on January 11th, 2018

HELLA Investor Update H1 FY 2017/18Outline
7
■ HELLA Financial Highlights H1 FY 2017/18
■ HELLA Financial Results H1 FY 2017/18
■ Outlook
■ Q&A
HELLA Investor Update H1 FY 2017/18, Conference Call on January 11th, 2018

GPM increase due to strong overall business developmentFinancial results H1 FY 2017/18
969887861
773
+88+82
H1 FY 17/18H1 FY 16/17H1 FY 15/16H1 FY 14/15
+26
8
-0.1 +0.5
27.2
28.1
+0.3
H1 FY 17/18H1 FY 16/17H1 FY 15/16H1 FY 14/15
27.727.3
Adj. Gross ProfitEUR millions
Adj. Gross Profit margin
■ Adj. Gross Profit increased by 82 mill. EUR (+9.2%) to 969 mill. EUR− Automotive +10.3% to 685 mill. EUR− Aftermarket + 1.2% to 210 mill. EUR− Special Applications +27.8% to
75 mill. EUR
8 HELLA Investor Update H1 FY 2017/18, Conference Call on January 11th, 2018
Highlights
Highlights■ Adj. Gross Profit margin improved
by 0.3%-points to 28.1%− despite ongoing capacity increases,
higher production volume and associated higher utilization with positive effects on GPM in Automotive especially in Q2
− increased margins in Aftermarket and Special Applications
% sales
Note: Adj. Gross Profit Margin 27.74% (H1 16/17) and 28.07% in (H1 17/18); Delta of 0.3pp

Continuous high R&D expenses to secure future growth and support production ramp-upFinancial results H1 FY 2017/18
9
3.7%
3.4%
8.1%
7.8%
339311291269
+20 +28
H1 FY 17/18H1 FY 16/17H1 FY 14/15
+22
H1 FY 15/16
+0.1
H1 FY 17/18H1 FY 16/17
9.7
-0.3 +0.5
9.2
H1 FY 14/15
9.8
H1 FY 15/16
9.5
R&D expensesEUR millions
R&D expenses ratio
■ Absolute R&D expenses increased by 28 mill. EUR (+8.9% YoY) to 339 mill. EUR, mainly:
− Secure and strengthen technology leadership along the market trends
− Preparation and realization of production ramp-ups
− Investments in international R&D capacities
■ H1 FY 17/18 ratio +0.1pp to 9.8% due to high level of absolute R&D expenses
HELLA Investor Update H1 FY 2017/18, Conference Call on January 11th, 2018
% sales
Highlights
Highlights
Relatively stable development of SG&A costsFinancial results H1 FY 2017/18
10
3.7%
3.4%
8.1%
7.8%
3.7%
3.4%
8.1%
7.8%
361341338305
+20+2
H1 FY 14/15 H1 FY 15/16 H1 FY 16/17 H1 FY 17/18
+33
10.8 10.7
-0.110.5
-0.2
H1 FY 17/18H1 FY 16/17H1 FY 15/16H1 FY 14/15
10.7
-0.1
Adjusted SG&A expensesEUR millions
Adjusted SG&A expenses ratio
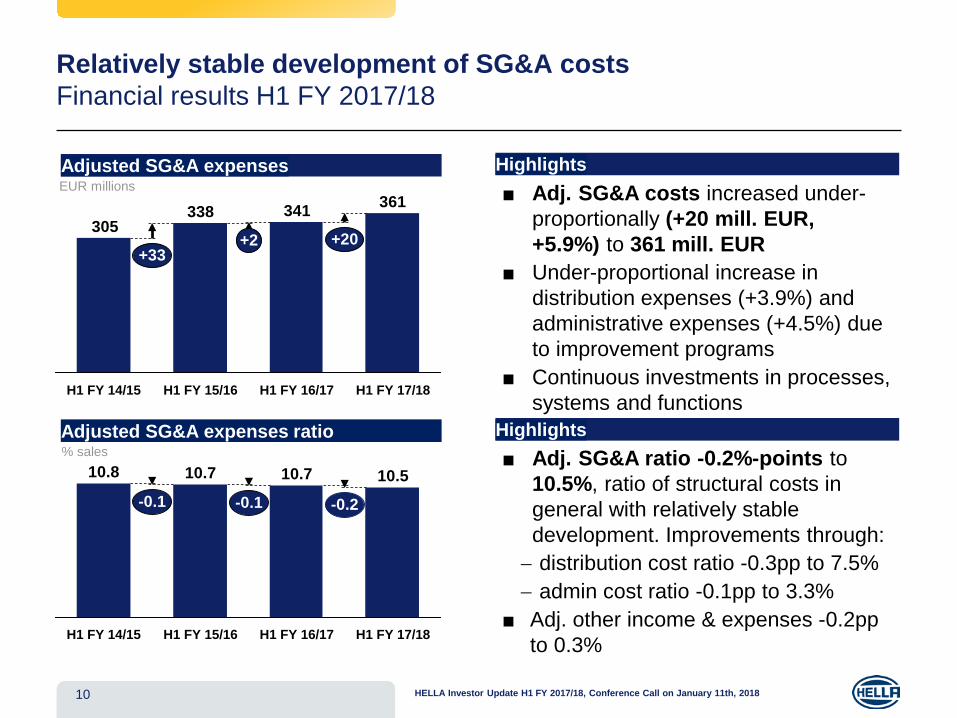
■ Adj. SG&A costs increased under-proportionally (+20 mill. EUR, +5.9%) to 361 mill. EUR
■ Under-proportional increase in distribution expenses (+3.9%) and administrative expenses (+4.5%) due to improvement programs
■ Continuous investments in processes, systems and functions
HELLA Investor Update H1 FY 2017/18, Conference Call on January 11th, 2018
■ Adj. SG&A ratio -0.2%-points to 10.5%, ratio of structural costs in general with relatively stable development. Improvements through: − distribution cost ratio -0.3pp to 7.5%− admin cost ratio -0.1pp to 3.3%
■ Adj. other income & expenses -0.2pp to 0.3%
Highlights
Highlights% sales
Adjusted EBIT and EBIT margin above prior-year’s levelFinancial results H1 FY 2017/18
293268256
227+12
+29+25
H1 FY 17/18H1 FY 16/17H1 FY 15/16H1 FY 14/15
11
8.1
+0.3
8.4
+0.1
8.5
+0.1
H1 FY 17/18H1 FY 16/17H1 FY 15/16H1 FY 14/15
8.0
Adjusted EBITEUR millions
Adjusted EBIT margin
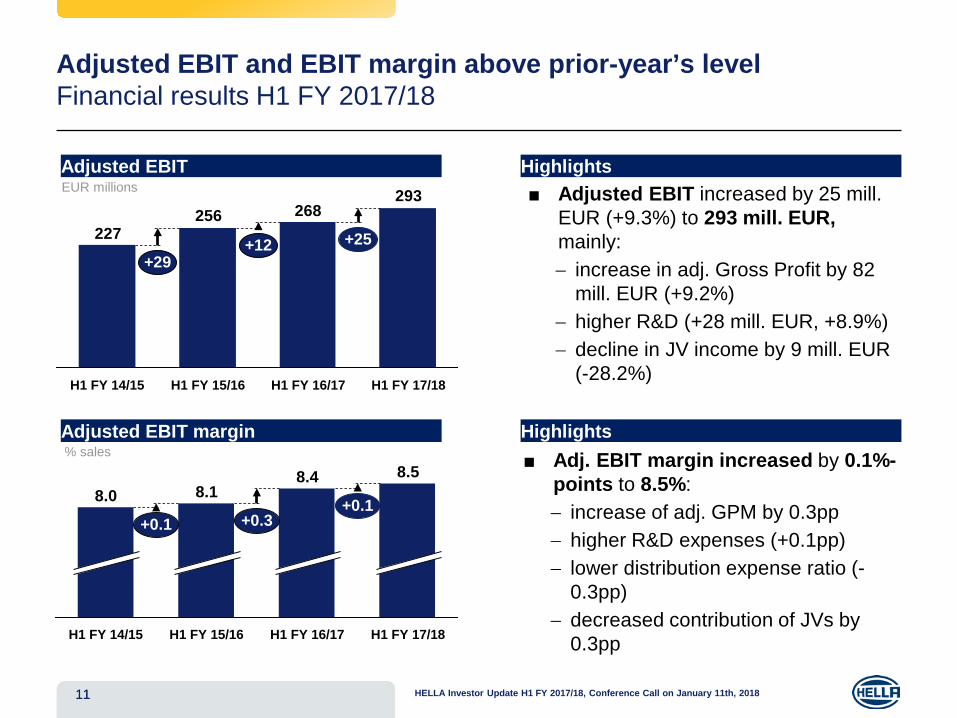
■ Adjusted EBIT increased by 25 mill. EUR (+9.3%) to 293 mill. EUR, mainly:− increase in adj. Gross Profit by 82
mill. EUR (+9.2%)− higher R&D (+28 mill. EUR, +8.9%)− decline in JV income by 9 mill. EUR
(-28.2%)
■ Adj. EBIT margin increased by 0.1%-points to 8.5%:− increase of adj. GPM by 0.3pp− higher R&D expenses (+0.1pp)− lower distribution expense ratio (-
0.3pp)− decreased contribution of JVs by
0.3pp
11 HELLA Investor Update H1 FY 2017/18, Conference Call on January 11th, 2018
% sales
Highlights
Highlights
P&L including reconciliation Financial results H1 FY 2017/18
12
HELLA GROUPin EUR mill.
H1FY 16/17
H1FY 17/18
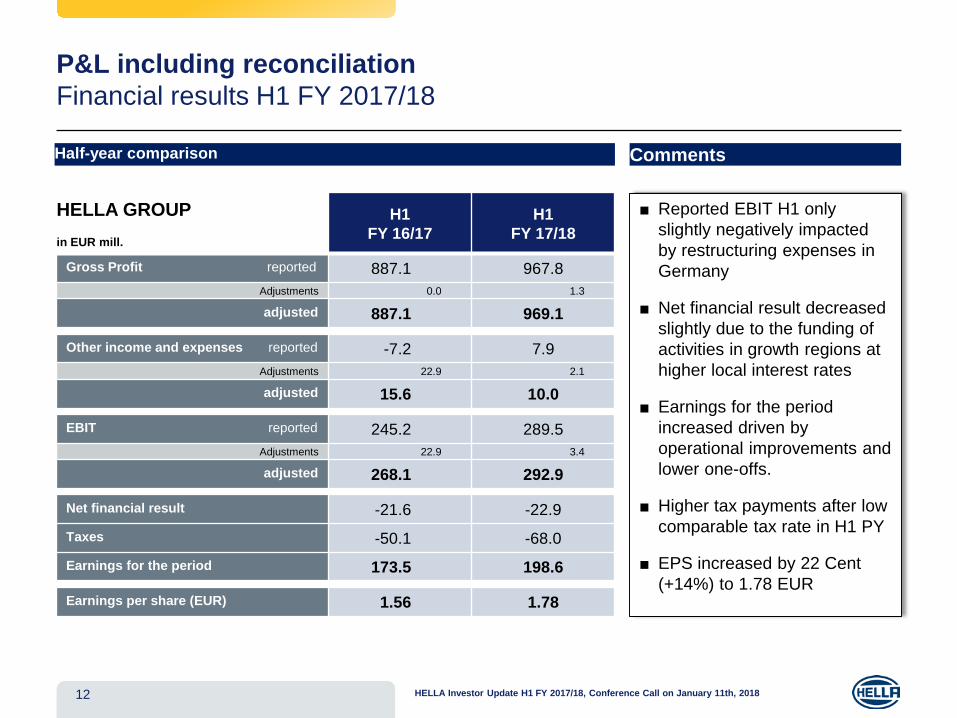
Gross Profit reported 887.1 967.8Adjustments 0.0 1.3
adjusted 887.1 969.1
Other income and expenses reported -7.2 7.9Adjustments 22.9 2.1
adjusted 15.6 10.0
EBIT reported 245.2 289.5Adjustments 22.9 3.4
adjusted 268.1 292.9
Net financial result -21.6 -22.9Taxes -50.1 -68.0Earnings for the period 173.5 198.6
Earnings per share (EUR) 1.56 1.78
■ Reported EBIT H1 only slightly negatively impacted by restructuring expenses in Germany
■ Net financial result decreased slightly due to the funding of activities in growth regions at higher local interest rates
■ Earnings for the period increased driven by operational improvements and lower one-offs.
■ Higher tax payments after low comparable tax rate in H1 PY
■ EPS increased by 22 Cent (+14%) to 1.78 EUR
CommentsHalf-year comparison
HELLA Investor Update H1 FY 2017/18, Conference Call on January 11th, 2018
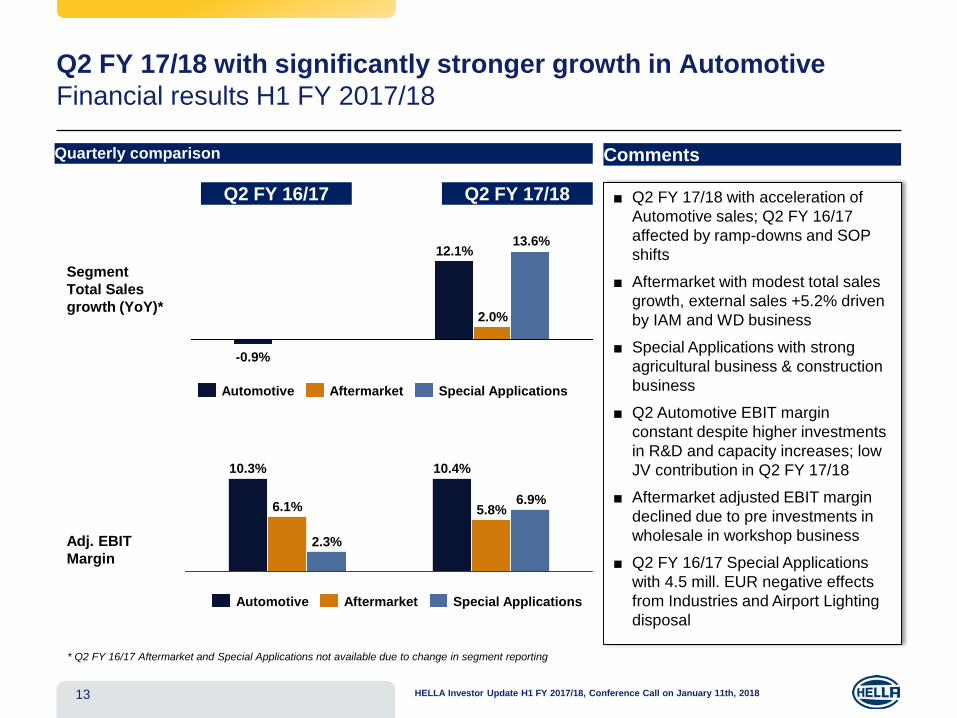
Q2 FY 17/18 with significantly stronger growth in AutomotiveFinancial results H1 FY 2017/18
Segment Total Salesgrowth (YoY)*
Adj. EBIT Margin
13.6%
2.0%
12.1%
-0.9%
Special ApplicationsAftermarketAutomotive
13
2.3%
6.1%
10.3%
6.9%5.8%
10.4%
Q2 FY 16/17 Q2 FY 17/18
Automotive Aftermarket Special Applications
HELLA Investor Update H1 FY 2017/18, Conference Call on January 11th, 2018
CommentsQuarterly comparison
■ Q2 FY 17/18 with acceleration of Automotive sales; Q2 FY 16/17 affected by ramp-downs and SOP shifts
■ Aftermarket with modest total sales growth, external sales +5.2% driven by IAM and WD business
■ Special Applications with strong agricultural business & construction business
■ Q2 Automotive EBIT margin constant despite higher investments in R&D and capacity increases; low JV contribution in Q2 FY 17/18
■ Aftermarket adjusted EBIT margin declined due to pre investments in wholesale in workshop business
■ Q2 FY 16/17 Special Applications with 4.5 mill. EUR negative effects from Industries and Airport Lighting disposal
* Q2 FY 16/17 Aftermarket and Special Applications not available due to change in segment reporting

EUR millions
Adj. Free Cash Flow from operating activities increased due to higher funds from operationsFinancial results H1 FY 2017/18
14
■ Adj. Free Cash Flow from operating activities increased by 17 mill. EUR to 91 mill. EUR, mainly due to increased funds from operations
■ Cash Conversion* ratio increased by 3.5pp to 31.1%
Adj. FCF from operating activities
Net CAPEX
213208189194
+19-5+5
H1 FY 17/18H1 FY 16/17H1 FY 15/16H1 FY 14/15
■ Net CAPEX increased by 5 mill. EUR to 213 mill. EUR
■ Continuous investments in customer-specific equipment, continuous capacity extension
■ Reimbursements increased by 13 mill. EUR to 76 mill. EUR depending on project launches
9174
102
-19
H1 FY 16/17
-27.7%-651.2%+23.1%
H1 FY 17/18H1 FY 15/16H1 FY 14/15
HELLA Investor Update H1 FY 2017/18, Conference Call on January 11th, 2018
EUR millions
Highlights
Highlights
Note: Adjustments of FCF include restructuring expenses, factoring (H1 FY 16/17 only) and adjustment for cash payments in context with the EU cartel proceeding (H1 FY 17/18 only)
*Note: Adj. Free Cash Flow from operating activities / adj. EBIT

Automotive segment with increasing growthFinancial results H1 FY 2017/18
15
■ Growth of 9.1% with ongoing production ramp-ups and higher demand for:− energy management and driver assistance
products− innovative / advanced lighting products− Demand driven by NSA, China and Europe
(ex. Germany)
Automotive Sales
■ Increase of adj. EBIT by 4.5% to 238 mill. EUR:− ongoing capacity increase with initially lower
utilization level; increase in production volume and higher utilization of existing capacities in Q2
− increase in R&D to prepare production ramp-upsand expand international R&D network
− lower JV contribution due to weakness in Asian joint ventures
Automotive Profitability
238227205
185
H1 FY 17/18
9.0
H1 FY 16/17
9.4
H1 FY 15/16
8.5
H1 FY 14/15
8.2
+11.2%+10.5%
+4.5%
Adj. EBIT Margin (% of total sales)Adj. EBIT
537 646948
10.4%-1.2%
2,413
+14.6%
2.9%9.7%
+9.1%
2,430
7.3%
2,650
H1 FY 17/18
+0.7%+6.4%
27
1,475
1,148
H1 FY 16/17
23
1,336
1,070
H1 FY 15/16
20
1,352
1,040
H1 FY 14/15
2,268
140
1,179
External Sales LightingExternal Sales Electronics Intersegment Sales
HELLA Investor Update H1 FY 2017/18, Conference Call on January 11th, 2018
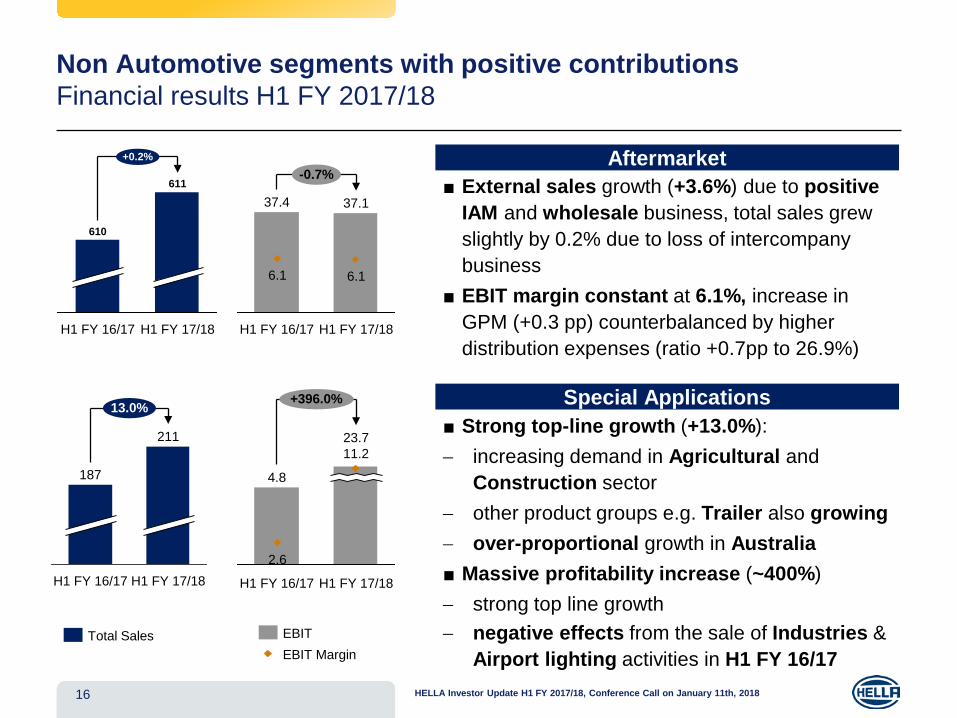
Non Automotive segments with positive contributionsFinancial results H1 FY 2017/18
16
■ External sales growth (+3.6%) due to positive IAM and wholesale business, total sales grew slightly by 0.2% due to loss of intercompany business
■ EBIT margin constant at 6.1%, increase in GPM (+0.3 pp) counterbalanced by higher distribution expenses (ratio +0.7pp to 26.9%)
537
Aftermarket+0.2%
H1 FY 17/18
611
H1 FY 16/17
610
H1 FY 16/17
37.4
6.1
-0.7%
H1 FY 17/18
37.1
6.1
■ Strong top-line growth (+13.0%):− increasing demand in Agricultural and
Construction sector− other product groups e.g. Trailer also growing− over-proportional growth in Australia■ Massive profitability increase (~400%)− strong top line growth− negative effects from the sale of Industries &
Airport lighting activities in H1 FY 16/17
537
Special Applications13.0%
H1 FY 17/18
211
H1 FY 16/17
187
+396.0%
4.8
2.6
H1 FY 17/18
23.711.2
H1 FY 16/17
EBIT MarginEBITTotal Sales
HELLA Investor Update H1 FY 2017/18, Conference Call on January 11th, 2018

HELLA Investor Update H1 FY 2017/18Outline
17
■ HELLA Financial Highlights H1 FY 2017/18
■ HELLA Financial Results H1 FY 2017/18
■ Outlook
■ Q&A
HELLA Investor Update H1 FY 2017/18, Conference Call on January 11th, 2018

Region Expected LVP(in m units) Comment
Europe
■ Continuing growth in 2017/18 expected. Europe excluding Germany expected to grow by 5.5% to 16.8m units, Germany with an expected decline of 0.7% to 5.9m units
NSA ■ After weak first half (-3.3%), better growth dynamic in H2 2017/18 expected
China■ China expected to grow slightly in 2017/18,
Asia/RoW expected to grow by 1.2% to 50.9m units
Global ■ Overall market expected to grow by 1.7%
Overall market FY 17/18 expected to grow by 1.7% according to IHSOutlook
Source: IHS Light Vehicle Production (LVP) (as of December 2017)
+96.2+1.7%
FY 17/18
FY 17/18
22.7
20.8
FY 17/18
FY 17/18
27.5
+0.1%
+0.4%
18
+3.8%
HELLA Investor Update H1 FY 2017/18, Conference Call on January 11th, 2018
19
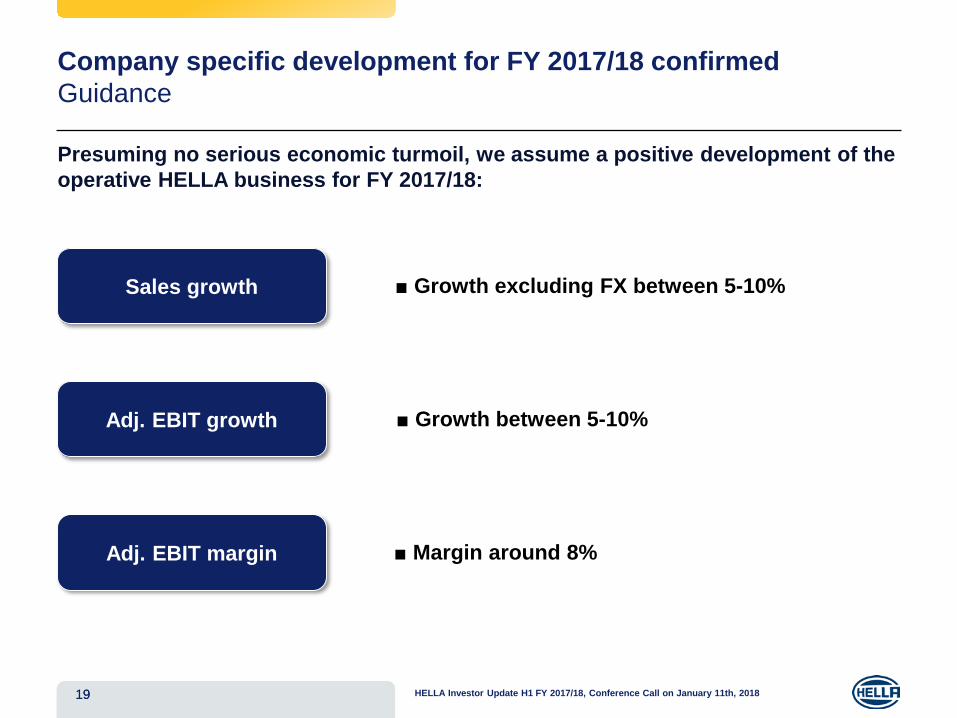
Company specific development for FY 2017/18 confirmedGuidance
19
Presuming no serious economic turmoil, we assume a positive development of the operative HELLA business for FY 2017/18:
■ Growth excluding FX between 5-10%Sales growth
Adj. EBIT margin ■ Margin around 8%
Adj. EBIT growth ■ Growth between 5-10%
HELLA Investor Update H1 FY 2017/18, Conference Call on January 11th, 2018

HELLA Investor Update H1 FY 2017/18Outline
20
■ HELLA Financial Highlights H1 FY 2017/18
■ HELLA Financial Results H1 FY 2017/18
■ Outlook
■ Q&A
HELLA Investor Update H1 FY 2017/18, Conference Call on January 11th, 2018

Thanks for your attention
Dr. Kerstin Dodel, CFAHead of Investor Relations
Office phone +49 2941 38 - 1349 Facsimile +49 2941 38 - 471349 Mobile phone +49 174 3343454 E-Mail [email protected] Internet www.hella.com
Related Documents