IEEE TRANSACTIONS ON PLASMA SCIENCE, VOL. 25, NO. 6, DECEMBER 1997 1229 Helicons—The Early Years Rod W. Boswell and Francis F. Chen Abstract—Helicon waves are right-hand polarized (RHP) waves which propagate in radially confined magnetized plasmas for frequencies where is the ion cyclotron frequency and is the electron cyclotron frequency. They are part of a much larger family of waves which can propagate down to zero frequency and constitute a very rich field for studying complex propagation characteristics and wave–particle interactions. This paper gives a historical perspective of the waves and their relationship to plasma source development up to the mid 1980’s, presents a simple description of their propagation characteristics in free and bounded plasmas, and finishes with their first reported use in plasma processing experiments. Index Terms—Helicon waves, historical review, plasma sources, wave propagation in cylinders. I. INTRODUCTION T HIS paper is the first part of a review of helicon waves and covers the period finishing in the mid 1980’s. This date was chosen as it marked the publication of the first experiments on high-density plasma etching using a helicon source; it was also the start of work in this subject at UCLA. Hence, it was natural to divide the major responsibilities of the authors with Boswell taking the early period and Chen taking the subsequent evolution. The present review will naturally follow Boswell’s style and his perspective, including, as it does, a certain number of personal opinions. The theoretical development of the dispersion of helicon and whistler waves has been put in the Appendix and only the most basic of equations necessary to clarify the physics of their propagation are presented in the text. II. HISTORICAL PERSPECTIVE The first measurements of right-hand polarized (RHP) waves were apparently made around the second half of the first World War. In order to eavesdrop on telegraphic communications which commonly used single cables and an Earth return, signal corps on opposing sides used to slip out into no-man’s land and lay down a few kilometers of cable hoping to pick up the weak currents produced by the telephones. To their great surprise, they picked up considerably more! Clear tones lasting seconds were heard descending in frequency from kHz to hundreds of Hertz. Sometimes these whistling tones were short in duration but repeated many times a second, a sound reminiscent of the dawn chorus of birds. Initially, it was suspected that these were communications Manuscript received November 25, 1996; revised August 6, 1997. R. W. Boswell is with the Plasma Research Laboratory, RSPhysSE, ANU, Canberra, Australia. F. F. Chen is with the Electrical Engineering Department, University of California, Los Angeles, CA USA. Publisher Item Identifier S 0093-3813(97)08991-1. from extra-terrestrial beings, and newspapers indulged in some rather fantastic speculation involving messages from Mars. III. WHISTLING ATMOSPHERICS The first report in a scientific journal of these whistling tones was given in 1919 by Barkhausen [1] in a paper on new amplifiers applied to magnetometers. Added to this paper was a report of whistling tones from the Earth heard on telephone lines at the war front. They were descending tones from about 1 kHz which lasted up to a second, and sometimes they were so loud that other normal telegraphic communication could not be distinguished. The soldiers christened the phenomenon “the grenades fly,” making a sound like “peou.” Barkhausen revisited his ideas in 1930 after more was known about the Heavyside layer 100 km above the surface of the Earth, and proposed that a lightning flash could account for the broad frequency spectrum. As for the long duration of the tone, he was at a loss but suggested that the Heavyside layer could induce multiple reflections in the waveguide formed by the earth and the high-altitude reflecting layer. Actually, the physics of the whistling tones was beyond the then extant knowledge and beyond the Heavyside layer. The following two years brought papers by Hartree [2] and Appleton [3] who, following a physical and engineering viewpoint, respectively, developed the first theory for the prop- agation of electromagnetic waves in a magnetized plasma. The need for such a theory was driven by a critical social desire, viz., the wish to communicate over large distances without using wires, and the radio waves in use showed dramatic fluctuations in reception depending on the frequency and the time of day. They obtained an equation for the refractive index which depended on the plasma density, magnetic field, fre- quency, and propagation angle. Three years later, Booker [4] simplified the relatively cumberson Appleton–Hartree disper- sion relation into quasilongitudinal and quasitransverse wave propagation cases (relative to the magnetic field) yielding, for the waves we are interested in, the rather simple dispersion relation (1) where refractive index of the plasma defined as the ratio of the speed of light to the phase velocity ( ) of the wave; electron plasma frequency; electron cyclotron frequency; angle between the wave vector ( ) and the magnetic field ( ). 0093–3813/97$10.00 1997 IEEE

Welcome message from author
This document is posted to help you gain knowledge. Please leave a comment to let me know what you think about it! Share it to your friends and learn new things together.
Transcript

IEEE TRANSACTIONS ON PLASMA SCIENCE, VOL. 25, NO. 6, DECEMBER 1997 1229
Helicons—The Early YearsRod W. Boswell and Francis F. Chen
Abstract—Helicon waves are right-hand polarized (RHP) waveswhich propagate in radially confined magnetized plasmas forfrequencies !ci � ! � !ce where !ci is the ion cyclotronfrequency and!ce is the electron cyclotron frequency. They arepart of a much larger family of waves which can propagatedown to zero frequency and constitute a very rich field forstudying complex propagation characteristics and wave–particleinteractions. This paper gives a historical perspective of the wavesand their relationship to plasma source development up to themid 1980’s, presents a simple description of their propagationcharacteristics in free and bounded plasmas, and finishes withtheir first reported use in plasma processing experiments.
Index Terms—Helicon waves, historical review, plasma sources,wave propagation in cylinders.
I. INTRODUCTION
T HIS paper is the first part of a review of helicon wavesand covers the period finishing in the mid 1980’s. This
date was chosen as it marked the publication of the firstexperiments on high-density plasma etching using a heliconsource; it was also the start of work in this subject at UCLA.Hence, it was natural to divide the major responsibilities of theauthors with Boswell taking the early period and Chen takingthe subsequent evolution. The present review will naturallyfollow Boswell’s style and his perspective, including, as itdoes, a certain number of personal opinions. The theoreticaldevelopment of the dispersion of helicon and whistler waveshas been put in the Appendix and only the most basic ofequations necessary to clarify the physics of their propagationare presented in the text.
II. HISTORICAL PERSPECTIVE
The first measurements of right-hand polarized (RHP)waves were apparently made around the second half ofthe first World War. In order to eavesdrop on telegraphiccommunications which commonly used single cables and anEarth return, signal corps on opposing sides used to slipout into no-man’s land and lay down a few kilometers ofcable hoping to pick up the weak currents produced by thetelephones. To their great surprise, they picked up considerablymore! Clear tones lasting seconds were heard descending infrequency from kHz to hundreds of Hertz. Sometimes thesewhistling tones were short in duration but repeated many timesa second, a sound reminiscent of the dawn chorus of birds.Initially, it was suspected that these were communications
Manuscript received November 25, 1996; revised August 6, 1997.R. W. Boswell is with the Plasma Research Laboratory, RSPhysSE, ANU,
Canberra, Australia.F. F. Chen is with the Electrical Engineering Department, University of
California, Los Angeles, CA USA.Publisher Item Identifier S 0093-3813(97)08991-1.
from extra-terrestrial beings, and newspapers indulged in somerather fantastic speculation involving messages from Mars.
III. W HISTLING ATMOSPHERICS
The first report in a scientific journal of these whistlingtones was given in 1919 by Barkhausen [1] in a paper on newamplifiers applied to magnetometers. Added to this paper wasa report of whistling tones from the Earth heard on telephonelines at the war front. They were descending tones from about1 kHz which lasted up to a second, and sometimes they wereso loud that other normal telegraphic communication couldnot be distinguished. The soldiers christened the phenomenon“the grenades fly,” making a sound like “peou.” Barkhausenrevisited his ideas in 1930 after more was known about theHeavyside layer 100 km above the surface of the Earth, andproposed that a lightning flash could account for the broadfrequency spectrum. As for the long duration of the tone, hewas at a loss but suggested that the Heavyside layer couldinduce multiple reflections in the waveguide formed by theearth and the high-altitude reflecting layer.
Actually, the physics of the whistling tones was beyond thethen extant knowledge and beyond the Heavyside layer.
The following two years brought papers by Hartree [2]and Appleton [3] who, following a physical and engineeringviewpoint, respectively, developed the first theory for the prop-agation of electromagnetic waves in a magnetized plasma. Theneed for such a theory was driven by a critical social desire,viz., the wish to communicate over large distances withoutusing wires, and the radio waves in use showed dramaticfluctuations in reception depending on the frequency and thetime of day. They obtained an equation for the refractive indexwhich depended on the plasma density, magnetic field, fre-quency, and propagation angle. Three years later, Booker [4]simplified the relatively cumberson Appleton–Hartree disper-sion relation into quasilongitudinal and quasitransverse wavepropagation cases (relative to the magnetic field) yielding, forthe waves we are interested in, the rather simple dispersionrelation
(1)
where
refractive index of the plasma defined as the ratio ofthe speed of light to the phase velocity ( )of the wave;electron plasma frequency;electron cyclotron frequency;angle between the wave vector () and the magneticfield ( ).
0093–3813/97$10.00 1997 IEEE
1230 IEEE TRANSACTIONS ON PLASMA SCIENCE, VOL. 25, NO. 6, DECEMBER 1997
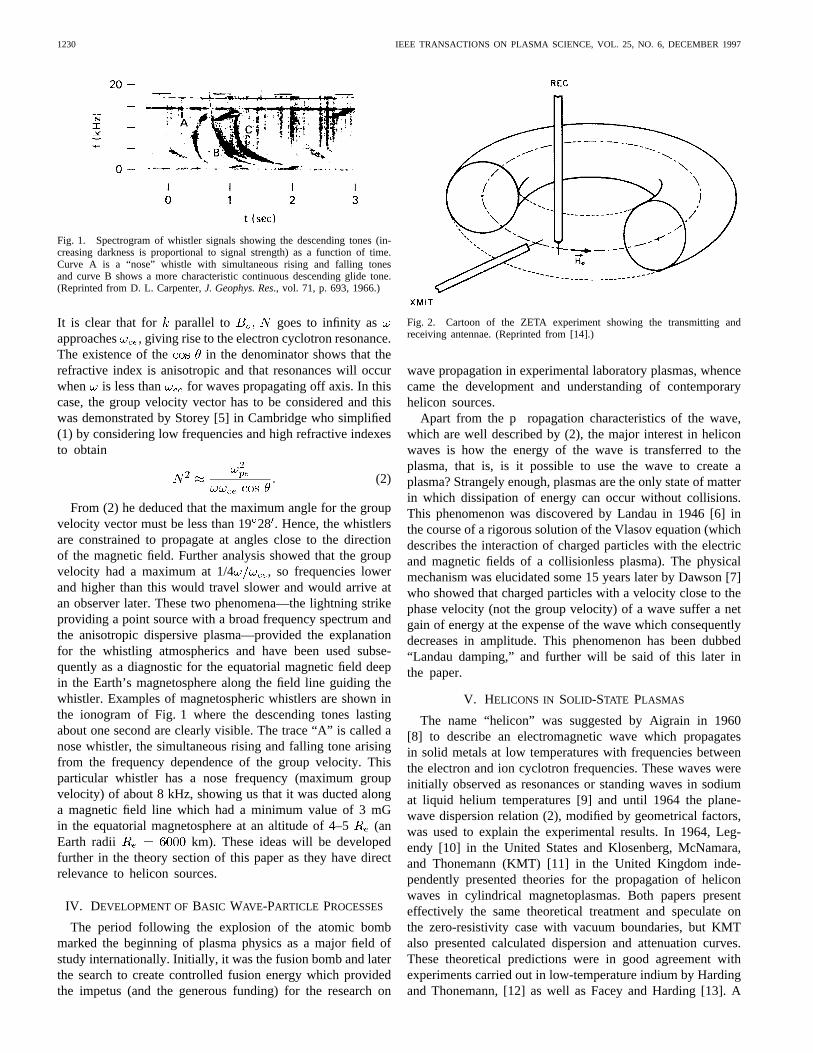
Fig. 1. Spectrogram of whistler signals showing the descending tones (in-creasing darkness is proportional to signal strength) as a function of time.Curve A is a “nose” whistle with simultaneous rising and falling tonesand curve B shows a more characteristic continuous descending glide tone.(Reprinted from D. L. Carpenter,J. Geophys. Res., vol. 71, p. 693, 1966.)
It is clear that for parallel to goes to infinity asapproaches , giving rise to the electron cyclotron resonance.The existence of the in the denominator shows that therefractive index is anisotropic and that resonances will occurwhen is less than for waves propagating off axis. In thiscase, the group velocity vector has to be considered and thiswas demonstrated by Storey [5] in Cambridge who simplified(1) by considering low frequencies and high refractive indexesto obtain
(2)
From (2) he deduced that the maximum angle for the groupvelocity vector must be less than 1928 . Hence, the whistlersare constrained to propagate at angles close to the directionof the magnetic field. Further analysis showed that the groupvelocity had a maximum at 1/4 , so frequencies lowerand higher than this would travel slower and would arrive atan observer later. These two phenomena—the lightning strikeproviding a point source with a broad frequency spectrum andthe anisotropic dispersive plasma—provided the explanationfor the whistling atmospherics and have been used subse-quently as a diagnostic for the equatorial magnetic field deepin the Earth’s magnetosphere along the field line guiding thewhistler. Examples of magnetospheric whistlers are shown inthe ionogram of Fig. 1 where the descending tones lastingabout one second are clearly visible. The trace “A” is called anose whistler, the simultaneous rising and falling tone arisingfrom the frequency dependence of the group velocity. Thisparticular whistler has a nose frequency (maximum groupvelocity) of about 8 kHz, showing us that it was ducted alonga magnetic field line which had a minimum value of 3 mGin the equatorial magnetosphere at an altitude of 4–5(anEarth radii km). These ideas will be developedfurther in the theory section of this paper as they have directrelevance to helicon sources.
IV. DEVELOPMENT OF BASIC WAVE-PARTICLE PROCESSES
The period following the explosion of the atomic bombmarked the beginning of plasma physics as a major field ofstudy internationally. Initially, it was the fusion bomb and laterthe search to create controlled fusion energy which providedthe impetus (and the generous funding) for the research on
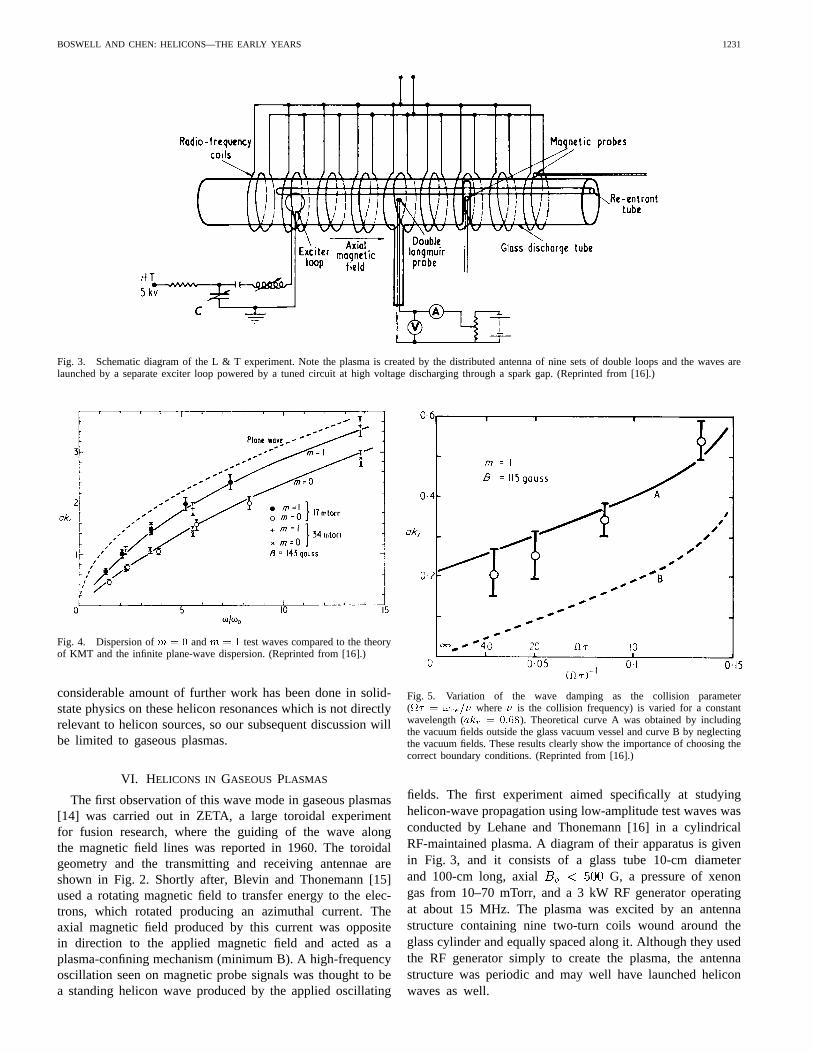
Fig. 2. Cartoon of the ZETA experiment showing the transmitting andreceiving antennae. (Reprinted from [14].)
wave propagation in experimental laboratory plasmas, whencecame the development and understanding of contemporaryhelicon sources.
Apart from the p ropagation characteristics of the wave,which are well described by (2), the major interest in heliconwaves is how the energy of the wave is transferred to theplasma, that is, is it possible to use the wave to create aplasma? Strangely enough, plasmas are the only state of matterin which dissipation of energy can occur without collisions.This phenomenon was discovered by Landau in 1946 [6] inthe course of a rigorous solution of the Vlasov equation (whichdescribes the interaction of charged particles with the electricand magnetic fields of a collisionless plasma). The physicalmechanism was elucidated some 15 years later by Dawson [7]who showed that charged particles with a velocity close to thephase velocity (not the group velocity) of a wave suffer a netgain of energy at the expense of the wave which consequentlydecreases in amplitude. This phenomenon has been dubbed“Landau damping,” and further will be said of this later inthe paper.
V. HELICONS IN SOLID-STATE PLASMAS
The name “helicon” was suggested by Aigrain in 1960[8] to describe an electromagnetic wave which propagatesin solid metals at low temperatures with frequencies betweenthe electron and ion cyclotron frequencies. These waves wereinitially observed as resonances or standing waves in sodiumat liquid helium temperatures [9] and until 1964 the plane-wave dispersion relation (2), modified by geometrical factors,was used to explain the experimental results. In 1964, Leg-endy [10] in the United States and Klosenberg, McNamara,and Thonemann (KMT) [11] in the United Kingdom inde-pendently presented theories for the propagation of heliconwaves in cylindrical magnetoplasmas. Both papers presenteffectively the same theoretical treatment and speculate onthe zero-resistivity case with vacuum boundaries, but KMTalso presented calculated dispersion and attenuation curves.These theoretical predictions were in good agreement withexperiments carried out in low-temperature indium by Hardingand Thonemann, [12] as well as Facey and Harding [13]. A
BOSWELL AND CHEN: HELICONS—THE EARLY YEARS 1231
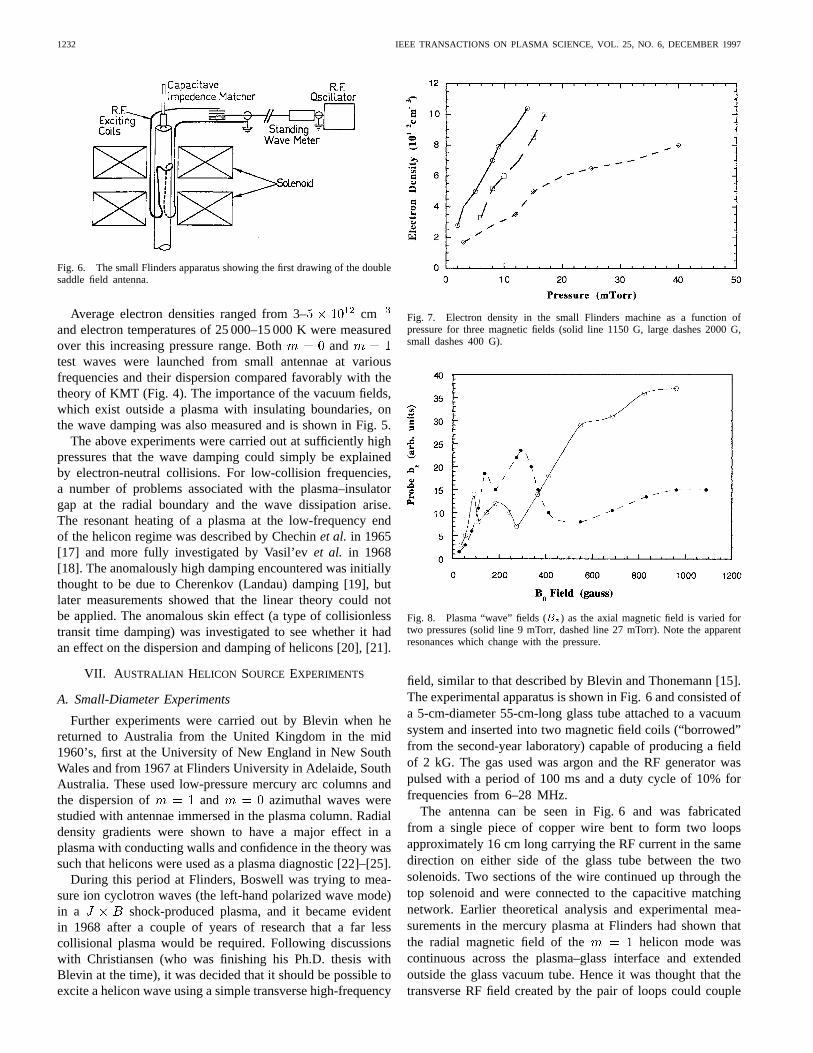
Fig. 3. Schematic diagram of the L & T experiment. Note the plasma is created by the distributed antenna of nine sets of double loops and the waves arelaunched by a separate exciter loop powered by a tuned circuit at high voltage discharging through a spark gap. (Reprinted from [16].)
Fig. 4. Dispersion ofm = 0 andm = 1 test waves compared to the theoryof KMT and the infinite plane-wave dispersion. (Reprinted from [16].)
considerable amount of further work has been done in solid-state physics on these helicon resonances which is not directlyrelevant to helicon sources, so our subsequent discussion willbe limited to gaseous plasmas.
VI. HELICONS IN GASEOUS PLASMAS
The first observation of this wave mode in gaseous plasmas[14] was carried out in ZETA, a large toroidal experimentfor fusion research, where the guiding of the wave alongthe magnetic field lines was reported in 1960. The toroidalgeometry and the transmitting and receiving antennae areshown in Fig. 2. Shortly after, Blevin and Thonemann [15]used a rotating magnetic field to transfer energy to the elec-trons, which rotated producing an azimuthal current. Theaxial magnetic field produced by this current was oppositein direction to the applied magnetic field and acted as aplasma-confining mechanism (minimum B). A high-frequencyoscillation seen on magnetic probe signals was thought to bea standing helicon wave produced by the applied oscillating
Fig. 5. Variation of the wave damping as the collision parameter(� = !ce=� where� is the collision frequency) is varied for a constantwavelength (akr = 0:68). Theoretical curve A was obtained by includingthe vacuum fields outside the glass vacuum vessel and curve B by neglectingthe vacuum fields. These results clearly show the importance of choosing thecorrect boundary conditions. (Reprinted from [16].)
fields. The first experiment aimed specifically at studyinghelicon-wave propagation using low-amplitude test waves wasconducted by Lehane and Thonemann [16] in a cylindricalRF-maintained plasma. A diagram of their apparatus is givenin Fig. 3, and it consists of a glass tube 10-cm diameterand 100-cm long, axial G, a pressure of xenongas from 10–70 mTorr, and a 3 kW RF generator operatingat about 15 MHz. The plasma was excited by an antennastructure containing nine two-turn coils wound around theglass cylinder and equally spaced along it. Although they usedthe RF generator simply to create the plasma, the antennastructure was periodic and may well have launched heliconwaves as well.
1232 IEEE TRANSACTIONS ON PLASMA SCIENCE, VOL. 25, NO. 6, DECEMBER 1997
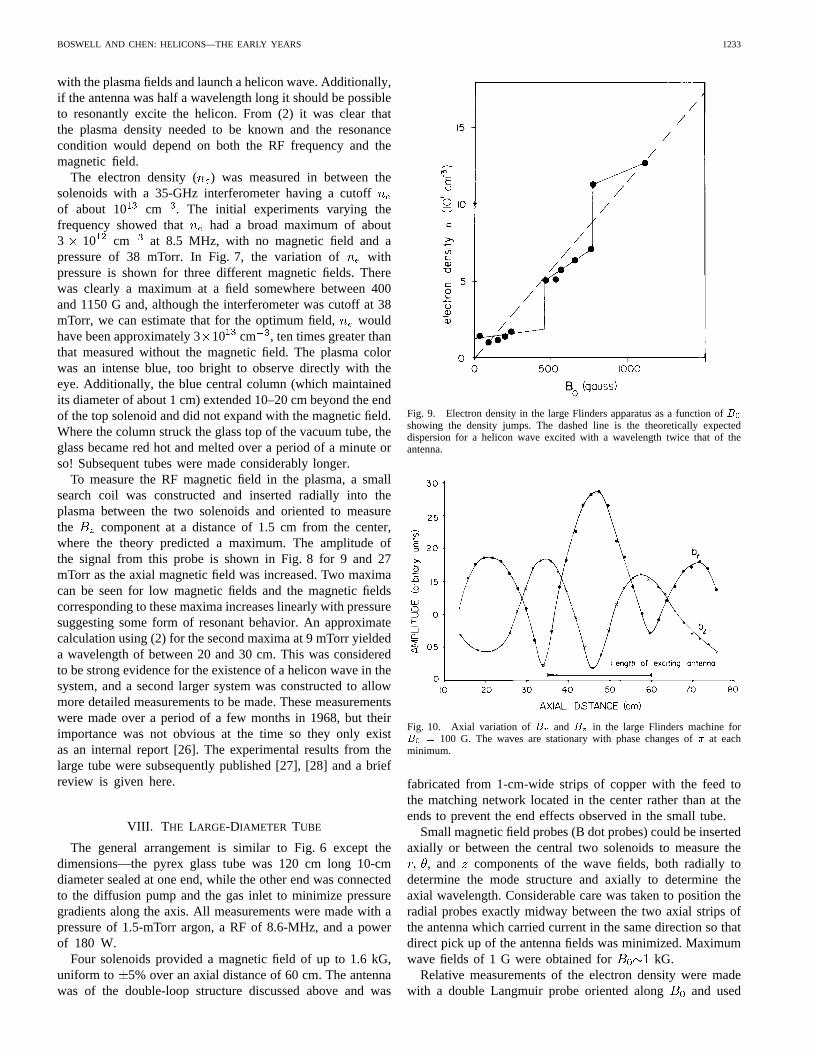
Fig. 6. The small Flinders apparatus showing the first drawing of the doublesaddle field antenna.
Average electron densities ranged from 3– cmand electron temperatures of 25 000–15 000 K were measuredover this increasing pressure range. Both andtest waves were launched from small antennae at variousfrequencies and their dispersion compared favorably with thetheory of KMT (Fig. 4). The importance of the vacuum fields,which exist outside a plasma with insulating boundaries, onthe wave damping was also measured and is shown in Fig. 5.
The above experiments were carried out at sufficiently highpressures that the wave damping could simply be explainedby electron-neutral collisions. For low-collision frequencies,a number of problems associated with the plasma–insulatorgap at the radial boundary and the wave dissipation arise.The resonant heating of a plasma at the low-frequency endof the helicon regime was described by Chechinet al. in 1965[17] and more fully investigated by Vasil’evet al. in 1968[18]. The anomalously high damping encountered was initiallythought to be due to Cherenkov (Landau) damping [19], butlater measurements showed that the linear theory could notbe applied. The anomalous skin effect (a type of collisionlesstransit time damping) was investigated to see whether it hadan effect on the dispersion and damping of helicons [20], [21].
VII. A USTRALIAN HELICON SOURCE EXPERIMENTS
A. Small-Diameter Experiments
Further experiments were carried out by Blevin when hereturned to Australia from the United Kingdom in the mid1960’s, first at the University of New England in New SouthWales and from 1967 at Flinders University in Adelaide, SouthAustralia. These used low-pressure mercury arc columns andthe dispersion of and azimuthal waves werestudied with antennae immersed in the plasma column. Radialdensity gradients were shown to have a major effect in aplasma with conducting walls and confidence in the theory wassuch that helicons were used as a plasma diagnostic [22]–[25].
During this period at Flinders, Boswell was trying to mea-sure ion cyclotron waves (the left-hand polarized wave mode)in a shock-produced plasma, and it became evidentin 1968 after a couple of years of research that a far lesscollisional plasma would be required. Following discussionswith Christiansen (who was finishing his Ph.D. thesis withBlevin at the time), it was decided that it should be possible toexcite a helicon wave using a simple transverse high-frequency
Fig. 7. Electron density in the small Flinders machine as a function ofpressure for three magnetic fields (solid line 1150 G, large dashes 2000 G,small dashes 400 G).
Fig. 8. Plasma “wave” fields (Bz ) as the axial magnetic field is varied fortwo pressures (solid line 9 mTorr, dashed line 27 mTorr). Note the apparentresonances which change with the pressure.
field, similar to that described by Blevin and Thonemann [15].The experimental apparatus is shown in Fig. 6 and consisted ofa 5-cm-diameter 55-cm-long glass tube attached to a vacuumsystem and inserted into two magnetic field coils (“borrowed”from the second-year laboratory) capable of producing a fieldof 2 kG. The gas used was argon and the RF generator waspulsed with a period of 100 ms and a duty cycle of 10% forfrequencies from 6–28 MHz.
The antenna can be seen in Fig. 6 and was fabricatedfrom a single piece of copper wire bent to form two loopsapproximately 16 cm long carrying the RF current in the samedirection on either side of the glass tube between the twosolenoids. Two sections of the wire continued up through thetop solenoid and were connected to the capacitive matchingnetwork. Earlier theoretical analysis and experimental mea-surements in the mercury plasma at Flinders had shown thatthe radial magnetic field of the helicon mode wascontinuous across the plasma–glass interface and extendedoutside the glass vacuum tube. Hence it was thought that thetransverse RF field created by the pair of loops could couple
BOSWELL AND CHEN: HELICONS—THE EARLY YEARS 1233
with the plasma fields and launch a helicon wave. Additionally,if the antenna was half a wavelength long it should be possibleto resonantly excite the helicon. From (2) it was clear thatthe plasma density needed to be known and the resonancecondition would depend on both the RF frequency and themagnetic field.
The electron density ( ) was measured in between thesolenoids with a 35-GHz interferometer having a cutoffof about 10 cm . The initial experiments varying thefrequency showed that had a broad maximum of about3 10 cm at 8.5 MHz, with no magnetic field and apressure of 38 mTorr. In Fig. 7, the variation of withpressure is shown for three different magnetic fields. Therewas clearly a maximum at a field somewhere between 400and 1150 G and, although the interferometer was cutoff at 38mTorr, we can estimate that for the optimum field, wouldhave been approximately 310 cm , ten times greater thanthat measured without the magnetic field. The plasma colorwas an intense blue, too bright to observe directly with theeye. Additionally, the blue central column (which maintainedits diameter of about 1 cm) extended 10–20 cm beyond the endof the top solenoid and did not expand with the magnetic field.Where the column struck the glass top of the vacuum tube, theglass became red hot and melted over a period of a minute orso! Subsequent tubes were made considerably longer.
To measure the RF magnetic field in the plasma, a smallsearch coil was constructed and inserted radially into theplasma between the two solenoids and oriented to measurethe component at a distance of 1.5 cm from the center,where the theory predicted a maximum. The amplitude ofthe signal from this probe is shown in Fig. 8 for 9 and 27mTorr as the axial magnetic field was increased. Two maximacan be seen for low magnetic fields and the magnetic fieldscorresponding to these maxima increases linearly with pressuresuggesting some form of resonant behavior. An approximatecalculation using (2) for the second maxima at 9 mTorr yieldeda wavelength of between 20 and 30 cm. This was consideredto be strong evidence for the existence of a helicon wave in thesystem, and a second larger system was constructed to allowmore detailed measurements to be made. These measurementswere made over a period of a few months in 1968, but theirimportance was not obvious at the time so they only existas an internal report [26]. The experimental results from thelarge tube were subsequently published [27], [28] and a briefreview is given here.
VIII. T HE LARGE-DIAMETER TUBE
The general arrangement is similar to Fig. 6 except thedimensions—the pyrex glass tube was 120 cm long 10-cmdiameter sealed at one end, while the other end was connectedto the diffusion pump and the gas inlet to minimize pressuregradients along the axis. All measurements were made with apressure of 1.5-mTorr argon, a RF of 8.6-MHz, and a powerof 180 W.
Four solenoids provided a magnetic field of up to 1.6 kG,uniform to 5% over an axial distance of 60 cm. The antennawas of the double-loop structure discussed above and was
Fig. 9. Electron density in the large Flinders apparatus as a function ofB0
showing the density jumps. The dashed line is the theoretically expecteddispersion for a helicon wave excited with a wavelength twice that of theantenna.
Fig. 10. Axial variation ofBr andBz in the large Flinders machine forB0 = 100 G. The waves are stationary with phase changes of� at eachminimum.
fabricated from 1-cm-wide strips of copper with the feed tothe matching network located in the center rather than at theends to prevent the end effects observed in the small tube.
Small magnetic field probes (B dot probes) could be insertedaxially or between the central two solenoids to measure the
, and components of the wave fields, both radially todetermine the mode structure and axially to determine theaxial wavelength. Considerable care was taken to position theradial probes exactly midway between the two axial strips ofthe antenna which carried current in the same direction so thatdirect pick up of the antenna fields was minimized. Maximumwave fields of 1 G were obtained for kG.
Relative measurements of the electron density were madewith a double Langmuir probe oriented along and used

1234 IEEE TRANSACTIONS ON PLASMA SCIENCE, VOL. 25, NO. 6, DECEMBER 1997
with the line densities across a diameter made with the 35-GHz interferometer to obtain absolute radial density profiles.The density increase with is given in Fig. 9. The jumps, ob-servable at 450 and 750 G, were only obtained by dramaticallychanging the match-box tuning; if this were kept constant fora good standing wave ratio (SWR) in the generator/match-box coax at G and then the increased, thedensity would remain reasonably constant but the SWR wouldincrease to values well over three. The dashed line in Fig. 9is the theoretical result for plane-wave propagation (2) whichreduces to
cm (3)
for an imposed wavelength of 50 cm, i.e., twice the antennalength. The axial variations of the wave and are shownin Fig. 10 for G where it can be seen that thecomponent fits well with the imposed transverse field createdby the antenna. Phase measurements along the axis showedthe wave to be a standing wave under the antenna and radialmeasurements defined the wave to be an mode. Cautionmust be used with fitting the axial wavelength measurementsas these were made under the antenna and showed variationsof up to 50% outside this region. Basically, the system is aforced resonator with its major defining parameter beingnonlinearly dependent on the input parameters.
The increase in density with was associated with anarrowing of the plasma column, from a full width halfmaximum of 5 cm at 37 G to 2 cm at 1130 G. Althoughthe decrease in the cross-field diffusion could account for anincrease in the peak density of a factor of about six (with theaverage density remaining the same), it is the average densitywhich increases by a factor of about ten implying that thehelicon wave is profoundly involved in the ionization of theplasma.
A numerical method for solving (A14) in cylindrical coordi-nates (developed by Davies, which allowed for radial densitygradients [52]) was modified to include the effects of rigidnonconducting boundaries and standing rather than propagat-ing waves. It was found that an effective resistivity, about 1000times that given by simple collisions, was necessary to fit theradial wave field profiles. Using the theoretical value producedsolutions with large fields constrained to a narrow layer atthe surface of the plasma which propagated into the plasmaa distance of about the collisionless skin depth. Theoreticalresearch by a number of groups in the 1990’s appears tosuggest that these large fields may be associated with TGmodes (see the Appendix).
The very high value of the effective resistivity was a puzzle,and considerable time was spent searching the literature forpossible collisionless mechanisms. Using a theory developedby Shafranov [29] and Dolgopolov [30] for Cherenkov damp-ing (as the presently known Landau damping was apparentlyknown in the USSR at the time) in a cylindrical plasma it wasshown that, for the conditions of this experiment, Cherenkovdamping was ten times greater than collisional damping but,unfortunately, still 100 times smaller than that required toexplain the experimental results. “Plus ¸ca change, plus c’est lameme chose.” Although this discussion constituted a chapter
of Boswell’s thesis, it was clear that under these experi-mental conditions, the simple linear derivations of Landauor Cherenkov damping were not adequate in explaining theexperimental results.
IX. THE DEVELOPMENT OF SIMILAR SYSTEMS
Experiments on electron cyclotron wave resonances werebeing conducted in the late 1960’s in West Germany byOechsner [31]–[33] in a glass cylinder 9 cm in length anddiameter. In this case, however, the magnetic field of up to50 G was perpendicular to the tube axis and the antenna wasa single loop surrounding the cylinder. Resonances similar tothose of Fig. 7 were observed for RF of 27 MHz and 2 kWand interpreted as being cavity resonances ( , etc.) ofwaves with . The electron density was enhancedduring the resonances and a theory was developed linkingelectron heating in the high electric fields of the resonanceto the increased ionization.
It is not possible to proceed further without mention ofthe “Lisitano” coil [34] which is a slotted slow-wave antennaoperating in the gigahertz range of frequencies. Although itis commonly thought of as an electron cyclotron resonance(ECR) source, it was able to produce long columns of highlyionized plasma when operating with , i.e., at themaximum phase velocity of the whistler wave. Modern ECRsources operate under similar conditions.
We will now make a distinction between antennae whichwere designed to launch waves in the helicon region and theexperiments above which were specifically designed to lookat the ionization of a background gas by helicon waves.
The bibliography of the former is immense and concernswave launching experiments on fusion devices for particleheating rather than ionization, in particular, the heating ofions. The antenna structure normally follows the design de-veloped by Stix [45] for launching ion cyclotron waves andcompressional Alfven waves (which are low-frequency heliconwaves). This antenna consisted of current loops wound outsidethe insulating vacuum tube with their axis parallel to the tubeaxis. These were spaced in groups along the tube, separated by1/2 wavelength of the desired wave with their current directionreversed for every other group. The idea was to resonantlylaunch -mode waves. The simplest form of the antennais called a consisting of two single-turn loopswith opposed currents separated by 1/2 wavelength.
Another type commonly used was the helical antenna [34]which could be used to launch either ormodes depending on the symmetry and the direction of themagnetic field. This form of antenna was also used at theUniversity of Sussex in the early 1970’s to create a heliconplasma quite successfully, its main disadvantage is that themulti-turn spiral has quite a high and consequently onlyone optimum operating condition. Finding it can frustrate themost patient student.
Many experiments were carried out in the 1970’s on lowerhybrid heating, fast wave heating and current generation, anda variety of low-frequency Alfven wave heating schemes. Ofinterest to this review is a paper published by a large number
BOSWELL AND CHEN: HELICONS—THE EARLY YEARS 1235
of researchers in the Nagoya group [36] on “Radio-frequencyplugging of a high-density plasma” which showed for the firsttime the Nagoya type III antenna. The type I was the simplehelix and the type II was a form of double half turn withthe current up one side and down the other (apparently). Inessence, the type III is a simplification of the double-loop (ordouble-saddle field) antenna used earlier [37]; both producean oscillating RF field transverse to the axial magnetic fieldand both have an axial length appropriate to 1/2 wavelength ofthe required helicon wave. The first report on using this typeof antenna for plasma production was in 1986 by Shoji inthe Annual Review of the Nagoya Institute of Plasma Physics[38] and the first publication was sometime later [39]. This,however, is somewhat in the future of our present review andwe return to the early 1980’s.
X. HELICON EXPERIMENTS AT THE ANU
In 1980, the basic design of a 20-cm-diameter helicon sourceattached to a 100-cm-diameter diffusion chamber was definedand the completed apparatus Waves on Magnetized Beams andTurbulence (WOMBAT) commissioned in 1981. Its purposewas to simulate wave and electron beam interactions with theAuroral plasma. During its construction, a small system of 5-cm diameter with a magnetic field up to 4 kG was put togetherto repeat the early experiments on the small tube experimentat Flinders. This was carried out in collaboration with theUniversity of Orleans (France) which had a similar system.The diagnostics were mainly optical emission spectroscopy (asit was thought that it may be possible to create an argon ionlaser), and a 90-GHz interferometer which allowed averagedensities up to about 10 cm to be measured across adiameter. For input powers of 1 kW at 7 MHz to a center feddouble-loop antenna, average densities of 0.5–0.810 cmwere obtained for argon pressures of a few milliTorr [40].Radial intensity profiles of ArI were hollow while those of ArIIwere peaked strongly in the center with a FWHM of about 1cm, implying that the central plasma density was around tentimes the line average across a diameter. As the magnetic fieldwas increased, the ArII line had a minimum FWHM and amaximum intensity at about 1 kG. Further increasing the fieldresulted in a decrease in the ArII line and an increase in theArII line until at 3.5 kG it was estimated that the plasma wasnot only fully ionized, but also consisted of at least 50% Arions. The neutral temperature was about 0.5 eV and the iontemperature 1 eV. The discharge was shown to be in a simplecorona equilibrium and, as it was fully ionized, radiation lossesfrom the ArII and ArIII transitions to the ground state limitedthe electron temperature to 3 eV.
As happens quite often in the development of a newtechnology, the step into etching involved a change in researcharea of a close colleague. In this case it was a researcher,Daniel Henry, in French Telecom (CNET) who was transferredfrom the space physics department in Orleans (close to theuniversity) to a new center for microelectronics developmentin Grenoble. The ANU had, and still has, close collabora-tive links with French research groups in Orleans, Nantes,Grenoble, and Paris, and this allowed Henry to spend a month
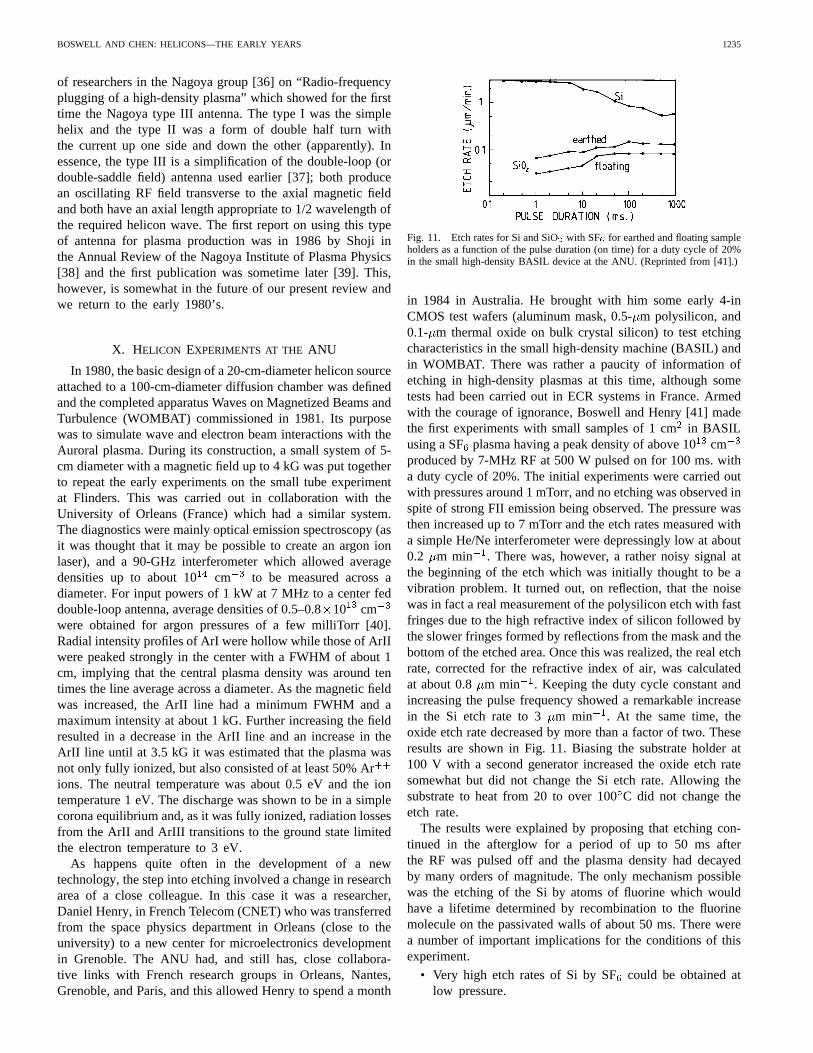
Fig. 11. Etch rates for Si and SiO2 with SF6 for earthed and floating sampleholders as a function of the pulse duration (on time) for a duty cycle of 20%in the small high-density BASIL device at the ANU. (Reprinted from [41].)
in 1984 in Australia. He brought with him some early 4-inCMOS test wafers (aluminum mask, 0.5-m polysilicon, and0.1- m thermal oxide on bulk crystal silicon) to test etchingcharacteristics in the small high-density machine (BASIL) andin WOMBAT. There was rather a paucity of information ofetching in high-density plasmas at this time, although sometests had been carried out in ECR systems in France. Armedwith the courage of ignorance, Boswell and Henry [41] madethe first experiments with small samples of 1 cmin BASILusing a SF plasma having a peak density of above 10cmproduced by 7-MHz RF at 500 W pulsed on for 100 ms. witha duty cycle of 20%. The initial experiments were carried outwith pressures around 1 mTorr, and no etching was observed inspite of strong FII emission being observed. The pressure wasthen increased up to 7 mTorr and the etch rates measured witha simple He/Ne interferometer were depressingly low at about0.2 m min . There was, however, a rather noisy signal atthe beginning of the etch which was initially thought to be avibration problem. It turned out, on reflection, that the noisewas in fact a real measurement of the polysilicon etch with fastfringes due to the high refractive index of silicon followed bythe slower fringes formed by reflections from the mask and thebottom of the etched area. Once this was realized, the real etchrate, corrected for the refractive index of air, was calculatedat about 0.8 m min . Keeping the duty cycle constant andincreasing the pulse frequency showed a remarkable increasein the Si etch rate to 3 m min . At the same time, theoxide etch rate decreased by more than a factor of two. Theseresults are shown in Fig. 11. Biasing the substrate holder at100 V with a second generator increased the oxide etch ratesomewhat but did not change the Si etch rate. Allowing thesubstrate to heat from 20 to over 100C did not change theetch rate.
The results were explained by proposing that etching con-tinued in the afterglow for a period of up to 50 ms afterthe RF was pulsed off and the plasma density had decayedby many orders of magnitude. The only mechanism possiblewas the etching of the Si by atoms of fluorine which wouldhave a lifetime determined by recombination to the fluorinemolecule on the passivated walls of about 50 ms. There werea number of important implications for the conditions of thisexperiment.
• Very high etch rates of Si by SFcould be obtained atlow pressure.
1236 IEEE TRANSACTIONS ON PLASMA SCIENCE, VOL. 25, NO. 6, DECEMBER 1997
• For pulse frequencies around 1 kHz, RF power at 20%duty cycle gave the same etch rate for Si as for continuouspower.
• The etch rate seemed to be limited by the thermal fluxof fluorine to the surface without any activation energybeing apparent.
• Etching continued in the afterglow at a rate determinedby the atomic fluorine density.
• The Si/SiO selectivity could be improved by increasingthe pulsing frequency.
Following these experiments, it was decided to patent theassociation of a helicon source with a diffusion chamber [42].At the time these experiments were being carried out, Chenspent a three-month sabbatical period with the plasma groupat the ANU and became fascinated with the high plasmadensities which could be generated with a helicon wave, and onreturning to UCLA started the first experiments in the UnitedStates. The period from 1984 to the present will be discussedin “Helicons, the Past Decade” (this issue, pp. 1245–1257), aswill details of the experimental results from WOMBAT andsubsequent plasma processing systems developed at the ANU.
APPENDIX
As the nomenclature of the many types of waves which canexist in a magnetized plasma is perhaps somewhat confusing,here we give a simple introduction to wave propagationusing the variation of the square of the refractive index withfrequency to delineate the different modes and their names.We will neglect thermal effects, which means that there is nopressure term and hence no ion or electron acoustic waves. Aresonance occurs when the wave phase velocity decreases tozero causing the refractive index to go to infinity, and a cutoffwhen the refractive index goes to zero. Negative values of thesquare of the refractive index mean that the phase velocity ispurely imaginary and there is no real value of the wavelength.The wave is then evanescent.
A. Propagation of Waves Parallel to the MagneticField in an Infinite Uniform Plasma
There are a variety of ways to investigate wave propagationin plasmas. We have chosen to follow Spitzer [43] Thehydromagnetic approximation of the “generalized Ohms Law”for a plasma can be written
(A1)
where
electron mass;charged-particle density;electronic charge;current density;electric field;magnetic induction;plasma velocity;electron partial pressure;plasma resistivity = ;electron-neutral collision time.
Assuming , and are the values ofand in the unperturbed plasma, and and areperturbations due to the wave, then to the first order, (A1)can be written for perturbing quantities, assuming no steadycurrents flow as
(A2)
The pressure gradient has been dropped in (A2) on theassumption of a cold plasma.
Using Cartesian coordinates with the steady applied mag-netic field in the -direction, the linearized equation of motionfor a plasma, Maxwell’s equations for perturbed quantities,and perturbations of the form
const
where and are the angular frequency and wave number ofthe wave, respectively. Some algebra yields
(A3)
where
for plane-wave propagation.Terms in (A3) can be identified with terms in the ini-
tial formulation [44] and may be ignored in the followingcircumstances.
1) corresponds to the displacement current term inMaxwell’s equation and can be ignored if the wavevelocity velocity of light.
2) corresponds to and is neglected if the elec-tron–cyclotron frequency , the collision fre-quency for electrons and neutrals.
3) corresponds to the and can be ignored ifion–cyclotron frequency .
4) corresponds to the electron inertial term and canbe ignored if a) and b) the plasma density ishigh.
Introducing the plasma frequencyand considering the case of zero resistivity, (A3) can berearranged as
(A4)
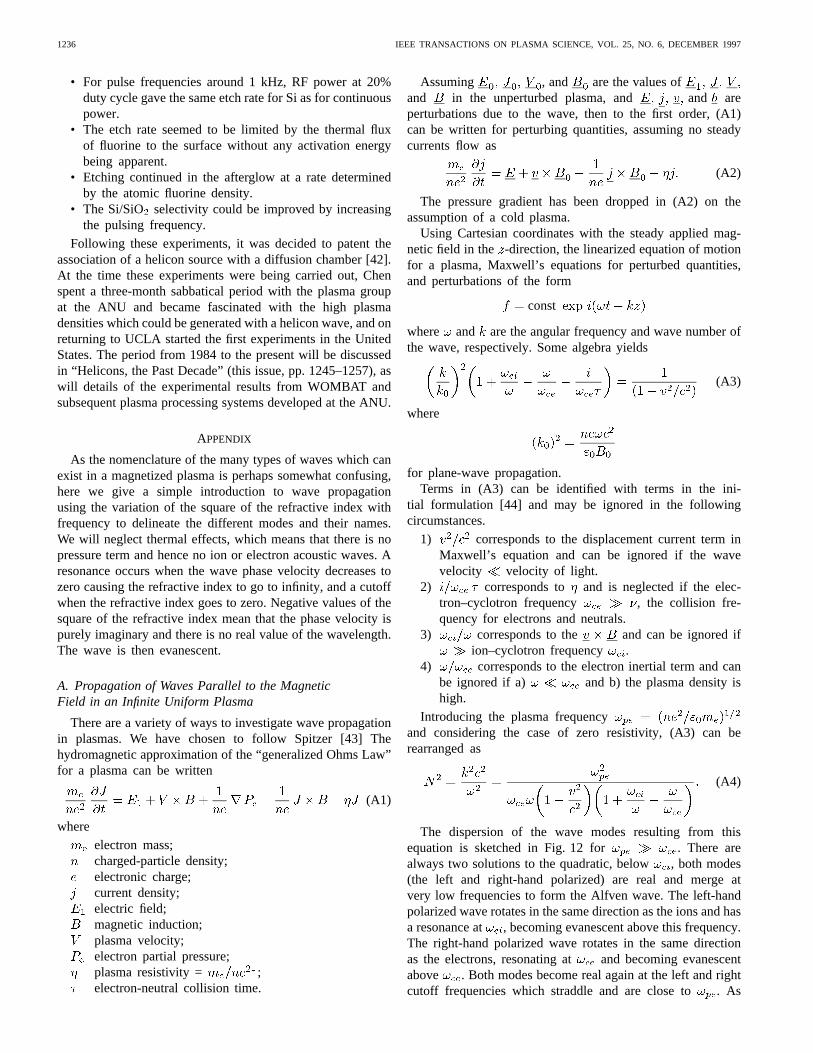
The dispersion of the wave modes resulting from thisequation is sketched in Fig. 12 for . There arealways two solutions to the quadratic, below , both modes(the left and right-hand polarized) are real and merge atvery low frequencies to form the Alfven wave. The left-handpolarized wave rotates in the same direction as the ions and hasa resonance at , becoming evanescent above this frequency.The right-hand polarized wave rotates in the same directionas the electrons, resonating at and becoming evanescentabove . Both modes become real again at the left and rightcutoff frequencies which straddle and are close to. As
BOSWELL AND CHEN: HELICONS—THE EARLY YEARS 1237
Fig. 12. Sketch of the dispersion of the LHP and RHP waves propagatingparallel to the magnetic field for!pe � !ce.
the frequency further increases, they asymptotically approachthe speed of light from above. The small difference in thedispersion gives rise to the Faraday effect, a useful diagnosticin plasmas. In further discussion, we will only consider realwaves with velocities much less than the velocity of light.
B. The Right-Hand Polarized Wave Below theElectron-Cyclotron Resonance
The three regions of different approximation to the OhmsLaw, depending on the relative magnitude of the frequencies
and , are set out below for and .1) Compressional Alfven Waves:In this regime, the elec-
tron inertia is neglected and the term is dropped out of(A4). The equation describing the dispersion of these waves is
(A5)
when
and the phase velocity of the wave becomes
the Alfven velocity. The compressional wave can be seen toarise from a combination of the and in terms ofthe Ohms Law equation which reduces, in this case, to
These waves are labeled (1) in Fig. 13. The low-frequencyAlfven wave comes from the simplest form of Ohms Law
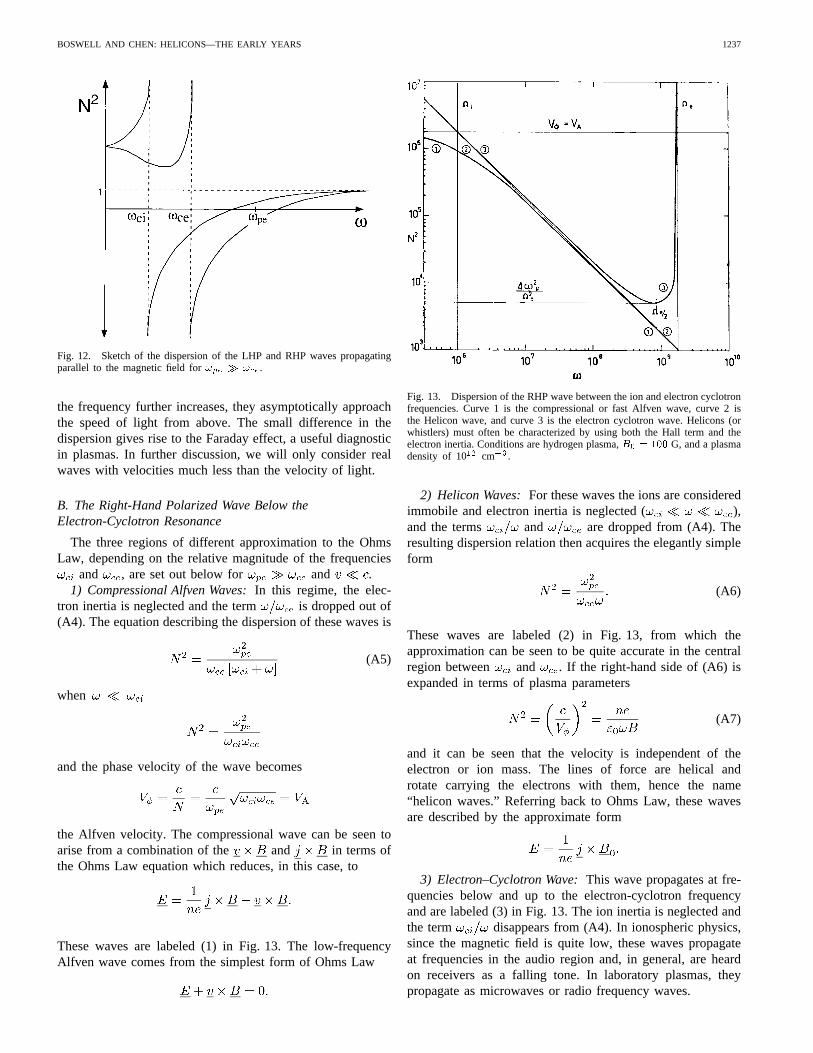
Fig. 13. Dispersion of the RHP wave between the ion and electron cyclotronfrequencies. Curve 1 is the compressional or fast Alfven wave, curve 2 isthe Helicon wave, and curve 3 is the electron cyclotron wave. Helicons (orwhistlers) must often be characterized by using both the Hall term and theelectron inertia. Conditions are hydrogen plasma,B0 = 100 G, and a plasmadensity of 1012 cm�3.
2) Helicon Waves:For these waves the ions are consideredimmobile and electron inertia is neglected ( ),and the terms and are dropped from (A4). Theresulting dispersion relation then acquires the elegantly simpleform
(A6)
These waves are labeled (2) in Fig. 13, from which theapproximation can be seen to be quite accurate in the centralregion between and . If the right-hand side of (A6) isexpanded in terms of plasma parameters
(A7)
and it can be seen that the velocity is independent of theelectron or ion mass. The lines of force are helical androtate carrying the electrons with them, hence the name“helicon waves.” Referring back to Ohms Law, these wavesare described by the approximate form
3) Electron–Cyclotron Wave:This wave propagates at fre-quencies below and up to the electron-cyclotron frequencyand are labeled (3) in Fig. 13. The ion inertia is neglected andthe term disappears from (A4). In ionospheric physics,since the magnetic field is quite low, these waves propagateat frequencies in the audio region and, in general, are heardon receivers as a falling tone. In laboratory plasmas, theypropagate as microwaves or radio frequency waves.
1238 IEEE TRANSACTIONS ON PLASMA SCIENCE, VOL. 25, NO. 6, DECEMBER 1997
(a) (b) (c)
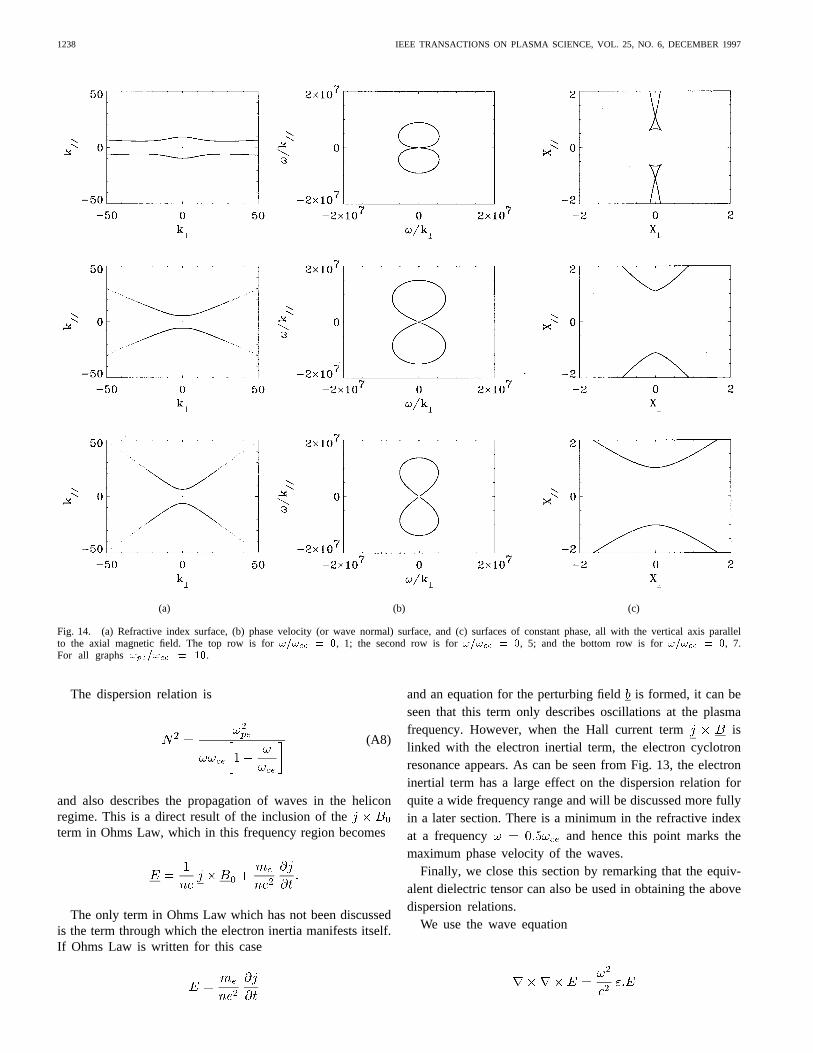
Fig. 14. (a) Refractive index surface, (b) phase velocity (or wave normal) surface, and (c) surfaces of constant phase, all with the vertical axis parallelto the axial magnetic field. The top row is for!=!ce = 0, 1; the second row is for!=!ce = 0, 5; and the bottom row is for!=!ce = 0, 7.For all graphs!pe=!ce = 10.
The dispersion relation is
(A8)
and also describes the propagation of waves in the heliconregime. This is a direct result of the inclusion of theterm in Ohms Law, which in this frequency region becomes
The only term in Ohms Law which has not been discussedis the term through which the electron inertia manifests itself.If Ohms Law is written for this case
and an equation for the perturbing fieldis formed, it can beseen that this term only describes oscillations at the plasmafrequency. However, when the Hall current term islinked with the electron inertial term, the electron cyclotronresonance appears. As can be seen from Fig. 13, the electroninertial term has a large effect on the dispersion relation forquite a wide frequency range and will be discussed more fullyin a later section. There is a minimum in the refractive indexat a frequency and hence this point marks themaximum phase velocity of the waves.
Finally, we close this section by remarking that the equiv-alent dielectric tensor can also be used in obtaining the abovedispersion relations.
We use the wave equation
BOSWELL AND CHEN: HELICONS—THE EARLY YEARS 1239
where the equivalent dielectric tensoris given by
(A9)
This approach is equivalent to solving (A1).
C. Off-Axis Propagation
The full solution for propagation at any angle to themagnetic field shows that the refractive index is severelyanisotropic, as can be seen from the simplified Apple-ton–Hartree relation
(A10)
This has to be taken into account in following a waveas it propagates through an anisotropic plasma, as the phasevelocity and group velocity vectors can change in both mag-nitude and direction. Ray tracing is commonly used in spaceplasma physics and wave propagation in large toroidal plasmasused for fusion research. Since typical helicon sources arecylindrical and the wave is constrained by density gradientsand the physical boundaries of the vacuum system, it isimportant to understand the basic physics of wave propagationin an anisotropic medium.
Although the general principles are given in a number oftexts, we have chosen Stix [45, ch. 3, and references therein]as the basis for the following review.
Group velocity has always been a difficult concept involvingforerunners at the velocity of light and a slower velocityassociated with modulation or interference. One tends tothink of varying frequencies in these cases; however, in thatwhich follows, we consider a point antenna emitting a fixedfrequency, and a wave number () which varies with theanisotropy of the refractive index using the definition of groupvelocity .
It was only in the early 1950’s that contemporaries of Storey[5] showed that in a medium such as the anisotropic plasmaconsidered here, the group velocity vector had a magnitude anddirection equal to the Pointing vector, i.e., the energy of thewave moved with the group velocity along the ray direction.
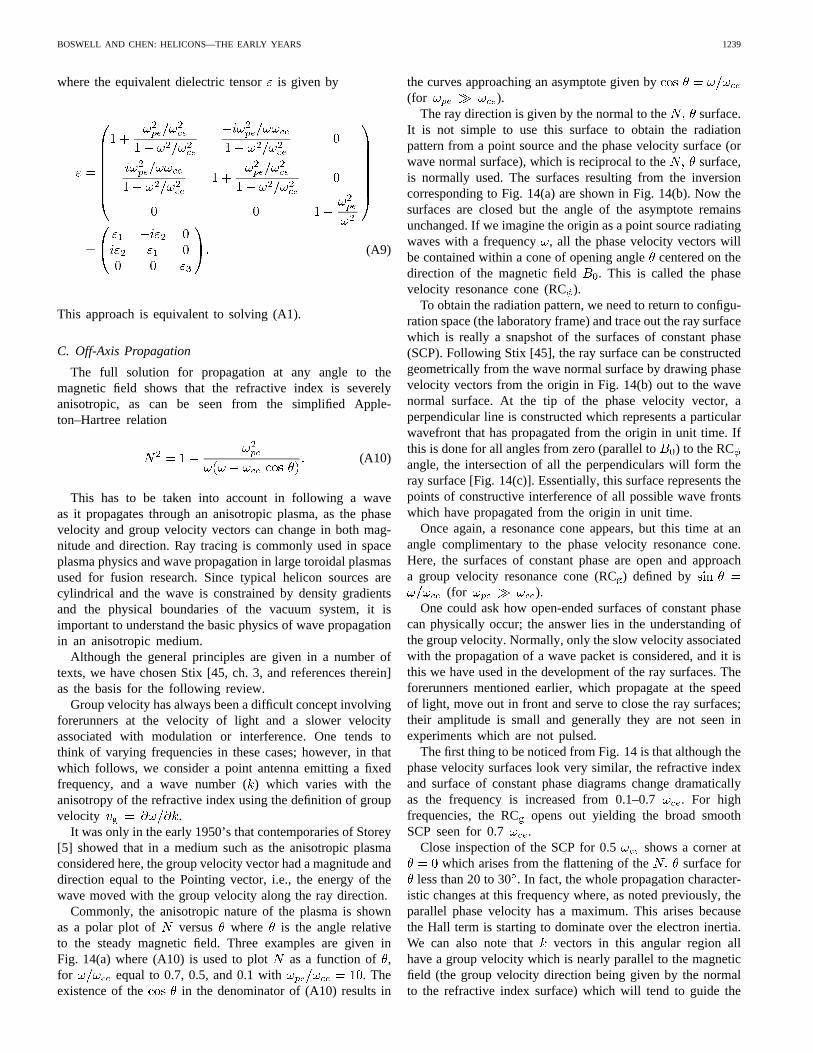
Commonly, the anisotropic nature of the plasma is shownas a polar plot of versus where is the angle relativeto the steady magnetic field. Three examples are given inFig. 14(a) where (A10) is used to plot as a function of ,for equal to 0.7, 0.5, and 0.1 with . Theexistence of the in the denominator of (A10) results in
the curves approaching an asymptote given by(for ).
The ray direction is given by the normal to the surface.It is not simple to use this surface to obtain the radiationpattern from a point source and the phase velocity surface (orwave normal surface), which is reciprocal to the surface,is normally used. The surfaces resulting from the inversioncorresponding to Fig. 14(a) are shown in Fig. 14(b). Now thesurfaces are closed but the angle of the asymptote remainsunchanged. If we imagine the origin as a point source radiatingwaves with a frequency , all the phase velocity vectors willbe contained within a cone of opening anglecentered on thedirection of the magnetic field . This is called the phasevelocity resonance cone (RC).
To obtain the radiation pattern, we need to return to configu-ration space (the laboratory frame) and trace out the ray surfacewhich is really a snapshot of the surfaces of constant phase(SCP). Following Stix [45], the ray surface can be constructedgeometrically from the wave normal surface by drawing phasevelocity vectors from the origin in Fig. 14(b) out to the wavenormal surface. At the tip of the phase velocity vector, aperpendicular line is constructed which represents a particularwavefront that has propagated from the origin in unit time. Ifthis is done for all angles from zero (parallel to) to the RCangle, the intersection of all the perpendiculars will form theray surface [Fig. 14(c)]. Essentially, this surface represents thepoints of constructive interference of all possible wave frontswhich have propagated from the origin in unit time.
Once again, a resonance cone appears, but this time at anangle complimentary to the phase velocity resonance cone.Here, the surfaces of constant phase are open and approacha group velocity resonance cone (RC) defined by
(for ).One could ask how open-ended surfaces of constant phase
can physically occur; the answer lies in the understanding ofthe group velocity. Normally, only the slow velocity associatedwith the propagation of a wave packet is considered, and it isthis we have used in the development of the ray surfaces. Theforerunners mentioned earlier, which propagate at the speedof light, move out in front and serve to close the ray surfaces;their amplitude is small and generally they are not seen inexperiments which are not pulsed.
The first thing to be noticed from Fig. 14 is that although thephase velocity surfaces look very similar, the refractive indexand surface of constant phase diagrams change dramaticallyas the frequency is increased from 0.1–0.7 . For highfrequencies, the RCopens out yielding the broad smoothSCP seen for 0.7 .
Close inspection of the SCP for 0.5 shows a corner atwhich arises from the flattening of the surface for
less than 20 to 30. In fact, the whole propagation character-istic changes at this frequency where, as noted previously, theparallel phase velocity has a maximum. This arises becausethe Hall term is starting to dominate over the electron inertia.We can also note that vectors in this angular region allhave a group velocity which is nearly parallel to the magneticfield (the group velocity direction being given by the normalto the refractive index surface) which will tend to guide the
1240 IEEE TRANSACTIONS ON PLASMA SCIENCE, VOL. 25, NO. 6, DECEMBER 1997
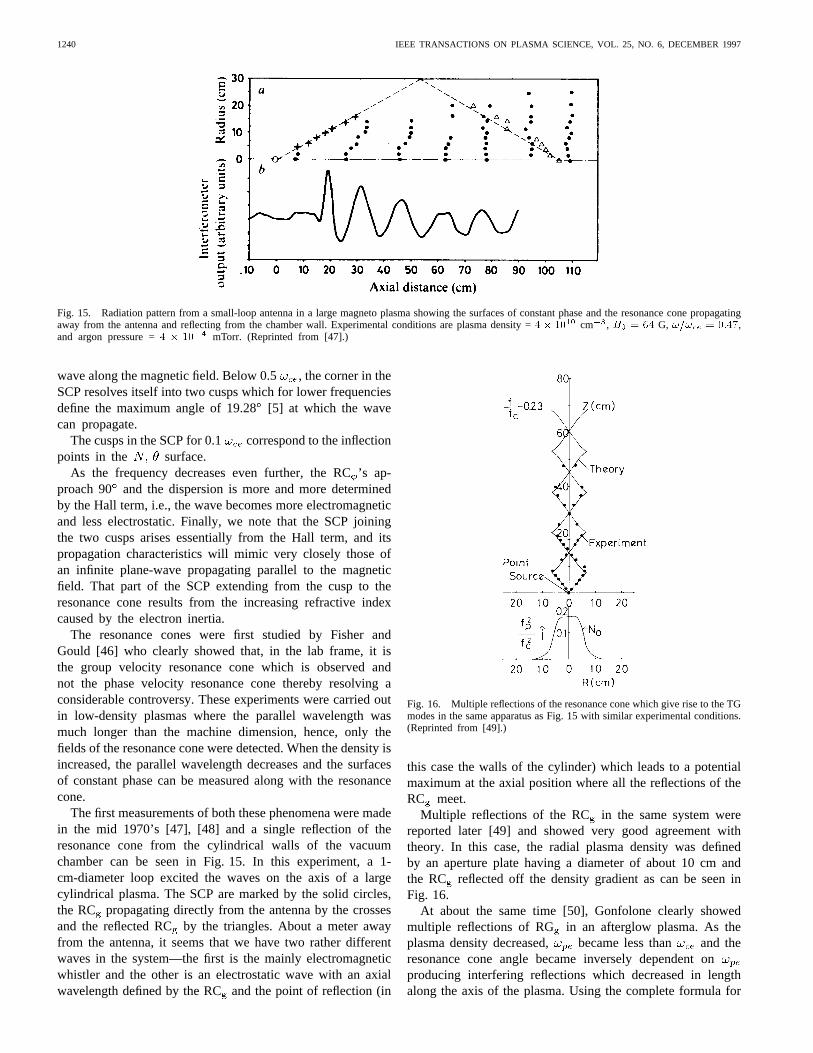
Fig. 15. Radiation pattern from a small-loop antenna in a large magneto plasma showing the surfaces of constant phase and the resonance cone propagatingaway from the antenna and reflecting from the chamber wall. Experimental conditions are plasma density =4� 10
10 cm�3, B0 = 64 G, !=!ce = 0:47,and argon pressure =4 � 10
�4 mTorr. (Reprinted from [47].)
wave along the magnetic field. Below 0.5 , the corner in theSCP resolves itself into two cusps which for lower frequenciesdefine the maximum angle of 19.28[5] at which the wavecan propagate.
The cusps in the SCP for 0.1 correspond to the inflectionpoints in the surface.
As the frequency decreases even further, the RC’s ap-proach 90 and the dispersion is more and more determinedby the Hall term, i.e., the wave becomes more electromagneticand less electrostatic. Finally, we note that the SCP joiningthe two cusps arises essentially from the Hall term, and itspropagation characteristics will mimic very closely those ofan infinite plane-wave propagating parallel to the magneticfield. That part of the SCP extending from the cusp to theresonance cone results from the increasing refractive indexcaused by the electron inertia.
The resonance cones were first studied by Fisher andGould [46] who clearly showed that, in the lab frame, it isthe group velocity resonance cone which is observed andnot the phase velocity resonance cone thereby resolving aconsiderable controversy. These experiments were carried outin low-density plasmas where the parallel wavelength wasmuch longer than the machine dimension, hence, only thefields of the resonance cone were detected. When the density isincreased, the parallel wavelength decreases and the surfacesof constant phase can be measured along with the resonancecone.
The first measurements of both these phenomena were madein the mid 1970’s [47], [48] and a single reflection of theresonance cone from the cylindrical walls of the vacuumchamber can be seen in Fig. 15. In this experiment, a 1-cm-diameter loop excited the waves on the axis of a largecylindrical plasma. The SCP are marked by the solid circles,the RC propagating directly from the antenna by the crossesand the reflected RCby the triangles. About a meter awayfrom the antenna, it seems that we have two rather differentwaves in the system—the first is the mainly electromagneticwhistler and the other is an electrostatic wave with an axialwavelength defined by the RCand the point of reflection (in
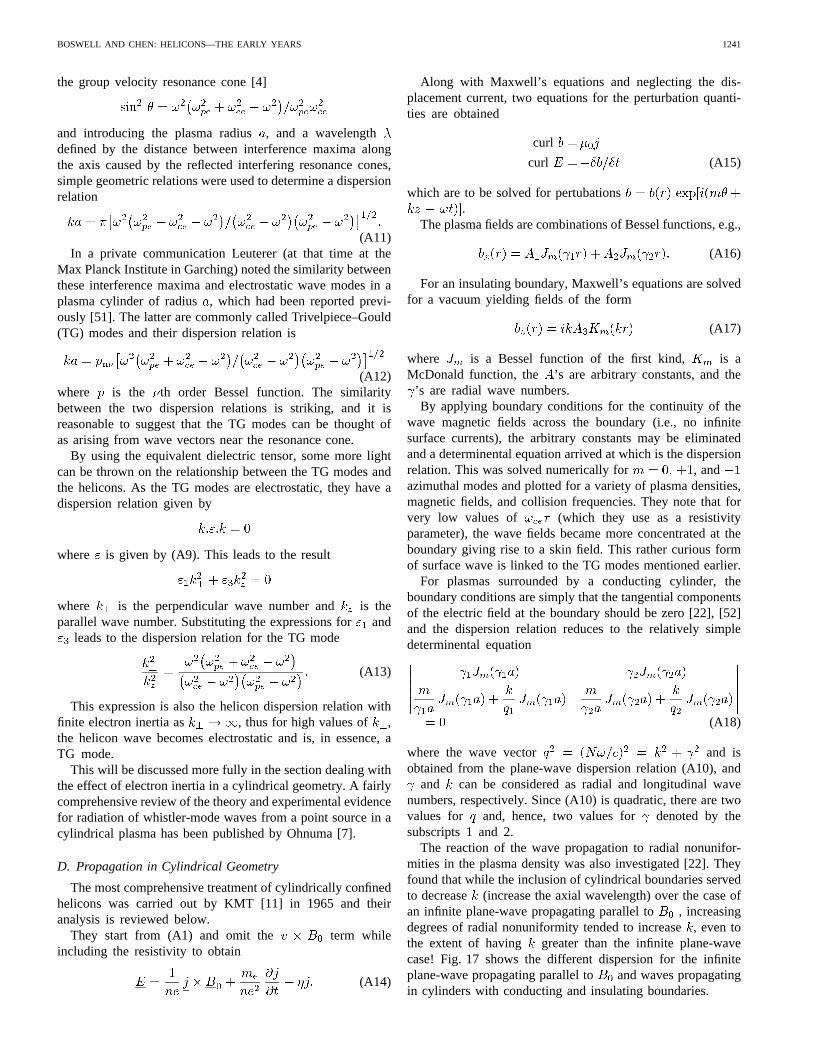
Fig. 16. Multiple reflections of the resonance cone which give rise to the TGmodes in the same apparatus as Fig. 15 with similar experimental conditions.(Reprinted from [49].)
this case the walls of the cylinder) which leads to a potentialmaximum at the axial position where all the reflections of theRC meet.
Multiple reflections of the RC in the same system werereported later [49] and showed very good agreement withtheory. In this case, the radial plasma density was definedby an aperture plate having a diameter of about 10 cm andthe RC reflected off the density gradient as can be seen inFig. 16.
At about the same time [50], Gonfolone clearly showedmultiple reflections of RG in an afterglow plasma. As theplasma density decreased, became less than and theresonance cone angle became inversely dependent onproducing interfering reflections which decreased in lengthalong the axis of the plasma. Using the complete formula for
BOSWELL AND CHEN: HELICONS—THE EARLY YEARS 1241
the group velocity resonance cone [4]
and introducing the plasma radius, and a wavelengthdefined by the distance between interference maxima alongthe axis caused by the reflected interfering resonance cones,simple geometric relations were used to determine a dispersionrelation
(A11)In a private communication Leuterer (at that time at the
Max Planck Institute in Garching) noted the similarity betweenthese interference maxima and electrostatic wave modes in aplasma cylinder of radius, which had been reported previ-ously [51]. The latter are commonly called Trivelpiece–Gould(TG) modes and their dispersion relation is
(A12)where is the th order Bessel function. The similaritybetween the two dispersion relations is striking, and it isreasonable to suggest that the TG modes can be thought ofas arising from wave vectors near the resonance cone.
By using the equivalent dielectric tensor, some more lightcan be thrown on the relationship between the TG modes andthe helicons. As the TG modes are electrostatic, they have adispersion relation given by
where is given by (A9). This leads to the result
where is the perpendicular wave number and is theparallel wave number. Substituting the expressions forand
leads to the dispersion relation for the TG mode
(A13)
This expression is also the helicon dispersion relation withfinite electron inertia as , thus for high values of ,the helicon wave becomes electrostatic and is, in essence, aTG mode.
This will be discussed more fully in the section dealing withthe effect of electron inertia in a cylindrical geometry. A fairlycomprehensive review of the theory and experimental evidencefor radiation of whistler-mode waves from a point source in acylindrical plasma has been published by Ohnuma [7].
D. Propagation in Cylindrical Geometry
The most comprehensive treatment of cylindrically confinedhelicons was carried out by KMT [11] in 1965 and theiranalysis is reviewed below.
They start from (A1) and omit the term whileincluding the resistivity to obtain
(A14)
Along with Maxwell’s equations and neglecting the dis-placement current, two equations for the perturbation quanti-ties are obtained
curl
curl (A15)
which are to be solved for pertubations.
The plasma fields are combinations of Bessel functions, e.g.,
(A16)
For an insulating boundary, Maxwell’s equations are solvedfor a vacuum yielding fields of the form
(A17)
where is a Bessel function of the first kind, is aMcDonald function, the ’s are arbitrary constants, and the
’s are radial wave numbers.By applying boundary conditions for the continuity of the
wave magnetic fields across the boundary (i.e., no infinitesurface currents), the arbitrary constants may be eliminatedand a determinental equation arrived at which is the dispersionrelation. This was solved numerically for , andazimuthal modes and plotted for a variety of plasma densities,magnetic fields, and collision frequencies. They note that forvery low values of (which they use as a resistivityparameter), the wave fields became more concentrated at theboundary giving rise to a skin field. This rather curious formof surface wave is linked to the TG modes mentioned earlier.
For plasmas surrounded by a conducting cylinder, theboundary conditions are simply that the tangential componentsof the electric field at the boundary should be zero [22], [52]and the dispersion relation reduces to the relatively simpledeterminental equation
(A18)
where the wave vector and isobtained from the plane-wave dispersion relation (A10), and
and can be considered as radial and longitudinal wavenumbers, respectively. Since (A10) is quadratic, there are twovalues for and, hence, two values for denoted by thesubscripts 1 and 2.
The reaction of the wave propagation to radial nonunifor-mities in the plasma density was also investigated [22]. Theyfound that while the inclusion of cylindrical boundaries servedto decrease (increase the axial wavelength) over the case ofan infinite plane-wave propagating parallel to , increasingdegrees of radial nonuniformity tended to increase, even tothe extent of having greater than the infinite plane-wavecase! Fig. 17 shows the different dispersion for the infiniteplane-wave propagating parallel to and waves propagatingin cylinders with conducting and insulating boundaries.
1242 IEEE TRANSACTIONS ON PLASMA SCIENCE, VOL. 25, NO. 6, DECEMBER 1997
Fig. 17. Whistler (Helicon) dispersion for—— rigid nonconducting bound-aries,– – – conducting boundaries, and- - - - infinite plane-wave propagatingparallel toB0. The effect of the different boundaries becomes important whena and k are comparable.
E. The Effects of Electron Inertia
In the 1960’s there was a debate as to whether it wasnecessary to include the electron inertia in the dispersion ofhelicons. It was known that there was a relation between thehelicon solutions and the TG modes [53] and that althoughboth modes could propagate in a magnetized plasma cylinder,their dispersion was quite different. It was pointed out thathigher order radial wave-mode numbers tended to decrease,and a simple approximation was given for their dispersion.
The dispersion relation (A18) has been used [23] to showthat the electron inertia had a measurable effect on the disper-sion of the waves for frequencies at least as low as 0.1and the result verified by experiment.
There are an infinity of solutions to these eigenvalue prob-lems, and generally the higher order modes are ignored on thepremise that they are highly damped. This is not necessarilythe case for all experimental conditions.
In searching for solutions of the cylindrical dispersionrelation which could be fitted to the experimental points,Boswell [54] found that higher order radial modes werestrongly affected by the electron inertia. By plotting theparallel wave number against the radial-mode number, heshowed that although the dispersion neglecting electron inertiawas reasonably correct for , for higher numbers, majordiscrepancies appeared for higher values with the dispersionapproaching an asymptote given by
(A19)
where is the cylinder radius and the radial-mode number.This curious behavior was not further investigated for sometime.
In the early 1980’s the effect of the boundary conditionson the radial-mode structure was revisited [55] and by ap-proximating the radial eigenmode spacing by , it wasshown that the asymptote (A19) was simply the resonancecone angle discussed in (A3).
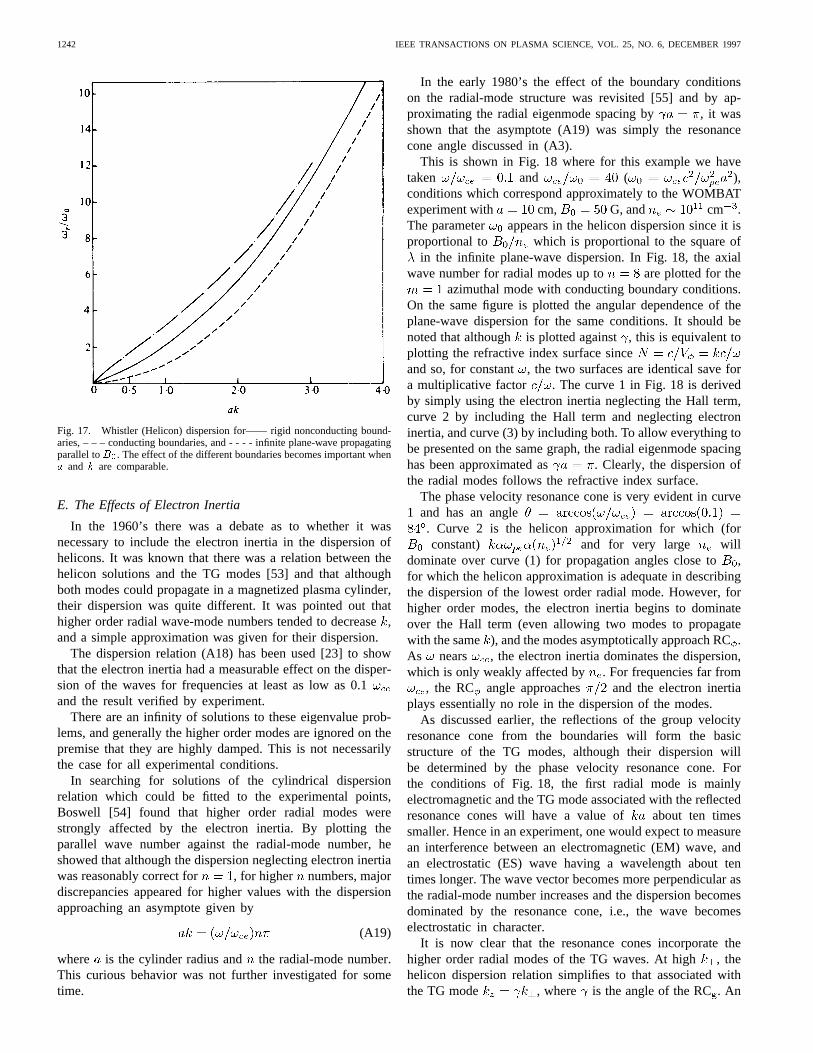
This is shown in Fig. 18 where for this example we havetaken and ( ),conditions which correspond approximately to the WOMBATexperiment with cm, G, and cm .The parameter appears in the helicon dispersion since it isproportional to which is proportional to the square of
in the infinite plane-wave dispersion. In Fig. 18, the axialwave number for radial modes up to are plotted for the
azimuthal mode with conducting boundary conditions.On the same figure is plotted the angular dependence of theplane-wave dispersion for the same conditions. It should benoted that although is plotted against , this is equivalent toplotting the refractive index surface sinceand so, for constant , the two surfaces are identical save fora multiplicative factor . The curve 1 in Fig. 18 is derivedby simply using the electron inertia neglecting the Hall term,curve 2 by including the Hall term and neglecting electroninertia, and curve (3) by including both. To allow everything tobe presented on the same graph, the radial eigenmode spacinghas been approximated as . Clearly, the dispersion ofthe radial modes follows the refractive index surface.
The phase velocity resonance cone is very evident in curve1 and has an angle
. Curve 2 is the helicon approximation for which (forconstant) and for very large will
dominate over curve (1) for propagation angles close to,for which the helicon approximation is adequate in describingthe dispersion of the lowest order radial mode. However, forhigher order modes, the electron inertia begins to dominateover the Hall term (even allowing two modes to propagatewith the same ), and the modes asymptotically approach RC.As nears , the electron inertia dominates the dispersion,which is only weakly affected by . For frequencies far from
, the RC angle approaches and the electron inertiaplays essentially no role in the dispersion of the modes.
As discussed earlier, the reflections of the group velocityresonance cone from the boundaries will form the basicstructure of the TG modes, although their dispersion willbe determined by the phase velocity resonance cone. Forthe conditions of Fig. 18, the first radial mode is mainlyelectromagnetic and the TG mode associated with the reflectedresonance cones will have a value of about ten timessmaller. Hence in an experiment, one would expect to measurean interference between an electromagnetic (EM) wave, andan electrostatic (ES) wave having a wavelength about tentimes longer. The wave vector becomes more perpendicular asthe radial-mode number increases and the dispersion becomesdominated by the resonance cone, i.e., the wave becomeselectrostatic in character.
It is now clear that the resonance cones incorporate thehigher order radial modes of the TG waves. At high, thehelicon dispersion relation simplifies to that associated withthe TG mode , where is the angle of the RC. An

BOSWELL AND CHEN: HELICONS—THE EARLY YEARS 1243
Fig. 18. Radial eigen modes (open circles) and plane-wave solutions for whistlers with!=!ce = 0, 1 and!=!0 = 40. Curve 3 is the full dispersion, curve 2is neglecting electron inertia, and curve 1 is neglecting the Hall term. The radial eigenmode spacing has been approximated as a = �. (Reprinted from [55].)
antenna located in the– plane (perpendicular to whichlies along the axis) with a charge densityexcites a TG mode where the wavefronts lie alongand the direction of propagation of the mode is that of theRC . The fine structure of the resonance cone (the higher orderradial modes) is produced by the high components of theantenna. In a two-dimensional waveguide with a conductingboundary, the boundary conditions at the walls are satisfiedby a set of image sources located outside the guide which canthen produce the modes seen in the eigenmode analysis.
In summary, we can say that the effect of the electroninertia is to introduce an ES component to the wave fields,which in cylindrical geometry appear as TG modes of varyingradial complexity. For high and low , the wave ispredominantly EM and its dispersion is governed by the Hallterm. This would be called the classic helicon wave. For highmagnetic fields, low densities or frequencies close to, theelectron inertia dominates and the wave will have strong EScharacteristics. Experimentally it will be the wave with theshortest and the EM wave having a very long, generallymuch longer than the plasma. It should be noted that thepropagation of the ES waves in a plasma with a finite electrontemperature will be strongly influenced by Landau dampingsince their wavelength can be quite small and their phasevelocity can be close to the thermal velocity of the electrons.
The EM wave will suffer collisionless damping only closeto where electrons moving opposite to the wave phasevelocity will see the wave-frequency doppler shifted toand take energy from the perpendicular component of thewave field.
Although these waves seem to be separate entities, they area result of the anisotropic nature of the refractive index andare part of the dispersion of the same wave propagating atdifferent angles in a cylinder.
ACKNOWLEDGMENT
The authors would like to thank Prof. S. M. Hamberger, Dr.D. Henry, Prof. H. A. Blevin, Dr. P. J. Christiansen, and Prof.A. Bouchoule for their positive encouragement. They wouldalso like to thank Prof. Leon Shohet for suggesting that the twoauthors collaborate on their project. Until 1984, all the fundinghad come from sparse university resources. Subsequently,most of the development was carried out on external contracts.For figures reprinted in this paper, the authors would like toacknowledge the following journals:Journal of GeophysicalResearch, Physical Review Letters, Proceedings of the PhysicalSociety, Plasma Physics and Controlled Fusion, Journal ofPlasma Physics Nature, and IEEE TRANSACTIONS ON PLASMA
SCIENCE.
REFERENCES
[1] H. Barkhausen, “Whistling tones from the earth,”Proc. I.R.E.,vol. 18,p. 143, 1930.
[2] D. R. Hartree, “The propagation of electromagnetic waves in a refractingmedium in a magnetic field,”Proc. Cambridge Phil. Soc.,vol. 27, p.143, 1931.
[3] E. V. Appleton, “Wireless studies of the ionosphere,”J. Inst. Elec.Engrs., vol. 71, p. 642, 1932.
[4] H. G. Booker, “Propagation of wave-packets incident obliquely upon astratified doubly refracting ionosphere,”Philos. Trans. R. Soc. LondonA, Math. Phys. Sci.,vol. 237A, p. 411, 1938.
[5] L. R. Storey, “An investigation of whistling atmospherics,”Philos.Trans. R. Soc. London A, Math. Phys. Sci.,vol. 246, p. 113, 1953.
[6] L. D. Landau, “On the vibrations of the electronic plasma,”J. Phys.,vol. 10, p. 25, 1946.
[7] J. M. Dawson, “Nonlinear electron oscillations in a cold plasma,”Phys.Rev.,vol. 113, p. 383, 1959.
[8] P. Aigrain, “Les ‘helicons’ dans les semiconducteurs,” inProc. Int. Conf.Semiconductor Physics,Prague, Czeckoslovakia, 1960, p. 224.
[9] F. E. Rose, M. T. Taylor, and R. Bowers, “Low frequency magnetoplasma resonances in sodium,”Phys. Rev.,vol. 127, p. 1122, 1962.
[10] C. R. Legendy, “Macroscopic theory of helicons,”Phys. Rev.,vol. 135,p. 1713, 1965.
[11] J. P. Klosenberg, B. McNamara, and P. C. Thonemann, “The dispersionand attenuation of helicon waves in a uniform cylindrical plasma,”J.Fluid Mech.,vol. 21, p. 545, 1965.
1244 IEEE TRANSACTIONS ON PLASMA SCIENCE, VOL. 25, NO. 6, DECEMBER 1997
[12] G. N. Harding and P. C. Thonemann, “A study of helicon waves inindium,” Proc. Phys. Soc.,vol. 85, p. 317, 1965.
[13] T. A. Facey and G. N. Harding, Culham Laboratory, Rep. CLM-R66,1966.
[14] R. M. Gallet, J. M. Richardson, B. Wieder, and G. D. Ward, “Microwavewhistler mode propagation in a dense laboratory plasma,”Phys. Rev.Lett., vol. 4, p. 347, 1960.
[15] H. A. Blevin and P. C. Thonemann, Culham Laboratory, Rep. CLM-R12, 1961.
[16] J. A. Lehane and P. C. Thonemann, “An experimental study of heliconwave propagation in a gaseous plasma,”Proc. Phys. Soc.,vol. 85, p.301, 1965.
[17] V. V. Chechin, M. P. Vasil’ev, L. I. Guigor’eva, A. V. Longinov, andB. I. Smerdov,J.E.T.P. Lett.,vol. 2, p. 260, 1965.
[18] M. P. Vasil’ev, L. I. Gregor’eva, A. V. Longinov, B. I. Smerdov, andU. U. Chechkin, “Plasma heating by a fast magnetosonic wave of largeamplitude,” J.E.T.P.,vol. 27, p. 882, 1968.
[19] V. D. Shafranov,J.E.T.P.,vol. 34, p. 1019, 1958.[20] H. A. Blevin, J. A. Reynolds, and P. C. Thonemann, Culham Laboratory,
Rep. CLM P204, 1969.[21] A. N. Kondratenko, “Kinetic theory of electromagnetic waves in a
bounded magnetoplasma,”Sov. Phys. Tech Phys.,vol. 11, p. 590,1966.
[22] H. A. Blevin and P. J. Christiansen, “Propagation of helicon waves ina nonuniform plasma,”Aust. J. Phys.,vol. 19, p. 501, 1966.
[23] H. A. Blevin, P. J. Christiansen, and B. Davies, “Effect of electroncyclotron resonance on helicon waves,”Phys. Lett. A,vol. 28, p. 230,1968.
[24] B. Davies, “Helicon wave propagation: Effect of electron inertia,”Phys.Rev. Lett.,vol. 22, p. 1246, 1969.
[25] A. B. Jolly, G. Martelli, and J. F. Troughton, “Helicon wave propagationin a laboratory plasma,”Plasma Phys.,vol. 10, p. 863, 1969.
[26] R. W. Boswell, “Modulated RF produced argon magneto-plasma,”School of Physical Sciences, The Flinders University of South Australia,Internal Rep. PR 68/8, 1968.
[27] , “Plasma production using a standing helicon wave,”Phys. Lett.,vol. 33A, pp. 457–458, 1970.
[28] , “Very efficient plasma generation by whistler waves near thelower hybrid frequency,”Plasma Phys. Control Fusion,vol. 10, pp.1147–1162, 1984.
[29] V. D. Shrafranov,J.E.T.P.,vol. 34, p. 1475, 1958.[30] V. V. Dolgopolov, A. I. Ermankov, N. I. Nazarov, K. N. Stepanov, and
V. T. Tolok, “Cerenkov absorption of ‘whistles’ in an inhomogeneousplasma cylinder,”Nucl. Fusion,vol. 3, p. 251, 1963.
[31] H. Oechsner, “On the influence of superimposed DC magnetic fieldson the density of electrodeless HF plasmas,” in 1970Int. Conf. on GasDischarges,p. 187.
[32] , “Electron cyclotron wave resonances and power absorptioneffects in electrodeless low pressure HF plasmas with superimposedstatic magnetic field,”Plasma Phys. Control Fusion,vol. 16, p. 835,1973.
[33] E. P. Szuszczewicz and H. Oechsner, “Spatial distribution of plasmadensity in a high-frequency discharge with a superimposed static mag-netic field,” Phys. Fluids,vol. 15, p. 2240, 1972.
[34] S. O. Knox, F. J. Paoloni, and Kristiansen, “Helical antenna for excitingazimuthally asymmetric Alfven waves,”M. J. Appl. Phys.,vol. 46, p.2516, 1975.
[35] G. Lisatano, R. A. Ellis, W. M. Hooke, and T. H. Stix, “Production of aquiescent discharge with high electron temperature,”Rev. Sci. Instrum.,vol. 39, p. 295, 1968.
[36] T. Watari, T. Hatori, R. Kumasawa, S. Hidekuma, T. Aoki, T.Kawamoto, W. Inutake, S. Hiroe, A. Nishizawa, K. Adati, T. Sato, T.Watanabe, H. Obayashi, and K. Takayama, “Radio-frequency pluggingof a high density plasma,”Phys. Fluids,vol. 21, p. 2076, 1978.
[37] R. W. Boswell, “A study of waves in gaseous plasmas,” Ph.D. thesis,Flinders Univ. of S. Australia, 1974.
[38] T. Shoji, “Experiment on RF plasma production in CHS,”Annu. Review,Institute of Plasma Physics, Nagoya Univ., Japan, 1986, p. 67.
[39] Nagoya publication.
[40] R. W. Boswell, R. K. Porteous, A. Prytz, and A. Bouchoule, “Somefeatures of RF excited fully ionized low pressure argon plasma,”Phys.Letts. A,vol. 91, p. 163, 1982.
[41] R. W. Boswell and D. Henry, “Pulsed high rate plasma etching withvariable Si/SiO2 selectivity and variable Si etch profiles,”Appl. Phys.Lett., vol. 47, p. 1095, 1985.
[42] R. W. Boswell, “Method and apparatus for producing a high densitymagneto-plasma,” Australian Patent 58606/86, and most other countries.
[43] L. Spitzer, “Physics of fully ionized gases,” inInterscience,2nd ed.New York: McGraw-Hill, 1962.
[44] P. J. Christiansen, “Experimental study of helicon waves,” Ph.D. thesis,Flinders Univ. of S. Australia, 1969.
[45] T. H. Stix, The Theory of Plasma Waves.New York: McGraw-Hill,1962, ch. 3 and references therein.
[46] R. K. Fisher and R. W. Gould, “Resonance cones in the field pattern ofa radio frequency probe in a warm anisotropic plasma,”Phys. Fluids,vol. 14, p. 875, 1971.
[47] R. W. Boswell, “Measurements of the far field resonance cone forwhistler mode waves in the magnetoplasma,”Nature, vol. 58, p. 258,1975.
[48] R. L. Stenzel,Radio Sci.,vol. 11, p. 1045, 1976.[49] T. Ohnuma, “Radiation phenomena of plasma waves,”IEEE Trans.
Plasma Sci.,vol. PS-6, p. 464, 1978.[50] A. Gonfolone, “Reflection of resonance cone and plasma-filled wave-
guide modes,”Appl. Phys. Lett.,vol. 32, p. 530, 1978.[51] A. W. Trivelpiece and R. W. Gould, “Space charge waves in cylindrical
plasma columns,”J. Appl. Phys.,vol. 30, p. 1784, 1959.[52] B. Davies, “Helicon wave propagation: Effect of electron inertia,”J.
Plasma Phys.,vol. 4, p. 43, 1970.[53] R. L. Ferrari and J. P. Klozenberg, “The dispersion and attenuation
of helicon waves in a cylindrical plasma-filled waveguide,”J. PlasmaPhys.,vol. 2, p. 283, 1968.
[54] R. W. Boswell “Dependence of helicon wave radial structure on electroninertia,” Aust. J. Phys.,vol. 25, p. 403, 1972.
[55] R. W. Boswell, “Electrostatic and electromagnetic eigen modes nearthe electron and ion gyrofrequencies in a cylindrical plasma,”J. PlasmaPhys.,vol. 31, p. 197, 1984.
Rod W. Boswellhas been working at the AustralianNational University in Canberra since 1980. Hisinterests include helicon plasmas and particles incell simulation.
Francis F. Chenhas had a 43-year career in plasmaphysics which includes contributions to probe diag-nostics, resistive drift waves, magnetic and inertialfusion, laser-plasma interactions, laser accelerators,and gas discharges. His recent interest in industrialapplications led to the present work on heliconsources. He has also authored a popular textbook.
Mr. Chen won the IEEE Plasma Science andApplications Award and the APS Maxwell Prize.
Related Documents