Original paper Helical differential X-ray phase-contrast computed tomography Jian Fu a , Marian Willner b , Liyuan Chen a , Renbo Tan a , Klaus Achterhold b , Martin Bech b, c, * , Julia Herzen d , Danays Kunka e , Juergen Mohr e , Franz Pfeiffer b a Beijing University of Aeronautics and Astronautics, 100191 Beijing, China b Technische Universität München, 85748 Garching, Germany c Lund University, Department for Medical Radiation Physics, 22185 Lund, Sweden d Institute of Materials Research, Helmholtz-Zentrum Geesthacht, 22607 Hamburg, Germany e Karlsruhe Institute of Technology, Institute for Microstructure Technology, 76344 Eggenstein-Leopoldshafen, Germany article info Article history: Received 17 July 2013 Received in revised form 9 January 2014 Accepted 11 January 2014 Available online 8 February 2014 Keywords: Differential phase-contrast Computed tomography Helical scan abstract We report on the first experimental results of helical differential phase-contrast computed tomography (helical DPC-CT) with a laboratory X-ray tube source and a TalboteLau grating interferometer. The results experimentally verify the feasibility of helical data acquisition and reconstruction in phase-contrast imaging, in analogy to its use in clinical CT systems. This allows fast and continuous volumetric scans for long objects with lengths exceeding the dimension of the detector. Since helical CT revolutionized the field of medical CT several years ago, we anticipate that this method will bring the same significant impact on the future medical and industrial applications of X-ray DPC-CT. Ó 2014 Associazione Italiana di Fisica Medica. Published by Elsevier Ltd. All rights reserved. Introduction X-Ray computed tomography (CT) is a powerful tool for medical and industrial applications such as clinical diagnosis, non- destructive testing and material evaluation. However, the usual CT modality is not suitable for extended long objects due to the limited field of view of the detector [1e4]. Since 1990, many at- tempts have been made to address this problem. The most suc- cessful approach is helical or spiral CT [1e4], in which the object is continuously translated through the beam while data is acquired. This allows a large axial coverage within one single scanning pro- cess with sufficient reconstruction accuracy and has enabled a broad use of the technique in clinical and industrial applications. Over the last years several phase-contrast imaging techniques have been developed [5e25], which rely on the phase shift intro- duced to the incoming X-rays when passing through an object. This method provides better image quality in soft-tissue and low atomic number samples. One of the recent developments is differential phase-contrast CT (DPC-CT) based on a grating interferometer [17e 25]. DPC-CT has first been implemented at X-ray synchrotron radiation sources [18e20] and recently been transferred to lab- based X-ray tube sources [21e25]. Several experimental case studies reported in the literature demonstrate that DPC-CT offers improved soft-tissue contrast and more internal structure details than absorption-contrast CT [22,24,25]. A first numerical investigation of helical DPC-CT has been per- formed by Qi et al. [26], who adapted the reconstruction algorithm of Taguchi [2] and Hu [3] to differential phase-contrast imaging and proved its validity on simulated data. Another numerical case study on helical DPC-CT has been done by Li et al. [27]. However, a proof of principle on experimental data has yet to be shown. The new aspect of the work presented here is to supplement the theoretical considerations of helical DPC-CT by providing an alternative reconstruction algorithm and give the first experimental demon- stration on a real biological specimen using a grating-based X-ray tube source imaging system. Methods and materials A three-dimensional object can be described by a complex refractive index distribution n(x,y,z) ¼ 1 d(x,y,z) þ ib(x,y,z), where x, y, and z describe the coordinate system of the sample. In con- ventional absorption-contrast CT, the imaginary part b is measured by the attenuation of the X-rays transmitted through the specimen. In differential phase-contrast imaging one measures the effect of variations of the real part d by evaluating the tiny refraction angles * Corresponding author. Technische Universität München, Physics Department E17, James-Franck-Strasse 1, 85748 Garching, Germany. Tel.: þ49 89 289 10807. E-mail addresses: [email protected] (J. Fu), [email protected] (M. Bech), [email protected] (F. Pfeiffer). Contents lists available at ScienceDirect Physica Medica journal homepage: http://www.physicamedica.com 1120-1797/$ e see front matter Ó 2014 Associazione Italiana di Fisica Medica. Published by Elsevier Ltd. All rights reserved. http://dx.doi.org/10.1016/j.ejmp.2014.01.005 Physica Medica 30 (2014) 374e379

Welcome message from author
This document is posted to help you gain knowledge. Please leave a comment to let me know what you think about it! Share it to your friends and learn new things together.
Transcript
lable at ScienceDirect
Physica Medica 30 (2014) 374e379
Contents lists avai
Physica Medica
journal homepage: http: / /www.physicamedica.com
Original paper
Helical differential X-ray phase-contrast computed tomography
Jian Fu a, Marian Willner b, Liyuan Chen a, Renbo Tan a, Klaus Achterhold b, Martin Bech b,c,*,Julia Herzen d, Danays Kunka e, Juergen Mohr e, Franz Pfeiffer b
aBeijing University of Aeronautics and Astronautics, 100191 Beijing, Chinab Technische Universität München, 85748 Garching, Germanyc Lund University, Department for Medical Radiation Physics, 22185 Lund, Swedend Institute of Materials Research, Helmholtz-Zentrum Geesthacht, 22607 Hamburg, GermanyeKarlsruhe Institute of Technology, Institute for Microstructure Technology, 76344 Eggenstein-Leopoldshafen, Germany
a r t i c l e i n f o
Article history:Received 17 July 2013Received in revised form9 January 2014Accepted 11 January 2014Available online 8 February 2014
Keywords:Differential phase-contrastComputed tomographyHelical scan
* Corresponding author. Technische Universität ME17, James-Franck-Strasse 1, 85748 Garching, German
E-mail addresses: [email protected] (J. Fu), [email protected] (F. Pfeiffer).
1120-1797/$ e see front matter � 2014 Associazionehttp://dx.doi.org/10.1016/j.ejmp.2014.01.005
a b s t r a c t
We report on the first experimental results of helical differential phase-contrast computed tomography(helical DPC-CT) with a laboratory X-ray tube source and a TalboteLau grating interferometer. The resultsexperimentally verify the feasibility of helical data acquisition and reconstruction in phase-contrastimaging, in analogy to its use in clinical CT systems. This allows fast and continuous volumetric scansfor long objects with lengths exceeding the dimension of the detector. Since helical CT revolutionized thefield of medical CT several years ago, we anticipate that this method will bring the same significantimpact on the future medical and industrial applications of X-ray DPC-CT.
� 2014 Associazione Italiana di Fisica Medica. Published by Elsevier Ltd. All rights reserved.
Introduction
X-Ray computed tomography (CT) is a powerful tool for medicaland industrial applications such as clinical diagnosis, non-destructive testing and material evaluation. However, the usualCT modality is not suitable for extended long objects due to thelimited field of view of the detector [1e4]. Since 1990, many at-tempts have been made to address this problem. The most suc-cessful approach is helical or spiral CT [1e4], in which the object iscontinuously translated through the beam while data is acquired.This allows a large axial coverage within one single scanning pro-cess with sufficient reconstruction accuracy and has enabled abroad use of the technique in clinical and industrial applications.
Over the last years several phase-contrast imaging techniqueshave been developed [5e25], which rely on the phase shift intro-duced to the incoming X-rays when passing through an object. Thismethod provides better image quality in soft-tissue and low atomicnumber samples. One of the recent developments is differentialphase-contrast CT (DPC-CT) based on a grating interferometer [17e25]. DPC-CT has first been implemented at X-ray synchrotron
ünchen, Physics Departmenty. Tel.: þ49 89 289 [email protected] (M. Bech),
Italiana di Fisica Medica. Published
radiation sources [18e20] and recently been transferred to lab-based X-ray tube sources [21e25]. Several experimental casestudies reported in the literature demonstrate that DPC-CT offersimproved soft-tissue contrast and more internal structure detailsthan absorption-contrast CT [22,24,25].
A first numerical investigation of helical DPC-CT has been per-formed by Qi et al. [26], who adapted the reconstruction algorithmof Taguchi [2] and Hu [3] to differential phase-contrast imaging andproved its validity on simulated data. Another numerical case studyon helical DPC-CT has been done by Li et al. [27]. However, a proofof principle on experimental data has yet to be shown. The newaspect of the work presented here is to supplement the theoreticalconsiderations of helical DPC-CT by providing an alternativereconstruction algorithm and give the first experimental demon-stration on a real biological specimen using a grating-based X-raytube source imaging system.
Methods and materials
A three-dimensional object can be described by a complexrefractive index distribution n(x,y,z) ¼ 1 � d(x,y,z) þ ib(x,y,z), wherex, y, and z describe the coordinate system of the sample. In con-ventional absorption-contrast CT, the imaginary part b is measuredby the attenuation of the X-rays transmitted through the specimen.In differential phase-contrast imaging one measures the effect ofvariations of the real part d by evaluating the tiny refraction angles
by Elsevier Ltd. All rights reserved.
J. Fu et al. / Physica Medica 30 (2014) 374e379 375
of X-rays induced by the specimen with a grating TalboteLauinterferometer [21]. Correspondingly, a differential phase-contrastprojection can be expressed by aðy0; z0; qÞ ¼ vðR
ldðx; y; zÞdlÞ=vy,
where y0and z
0describe the coordinate system of the detector, q the
rotation view angle of the object around the z-axis and l the inci-dent ray direction.
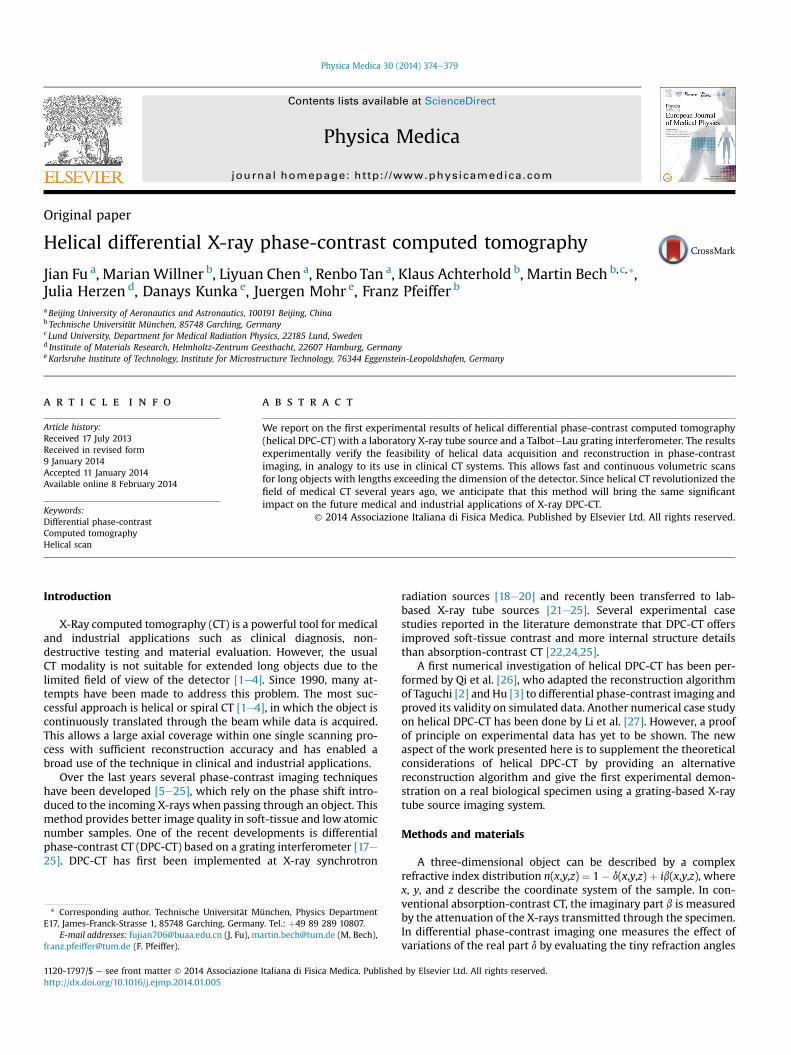
Figure 1(a) and (b) depicts the considered helical DPC-CTscanning geometry. It is similar to the standard DPC-CT, in whichthe source grating G0, the phase grating G1 and the absorptiongrating G2 form the TalboteLau interferometer and a sample holderrotates the object over 360� during data acquisition. At each viewangle, a phase-stepping procedure is performed and allows atten-uation and phase information to be extracted (a detailed descrip-tion of the method can be found in Refs. [20,21]). The 3D volume ofthe object can finally be reconstructed by standard CT algorithms.The only modification for the differential phase-contrast data is theapplication of the imaginary Hilbert filter [22]. In helical scanningmode there is an additional vertical translation of the sample witheach rotation step.
In the presented helical DPC-CT scanning mode in Fig. 1(a) and(b), the X-ray source and the detector form a cone-beam geometry.In this work, we adapt the corresponding cone-beam helical CTreconstruction algorithm proposed by Noo [4]. This algorithmconceptually converts the DPC projections a(y
0,z
0,q) to a stack of fan-
beam sinograms p(y0,g), each associatedwith one axial z-slice. Here,
g represents the associated fan-beam scanning view angle rangingfrom 0 to 2p. Once the fan-beam sinograms are built, reconstruc-tion is performed for each z-slice using the classical fan-beam
Figure 1. (a) The helical DPC-CT data acquisition scheme with an X-ray tube source and a tdescribing the inspected sample and the detector respectively. y
0and z
0are the indexes of de
distance from the X-ray tube to the detector. (b) The geometrical relationship among the imapitch. a(y
0,z
0,q) represents the DPC data from the y0th channel of the z0th row array at the vie
filtered back-projection in combination with the imaginary Hil-bert filter [22].
Mathematically the conversion equation between a(y0,z
0,q) and
p(y0,g) is
pðy0;gÞzffiffiffiffiffiffiffiffiffiffiffiffiffiffiffiffiffiffiy02 þ x02c
qffiffiffiffiffiffiffiffiffiffiffiffiffiffiffiffiffiffiffiffiffiffiffiffiffiffiffiffiffiy02 þ z02 þ x02c
q aðy0; z0; qÞ; (1)
where
z0zy02 þ x02cxcx0c
Dz: (2)
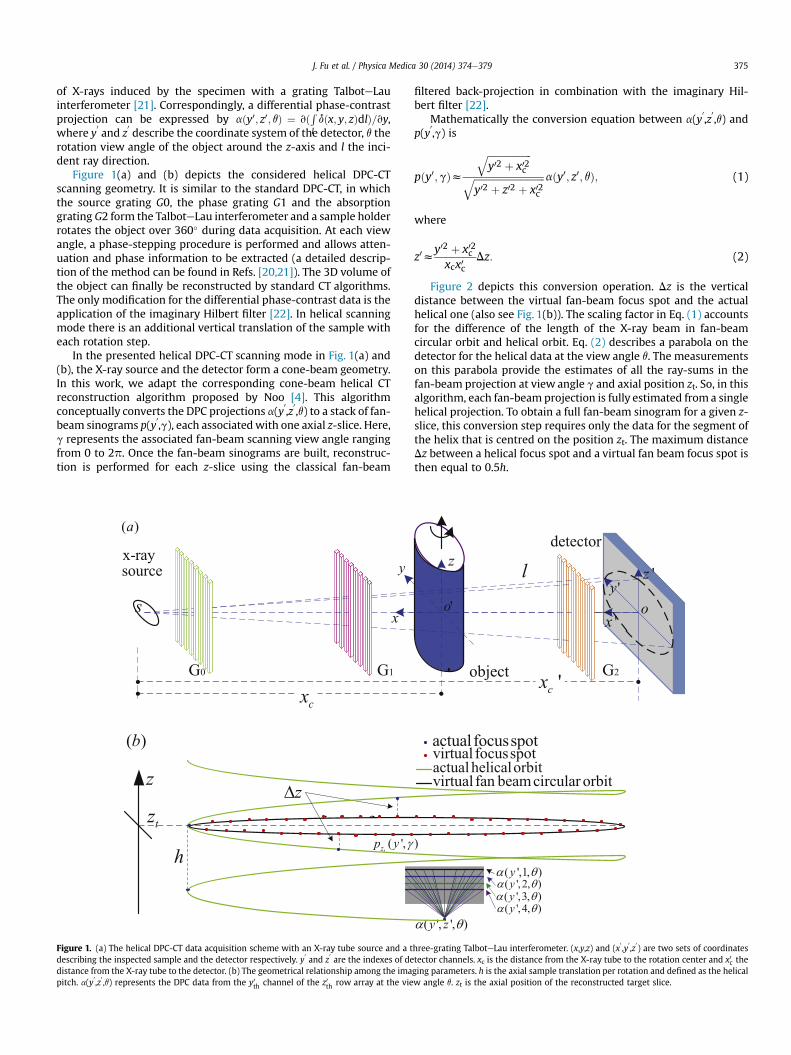
Figure 2 depicts this conversion operation. Dz is the verticaldistance between the virtual fan-beam focus spot and the actualhelical one (also see Fig. 1(b)). The scaling factor in Eq. (1) accountsfor the difference of the length of the X-ray beam in fan-beamcircular orbit and helical orbit. Eq. (2) describes a parabola on thedetector for the helical data at the view angle q. The measurementson this parabola provide the estimates of all the ray-sums in thefan-beam projection at view angle g and axial position zt. So, in thisalgorithm, each fan-beam projection is fully estimated from a singlehelical projection. To obtain a full fan-beam sinogram for a given z-slice, this conversion step requires only the data for the segment ofthe helix that is centred on the position zt. The maximum distanceDz between a helical focus spot and a virtual fan beam focus spot isthen equal to 0.5h.
hree-grating TalboteLau interferometer. (x,y,z) and (x0,y
0,z
0) are two sets of coordinates
tector channels. xc is the distance from the X-ray tube to the rotation center and x0c theging parameters. h is the axial sample translation per rotation and defined as the helicalw angle q. zt is the axial position of the reconstructed target slice.
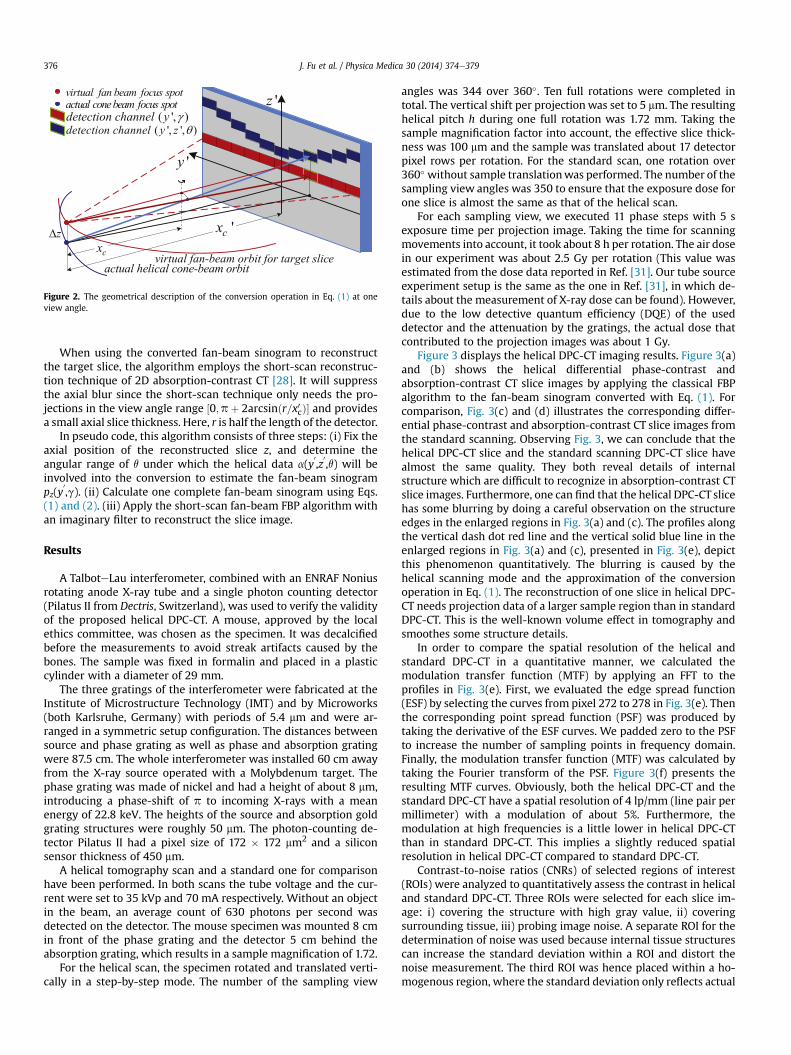
Figure 2. The geometrical description of the conversion operation in Eq. (1) at oneview angle.
J. Fu et al. / Physica Medica 30 (2014) 374e379376
When using the converted fan-beam sinogram to reconstructthe target slice, the algorithm employs the short-scan reconstruc-tion technique of 2D absorption-contrast CT [28]. It will suppressthe axial blur since the short-scan technique only needs the pro-jections in the view angle range ½0;pþ 2arcsinðr=x0cÞ� and providesa small axial slice thickness. Here, r is half the length of the detector.
In pseudo code, this algorithm consists of three steps: (i) Fix theaxial position of the reconstructed slice z, and determine theangular range of q under which the helical data a(y
0,z
0,q) will be
involved into the conversion to estimate the fan-beam sinogrampz(y
0,g). (ii) Calculate one complete fan-beam sinogram using Eqs.
(1) and (2). (iii) Apply the short-scan fan-beam FBP algorithm withan imaginary filter to reconstruct the slice image.
Results
A TalboteLau interferometer, combined with an ENRAF Noniusrotating anode X-ray tube and a single photon counting detector(Pilatus II from Dectris, Switzerland), was used to verify the validityof the proposed helical DPC-CT. A mouse, approved by the localethics committee, was chosen as the specimen. It was decalcifiedbefore the measurements to avoid streak artifacts caused by thebones. The sample was fixed in formalin and placed in a plasticcylinder with a diameter of 29 mm.
The three gratings of the interferometer were fabricated at theInstitute of Microstructure Technology (IMT) and by Microworks(both Karlsruhe, Germany) with periods of 5.4 mm and were ar-ranged in a symmetric setup configuration. The distances betweensource and phase grating as well as phase and absorption gratingwere 87.5 cm. The whole interferometer was installed 60 cm awayfrom the X-ray source operated with a Molybdenum target. Thephase grating was made of nickel and had a height of about 8 mm,introducing a phase-shift of p to incoming X-rays with a meanenergy of 22.8 keV. The heights of the source and absorption goldgrating structures were roughly 50 mm. The photon-counting de-tector Pilatus II had a pixel size of 172 � 172 mm2 and a siliconsensor thickness of 450 mm.
A helical tomography scan and a standard one for comparisonhave been performed. In both scans the tube voltage and the cur-rent were set to 35 kVp and 70 mA respectively. Without an objectin the beam, an average count of 630 photons per second wasdetected on the detector. The mouse specimen was mounted 8 cmin front of the phase grating and the detector 5 cm behind theabsorption grating, which results in a sample magnification of 1.72.
For the helical scan, the specimen rotated and translated verti-cally in a step-by-step mode. The number of the sampling view
angles was 344 over 360�. Ten full rotations were completed intotal. The vertical shift per projectionwas set to 5 mm. The resultinghelical pitch h during one full rotation was 1.72 mm. Taking thesample magnification factor into account, the effective slice thick-ness was 100 mm and the sample was translated about 17 detectorpixel rows per rotation. For the standard scan, one rotation over360� without sample translationwas performed. The number of thesampling view angles was 350 to ensure that the exposure dose forone slice is almost the same as that of the helical scan.
For each sampling view, we executed 11 phase steps with 5 sexposure time per projection image. Taking the time for scanningmovements into account, it took about 8 h per rotation. The air dosein our experiment was about 2.5 Gy per rotation (This value wasestimated from the dose data reported in Ref. [31]. Our tube sourceexperiment setup is the same as the one in Ref. [31], in which de-tails about the measurement of X-ray dose can be found). However,due to the low detective quantum efficiency (DQE) of the useddetector and the attenuation by the gratings, the actual dose thatcontributed to the projection images was about 1 Gy.
Figure 3 displays the helical DPC-CT imaging results. Figure 3(a)and (b) shows the helical differential phase-contrast andabsorption-contrast CT slice images by applying the classical FBPalgorithm to the fan-beam sinogram converted with Eq. (1). Forcomparison, Fig. 3(c) and (d) illustrates the corresponding differ-ential phase-contrast and absorption-contrast CT slice images fromthe standard scanning. Observing Fig. 3, we can conclude that thehelical DPC-CT slice and the standard scanning DPC-CT slice havealmost the same quality. They both reveal details of internalstructure which are difficult to recognize in absorption-contrast CTslice images. Furthermore, one can find that the helical DPC-CT slicehas some blurring by doing a careful observation on the structureedges in the enlarged regions in Fig. 3(a) and (c). The profiles alongthe vertical dash dot red line and the vertical solid blue line in theenlarged regions in Fig. 3(a) and (c), presented in Fig. 3(e), depictthis phenomenon quantitatively. The blurring is caused by thehelical scanning mode and the approximation of the conversionoperation in Eq. (1). The reconstruction of one slice in helical DPC-CT needs projection data of a larger sample region than in standardDPC-CT. This is the well-known volume effect in tomography andsmoothes some structure details.
In order to compare the spatial resolution of the helical andstandard DPC-CT in a quantitative manner, we calculated themodulation transfer function (MTF) by applying an FFT to theprofiles in Fig. 3(e). First, we evaluated the edge spread function(ESF) by selecting the curves from pixel 272 to 278 in Fig. 3(e). Thenthe corresponding point spread function (PSF) was produced bytaking the derivative of the ESF curves. We padded zero to the PSFto increase the number of sampling points in frequency domain.Finally, the modulation transfer function (MTF) was calculated bytaking the Fourier transform of the PSF. Figure 3(f) presents theresulting MTF curves. Obviously, both the helical DPC-CT and thestandard DPC-CT have a spatial resolution of 4 lp/mm (line pair permillimeter) with a modulation of about 5%. Furthermore, themodulation at high frequencies is a little lower in helical DPC-CTthan in standard DPC-CT. This implies a slightly reduced spatialresolution in helical DPC-CT compared to standard DPC-CT.
Contrast-to-noise ratios (CNRs) of selected regions of interest(ROIs) were analyzed to quantitatively assess the contrast in helicaland standard DPC-CT. Three ROIs were selected for each slice im-age: i) covering the structure with high gray value, ii) coveringsurrounding tissue, iii) probing image noise. A separate ROI for thedetermination of noise was used because internal tissue structurescan increase the standard deviation within a ROI and distort thenoise measurement. The third ROI was hence placed within a ho-mogenous region, where the standard deviation only reflects actual
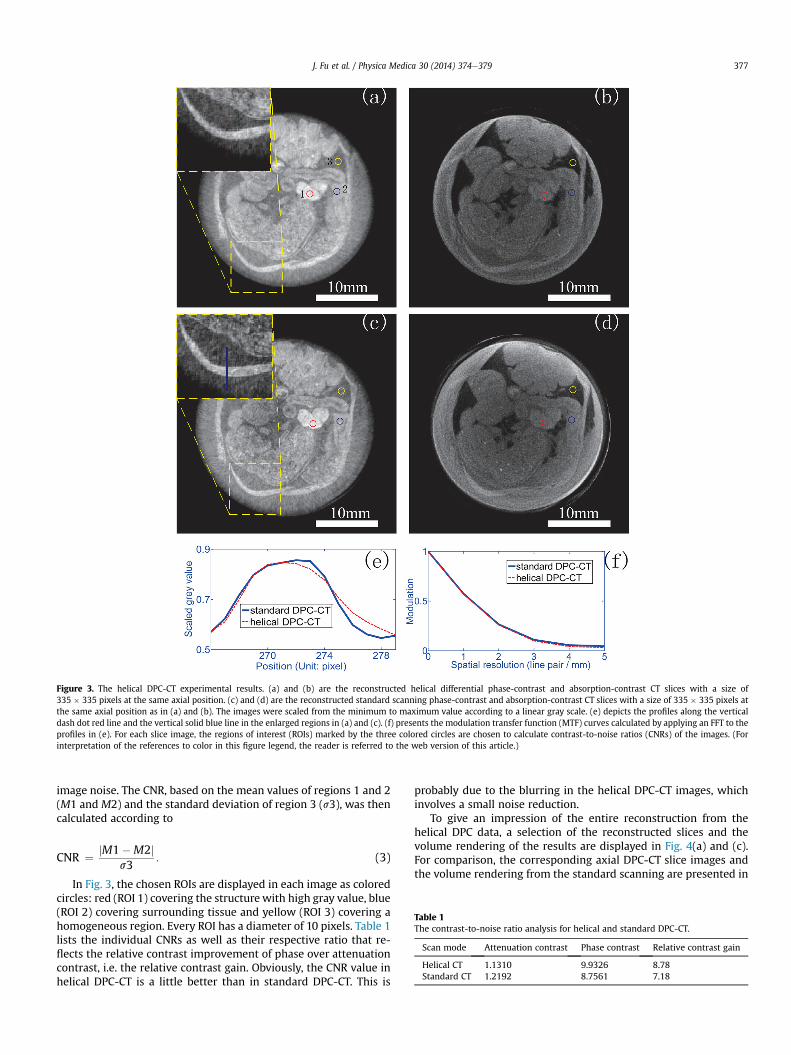
Figure 3. The helical DPC-CT experimental results. (a) and (b) are the reconstructed helical differential phase-contrast and absorption-contrast CT slices with a size of335 � 335 pixels at the same axial position. (c) and (d) are the reconstructed standard scanning phase-contrast and absorption-contrast CT slices with a size of 335 � 335 pixels atthe same axial position as in (a) and (b). The images were scaled from the minimum to maximum value according to a linear gray scale. (e) depicts the profiles along the verticaldash dot red line and the vertical solid blue line in the enlarged regions in (a) and (c). (f) presents the modulation transfer function (MTF) curves calculated by applying an FFT to theprofiles in (e). For each slice image, the regions of interest (ROIs) marked by the three colored circles are chosen to calculate contrast-to-noise ratios (CNRs) of the images. (Forinterpretation of the references to color in this figure legend, the reader is referred to the web version of this article.)
Table 1The contrast-to-noise ratio analysis for helical and standard DPC-CT.
Scan mode Attenuation contrast Phase contrast Relative contrast gain
Helical CT 1.1310 9.9326 8.78Standard CT 1.2192 8.7561 7.18
J. Fu et al. / Physica Medica 30 (2014) 374e379 377
image noise. The CNR, based on the mean values of regions 1 and 2(M1 and M2) and the standard deviation of region 3 (s3), was thencalculated according to
CNR ¼ jM1�M2js3
: (3)
In Fig. 3, the chosen ROIs are displayed in each image as coloredcircles: red (ROI 1) covering the structure with high gray value, blue(ROI 2) covering surrounding tissue and yellow (ROI 3) covering ahomogeneous region. Every ROI has a diameter of 10 pixels. Table 1lists the individual CNRs as well as their respective ratio that re-flects the relative contrast improvement of phase over attenuationcontrast, i.e. the relative contrast gain. Obviously, the CNR value inhelical DPC-CT is a little better than in standard DPC-CT. This is
probably due to the blurring in the helical DPC-CT images, whichinvolves a small noise reduction.
To give an impression of the entire reconstruction from thehelical DPC data, a selection of the reconstructed slices and thevolume rendering of the results are displayed in Fig. 4(a) and (c).For comparison, the corresponding axial DPC-CT slice images andthe volume rendering from the standard scanning are presented in
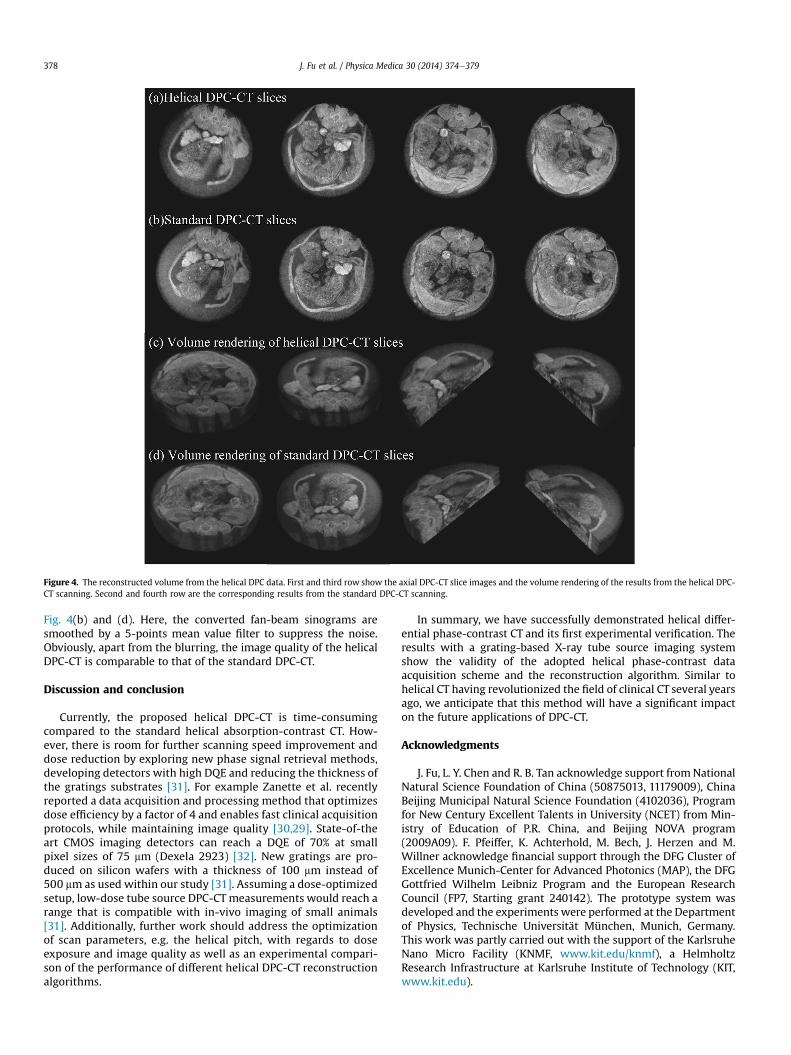
Figure 4. The reconstructed volume from the helical DPC data. First and third row show the axial DPC-CT slice images and the volume rendering of the results from the helical DPC-CT scanning. Second and fourth row are the corresponding results from the standard DPC-CT scanning.
J. Fu et al. / Physica Medica 30 (2014) 374e379378
Fig. 4(b) and (d). Here, the converted fan-beam sinograms aresmoothed by a 5-points mean value filter to suppress the noise.Obviously, apart from the blurring, the image quality of the helicalDPC-CT is comparable to that of the standard DPC-CT.
Discussion and conclusion
Currently, the proposed helical DPC-CT is time-consumingcompared to the standard helical absorption-contrast CT. How-ever, there is room for further scanning speed improvement anddose reduction by exploring new phase signal retrieval methods,developing detectors with high DQE and reducing the thickness ofthe gratings substrates [31]. For example Zanette et al. recentlyreported a data acquisition and processing method that optimizesdose efficiency by a factor of 4 and enables fast clinical acquisitionprotocols, while maintaining image quality [30,29]. State-of-theart CMOS imaging detectors can reach a DQE of 70% at smallpixel sizes of 75 mm (Dexela 2923) [32]. New gratings are pro-duced on silicon wafers with a thickness of 100 mm instead of500 mm as used within our study [31]. Assuming a dose-optimizedsetup, low-dose tube source DPC-CT measurements would reach arange that is compatible with in-vivo imaging of small animals[31]. Additionally, further work should address the optimizationof scan parameters, e.g. the helical pitch, with regards to doseexposure and image quality as well as an experimental compari-son of the performance of different helical DPC-CT reconstructionalgorithms.
In summary, we have successfully demonstrated helical differ-ential phase-contrast CT and its first experimental verification. Theresults with a grating-based X-ray tube source imaging systemshow the validity of the adopted helical phase-contrast dataacquisition scheme and the reconstruction algorithm. Similar tohelical CT having revolutionized the field of clinical CT several yearsago, we anticipate that this method will have a significant impacton the future applications of DPC-CT.
Acknowledgments
J. Fu, L. Y. Chen and R. B. Tan acknowledge support fromNationalNatural Science Foundation of China (50875013, 11179009), ChinaBeijing Municipal Natural Science Foundation (4102036), Programfor New Century Excellent Talents in University (NCET) from Min-istry of Education of P.R. China, and Beijing NOVA program(2009A09). F. Pfeiffer, K. Achterhold, M. Bech, J. Herzen and M.Willner acknowledge financial support through the DFG Cluster ofExcellence Munich-Center for Advanced Photonics (MAP), the DFGGottfried Wilhelm Leibniz Program and the European ResearchCouncil (FP7, Starting grant 240142). The prototype system wasdeveloped and the experiments were performed at the Departmentof Physics, Technische Universität München, Munich, Germany.This work was partly carried out with the support of the KarlsruheNano Micro Facility (KNMF, www.kit.edu/knmf), a HelmholtzResearch Infrastructure at Karlsruhe Institute of Technology (KIT,www.kit.edu).
J. Fu et al. / Physica Medica 30 (2014) 374e379 379
References
[1] Kalender WA. Technical foundations of spiral CT. Semin Ultrasound CT MRI1994;15:81e9.
[2] Taguchi K, Aradeate H. Algorithm for image reconstruction in multi-slicehelical CT. Med Phys 1998;25:550e61.
[3] Hu H. Multi-slice helical CT: scan and reconstruction. Med Phys 1999;26:5e18.
[4] Noo F, Defrise M, Clackdoyle R. Single-slice rebinning method for helical cone-beam CT. Phys Med Biol 1999;44:561e70.
[5] Bonse U, Hart M. An x-ray interferometer. Appl Phys Lett 1965;6:155e6.[6] Davis TJ, Gao D, Gureyev TE, Stevenson AW, Wilkins SW. Phase-contrast im-
aging of weakly absorbing materials using hard x-rays. Nature 1995;373:595e8.
[7] Ingal VN, Beliaevskaya EA. X-ray plane-wave topography observation of thephase contrast from a non-crystalline object. J Phys D 1995;28:2314e7.
[8] Snigirev A, Snigireva I, Kohn V, Kuznetsov S, Schelokov I. On the possibilities ofx-ray phase contrast microimaging by coherent high-energy synchrotron ra-diation. Rev Sci Instrum 1995;66:5486e92.
[9] Ingal VN, Beliaevskaya EA. Phase dispersion radiography of biological objects.Phys Med 1996;12:75e81.
[10] Momose A, Takeda T, Hirano K. Phase-contrast x-ray computed tomographyfor observing biological soft tissues. Nat Med 1996;2:473e5.
[11] Nugent KA, Gureyev TE, Cookson DF, Paganin D, Barnea Z. Quantitative phaseimaging using hard x-rays. Phys Rev Lett 1996;77:2961e4.
[12] Wilkins SW, Gureyev TE, Gao D, Pogany A, Stevenson AW. Phase-contrastimaging using polychromatic hard x-rays. Nature 1996;384:335e7.
[13] Chapman D, ThomlinsonW, Johnston RE, Washburn D, Pisano E, Gmür N, et al.Diffraction enhanced x-ray imaging. Phys Med Biol 1997;42:2015e25.
[14] Cloetens P, Ludwig W, Baruchel J, van Dyck D, van Landuyt J, Guigay JP, et al.Holotomography: quantitative phase tomography with micrometer resolu-tion using hard synchrotron radiation x rays. Appl Phys Lett 1999;75:2912e4.
[15] Fitzgerald R. Phase-sensitive x-ray imaging. Phys Today 2000;7:23e7.[16] Zhou SA, Brahme A. Development of phase-contrast x-ray imaging techniques
and potential medical applications. Phys Med Eur J Med Phys 2008;24:129e48.
[17] Momose A. Phase-sensitive imaging and phase tomography using x-ray in-terferometers. Opt Express 2003;11:2303e14.
[18] Momose A, Kawamoto S, Koyama I, Hamaishi Y, Takai K, Suzuki Y. Demon-stration of x-ray Talbot interferometry. Jpn J Appl Phys 2003;42:L866e8.
[19] Momose A. Recent advances in x-ray phase imaging. Jpn J Appl Phys 2005;44:6355e9.
[20] Weitkamp T, Diaz A, David C, Pfeiffer F, Stampanoni M, Cloetens P, et al. X-rayphase imaging with a grating interferometer. Opt Express 2005;13:6296e304.
[21] Pfeiffer F, Weitkamp T, Bunk O, David C. Phase retrieval and differentialphase-contrast imaging with low-brilliance x-ray sources. Nat Phys 2006;2:258e61.
[22] Pfeiffer F, Kottler C, Bunk O, David C. Hard x-ray phase tomography with low-brilliance sources. Phys Rev Lett 2007;98:108105.
[23] Pfeiffer F, Bech M, Bunk O, Kraft P, Eikenberry EF, Brönnimann C, et al. Hard-X-ray dark-field imaging using a grating interferometer. Nat Mater 2008;7:134e7.
[24] Bech M, Jensen TH, Feidenhans’l R, Bunk O, David C, Pfeiffer F. Soft-tissuephase-contrast tomography with an x-ray tube source. Phys Med Biol2009;54:2747e53.
[25] Donath T, Pfeiffer F, Bunk O, Grüzweig C, Hempel E, Popescu S, et al. Towardclinical x-ray phase-contrast ct demonstration of enhanced soft-tissuecontrast in human specimen. Invest Radiol 2010;45:445e52.
[26] Qi ZH, Theriault-Lauzier P, Bevins N, Zambelli J, Li K, Chen GH. Helical x-raydifferential phase contrast computed tomography. Proc SPIE 2011;7961:79611Q.
[27] Li J, Zhu PP, Sun Y. An approximate reconstruction method for helical cone-beam differential phase-contrast computed tomography images. Phys MedBiol 2012;57:2347e56.
[28] Parker DL. Optimal short scan convolution reconstruction for fan-beam CT.Med Phys 1982;9:254e7.
[29] Zanette I, Bech M, Pfeiffer F, Weitkamp T. Appl Phys Lett 2011;98:094101.[30] Zanette I, Bech M, Rack A, Duc GL, Tafforeau P, David C. Trimodal low-dose X-
ray tomography. Proc Natl Acad Sci U S A 2012;109:10199e204.[31] Tapfer A, Braren R, Bech M, Willner M, Zanette I, Weitkamp T, et al. X-Ray
phase-contrast CT of a pancreatic ductal adenocarcinoma mouse model. PLoSONE 2013;8:e58439. http://dx.doi.org/10.1371/journal.pone.0058439.
[32] Konstantinidis AC, Szafraniec MB, Speller RD, Olivo A. The Dexela 2923 CMOSX-ray detector: a flat panel detector based on CMOS active pixel sensors formedical imaging applications. Nucl Instrum Methods Phys Res A 2012;689:12e21.
Related Documents


