HEDGE FUND OWNERSHIP REPORT – Q3 2019 A REPORT COVERING HEDGE FUND STOCK OWNERSHIP TRENDS AND INDIVIDUAL MANAGER PORTFOLIOS ENTER WHALEWISDOM

Welcome message from author
This document is posted to help you gain knowledge. Please leave a comment to let me know what you think about it! Share it to your friends and learn new things together.
Transcript
HEDGE FUND OWNERSHIP REPORT – Q3 2019A REPORT COVERING HEDGE FUND STOCK OWNERSHIP TRENDS AND INDIVIDUAL MANAGER PORTFOLIOS
ENTER
WHALEWISDOM

BACKCONTENTS FORWARD 1
WHALEWISDOM
INTRODUCTION TO WHALEWISDOM
Managers with more than $100 million in assets
under management are required to disclose their
holdings to the SEC each quarter via 13F filings.
These filings are due 45 days after the quarter
end date. For Q3 2019 that means managers must
disclose all qualifying assets held on September
30th, 2019 by November 14th, 2019. Qualifying
assets include long positions in US equities
and ADRs, call/put options, and convertible
debt securities. Shorts, cash positions, foreign
investments and other assets are not included.
Investors can take advantage of these 13F filings
to create portfolios from managers that have
proven past success. Despite the 45-day delay
in reporting, research has shown that investing
alongside a single manager or group of managers
can outperform the market. The key is to identify
the best and most consistent funds to copy.
So what is the best way to identify funds whose
13F portfolio has the best chance of success?
Start by backtesting. Using WhaleWisdom’s
custom backtester engine, you can find out what
your return would have been if you had copied
the top holdings reported each quarter in a
fund’s 13F filing. Getting backtested performance
numbers is just the first step though. Once you
have a manager’s past performance, you need
to adjust the returns for risk against a known
benchmark. But how far back in time should you
look and which risk-adjusted metrics offer the
best insight into how the fund might perform in
the future? Are factors such as turnover rate or
percent concentration in top holdings important
to consider?
To help take the guesswork out of fund
selection, I’ve come up with a scoring system
called the WhaleScore. The WhaleScore lets
you quickly identify which funds tend to make
good candidates for replicating and whose past
performance indicates a consistent track record
of outperforming the market. The best of the
WhaleScore filers are brought together into the
WhaleIndex.
WhaleScores and the WhaleIndex are typically
updated 1-3 days after the 13F filing deadline.
Premium subscribers have access to these
changes as soon as they are ready. For this past
quarter, updates were completed and made
available to subscribers on November 16th, 2019.
For more information on how to subscribe
BACKGROUNDPURPOSE OF THIS REPORT
This report summarizes the latest
moves in the WhaleIndex® for the
most recent 13F filing quarter ending
September 30th, 2019. Here you’ll
find the latest data and trends on the
best performing hedge funds’ 13F
equity holdings. Comprised of the
100 highest conviction stocks from
the top scoring hedge funds, the
WhaleIndex is an indicator of where
the smart money is going and how
well it is performing. The purpose
of the WhaleIndex is simple: try to
outperform the market by imitating
the world’s best investors.
Daniel Collins -
Owner/Founder
WhaleWisdom.com
Report Data compiled as of
November 26th, 2019.
BACKCONTENTS FORWARD 2
WHALEWISDOM
CONTENTS OF REPORT
1 INTRODUCTION
3 WHALEINDEX
4 WHALE 20 OMEGA
5 WHALE 20 CONSERVATIVE
6 TOP 25 WHALESCORES
7 WHALEINDEX SECTOR BREAKDOWN OVER TIME
8 TOP 50 AGGREGATE
10 TOP 10 BUYS AND SELLS
11 TOP 25 COMMUNICATIONS
12 TOP 25 CONSUMER DISCRETIONARY
13 TOP 25 CONSUMER STAPLES
14 TOP 25 ENERGY
15 TOP 25 FINANCIALS
16 TOP 25 HEALTH CARE
17 TOP 25 INDUSTRIALS
18 TOP 25 INFORMATION TECHNOLOGY
19 TOP 25 MATERIALS
20 TOP 25 REAL ESTATE
21 TOP 25 TRANSPORTS
22 TOP 25 UTILITIES & TELECOMMUNICATIONS
23 ABOUT WHALEWISDOM
24 DISCLAIMER
PAGE

BACKCONTENTS FORWARD 3
WHALEWISDOM
WHALEINDEX
SECURITIES ADDED
Palo Alto Networks Inc. PANW
Liberty Broadband Corp Class C LBRDK
Ferrari N.V. RACE
Fidelity National Information Services Inc. FIS
Activision Blizzard Inc. ATVI
Electronic Arts, Inc. EA
ANSYS, Inc. ANSS
Liberty Global plc Class C LBTYK
RealPage Inc. RP
Broadcom Ltd. (Avago Technologies) AVGO
Illumina Inc. ILMN
FactSet Research Systems Inc. FDS
Wix.com Ltd WIX
Symantec Corp. SYMC
Dynatrace Inc. DT
Veeva Systems Inc. VEEV
Anaplan Inc. PLAN
Cognex Corp. CGNX
FireEye Inc. FEYE
Taiwan Semiconductor Manufacturing Co TSM
eHealth Inc. EHTH
Berkshire Hathaway Inc Class B BRK.B
Verra Mobility Corp. VRRM
Charles Schwab Corp. SCHW
Booking Holdings Inc. (Priceline) BKNG
TAL Education Group TAL
SECURITIES DROPPED
Tableau Software Inc. DATA
Herbalife Nutrition Ltd HLF
Yelp Inc. YELP
Splunk Inc. SPLK
World Acceptance Corp. WRLD
Snap Inc Class A SNAP
Walt Disney Co. (The) DIS
Copart Inc. CPRT
Zillow Group Inc Class C Z
MicroStrategy Inc. MSTR
Axon Enterprise Inc. AAXN
Brightcove Inc. BCOV
Yandex N.V. YNDX
Marvell Technology Group Ltd MRVL
Veracyte Inc. VCYT
Ceridian HCM Holding Inc. CDAY
SVMK Inc. SVMK
Xilinx, Inc. XLNX
Sonos Inc. SONO
Altaba Inc. (Yahoo) AABA
Trupanion Inc. TRUP
Nielsen N.V. NLSN
Ally Financial Inc. ALLY
Appian Corp. APPN
Kratos Defense & Security Solutions Inc. KTOS
Frontdoor Inc. FTDR
Rebalancing on November 16th, 2019
Performance #’s (as of Nov 26th, 2019) YTD 1 year 3 year 5 year Inception Annualized Std. Dev. Alpha
WhaleIndex 27.69 22.97 52.3 74.32 369.23 11.82 18.6 1.68
Benchmark Total Return 27.29 19.61 50.3 67.98 226.91 8.94 14.2

BACKCONTENTS FORWARD 4
WHALEWISDOM
WHALE 20 OMEGA
Performance #’s (as of Nov 26th, 2019) YTD 1 year 3 year 5 year Inception Annualized Std. Dev. Alpha
Whale 20 Omega 36.8 26.3 71.5 137.43 679.17 16 27.01 5.83
Benchmark Total Return 27.29 19.61 50.3 67.98 226.91 8.94 14.2
Rebalancing on November 16th, 2019
SECURITIES ADDED
Acadia Pharmaceuticals Inc. ACAD
MyoKardia Inc. MYOK
Argenx SE ADS ADR ARGX
Zuora Inc. ZUO
CRISPR Therapeutics AG CRSP
Nutanix Inc. NTNX
Spark Therapeutics Inc. ONCE
SECURITIES DROPPED
Biohaven Pharmaceutical Holding Co Ltd BHVN
Dicerna Pharmaceuticals Inc. DRNA
Veracyte Inc. VCYT
Immunomedics Inc. IMMU
Zogenix Inc. ZGNX
Rocket Pharmaceuticals Inc. RCKT
Kura Oncology Inc. KURA
The Whale 20 Omega portfolio represents the top 20 holdings of the WhaleIndex with a focus on maximizing Alpha. This portfolio will be more
aggressive with higher turnover and risk compared to the other portfolio offerings. The portfolio is equally weighted and rebalanced quarterly
46 days after the end of each quarter. The top 30 filers by Omega ratio whose WhaleScore beats the S&P WhaleScore are used each quarter.

BACKCONTENTS FORWARD 5
WHALEWISDOM
WHALE 20 CONSERVATIVE
The Whale 20 Conservative portfolio represents the top 20 holdings of the WhaleIndex with a focus on reducing turnover by not replacing
stocks that remain in the top 50 holdings of the WhaleIndex. Once a stock falls out of the top 50 holdings of the WhaleIndex it is replaced with
the most popular stock not currently in the portfolio. The portfolio is equally weighted and rebalanced quarterly 46 days after the end of each
quarter. The top 30 filers by Calmar and Sortino ratios whose WhaleScore beats the S&P WhaleScore are used.
Performance #’s (as of Nov 26th, 2019) YTD 1 year 3 year 5 year Inception Annualized Std. Dev. Alpha
Whale 20 Conservative 30.05 26.92 69.45 84.76 420.68 12.67 15.57 4.03
Benchmark Total Return 27.29 19.61 50.3 67.98 226.91 8.94 14.2
Rebalancing on November 16th, 2019
SECURITIES ADDED
UnitedHealth Group Inc. UNH
Bank of America Corp. (North Carolina National Bank) BAC
FIserv Inc. FISV
SECURITIES DROPPED
Booking Holdings Inc. (Priceline) BKNG
IQVIA Holdings Inc. IQV
Intuitive Surgical Inc. ISRG

BACKCONTENTS FORWARD 6
WHALEWISDOM
TOP 25 WHALESCORES
Rank Whale Name Equal Weighted Equal Weighted One Year Portfolio Top 20 Holdings WhaleScore Average WhaleScore Market Value % of Portfolio
1 ABDIEL CAPITAL ADVISORS, LP 100 99 $1.63 Billion 100.00%
2 OBERNDORF WILLIAM E 99 99 $185 Million 100.00%
3 LANNEBO FONDER AB 98 95 $329 Million 96.88%
4 OWNERSHIP CAPITAL B.V. 98 94 $2.16 Billion 97.29%
5 GRANITE INVESTMENT PARTNERS, LLC 98 95 $1.93 Billion 27.76%
6 ARCHON CAPITAL MANAGEMENT LLC 98 95 $424 Million 95.72%
7 HMI CAPITAL, LLC 97 95 $806 Million 100.00%
8 SCGE MANAGEMENT, L.P. 97 95 $1.98 Billion 99.07%
9 NIGHT OWL CAPITAL MANAGEMENT, LLC 97 93 $315 Million 97.97%
10 CROSSLINK CAPITAL INC 97 95 $386 Million 98.44%
11 WINDACRE PARTNERSHIP LLC 96 93 $2 Billion 100.00%
12 ECHINUS ADVISORS, LLC 96 93 $1.16 Billion 100.00%
13 AO ASSET MANAGEMENT, LP 96 94 $1.02 Billion 72.52%
14 FIRST LIGHT ASSET MANAGEMENT, LLC 96 97 $662 Million 74.35%
15 HAMILTON LANE ADVISORS LLC 96 92 $239 Million 90.68%
16 ALTIMETER CAPITAL MANAGEMENT, LP 96 97 $4.1 Billion 99.21%
17 KAYNE ANDERSON RUDNICK INVESTMENT MANAGEMENT LLC 96 94 $19.2 Billion 45.57%
18 BRANDYWINE MANAGERS, LLC 96 95 $299 Million 97.18%
19 FOXHAVEN ASSET MANAGEMENT, LP 95 90 $2.47 Billion 94.36%
20 CRESTWOOD CAPITAL MANAGEMENT, L.P. 95 89 $179 Million 98.66%
21 ROCK POINT ADVISORS, LLC 95 89 $221 Million 76.81%
22 GRANAHAN INVESTMENT MANAGEMENT INC 95 96 $1.82 Billion 48.74%
23 GLYNN CAPITAL MANAGEMENT LLC 95 94 $547 Million 93.21%
24 CLARIUS GROUP, LLC 94 93 $545 Million 66.87%
25 ALTA PARK CAPITAL, LP 94 96 $244 Million 99.03%

BACKCONTENTS FORWARD 7
WHALEWISDOM
WHALEINDEX SECTOR BREAKDOWN OVER TIME
The weightings for each sector of the WhaleIndex 100 for the past 6 quarters.
0
20
40
60
80
100 UTILITIES & TELECOMMUNICATIONS
TRANSPORTS
REAL ESTATE
MATERIALS
INFORMATION TECHNOLOGY
INDUSTRIALS
HEALTH CARE
FINANCIALS
ENERGY
CONSUMER STAPLES
CONSUMER DISCRETIONARY
COMMUNICATIONSQ3 2019Q2 2019Q1 2019Q4 2018Q3 2018Q2 2018

BACKCONTENTS FORWARD 8
WHALEWISDOM
Ran
k
Se
cu
rity
Nam
e
Sym
bo
l
Valu
e O
wn
ed
Sh
are
s O
wn
ed
Q/Q
Ch
an
ge
in
Sh
are
s
% o
f S
tock
Ow
ne
rsh
ip
# o
f O
wn
ers
New
Ow
ne
rs
Bu
ys
Se
lls
Ho
lds
Exit
s
# o
f O
wn
ers
h
old
ing
in
to
p 1
0
1 Microsoft Corp. MSFT $3.37 Billion 24.2 Million 667 Thousand 0.32% 41 3 16 15 7 0 25
2 Amazon.com Inc. AMZN $10.6 Billion 6.12 Million 62.9 Thousand 1.24% 41 1 16 17 7 2 26
3 Facebook Inc. FB $5.08 Billion 28.5 Million 899 Thousand 1.00% 36 1 13 14 8 2 17
4 Alphabet Inc. Class C GOOG $5.57 Billion 4.57 Million 407 Thousand 0.66% 33 3 14 11 5 0 12
5 VISA Inc. V $2.57 Billion 14.9 Million -181 Thousand 0.75% 32 1 14 11 6 2 16
6 Mastercard Inc. MA $2.75 Billion 10.1 Million -251 Thousand 1.00% 28 1 11 11 5 1 12
7 Alphabet Inc. Class A GOOGL $1.1 Billion 903 Thousand 256 Thousand 0.13% 27 3 11 11 2 2 9
8 Netflix Inc. NFLX $3 Billion 11.2 Million -1.13 Million 2.56% 26 0 9 14 3 6 8
9 Salesforce.com Inc. CRM $2.88 Billion 19.4 Million 8.05 Million 2.50% 25 5 12 6 2 2 8
10 Apple Inc. AAPL $705 Million 3.15 Million 203 Thousand 0.07% 24 1 9 9 5 1 11
11 Twilio Inc. TWLO $1.69 Billion 15.4 Million 2.09 Million 11.34% 22 1 11 8 2 0 10
12 Alibaba Group Holding Ltd ADR BABA $9.41 Billion 56.3 Million 1.83 Million 2.21% 22 1 10 9 2 1 13
13 Okta Inc. OKTA $606 Million 6.16 Million -402 Thousand 5.39% 21 3 6 7 5 4 3
14 ServiceNow Inc. NOW $891 Million 3.51 Million 297 Thousand 1.87% 21 2 13 3 3 1 7
15 Adobe Systems, Inc. ADBE $583 Million 2.11 Million 548 Thousand 0.43% 20 3 9 2 6 0 6
16 PayPal Holdings Inc. PYPL $452 Million 4.37 Million -1.64 Million 0.37% 20 0 8 10 2 2 4
17 Workday Inc. WDAY $1.32 Billion 7.76 Million 573 Thousand 3.43% 19 2 7 6 4 1 4
18 Johnson & Johnson Co. JNJ $161 Million 1.25 Million 201 Thousand 0.05% 19 1 7 7 4 1 2
19 Berkshire Hathaway Inc. Class B BRK.B $86.9 Million 418 Thousand 76.1 Thousand 0.02% 18 0 6 2 10 0 0
20 MercadoLibre Inc. MELI $4.12 Billion 7.47 Million -153 Thousand 15.02% 18 1 6 10 1 0 7
21 AbbVie Inc. ABBV $110 Million 1.46 Million -515 Thousand 0.10% 17 0 5 5 7 0 3
22 Shopify Inc. SHOP $3.12 Billion 10 Million -258 Thousand 8.89% 17 3 4 6 4 0 8
23 Charter Communications Inc. CHTR $1.72 Billion 4.16 Million 335 Thousand 1.88% 17 2 5 7 3 1 9
24 TransDigm Group Inc. TDG $1.85 Billion 3.55 Million -606 Thousand 6.65% 17 3 4 9 1 0 7
25 Square Inc. SQ $384 Million 6.2 Million -965 Thousand 1.45% 16 2 8 4 2 4 4
TOP 50 AGGREGATE (1–25) Compiled from top 100 WhaleScore Funds
26–50 Aggregate on following page

BACKCONTENTS FORWARD 9
WHALEWISDOM
Ran
k
Se
cu
rity
Nam
e
Sym
bo
l
Valu
e O
wn
ed
Sh
are
s O
wn
ed
Q/Q
Ch
an
ge
in
Sh
are
s
% o
f S
tock
Ow
ne
rsh
ip
# o
f O
wn
ers
New
Ow
ne
rs
Bu
ys
Se
lls
Ho
lds
Exit
s
# o
f O
wn
ers
h
old
ing
in
to
p 1
0
26 Coca Cola Co. KO $482 Million 8.85 Million 225 Thousand 0.21% 16 1 5 4 6 0 2
27 Merck & Co. MRK $97.2 Million 1.15 Million 103 Thousand 0.05% 16 1 6 2 7 0 0
28 JPMorgan Chase & Co. (Chemical Bank) JPM $193 Million 1.64 Million 448 Thousand 0.05% 16 1 7 3 5 1 3
29 Home Depot, Inc. (The) HD $331 Million 1.43 Million -103 Thousand 0.13% 16 1 6 6 3 0 3
30 Elastic NV ESTC $554 Million 6.73 Million 3.49 Million 8.93% 16 4 6 4 2 1 4
31 NVIDIA Corp. NVDA $1.52 Billion 8.76 Million -1.36 Million 1.44% 15 2 4 7 2 1 1
32 Comcast Corp. Class A CMCSA $539 Million 12 Million 1.38 Million 0.26% 15 0 6 7 2 0 3
33 Illumina Inc. ILMN $5.48 Billion 18 Million 459 Thousand 12.24% 15 0 8 4 3 1 1
34 Coupa Software Inc. COUP $1.02 Billion 7.84 Million -259 Thousand 12.70% 15 2 3 8 2 0 5
35 Walt Disney Co. (The) DIS $255 Million 1.95 Million -528 Thousand 0.11% 15 1 6 5 3 2 2
36 Danaher Corp. DHR $213 Million 1.47 Million 165 Thousand 0.21% 15 1 5 9 0 2 2
37 Pfizer, Inc. PFE $45 Million 1.25 Million 403 Thousand 0.02% 14 2 5 2 5 1 0
38 Fidelity National Information Services Inc. FIS $499 Million 3.76 Million 3.56 Million 0.61% 14 9 3 2 0 1 3
39 Five9 Inc. FIVN $418 Million 7.79 Million 1.57 Million 12.84% 14 3 5 4 2 0 5
40 Zendesk Inc. ZEN $364 Million 5 Million 317 Thousand 4.50% 14 2 6 3 3 0 3
41 Datadog Inc. DDOG $309 Million 9.1 Million 9.1 Million 0.03% 14 14 0 0 0 0 1
42 FIserv Inc. FISV $274 Million 2.64 Million 1.18 Million 0.67% 14 5 6 3 0 0 3
43 NIKE Inc. NKE $249 Million 2.66 Million 593 Thousand 0.17% 14 1 7 5 1 1 1
44 Procter & Gamble Co. (OH) (1905) PG $173 Million 1.39 Million 67 Thousand 0.06% 14 2 7 1 4 2 0
45 Moodys Corp. MCO $2.16 Billion 10.5 Million 126 Thousand 5.57% 14 0 7 6 1 1 5
46 Intel Corp. INTC $233 Million 4.52 Million 716 Thousand 0.10% 14 1 4 4 5 0 1
47 Chevron Corp. (Standard Oil of California) CVX $136 Million 1.15 Million 364 Thousand 0.06% 14 0 7 4 3 0 0
48 Activision Blizzard Inc. ATVI $405 Million 7.66 Million 3.33 Million 1.00% 14 3 5 4 2 0 3
49 ExxonMobil Corp. (Standard Oil of New Jersey) XOM $62.1 Million 880 Thousand 108 Thousand 0.02% 13 2 5 5 1 0 0
50 Palo Alto Networks Inc. PANW $243 Million 1.19 Million 37.5 Thousand 1.24% 13 2 4 3 4 1 4
TOP 50 AGGREGATE (26–50) Compiled from top 100 WhaleScore Funds

BACKCONTENTS FORWARD 10
WHALEWISDOM
Ran
k
Se
cu
rity
Nam
e
Sym
bo
l
Valu
e O
wn
ed
Sh
are
s O
wn
ed
Q/Q
Ch
an
ge
in
Sh
are
s
% o
f S
tock
Ow
ne
rsh
ip
# o
f O
wn
ers
New
Ow
ne
rs
Bu
ys
Se
lls
Ho
lds
Exit
s
# o
f O
wn
ers
h
old
ing
in
to
p 1
0
1 Microsoft Corp. MSFT $3.37 Billion 24.2 Million 667 Thousand 0.32% 41 3 16 15 7 0 25
2 Salesforce.com Inc. CRM $2.88 Billion 19.4 Million 8.05 Million 2.50% 25 5 12 6 2 2 8
3 Alphabet Inc. Class C GOOG $5.57 Billion 4.57 Million 407 Thousand 0.66% 33 3 14 11 5 0 12
4 Amazon.com Inc. AMZN $10.6 Billion 6.12 Million 62.9 Thousand 1.24% 41 1 16 17 7 2 26
5 VISA Inc. V $2.57 Billion 14.9 Million -181 Thousand 0.75% 32 1 14 11 6 2 16
6 ServiceNow Inc. NOW $891 Million 3.51 Million 297 Thousand 1.87% 21 2 13 3 3 1 7
7 Facebook Inc. FB $5.08 Billion 28.5 Million 899 Thousand 1.00% 36 1 13 14 8 2 17
8 Datadog Inc. DDOG $309 Million 9.1 Million 9.1 Million 0.03% 14 14 0 0 0 0 1
9 Alphabet Inc. Class A GOOGL $1.1 Billion 903 Thousand 256 Thousand 0.13% 27 3 11 11 2 2 9
10 Twilio Inc. TWLO $1.69 Billion 15.4 Million 2.09 Million 11.34% 22 1 11 8 2 0 10
Ran
k
Se
cu
rity
Nam
e
Sym
bo
l
Valu
e O
wn
ed
Sh
are
s O
wn
ed
Q/Q
Ch
an
ge
in
Sh
are
s
% o
f S
tock
Ow
ne
rsh
ip
# o
f O
wn
ers
New
Ow
ne
rs
Bu
ys
Se
lls
Ho
lds
Exit
s
# o
f O
wn
ers
h
old
ing
in
to
p 1
0
1 Netflix Inc. NFLX $3 Billion 11.2 Million -1.13 Million 2.56% 26 0 9 14 3 6 8
2 Amazon.com Inc. AMZN $10.6 Billion 6.12 Million 62.9 Thousand 1.24% 41 1 16 17 7 2 26
3 Facebook Inc. FB $5.08 Billion 28.5 Million 899 Thousand 1.00% 36 1 13 14 8 2 17
4 Microsoft Corp. MSFT $3.37 Billion 24.2 Million 667 Thousand 0.32% 41 3 16 15 7 0 25
5 VISA Inc. V $2.57 Billion 14.9 Million -181 Thousand 0.75% 32 1 14 11 6 2 16
6 Alphabet Inc. Class A GOOGL $1.1 Billion 903 Thousand 256 Thousand 0.13% 27 3 11 11 2 2 9
7 PayPal Holdings Inc. PYPL $452 Million 4.37 Million -1.64 Million 0.37% 20 0 8 10 2 2 4
8 Mastercard Inc. MA $2.75 Billion 10.1 Million -251 Thousand 1.00% 28 1 11 11 5 1 12
9 Alphabet Inc. Class C GOOG $5.57 Billion 4.57 Million 407 Thousand 0.66% 33 3 14 11 5 0 12
10 Danaher Corp. DHR $213 Million 1.47 Million 165 Thousand 0.21% 15 1 5 9 0 2 2
TOP 10 BUYS AND SELLS Compiled from top 100 WhaleScore Funds
TOP 10 PURCHASES
TOP 10 SELLS

BACKCONTENTS FORWARD 11
WHALEWISDOM
Ran
k
Se
cu
rity
Nam
e
Sym
bo
l
Valu
e O
wn
ed
Sh
are
s O
wn
ed
Q/Q
Ch
an
ge
in
Sh
are
s
% o
f S
tock
Ow
ne
rsh
ip
# o
f O
wn
ers
New
Ow
ne
rs
Bu
ys
Se
lls
Ho
lds
Exit
s
# o
f O
wn
ers
h
old
ing
in
to
p 1
0
1 Facebook Inc. FB $5.08 Billion 28.5 Million 899 Thousand 1.00% 36 1 13 14 8 2 17
2 Alphabet Inc. Class C GOOG $5.57 Billion 4.57 Million 407 Thousand 0.66% 33 3 14 11 5 0 12
3 Alphabet Inc. Class A GOOGL $1.1 Billion 903 Thousand 256 Thousand 0.13% 27 3 11 11 2 2 9
4 Netflix Inc. NFLX $3 Billion 11.2 Million -1.13 Million 2.56% 26 0 9 14 3 6 8
5 Alibaba Group Holding Ltd ADR BABA $9.41 Billion 56.3 Million 1.83 Million 2.21% 22 1 10 9 2 1 13
6 PayPal Holdings Inc. PYPL $452 Million 4.37 Million -1.64 Million 0.37% 20 0 8 10 2 2 4
7 Workday Inc. WDAY $1.32 Billion 7.76 Million 573 Thousand 3.43% 19 2 7 6 4 1 4
8 MercadoLibre Inc. MELI $4.12 Billion 7.47 Million -153 Thousand 15.02% 18 1 6 10 1 0 7
9 Charter Communications Inc. CHTR $1.72 Billion 4.16 Million 335 Thousand 1.88% 17 2 5 7 3 1 9
10 Shopify Inc. SHOP $3.12 Billion 10 Million -258 Thousand 8.89% 17 3 4 6 4 0 8
11 Comcast Corp. Class A CMCSA $539 Million 12 Million 1.38 Million 0.26% 15 0 6 7 2 0 3
12 Walt Disney Co. (The) DIS $255 Million 1.95 Million -528 Thousand 0.11% 15 1 6 5 3 2 2
13 Spotify Technology SA SPOT $2.42 Billion 21.2 Million 135 Thousand 11.71% 11 1 7 3 0 3 3
14 S&P Global Inc. (McGraw-Hill Inc.) SPGI $220 Million 900 Thousand -465 Thousand 0.37% 11 0 3 7 1 0 1
15 Wix.com Ltd WIX $437 Million 3.74 Million 178 Thousand 7.51% 10 0 6 1 3 1 2
16 GoDaddy Inc. GDDY $258 Million 3.9 Million 1.22 Million 2.19% 9 2 4 2 1 0 0
17 Match Group Inc. MTCH $382 Million 5.35 Million 2.08 Million 1.90% 8 2 3 2 1 0 3
18 Twitter Inc. TWTR $292 Million 7.1 Million -394 Thousand 0.92% 8 2 2 3 1 1 2
19 The Trade Desk Inc. Class A TTD $633 Million 3.38 Million 173 Thousand 7.51% 8 1 3 3 1 1 1
20 Yandex N.V. YNDX $266 Million 7.59 Million 2.31 Million 2.34% 7 1 3 2 1 1 3
21 Zillow Group Inc. Class B ZG $191 Million 6.47 Million 2.81 Million 11.02% 7 0 3 1 3 0 1
22 Zillow Group Inc. Class C Z $521 Million 17.5 Million -334 Thousand 12.31% 7 1 2 4 0 1 1
23 New York Times Co. Class A NYT $388 Million 13.6 Million 501 Thousand 8.21% 6 0 4 1 1 1 3
24 Nielsen N.V. NLSN $405 Million 19 Million -4.89 Million 5.35% 6 1 1 4 0 0 2
25 Brightcove Inc. BCOV $64.4 Million 6.14 Million -1.05 Million 16.05% 6 0 2 2 2 0 2
TOP 25 COMMUNICATIONS
BACKCONTENTS FORWARD 12
WHALEWISDOM
Ran
k
Se
cu
rity
Nam
e
Sym
bo
l
Valu
e O
wn
ed
Sh
are
s O
wn
ed
Q/Q
Ch
an
ge
in
Sh
are
s
% o
f S
tock
Ow
ne
rsh
ip
# o
f O
wn
ers
New
Ow
ne
rs
Bu
ys
Se
lls
Ho
lds
Exit
s
# o
f O
wn
ers
h
old
ing
in
to
p 1
0
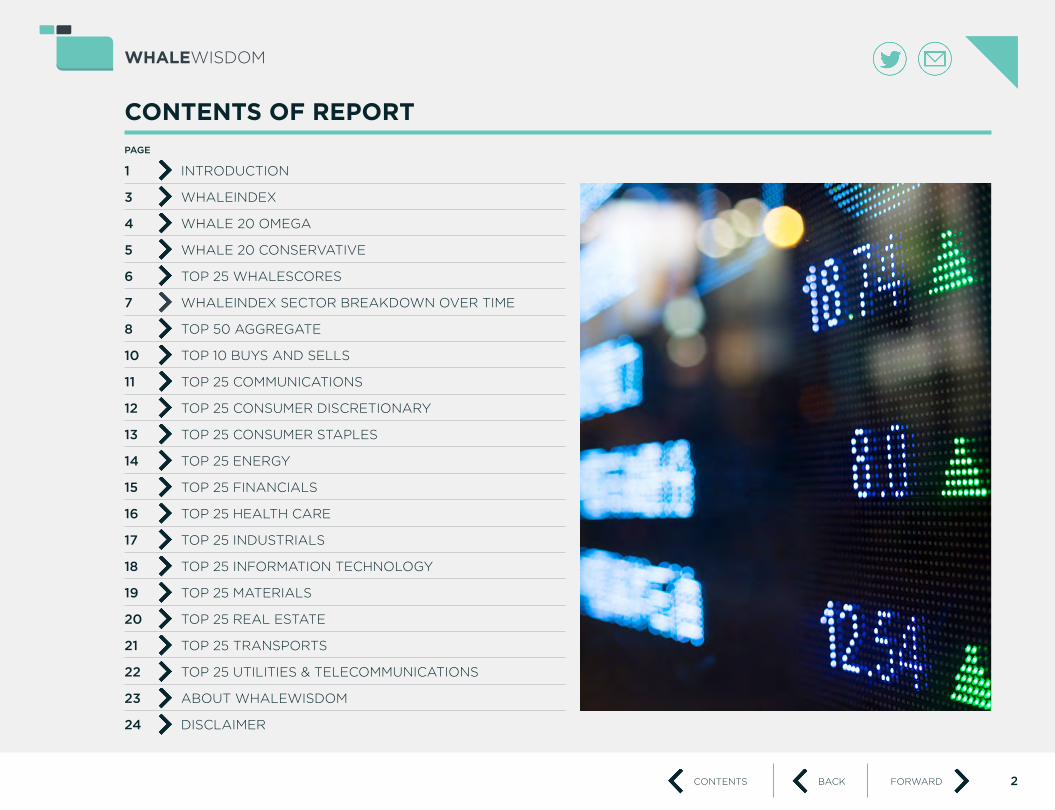
1 Amazon.com Inc. AMZN $10.6 Billion 6.12 Million 62.9 Thousand 1.24% 41 1 16 17 7 2 26
2 Home Depot, Inc. (The) HD $331 Million 1.43 Million -103 Thousand 0.13% 16 1 6 6 3 0 3
3 NIKE Inc. NKE $249 Million 2.66 Million 593 Thousand 0.17% 14 1 7 5 1 1 1
4 Uber Technologies Inc. UBER $1.44 Billion 47.1 Million 4.74 Million 2.77% 12 1 3 2 6 6 4
5 Booking Holdings Inc. (Priceline) BKNG $820 Million 418 Thousand 21 Thousand 0.85% 11 0 6 3 2 0 3
6 Pinduoduo Inc. PDD $1.2 Billion 37.3 Million 18.1 Million 3.35% 11 4 5 0 2 0 3
7 Wayfair Inc. Class A W $1.25 Billion 11.2 Million 755 Thousand 12.08% 10 1 3 4 2 1 5
8 TJX Companies Inc. TJX $349 Million 6.25 Million 1.63 Million 0.52% 9 1 7 1 0 0 2
9 Chegg Inc. CHGG $668 Million 22.3 Million -136 Thousand 18.65% 9 1 4 4 0 0 3
10 Lyft Inc. LYFT $321 Million 7.85 Million 2.76 Million 2.68% 9 1 5 2 1 2 1
11 Hilton Worldwide Holdings Inc. HLT $226 Million 2.42 Million 882 Thousand 0.84% 9 1 3 4 1 0 1
12 McDonalds Corp. MCD $119 Million 556 Thousand -175 Thousand 0.07% 9 0 3 4 2 1 1
13 Yum! Brands, Inc. (Tricon Global Restaurants) YUM $72.4 Million 638 Thousand 98.2 Thousand 0.21% 9 3 2 3 1 1 0
14 Target Corp. TGT $36.7 Million 343 Thousand -321 Thousand 0.07% 9 1 3 2 3 1 0
15 CarGurus Inc. CARG $405 Million 13.1 Million 2.84 Million 9.89% 8 1 2 3 2 1 5
16 Lowes Companies, Inc. LOW $199 Million 1.81 Million 191 Thousand 0.23% 8 0 4 2 2 0 1
17 Starbucks Corp. SBUX $156 Million 1.76 Million 76 Thousand 0.15% 8 1 3 3 1 0 1
18 eBay Inc. EBAY $46.9 Million 1.2 Million -336 Thousand 0.14% 8 0 3 1 4 1 1
19 V.F. Corp. (Vanity Fair Mills Inc.) VFC $61.2 Million 688 Thousand -214 Thousand 0.17% 8 0 5 3 0 0 0
20 Carvana Co. CVNA $747 Million 11.3 Million 1.39 Million 7.48% 7 2 3 1 1 1 3
21 Farfetch Ltd FTCH $214 Million 24.8 Million 8.33 Million 8.27% 7 1 4 1 1 3 1
22 Ross Stores Inc. (DE) ROST $321 Million 2.92 Million 13.6 Thousand 0.80% 7 0 3 3 1 1 1
23 OReilly Automotive Inc. ORLY $108 Million 271 Thousand -213 Thousand 0.35% 7 0 4 2 1 0 1
24 Norwegian Cruise Line Holdings Ltd NCLH $66.8 Million 1.29 Million 158 Thousand 0.60% 7 1 5 1 0 0 0
25 Chipotle Mexican Grill, Inc. CMG $511 Million 608 Thousand 15.7 Thousand 2.19% 7 0 3 3 1 3 1
TOP 25 CONSUMER DISCRETIONARY

BACKCONTENTS FORWARD 13
WHALEWISDOM
Ran
k
Se
cu
rity
Nam
e
Sym
bo
l
Valu
e O
wn
ed
Sh
are
s O
wn
ed
Q/Q
Ch
an
ge
in
Sh
are
s
% o
f S
tock
Ow
ne
rsh
ip
# o
f O
wn
ers
New
Ow
ne
rs
Bu
ys
Se
lls
Ho
lds
Exit
s
# o
f O
wn
ers
h
old
ing
in
to
p 1
0
1 Coca Cola Co. KO $482 Million 8.85 Million 225 Thousand 0.21% 16 1 5 4 6 0 2
2 Procter & Gamble Co. (OH) (1905) PG $173 Million 1.39 Million 67 Thousand 0.06% 14 2 7 1 4 2 0
3 Costco Co. COST $161 Million 558 Thousand 201 Thousand 0.13% 13 1 7 4 1 0 1
4 Estee Lauder Companies Inc. EL $209 Million 1.05 Million 511 Thousand 0.29% 12 2 6 2 2 0 2
5 Philip Morris International Inc. PM $137 Million 1.8 Million 1.12 Million 0.12% 10 1 5 2 2 0 1
6 General Mills Co. GIS $21 Million 380 Thousand 58.6 Thousand 0.06% 10 1 5 2 2 0 1
7 Walmart Inc. WMT $44.7 Million 376 Thousand 22.7 Thousand 0.01% 9 1 3 3 2 0 1
8 Pepsico Inc. (Loft, Inc.) PEP $90.2 Million 658 Thousand -72.5 Thousand 0.05% 9 0 5 3 1 3 1
9 Colgate-Palmolive Co. CL $32.4 Million 441 Thousand 55.5 Thousand 0.05% 9 2 4 2 1 0 1
10 Altria Group, Inc. (Philip Morris) MO $61.7 Million 1.51 Million 941 Thousand 0.08% 8 2 3 1 2 1 1
11 Mondelez International Inc. (Kraft Foods) MDLZ $133 Million 2.4 Million -292 Thousand 0.17% 8 0 4 3 1 1 0
12 Sysco Corp. SYY $44.4 Million 559 Thousand -121 Thousand 0.11% 8 1 3 1 3 1 0
13 Walgreens Boots Alliance Inc. WBA $11.2 Million 202 Thousand -38.4 Thousand 0.02% 8 0 2 2 4 1 0
14 CVS Health Corp. (Melville Shoe) CVS $26.3 Million 416 Thousand -281 Thousand 0.03% 7 0 3 3 1 1 0
15 Constellation Brands, Inc. STZ $45.9 Million 222 Thousand 831 0.12% 5 1 1 3 0 0 1
16 Ollies Bargain Outlet Holdings Inc. OLLI $269 Million 4.58 Million 2.08 Million 7.22% 5 1 2 2 0 0 0
17 Kellogg Co. K $15.1 Million 234 Thousand -2.16 Thousand 0.07% 5 1 2 2 0 0 0
18 Church & Dwight Co., Inc. CHD $52.8 Million 702 Thousand 660 Thousand 0.28% 5 1 3 0 1 0 0
19 AmerisourceBergen Corp (Holding Co) ABC $9.37 Million 114 Thousand 40.5 Thousand 0.05% 5 2 1 2 0 0 0
20 Kimberly-Clark Corp. KMB $12.2 Million 85.8 Thousand 44.9 Thousand 0.02% 5 0 4 1 0 0 0
21 NU Skin Enterprises Inc. Class A NUS $18.6 Million 437 Thousand -12.7 Thousand 0.79% 4 1 0 2 1 0 1
22Spectrum Brands Holdings (Zapata Off-Shore - HRG Group)
SPB $30.6 Million 580 Thousand 405 Thousand 0.29% 4 3 0 0 1 0 0
23 McCormick & Co. Non-Voting Shares MKC $38 Million 243 Thousand 19.1 Thousand 0.18% 4 0 2 2 0 0 0
24 Kroger Co. KR $19.3 Million 748 Thousand 461 Thousand 0.09% 4 1 2 1 0 0 0
25 Smucker (J.M.) Co. SJM $8.7 Million 79 Thousand 8.46 Thousand 0.07% 4 1 1 2 0 0 0
TOP 25 CONSUMER STAPLES

BACKCONTENTS FORWARD 14
WHALEWISDOM
Ran
k
Se
cu
rity
Nam
e
Sym
bo
l
Valu
e O
wn
ed
Sh
are
s O
wn
ed
Q/Q
Ch
an
ge
in
Sh
are
s
% o
f S
tock
Ow
ne
rsh
ip
# o
f O
wn
ers
New
Ow
ne
rs
Bu
ys
Se
lls
Ho
lds
Exit
s
# o
f O
wn
ers
h
old
ing
in
to
p 1
0
1 Chevron Corp. (Standard Oil of California) CVX $136 Million 1.15 Million 364 Thousand 0.06% 14 0 7 4 3 0 0
2 ExxonMobil Corp. (Standard Oil of New Jersey) XOM $62.1 Million 880 Thousand 108 Thousand 0.02% 13 2 5 5 1 0 0
3 EOG Resources Inc. EOG $790 Million 10.6 Million 4.38 Million 1.83% 12 0 7 4 1 1 2
4 Schlumberger Ltd. SLB $67.6 Million 1.98 Million -108 Thousand 0.14% 12 0 4 4 4 0 1
5 ConocoPhillips (Phillips Petroleum) COP $135 Million 2.37 Million 646 Thousand 0.21% 10 2 4 4 0 0 0
6 Occidental Petroleum Corp. OXY $41 Million 923 Thousand -350 Thousand 0.12% 9 0 5 4 0 1 1
7 Halliburton Co. HAL $18.2 Million 966 Thousand 450 Thousand 0.11% 6 1 1 3 1 0 0
8 Royal Dutch Shell plc Class A ADR RDS.A $5.56 Million 94.5 Thousand 146 0.00% 6 0 1 1 4 0 0
9 Valero Energy Corp. VLO $29.9 Million 350 Thousand 225 Thousand 0.08% 6 3 2 1 0 0 0
10 Williams Cos. (The) WMB $43.3 Million 1.8 Million 1.6 Million 0.15% 5 0 3 0 2 0 0
11 Hollyfrontier Corp. HFC $14.5 Million 271 Thousand 78.1 Thousand 0.16% 5 2 0 2 1 0 0
12 Phillips 66 PSX $13.6 Million 133 Thousand -18.4 Thousand 0.03% 5 0 2 1 2 0 0
13 Enbridge, Inc. ENB $122 Million 3.49 Million 2.75 Million 0.17% 4 1 2 1 0 0 1
14 Dril-Quip, Inc. DRQ $196 Million 3.9 Million 50.2 Thousand 10.78% 4 1 1 1 1 0 0
15 Petroleo Brasileiro SA (Petrobras) ADR PBR $410 Million 28.3 Million -1.01 Million 0.43% 4 1 2 1 0 0 0
16 Apache Corp. APA $481 Million 18.8 Million -5.12 Million 5.00% 4 0 3 1 0 0 0
17 Vistra Energy Cp VST $12.9 Million 482 Thousand 310 Thousand 0.10% 4 2 2 0 0 0 0
18 Royal Dutch Shell plc Class B ADR RDS.B $20.9 Million 348 Thousand 69 Thousand 0.01% 4 1 0 1 2 0 0
19 Concho Resources Inc. CXO $32.7 Million 481 Thousand 453 Thousand 0.24% 4 1 2 1 0 0 0
20 BP Plc ADR (British Petroleum) BP $1.51 Million 39.7 Thousand 990 0.00% 4 0 1 1 2 0 0
21 Diamondback Energy Inc. FANG $6.19 Million 68.8 Thousand 42.4 Thousand 0.04% 4 1 2 1 0 0 0
22 Baker Hughes Class A BHGE $34.2 Million 1.48 Million 15.6 Thousand 0.14% 3 0 3 0 0 3 1
23 SolarEdge Technologies Inc. SEDG $19.1 Million 228 Thousand 170 Thousand 0.47% 3 1 2 0 0 1 0
24 Cheniere Energy Inc. LNG $4.01 Million 63.6 Thousand -3.94 Thousand 0.02% 3 0 2 1 0 1 0
25 Canadian Natural Resources, Ltd CNQ $25.9 Million 971 Thousand 90.9 Thousand 0.08% 3 0 1 2 0 0 0
TOP 25 ENERGY
BACKCONTENTS FORWARD 15
WHALEWISDOM
Ran
k
Se
cu
rity
Nam
e
Sym
bo
l
Valu
e O
wn
ed
Sh
are
s O
wn
ed
Q/Q
Ch
an
ge
in
Sh
are
s
% o
f S
tock
Ow
ne
rsh
ip
# o
f O
wn
ers
New
Ow
ne
rs
Bu
ys
Se
lls
Ho
lds
Exit
s
# o
f O
wn
ers
h
old
ing
in
to
p 1
0
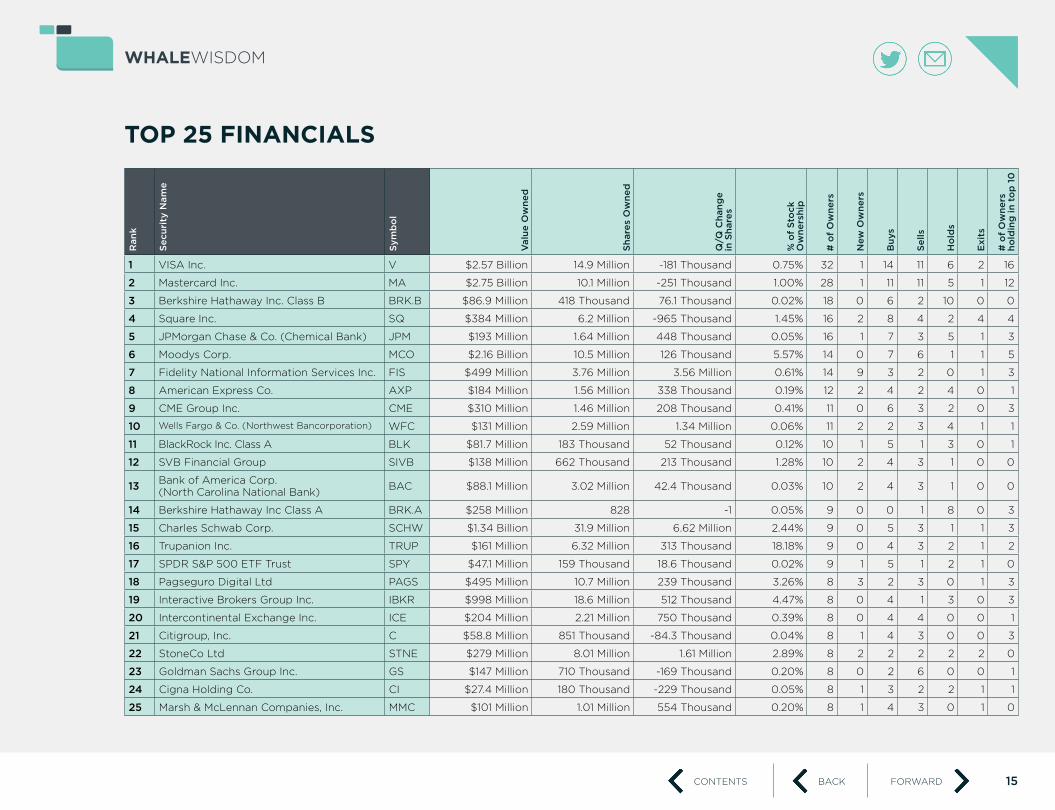
1 VISA Inc. V $2.57 Billion 14.9 Million -181 Thousand 0.75% 32 1 14 11 6 2 16
2 Mastercard Inc. MA $2.75 Billion 10.1 Million -251 Thousand 1.00% 28 1 11 11 5 1 12
3 Berkshire Hathaway Inc. Class B BRK.B $86.9 Million 418 Thousand 76.1 Thousand 0.02% 18 0 6 2 10 0 0
4 Square Inc. SQ $384 Million 6.2 Million -965 Thousand 1.45% 16 2 8 4 2 4 4
5 JPMorgan Chase & Co. (Chemical Bank) JPM $193 Million 1.64 Million 448 Thousand 0.05% 16 1 7 3 5 1 3
6 Moodys Corp. MCO $2.16 Billion 10.5 Million 126 Thousand 5.57% 14 0 7 6 1 1 5
7 Fidelity National Information Services Inc. FIS $499 Million 3.76 Million 3.56 Million 0.61% 14 9 3 2 0 1 3
8 American Express Co. AXP $184 Million 1.56 Million 338 Thousand 0.19% 12 2 4 2 4 0 1
9 CME Group Inc. CME $310 Million 1.46 Million 208 Thousand 0.41% 11 0 6 3 2 0 3
10 Wells Fargo & Co. (Northwest Bancorporation) WFC $131 Million 2.59 Million 1.34 Million 0.06% 11 2 2 3 4 1 1
11 BlackRock Inc. Class A BLK $81.7 Million 183 Thousand 52 Thousand 0.12% 10 1 5 1 3 0 1
12 SVB Financial Group SIVB $138 Million 662 Thousand 213 Thousand 1.28% 10 2 4 3 1 0 0
13Bank of America Corp. (North Carolina National Bank)
BAC $88.1 Million 3.02 Million 42.4 Thousand 0.03% 10 2 4 3 1 0 0
14 Berkshire Hathaway Inc Class A BRK.A $258 Million 828 -1 0.05% 9 0 0 1 8 0 3
15 Charles Schwab Corp. SCHW $1.34 Billion 31.9 Million 6.62 Million 2.44% 9 0 5 3 1 1 3
16 Trupanion Inc. TRUP $161 Million 6.32 Million 313 Thousand 18.18% 9 0 4 3 2 1 2
17 SPDR S&P 500 ETF Trust SPY $47.1 Million 159 Thousand 18.6 Thousand 0.02% 9 1 5 1 2 1 0
18 Pagseguro Digital Ltd PAGS $495 Million 10.7 Million 239 Thousand 3.26% 8 3 2 3 0 1 3
19 Interactive Brokers Group Inc. IBKR $998 Million 18.6 Million 512 Thousand 4.47% 8 0 4 1 3 0 3
20 Intercontinental Exchange Inc. ICE $204 Million 2.21 Million 750 Thousand 0.39% 8 0 4 4 0 0 1
21 Citigroup, Inc. C $58.8 Million 851 Thousand -84.3 Thousand 0.04% 8 1 4 3 0 0 3
22 StoneCo Ltd STNE $279 Million 8.01 Million 1.61 Million 2.89% 8 2 2 2 2 2 0
23 Goldman Sachs Group Inc. GS $147 Million 710 Thousand -169 Thousand 0.20% 8 0 2 6 0 0 1
24 Cigna Holding Co. CI $27.4 Million 180 Thousand -229 Thousand 0.05% 8 1 3 2 2 1 1
25 Marsh & McLennan Companies, Inc. MMC $101 Million 1.01 Million 554 Thousand 0.20% 8 1 4 3 0 1 0
TOP 25 FINANCIALS

BACKCONTENTS FORWARD 16
WHALEWISDOM
Ran
k
Se
cu
rity
Nam
e
Sym
bo
l
Valu
e O
wn
ed
Sh
are
s O
wn
ed
Q/Q
Ch
an
ge
in
Sh
are
s
% o
f S
tock
Ow
ne
rsh
ip
# o
f O
wn
ers
New
Ow
ne
rs
Bu
ys
Se
lls
Ho
lds
Exit
s
# o
f O
wn
ers
h
old
ing
in
to
p 1
0
1 Johnson & Johnson Co. JNJ $161 Million 1.25 Million 201 Thousand 0.05% 19 1 7 7 4 1 2
2 AbbVie Inc. ABBV $110 Million 1.46 Million -515 Thousand 0.10% 17 0 5 5 7 0 3
3 Merck & Co. MRK $97.2 Million 1.15 Million 103 Thousand 0.05% 16 1 6 2 7 0 0
4 Illumina Inc. ILMN $5.48 Billion 18 Million 459 Thousand 12.24% 15 0 8 4 3 1 1
5 Danaher Corp. DHR $213 Million 1.47 Million 165 Thousand 0.21% 15 1 5 9 0 2 2
6 Pfizer, Inc. PFE $45 Million 1.25 Million 403 Thousand 0.02% 14 2 5 2 5 1 0
7 Thermo Fisher Scientific, Inc. TMO $1.55 Billion 5.34 Million -199 Thousand 1.33% 13 2 6 5 0 2 3
8 UnitedHealth Group Inc. UNH $304 Million 1.4 Million 443 Thousand 0.15% 13 0 7 5 1 0 2
9 Abbott Laboratories ABT $108 Million 1.29 Million 495 Thousand 0.07% 12 0 6 2 4 0 0
10 Medtronic Plc MDT $75.3 Million 693 Thousand -10.2 Thousand 0.05% 11 2 5 3 1 0 1
11 Becton, Dickinson and Co. BDX $189 Million 747 Thousand 21.6 Thousand 0.28% 11 0 6 2 3 0 0
12 Edwards Lifesciences Corp. EW $216 Million 984 Thousand 219 Thousand 0.47% 10 2 4 3 1 1 2
13 Intuitive Surgical Inc. ISRG $1.28 Billion 2.37 Million -159 Thousand 2.06% 10 1 3 4 2 2 0
14 Alnylam Pharmaceuticals Inc. ALNY $905 Million 11.3 Million 2.19 Million 10.12% 9 0 3 3 3 1 1
15 IDEXX Laboratories Inc. IDXX $223 Million 821 Thousand -154 Thousand 0.95% 9 0 1 5 3 1 1
16 Bluebird Bio Inc. BLUE $435 Million 4.74 Million -182 Thousand 8.57% 9 0 4 4 1 0 1
17 Gilead Sciences Inc. GILD $43.6 Million 687 Thousand 162 Thousand 0.05% 9 2 3 1 3 0 1
18 Stryker Corp. SYK $107 Million 493 Thousand -6.4 Thousand 0.13% 9 0 5 3 1 0 0
19 Agios Pharmaceuticals Inc. AGIO $105 Million 3.23 Million 663 Thousand 5.50% 9 0 5 4 0 0 0
20 DexCom Inc. DXCM $883 Million 5.92 Million -248 Thousand 6.49% 9 0 2 7 0 0 0
21 Amgen, Inc. AMGN $25.7 Million 133 Thousand 2.86 Thousand 0.02% 9 0 3 3 3 0 0
22 EXACT Sciences Corp. EXAS $270 Million 2.98 Million -245 Thousand 2.30% 9 2 1 5 1 0 1
23 Bristol-Myers Squibb Co. BMY $51.5 Million 1.02 Million -19.2 Thousand 0.06% 9 0 3 3 3 0 1
24 Kura Oncology Inc. KURA $42.2 Million 2.78 Million 470 Thousand 6.16% 9 3 2 1 3 0 0
25 INCYTE Corporation INCY $63.7 Million 858 Thousand 401 Thousand 0.40% 9 0 3 2 4 0 0
TOP 25 HEALTH CARE

BACKCONTENTS FORWARD 17
WHALEWISDOM
Ran
k
Se
cu
rity
Nam
e
Sym
bo
l
Valu
e O
wn
ed
Sh
are
s O
wn
ed
Q/Q
Ch
an
ge
in
Sh
are
s
% o
f S
tock
Ow
ne
rsh
ip
# o
f O
wn
ers
New
Ow
ne
rs
Bu
ys
Se
lls
Ho
lds
Exit
s
# o
f O
wn
ers
h
old
ing
in
to
p 1
0
1 TransDigm Group Inc. TDG $1.85 Billion 3.55 Million -606 Thousand 6.65% 17 3 4 9 1 0 7
2 General Electric Co. GE $150 Million 16.8 Million 70 Thousand 0.19% 13 1 5 4 3 1 1
3 Verisk Analytics Inc. VRSK $345 Million 2.18 Million -396 Thousand 1.33% 12 0 5 4 3 1 3
4 3M Co. (Minnesota Mining & Manufacturing) MMM $101 Million 617 Thousand 298 Thousand 0.11% 12 2 6 2 2 0 0
5 Deere & Co. DE $787 Million 4.66 Million -313 Thousand 1.47% 11 1 6 3 1 1 1
6 CoStar Group Inc. CSGP $600 Million 1.01 Million -21.7 Thousand 2.77% 10 0 4 6 0 0 2
7 Boeing Company BA $234 Million 615 Thousand 215 Thousand 0.11% 10 0 4 3 3 2 1
8 Fortive Corp. FTV $262 Million 3.82 Million 592 Thousand 1.14% 10 0 7 2 1 0 0
9 United Technologies Corp. (United Aircraft Corp.) UTX $62.8 Million 460 Thousand 267 Thousand 0.05% 10 1 6 2 1 2 0
10 Fastenal Co. FAST $357 Million 10.9 Million 1.16 Million 1.91% 9 1 4 1 3 1 2
11 Illinois Tool Works Inc. ITW $76.7 Million 490 Thousand 43.7 Thousand 0.15% 9 1 4 3 1 0 0
12 Heico Corp. HEI $180 Million 1.47 Million -65.4 Thousand 1.09% 8 2 1 2 3 1 2
13Honeywell International Inc. (Allied Chemical and Dye - Allied Signal)
HON $38.7 Million 229 Thousand 4.32 Thousand 0.03% 8 0 6 1 1 2 0
14 Roper Technologies Inc. ROP $109 Million 306 Thousand 17.5 Thousand 0.29% 7 1 4 2 0 0 2
15 Westinghouse Air Brake Technologies Corp. WAB $396 Million 5.52 Million 485 Thousand 2.93% 7 0 3 2 2 1 1
16 Ritchie Brothers Auctioneers, Inc. RBA $603 Million 15.1 Million -612 Thousand 13.96% 7 2 1 2 2 0 1
17 Equifax Inc. EFX $428 Million 3.04 Million -324 Thousand 2.52% 7 1 2 4 0 0 0
18 Lockheed Martin Corp. LMT $32.4 Million 83.1 Thousand 22.3 Thousand 0.03% 7 2 4 0 1 1 0
19 Rockwell Automation, Inc. ROK $55.7 Million 338 Thousand -42 Thousand 0.29% 7 1 4 1 1 1 0
20 Copart Inc. CPRT $454 Million 5.65 Million -5.76 Million 2.47% 6 1 2 1 2 0 2
21 Kratos Defense & Security Solutions Inc. KTOS $49.3 Million 2.65 Million 376 Thousand 2.50% 6 3 2 1 0 0 2
22 SiteOne Landscape Supply Inc. SITE $599 Million 8.09 Million 69.4 Thousand 19.64% 6 1 2 3 0 0 1
23 Waste Management, Inc. WM $28.8 Million 250 Thousand -330 Thousand 0.06% 6 1 4 0 1 1 0
24 Emerson Electric Co. EMR $5.16 Million 77.2 Thousand 113 0.01% 6 0 3 3 0 0 0
25 Stericycle Inc. SRCL $467 Million 9.17 Million 219 Thousand 10.06% 5 0 2 3 0 0 2
TOP 25 INDUSTRIALS

BACKCONTENTS FORWARD 18
WHALEWISDOM
Ran
k
Se
cu
rity
Nam
e
Sym
bo
l
Valu
e O
wn
ed
Sh
are
s O
wn
ed
Q/Q
Ch
an
ge
in
Sh
are
s
% o
f S
tock
Ow
ne
rsh
ip
# o
f O
wn
ers
New
Ow
ne
rs
Bu
ys
Se
lls
Ho
lds
Exit
s
# o
f O
wn
ers
h
old
ing
in
to
p 1
0
1 Microsoft Corp. MSFT $3.37 Billion 24.2 Million 667 Thousand 0.32% 41 3 16 15 7 0 25
2 Salesforce.com Inc. CRM $2.88 Billion 19.4 Million 8.05 Million 2.50% 25 5 12 6 2 2 8
3 Apple Inc AAPL $705 Million 3.15 Million 203 Thousand 0.07% 24 1 9 9 5 1 11
4 Twilio Inc TWLO $1.69 Billion 15.4 Million 2.09 Million 11.34% 22 1 11 8 2 0 10
5 ServiceNow Inc NOW $891 Million 3.51 Million 297 Thousand 1.87% 21 2 13 3 3 1 7
6 Okta Inc OKTA $606 Million 6.16 Million -402 Thousand 5.39% 21 3 6 7 5 4 3
7 Adobe Systems, Inc. ADBE $583 Million 2.11 Million 548 Thousand 0.43% 20 3 9 2 6 0 6
8 Elastic NV ESTC $554 Million 6.73 Million 3.49 Million 8.93% 16 4 6 4 2 1 4
9 Coupa Software Inc COUP $1.02 Billion 7.84 Million -259 Thousand 12.70% 15 2 3 8 2 0 5
10 NVIDIA Corp. NVDA $1.52 Billion 8.76 Million -1.36 Million 1.44% 15 2 4 7 2 1 1
11 Five9 Inc FIVN $418 Million 7.79 Million 1.57 Million 12.84% 14 3 5 4 2 0 5
12 Activision Blizzard Inc ATVI $405 Million 7.66 Million 3.33 Million 1.00% 14 3 5 4 2 0 3
13 FIserv Inc. FISV $274 Million 2.64 Million 1.18 Million 0.67% 14 5 6 3 0 0 3
14 Zendesk Inc ZEN $364 Million 5 Million 317 Thousand 4.50% 14 2 6 3 3 0 3
15 Intel Corp. INTC $233 Million 4.52 Million 716 Thousand 0.10% 14 1 4 4 5 0 1
16 Atlassian Corp Plc TEAM $1.36 Billion 10.9 Million -801 Thousand 9.19% 13 1 4 6 2 2 5
17 Palo Alto Networks Inc PANW $243 Million 1.19 Million 37.5 Thousand 1.24% 13 2 4 3 4 1 4
18 Avalara Inc AVLR $545 Million 8.09 Million 416 Thousand 10.72% 13 4 5 3 1 1 4
19 Cisco Systems, Inc. CSCO $82.2 Million 1.66 Million -125 Thousand 0.04% 13 0 5 5 3 1 0
20 Splunk Inc SPLK $119 Million 1.01 Million -137 Thousand 0.67% 13 2 7 2 2 2 0
21 DocuSign Inc DOCU $685 Million 11.1 Million -1.26 Million 6.37% 12 1 5 3 3 1 2
22 Slack Technologies Inc WORK $241 Million 10.1 Million -2.18 Million 4.23% 12 2 5 3 2 7 3
23 New Relic Inc NEWR $147 Million 2.4 Million -119 Thousand 4.11% 12 2 5 3 2 4 3
24 Texas Instruments, Inc. TXN $866 Million 6.7 Million -330 Thousand 0.72% 12 0 5 6 1 0 2
25 Zoom Video Communications Inc ZM $246 Million 3.22 Million 38.3 Thousand 1.18% 12 2 4 2 4 4 2
TOP 25 INFORMATION TECHNOLOGY
BACKCONTENTS FORWARD 19
WHALEWISDOM
Ran
k
Se
cu
rity
Nam
e
Sym
bo
l
Valu
e O
wn
ed
Sh
are
s O
wn
ed
Q/Q
Ch
an
ge
in
Sh
are
s
% o
f S
tock
Ow
ne
rsh
ip
# o
f O
wn
ers
New
Ow
ne
rs
Bu
ys
Se
lls
Ho
lds
Exit
s
# o
f O
wn
ers
h
old
ing
in
to
p 1
0
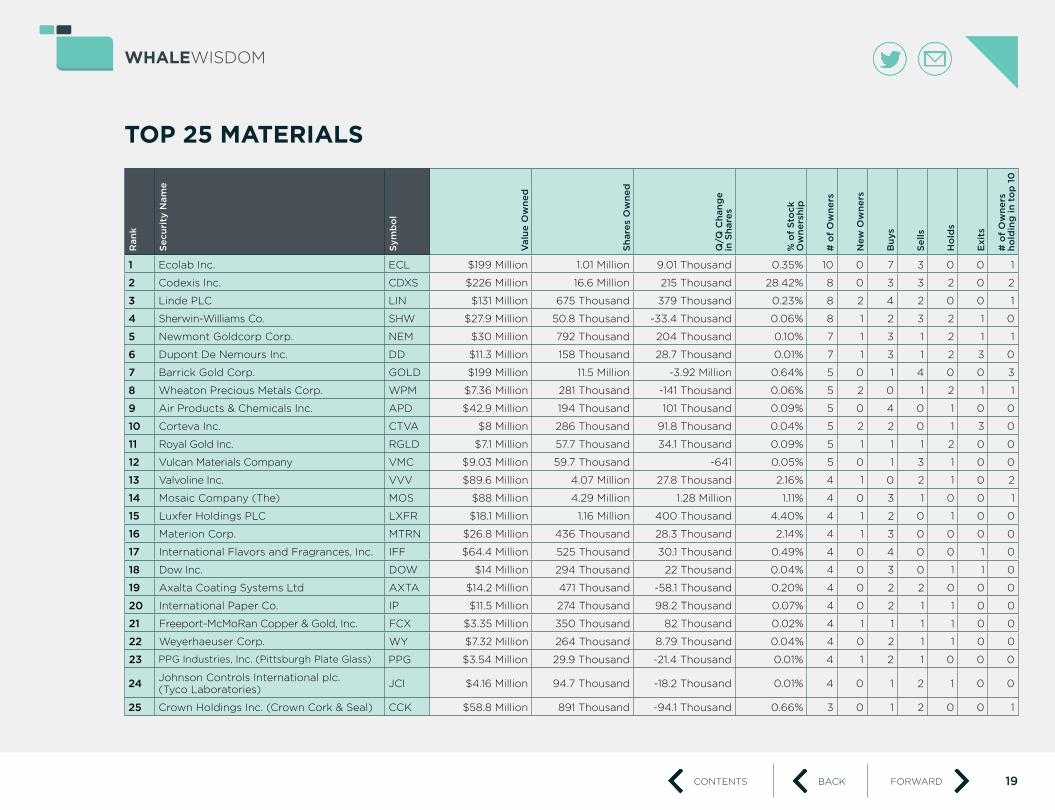
1 Ecolab Inc. ECL $199 Million 1.01 Million 9.01 Thousand 0.35% 10 0 7 3 0 0 1
2 Codexis Inc. CDXS $226 Million 16.6 Million 215 Thousand 28.42% 8 0 3 3 2 0 2
3 Linde PLC LIN $131 Million 675 Thousand 379 Thousand 0.23% 8 2 4 2 0 0 1
4 Sherwin-Williams Co. SHW $27.9 Million 50.8 Thousand -33.4 Thousand 0.06% 8 1 2 3 2 1 0
5 Newmont Goldcorp Corp. NEM $30 Million 792 Thousand 204 Thousand 0.10% 7 1 3 1 2 1 1
6 Dupont De Nemours Inc. DD $11.3 Million 158 Thousand 28.7 Thousand 0.01% 7 1 3 1 2 3 0
7 Barrick Gold Corp. GOLD $199 Million 11.5 Million -3.92 Million 0.64% 5 0 1 4 0 0 3
8 Wheaton Precious Metals Corp. WPM $7.36 Million 281 Thousand -141 Thousand 0.06% 5 2 0 1 2 1 1
9 Air Products & Chemicals Inc. APD $42.9 Million 194 Thousand 101 Thousand 0.09% 5 0 4 0 1 0 0
10 Corteva Inc. CTVA $8 Million 286 Thousand 91.8 Thousand 0.04% 5 2 2 0 1 3 0
11 Royal Gold Inc. RGLD $7.1 Million 57.7 Thousand 34.1 Thousand 0.09% 5 1 1 1 2 0 0
12 Vulcan Materials Company VMC $9.03 Million 59.7 Thousand -641 0.05% 5 0 1 3 1 0 0
13 Valvoline Inc. VVV $89.6 Million 4.07 Million 27.8 Thousand 2.16% 4 1 0 2 1 0 2
14 Mosaic Company (The) MOS $88 Million 4.29 Million 1.28 Million 1.11% 4 0 3 1 0 0 1
15 Luxfer Holdings PLC LXFR $18.1 Million 1.16 Million 400 Thousand 4.40% 4 1 2 0 1 0 0
16 Materion Corp. MTRN $26.8 Million 436 Thousand 28.3 Thousand 2.14% 4 1 3 0 0 0 0
17 International Flavors and Fragrances, Inc. IFF $64.4 Million 525 Thousand 30.1 Thousand 0.49% 4 0 4 0 0 1 0
18 Dow Inc. DOW $14 Million 294 Thousand 22 Thousand 0.04% 4 0 3 0 1 1 0
19 Axalta Coating Systems Ltd AXTA $14.2 Million 471 Thousand -58.1 Thousand 0.20% 4 0 2 2 0 0 0
20 International Paper Co. IP $11.5 Million 274 Thousand 98.2 Thousand 0.07% 4 0 2 1 1 0 0
21 Freeport-McMoRan Copper & Gold, Inc. FCX $3.35 Million 350 Thousand 82 Thousand 0.02% 4 1 1 1 1 0 0
22 Weyerhaeuser Corp. WY $7.32 Million 264 Thousand 8.79 Thousand 0.04% 4 0 2 1 1 0 0
23 PPG Industries, Inc. (Pittsburgh Plate Glass) PPG $3.54 Million 29.9 Thousand -21.4 Thousand 0.01% 4 1 2 1 0 0 0
24Johnson Controls International plc. (Tyco Laboratories)
JCI $4.16 Million 94.7 Thousand -18.2 Thousand 0.01% 4 0 1 2 1 0 0
25 Crown Holdings Inc. (Crown Cork & Seal) CCK $58.8 Million 891 Thousand -94.1 Thousand 0.66% 3 0 1 2 0 0 1
TOP 25 MATERIALS
BACKCONTENTS FORWARD 20
WHALEWISDOM
Ran
k
Se
cu
rity
Nam
e
Sym
bo
l
Valu
e O
wn
ed
Sh
are
s O
wn
ed
Q/Q
Ch
an
ge
in
Sh
are
s
% o
f S
tock
Ow
ne
rsh
ip
# o
f O
wn
ers
New
Ow
ne
rs
Bu
ys
Se
lls
Ho
lds
Exit
s
# o
f O
wn
ers
h
old
ing
in
to
p 1
0
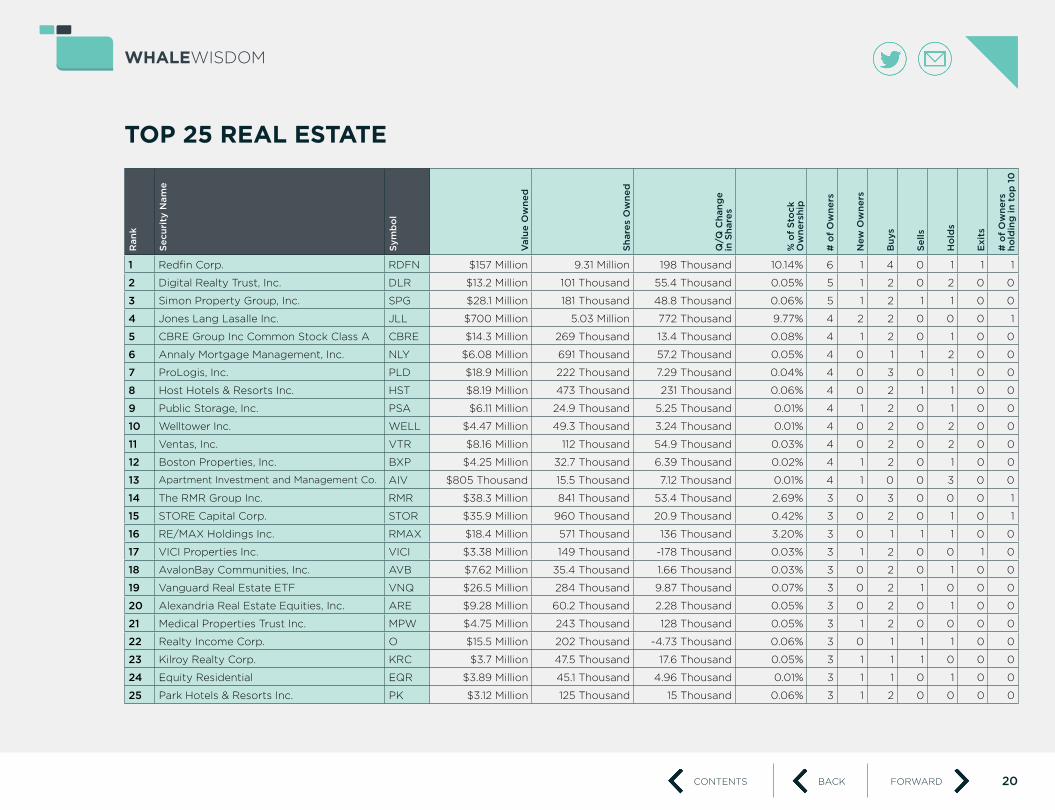
1 Redfin Corp. RDFN $157 Million 9.31 Million 198 Thousand 10.14% 6 1 4 0 1 1 1
2 Digital Realty Trust, Inc. DLR $13.2 Million 101 Thousand 55.4 Thousand 0.05% 5 1 2 0 2 0 0
3 Simon Property Group, Inc. SPG $28.1 Million 181 Thousand 48.8 Thousand 0.06% 5 1 2 1 1 0 0
4 Jones Lang Lasalle Inc. JLL $700 Million 5.03 Million 772 Thousand 9.77% 4 2 2 0 0 0 1
5 CBRE Group Inc Common Stock Class A CBRE $14.3 Million 269 Thousand 13.4 Thousand 0.08% 4 1 2 0 1 0 0
6 Annaly Mortgage Management, Inc. NLY $6.08 Million 691 Thousand 57.2 Thousand 0.05% 4 0 1 1 2 0 0
7 ProLogis, Inc. PLD $18.9 Million 222 Thousand 7.29 Thousand 0.04% 4 0 3 0 1 0 0
8 Host Hotels & Resorts Inc. HST $8.19 Million 473 Thousand 231 Thousand 0.06% 4 0 2 1 1 0 0
9 Public Storage, Inc. PSA $6.11 Million 24.9 Thousand 5.25 Thousand 0.01% 4 1 2 0 1 0 0
10 Welltower Inc. WELL $4.47 Million 49.3 Thousand 3.24 Thousand 0.01% 4 0 2 0 2 0 0
11 Ventas, Inc. VTR $8.16 Million 112 Thousand 54.9 Thousand 0.03% 4 0 2 0 2 0 0
12 Boston Properties, Inc. BXP $4.25 Million 32.7 Thousand 6.39 Thousand 0.02% 4 1 2 0 1 0 0
13 Apartment Investment and Management Co. AIV $805 Thousand 15.5 Thousand 7.12 Thousand 0.01% 4 1 0 0 3 0 0
14 The RMR Group Inc. RMR $38.3 Million 841 Thousand 53.4 Thousand 2.69% 3 0 3 0 0 0 1
15 STORE Capital Corp. STOR $35.9 Million 960 Thousand 20.9 Thousand 0.42% 3 0 2 0 1 0 1
16 RE/MAX Holdings Inc. RMAX $18.4 Million 571 Thousand 136 Thousand 3.20% 3 0 1 1 1 0 0
17 VICI Properties Inc. VICI $3.38 Million 149 Thousand -178 Thousand 0.03% 3 1 2 0 0 1 0
18 AvalonBay Communities, Inc. AVB $7.62 Million 35.4 Thousand 1.66 Thousand 0.03% 3 0 2 0 1 0 0
19 Vanguard Real Estate ETF VNQ $26.5 Million 284 Thousand 9.87 Thousand 0.07% 3 0 2 1 0 0 0
20 Alexandria Real Estate Equities, Inc. ARE $9.28 Million 60.2 Thousand 2.28 Thousand 0.05% 3 0 2 0 1 0 0
21 Medical Properties Trust Inc. MPW $4.75 Million 243 Thousand 128 Thousand 0.05% 3 1 2 0 0 0 0
22 Realty Income Corp. O $15.5 Million 202 Thousand -4.73 Thousand 0.06% 3 0 1 1 1 0 0
23 Kilroy Realty Corp. KRC $3.7 Million 47.5 Thousand 17.6 Thousand 0.05% 3 1 1 1 0 0 0
24 Equity Residential EQR $3.89 Million 45.1 Thousand 4.96 Thousand 0.01% 3 1 1 0 1 0 0
25 Park Hotels & Resorts Inc. PK $3.12 Million 125 Thousand 15 Thousand 0.06% 3 1 2 0 0 0 0
TOP 25 REAL ESTATE

BACKCONTENTS FORWARD 21
WHALEWISDOM
Ran
k
Se
cu
rity
Nam
e
Sym
bo
l
Valu
e O
wn
ed
Sh
are
s O
wn
ed
Q/Q
Ch
an
ge
in
Sh
are
s
% o
f S
tock
Ow
ne
rsh
ip
# o
f O
wn
ers
New
Ow
ne
rs
Bu
ys
Se
lls
Ho
lds
Exit
s
# o
f O
wn
ers
h
old
ing
in
to
p 1
0
1 Union Pacific Corp. UNP $111 Million 685 Thousand 49.6 Thousand 0.10% 8 0 3 2 3 0 1
2 Delta Air Lines Inc. DAL $38.8 Million 674 Thousand 58.8 Thousand 0.10% 7 1 2 4 0 0 0
3 Norfolk Southern Corp. NSC $49.5 Million 275 Thousand 210 Thousand 0.10% 7 2 3 0 2 0 0
4 Expeditors International of Washington Inc. EXPD $427 Million 5.75 Million 847 Thousand 3.37% 6 0 5 1 0 0 1
5 Knight Transportation Inc. KNX $116 Million 3.19 Million 158 Thousand 3.96% 6 3 0 2 1 1 1
6 Old Dominion Freight Line Inc. ODFL $667 Million 3.93 Million 34.6 Thousand 4.91% 6 1 3 2 0 0 1
7 CSX Corp. CSX $86.2 Million 1.24 Million 1.18 Million 0.16% 6 2 4 0 0 0 0
8 United Parcel Service, Inc. Class B UPS $53.9 Million 450 Thousand -20.7 Thousand 0.05% 6 0 4 1 1 1 0
9 FedEx Corporation FDX $7.79 Million 53.5 Thousand -112 Thousand 0.02% 5 1 2 1 1 1 0
10 Kansas City Southern Industries Inc. KSU $68.9 Million 518 Thousand 279 Thousand 0.52% 5 1 2 1 1 0 0
11 XPO Logistics Inc. XPO $916 Million 12.8 Million -30.1 Thousand 13.89% 4 0 1 2 1 1 1
12 C.H. Robinson Worldwide Inc. CHRW $173 Million 2.04 Million 514 Thousand 1.50% 4 1 3 0 0 0 1
13 Spirit Airlines Inc. SAVE $21.4 Million 589 Thousand 345 Thousand 0.86% 4 1 0 1 2 0 0
14 Azul SA ADR AZUL $129 Million 3.61 Million 3.56 Thousand 0.86% 4 1 1 1 1 0 0
15 Gol Linhas Aereas Inteligentes S.A. ADR GOL $28 Million 1.81 Million 394 Thousand 1.03% 4 0 3 1 0 1 0
16 United Airlines Holdings Inc. UAL $1.05 Billion 11.8 Million -19.1 Thousand 4.61% 3 0 1 2 0 0 1
17 Kirby Corp. KEX $745 Million 9.06 Million -62.9 Thousand 15.13% 3 0 1 1 1 0 2
18 Macquarie Infrastructure Co. MIC $33.5 Million 847 Thousand 767 Thousand 0.98% 3 1 1 1 0 1 1
19 Allegiant Travel Co ALGT $30.2 Million 202 Thousand -10.4 Thousand 1.24% 3 0 0 2 1 0 0
20 JetBlue Airways Corp. JBLU $4.86 Million 290 Thousand 36.5 Thousand 0.10% 3 1 0 1 1 0 0
21 Ryder System Inc. R $7.32 Million 141 Thousand 55.7 Thousand 0.27% 3 2 1 0 0 0 0
22 Hudson Ltd HUD $1.82 Million 149 Thousand 50 Thousand 0.16% 3 1 0 1 1 0 0
23 Southwest Airlines Co. LUV $1.72 Million 31.8 Thousand -50.4 Thousand 0.01% 3 1 0 0 2 1 0
24 Mesa Air Group Inc. MESA $6.66 Million 987 Thousand -17.4 Thousand 3.14% 3 1 1 1 0 0 0
25 Canadian National Railway Co. CNI $45.5 Million 506 Thousand 466 Thousand 0.07% 2 1 1 0 0 0 1
TOP 25 TRANSPORTS

BACKCONTENTS FORWARD 22
WHALEWISDOM
Ran
k
Se
cu
rity
Nam
e
Sym
bo
l
Valu
e O
wn
ed
Sh
are
s O
wn
ed
Q/Q
Ch
an
ge
in
Sh
are
s
% o
f S
tock
Ow
ne
rsh
ip
# o
f O
wn
ers
New
Ow
ne
rs
Bu
ys
Se
lls
Ho
lds
Exit
s
# o
f O
wn
ers
h
old
ing
in
to
p 1
0
1 Ringcentral Inc. RNG $431 Million 3.43 Million -97.8 Thousand 4.13% 13 2 2 7 2 0 6
2 American Tower Corp., Class A AMT $174 Million 788 Thousand 364 Thousand 0.18% 11 2 4 5 0 1 3
3 Verizon Communications VZ $129 Million 2.14 Million -114 Thousand 0.05% 11 0 4 3 4 1 1
4 Snap Inc Class A SNAP $681 Million 43.1 Million -3.47 Million 3.13% 9 2 2 4 1 2 3
5 Crown Castle International Corp. CCI $120 Million 866 Thousand 247 Thousand 0.21% 9 1 3 5 0 0 0
6 AT&T Inc. (Southwestern Bell - SBC Corp.) T $73.2 Million 1.93 Million -870 Thousand 0.03% 9 0 6 3 0 0 0
7 T-Mobile US Inc. TMUS $249 Million 3.16 Million -717 Thousand 0.37% 8 2 2 4 0 3 2
8 Centurylink Inc. CTL $37.2 Million 2.98 Million 353 Thousand 0.27% 6 1 1 4 0 0 2
9 NextEra Energy Inc. NEE $66 Million 283 Thousand -9.08 Thousand 0.06% 6 2 3 1 0 0 0
10 Exelon Corp. EXC $10 Million 208 Thousand -241 Thousand 0.02% 6 2 3 1 0 0 0
11 Kinder Morgan Inc. (DE) KMI $50.1 Million 2.43 Million -862 Thousand 0.11% 5 0 3 1 1 1 0
12American Electric Power Co. (American Gas & Electric)
AEP $37.6 Million 401 Thousand 17 Thousand 0.08% 5 0 4 0 1 0 0
13 Edison International (Southern California Edison) EIX $34.3 Million 454 Thousand 402 Thousand 0.13% 5 0 4 0 1 0 0
14 Sempra Energy, Inc. SRE $23.2 Million 157 Thousand 59.1 Thousand 0.06% 5 1 3 1 0 0 0
15Consolidated Edison Co. of New York Inc. (Consolidated Gas Co. of New York)
ED $5.7 Million 60.4 Thousand -153 Thousand 0.02% 5 1 2 1 1 0 0
16 CMS Energy Corp. (Consumers Power Co.) CMS $8.02 Million 125 Thousand 27 0.04% 5 1 3 0 1 1 0
17 Alliant Energy Corp. LNT $5.19 Million 96.3 Thousand 54.3 Thousand 0.04% 5 1 2 0 2 0 0
18 Bandwidth Inc. BAND $49.8 Million 765 Thousand -183 Thousand 3.33% 4 0 0 4 0 1 1
19 Vonage Holdings Corp. VG $25 Million 2.21 Million 160 Thousand 0.91% 4 1 1 2 0 0 1
20 GTT Communications Inc. GTT $146 Million 15.5 Million 858 Thousand 27.56% 4 0 4 0 0 1 1
21 American Water Works Co Inc. AWK $63.6 Million 512 Thousand -17.2 Thousand 0.28% 4 0 2 2 0 1 0
22 AES Corp. (The) AES $42.6 Million 2.61 Million 1.93 Million 0.39% 4 0 3 1 0 0 0
23 NRG Energy Inc. NRG $19.9 Million 502 Thousand 141 Thousand 0.20% 4 1 1 1 1 0 0
24 Dominion Energy Inc. D $16 Million 198 Thousand 11.8 Thousand 0.02% 4 0 3 0 1 0 0
25 Duke Energy Corp. DUK $11.1 Million 116 Thousand -158 Thousand 0.02% 4 0 2 1 1 2 0
TOP 25 UTILITIES & TELECOMMUNICATIONS
BACKCONTENTS FORWARD 23
WHALEWISDOM
ABOUT WHALEWISDOM
WhaleWisdom.com is the premier site for accessing and analyzing hedge fund 13F and 13D/G filings.
WHAT CAN YOU DO FOR FREE?• View 13F holdings for the past year for any fund.
• Run backtest’s, find consensus holdings, do stock screening and other reports for the past year.
• Create unlimited Email Alerts for any SEC filing (13D/G filings are limited to 10 per day).
• Use all search tools on the site with the exception of the 13D/G search. This includes the 13F Fund Performance Search,
N-SAR Filing Search, Form D’s, Insider Transactions, and more.
WHAT DO WHALEWISDOM PREMIUM SUBSCRIBERS GET?We also offer a premium subscription service for users who need more:
• Access to 13F data as far back as 2001. View 13D/G data back to 2006.
• Easily bring 13F data into Excel via our Excel Add-in, API, or using Export buttons throughout the site.
• Backtest using 13F data going back to 2001.
• View a qualifying fund’s WhaleScore, our proprietary scoring system for 13F filers that makes it easy to identify the best
performing funds to copy.
• Access to the WhaleIndex. The WhaleIndex contains consensus stock picks from our best performing WhaleScore funds.
• 13D/G historical search going back to 2006.
• Bulk FTP files updated nightly for Enterprise subscribers.
BACKCONTENTS FORWARD 24
WHALEWISDOM
WhaleWisdom is not a registered
investment manager, investment advisor,
broker dealer or other regulated entity.
Past performance of the funds or
securities discussed herein should not and
cannot be viewed as an indicator of future
performance. The performance results of
persons investing in any fund or security
will differ for a variety of reasons.
This report provides general information
only. Neither the information nor any
opinion expressed constitutes an offer or
an invitation to make an offer, to buy or
sell any securities or any other financial
instrument. This report is not intended to
provide personal investment advice and
it does not take into account the specific
investment objectives, financial situation,
tax profile and needs of any specific
person. Investors should seek financial and
tax advice regarding the appropriateness
of investing in financial instruments.
Any decision to purchase securities
described in this report must be based
solely on existing public information on
such security or fund, or the information
contained in the prospectus or other
offering document issued in connection
with such offering, and not on this report.
Securities in this report are not
recommended, offered or sold by
WhaleWisdom. Investments involve
numerous risks, including, among others,
market risk, counterparty default risk
and liquidity risk, and investors should
be prepared to lose their entire principal
amount. No security, financial instrument
or derivative is suitable for all investors.
The information herein (other than
disclosure information relating to
WhaleWisdom) was obtained from various
sources and we do not guarantee its
accuracy. Neither WhaleWisdom nor any
officer or employee of WhaleWisdom
accepts any liability whatsoever for any
direct, indirect or consequential damages
or losses arising from any use of this report
or its contents.
COPYRIGHT AND GENERAL INFORMATION REGARDING THIS REPORT:
This Publication is protected by U.S. and
International Copyright laws. All rights reserved.
No part of this Publication or its contents, may
be copied, downloaded, further transmitted, or
otherwise reproduced, stored, disseminated,
transferred, or used, in any form or by any
means, except internally and as permitted
under the WhaleWisdom Service Agreement or
with prior written permission. This publication
is proprietary and limited to the sole use of the
intended recipient.
Our reports are based upon information
gathered from various sources believed to be
reliable but are not guaranteed as to accuracy
or completeness. The information in this report
is not intended to be, and shall not constitute,
an offer to sell or a solicitation of an offer to
buy any security or investment product or
service. The information in this report is subject
to change without notice, and WhaleWisdom
assumes no responsibility to update the
information contained in this report.
DISCLAIMER

WHALEWISDOM
BACK TO COVER
Copyright © 2019 WhaleWisdom LLC. All rights reserved.
WHALEWISDOM
Related Documents