i Heavy Minerals in Soils from the Athabasca Basin and the Implications for Exploration Geochemistry of Uranium Deposits at Depth by William R. Carlson A thesis submitted to the Department of Geological Sciences and Geological Engineering In conformity with the requirements for the Degree of Master of Science Queen’s University Kingston, Ontario, Canada (September, 2016) Copyright ©William R. Carlson, 2016

Welcome message from author
This document is posted to help you gain knowledge. Please leave a comment to let me know what you think about it! Share it to your friends and learn new things together.
Transcript
i
Heavy Minerals in Soils from the Athabasca Basin and the
Implications for Exploration Geochemistry of Uranium Deposits at
Depth
by
William R. Carlson
A thesis submitted to the Department of Geological Sciences and Geological Engineering
In conformity with the requirements for the
Degree of Master of Science
Queen’s University
Kingston, Ontario, Canada
(September, 2016)
Copyright ©William R. Carlson, 2016
ii
Abstract
The Centennial deposit is a high grade (~8% U3O8), deeply buried (~950m),
unconformity-related U deposit located in the south-central region of the Athabasca Basin in
northern Saskatchewan, Canada. The mineral chemistry of fine fractions (<63 μm) of soils from
grids above the Centennial deposit were examined to understand possible controls on the
geochemistry and radiogenic 207Pb/206Pb ratios measured in the clay-size (<2 μm) fractions used
for exploration. Soil samples distal and proximal to the deposit projection to the surface and
geophysically defined structures were selected. Mineral abundances were determined using the
scanning electron microscope and Mineral Liberation Analysis.
Zircon was the only U-rich mineral identified with modal abundances >0.02% by weight.
Monazite, which can be U-rich, was identified, but not in significant abundances. The source of
the zircon and other heavy minerals is interpreted to be from sub-cropping sources that are >100
km up-ice from Centennial. Trace element analysis using laser ablation inductively coupled
plasma mass spectrometry of hydroseparated zircon grains indicate that zircon abundances and
zircon Pb concentrations in surficial samples have minimal effect on the radiogenic 207Pb/206Pb
ratios in the clay-fraction of the samples, with the dominant source of radiogenic Pb being clay
mineral surfaces that trapped Pb during secondary dispersion from the Centennial uranium
deposit through faults and fractures to the surface. The REE patterns indicate HREE enrichment
in the clay-fractions of samples that have higher abundances of zircon in the <20 μm fraction.
Immobile elements such as HREE that are concentrated in zircon can be used as indicators of
radiogenic Pb being sourced from minerals at the surface rather than being sourced from
secondary dispersion from deeply buried U deposits.
iii
Co-Authorship
The thesis and manuscript contained herein are prepared by William R. Carlson. Chapter 2 is co-authored
by Dr. Dan Layton-Matthews (project co-supervisor) and Dr. Kurt Kyser (project supervisor) who
provided scientific and editorial support for this research. Uravan Minerals carried out the geochemical
survey that was the subject of this thesis.
iv
Acknowledgements
I am very grateful to my supervisors Dr. Kurt Kyser and Dr. Dan Layton-Matthews for the
guidance and support throughout this entire project. The SEM and MLA work for this project would not
have been possible without the great help that Agatha Dobosz offered in SEM operation. Evelyn Leduc
was very helpful and patient with LA-ICPMS work on grain mounts and also offered guidance in writing
of this thesis. Jerzey was helpful by offering friendly tips on polishing grain mounts for the SEM.
A very special thanks go to Dr. Steve Beyer and Paul Stewart for the help, constructive
conversations, and friendship during the course of this project. Thanks to Mike Gadd for always being in
the office and for being willing to talk about any questions I had regarding my project. Thanks to Brian
Joy for the help with the EPMA work. Thank you to all of my friends and family for encouragement and
support. Thank you to all of the staff and students I had the pleasure to work with at QFIR and the
Queen’s Geology Department. Thank you to my girlfriend Rachel Greco for her unconditional love and
always being there to talk to me.
Thanks to Uravan Minerals for allowing me to use geochemical samples collected from their
orientation survey of Centennial conducted in 2013.
Finally, this thesis is dedicated to my parents: Mark and Lee Carlson for their loving support
during my undergraduate and graduate degrees. I could not have made it where I am today without their
help.
v
Table of Contents
Abstract ......................................................................................................................................................... ii
Co-Authorship.............................................................................................................................................. iii
Acknowledgements ...................................................................................................................................... iv
Chapter 1: Introduction ............................................................................................................................. 1
1.1 Introduction ......................................................................................................................................... 1
1.2 Geologic Setting of the Athabasca Basin ............................................................................................ 5
1.3 Genetic Models ................................................................................................................................... 9
1.4 The Centennial Deposit ..................................................................................................................... 11
1.5 Exploration Methods ......................................................................................................................... 12
1.6 Project Purpose ................................................................................................................................. 14
1.7 Thesis Layout .................................................................................................................................... 18
Chapter 2: Heavy minerals in soils from the Centennial Uranium Deposit in Athabasca Basin and
the implications for exploration geochemistry of uranium deposits at depth ..................................... 19
2.1 Introduction ....................................................................................................................................... 19
2.2 Regional and Local Geology............................................................................................................. 23
2.3 Pb isotopes and U concentrations in exploration for U deposits....................................................... 28
2.4 Methods............................................................................................................................................. 31
2.4.1 Sample Collection and Analysis from Surface Geochemical Survey ........................................ 31
2.4.2 Sample Selection and Preparation .............................................................................................. 33
2.4.3 Mineral Analysis ........................................................................................................................ 37
2.4.4 Maximum U and Pb Contribution from Heavy Mineral Content .............................................. 43
2.5 Results ............................................................................................................................................... 45
2.6 Discussion ......................................................................................................................................... 58
2.6.1 Mineral Quantification ............................................................................................................... 58
2.6.2 Radiogenic Pb Contribution from Minerals at the Surface ........................................................ 60
2.6.3 Identifying “false” Radiogenic Pb anomalies at the surface ...................................................... 66
2.8 Conclusions ....................................................................................................................................... 69
vi
Chapter 3: Conclusions and Future Work ............................................................................................. 72
References ................................................................................................................................................... 78
Appendix A ................................................................................................................................................. 96
Appendix B ................................................................................................................................................. 98
Appendix C ............................................................................................................................................... 101
Appendix D ............................................................................................................................................... 111
Appendix E ............................................................................................................................................... 117
Appendix F................................................................................................................................................ 127
Appendix G ............................................................................................................................................... 129
vii
List of Figures
Figure 1.1: Geologic map of the Athabasca Basin and its location in northern Saskatchewan ..... 4
Figure 1.2: Map of the Athabasca Basin showing the data from an airborne radiometric survey
and dominant ice flow directions .................................................................................................... 8
Figure 1.3: Schematic diagram showing the basement-hosted and sandstone-hosted end member
deposit types.................................................................................................................................. 10
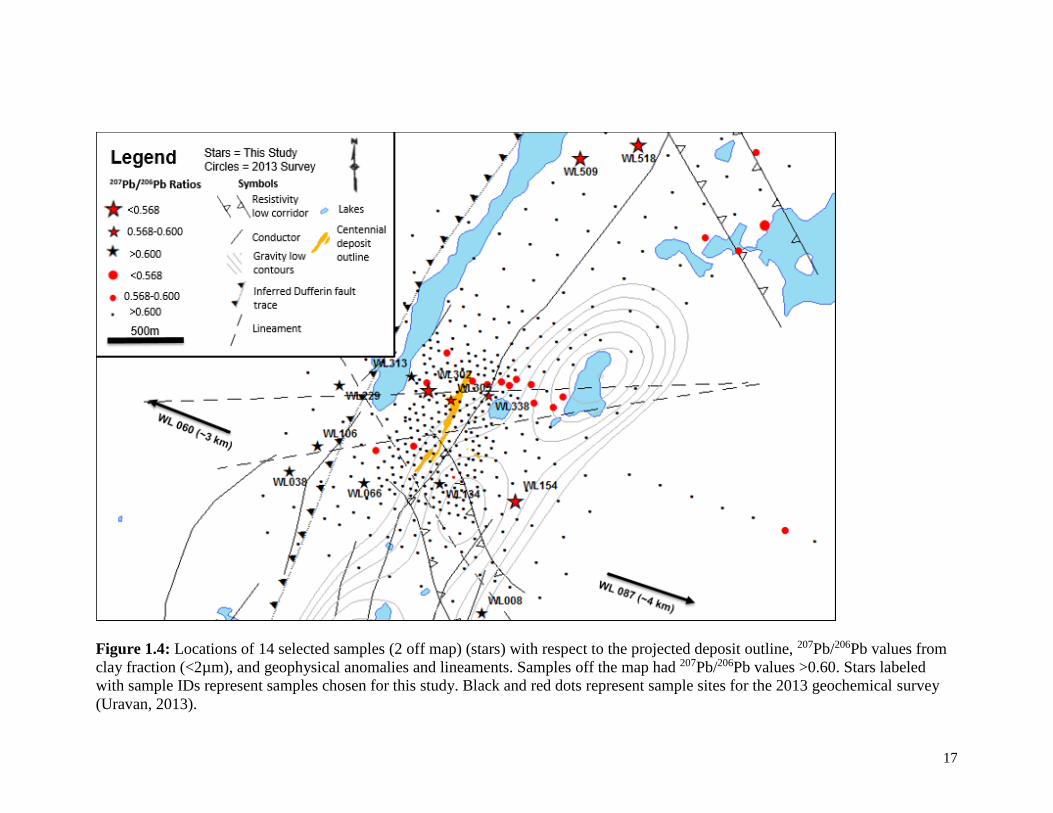
Figure 1.4: Locations of selected samples with respect to the projected deposit outline,
207Pb/206Pb values from clay fraction (<2µm), and geophysical anomalies and lineaments ........ 17
Figure 2.1: Geologic map of the Athabasca Basin and its location in northern Saskatchewan ................. 21
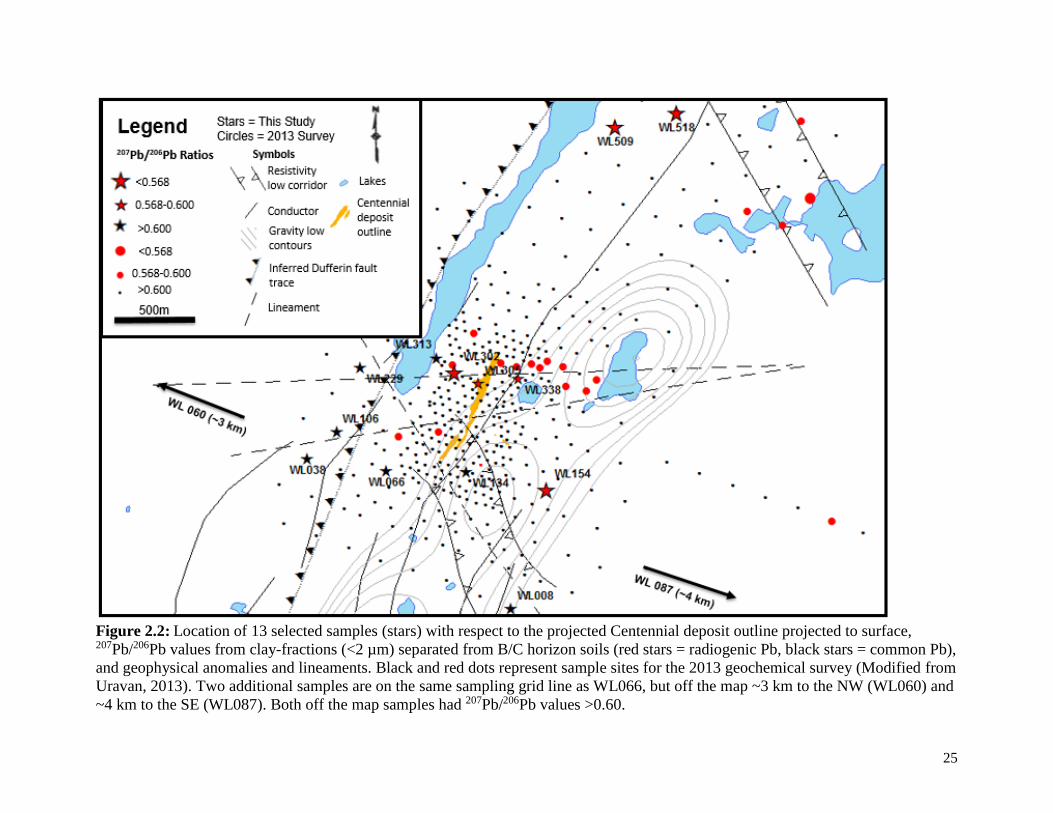
Figure 2.2: Location of 13 selected samples (stars) with respect to the projected Centennial deposit
outline projected to surface, 207Pb/206Pb values from clay-fractions (<2 µm) separated from B/C horizon
soils (red stars = radiogenic Pb, black stars = common Pb), and geophysical anomalies and lineaments. . 25
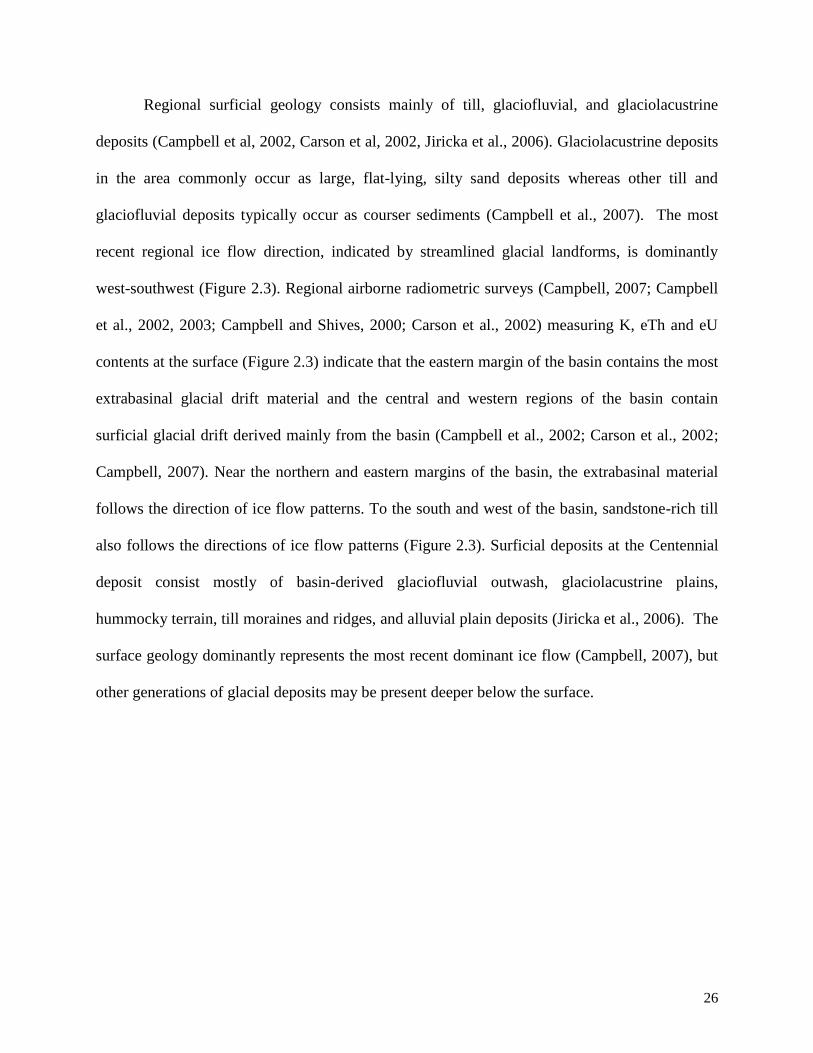
Figure 2.3: Map showing the dominant direction of ice flow (black arrows) and the normalized eTh
(equivalent Th), K and eU from an airborne radiometric survey ................................................................ 27
Figure 2.4: Conceptual plot of U concentrations vs 207Pb/206Pb ratios in surficial media illustrating the
effects of syn-ore primary and post-ore secondary dispersion on U and radiogenic Pb ............................. 30
Figure 2.5: Normal probability plots indicating possible break points in 207Pb/206Pb ratios and
concentrations of U in ppm in the clay fraction separated from soils ......................................................... 36
Figure 2.6: BSE images of typical zircon grain morphologies in the <20 µm fraction ............................. 38
Figure 2.7: False color mosaic of an original sample and its heavy mineral concentrate .......................... 40
Figure 2.8: Photomicrographs of clay coated grains that were identified as aluminosilicates ................... 48
Figure 2.9: Proportions by count of extrabasinal material in 100 pebble counts compared to heavy
mineral contents by weight (S.G.>3.1) in <63 μm fractions ....................................................................... 50
Figure 2.10: Mean abundances in grain size fractions for feldspars and heavy minerals .......................... 59
Figure 2.11: Relationship between the 207Pb/206Pb ratios and U concentrations in selected clay fraction
samples of soils from the Centennial deposit area ...................................................................................... 63
Figure 2.12: Zircon and garnet abundances in <20 μm fraction vs. HREE/LREE in clay-size fraction (<2
μm) aqua regia digests. ............................................................................................................................... 67
Figure 2.13: Chondrite-normalized rare earth element-yttrium plot in the clay-size fraction (<2 μm) aqua
regia digests of samples and their zircon abundances in the <20 μm fraction ............................................ 68
Figure 3.1: Map of suggested locations for future studies ........................................................... 77
viii
List of Tables
Table 2.1: Descriptions and typical depths of podzol soil horizons ............................................ 33
Table 2.2: Initial and increased operating parameters for HS-11 hydroseparator ....................... 35
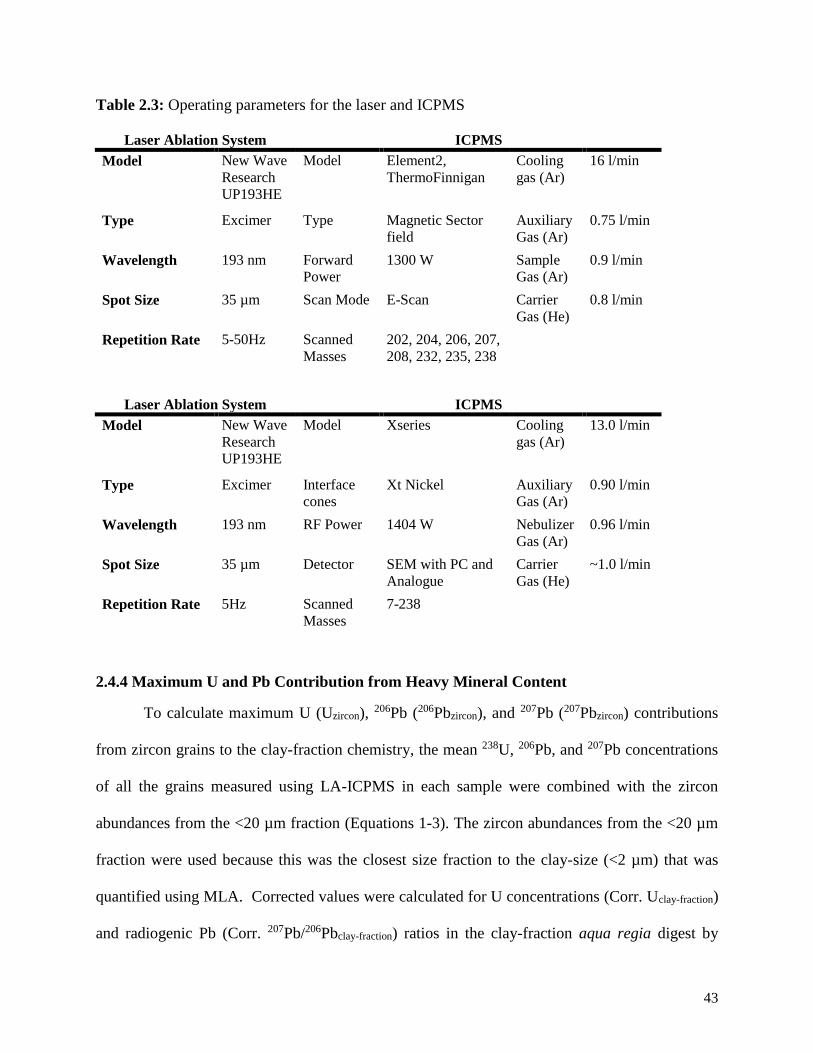
Table 2.3: Operating parameters for the laser and ICPMS .......................................................... 43
Table 2.4: Selected element concentrations of the soil clay-fraction .......................................... 46
Table 2.5: Average proportions by weight of heavy minerals with a S.G. > 3.2 in each size
fraction determined by MLA and the weight percent of heavy minerals in a concentrate produced
by heavy liquid separation by OBM ............................................................................................. 49
Table 2.6: Abundances in weight percent of minerals in non-hydroseparated sample and
hydroseparated sample in the <20 μm fraction ............................................................................. 51
Table 2.7: Abundances in weight percent of minerals in non-hydroseparated sample and
hydroseparated sample in the 20-45 μm fraction .......................................................................... 53
Table 2.8: Abundances in weight percent of minerals in non-hydroseparated sample and
hydroseparated sample in the 45-63 μm fraction .......................................................................... 55
Table 2.9: Summary of element concentrations in zircons from the <20 and 20-45 μm fractions
analyzed using EPMA................................................................................................................... 57
Table 2.10: Average U, 206Pb, 207Pb contributions from zircon grains in the <20µm size fraction,
the U, Pb and 207Pb/206Pb concentrations measured in the clay fraction aqua regia digest, and the
corrected U concentration and 207Pb/206Pb of the clay fraction assuming all the U and Pb from the
zircon had contributed to the measured U, Pb and 207Pb/206Pb. in the clay fraction ..................... 65
1
Chapter 1: Introduction
1.1 Introduction
Unconformity-associated uranium deposits occur as semi massive replacements, veins,
and pods of mainly uraninite located near an unconformity between diagenetically-altered,
uranium-depleted, Proterozoic red bed basins and metamorphosed, uranium-rich, basement
rocks, such as supracrustal gneiss and graphitic metapelite (Kyser and Cuney, 2009). Two types
of deposits have been described, based on their location relative to the unconformity and their
respective genetic model: 1) basement-hosted deposits, which are located at or below the
unconformity and are generally “mono-metallic” or simple (consisting of mostly U), with a low
total concentration of rare earth elements (REEs), and 2) sandstone-hosted deposits, which are
located at and above the unconformity and are “poly-metallic” or complex (consisting of U, V,
Ni, Co, Cu, and As), with a high total concentration of REEs (Fayek and Kyser, 1997; Kyser and
Cuney, 2009).
The only unconformity-associated U deposits currently in production worldwide are
located in the Athabasca Basin of Saskatchewan, Canada and the McArthur Basin of the
Northern Territory, Australia (OECD Nuclear Energy Agency and the International Atomic
Energy Agency, 2012). Although production has been limited to these two localities,
unconformity-associated uranium deposits have accounted for over 15% of the total world
production of uranium up to 2007 (Cuney, 2008). These deposits are of particular importance in
Canada because they have been the only source of uranium production in the country for over 15
years; in 2010 Canada was the second largest producer of uranium in the world, with 18% of the
total yearly production (OECD Nuclear Energy Agency and the International Atomic Energy
Agency, 2012). The average ore grade in the Athabasca Basin is 1.97% (Gandhi, 2007), more
2
than four times the average grade for unconformity-associated deposits in Australia (Jefferson et
al., 2007; Kyser and Cuney, 2009).
All currently producing deposits in the Athabasca Basin are located near the eastern
margin of the basin (Figure 1.1). Some deposits, such as McArthur River and Cigar Lake, are
buried under approximately 550 m (Marlatt et al., 1992) and 430 m (Bruneton, 1987) of
sandstone cover, respectively. Other deposits (Rabbit Lake, Eagle Point, Key Lake, and
Midwest) have no sandstone cover, but are only covered by glacial sediments. (Sopuck et al.,
1983; Sibbald, 1985). Uraniferous boulder trains have aided in the discovery of some sub-
cropping deposits including Key Lake, Rabbit Lake, and Midwest (Sopuck et al., 1983).
However, few recent discoveries have been at the surface (Marlett and Kyser, 2011); this has
prompted further development of exploration geochemistry techniques aimed at vectoring
towards deeper deposits (Cohen et al., 2010; Stewart, 2015; Kyser et al.; 2015).
Lithogeochemical boulder prospecting to identify alteration haloes of deposits at depth by their
clay mineralogy and elemental concentrations has been a widely used exploration technique
(Earle, 2001). However, occurrences of clay-alteration haloes not associated with economic
mineralization have also been observed, further encouraging the development of new exploration
techniques (Alexander et al., 2009).
High grade U deposits are a source for U, radiogenic Pb, and a suite of pathfinder
elements including Ni, Co, V, Cu, and As (Hoeve and Sibbald, 1978; Hoeve and Quirt, 1984;
Sibbald, 1985). Surface geochemical sampling programs may be conducted to identify
geochemical anomalies in radiogenic Pb and other pathfinder elements occurring from materials
that may have been mobilized to the surface from deeply buried deposits (Sibbald and Quirt,
1987; Stewart, 2015; Kyser et al., 2015). This upward movement of materials, such as radiogenic
3
Pb, is thought to occur through faults and fractures in the rocks (Holk et al., 2003). The
remobilized elements are subsequently transferred to surface media such as vegetation, soil, and
till (Cameron, 2012). However, transported materials at the surface have been identified by
relatively higher eU than eTh and K in airborne and ground radiometric surveys (Campbell et al.,
2002; Campbell, 2007). Therefore, geochemical anomalies, especially of U and radiogenic Pb,
must be interpreted carefully to determine if they are sourced from a deposit at depth or materials
at the surface.
The objective of this thesis was to develop methods to quantitatively analyze the
mineralogy of fine fractions of soils from a surface geochemical orientation survey conducted
over the Centennial uranium deposit located in the south-central region of the Athabasca Basin
(Figure 1.1). The goal was to identify minerals that commonly have high concentrations of U and
radiogenic Pb and to calculate the maximum contributions of those elements from the U-rich
minerals to the geochemical signature, particularly radiogenic Pb, of the samples, in an effort to
better characterize any geochemical anomalies.
4
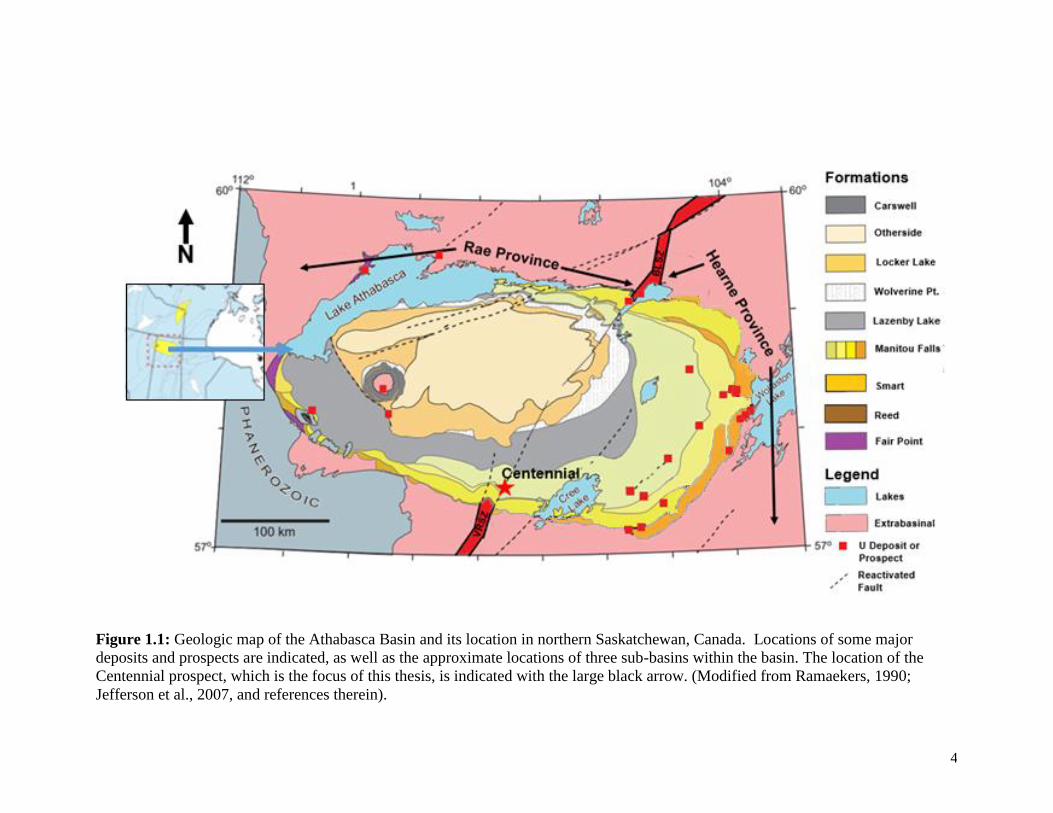
Figure 1.1: Geologic map of the Athabasca Basin and its location in northern Saskatchewan, Canada. Locations of some major
deposits and prospects are indicated, as well as the approximate locations of three sub-basins within the basin. The location of the
Centennial prospect, which is the focus of this thesis, is indicated with the large black arrow. (Modified from Ramaekers, 1990;
Jefferson et al., 2007, and references therein).
5
1.2 Geologic Setting of the Athabasca Basin
The Athabasca Basin is a large (~100,000 km2) Proterozoic intracratonic basin located in
northern Saskatchewan hosting a sedimentary sequence approximately 1.5 km in thickness,
consisting mainly of fluvial sandstone units known as the Athabasca Group (Ramaekers, 1990;
Ramaekers, 2007; Rainbird et al., 2007). The formation of the basin was a result of rapid uplift
and erosion of the Trans-Hudson Orogeny (Lewry and Sibbald, 1980; Ramaekers, 1990). The
Athabasca Basin has undergone extensive erosion, as suggested by fluid inclusion data that
indicated a paleo-depth of up to 6 km (Pagel et al., 1980).
The Athabasca Group unconformably overlies metamorphosed rocks of the Archean to
Paleoproterozoic Hearn and Rae Provinces that are divided by the Snowbird Tectonic Zone,
which is expressed at the surface as the Virgin River Shear Zone south of the basin, and as the
Black River Shear Zone in the north (Figure 1.1) (Hoffman, 1988). The Centennial project area
is located in the south-central region of the basin in the Virgin River Shear Zone (Figure 1.1).
The metamorphosed basement rocks are characterized by a paleoweathering profile that can
extend 50 m below the unconformity (Hoeve and Sibbald, 1978; Hoeve and Quirt, 1984;
Ramaekers, 1990). The basement rocks are dominantly deformed granitoid and supracrustal
gneisses, unconformably overlain by metamorphosed sedimentary rocks (Lewry and Sibbald,
1980).
The Athabasca Group was deposited from around 1760 Ma to 1500 Ma (Kyser et al.,
2000; Ramaekers, 2004). It is divided into four unconformity-bound sequences from the base to
the top of the basin: 1) the Manitou Falls (divided into a, b, c, and d members) and Fair Point
Formations, which are quartz rich, generally fining upward sequences with conglomerates being
more common near the base; 2) the Lazenby Lake and Wolverine Point Formations, consisting
6
of fluvial to marine sandstones with few siltstones and mudstones; 3) the Locker Lake and
Otherside Formations, which are predominantly sandstones; and 4) the Douglas and Carswell
Formations, which form a cap of marine mudstone and stromatolitic dolostone that are only
found at the Carswell Structure, in the west-central region of the basin (Figure 1.1) (Hoeve and
Quirt, 1984; Armstrong and Ramaekers, 1984; Ramaekers, 1990; Hiatt and Kyser, 2007). The
stratigraphic sequences of the Athabasca Group were deposited in three distinct, northeast-
southwest-trending sub basins: the Cree Basin in the east, the Mirror Basin in the central portion,
and the Jackfish Basin in the western region (Figure 1.1) (Hoeve and Quirt, 1984; Armstrong and
Ramaekers, 1985; Ramaekers, 1990). The Athabasca Basin is intruded by a swarm of gabbroic
diabase dikes with an approximate age of 1300 Ma (Armstrong and Ramaekers, 1985), which is
likely related to the McKenzie Dike Swarm (Cumming and Krstic, 1992). Regional diagenetic
alteration occurred throughout the basin, resulting in a dominant mineralogy of quartz with trace
minerals such as zircon, tourmaline, rutile, ilmenite, and very rare mica and feldspar (Ramaekers,
1990).
Several different ice flow directions have been recorded in the Athabasca Basin
(Schreiner, 1984; Millard, 1988; Dyke and Dredge, 1989; Campbell, 2007) indicating it has been
subjected to multiple glaciation events. Different generations of glacial deposits can be buried
under meters of till, but the most recent, and main regional ice-flow record was a result of the
late stages of Late Wisconsonian glaciation and deglaciation (Campbell, 2007), which blanketed
the surface of the Athabasca Basin with glacial drift (~90-95% coverage). Large fields of
streamlined drumlins are present in the central and western regions of the basin, and indicate that
the most recent ice flow direction was west-southwestern (Campbell, 2007; Campbell et al.,
2002). In the northern and western regions of the basin, the ice flow direction is dominantly west
7
and becomes more southwestern towards the southern and eastern regions of the basin (Figure
1.2). Glacial drift generally thins from west to east, and occurs only as a veneer at the eastern
margin of the basin (Campbell, 2007). At some sample locations, the boulders in the till can
consist entirely of extrabasinal clasts; erratics have been identified from several hundreds of
kilometers away (Campbell et al., 2002; Campbell, 2007).

8
Figure 1.2: Map of the Athabasca Basin showing the data from an airborne radiometric survey
and dominant ice flow directions, with different generations indicated by colours of arrows.
Intense magenta and blue colors (stronger eU and K signal relative to eTh) indicate extrabasinal
surface material; less intense green, yellow colors (stronger eTh relative to K and eU) indicate
basin-derived surface material. The large black star indicates the location of the Centennial
deposit, the focus of this study. (Modified from Campbell et al., 2007 and references therein)
9
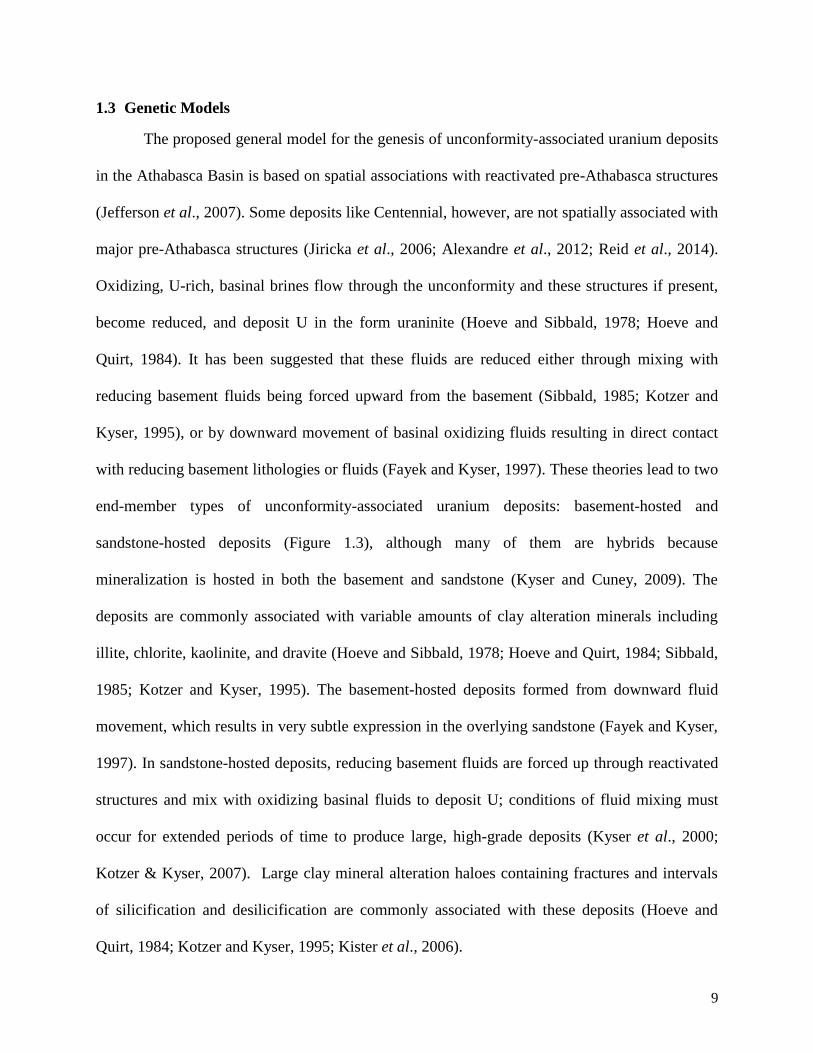
1.3 Genetic Models
The proposed general model for the genesis of unconformity-associated uranium deposits
in the Athabasca Basin is based on spatial associations with reactivated pre-Athabasca structures
(Jefferson et al., 2007). Some deposits like Centennial, however, are not spatially associated with
major pre-Athabasca structures (Jiricka et al., 2006; Alexandre et al., 2012; Reid et al., 2014).
Oxidizing, U-rich, basinal brines flow through the unconformity and these structures if present,
become reduced, and deposit U in the form uraninite (Hoeve and Sibbald, 1978; Hoeve and
Quirt, 1984). It has been suggested that these fluids are reduced either through mixing with
reducing basement fluids being forced upward from the basement (Sibbald, 1985; Kotzer and
Kyser, 1995), or by downward movement of basinal oxidizing fluids resulting in direct contact
with reducing basement lithologies or fluids (Fayek and Kyser, 1997). These theories lead to two
end-member types of unconformity-associated uranium deposits: basement-hosted and
sandstone-hosted deposits (Figure 1.3), although many of them are hybrids because
mineralization is hosted in both the basement and sandstone (Kyser and Cuney, 2009). The
deposits are commonly associated with variable amounts of clay alteration minerals including
illite, chlorite, kaolinite, and dravite (Hoeve and Sibbald, 1978; Hoeve and Quirt, 1984; Sibbald,
1985; Kotzer and Kyser, 1995). The basement-hosted deposits formed from downward fluid
movement, which results in very subtle expression in the overlying sandstone (Fayek and Kyser,
1997). In sandstone-hosted deposits, reducing basement fluids are forced up through reactivated
structures and mix with oxidizing basinal fluids to deposit U; conditions of fluid mixing must
occur for extended periods of time to produce large, high-grade deposits (Kyser et al., 2000;
Kotzer & Kyser, 2007). Large clay mineral alteration haloes containing fractures and intervals
of silicification and desilicification are commonly associated with these deposits (Hoeve and
Quirt, 1984; Kotzer and Kyser, 1995; Kister et al., 2006).
10
Figure 1.3: Schematic diagram showing the basement-hosted and sandstone-hosted end member deposit types and the potential
pathways for secondary dispersion of pathfinder elements. (Modified from Jefferson et al., 2007, and references therein).
11
1.4 The Centennial Deposit
This thesis focuses on an orientation surface geochemical survey conducted over the
Centennial deposit. Centennial represents the first discovery of significant mineralization along
the Virgin River Shear Zone structural trend (Jiricka and Witt, 2008). Mineralization is
predominantly hosted in the basement and is “mono-metallic” as it has relatively low
concentrations of Ni, Cu, As, and V compared to “poly-metallic” type deposits (Jiricka et al.,
2006). There is significant brittle deformation at the deposit, but no spatial association with
graphite rich basement lithologies or significant post Athabasca displacement (Ried et al., 2014).
Secondary uranyl minerals are common up to 100m above the deposit (Jiricka et al., 2006) with
brittle structures allowing late fluid movement including recent meteoric water (Alexandre et al.,
2012; Ried et al., 2014). Several intervals of > 20% U3O8 over 0.5m have been intersected in
diamond drill core (Jiricka et al., 2006).
The basement rocks underlying the project area are interpreted to be Virgin River Schists
(within the Virgin River Shear Zone) (Reid et al., 2014). The Manitou Falls Formation is the
only formation of the Athabasca Group that is present in the Centennial project area (Jiricka et
al., 2006), but Lazenby Lake, Wolverine Point, Locker Lake, and Otherside formations are
exposed north and northeast (up ice) of the area (Figure 1.1).
Unconsolidated Quaternary glacial deposits in the area range in thickness of
approximately 0-15m and up to 5% of the surface is exposed bedrock of the Manitou Falls
Formation (Jiricka et al., 2005). Surficial deposits in the project area consist mostly of
glaciofluvial outwash and hummocky terrain, till moraines and ridges, and alluvial plain deposits
(Jiricka et al., 2006). The relatively thin glacial cover and exposed bedrock suggests that surface
geochemical sampling may be an effective exploration tool here (Jiricka et al., 2005).
12
1.5 Exploration Methods
Large, Proterozoic, diagenetically-altered sandstone basins unconformably overlying
metamorphosed basement host all known unconformity-associated U deposits (Kyser and Cuney,
2009) and therefore are the first order exploration targets. In prospective basins, geophysical
methods including electromagnetic, gravity, seismic and magnetotelluric surveys may be
employed to identify conductivity trends from graphitic basement units related to reactivated
fault zones in the subsurface (Jefferson et al., 2007). Geochemical methods may then be applied
to target primary dispersion of mineralization-related minerals and their chemistry, or secondary
dispersion of elements related to mineralization through faults and fractures (Sopuck ., 1983;
Earl, 1983; Clark, 1987; Holk et al., 2003; Cohen et al., 2010; Stewart, 2015; Kyser et al., 2015).
There have been several proposed methods of secondary transport including fault related
dilatency pumping, ground water transport, and microbial activity (Aspandiar et al., 2008; Kelley
et al., 2006). The pathways for mineralizing fluids are faults and fractures in the bedrock. Large
clay alteration haloes may be important tools for geochemical exploration (Sopuck et al., 1983)
consisting of alteration-related mineralogy and brittle deformation creating pathways for element
dispersion through faults and fractures.
Geochemical surveys can involve sampling of various surface media including soil, till,
boulders, outcrops, vegetation, and near surface gases (Coker and Dunn, 1983; Dunn, 1983;
Hoeve and Quirt, 1984; Earle and Sopuck, 1989; Stewart, 2015; Kyser et al., 2015). For
geochemical soil surveys to be reliable, the proper soil horizon, size fraction, and extraction
methods must be employed (Hawkes and Webb, 1962; Rose et al., 1979). The soil type found in
northern Saskatchewan is podzol, which occurs in temperate humid climates where the dominant
vegetation is coniferous trees (Hawkes and Webb, 1962). Podzol consists of 3 profiles: A, B,
13
and C which are further divided into A0, A1, A2, B1, B2, and C (Hawkes and Webb, 1962; Rose et
al., 1979). The A0 horizon is composed entirely of decomposing plant material, A1 transitions
downwards becoming more mineral based. The A2 horizon is mainly quartz without organic
matter that has been “eluviated” or leached and mechanically removed by percolating meteoric
water (Hawkes and Webb, 1962; Rose et al., 1979). The components that are eluviated from the
A horizon “illuviate” or accumulate in the B horizon which is stained a bright orange color.
(Hawkes and Webb, 1962; Rose et al., 1979). The B2 horizon is a lighter colored transition to the
C horizon. The C horizon, which is closest to bedrock, is dominantly silt, clay and sand
composed of weathered bedrock and till. A recent Study of radiogenic Pb ratios in soils above
the Cigar Lake deposit in the Athabasca Basin (Kyser et al., 2015) indicated that soils closest to
the surface had less radiogenic Pb signatures than soils deeper because of anthropogenic input of
common Pb near the surface.
Radiogenic Pb ratios may be an effective secondary dispersion exploration tool (Holk et
al., 2003; Alexandre et al., 2009; Stewart, 2015; Kyser et al., 2015). In some studies (Holk et al.,
2003; Alexandre et al., 2009), the Pb207/Pb206 has been found to be very low in rocks at
mineralization and can be traced along faults and fractures hundreds of meters above deposits.
Common lead Pb207/Pb206 values varied between approximately 0.7-0.9, whereas radiogenic
values associated with uranium mineralization were as low as 0.08 (Holk et al., 2003; Alexandre
et al., 2009). A mixing of these “radiogenic” Pb isotopes with “common” Pb isotopes can result
in anomalously low Pb207/Pb206 ratios in rocks that overly uranium mineralization (Holk et al.
2003).
The rocks of the Athabasca Basin are dominantly quartz-rich (Hoeve and Sibbald, 1978;
Sibbald, 1985; Ramaekers, 1990) containing a regional U background in unmineralized rocks of
14
< 2 ppm (Fayek & Kyser, 1997); therefore, radiogenic Pb in unmineralized sandstone would be
unsupported and would indicate that the Pb was mobilized from an enriched U source (e.g. a
high grade deposit at depth) (Holk et al., 2003). Relative to the Athabasca Group, the basement
lithologies surrounding the basin area have much higher background concentrations in pathfinder
elements like U (7+ ppm) and radiogenic Pb, due to heavy minerals (> 3.1 g/cm3) such as zircon,
phosphates, and uraninite (Hecht and Cuney, 2000; Annesly et al., 2000). Uraninite has been
observed in pegmatoids near the eastern margin of the basin (Annesley and Madore, 1999).
Multiple glaciation events have dispersed basement lithologies across the Athabasca Basin
(Campbell et al, 2002; Campbell, 2007) possibly obscuring or overwhelming the surface
geochemical signature to produce anomalies that are related to glacially dispersed material,
rather than to a deposit at depth.
1.6 Project Purpose
The purpose of this project was to identify minerals in the fine fraction (< 63 µm) of soils
from an orientation surface geochemical survey, and to determine if there is a significant
contribution from these minerals to the surface geochemical signature, particularly radiogenic
Pb, of the soils.
A survey was conducted in the summer of 2013, at the Centennial uranium deposit
located in the south-central region of the Athabasca Basin (Figure 1.1). The clay sized (< 2 µm)
fraction was separated from the soil and digested in aqua regia to extract elements that had been
adsorbed to clay surfaces and the leachate was analyzed by Inductively-Coupled Plasma Mass
Spectrometry (ICP-MS) for 53 elements and Pb isotopic ratios. Although aqua regia is a
relatively strong acid solution, it cannot dissolve some minerals very easily, namely silicates
(Niskavaara et al., 1997). The reason for using aqua regia was to identify mobile elements in the
15
soil directly above the deposit outline, without getting a signal from minerals in the surficial
media. Radiogenic Pb signatures were found along geophysical lineaments related to brittle
deformation directly above the deposit, but some were not near the deposit outline or along
geophysical lineaments (Figure 1.4) (Uravan unpublished data, 2013).
For this thesis, samples from Centennial with radiogenic and common Pb signatures in
the clay sized fraction were selected for quantitative mineralogical analysis to determine if there
was a relationship between mineral abundances in soils, trace element concentrations in U-rich
minerals like zircon and monazite, and the geochemical signature in the clay sized fraction of
soils, particularly radiogenic Pb. Although zircon is generally chemically untouched by aqua
regia (Niskavaara et al., 1997; Evans et al., 2005), radiation can damage its crystal structure,
allowing it to be at least partially dissolved in acidic conditions (Ewing et al., 1982; Tole, 1985;
Balan et al., 2001). Regional airborne radiometric surveys (Campbell et al., 2002, 2003, 2007;
Campbell and Shives, 2000; Carson et al., 2002) measuring the relative K, eTh and eU signal of
the surface suggest that the eastern margin of the basin contains the most extrabasinal glacial
drift material, whereas the central and western regions of the basin contain glacial drift
dominantly derived from the basin (Figure 1.2). However, extrabasinal material is commonly
dominant in the core of streamlined glacial drift landforms such as drumlins (which are present
in the central and western regions of the basin directly up-ice of Centennial), whereas basinal
material is dominant near the surface of these landforms (Campbell, 2007). It is therefore evident
that some extrabasinal material at or near the surface may not be reflected in airborne
radiometric surveys. Several previous surficial studies, in addition to the surficial geochemical
exploration program of 2013, have identified extrabasinal material at Centennial (Jiricka et al.,
2005; Jiricka, et al., 2006; Uravan unpublished data, 2013).
16
Even in an area with limited abundance of extrabasinal material, a small abundance of U-
rich minerals such as zircon or monazite present in the soil may still have an effect on the
radiogenic Pb signature of the clay sized fraction. This thesis was completed to develop a method
for quantifying the mineralogy in the soil, and analyzing trace element concentrations of U-rich
minerals to determine the effect they may have on the radiogenic Pb signature of the clay sized
fraction at Centennial.
A process for heavy mineral concentration was developed using the HS-11 software-
controlled hydroseparator (CNT Minerals), to collect a representative population of the rare, U-
rich heavy minerals found in each sample. A method to mount the separated minerals whilst
preserving their representative distribution was also devised, and these mounts were then
analyzed using a Scanning Electron Microscope (SEM) for mineral identification, and Mineral
Liberation Analysis (MLA) technique for quantification. The trace element concentrations found
in the mineral separates were then analyzed using Laser Ablation Inductively Coupled Plasma
Mass-Spectrometry (LA-ICP-MS).
17
Figure 1.4: Locations of 14 selected samples (2 off map) (stars) with respect to the projected deposit outline, 207Pb/206Pb values from
clay fraction (<2µm), and geophysical anomalies and lineaments. Samples off the map had 207Pb/206Pb values >0.60. Stars labeled
with sample IDs represent samples chosen for this study. Black and red dots represent sample sites for the 2013 geochemical survey
(Uravan, 2013).
18
1.7 Thesis Layout
This thesis is divided into three chapters: introduction, manuscript, and conclusions. The
geographic location, the geologic setting, and the purpose of the project, and the reasoning
behind it, are outlined in the introduction. Chapter two includes a short introduction, a
description of the methods used and developed during this project, a presentation of the results,
as well as discussion of the results and conclusions to be drawn from them. The manuscript will
be submitted to Geochemistry: Exploration, Environment, Analysis (GEEA). The last chapter
will summarize and highlight the significance of the results and suggest future work. All data
that produced or used during the course of this project, and is not displayed in the manuscript
chapter is included in the Appendices.
19
Chapter 2: Zircon in soils from the Centennial Uranium Deposit in
Athabasca Basin and the implications for exploration geochemistry of
uranium deposits at depth
2.1 Introduction
Unconformity-related U deposits occur as semi-massive replacements, veins, and pods of
mainly uraninite located near the unconformity between Proterozoic, U-depleted, red-bed
sandstones, and metamorphosed, U-rich, Archean to Paleoproterozoic crystalline basement
rocks, including supracrustal gneiss and graphitic metapelite (e.g. Kyser and Cuney, 2015).
These deposits commonly form at major fault zones that exhibit a structural displacement of
basement and overlying sandstone rocks (Hoeve and Quirt, 1984). The genetic model for these
deposits involves reducing fluids originating from the basement and oxidizing basinal brines
mixing at a relatively immobile redox front controlled by structures in the basement and
overlying sandstone, commonly resulting in a large clay-mineral alteration halo above the
deposit (Hoeve and Sibbald, 1978; Sibbald, 1985). In addition, some unconformity-related
deposits form by oxidizing basinal brines being reduced directly by basement rocks or mafic
intrusives, resulting in dominantly basement-hosted mineralization with a subtle, less extensive
clay-mineral alteration halo (Fayek & Kyser 1997; Holk et al., 2003; Kyser and Cuney, 2015).
The Athabasca Basin is a large (~100,000 km2) Proterozoic intracratonic basin located in
northern Saskatchewan and Alberta (Figure 2.1). Although most deposits are located in the
eastern part of the basin (Figure 2.1), the Centennial U deposit, the focus of this study, is a high-
grade (~8 wt% U3O8) unconformity-related deposit that is located in the south-central region of
the Athabasca Basin (Figure 2.1). Airborne and ground geophysics (resistivity, electromagnetics
(EM), gravity) have delineated conductors, resistivity lows, gravity lows, and linear geophysical
20
trends (lineaments) related to structures (Figure 2.2) along a major regional fault zone at the
Centennial project (Uravan, 2013). The deposit, which is about 950 meters below the surface,
was outlined by several drill holes following the discovery hole drilled in 2004 (Jiricka et al.,
2006). Unlike typical unconformity-related U deposits, the Centennial deposit is not directly
associated with significant post-Athabasca structural displacement or graphitic conductors (Reid
et al., 2014). The Centennial deposit is dominantly basement hosted, but is associated with late
clay alteration and brittle structures that extend from the basement to the surface and host
perched secondary U mineralization up to 100m above the unconformity (Jiricka et al., 2006;
Alexandre et al., 2012; Reid et al., 2014). Surface media including soils from tills and tree-cores
were collected both proximal and distal to the deposit projection to the surface as part of an
orientation survey by Uravan Minerals in 2013, to evaluate the use of surface geochemistry in
detecting deep deposits.
21
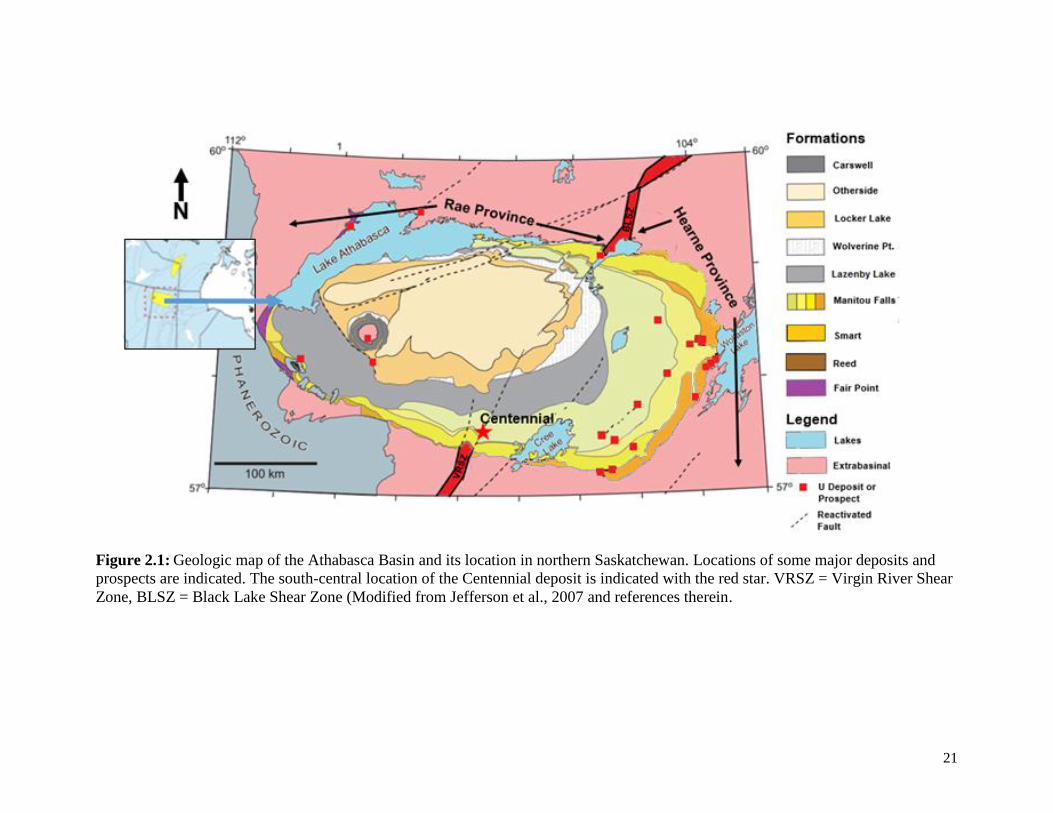
Figure 2.1: Geologic map of the Athabasca Basin and its location in northern Saskatchewan. Locations of some major deposits and
prospects are indicated. The south-central location of the Centennial deposit is indicated with the red star. VRSZ = Virgin River Shear
Zone, BLSZ = Black Lake Shear Zone (Modified from Jefferson et al., 2007 and references therein.
22
Traditional mineral exploration for unconformity-related U deposits is focused in large,
Proterozoic sandstone basins where geophysical methods are used to delineate reactivated
basement structures and graphitic conductors (Sibbald and Quirt, 1987). Surface geochemical
surveys to identify anomalous concentrations of pathfinder elements such as Pb, Ni, Co, Cu, B,
As, Zn, Mn, Fe, V, Ag, Se, Au, S, and PGEs (Sibbald, 1985) are sometimes conducted to detect
primary dispersion of pathfinder elements or alteration clay mineralogy that formed syn-ore
(Hoeve and Quirt, 1984; Sopuck et al., 1983). In addition, 207Pb/206Pb ratios in surficial media
can reflect secondary post-ore dispersion of radiogenic Pb from the decay of U deposits at depth
(Holk et al., 2003; Alexandre et al., 2009; Stewart, 2015; Kyser et al., 2015), although such
components may also come from detrital material in the soils and tills and be unrelated to a
deposit below.
This study examined an area far down ice (>100 km) of any out-cropping Archean and
Paleoproterozoic basement rocks in the Athabasca Basin to determine what U-rich heavy
minerals are in glacial sediments at surface above the buried Centennial deposit and whether
these minerals can explain the Pb isotope anomalies in the clay fraction of soils from tills above
and near the deposit projected to the surface. The purpose of this study is to identify mineral
abundances, particularly in the small size fraction (<63 µm), of soil samples from above the
Centennial deposit, to calculate the contribution of radiogenic Pb and U from U-rich minerals in
the tills, and to suggest a method to identify “false” radiogenic Pb anomalies caused by U-rich
minerals at the surface. The premise of this study was to determine if there were significant
amounts of extrabasinal-derived sediments at the Centennial deposit; if there is significant
influence from extrabasinal derived material at Centennial, then areas more proximal to the
influence of down-ice sub-cropping basement rocks would be more likely to have higher
23
amounts of extrabasinal material at surface and higher potential for radiogenic Pb contamination
from the extrabasinal material.
2.2 Regional and Local Geology
The Athabasca Basin consists of fluvial to marine siliciclastic units of the Athabasca
Group (Ramaekers, 1990). The basin has a maximum thickness of approximately 1.5 km, but
regional homogenization studies of fluid inclusions from euhedral quartz indicates a possible
paleo-maximum thickness of up to 6 km (Pagel et al., 1980). Regional diagenesis occurred
across the entire basin and, as a result, the preserved detrital mineralogy of the Athabasca Group
is dominantly quartz that is interbedded with variably-altered rare heavy mineral (i.e., zircon,
rutile, and ilmenite) bands (Ramaekers, 1990). The basin unconformably overlies
metamorphosed sedimentary and igneous rocks of the Archean to Paleoproterozoic Hearne and
Rae provinces that are divided by the Virgin River and Black Lake Shear Zones (VRSZ and
BLSZ) (Fig. 2.1; Hoffman, 1988). The metamorphosed basement rocks display a regional
paleoweathering profile that can extend over 50 m below the unconformity (Ramaekers, 1990).
The Athabasca Basin is intruded by diabase dikes that are ca. 1300 Ma (Armstrong and
Ramaekers, 1985) and probably are related to the Mackenzie Dike Swarm (Cumming and Krstic,
1992).
The Centennial deposit is located in the south-central region of the Athabasca Basin on
the eastern side of the VRSZ adjacent to the Hearne Province (Figure 2.1). The inferred location
of the Dufferin Fault, which is a major reactivated post-Athabasca structure, is approximately
300m west of the deposit (Figure 2.2). The Dufferin fault is a W-NW dipping thrust fault that
may have acted as a major fluid conduit during mineralization (Jiricka, 2010). The VRSZ and the
Dufferin Fault in this area were the cause of a complex brittle structural framework that allowed
24
movement of mineralizing basinal fluids between the basin and basement rocks (Reid et al.,
2014). Mineralization is dominantly hosted in the basement with late, sub-economic perched
mineralization found up to 100m above the unconformity (Reid et al., 2014). The deposit is
intruded by diabase that is related to the Mackenzie Dike swarm (Reid et al., 2014). The brittle
structural framework in the area has allowed periodic fluid movement up to present day (Reid et
al. 2014).
25
Figure 2.2: Location of 13 selected samples (stars) with respect to the projected Centennial deposit outline projected to surface, 207Pb/206Pb values from clay-fractions (<2 µm) separated from B/C horizon soils (red stars = radiogenic Pb, black stars = common Pb),
and geophysical anomalies and lineaments. Black and red dots represent sample sites for the 2013 geochemical survey (Modified from
Uravan, 2013). Two additional samples are on the same sampling grid line as WL066, but off the map ~3 km to the NW (WL060) and
~4 km to the SE (WL087). Both off the map samples had 207Pb/206Pb values >0.60.
26
Regional surficial geology consists mainly of till, glaciofluvial, and glaciolacustrine
deposits (Campbell et al, 2002, Carson et al, 2002, Jiricka et al., 2006). Glaciolacustrine deposits
in the area commonly occur as large, flat-lying, silty sand deposits whereas other till and
glaciofluvial deposits typically occur as courser sediments (Campbell et al., 2007). The most
recent regional ice flow direction, indicated by streamlined glacial landforms, is dominantly
west-southwest (Figure 2.3). Regional airborne radiometric surveys (Campbell, 2007; Campbell
et al., 2002, 2003; Campbell and Shives, 2000; Carson et al., 2002) measuring K, eTh and eU
contents at the surface (Figure 2.3) indicate that the eastern margin of the basin contains the most
extrabasinal glacial drift material and the central and western regions of the basin contain
surficial glacial drift derived mainly from the basin (Campbell et al., 2002; Carson et al., 2002;
Campbell, 2007). Near the northern and eastern margins of the basin, the extrabasinal material
follows the direction of ice flow patterns. To the south and west of the basin, sandstone-rich till
also follows the directions of ice flow patterns (Figure 2.3). Surficial deposits at the Centennial
deposit consist mostly of basin-derived glaciofluvial outwash, glaciolacustrine plains,
hummocky terrain, till moraines and ridges, and alluvial plain deposits (Jiricka et al., 2006). The
surface geology dominantly represents the most recent dominant ice flow (Campbell, 2007), but
other generations of glacial deposits may be present deeper below the surface.
27
Figure 2.3: Map showing the dominant direction of ice flow (arrow colours indicate generation)
and the normalized eTh (equivalent Th), K and eU from an airborne radiometric survey. Intense
magenta, blue, green, and yellow colours indicate extrabasinal surface material; less intense
green, yellow, and white colors indicate basin derived surface material. The black star indicates
the location of the Centennial deposit. (Modified from Campbell, 2007, Campbell et al., 2002,
Carson et al., 2002, and references therein).
28
The Centennial deposit is down ice (>100 km; most recent ice flow event) from any
exposed basement lithologies (Figure 2.1; Figure 2.3). Regional radiometric surveys suggest very
little extrabasinal material in the Centennial project area (Figure 2.3), but some of the boulders
observed in a recent surface geochemical survey were extrabasinal granitoids and metapelites
(Unpublished Uravan data, 2013). Extrabasinal material was also observed in the pebble-size
fraction during earlier soil sampling programs in the area (Jiricka et al., 2005, Jiricka et al.,
2006). Extrabasinal material in the boulder, pebble, and smaller size fractions in till at the surface
or in till that is several meters below the surface may contain high abundances of U-rich minerals
that could affect radiogenic Pb and geochemical anomalies in surficial media above the
Centennial deposit.
2.3 Pb isotopes and U concentrations in exploration for U deposits
The 207Pb isotope is the stable decay product of the 235U isotope, which has a half-life of
ca. 0.70 Ga and the 206Pb isotope is the stable decay product of the 238U, which has a half-life of
ca. 4.46 Ga (Jaffey et al., 1971). About 99.28% of natural U is the 238U isotope whereas about
0.72% of natural U is the 235U isotope (Bievre and Taylor, 1993). Most rocks have Pb that
reflects a mixture from the original accretion of the Earth plus that produced from the decay of
U. Common Pb typically refers to 204Pb. However, Pb isotopic ratios (including 204Pb, 206Pb,
207Pb, and 208Pb) may be referred to as common or radiogenic Pb depending on the ratio. Given
that most rocks have similar U/Pb ratios, most Pb has a 207Pb/206Pb ratio referred to as “common
Pb” which is not to be confused with 204Pb. As a consequence of the relatively faster decay rate
of 235U, 207Pb/206Pb ratios of “common Pb” are about 0.91. However, in the presence of U-rich
29
sources, 207Pb/206Pb ratios as low as 0.07 occur due to the increasing relative abundance of 238U
(Catanzaro et al., 1968). Secondary dispersion of radiogenic Pb hundreds of metres from a high-
grade U deposit can result in anomalously low 207Pb/206Pb ratios in bedrock and surficial media
because of the increased 206Pb from U-rich sources (Holk et al., 2003; Alexandre et al., 2009;
Stewart, 2015; Kyser et al, 2015).
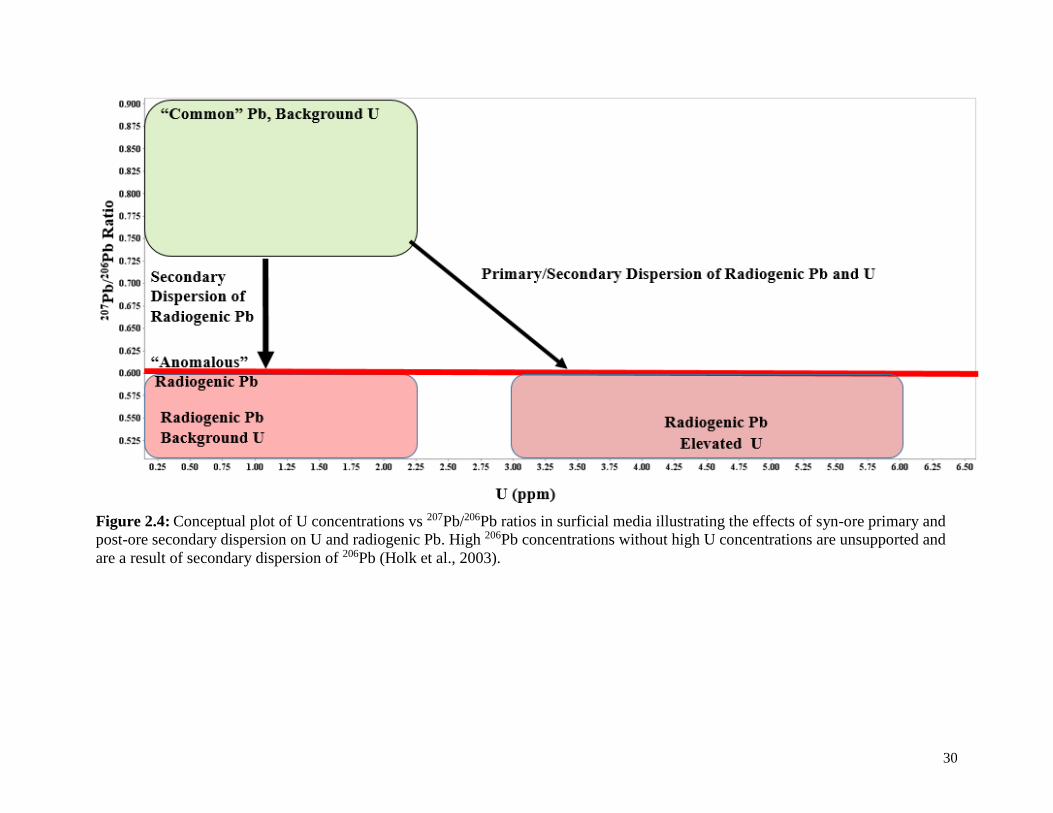
Elevated concentrations of U in the Athabasca Basin may be sourced from either primary
or secondary dispersion (Figure 2.4). Primary dispersion occurs at depth under relatively high
pressure and temperature (Hawkes and Webb, 1962), and in the Athabasca Basin, during a U
mineralizing event. Secondary dispersion occurs at relatively lower pressures and temperatures
and commonly occurs due to mobilization by post-ore fluids (Hawkes and Webb, 1962; Rose et
al., 1979). Secondary dispersion of U in the Athabasca Basin may occur over time from a deposit
at depth or from glacial dispersion of U-rich lithologies, such as U deposits near the surface or
basement rocks having U-rich phases such as monazite and zircon.
Radiogenic Pb dispersed from a U deposit at depth after the deposit formed is
unsupported, meaning that the Pb lacks the presence of U-rich source in the same sample (Figure
2.4). Radiogenic Pb in the presence of U may be a result of a combination of primary or
secondary U and secondary dispersion of radiogenic Pb (Figure 2.4). Elevated U contents
without radiogenic Pb is likely a result of recent secondary dispersion of U or removal of
radiogenic Pb (Figure 2.4).
30
Figure 2.4: Conceptual plot of U concentrations vs 207Pb/206Pb ratios in surficial media illustrating the effects of syn-ore primary and
post-ore secondary dispersion on U and radiogenic Pb. High 206Pb concentrations without high U concentrations are unsupported and
are a result of secondary dispersion of 206Pb (Holk et al., 2003).
31
The rocks of the Athabasca Basin are dominantly quartz-rich (Hoeve and Sibbald, 1978,
Sibbald, 1985, Ramaekers, 1990) containing a regional U background of approximately 1-2 ppm
(Fayek & Kyser, 1997). Therefore, radiogenic Pb in unmineralized sandstone that is unsupported
must have been mobilized from a U-rich source such as a high grade deposit at depth (Holk et
al., 2003). Basement lithologies surrounding the basin area have much higher concentrations of
pathfinder elements like U (ca. 15 ppm) and radiogenic Pb because of their inventory of heavy
minerals (specific gravity >3.1) such as zircon, phosphates, and uraninite (Hecht and Cuney,
2000; Annesley et al., 2000). The Athabasca Basin is more than 90% covered by glacial
sediments (Campbell, 2007), so the surface contains a mixture of basinal and extrabasinal
material. Heavy minerals within glacial sediments may be derived from sources outside of the
Athabasca Basin, and may therefore contain relatively high abundances of pathfinder elements
and radiogenic Pb that may cause surface anomalies not related to a deposit at depth (i.e. false
anomalies).
2.4 Methods
2.4.1 Sample Collection and Analysis from Surface Geochemical Survey
Soil samples were collected with 50m spacing on a grid around the projected surface
expression of the deposit outline. Spacing was spread to 100m and 200m moving away from the
deposit outline (Figure 2.2). Four hundred ninety-five samples of approximately 1 kg of A2, B2
or C horizon soils were collected from approximately 40-50 cm below the surface. The soil in
the study area is podzol, with A, B, and C horizons that were further divided into A0, A1, A2, B1,
B2, and C (Hawkes and Webb, 1962; Rose et al., 1979). Descriptions and typical depths of each
soil horizon are summarized in Table 2.1. The A2 horizon was only collected when its depth
32
continued below 50 cm; this commonly occurred near streams or on steep slopes. In most cases,
the B2 horizon was collected due to a poorly defined C horizon. At 45 of the soil sample sites, 2
kg ‘bulk soil’ samples were collected for heavy minerals in the 63-180 μm fraction. The bulk soil
samples were passed through methylene iodide heavy liquid separation and the mineralogy of
heavy minerals concentrates (HMC) in the 63-180µm size fraction was determined by
Overburden Drilling Management Inc. (ODM) on a subset of 100 grains.
Splits of the soils were taken and stored at Queen’s University. The clay-fraction of the
soil (<2 µm) was separated for analysis because clay minerals have charged surfaces that can
easily adsorb cations (Hawkes and Webb, 1962). The clay-sized fraction was separated from 2
mm sieved soil by ultrasonic disaggregation and centrifugation at Queen’s Facility for Isotope
Research. Clay-fraction samples (n=449) were sent to ACME Labs (now Bureau Veritas) in
Vancouver and digested in aqua regia (3:1 HCl:HNO3) for one hour at 90⁰ C and the leachate
analyzed for 53 elements and 204Pb, 206Pb, 207Pb, and 208Pb isotopes using ICP-MS. Aqua regia
was used to liberate elements adsorbed onto the clay surfaces because residual elements not
released by aqua regia are mostly bound to silicate lattices and are not important for analyzing
element mobility in soils (Niskavaara et al., 1997).
33
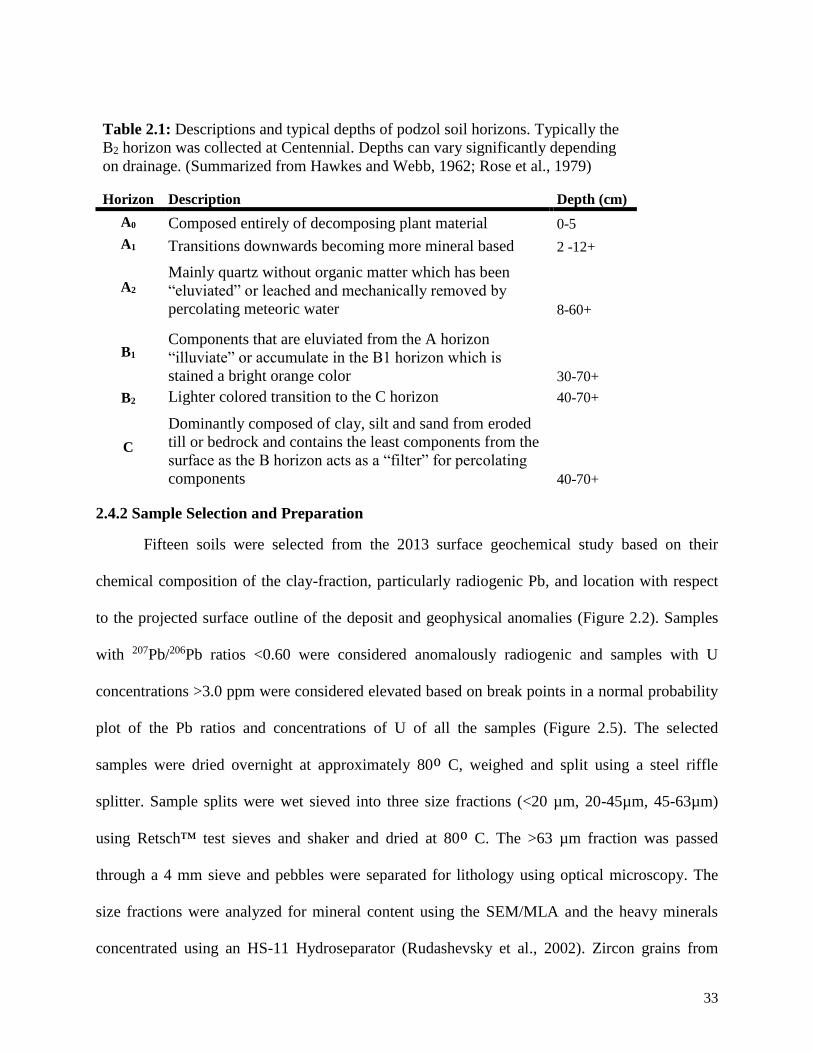
Table 2.1: Descriptions and typical depths of podzol soil horizons. Typically the
B2 horizon was collected at Centennial. Depths can vary significantly depending
on drainage. (Summarized from Hawkes and Webb, 1962; Rose et al., 1979)
Horizon Description Depth (cm)
A0 Composed entirely of decomposing plant material 0-5
A1 Transitions downwards becoming more mineral based 2 -12+
A2 Mainly quartz without organic matter which has been
“eluviated” or leached and mechanically removed by
percolating meteoric water 8-60+
B1 Components that are eluviated from the A horizon
“illuviate” or accumulate in the B1 horizon which is
stained a bright orange color 30-70+
B2 Lighter colored transition to the C horizon 40-70+
C
Dominantly composed of clay, silt and sand from eroded
till or bedrock and contains the least components from the
surface as the B horizon acts as a “filter” for percolating
components 40-70+
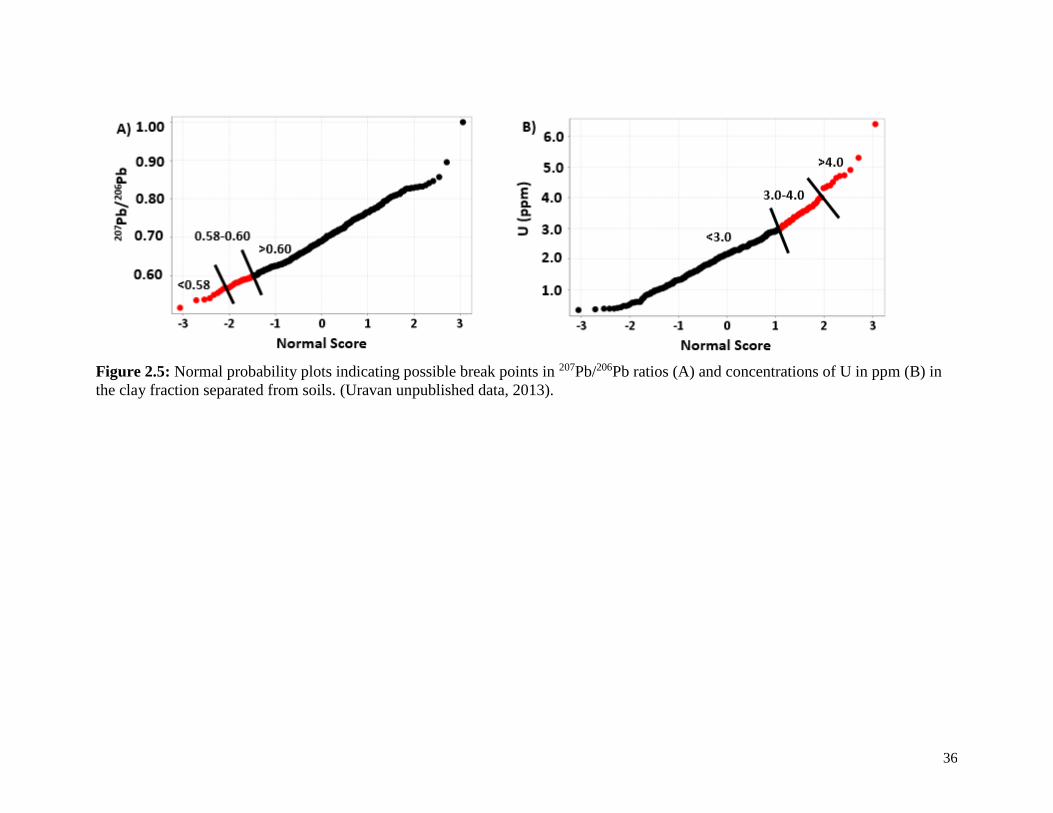
2.4.2 Sample Selection and Preparation
Fifteen soils were selected from the 2013 surface geochemical study based on their
chemical composition of the clay-fraction, particularly radiogenic Pb, and location with respect
to the projected surface outline of the deposit and geophysical anomalies (Figure 2.2). Samples
with 207Pb/206Pb ratios <0.60 were considered anomalously radiogenic and samples with U
concentrations >3.0 ppm were considered elevated based on break points in a normal probability
plot of the Pb ratios and concentrations of U of all the samples (Figure 2.5). The selected
samples were dried overnight at approximately 80⁰ C, weighed and split using a steel riffle
splitter. Sample splits were wet sieved into three size fractions (<20 µm, 20-45µm, 45-63µm)
using Retsch™ test sieves and shaker and dried at 80⁰ C. The >63 µm fraction was passed
through a 4 mm sieve and pebbles were separated for lithology using optical microscopy. The
size fractions were analyzed for mineral content using the SEM/MLA and the heavy minerals
concentrated using an HS-11 Hydroseparator (Rudashevsky et al., 2002). Zircon grains from
34
HMC were analyzed for U and Pb isotopic concentrations using LA-ICPMS and their
morphology analyzed using SEM.
An HS-11 software controlled hydroseparator was used to concentrate heavy minerals for
analysis by LA-ICPMS. The hydroseparator uses a gravity tank to create a constant hydraulic
head and a computer-controlled oscillating pulse-regulator to control a flow and pulse of water
through curved vertical glass separation tubes (GST) of different sizes. Within the GSTs,
minerals are sorted by size and density based on Stoke’s Law. The pulse regulator settings are
divided into modes 1.1-1.5 for concentration. As the mode number increases, the intensity of the
pulse increases and the pulse frequency decreases. The water flow was set at a constant rate of
25-95 ml/min that depended on the size fraction. Initial concentrates are produced using a large
glass separation tube (LGST) and final concentrates are produced using a small glass separation
tube (SGST).
Mineral abundances in the HMC were determined using the Mineral Liberation Analyzer
for the SEM. Concentration factors were calculated by dividing the HMC mineral abundances by
the non-hydroseparated mineral abundances. After initial concentration factors were calculated
on the first ten samples, higher flow rates and pulse regulator modes were used for the last five
samples to improve concentration factors. Table 2.2 summarizes the operating parameters used
for the HS-11 hydroseparator.
35
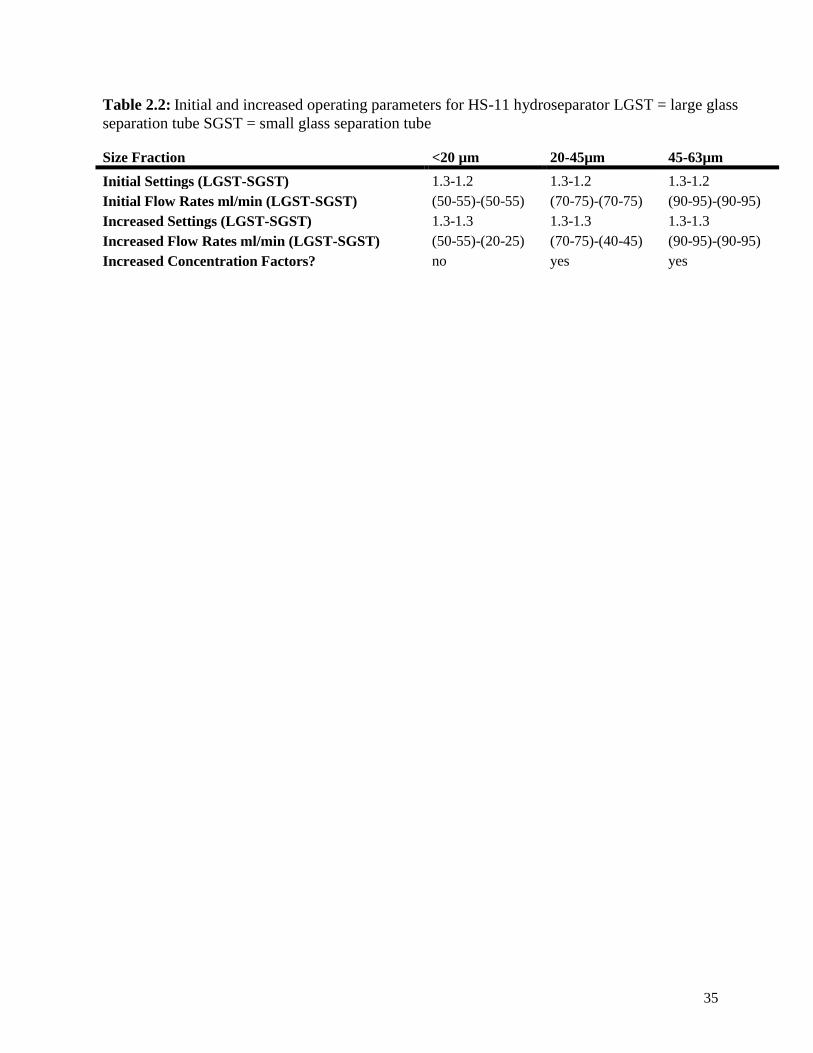
Table 2.2: Initial and increased operating parameters for HS-11 hydroseparator LGST = large glass
separation tube SGST = small glass separation tube
Size Fraction <20 µm 20-45µm 45-63µm
Initial Settings (LGST-SGST) 1.3-1.2 1.3-1.2 1.3-1.2
Initial Flow Rates ml/min (LGST-SGST) (50-55)-(50-55) (70-75)-(70-75) (90-95)-(90-95)
Increased Settings (LGST-SGST) 1.3-1.3 1.3-1.3 1.3-1.3
Increased Flow Rates ml/min (LGST-SGST) (50-55)-(20-25) (70-75)-(40-45) (90-95)-(90-95)
Increased Concentration Factors? no yes yes
36
Figure 2.5: Normal probability plots indicating possible break points in 207Pb/206Pb ratios (A) and concentrations of U in ppm (B) in
the clay fraction separated from soils. (Uravan unpublished data, 2013).
37
One hundred pebbles from each sample that contained pebbles were counted and split
into two categories based on their lithology. Sandstone pebbles were considered basinal material
because the Athabasca Basin is almost entirely sandstone (Ramaekers, 1990). All other
lithologies (commonly metapelite and granitoid) were considered extrabasinal material.
Proportions of lithologies were expressed as a percent. Pebble lithology counting was conducted
to compare proportions of extrabasinal material in the pebble fraction to proportions of heavy
minerals in the <63 μm fraction because extrabasinal material is assumed to be the dominant
source of heavy minerals.
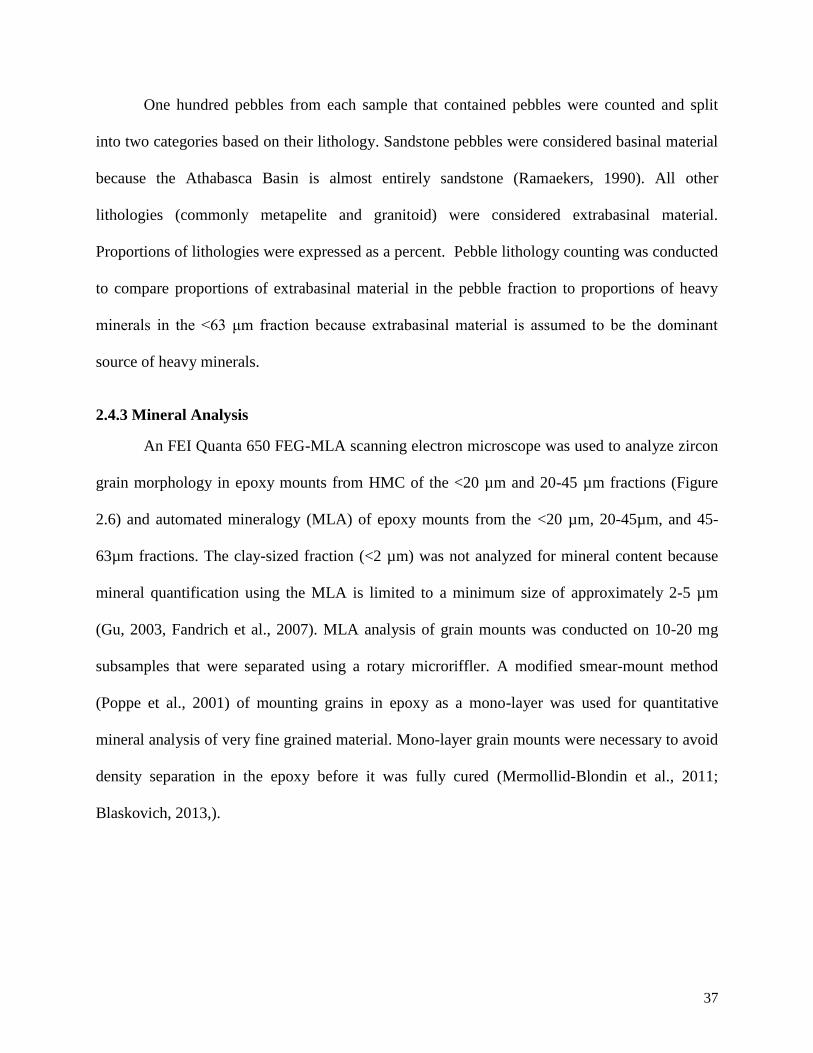
2.4.3 Mineral Analysis
An FEI Quanta 650 FEG-MLA scanning electron microscope was used to analyze zircon
grain morphology in epoxy mounts from HMC of the <20 µm and 20-45 µm fractions (Figure
2.6) and automated mineralogy (MLA) of epoxy mounts from the <20 µm, 20-45µm, and 45-
63µm fractions. The clay-sized fraction (<2 µm) was not analyzed for mineral content because
mineral quantification using the MLA is limited to a minimum size of approximately 2-5 µm
(Gu, 2003, Fandrich et al., 2007). MLA analysis of grain mounts was conducted on 10-20 mg
subsamples that were separated using a rotary microriffler. A modified smear-mount method
(Poppe et al., 2001) of mounting grains in epoxy as a mono-layer was used for quantitative
mineral analysis of very fine grained material. Mono-layer grain mounts were necessary to avoid
density separation in the epoxy before it was fully cured (Mermollid-Blondin et al., 2011;
Blaskovich, 2013,).
38
Figure 2.6: BSE images of typical zircon grain morphologies in the <20 µm fraction from
samples WL008 (A), WL087 (B), and WL038 (C). WL087 has the lowest calculated radiogenic
Pb contribution from zircons (0.002), whereas WL038 has the highest (0.078). Chemical zoning
was commonly observed. The majority of the grains are broken pieces of larger grains (Left), but
some are unbroken zircon crystals (Right). Zr=zircon, Qtz=quartz, Hbl=Hornblende, Kspar= K-
feldspar
39
The MLA uses backscatter electron (BSE) imaging to define grain/background
boundaries along with energy dispersive x-ray spectrometry (EDS) and a library of EDS spectra
to identify mineral phases. The parameters for the MLA measurements included 25 kV, a beam
diameter of 4.8-5 nm, and a magnification of 400x for the 2-20 µm size fraction (referred to as
the <20 μm fraction) and 240x for the larger size fractions. Brightness and contrast for BSE
imaging were calibrated to a copper elemental standard. Minerals within the sample were
matched to modified EDS spectra (FEI Standard Mineral Reference Library; Severin, 2004) and
were used as standards for all of the samples. MLA was used to quantify the mineral content of
both unprocessed (non-hydroseparated) and heavy mineral concentrated samples (Fandrich et al.,
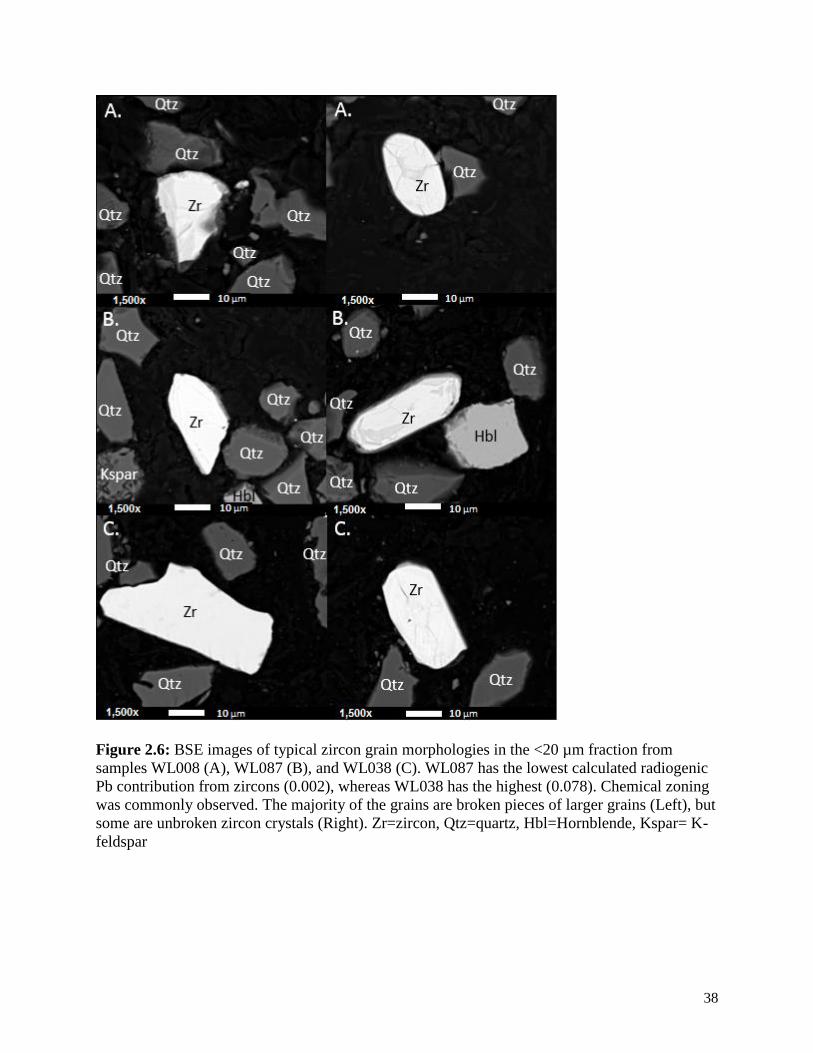
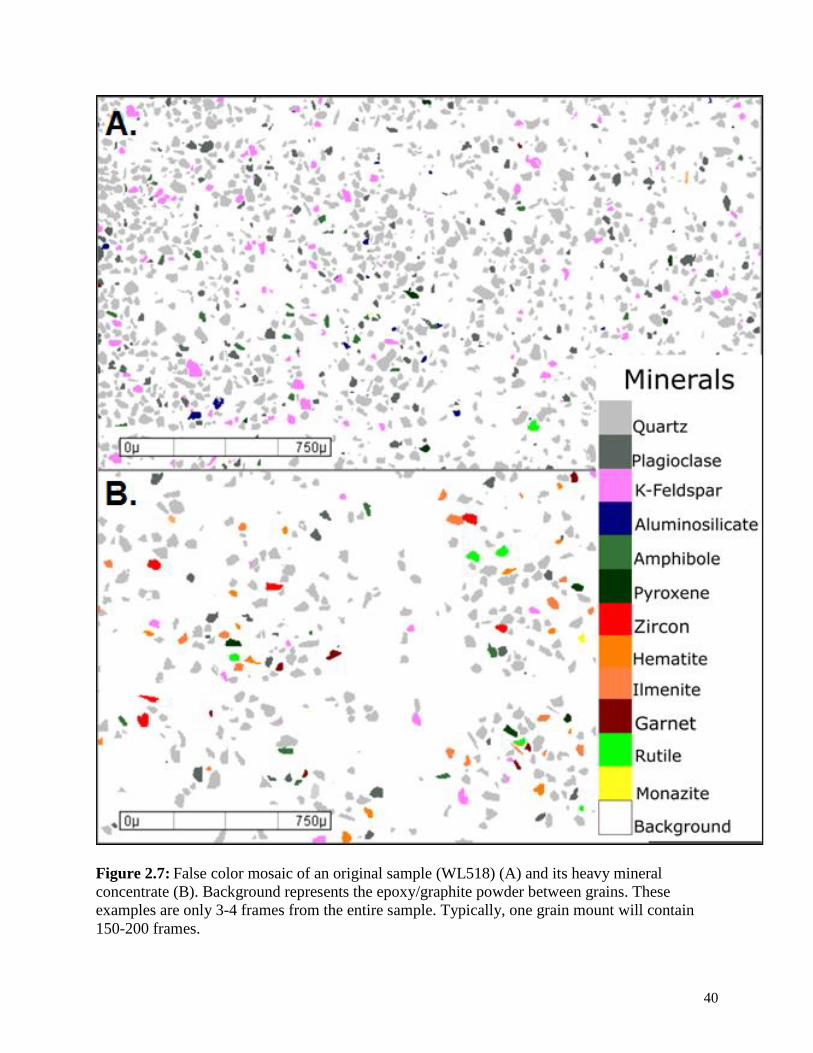
2007). An MLA false color mosaic (Figure 2.7) was created for each mount, which identified
grains (up to 350,000 particles) after assigning a color for each mineral EDS spectra. The MLA
mosaic was used to locate rare minerals in the grain mounts, like zircon, to be investigated using
LA-ICPMS. Minerals were assigned an average density (Klein and Dutrow, 2008; FEI Standard
Mineral Reference Library), such that mineral abundances by weight percent could be defined
using modal data produced by the MLA software.
40
Figure 2.7: False color mosaic of an original sample (WL518) (A) and its heavy mineral
concentrate (B). Background represents the epoxy/graphite powder between grains. These
examples are only 3-4 frames from the entire sample. Typically, one grain mount will contain
150-200 frames.
41
Electron probe microanalysis (EPMA) was used on 30 zircon grains from 4 different
HMC to determine U and Pb concentrations using an automated JOEL JXA-8230 with 5
wavelength dispersive spectrometers. Elements analyzed included Si, Zr, Hf, U, Th, Y and Pb,
although Pb concentrations were below detections limits (<150 ppm). Data were acquired using a
1-2 µm focused beam, 15 kV acceleration voltage and 100 nA beam current with peak and
background counting times of 10s for Zr and Si, 60s for Hf, 120s for Y, 200s for U and Pb, and
240s for Th. Zircon NMNH was the standard used for Zr, Hf and Si, synthetic UO2, ThO2 and
YO2 from the U.S. Atomic Energy Commission were used as standards for U, Th, and Y, and
Cerussite (Tsumbeb, GSC no. 66) was used for a Pb standard. Matrix-corrections were done
using JEOL PC-EPMA version 1.9.2.0, atomic number and absorption corrections were done
using XPP (Pouchou and Pichoir), the MAC database was FFAST from Chandler et al. (2005),
and the method of Reed (1990) was used for fluorescence correction. EPMA was performed to
determine a range of expected U and Pb concentrations so that proper standards could be used
for LA-ICPMS.
Laser ablation inductively-coupled-plasma mass spectrometry (LA-ICPMS) was done
with a ThermoScientific Element XR® ICP-MS and a ThermoScientific XSeries 2® quadrapole
ICP-MS coupled to an ESI NWR 193 nm ArF Excimer laser system. A total of 168 zircon grains
from the 20-45 µm fraction of the heavy mineral concentrate were analyzed. Isotopes analyzed
included 206Pb, 207Pb, 208Pb and 238U. Laser operating parameters are summarized in Table 2.3.
To cover the range of Pb and U content anticipated in some of the zircon grains (>400 ppm U
and >400 ppm Pb), a linear two point standard calibration curve was used with NIST 610
(National Institute of Standards and Technology, 1992a: 457.2 ppm U and 426 ppm Pb) and
NIST 612 (National Institute of Standards and Technology, 1992b: 37.4 ppm U and 38.6 ppm
42
Pb) glasses, and zircon 91500 (Wiedenbeck et al., 1995: 81.2 ppm U and 14.8 ppm Pb) to correct
all masses for ablation efficiency, mass bias, and instrumental drift. Published Pb isotopic ratios
were used to calculate concentrations of 206Pb, 207Pb, and 208Pb for each standard (Woodhead et
al., 2001; Weidenbeck et al., 1995; 2005). Fourteen of the 15 HMCs had large enough zircon
grains (30-40 μm diameter; limited by laser spot size of 35 μm) to be measured using LA-
ICPMS.
43
Table 2.3: Operating parameters for the laser and ICPMS
Laser Ablation System ICPMS
Model New Wave
Research
UP193HE
Model Element2,
ThermoFinnigan
Cooling
gas (Ar)
16 l/min
Type Excimer Type Magnetic Sector
field
Auxiliary
Gas (Ar)
0.75 l/min
Wavelength 193 nm Forward
Power
1300 W Sample
Gas (Ar)
0.9 l/min
Spot Size 35 µm Scan Mode E-Scan Carrier
Gas (He)
0.8 l/min
Repetition Rate 5-50Hz Scanned
Masses
202, 204, 206, 207,
208, 232, 235, 238
Laser Ablation System ICPMS
Model New Wave
Research
UP193HE
Model Xseries Cooling
gas (Ar)
13.0 l/min
Type Excimer Interface
cones
Xt Nickel Auxiliary
Gas (Ar)
0.90 l/min
Wavelength 193 nm RF Power 1404 W Nebulizer
Gas (Ar)
0.96 l/min
Spot Size 35 µm Detector SEM with PC and
Analogue
Carrier
Gas (He)
~1.0 l/min
Repetition Rate 5Hz Scanned
Masses
7-238
2.4.4 Maximum U and Pb Contribution from Heavy Mineral Content
To calculate maximum U (Uzircon), 206Pb (206Pbzircon), and 207Pb (207Pbzircon) contributions
from zircon grains to the clay-fraction chemistry, the mean 238U, 206Pb, and 207Pb concentrations
of all the grains measured using LA-ICPMS in each sample were combined with the zircon
abundances from the <20 µm fraction (Equations 1-3). The zircon abundances from the <20 µm
fraction were used because this was the closest size fraction to the clay-size (<2 µm) that was
quantified using MLA. Corrected values were calculated for U concentrations (Corr. Uclay-fraction)
and radiogenic Pb (Corr. 207Pb/206Pbclay-fraction) ratios in the clay-fraction aqua regia digest by
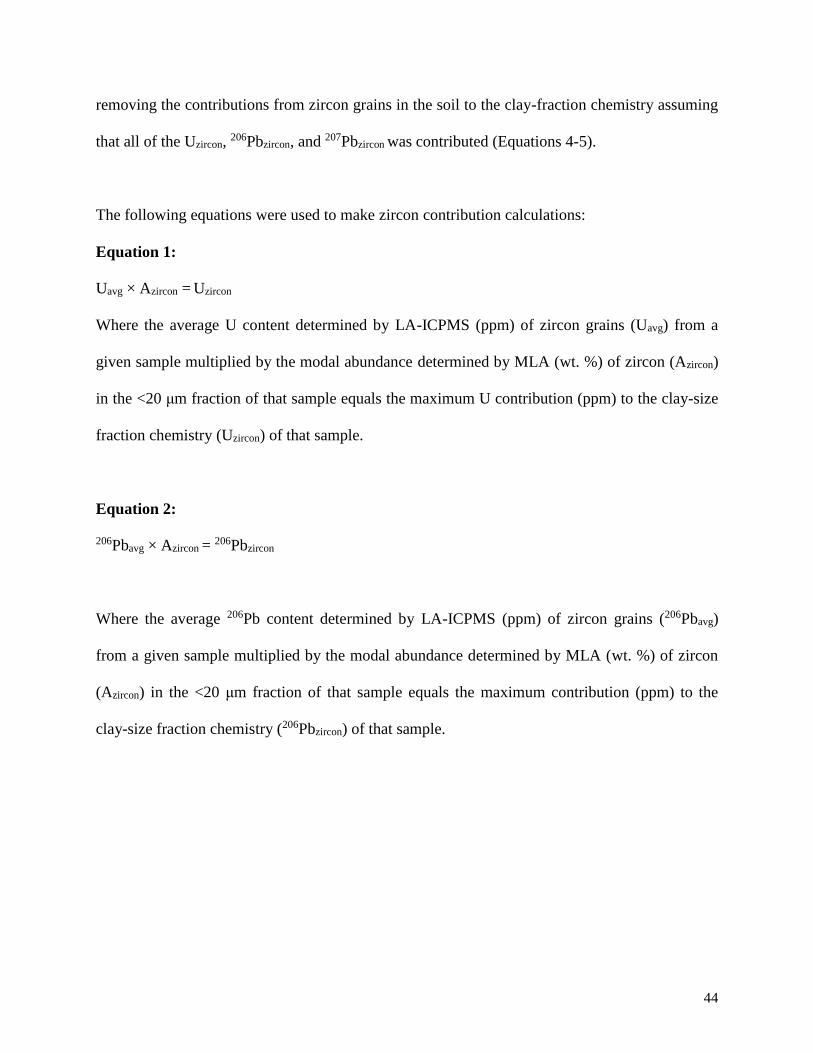
44
removing the contributions from zircon grains in the soil to the clay-fraction chemistry assuming
that all of the Uzircon, 206Pbzircon, and 207Pbzircon was contributed (Equations 4-5).
The following equations were used to make zircon contribution calculations:
Equation 1:
Uavg × Azircon = Uzircon
Where the average U content determined by LA-ICPMS (ppm) of zircon grains (Uavg) from a
given sample multiplied by the modal abundance determined by MLA (wt. %) of zircon (Azircon)
in the <20 μm fraction of that sample equals the maximum U contribution (ppm) to the clay-size
fraction chemistry (Uzircon) of that sample.
Equation 2:
206Pbavg × Azircon = 206Pbzircon
Where the average 206Pb content determined by LA-ICPMS (ppm) of zircon grains (206Pbavg)
from a given sample multiplied by the modal abundance determined by MLA (wt. %) of zircon
(Azircon) in the <20 μm fraction of that sample equals the maximum contribution (ppm) to the
clay-size fraction chemistry (206Pbzircon) of that sample.
45
Equation 3:
207Pbavg × Azircon = 207Pbzircon
Where the average 207Pb content determined by LA-ICPMS (ppm) of zircon grains (207Pbavg)
from a given sample multiplied by the modal abundance determined by MLA (Wt. %) of zircon
(Azircon) in the <20 μm fraction of that sample equals the maximum contribution (ppm) to the
clay-size fraction chemistry (207Pbzircon) of that sample.
Equation 4:
Uclay-fraction - Uzircon = Corr. Uclay-fraction
Where the U content from the clay-fraction (Uclay-fraction) minus the Uzircon equals the corrected U
content in the clay-fraction (Corr. Uclay-fraction)
Equation 5:
(207Pbclay-fraction − 207Pbzircon) ÷ (206Pbclay-fraction −
206Pbzircon) = Corr. 207Pb/206Pbclay-fraction
Where the 207Pb content from the clay fraction (207Pbclay-fraction) minus the 207Pbzircon divided by
206Pb content from the clay fraction (206Pbclay-fraction) minus the 206Pbzircon from a given sample
equals the corrected 207Pb/206Pb ratio (Corr. 207Pb/206Pbclay-fraction)
2.5 Results
Twenty-six samples of the clay-sized fraction from the 2013 Uravan survey have
207Pb/206Pb ratios <0.60 (Figure 2.2). The average 207Pb/206Pb for all samples with ratios greater
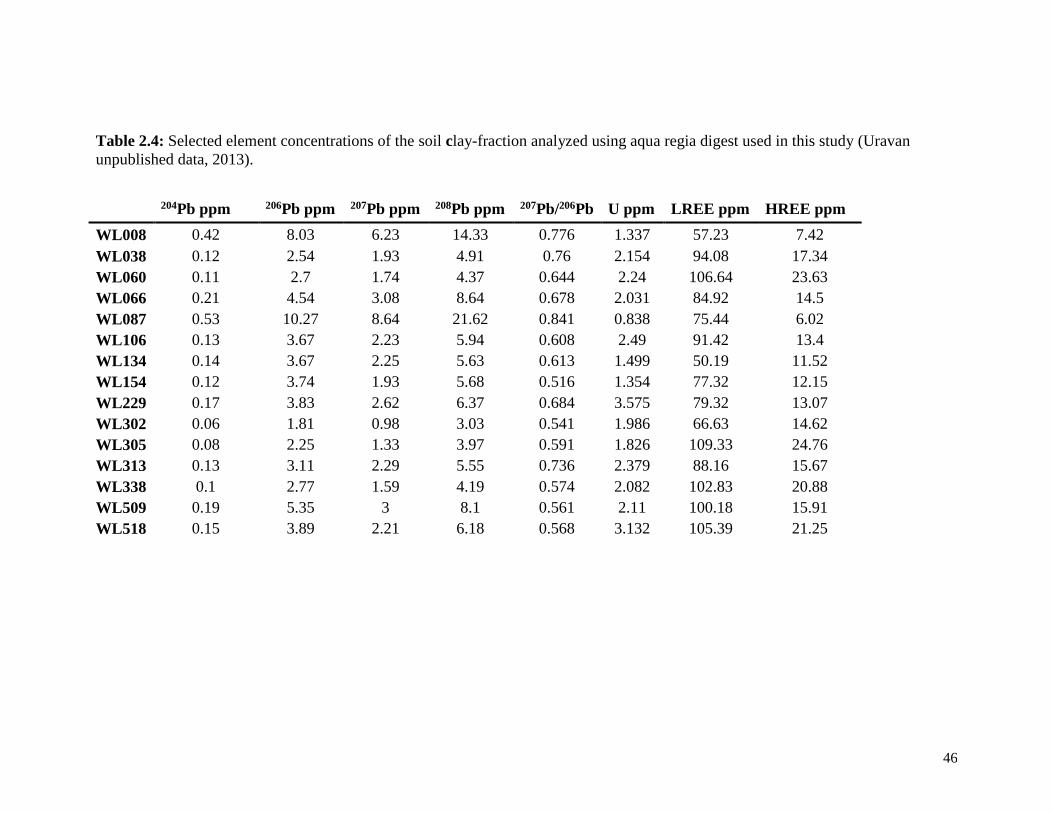
than 0.60 was 0.70. Table 2.4 shows the concentrations of elements of interest and 207Pb/206Pb
ratios in the clay-fraction from the 15 samples used for this study.
46
Table 2.4: Selected element concentrations of the soil clay-fraction analyzed using aqua regia digest used in this study (Uravan
unpublished data, 2013).
204Pb ppm 206Pb ppm 207Pb ppm 208Pb ppm 207Pb/206Pb U ppm LREE ppm HREE ppm
WL008 0.42 8.03 6.23 14.33 0.776 1.337 57.23 7.42
WL038 0.12 2.54 1.93 4.91 0.76 2.154 94.08 17.34
WL060 0.11 2.7 1.74 4.37 0.644 2.24 106.64 23.63
WL066 0.21 4.54 3.08 8.64 0.678 2.031 84.92 14.5
WL087 0.53 10.27 8.64 21.62 0.841 0.838 75.44 6.02
WL106 0.13 3.67 2.23 5.94 0.608 2.49 91.42 13.4
WL134 0.14 3.67 2.25 5.63 0.613 1.499 50.19 11.52
WL154 0.12 3.74 1.93 5.68 0.516 1.354 77.32 12.15
WL229 0.17 3.83 2.62 6.37 0.684 3.575 79.32 13.07
WL302 0.06 1.81 0.98 3.03 0.541 1.986 66.63 14.62
WL305 0.08 2.25 1.33 3.97 0.591 1.826 109.33 24.76
WL313 0.13 3.11 2.29 5.55 0.736 2.379 88.16 15.67
WL338 0.1 2.77 1.59 4.19 0.574 2.082 102.83 20.88
WL509 0.19 5.35 3 8.1 0.561 2.11 100.18 15.91
WL518 0.15 3.89 2.21 6.18 0.568 3.132 105.39 21.25
47
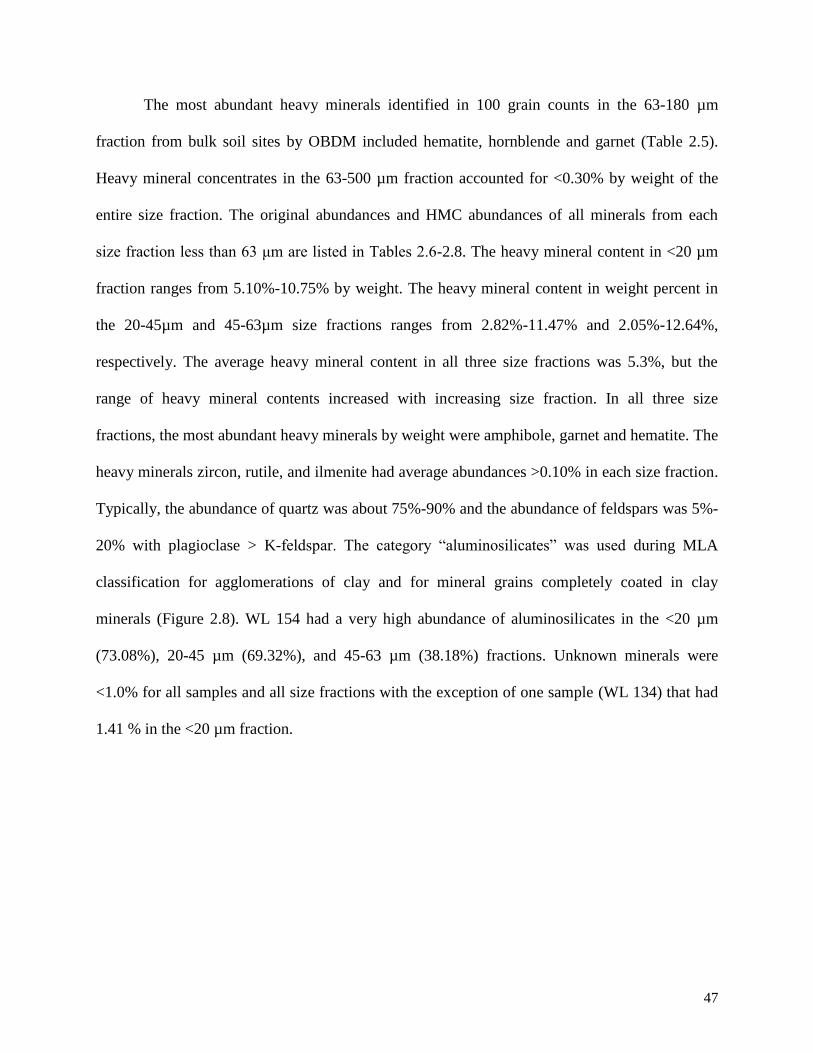
The most abundant heavy minerals identified in 100 grain counts in the 63-180 µm
fraction from bulk soil sites by OBDM included hematite, hornblende and garnet (Table 2.5).
Heavy mineral concentrates in the 63-500 µm fraction accounted for <0.30% by weight of the
entire size fraction. The original abundances and HMC abundances of all minerals from each
size fraction less than 63 μm are listed in Tables 2.6-2.8. The heavy mineral content in <20 µm
fraction ranges from 5.10%-10.75% by weight. The heavy mineral content in weight percent in
the 20-45µm and 45-63µm size fractions ranges from 2.82%-11.47% and 2.05%-12.64%,
respectively. The average heavy mineral content in all three size fractions was 5.3%, but the
range of heavy mineral contents increased with increasing size fraction. In all three size
fractions, the most abundant heavy minerals by weight were amphibole, garnet and hematite. The
heavy minerals zircon, rutile, and ilmenite had average abundances >0.10% in each size fraction.
Typically, the abundance of quartz was about 75%-90% and the abundance of feldspars was 5%-
20% with plagioclase > K-feldspar. The category “aluminosilicates” was used during MLA
classification for agglomerations of clay and for mineral grains completely coated in clay
minerals (Figure 2.8). WL 154 had a very high abundance of aluminosilicates in the <20 µm
(73.08%), 20-45 µm (69.32%), and 45-63 µm (38.18%) fractions. Unknown minerals were
<1.0% for all samples and all size fractions with the exception of one sample (WL 134) that had
1.41 % in the <20 µm fraction.
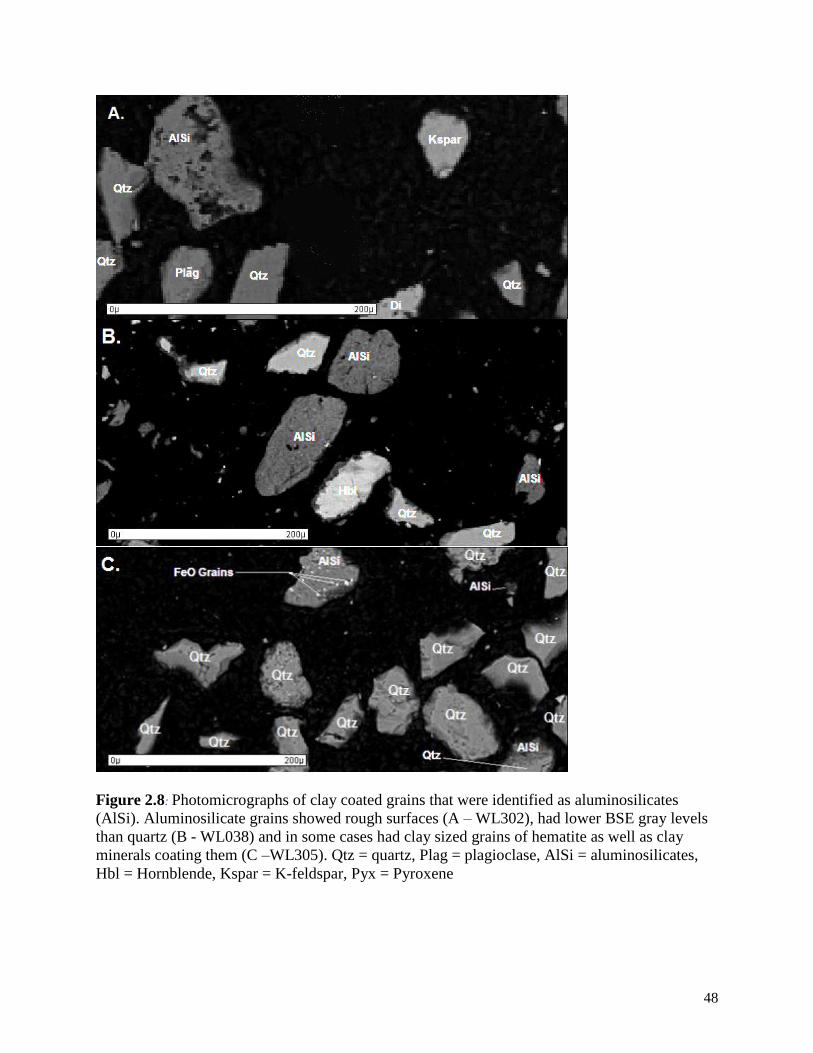
48
Figure 2.8: Photomicrographs of clay coated grains that were identified as aluminosilicates
(AlSi). Aluminosilicate grains showed rough surfaces (A – WL302), had lower BSE gray levels
than quartz (B - WL038) and in some cases had clay sized grains of hematite as well as clay
minerals coating them (C –WL305). Qtz = quartz, Plag = plagioclase, AlSi = aluminosilicates,
Hbl = Hornblende, Kspar = K-feldspar, Pyx = Pyroxene
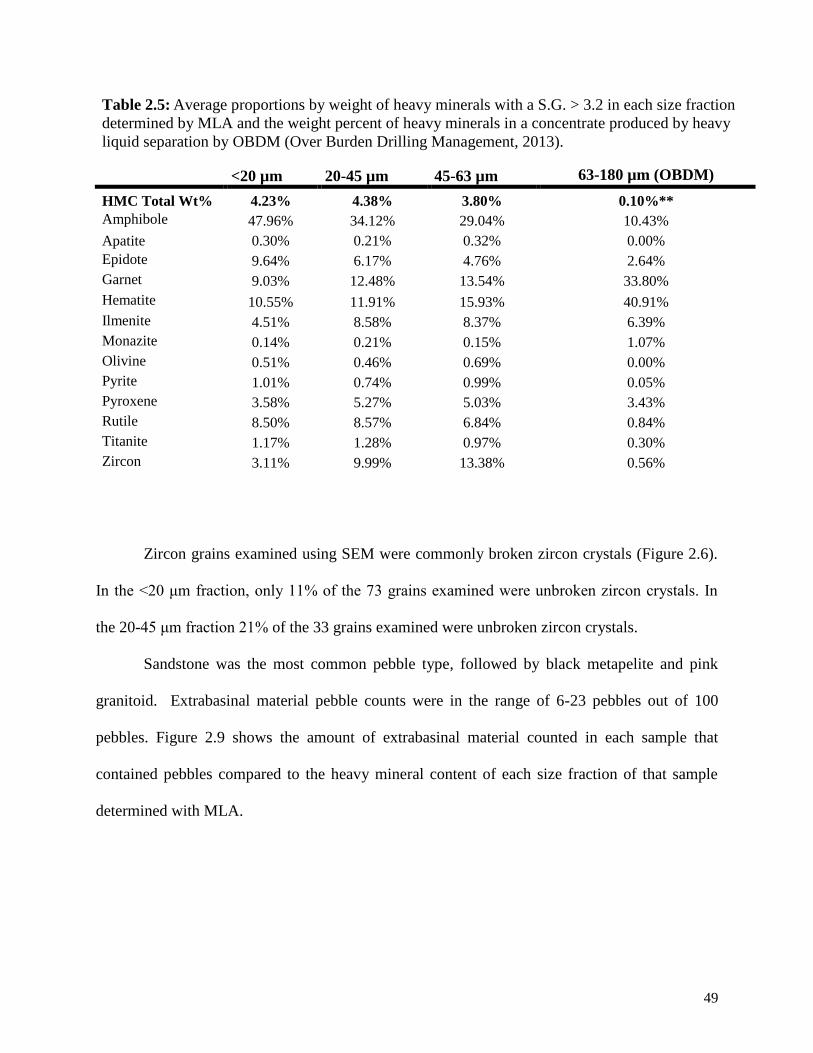
49
Table 2.5: Average proportions by weight of heavy minerals with a S.G. > 3.2 in each size fraction
determined by MLA and the weight percent of heavy minerals in a concentrate produced by heavy
liquid separation by OBDM (Over Burden Drilling Management, 2013).
<20 µm 20-45 µm 45-63 µm 63-180 µm (OBDM)
HMC Total Wt% 4.23% 4.38% 3.80% 0.10%**
Amphibole 47.96% 34.12% 29.04% 10.43%
Apatite 0.30% 0.21% 0.32% 0.00%
Epidote 9.64% 6.17% 4.76% 2.64%
Garnet 9.03% 12.48% 13.54% 33.80%
Hematite 10.55% 11.91% 15.93% 40.91%
Ilmenite 4.51% 8.58% 8.37% 6.39%
Monazite 0.14% 0.21% 0.15% 1.07%
Olivine 0.51% 0.46% 0.69% 0.00%
Pyrite 1.01% 0.74% 0.99% 0.05%
Pyroxene 3.58% 5.27% 5.03% 3.43%
Rutile 8.50% 8.57% 6.84% 0.84%
Titanite 1.17% 1.28% 0.97% 0.30%
Zircon 3.11% 9.99% 13.38% 0.56%
Zircon grains examined using SEM were commonly broken zircon crystals (Figure 2.6).
In the <20 μm fraction, only 11% of the 73 grains examined were unbroken zircon crystals. In
the 20-45 μm fraction 21% of the 33 grains examined were unbroken zircon crystals.
Sandstone was the most common pebble type, followed by black metapelite and pink
granitoid. Extrabasinal material pebble counts were in the range of 6-23 pebbles out of 100
pebbles. Figure 2.9 shows the amount of extrabasinal material counted in each sample that
contained pebbles compared to the heavy mineral content of each size fraction of that sample
determined with MLA.
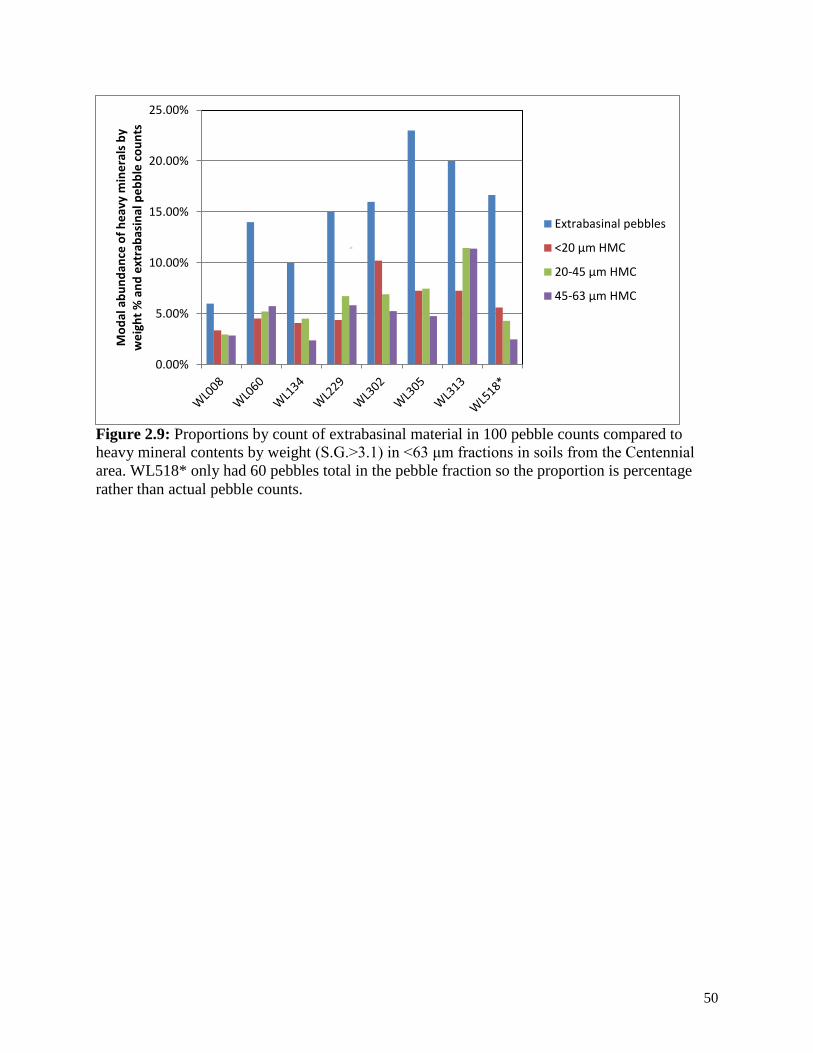
50
Figure 2.9: Proportions by count of extrabasinal material in 100 pebble counts compared to
heavy mineral contents by weight (S.G.>3.1) in <63 μm fractions in soils from the Centennial
area. WL518* only had 60 pebbles total in the pebble fraction so the proportion is percentage
rather than actual pebble counts.
0.00%
5.00%
10.00%
15.00%
20.00%
25.00%M
od
al a
bu
nd
ance
of
he
avy
min
era
ls b
y w
eig
ht
% a
nd
ext
rab
asin
al p
eb
ble
co
un
ts
Extrabasinal pebbles
<20 µm HMC
20-45 µm HMC
45-63 µm HMC
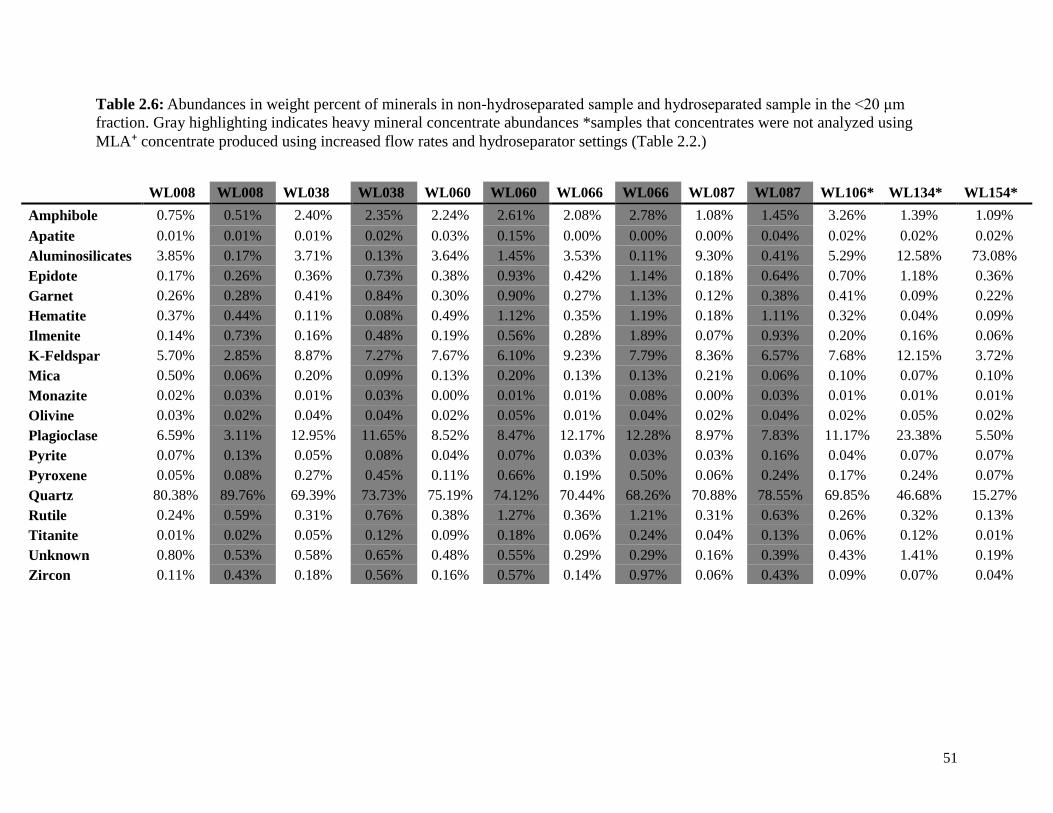
51
Table 2.6: Abundances in weight percent of minerals in non-hydroseparated sample and hydroseparated sample in the <20 μm
fraction. Gray highlighting indicates heavy mineral concentrate abundances *samples that concentrates were not analyzed using
MLA⁺ concentrate produced using increased flow rates and hydroseparator settings (Table 2.2.)
WL008 WL008 WL038 WL038 WL060 WL060 WL066 WL066 WL087 WL087 WL106* WL134* WL154*
Amphibole 0.75% 0.51% 2.40% 2.35% 2.24% 2.61% 2.08% 2.78% 1.08% 1.45% 3.26% 1.39% 1.09%
Apatite 0.01% 0.01% 0.01% 0.02% 0.03% 0.15% 0.00% 0.00% 0.00% 0.04% 0.02% 0.02% 0.02%
Aluminosilicates 3.85% 0.17% 3.71% 0.13% 3.64% 1.45% 3.53% 0.11% 9.30% 0.41% 5.29% 12.58% 73.08%
Epidote 0.17% 0.26% 0.36% 0.73% 0.38% 0.93% 0.42% 1.14% 0.18% 0.64% 0.70% 1.18% 0.36%
Garnet 0.26% 0.28% 0.41% 0.84% 0.30% 0.90% 0.27% 1.13% 0.12% 0.38% 0.41% 0.09% 0.22%
Hematite 0.37% 0.44% 0.11% 0.08% 0.49% 1.12% 0.35% 1.19% 0.18% 1.11% 0.32% 0.04% 0.09%
Ilmenite 0.14% 0.73% 0.16% 0.48% 0.19% 0.56% 0.28% 1.89% 0.07% 0.93% 0.20% 0.16% 0.06%
K-Feldspar 5.70% 2.85% 8.87% 7.27% 7.67% 6.10% 9.23% 7.79% 8.36% 6.57% 7.68% 12.15% 3.72%
Mica 0.50% 0.06% 0.20% 0.09% 0.13% 0.20% 0.13% 0.13% 0.21% 0.06% 0.10% 0.07% 0.10%
Monazite 0.02% 0.03% 0.01% 0.03% 0.00% 0.01% 0.01% 0.08% 0.00% 0.03% 0.01% 0.01% 0.01%
Olivine 0.03% 0.02% 0.04% 0.04% 0.02% 0.05% 0.01% 0.04% 0.02% 0.04% 0.02% 0.05% 0.02%
Plagioclase 6.59% 3.11% 12.95% 11.65% 8.52% 8.47% 12.17% 12.28% 8.97% 7.83% 11.17% 23.38% 5.50%
Pyrite 0.07% 0.13% 0.05% 0.08% 0.04% 0.07% 0.03% 0.03% 0.03% 0.16% 0.04% 0.07% 0.07%
Pyroxene 0.05% 0.08% 0.27% 0.45% 0.11% 0.66% 0.19% 0.50% 0.06% 0.24% 0.17% 0.24% 0.07%
Quartz 80.38% 89.76% 69.39% 73.73% 75.19% 74.12% 70.44% 68.26% 70.88% 78.55% 69.85% 46.68% 15.27%
Rutile 0.24% 0.59% 0.31% 0.76% 0.38% 1.27% 0.36% 1.21% 0.31% 0.63% 0.26% 0.32% 0.13%
Titanite 0.01% 0.02% 0.05% 0.12% 0.09% 0.18% 0.06% 0.24% 0.04% 0.13% 0.06% 0.12% 0.01%
Unknown 0.80% 0.53% 0.58% 0.65% 0.48% 0.55% 0.29% 0.29% 0.16% 0.39% 0.43% 1.41% 0.19%
Zircon 0.11% 0.43% 0.18% 0.56% 0.16% 0.57% 0.14% 0.97% 0.06% 0.43% 0.09% 0.07% 0.04%
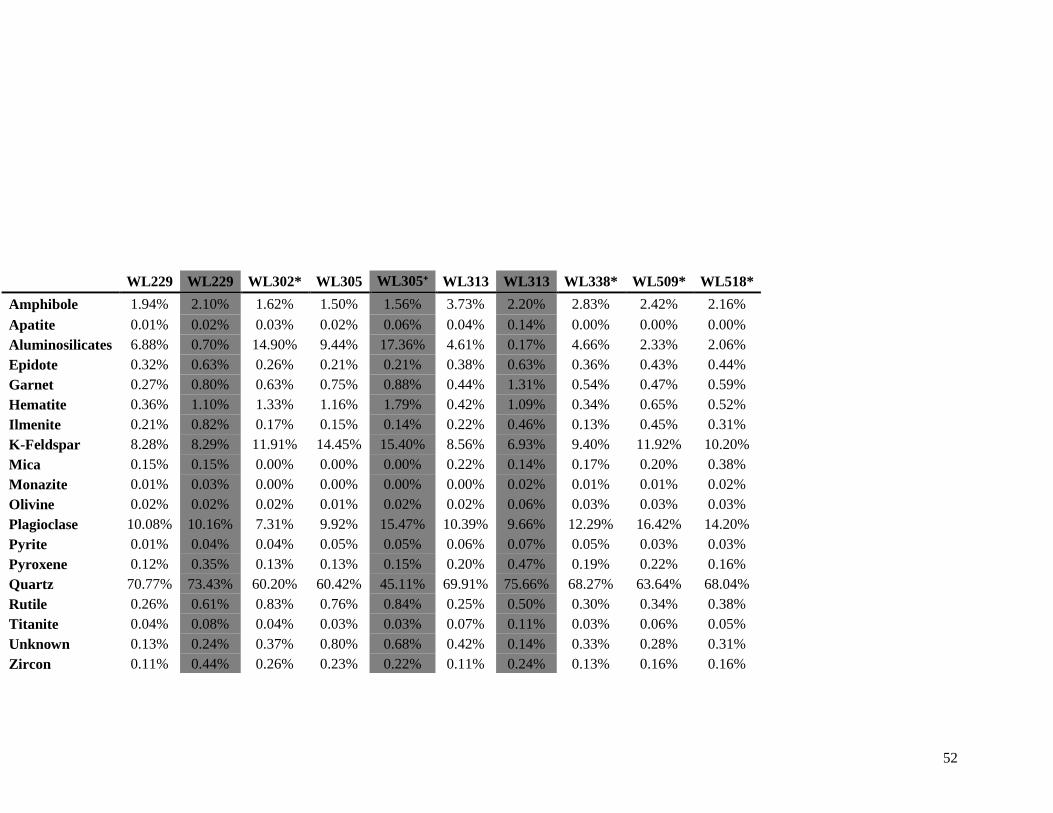
52
WL229 WL229 WL302* WL305 WL305⁺ WL313 WL313 WL338* WL509* WL518*
Amphibole 1.94% 2.10% 1.62% 1.50% 1.56% 3.73% 2.20% 2.83% 2.42% 2.16%
Apatite 0.01% 0.02% 0.03% 0.02% 0.06% 0.04% 0.14% 0.00% 0.00% 0.00%
Aluminosilicates 6.88% 0.70% 14.90% 9.44% 17.36% 4.61% 0.17% 4.66% 2.33% 2.06%
Epidote 0.32% 0.63% 0.26% 0.21% 0.21% 0.38% 0.63% 0.36% 0.43% 0.44%
Garnet 0.27% 0.80% 0.63% 0.75% 0.88% 0.44% 1.31% 0.54% 0.47% 0.59%
Hematite 0.36% 1.10% 1.33% 1.16% 1.79% 0.42% 1.09% 0.34% 0.65% 0.52%
Ilmenite 0.21% 0.82% 0.17% 0.15% 0.14% 0.22% 0.46% 0.13% 0.45% 0.31%
K-Feldspar 8.28% 8.29% 11.91% 14.45% 15.40% 8.56% 6.93% 9.40% 11.92% 10.20%
Mica 0.15% 0.15% 0.00% 0.00% 0.00% 0.22% 0.14% 0.17% 0.20% 0.38%
Monazite 0.01% 0.03% 0.00% 0.00% 0.00% 0.00% 0.02% 0.01% 0.01% 0.02%
Olivine 0.02% 0.02% 0.02% 0.01% 0.02% 0.02% 0.06% 0.03% 0.03% 0.03%
Plagioclase 10.08% 10.16% 7.31% 9.92% 15.47% 10.39% 9.66% 12.29% 16.42% 14.20%
Pyrite 0.01% 0.04% 0.04% 0.05% 0.05% 0.06% 0.07% 0.05% 0.03% 0.03%
Pyroxene 0.12% 0.35% 0.13% 0.13% 0.15% 0.20% 0.47% 0.19% 0.22% 0.16%
Quartz 70.77% 73.43% 60.20% 60.42% 45.11% 69.91% 75.66% 68.27% 63.64% 68.04%
Rutile 0.26% 0.61% 0.83% 0.76% 0.84% 0.25% 0.50% 0.30% 0.34% 0.38%
Titanite 0.04% 0.08% 0.04% 0.03% 0.03% 0.07% 0.11% 0.03% 0.06% 0.05%
Unknown 0.13% 0.24% 0.37% 0.80% 0.68% 0.42% 0.14% 0.33% 0.28% 0.31%
Zircon 0.11% 0.44% 0.26% 0.23% 0.22% 0.11% 0.24% 0.13% 0.16% 0.16%
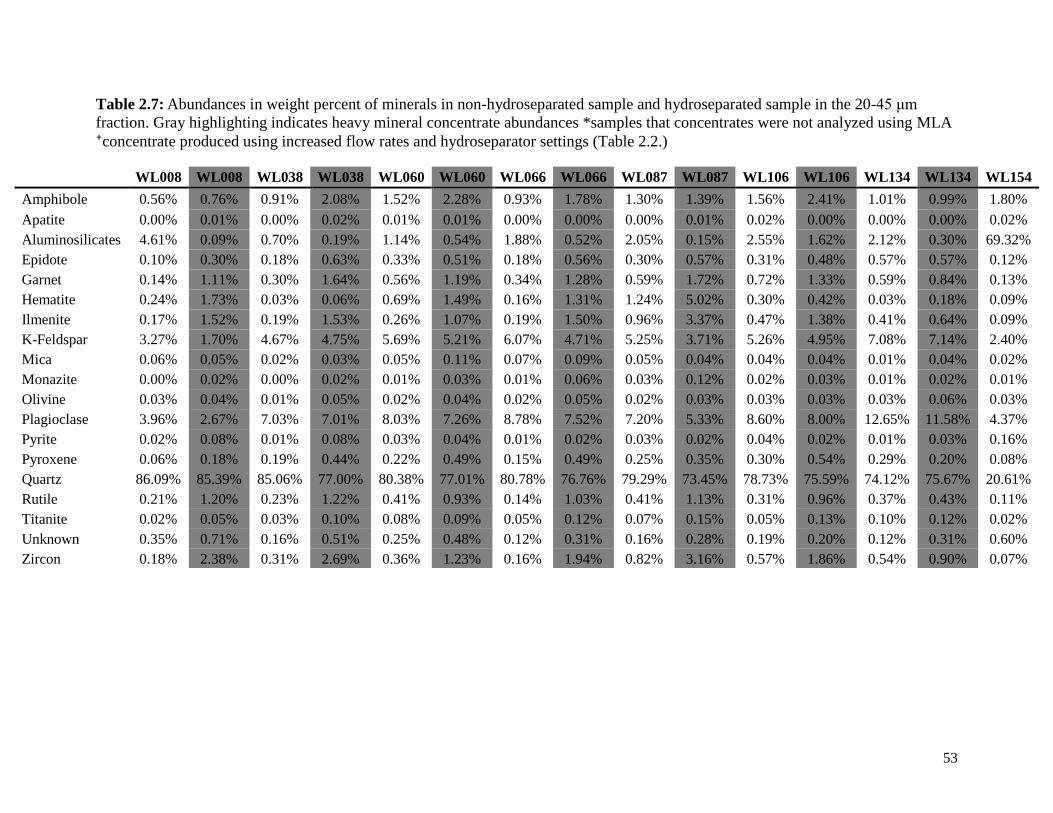
53
Table 2.7: Abundances in weight percent of minerals in non-hydroseparated sample and hydroseparated sample in the 20-45 μm
fraction. Gray highlighting indicates heavy mineral concentrate abundances *samples that concentrates were not analyzed using MLA
⁺concentrate produced using increased flow rates and hydroseparator settings (Table 2.2.)
WL008 WL008 WL038 WL038 WL060 WL060 WL066 WL066 WL087 WL087 WL106 WL106 WL134 WL134 WL154
Amphibole 0.56% 0.76% 0.91% 2.08% 1.52% 2.28% 0.93% 1.78% 1.30% 1.39% 1.56% 2.41% 1.01% 0.99% 1.80%
Apatite 0.00% 0.01% 0.00% 0.02% 0.01% 0.01% 0.00% 0.00% 0.00% 0.01% 0.02% 0.00% 0.00% 0.00% 0.02%
Aluminosilicates 4.61% 0.09% 0.70% 0.19% 1.14% 0.54% 1.88% 0.52% 2.05% 0.15% 2.55% 1.62% 2.12% 0.30% 69.32%
Epidote 0.10% 0.30% 0.18% 0.63% 0.33% 0.51% 0.18% 0.56% 0.30% 0.57% 0.31% 0.48% 0.57% 0.57% 0.12%
Garnet 0.14% 1.11% 0.30% 1.64% 0.56% 1.19% 0.34% 1.28% 0.59% 1.72% 0.72% 1.33% 0.59% 0.84% 0.13%
Hematite 0.24% 1.73% 0.03% 0.06% 0.69% 1.49% 0.16% 1.31% 1.24% 5.02% 0.30% 0.42% 0.03% 0.18% 0.09%
Ilmenite 0.17% 1.52% 0.19% 1.53% 0.26% 1.07% 0.19% 1.50% 0.96% 3.37% 0.47% 1.38% 0.41% 0.64% 0.09%
K-Feldspar 3.27% 1.70% 4.67% 4.75% 5.69% 5.21% 6.07% 4.71% 5.25% 3.71% 5.26% 4.95% 7.08% 7.14% 2.40%
Mica 0.06% 0.05% 0.02% 0.03% 0.05% 0.11% 0.07% 0.09% 0.05% 0.04% 0.04% 0.04% 0.01% 0.04% 0.02%
Monazite 0.00% 0.02% 0.00% 0.02% 0.01% 0.03% 0.01% 0.06% 0.03% 0.12% 0.02% 0.03% 0.01% 0.02% 0.01%
Olivine 0.03% 0.04% 0.01% 0.05% 0.02% 0.04% 0.02% 0.05% 0.02% 0.03% 0.03% 0.03% 0.03% 0.06% 0.03%
Plagioclase 3.96% 2.67% 7.03% 7.01% 8.03% 7.26% 8.78% 7.52% 7.20% 5.33% 8.60% 8.00% 12.65% 11.58% 4.37%
Pyrite 0.02% 0.08% 0.01% 0.08% 0.03% 0.04% 0.01% 0.02% 0.03% 0.02% 0.04% 0.02% 0.01% 0.03% 0.16%
Pyroxene 0.06% 0.18% 0.19% 0.44% 0.22% 0.49% 0.15% 0.49% 0.25% 0.35% 0.30% 0.54% 0.29% 0.20% 0.08%
Quartz 86.09% 85.39% 85.06% 77.00% 80.38% 77.01% 80.78% 76.76% 79.29% 73.45% 78.73% 75.59% 74.12% 75.67% 20.61%
Rutile 0.21% 1.20% 0.23% 1.22% 0.41% 0.93% 0.14% 1.03% 0.41% 1.13% 0.31% 0.96% 0.37% 0.43% 0.11%
Titanite 0.02% 0.05% 0.03% 0.10% 0.08% 0.09% 0.05% 0.12% 0.07% 0.15% 0.05% 0.13% 0.10% 0.12% 0.02%
Unknown 0.35% 0.71% 0.16% 0.51% 0.25% 0.48% 0.12% 0.31% 0.16% 0.28% 0.19% 0.20% 0.12% 0.31% 0.60%
Zircon 0.18% 2.38% 0.31% 2.69% 0.36% 1.23% 0.16% 1.94% 0.82% 3.16% 0.57% 1.86% 0.54% 0.90% 0.07%
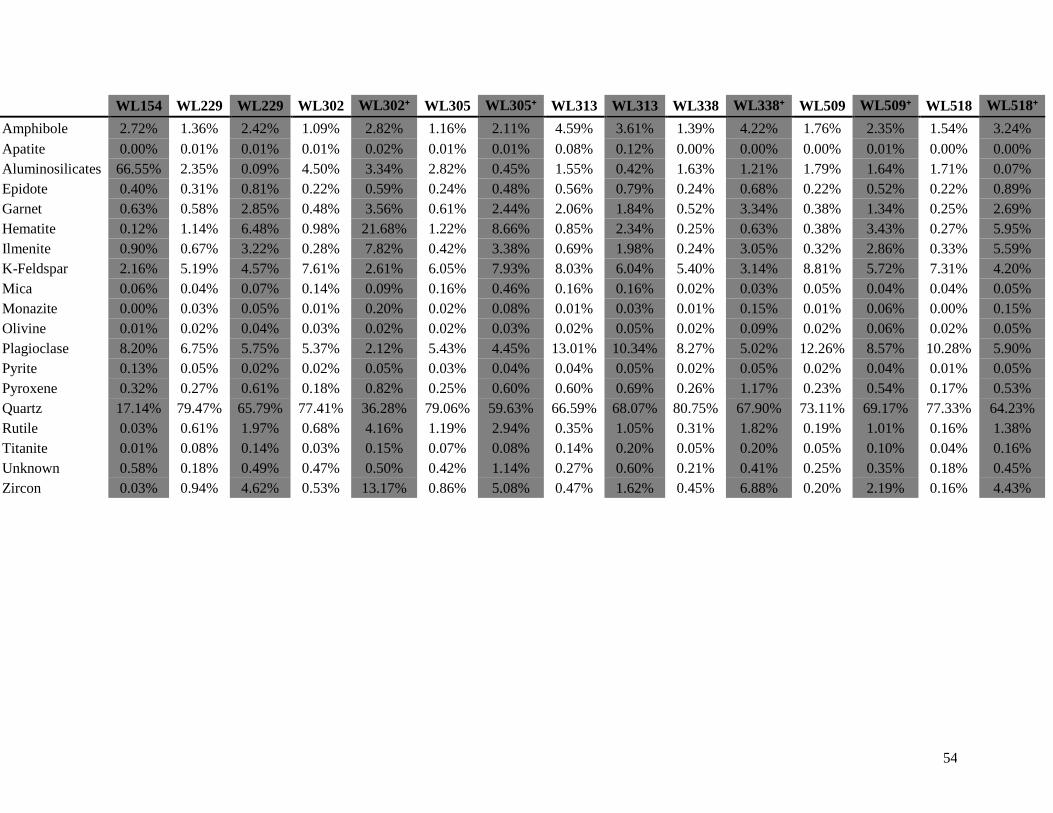
54
WL154 WL229 WL229 WL302 WL302⁺ WL305 WL305⁺ WL313 WL313 WL338 WL338⁺ WL509 WL509⁺ WL518 WL518⁺
Amphibole 2.72% 1.36% 2.42% 1.09% 2.82% 1.16% 2.11% 4.59% 3.61% 1.39% 4.22% 1.76% 2.35% 1.54% 3.24%
Apatite 0.00% 0.01% 0.01% 0.01% 0.02% 0.01% 0.01% 0.08% 0.12% 0.00% 0.00% 0.00% 0.01% 0.00% 0.00%
Aluminosilicates 66.55% 2.35% 0.09% 4.50% 3.34% 2.82% 0.45% 1.55% 0.42% 1.63% 1.21% 1.79% 1.64% 1.71% 0.07%
Epidote 0.40% 0.31% 0.81% 0.22% 0.59% 0.24% 0.48% 0.56% 0.79% 0.24% 0.68% 0.22% 0.52% 0.22% 0.89%
Garnet 0.63% 0.58% 2.85% 0.48% 3.56% 0.61% 2.44% 2.06% 1.84% 0.52% 3.34% 0.38% 1.34% 0.25% 2.69%
Hematite 0.12% 1.14% 6.48% 0.98% 21.68% 1.22% 8.66% 0.85% 2.34% 0.25% 0.63% 0.38% 3.43% 0.27% 5.95%
Ilmenite 0.90% 0.67% 3.22% 0.28% 7.82% 0.42% 3.38% 0.69% 1.98% 0.24% 3.05% 0.32% 2.86% 0.33% 5.59%
K-Feldspar 2.16% 5.19% 4.57% 7.61% 2.61% 6.05% 7.93% 8.03% 6.04% 5.40% 3.14% 8.81% 5.72% 7.31% 4.20%
Mica 0.06% 0.04% 0.07% 0.14% 0.09% 0.16% 0.46% 0.16% 0.16% 0.02% 0.03% 0.05% 0.04% 0.04% 0.05%
Monazite 0.00% 0.03% 0.05% 0.01% 0.20% 0.02% 0.08% 0.01% 0.03% 0.01% 0.15% 0.01% 0.06% 0.00% 0.15%
Olivine 0.01% 0.02% 0.04% 0.03% 0.02% 0.02% 0.03% 0.02% 0.05% 0.02% 0.09% 0.02% 0.06% 0.02% 0.05%
Plagioclase 8.20% 6.75% 5.75% 5.37% 2.12% 5.43% 4.45% 13.01% 10.34% 8.27% 5.02% 12.26% 8.57% 10.28% 5.90%
Pyrite 0.13% 0.05% 0.02% 0.02% 0.05% 0.03% 0.04% 0.04% 0.05% 0.02% 0.05% 0.02% 0.04% 0.01% 0.05%
Pyroxene 0.32% 0.27% 0.61% 0.18% 0.82% 0.25% 0.60% 0.60% 0.69% 0.26% 1.17% 0.23% 0.54% 0.17% 0.53%
Quartz 17.14% 79.47% 65.79% 77.41% 36.28% 79.06% 59.63% 66.59% 68.07% 80.75% 67.90% 73.11% 69.17% 77.33% 64.23%
Rutile 0.03% 0.61% 1.97% 0.68% 4.16% 1.19% 2.94% 0.35% 1.05% 0.31% 1.82% 0.19% 1.01% 0.16% 1.38%
Titanite 0.01% 0.08% 0.14% 0.03% 0.15% 0.07% 0.08% 0.14% 0.20% 0.05% 0.20% 0.05% 0.10% 0.04% 0.16%
Unknown 0.58% 0.18% 0.49% 0.47% 0.50% 0.42% 1.14% 0.27% 0.60% 0.21% 0.41% 0.25% 0.35% 0.18% 0.45%
Zircon 0.03% 0.94% 4.62% 0.53% 13.17% 0.86% 5.08% 0.47% 1.62% 0.45% 6.88% 0.20% 2.19% 0.16% 4.43%
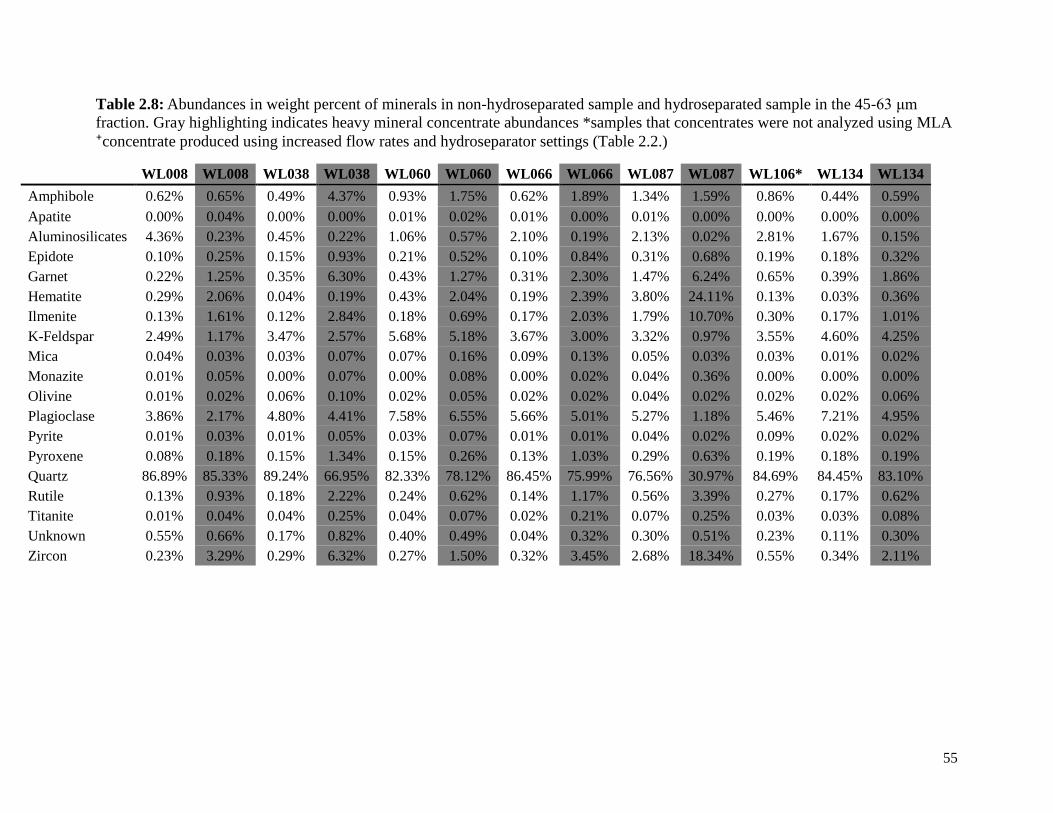
55
Table 2.8: Abundances in weight percent of minerals in non-hydroseparated sample and hydroseparated sample in the 45-63 μm
fraction. Gray highlighting indicates heavy mineral concentrate abundances *samples that concentrates were not analyzed using MLA
⁺concentrate produced using increased flow rates and hydroseparator settings (Table 2.2.)
WL008 WL008 WL038 WL038 WL060 WL060 WL066 WL066 WL087 WL087 WL106* WL134 WL134
Amphibole 0.62% 0.65% 0.49% 4.37% 0.93% 1.75% 0.62% 1.89% 1.34% 1.59% 0.86% 0.44% 0.59%
Apatite 0.00% 0.04% 0.00% 0.00% 0.01% 0.02% 0.01% 0.00% 0.01% 0.00% 0.00% 0.00% 0.00%
Aluminosilicates 4.36% 0.23% 0.45% 0.22% 1.06% 0.57% 2.10% 0.19% 2.13% 0.02% 2.81% 1.67% 0.15%
Epidote 0.10% 0.25% 0.15% 0.93% 0.21% 0.52% 0.10% 0.84% 0.31% 0.68% 0.19% 0.18% 0.32%
Garnet 0.22% 1.25% 0.35% 6.30% 0.43% 1.27% 0.31% 2.30% 1.47% 6.24% 0.65% 0.39% 1.86%
Hematite 0.29% 2.06% 0.04% 0.19% 0.43% 2.04% 0.19% 2.39% 3.80% 24.11% 0.13% 0.03% 0.36%
Ilmenite 0.13% 1.61% 0.12% 2.84% 0.18% 0.69% 0.17% 2.03% 1.79% 10.70% 0.30% 0.17% 1.01%
K-Feldspar 2.49% 1.17% 3.47% 2.57% 5.68% 5.18% 3.67% 3.00% 3.32% 0.97% 3.55% 4.60% 4.25%
Mica 0.04% 0.03% 0.03% 0.07% 0.07% 0.16% 0.09% 0.13% 0.05% 0.03% 0.03% 0.01% 0.02%
Monazite 0.01% 0.05% 0.00% 0.07% 0.00% 0.08% 0.00% 0.02% 0.04% 0.36% 0.00% 0.00% 0.00%
Olivine 0.01% 0.02% 0.06% 0.10% 0.02% 0.05% 0.02% 0.02% 0.04% 0.02% 0.02% 0.02% 0.06%
Plagioclase 3.86% 2.17% 4.80% 4.41% 7.58% 6.55% 5.66% 5.01% 5.27% 1.18% 5.46% 7.21% 4.95%
Pyrite 0.01% 0.03% 0.01% 0.05% 0.03% 0.07% 0.01% 0.01% 0.04% 0.02% 0.09% 0.02% 0.02%
Pyroxene 0.08% 0.18% 0.15% 1.34% 0.15% 0.26% 0.13% 1.03% 0.29% 0.63% 0.19% 0.18% 0.19%
Quartz 86.89% 85.33% 89.24% 66.95% 82.33% 78.12% 86.45% 75.99% 76.56% 30.97% 84.69% 84.45% 83.10%
Rutile 0.13% 0.93% 0.18% 2.22% 0.24% 0.62% 0.14% 1.17% 0.56% 3.39% 0.27% 0.17% 0.62%
Titanite 0.01% 0.04% 0.04% 0.25% 0.04% 0.07% 0.02% 0.21% 0.07% 0.25% 0.03% 0.03% 0.08%
Unknown 0.55% 0.66% 0.17% 0.82% 0.40% 0.49% 0.04% 0.32% 0.30% 0.51% 0.23% 0.11% 0.30%
Zircon 0.23% 3.29% 0.29% 6.32% 0.27% 1.50% 0.32% 3.45% 2.68% 18.34% 0.55% 0.34% 2.11%
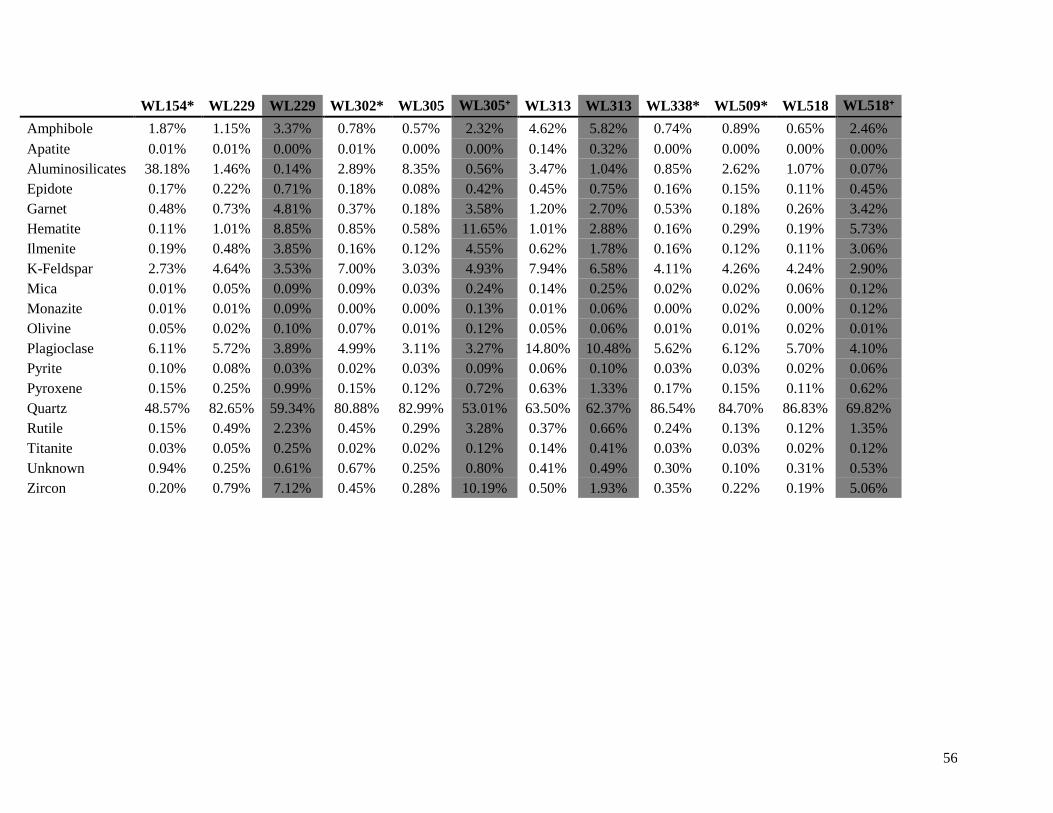
56
WL154* WL229 WL229 WL302* WL305 WL305⁺ WL313 WL313 WL338* WL509* WL518 WL518⁺
Amphibole 1.87% 1.15% 3.37% 0.78% 0.57% 2.32% 4.62% 5.82% 0.74% 0.89% 0.65% 2.46%
Apatite 0.01% 0.01% 0.00% 0.01% 0.00% 0.00% 0.14% 0.32% 0.00% 0.00% 0.00% 0.00%
Aluminosilicates 38.18% 1.46% 0.14% 2.89% 8.35% 0.56% 3.47% 1.04% 0.85% 2.62% 1.07% 0.07%
Epidote 0.17% 0.22% 0.71% 0.18% 0.08% 0.42% 0.45% 0.75% 0.16% 0.15% 0.11% 0.45%
Garnet 0.48% 0.73% 4.81% 0.37% 0.18% 3.58% 1.20% 2.70% 0.53% 0.18% 0.26% 3.42%
Hematite 0.11% 1.01% 8.85% 0.85% 0.58% 11.65% 1.01% 2.88% 0.16% 0.29% 0.19% 5.73%
Ilmenite 0.19% 0.48% 3.85% 0.16% 0.12% 4.55% 0.62% 1.78% 0.16% 0.12% 0.11% 3.06%
K-Feldspar 2.73% 4.64% 3.53% 7.00% 3.03% 4.93% 7.94% 6.58% 4.11% 4.26% 4.24% 2.90%
Mica 0.01% 0.05% 0.09% 0.09% 0.03% 0.24% 0.14% 0.25% 0.02% 0.02% 0.06% 0.12%
Monazite 0.01% 0.01% 0.09% 0.00% 0.00% 0.13% 0.01% 0.06% 0.00% 0.02% 0.00% 0.12%
Olivine 0.05% 0.02% 0.10% 0.07% 0.01% 0.12% 0.05% 0.06% 0.01% 0.01% 0.02% 0.01%
Plagioclase 6.11% 5.72% 3.89% 4.99% 3.11% 3.27% 14.80% 10.48% 5.62% 6.12% 5.70% 4.10%
Pyrite 0.10% 0.08% 0.03% 0.02% 0.03% 0.09% 0.06% 0.10% 0.03% 0.03% 0.02% 0.06%
Pyroxene 0.15% 0.25% 0.99% 0.15% 0.12% 0.72% 0.63% 1.33% 0.17% 0.15% 0.11% 0.62%
Quartz 48.57% 82.65% 59.34% 80.88% 82.99% 53.01% 63.50% 62.37% 86.54% 84.70% 86.83% 69.82%
Rutile 0.15% 0.49% 2.23% 0.45% 0.29% 3.28% 0.37% 0.66% 0.24% 0.13% 0.12% 1.35%
Titanite 0.03% 0.05% 0.25% 0.02% 0.02% 0.12% 0.14% 0.41% 0.03% 0.03% 0.02% 0.12%
Unknown 0.94% 0.25% 0.61% 0.67% 0.25% 0.80% 0.41% 0.49% 0.30% 0.10% 0.31% 0.53%
Zircon 0.20% 0.79% 7.12% 0.45% 0.28% 10.19% 0.50% 1.93% 0.35% 0.22% 0.19% 5.06%
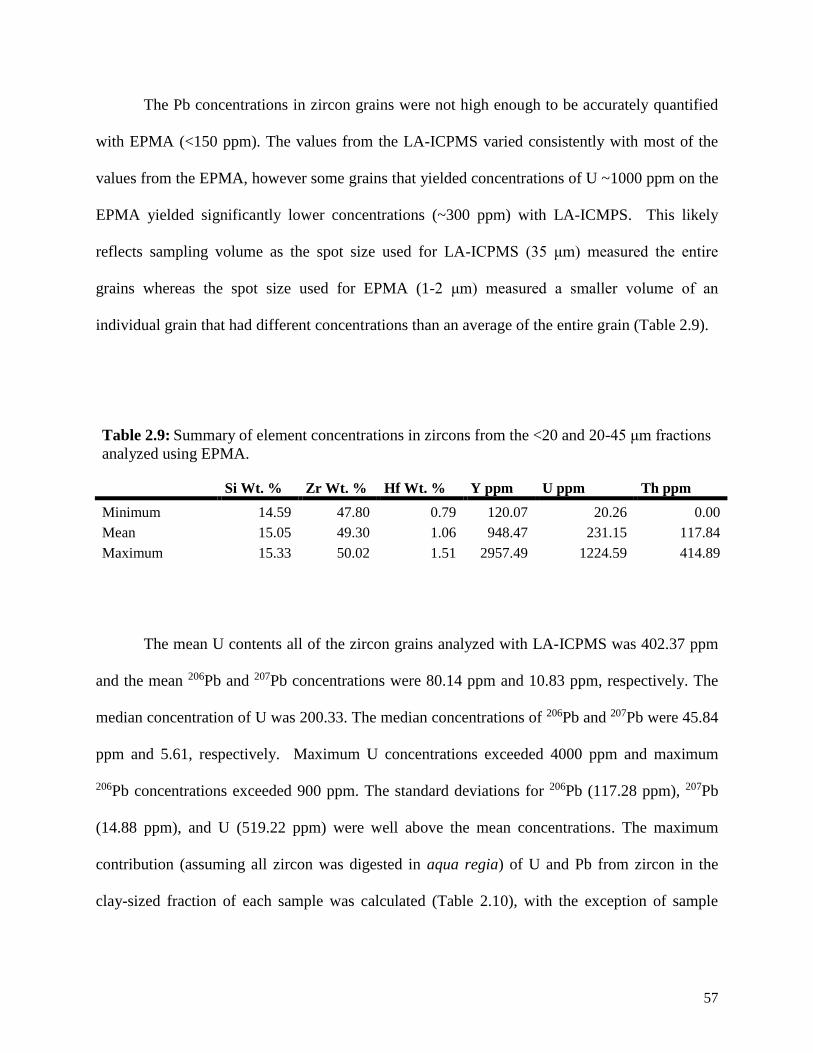
57
The Pb concentrations in zircon grains were not high enough to be accurately quantified
with EPMA (<150 ppm). The values from the LA-ICPMS varied consistently with most of the
values from the EPMA, however some grains that yielded concentrations of U ~1000 ppm on the
EPMA yielded significantly lower concentrations (~300 ppm) with LA-ICMPS. This likely
reflects sampling volume as the spot size used for LA-ICPMS (35 μm) measured the entire
grains whereas the spot size used for EPMA (1-2 μm) measured a smaller volume of an
individual grain that had different concentrations than an average of the entire grain (Table 2.9).
Table 2.9: Summary of element concentrations in zircons from the <20 and 20-45 μm fractions
analyzed using EPMA.
Si Wt. % Zr Wt. % Hf Wt. % Y ppm U ppm Th ppm
Minimum 14.59 47.80 0.79 120.07 20.26 0.00
Mean 15.05 49.30 1.06 948.47 231.15 117.84
Maximum 15.33 50.02 1.51 2957.49 1224.59 414.89
The mean U contents all of the zircon grains analyzed with LA-ICPMS was 402.37 ppm
and the mean 206Pb and 207Pb concentrations were 80.14 ppm and 10.83 ppm, respectively. The
median concentration of U was 200.33. The median concentrations of 206Pb and 207Pb were 45.84
ppm and 5.61, respectively. Maximum U concentrations exceeded 4000 ppm and maximum
206Pb concentrations exceeded 900 ppm. The standard deviations for 206Pb (117.28 ppm), 207Pb
(14.88 ppm), and U (519.22 ppm) were well above the mean concentrations. The maximum
contribution (assuming all zircon was digested in aqua regia) of U and Pb from zircon in the
clay-sized fraction of each sample was calculated (Table 2.10), with the exception of sample
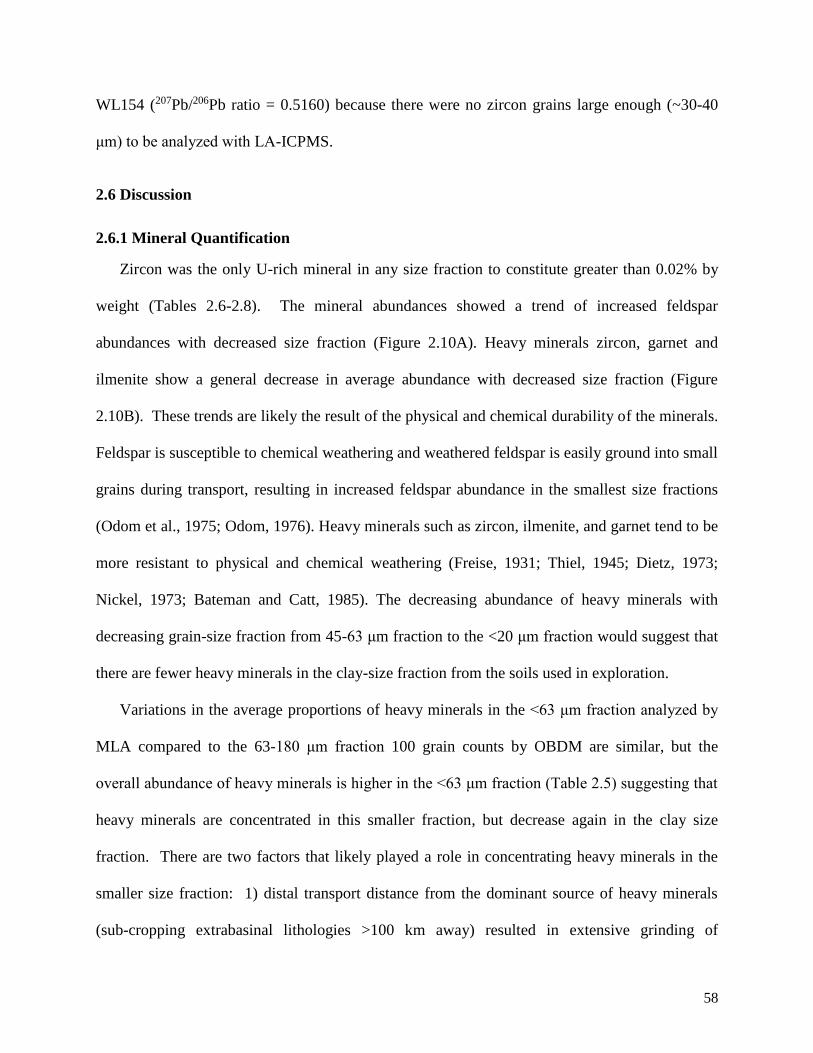
58
WL154 (207Pb/206Pb ratio = 0.5160) because there were no zircon grains large enough (~30-40
μm) to be analyzed with LA-ICPMS.
2.6 Discussion
2.6.1 Mineral Quantification
Zircon was the only U-rich mineral in any size fraction to constitute greater than 0.02% by
weight (Tables 2.6-2.8). The mineral abundances showed a trend of increased feldspar
abundances with decreased size fraction (Figure 2.10A). Heavy minerals zircon, garnet and
ilmenite show a general decrease in average abundance with decreased size fraction (Figure
2.10B). These trends are likely the result of the physical and chemical durability of the minerals.
Feldspar is susceptible to chemical weathering and weathered feldspar is easily ground into small
grains during transport, resulting in increased feldspar abundance in the smallest size fractions
(Odom et al., 1975; Odom, 1976). Heavy minerals such as zircon, ilmenite, and garnet tend to be
more resistant to physical and chemical weathering (Freise, 1931; Thiel, 1945; Dietz, 1973;
Nickel, 1973; Bateman and Catt, 1985). The decreasing abundance of heavy minerals with
decreasing grain-size fraction from 45-63 μm fraction to the <20 μm fraction would suggest that
there are fewer heavy minerals in the clay-size fraction from the soils used in exploration.
Variations in the average proportions of heavy minerals in the <63 μm fraction analyzed by
MLA compared to the 63-180 μm fraction 100 grain counts by OBDM are similar, but the
overall abundance of heavy minerals is higher in the <63 μm fraction (Table 2.5) suggesting that
heavy minerals are concentrated in this smaller fraction, but decrease again in the clay size
fraction. There are two factors that likely played a role in concentrating heavy minerals in the
smaller size fraction: 1) distal transport distance from the dominant source of heavy minerals
(sub-cropping extrabasinal lithologies >100 km away) resulted in extensive grinding of
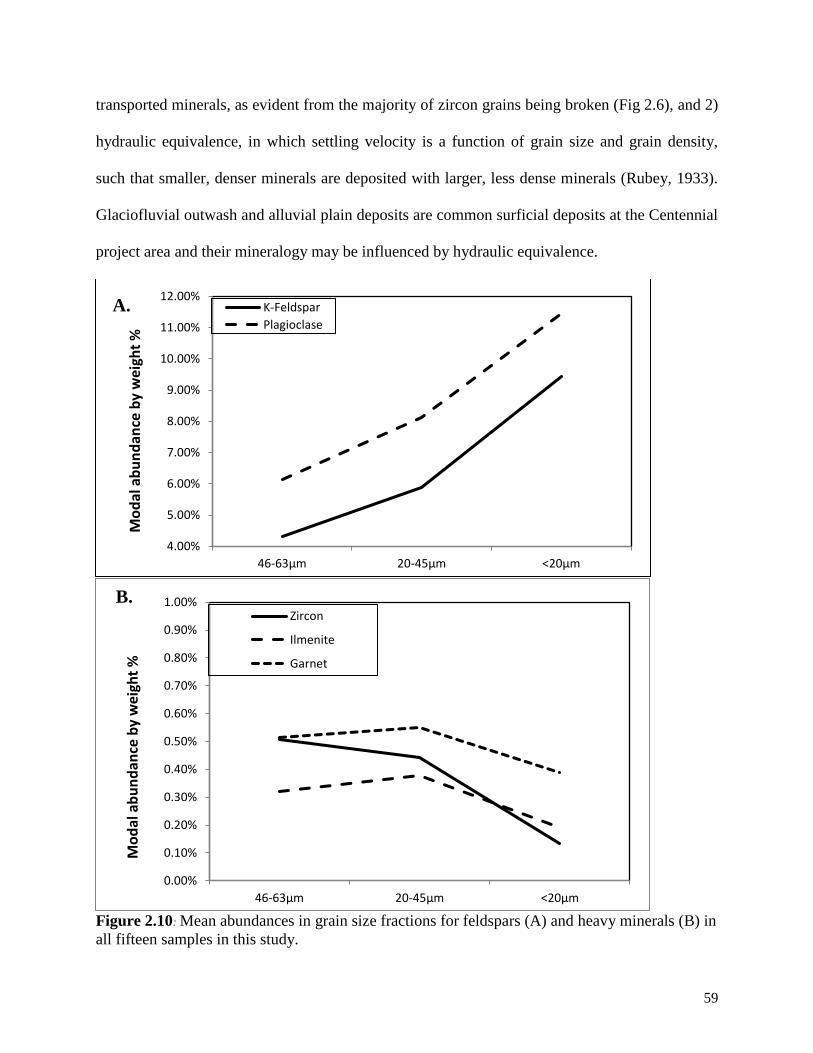
59
transported minerals, as evident from the majority of zircon grains being broken (Fig 2.6), and 2)
hydraulic equivalence, in which settling velocity is a function of grain size and grain density,
such that smaller, denser minerals are deposited with larger, less dense minerals (Rubey, 1933).
Glaciofluvial outwash and alluvial plain deposits are common surficial deposits at the Centennial
project area and their mineralogy may be influenced by hydraulic equivalence.
Figure 2.10: Mean abundances in grain size fractions for feldspars (A) and heavy minerals (B) in
all fifteen samples in this study.
4.00%
5.00%
6.00%
7.00%
8.00%
9.00%
10.00%
11.00%
12.00%
46-63µm 20-45µm <20µm
Mo
dal
ab
un
dan
ce b
y w
eigh
t %
K-Feldspar
Plagioclase
0.00%
0.10%
0.20%
0.30%
0.40%
0.50%
0.60%
0.70%
0.80%
0.90%
1.00%
46-63µm 20-45µm <20µm
Mo
dal
ab
un
dan
ce b
y w
eigh
t %
Zircon
Ilmenite
Garnet
A.
B.
60
The pebble fraction from soil samples in the Athabasca Basin can be divided into
extrabasinal material, which is a dominant source of U-rich minerals, and basinal material that is
dominantly quartz. Pebble counting is an effective estimate of the dominant source of sediment
in a given sample (Anderson, 1957; Gibbard, 1985; Woodward et l., 1992). The number of
extrabasinal pebbles in each sample from this project does not show any correlation with heavy
minerals in the smaller size fractions (Figure 2.9). However, proportions of extrabasinal pebbles
are very low (23% or less) in the 8 samples that had pebbles from Centennial. More conclusive
work needs to be conducted to test the viability of pebbles counting to determine provenance of
finer fractions in soils. However, pebble counts may still be a useful addition to surface
geochemical surveys to help identify patterns that may indicate sources of false anomalies or
even dispersal trains from sub-cropping mineralization.
2.6.2 Radiogenic Pb Contribution from Zircon at the Surface
The average 207Pb/206Pb ratio for the entire soil survey from 2013 excluding samples with
ratios <0.60 is 0.70, which is the background ratio for this area. For ratios lower than this, there
must be U-rich sources in the till or radiogenic Pb that has migrated to the surface from the
Centennial deposit at depth during secondary dispersion processes. The brittle structural
framework that resulted from the Virgin River Shear Zone and the Dufferin Fault may be the
pathways for secondary dispersion of radiogenic Pb. Many of the samples with the lowest
(<0.60) 207Pb/206Pb ratios are either within 100m of the surface projection of the deposit outline
or along brittle structures that are associated with the deposit (Figure 2.2), suggesting that the
most direct pathways from the deposit are associated with the lowest 207Pb/206Pb ratios.
The maximum contribution from zircons in the host till to the Pb isotopic composition and U
concentrations of the clay-fraction chemistry can be estimated using the Pb and U contents and
61
207Pb/206Pb in the zircons and the mass of the zircons in the smallest size fraction of this study,
the <20 μm fraction. This is a maximum contribution because, although metamict zircon grains
may dissolve in the aqua regia (Ewing et al., 1982; Tole et al., 1985; Belan et al., 2001), more
than 10% of the zircon grains in the <20 μm fraction of the host till were fully intact crystals so it
is not likely that all of the zircon grains were dissolved by aqua regia. In addition, the abundance
of zircons decreases with decreasing size fraction so there are fewer zircon grains in the clay-size
fraction than in the <20 μm fraction.
Six of the fifteen samples selected for this study have 207Pb/206Pb ratios <0.60. Three of these
(WL302, WL305, WL338) were within 100m of the surface projected deposit outline or along
structures associated with the deposit (Figure 2.2). The effect on the 207Pb/206Pb of the clay
fraction from the zircons in these three samples was ≤0.034 (Table 2.10). This suggests that the
dominant source of radiogenic 207Pb/206Pb ratios in these samples are not heavy minerals in the
soil at the surface. However, these three samples have relatively low U contents, (Table 2.4;
Figure 2.11) suggesting that the radiogenic Pb in the clay fraction was sourced from secondary
dispersion of radiogenic Pb, but not of U.
The lowest 207Pb/206Pb ratio in this study is 0.516 (WL154) located >200m away from any
geophysical evidence of brittle structures associated with the deposit (Figure 2.2). There is no
evidence of contamination from heavy minerals in WL154 as it has the lowest abundance of
zircon in the <20 μm fraction of any of the 15 samples analyzed with MLA. However, WL154
was the most clay-rich (73.08% aluminosilicates in the <20 μm fraction) of all the samples
analyzed with MLA and was located in a flat lying area. Fine-grained, silty sand in flat lying
areas is characteristic of glaciolacustrine deposits in the Athabasca Basin (Campbell, 2007). U
could have been removed from the sediments when a lake drained leaving behind radiogenic Pb
62
at WL154. WL134 was the only A2 horizon soil analyzed for mineralogy and it also has a
relatively low 207Pb/206Pb ratio (0.613) and relatively low zircon abundance in the <20 μm
fraction (0.07%). The A2 horizon at WL134 was sampled because of the proximity to a
streambed allowing deep, recent eluviation. The presence of meteoric water here could have
removed U but not radiogenic Pb. Indeed, these two samples have background U contents with
low 207Pb/206Pb ratios (Figure 2.11).
Samples WL518 and WL509 have radiogenic 207Pb/206Pb ratios and are located about 2 km
north-northeast of the surface projection of the deposit (Figure 2.2). WL518 has a calculated
change in the 207Pb/206Pb in the clay fraction of 0.045 to the ratio, suggesting that a small amount
of the radiogenic Pb could be the result of zircon in the soil at the surface. In contrast, zircons in
WL509 lowered the 207Pb/206Pb of the clay fraction by only 0.006. In both samples, the
207Pb/206Pb is not affected by the zircons in the soil enough to account for their 207Pb/206Pb ratios
being <0.60, so there must be another source of radiogenic Pb. The area 2 km N-NE of the
deposit outline hosts a group of radiogenic Pb anomalies in the clay fraction centered on a
resistivity low corridor (Figure 2.2) that may be related to brittle structures in the bedrock that
could act as pathways for radiogenic Pb from U-mineralization at the unconformity.
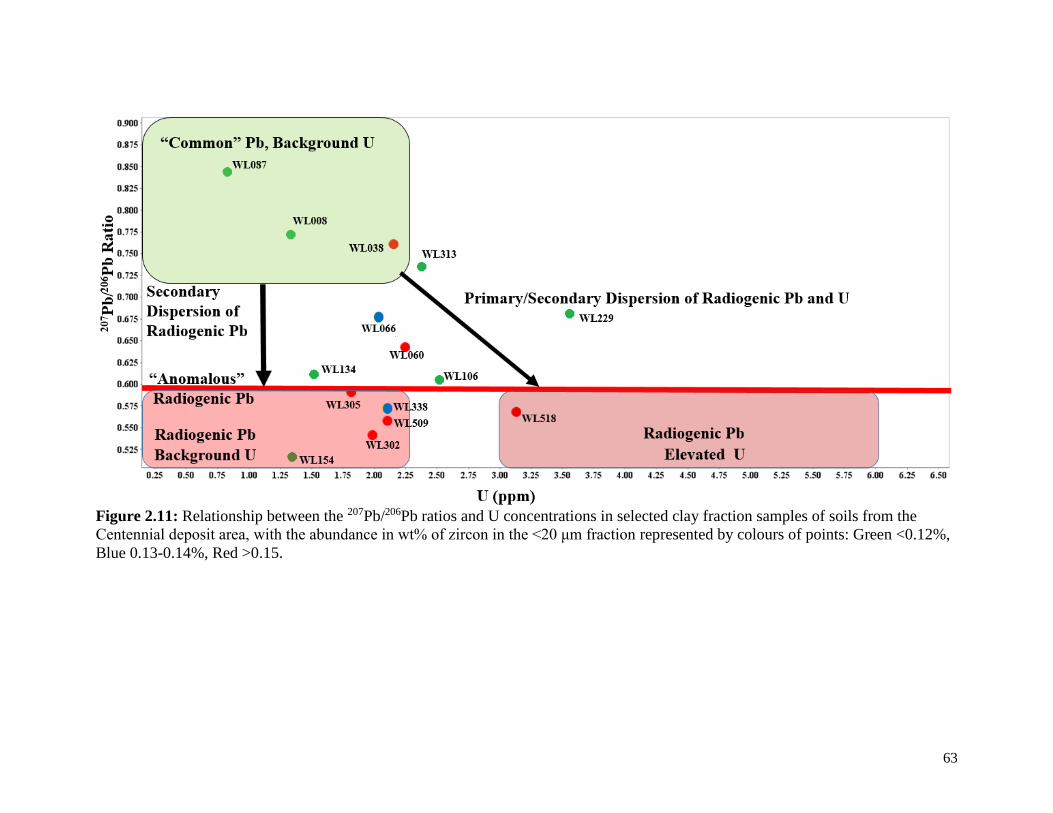
63
Figure 2.11: Relationship between the 207Pb/206Pb ratios and U concentrations in selected clay fraction samples of soils from the
Centennial deposit area, with the abundance in wt% of zircon in the <20 μm fraction represented by colours of points: Green <0.12%,
Blue 0.13-0.14%, Red >0.15.
64
Samples with background 207Pb/206Pb ratios generally have smaller corrections to their
207Pb/206Pb from the zircons (Table 2.10), assuming that the Pb in the zircons from the <20 μm
fraction affected the Pb in the clay fraction. For example, the sample with the highest “common”
207Pb/206Pb ratio of 0.84 (WL087) also has the smallest corrections to its 207Pb/206Pb (0.002) and
is located >2km away from the deposit. However, the sample with the largest correction to its
207Pb/206Pb of 0.078 is WL038, but the 207Pb/206Pb in the clay fraction was 0.760, well above the
background 207Pb/206Pb ratio in the area. Sample WL060 has a relatively low 207Pb/206Pb ratio
(0.644) despite being located >2 km from the deposit, but it also has one of the largest
corrections to its 207Pb/206Pb (0.027). This correction could, in part, account for the low
207Pb/206Pb ratio in the clay fraction of WL060. Samples WL060 and WL038 lie west of the
deposit and near the inferred Dufferin Fault zone and have 207Pb/206Pb ratios >0.60, as do all of
the samples just west of the deposit and the Dufferin Fault zone (Figure 2.2).
The densest grouping of samples with 207Pb/206Pb ratios <0.60 lie along geophysically
defined structures associated with the deposit (Figure 2.2), consistent with the most direct
pathways from high grade U mineralization being associated with the most radiogenic clay
fractions.
The corrections were calculated only taking zircon grains into account because monazite, the
other U-rich mineral present, was in very insignificant abundances. However, there are other
minerals that are not as rich in uranium but still may have trace concentrations; minerals like
apatite, rutile, ilmenite, titanite, and garnet may all contain trace concentration of uranium.
Therefore, the abundances and U and Pb concentrations of heavy minerals other than zircon
should be considered when interpreting surface geochemical surveys.
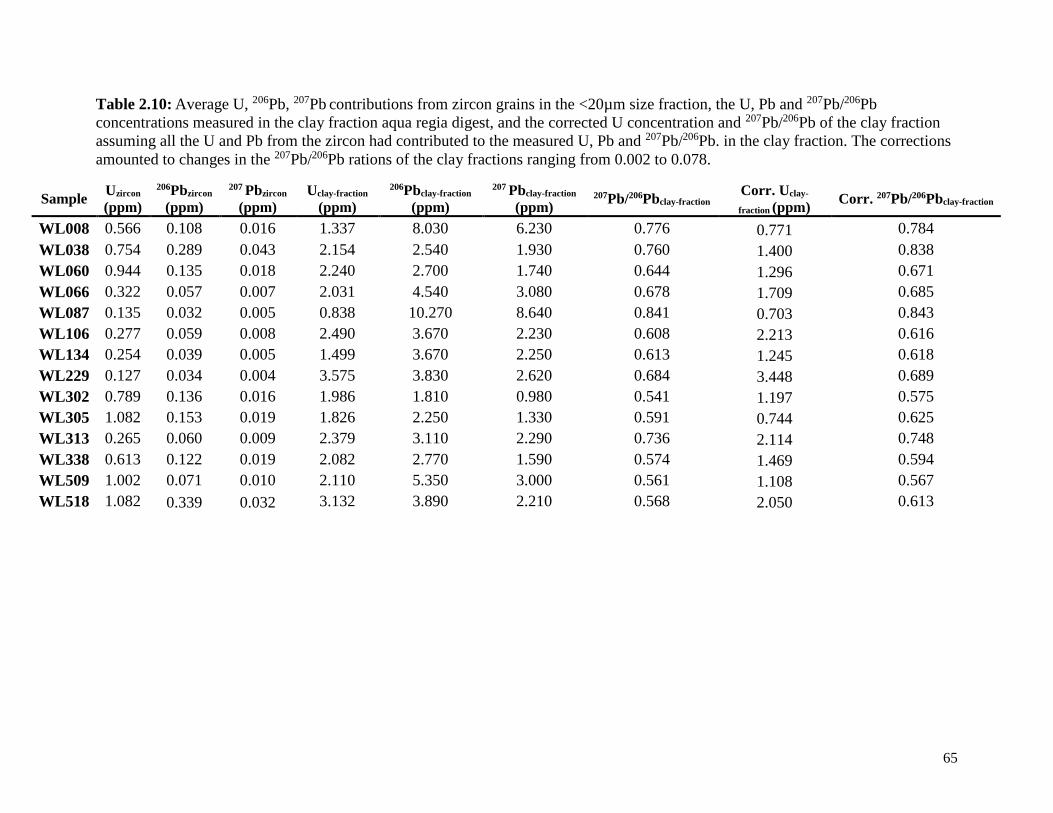
65
Table 2.10: Average U, 206Pb, 207Pb contributions from zircon grains in the <20µm size fraction, the U, Pb and 207Pb/206Pb
concentrations measured in the clay fraction aqua regia digest, and the corrected U concentration and 207Pb/206Pb of the clay fraction
assuming all the U and Pb from the zircon had contributed to the measured U, Pb and 207Pb/206Pb. in the clay fraction. The corrections
amounted to changes in the 207Pb/206Pb rations of the clay fractions ranging from 0.002 to 0.078.
Sample Uzircon
(ppm)
206Pbzircon
(ppm)
207 Pbzircon
(ppm)
Uclay-fraction
(ppm)
206Pbclay-fraction
(ppm)
207 Pbclay-fraction
(ppm) 207Pb/206Pbclay-fraction
Corr. Uclay-
fraction (ppm) Corr. 207Pb/206Pbclay-fraction
WL008 0.566 0.108 0.016 1.337 8.030 6.230 0.776 0.771 0.784
WL038 0.754 0.289 0.043 2.154 2.540 1.930 0.760 1.400 0.838
WL060 0.944 0.135 0.018 2.240 2.700 1.740 0.644 1.296 0.671
WL066 0.322 0.057 0.007 2.031 4.540 3.080 0.678 1.709 0.685
WL087 0.135 0.032 0.005 0.838 10.270 8.640 0.841 0.703 0.843
WL106 0.277 0.059 0.008 2.490 3.670 2.230 0.608 2.213 0.616
WL134 0.254 0.039 0.005 1.499 3.670 2.250 0.613 1.245 0.618
WL229 0.127 0.034 0.004 3.575 3.830 2.620 0.684 3.448 0.689
WL302 0.789 0.136 0.016 1.986 1.810 0.980 0.541 1.197 0.575
WL305 1.082 0.153 0.019 1.826 2.250 1.330 0.591 0.744 0.625
WL313 0.265 0.060 0.009 2.379 3.110 2.290 0.736 2.114 0.748
WL338 0.613 0.122 0.019 2.082 2.770 1.590 0.574 1.469 0.594
WL509 1.002 0.071 0.010 2.110 5.350 3.000 0.561 1.108 0.567
WL518 1.082 0.339 0.032 3.132 3.890 2.210 0.568 2.050 0.613
66
2.6.3 Identifying “false” Radiogenic Pb anomalies at the surface
Uraninite samples from the Athabasca Basin have a convex REE pattern (Fayek and
Kyser, 1997; Mercadier et al., 2011a; Mercadier et al., 2011b), whereas altered and unaltered
sandstone in the Athabasca Basin is LREE enriched (Fayek and Kyser, 1997). Zircon can contain
concentrations of up to 10% REE2O3 (Speer, 1982) and garnet can have up to 1% REE2O3 (Jaffe
1951; Wakita et al. 1969; Meagher 1982). In both minerals, chondrite-normalized patterns
indicate that HREE are relatively enriched compared to LREE (Hanchar, 2001; Whitehorse and
Platt, 2003). Therefore, the LREE enriched patterns recorded by the clay separates from
Centennial (Figure 2.12) do not resemble zircon and garnet REE patterns, nor do they reflect
primary or secondary dispersion of REE from the Centennial deposit, but are most similar to the
REE patterns in the sandstones of the basin.
There is no correlation between zircon abundances, their U concentrations, or the
corrections they impart on the 207Pb/206Pb ratios of the clay fractions. However, there is a
moderate positive correlation (r2=0.61) between the combined abundances of zircon and garnet
in the <20 μm fraction and HREE/LREE in the clay fractions and between zircon and garnet
abundances in the <20 μm fraction (r2=0.64). WL134 is an exception to the correlation between
HREE/LREE and combined zircon and garnet abundances (Figure 2.12), but the recent
eluviation resulting in a deep A2 horizon likely effected the chemistry and mineralogy at that
sample. Zircon can contain U, radiogenic Pb, and HREE (Ahrens et al., 1967; Hanchar and
Westrenen, 2007) so that enrichment of HREE accompanied by radiogenic Pb and U anomalies
in clay-fraction chemistry may be indicative of detrital zircon in a sample. Chondrite-normalized
REE patterns in the clay fractions of the 15 samples analyzed for mineral abundances (Figure
2.13) illustrate that the samples with higher abundances of zircon in the <20 μm fraction also
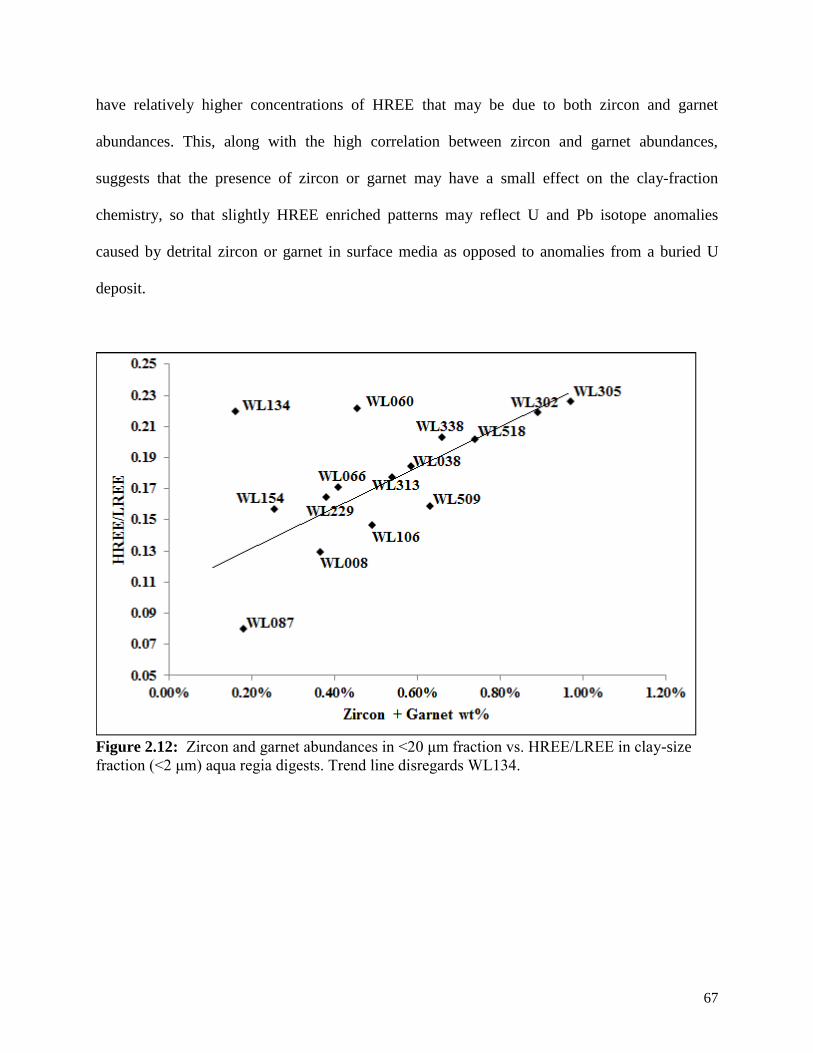
67
have relatively higher concentrations of HREE that may be due to both zircon and garnet
abundances. This, along with the high correlation between zircon and garnet abundances,
suggests that the presence of zircon or garnet may have a small effect on the clay-fraction
chemistry, so that slightly HREE enriched patterns may reflect U and Pb isotope anomalies
caused by detrital zircon or garnet in surface media as opposed to anomalies from a buried U
deposit.
Figure 2.12: Zircon and garnet abundances in <20 μm fraction vs. HREE/LREE in clay-size
fraction (<2 μm) aqua regia digests. Trend line disregards WL134.
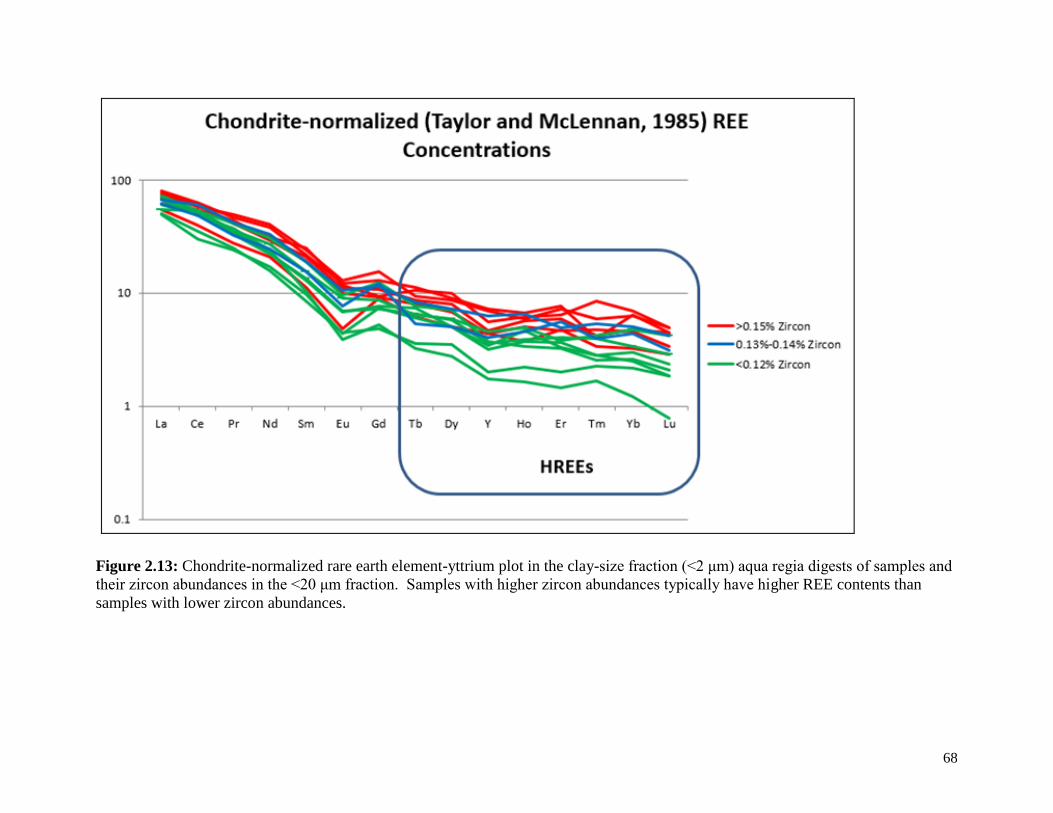
68
Figure 2.13: Chondrite-normalized rare earth element-yttrium plot in the clay-size fraction (<2 μm) aqua regia digests of samples and
their zircon abundances in the <20 μm fraction. Samples with higher zircon abundances typically have higher REE contents than
samples with lower zircon abundances.
69
2.7 Conclusions
Heavy minerals commonly found in soils such as zircon and monazite can contain high
concentrations of U and radiogenic Pb that may affect the geochemical signature of the soils.
Above the Centennial deposit, which is >100 km down ice of basement sources of
contamination, the surficial geochemistry is not significantly affected by glacially transported
material. Zircon was the only U-rich mineral found in any significant abundance (>0.02%) in the
<63 μm fractions of soil samples analyzed above the Centennial deposit. Zircon appears to be
concentrated in the <63 μm fraction (Max. = 2.69%), but the abundance decreases an order of
magnitude in the <20 μm fraction (Max. = 0.26%) and is likely even less abundant in the clay-
fraction (<2 μm). The maximum effect that zircon would have on 207Pb/206Pb ratios of the clay-
fraction at the Centennial deposit is 0.078 and the maximum contribution to U is 1.08 ppm.
Six samples were selected because their clay fractions have radiogenic 207Pb/206Pb ratios
of <0.6. The greatest possible effect on the Pb isotope ratios of these samples from zircons in the
soils is a decrease in their 207Pb/206Pb ratios of only 0.045. None of the samples with radiogenic
207Pb/206Pb ratios analyzed were significantly affected by zircon in the host soils at the surface.
Therefore, the radiogenic Pb came from another source, such as U-rich lithologies at depth or U-
rich minerals in till meters below the surface where the samples were collected. All of the
samples with radiogenic 207Pb/206Pb ratios <0.6 show evidence of secondary dispersion of
radiogenic Pb or U and radiogenic Pb, but not of U (Figure 2.11).
Seven of the nine samples with background 207Pb/206Pb ratios of >0.6 would have a
correction to their 207Pb/206Pb ratios of 0.012 or less, suggesting that these were not affected by
minerals in the soils at the surface. However, one sample (WL106) has a 207Pb/206Pb ratio in the
clay fraction of 0.608, which is low for a background ratio. WL106 is located near a
geophysically defined structure associated with the deposit (Figure 2.2) suggesting that the
70
relatively low 207Pb/206Pb ratio is related to the deposit at depth. The two samples with
background 207Pb/206Pb ratios in the clay fraction, but potentially large corrections to their
207Pb/206Pb ratios from zircons (WL060 = 0.027 and WL038 = 0.078) are not associated with the
deposit outline or geophysically defined structures. This suggests that these 207Pb/206Pb ratios
could have been affected by minerals at surface, but not enough to produce “false” radiogenic Pb
anomalies.
The contributions from transported zircon to surface geochemical anomalies at the
Centennial deposit are minimal because of the great distance from potential sources of
contamination. However, other minerals such as apatite, rutile, ilmenite, and garnet may also
contain trace concentrations of U and the abundances and geochemistry of these minerals should
be considered in future studies. Only the minerals in the near surface environment were taken
into account for this project, but other generations of glacial deposits deeper below the surface
may contain minerals that could be potential sources of secondary dispersion of pathfinder
elements. Therefore, glacial stratigraphy should also be taken into account. The materials at or
near the surface may more significantly affect exploration geochemical surveys carried out closer
to sources of U-rich mineral contamination (i.e., outcropping basement rocks). For example, if
the abundance of zircon was 4 times higher (~1% zircon) in the clay fraction of soils, U
contributions could exceed 4 ppm and 207Pb/206Pb ratios could be lowered by up to 0.3.
Although the pebble counts of extrabasinal material from Centennial samples showed no
correlation with the heavy mineral content in the <63 μm fraction (Figure 2.9), there is a minimal
amount (23% or less) of extrabasinal pebbles at Centennial. Only 8 samples from Centennial
contained pebbles and extrabasinal lithologies also contain lighter minerals like k-feldspar and
quartz. Therefore, pebble counting in surface geochemical exploration programs should be
71
studied further as a possible cost effective way to identify sediment sources that could contribute
to U, radiogenic Pb, and other pathfinder element anomalies.
Although minimal abundances of U-rich minerals may affect the 207Pb/206Pb ratios, they
commonly contain other, less mobile, elements. Zircon and garnet are commonly associated and
are relatively enriched in HREE compared to LREE and HREE are relatively immobile
compared to radiogenic Pb mobilized from a U deposit (Holk et al., 2003, Alexandre et al., 2009,
Stewart, 2015, Kyser et al., 2015). Zircon and garnet abundances in the <20 μm fraction at
Centennial showed a strong correlation with HREE concentrations in clay fraction chemistry.
Radiogenic Pb anomalies accompanied by higher concentrations of HREE relative to
background may be possible “red flags” for false anomalies being produced by zircon at the
surface.
Exploration for deeply buried unconformity-related U deposits using radiogenic Pb ratios
in clay-size fractions of soils at the surface combined with geophysical exploration methods is a
viable technique. However, awareness of local surficial deposits, local and regional ice flow
directions, and distance from near surface sources of contamination is critical for interpretation
of radiogenic Pb anomalies.
72
Chapter 3: Conclusions and Future Work
There are commonly heavy minerals in soils that can contain high concentrations of U
and radiogenic Pb. Minerals, such as zircon or monazite, are u-rich and may affect the
geochemical signature of the soils. Other minerals including apatite, rutile, ilmenite, and garnet
may all contain trace concentration of U and may affect the geochemical signature of the soils.
The Athabasca Group sandstone consists of dominantly quartz (Ramaekers, 1990) so surficial
sediments sourced from the Athabasca Group will have minimal heavy minerals. However,
Proterozoic and Archean basement lithologies that are exposed at the surface around the
Athabasca Basin can contain significant abundances of U-rich heavy minerals (Hecht and Cuney,
2000; Annesley et al., 2000). The surficial geochemistry at Centennial is not significantly
affected by zircon in the glacial sediments because the Centennial deposit is located >100 km
down ice (most recent ice flow) of any exposed basement lithologies. However, other heavy
minerals that could contain elevated U concentrations should be considered and minerals other
generations of glacial deposits deeper below the surface should be considered as potential
sources for secondary dispersion of pathfinder elements.
Zircon was the only U-rich mineral found in any significant abundance (>0.02%) in the
<63 μm fractions of soil samples analyzed above the Centennial deposit. The maximum
abundance of zircon decreases an order of magnitude from the <63 μm fraction (Max. = 2.69%)
to the <20 μm fraction (Max. = 0.26%) and is likely even less abundant in the clay-fraction (<2
μm). The estimate of the effect that zircon had on 207Pb/206Pb ratios was calculated using zircon
abundances from the <20 μm fraction and the highest change to the 207Pb/206Pb ratio was 0.078 at
WL038. Even with the highest calculated effect on the 207Pb/206Pb ratio, WL038 has a
73
207Pb/206Pb ratio of 0.760 so it was not effected by zircon enough to generate a “false” radiogenic
Pb anomaly.
The greatest possible effect zircon in the soil had on the Pb isotope ratios of the 6
selected samples with radiogenic 207Pb/206Pb ratios is a decrease of only 0.045 in their 207Pb/206Pb
ratios. There are not enough U-rich minerals in any of the radiogenic samples analyzed to
account for their 207Pb/206Pb ratios being well below 0.600 and all of the samples with radiogenic
207Pb/206Pb ratios <0.6 show evidence of secondary dispersion of radiogenic Pb or U and
radiogenic Pb, but not of U alone. Therefore, the radiogenic Pb is more likely sourced from
secondary dispersion from some type of U-rich source below the surface. These sources could
include U-rich lithologies at depth, a U deposit at depth, or U-rich minerals in till meters below
the surface where the samples were collected.
Nearly all of the selected samples with background 207Pb/206Pb ratios of >0.6 would have
a correction to their 207Pb/206Pb ratios of 0.012 or less, suggesting that these were not
significantly affected by minerals in the soil at the surface. WL106 had 207Pb/206Pb ratio in the
clay fraction of 0.608, which is low for a background ratio, and it is located near a geophysically
defined structure associated with the deposit. The low effect zircon in the soil would have on the
207Pb/206Pb ratio (decrease of only 0.008) and the proximity to structures related to the deposit
suggests that the relatively low 207Pb/206Pb ratio at WL106 is related to the deposit at depth.
WL060 and WL038 both had potentially large corrections to their 207Pb/206Pb ratios from zircons
(decreases of 0.027 and 0.078, respectively). However, these samples had 207Pb/206Pb ratios well
above background and they are not spatially associated with the deposit outline or geophysically
defined structures. Therefore, the 207Pb/206Pb ratios at WL060 and WL038 may have been
74
affected by the minerals at the surface, but not enough to produce “false” radiogenic Pb
anomalies.
The minimal effect that U-rich minerals in the soil have on the surface geochemical
survey at Centennial is a result of the transport distance from any exposed basement lithologies
containing high abundances of U-rich minerals. However, surface geochemical surveys carried
out more proximally down ice of exposed basement lithologies may be significantly affected. If
the abundance of zircon is 4 times higher (~1% zircon) in the clay fraction of soils, U
contributions from zircon could exceed 4 ppm and 207Pb/206Pb ratios could be decreased by up to
0.3. Therefore, exploration for deeply buried U-deposits using radiogenic Pb ratios in the clay-
size fraction of soils is a viable technique when combined with geophysical exploration methods,
but awareness of local and regional surficial deposits and ice flow directions is important for
interpretation of radiogenic Pb anomalies.
At Centennial, the dominant source of U-rich minerals is glacially transported
extrabasinal material. The pebble counts of extrabasinal material showed no correlation with the
heavy mineral content in the <63 μm fraction. However, there were only 8 samples with pebbles
in them and minimal abundances of extrabasinal material. Pebble counting in surface
geochemical exploration programs may still be a cost effective way to identify sediment sources
that could contribute to U, radiogenic Pb, and other pathfinder element anomalies especially in
areas with significantly more extrabasinal material at the surface. Large groups of geochemical
anomalies, especially ones that coincide with high extrabasinal pebble counts and ice flow
directions, may be possible “red flags” for false anomalies being produced by U-rich minerals in
the soil at the surface.
75
U-rich minerals may affect the 207Pb/206Pb ratios, but they commonly contain other, less
mobile, elements. For example, zircon and garnet are relatively enriched in HREE compared to
LREE (Hanchar, 2001, Whitehorse and Platt, 2003). HREE are relatively immobile (Fayek and
Kyser, 1997) compared to radiogenic Pb mobilized from a U deposit (Holk et al., 2003,
Alexandre et al., 2009, Stewart, 2015, Kyser et al., 2015). At Centennial, there is a strong
correlation between zircon and garnet in the <20 μm fraction (r2=0.61) suggesting that they were
transported from the same source. Radiogenic Pb anomalies accompanied by higher
concentrations of HREE relative to background may be possible “red flags” for false anomalies
being produced by zircon accompanied by garnet in the soil at the surface.
3.5 Future Work
Minerals at the surface did not significantly affect the clay-fraction chemistry at the
Centennial deposit, but clay-fraction chemistry at different locations more proximally down ice
of exposed extrabasinal material could be affected. Therefore, carrying out the same type of
study at a location where a geochemical survey has been carried out that is more likely to be
affected (e.g. eastern region of the Athabasca Basin) would be helpful for characterizing “false”
radiogenic Pb anomalies. Fine fraction mineral abundance identification using MLA, identifying
and counting extrabasinal pebbles, and calculating effects that U-rich minerals would have on
clay-fraction geochemistry will help to identify characteristics of soils that generate “false”
radiogenic Pb anomalies. Other minerals that may have trace amounts of U should also be
considered and the concentrations of REE in minerals studied should also be determined to
identify potential sources of higher HREE/LREE patterns. This study focused on minerals very
close to the surface, but other generations of glacial deposits may be below the surface and these
76
should be considered as potential sources of secondary dispersion of pathfinder elements.
Locations in the Athabasca Basin where airborne radiometrics identify dominantly extrabasinal
material (Figure 3.1) at the surface would be suitable for future investigations.
Using HREE/LREE ratios combined with pebble counting and surficial geology mapping
may be an effective way to distinguish “false” from “true” radiogenic Pb and U anomalies.
Carrying out similar studies on the eastern margin of the Athabasca Basin would be important
for testing this hypothesis. The maximum proportion of extrabasinal pebbles in the samples
analyzed at Centennial was 23 % and the maximum abundances of zircon and garnet in the <20
μm fraction were 0.26% and 0.75%, respectively. If samples taken near the eastern margin of the
Athabasca Basin had proportions of extrabasinal pebbles in the 60-80% range, there would likely
be higher abundances of zircon and garnet as well. Increased zircon could result in “false”
radiogenic Pb anomalies, but the increased abundance of both zircon and garnet could result in
higher HREE/LREE ratios.
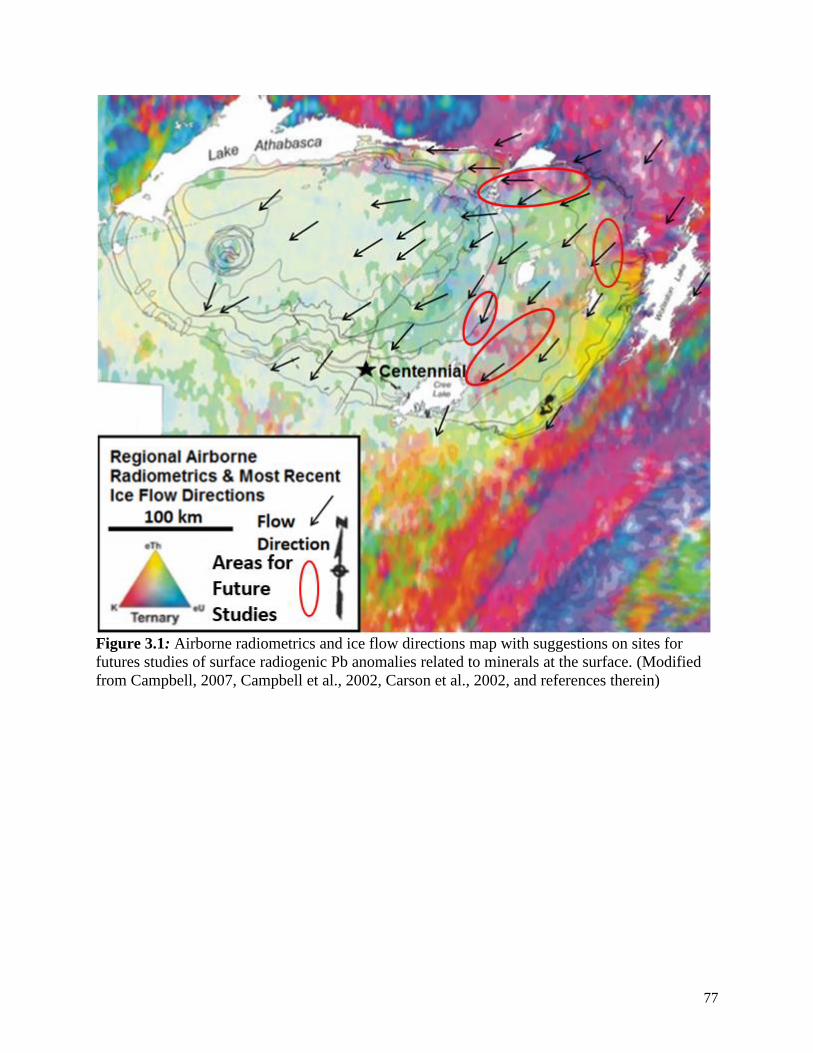
77
Figure 3.1: Airborne radiometrics and ice flow directions map with suggestions on sites for
futures studies of surface radiogenic Pb anomalies related to minerals at the surface. (Modified
from Campbell, 2007, Campbell et al., 2002, Carson et al., 2002, and references therein)
78
References
Ahrens, L. H., Cherry, R. D., and Erlank, A. J., 1967. Observations on the Tn-U relationship in
zircons from granitic rocks and from kimberlites. Geochimica et Cosmochimica Acta, v.31-
12, 2379-2387
Alexandre, P., Kyser, K., Jiricka, D. 2009. Critical Geochemical and Mineralogical Factors for
the Formation of Unconformity-Related Uranium Deposits: Comparison between Barren and
Mineralized Systems in the Athabasca Basin, Canada. Economic Geology, 104, 413-435
Alexandre, P., Kyser, K., Jiricka, D., and Witt, G., 2012. Formation and evolution of the
Centennial unconformity-related uranium deposit in the south-central Athabasca Basin,
Canada: Economic Geology, v. 107, 385–400
Anderson, Richard C., 1957. Pebble and sand lithology of the major Wisconsin glacial lobes of
the Central Lowland, Geological Society of America Bulletin, v.68-11, 1415-1450.
Anneseley, I. R., Madore, C., Kusmirski, R. T., & Bonli, T., 2000. Uraninite-bearing granitic
pegmatite, Moore Lakes, Saskatchewan: petrology and U-Th-Pb chemical ages. Summary of
investigations, v. 2, 2000-4.
Annesley, I. R., Madore, C., 1999. Leucogranites and Pegmatites of the Sub-Athabasca
Basement, Saskatchewan: U Protore? Stanley, C.J. (ed) Mineral Deposits: Proceess to
Processing. Balkema, Rotterdam, 297-300
Armstrong, R.L. & Ramaekers, P. 1985. Sr Isotopic Study of Helikian Sediment and Diabase
Dikes in the Athabasca Basin in Northern Saskatchewan. Canadian Journal of Earth
Sciences, 22(3), 399-407
79
Aspandiar, M.F., Anand, R.R. and Gray, D.J., 2008. Geochemical Dispersion Mechanisms
Through Transported Cover: Implications for Mineral Exploration in Australia. CRC Leme,
Open File Report 246, 84p.
Balan, E., Neuville, D.R., Trocellier, P., Fritsch, E., Muller, J.P. & Calas, G. 2001.
Metamictization and Chemical Durability of Detrital Zircon. American Mineralogist, 86,
1025-1033
Bateman, R. M., & Catt, J. A., 1985. Modification of Heavy Mineral Assemblages in English
Coversands by Acid Pedochemical Weathering. Catena, v.12(1), 1-21.
Blaskovich, R.J., 2013. Characterizing waste rock using automated quantitative electron
microscopy. MSc. Thesis, University of British Columbia, 327p.
Bruneton, P., 1987. Geology of the Cigar Lake Uranium Deposit (Saskatchewan, Canada).
Economic Minerals of Saskatchewan, Saskatchewan Geological Society, 99-119
Cameron, E. M. 2013. From Chile to Nevada to the Athabasca Basin: Earthquake-Induced
Geochemical Anomalies from Near-Field to Far-Field. Geochemistry: Exploration,
Environment, Analysis, 13, 41-51
Campbell, J.E. 1980. Report on the Surficial Geology of the Dufferin Lake Project Area, for
Uranerz. Saskatchewan Industry and Resources Mineral Assessment File No. 74G05-NE
0042, 7p.
Campbell, J.E. 1995a. The Surficial Geology of the Birgin Lake Project Area, Saskatchewan
and Recommendations for Future Work. Saskatchewan Industry and Resources Mineral
Assessment File No. 74G14-001, 9p.
Campbell, J.E. 1995b. Surficial Geology of the Black Lake Project (75-02) area, Saskatchewan.
Saskatchewan industry and Resources Mineral Assessment File No. 74P04-0033, 8p.
80
Campbell, J.E. 1998a. Quaternary Geological Investigations in the Dawn Lake Deposit Area,
Dawn Lake Project. Saskatchewan Industry and Resources Mineral Assessment File No. 741-
0066, 35p.
Campbell, J.E. 1998b. Quaternary Geological Investigations in the Karen-Newnham Lakes
Area, Perch-Cyprian Project (NTS 74P-1, 2) for JNR Resources Inc. Saskatchewan Industry
and Resources Mineral Assessment File No. 74p-0016, 27p.
Campbell, J.E. 2001. Phelps Lake Project: Highlights of the Quaternary Investigations in the
Bonokoski Lake Area (NTS 64M-11, -12, -13, and -14). Summary of Investigations 2001,
Volume 2, Saskatchewan Geological Survey, Saskatchewan Energy and Mines, Miscellaneous
Report 2001-4.2, 19-27
Campbell, J.E. 2002. Phelps Lake Project: Highlights of the Quaternary Investigations in the
Keseechewun Lake Area (NTS 64M-09, -10, -15, and-16). Summary of Investigations 2002,
Volume 2, Saskatchewan Geological Survey, Saskatchewan Energy and Mines, Miscellaneous
Report 2002-4.2, Paper A-2, 16p. (CD-ROM)
Campbell, J.E. 2003. Quaternary Investigations in the Paterson Island Area (parts of NTS 64E-
10 and -15), Reindeer Lake, Eastern Peter Lake Domain. Summary of Investigations 2003,
Volume 2, Saskatchewan Geological Survey, Saskatchewan Energy and Mines, Miscellaneous
Report 2003-4.2, Paper A-7, 16p. (CD-ROM)
Campbell, J.E. 2007. Quaternary Geology of the Eastern Athabasca Basin, Saskatchewan.
EXTECH IV: Geology and Uranium Exploration TECHnology of the Proterozoic Athabasca
Basin, Saskatchewan and Alberta, eds. C.W. Jefferson and G. Delaney; Geological Survey of
Canada, Bulletin 588, 211-228 (also Saskatchewan Geological Society, Special Publication
18, Geological Association of Canada, Mineral Deposits Division, Special Publication 4)
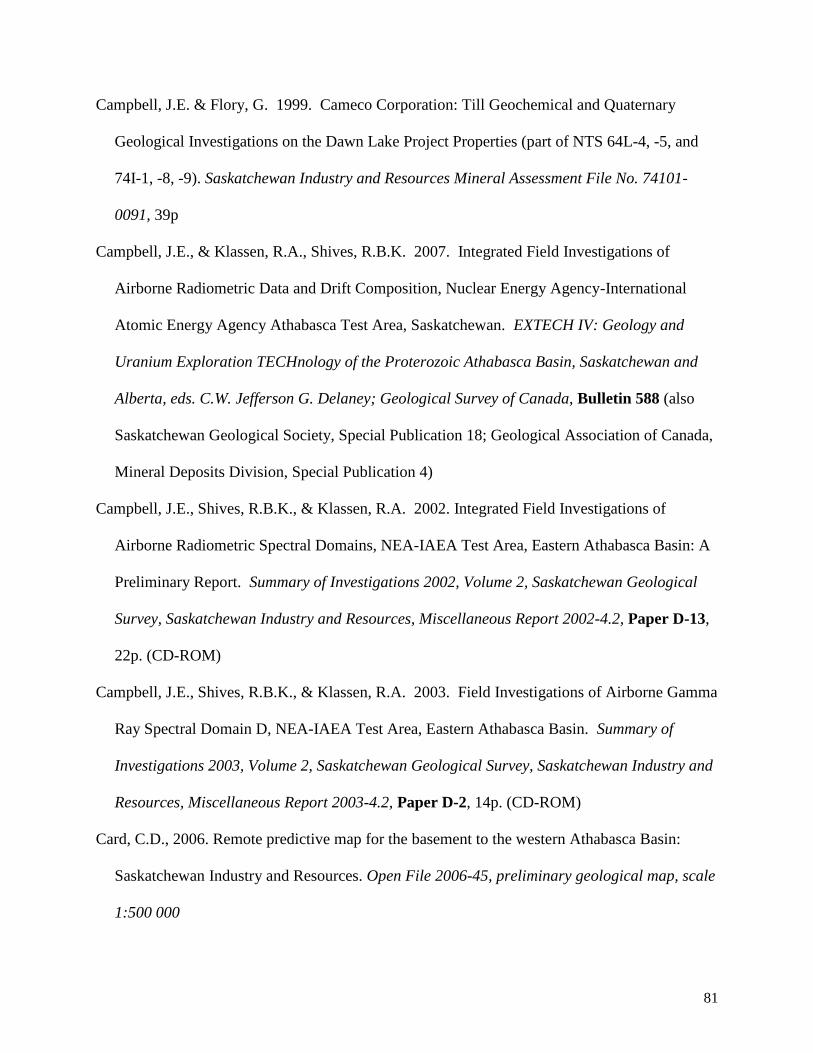
81
Campbell, J.E. & Flory, G. 1999. Cameco Corporation: Till Geochemical and Quaternary
Geological Investigations on the Dawn Lake Project Properties (part of NTS 64L-4, -5, and
74I-1, -8, -9). Saskatchewan Industry and Resources Mineral Assessment File No. 74101-
0091, 39p
Campbell, J.E., & Klassen, R.A., Shives, R.B.K. 2007. Integrated Field Investigations of
Airborne Radiometric Data and Drift Composition, Nuclear Energy Agency-International
Atomic Energy Agency Athabasca Test Area, Saskatchewan. EXTECH IV: Geology and
Uranium Exploration TECHnology of the Proterozoic Athabasca Basin, Saskatchewan and
Alberta, eds. C.W. Jefferson G. Delaney; Geological Survey of Canada, Bulletin 588 (also
Saskatchewan Geological Society, Special Publication 18; Geological Association of Canada,
Mineral Deposits Division, Special Publication 4)
Campbell, J.E., Shives, R.B.K., & Klassen, R.A. 2002. Integrated Field Investigations of
Airborne Radiometric Spectral Domains, NEA-IAEA Test Area, Eastern Athabasca Basin: A
Preliminary Report. Summary of Investigations 2002, Volume 2, Saskatchewan Geological
Survey, Saskatchewan Industry and Resources, Miscellaneous Report 2002-4.2, Paper D-13,
22p. (CD-ROM)
Campbell, J.E., Shives, R.B.K., & Klassen, R.A. 2003. Field Investigations of Airborne Gamma
Ray Spectral Domain D, NEA-IAEA Test Area, Eastern Athabasca Basin. Summary of
Investigations 2003, Volume 2, Saskatchewan Geological Survey, Saskatchewan Industry and
Resources, Miscellaneous Report 2003-4.2, Paper D-2, 14p. (CD-ROM)
Card, C.D., 2006. Remote predictive map for the basement to the western Athabasca Basin:
Saskatchewan Industry and Resources. Open File 2006-45, preliminary geological map, scale
1:500 000
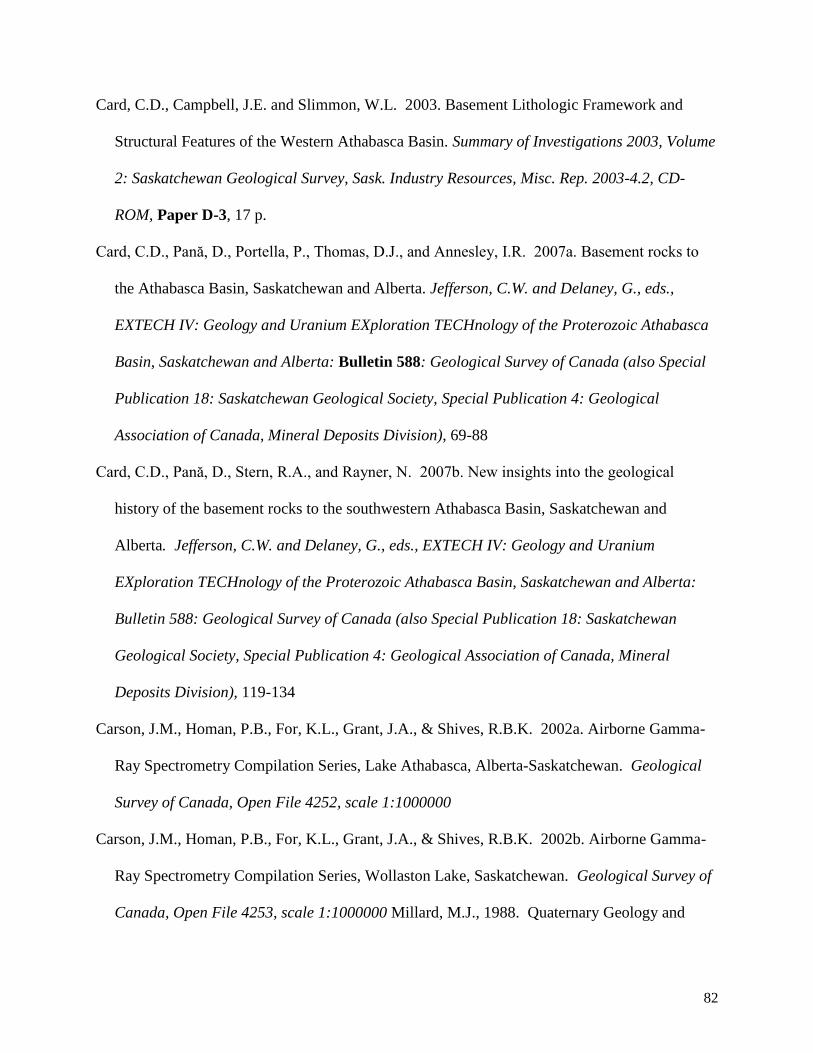
82
Card, C.D., Campbell, J.E. and Slimmon, W.L. 2003. Basement Lithologic Framework and
Structural Features of the Western Athabasca Basin. Summary of Investigations 2003, Volume
2: Saskatchewan Geological Survey, Sask. Industry Resources, Misc. Rep. 2003-4.2, CD-
ROM, Paper D-3, 17 p.
Card, C.D., Pană, D., Portella, P., Thomas, D.J., and Annesley, I.R. 2007a. Basement rocks to
the Athabasca Basin, Saskatchewan and Alberta. Jefferson, C.W. and Delaney, G., eds.,
EXTECH IV: Geology and Uranium EXploration TECHnology of the Proterozoic Athabasca
Basin, Saskatchewan and Alberta: Bulletin 588: Geological Survey of Canada (also Special
Publication 18: Saskatchewan Geological Society, Special Publication 4: Geological
Association of Canada, Mineral Deposits Division), 69-88
Card, C.D., Pană, D., Stern, R.A., and Rayner, N. 2007b. New insights into the geological
history of the basement rocks to the southwestern Athabasca Basin, Saskatchewan and
Alberta. Jefferson, C.W. and Delaney, G., eds., EXTECH IV: Geology and Uranium
EXploration TECHnology of the Proterozoic Athabasca Basin, Saskatchewan and Alberta:
Bulletin 588: Geological Survey of Canada (also Special Publication 18: Saskatchewan
Geological Society, Special Publication 4: Geological Association of Canada, Mineral
Deposits Division), 119-134
Carson, J.M., Homan, P.B., For, K.L., Grant, J.A., & Shives, R.B.K. 2002a. Airborne Gamma-
Ray Spectrometry Compilation Series, Lake Athabasca, Alberta-Saskatchewan. Geological
Survey of Canada, Open File 4252, scale 1:1000000
Carson, J.M., Homan, P.B., For, K.L., Grant, J.A., & Shives, R.B.K. 2002b. Airborne Gamma-
Ray Spectrometry Compilation Series, Wollaston Lake, Saskatchewan. Geological Survey of
Canada, Open File 4253, scale 1:1000000 Millard, M.J., 1988. Quaternary Geology and
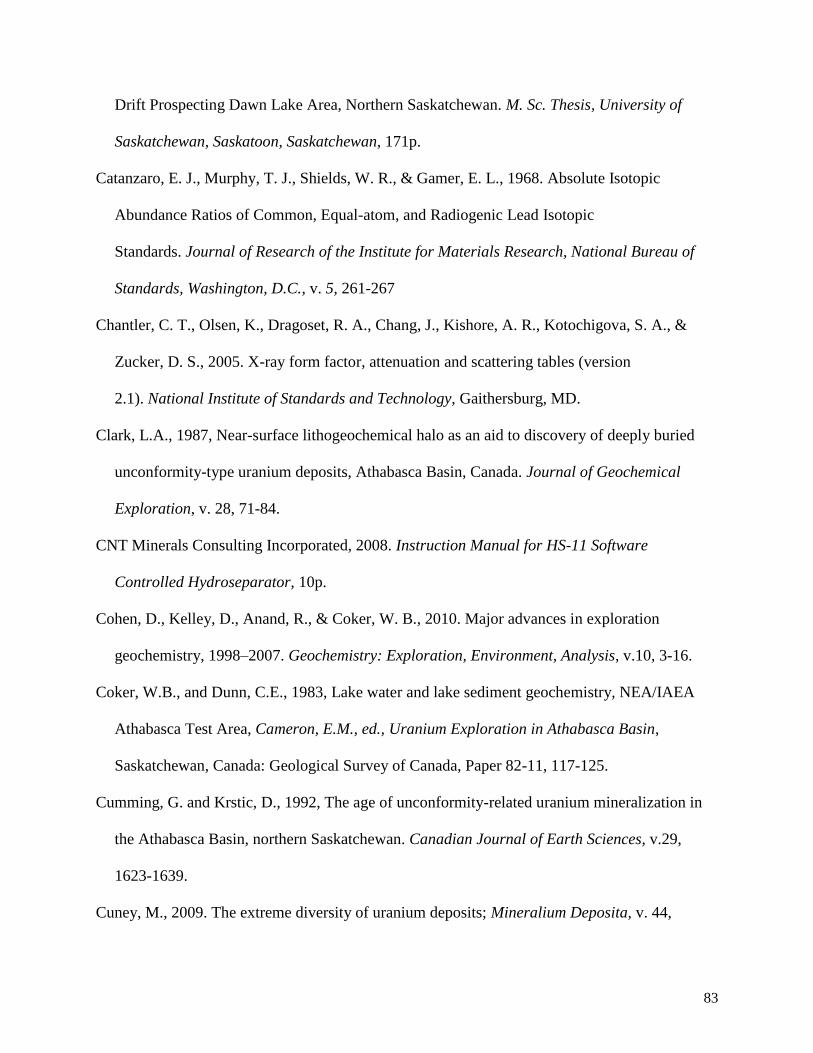
83
Drift Prospecting Dawn Lake Area, Northern Saskatchewan. M. Sc. Thesis, University of
Saskatchewan, Saskatoon, Saskatchewan, 171p.
Catanzaro, E. J., Murphy, T. J., Shields, W. R., & Gamer, E. L., 1968. Absolute Isotopic
Abundance Ratios of Common, Equal-atom, and Radiogenic Lead Isotopic
Standards. Journal of Research of the Institute for Materials Research, National Bureau of
Standards, Washington, D.C., v. 5, 261-267
Chantler, C. T., Olsen, K., Dragoset, R. A., Chang, J., Kishore, A. R., Kotochigova, S. A., &
Zucker, D. S., 2005. X-ray form factor, attenuation and scattering tables (version
2.1). National Institute of Standards and Technology, Gaithersburg, MD.
Clark, L.A., 1987, Near-surface lithogeochemical halo as an aid to discovery of deeply buried
unconformity-type uranium deposits, Athabasca Basin, Canada. Journal of Geochemical
Exploration, v. 28, 71-84.
CNT Minerals Consulting Incorporated, 2008. Instruction Manual for HS-11 Software
Controlled Hydroseparator, 10p.
Cohen, D., Kelley, D., Anand, R., & Coker, W. B., 2010. Major advances in exploration
geochemistry, 1998–2007. Geochemistry: Exploration, Environment, Analysis, v.10, 3-16.
Coker, W.B., and Dunn, C.E., 1983, Lake water and lake sediment geochemistry, NEA/IAEA
Athabasca Test Area, Cameron, E.M., ed., Uranium Exploration in Athabasca Basin,
Saskatchewan, Canada: Geological Survey of Canada, Paper 82-11, 117-125.
Cumming, G. and Krstic, D., 1992, The age of unconformity-related uranium mineralization in
the Athabasca Basin, northern Saskatchewan. Canadian Journal of Earth Sciences, v.29,
1623-1639.
Cuney, M., 2009. The extreme diversity of uranium deposits; Mineralium Deposita, v. 44,
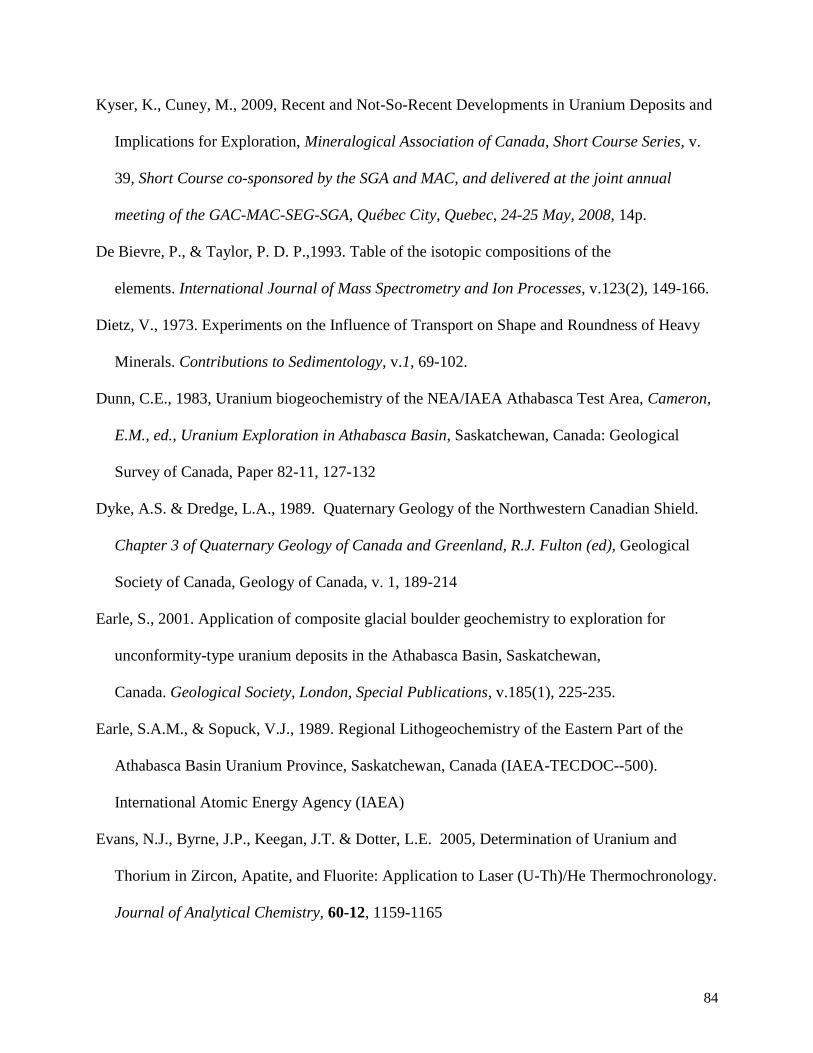
84
Kyser, K., Cuney, M., 2009, Recent and Not-So-Recent Developments in Uranium Deposits and
Implications for Exploration, Mineralogical Association of Canada, Short Course Series, v.
39, Short Course co-sponsored by the SGA and MAC, and delivered at the joint annual
meeting of the GAC-MAC-SEG-SGA, Québec City, Quebec, 24-25 May, 2008, 14p.
De Bievre, P., & Taylor, P. D. P.,1993. Table of the isotopic compositions of the
elements. International Journal of Mass Spectrometry and Ion Processes, v.123(2), 149-166.
Dietz, V., 1973. Experiments on the Influence of Transport on Shape and Roundness of Heavy
Minerals. Contributions to Sedimentology, v.1, 69-102.
Dunn, C.E., 1983, Uranium biogeochemistry of the NEA/IAEA Athabasca Test Area, Cameron,
E.M., ed., Uranium Exploration in Athabasca Basin, Saskatchewan, Canada: Geological
Survey of Canada, Paper 82-11, 127-132
Dyke, A.S. & Dredge, L.A., 1989. Quaternary Geology of the Northwestern Canadian Shield.
Chapter 3 of Quaternary Geology of Canada and Greenland, R.J. Fulton (ed), Geological
Society of Canada, Geology of Canada, v. 1, 189-214
Earle, S., 2001. Application of composite glacial boulder geochemistry to exploration for
unconformity-type uranium deposits in the Athabasca Basin, Saskatchewan,
Canada. Geological Society, London, Special Publications, v.185(1), 225-235.
Earle, S.A.M., & Sopuck, V.J., 1989. Regional Lithogeochemistry of the Eastern Part of the
Athabasca Basin Uranium Province, Saskatchewan, Canada (IAEA-TECDOC--500).
International Atomic Energy Agency (IAEA)
Evans, N.J., Byrne, J.P., Keegan, J.T. & Dotter, L.E. 2005, Determination of Uranium and
Thorium in Zircon, Apatite, and Fluorite: Application to Laser (U-Th)/He Thermochronology.
Journal of Analytical Chemistry, 60-12, 1159-1165
85
Ewing, R.C., Haaker, R.F., & Lutze, W. 1982. Leachability of zircon as a function of alpha
dose. Scientific Basis for Radioactive Waste Management, 5, 389– 397.
Fandrich, R., Gu, Y., Burrows, D., & Moeller, K., 2007. Modern SEM-based mineral liberation
analysis. International Journal of Mineral Processing, v.84, 310-320.
Fayek, M. and Kyser, K.K. 1997. Characterization of multiple fluid events and rare-earth-
element mobility associated with formation of unconformity-type uranium deposits in the
Athabasca Basin, Saskatchewan. The Canadian Mineralogist, 35, 627-658.
Freise, F.W., 1931, Untersuchung von Mineralen auf Abnutzbarkeit bei Verfrachtung im Wasser.
Tschermaks Mineral. Petrogr. Mitt., v.41, 1–7.
Gandhi, S., 2007, Significant Unconformity Associated Uranium Deposits of the Athabasca
Basin, Saskatchewan and Alberta, and Selected Related Deposits of Canada and the World:
Geological Survey of Canada, Open File 5005, Saskatchewan Industry and Resources, Open
File 2007- 11, CD-ROM
Gibbard, P. L., 1985. The Pleistocene History of the Middle Thames Valley. Cambridge
University Press. 168p.
Gu, Y. (2003). Automated scanning electron microscope based mineral liberation analysis an
introduction to JKMRC/FEI mineral liberation analyzer. Journal of Minerals and Materials
Characterization and Engineering, v.2, 33-41
Hanchar, J. M., & Van Westrenen, W., 2007. Rare Earth Element Behavior in Zircon-melt
Systems. Elements, v.3(1), 37-42.
Hanchar, J. M., Finch, R. J., Hoskin, P. W., Watson, E. B., Cherniak, D. J., & Mariano, A. N.,
2001. Rare earth elements in synthetic zircon: Part 1. Synthesis, and rare earth element and
phosphorus doping. American Mineralogist, v.86(5-6), 667-680.
86
Hawkes, H. E., & Webb, J. S. (1962). Geochemistry in Mineral Exploration, Harper’s
Geoscience Series. New York, 355p.
Hecht, L., and Cuney, M., 2000, Hydrothermal alteration of monazite in the Precambrian
crystalline basement of the Athabasca Basin (Saskatchewan, Canada): Implications for the
formation of unconformity-related uranium deposits: Mineralium Deposita, v.35, 791–795.
Hiatt, E. and Kyser, T., 2007, Sequence stratigraphy, hydrostratigraphy, and mineralizing fluid
flow, in the Proterozoic Manitou Falls Formation, eastern Athabasca Basin, Saskatchewan,
Jefferson, C.W., and Delaney, G., eds., EXTECH IV: Geology and Uranium Exploration
TECHNology of the Proterozoic Athabasca basin, Saskatchewan and Alberta, Geological
Survey of Canada Bulletin 588, Saskatchewan Geological Society Special Publication 18,
Mineral Deposit Division (GAC) Special Publication 4, 489-506.
Hoeve, J. and Quirt, D.H. 1984. Mineralization and host rock alteration in relation to clay
mineral diagenesis and evolution of the Middle Proterozoic, Athabasca Basin, northern
Saskatchewan, Canada. Saskatchewan Research Council. SRC Technical Report, 187, 187p.
Hoeve, J. and Sibbald, T. 1978. On the genesis of Rabbit Lake and other unconformity-type
uranium deposits in northern Saskatchewan, Canada. Economic Geology, 73, 1450-1473.
Hoffman, P.F. 1988. United Plates of America: The Birth of a Craton: Early Proterozoic
Assembly and Growth of Laurentia. Annual Review of Earth Science 1988, 16, 543-603
Holk G.J., Kyser T.K., Chipley D.; Hiatt E.E., and Marlatt J. 2003. Mobile Pb-isotopes in
Proterozoic sedimentary basins as guides for exploration of uranium deposits. Journal of
Geochemical Exploration: Elsevier, 80(2), 297-320
Jaffe, H.W., 1951. The role of Yttrium and Other Minor Elements in the Garnet Group.
American Mineralogy. v.36, 133-155
87
Jaffey, A.H., Flynn, K.F., Glendin, L.E., Bentley, W.C., and Essling, A.M., 1971. Precision
Measurement of Half-lives and Specific Activities of 235U and 238U. Physical Review C. v.4-5,
1881-1906
Jefferson, C.W., Thomas, D., Quirt, D., Mwenifumbo, C.J., and Brisbin, D. 2007. Empirical
Models for Canadian Unconformity Associated Uranium Deposits. Proceedings of
Exploration 07: Fifth Decennial International Conference on Mineral Exploration, 741-769
Jiricka, D. E., & Witt, G., 2008. The Centennial deposit—an atypical unconformity-associated
uranium deposit. Calgary, Mining Forum, April, 2008
Jiricka, D., Witt, G., Wright, D., Hilchey, A. 2006. Virgin River Project 2005 Annual
Exploration Report, Mineral Claim CBS-7794, NTS 74G/11 and 74G/12, 104 p.
Jiricka, D., Witt, G., Wright, D., Hilchey, A. 2005, MacFarlane Lake Project Annual Exploration
Report: Unpublished internal Cameco report, 29p.
Jiricka, D., Witt, G., Wright, D., Hilchey, A. 2006, Virgin River Project Annual Exploration
Report: Unpublished internal Cameco report, 104p.
Kister, P., Laverret, E., Quirt, D., Cuney, M., Mas, P.P., Beaufort, D. and Bruneton, P., 2006,
Mineralogy and geochemistry of the host-rock alterations associated with the Shea Creek
unconformity-type uranium deposits (Athabasca Basin, Saskatchewan, Canada). Part 2.
Regional-scale spatial distribution of the Athabasca group sandstone matrix minerals. Clays
and Clay Minerals, v. 54, 295-313.
Klien, C., Dutrow, B., & Dana, J. D. (2008). The 23rd ed. of the Manual of Mineral Science.
John Wiley and Sons
88
Kotzer, T.G., and Kyser, T.K., 1995, Petrogenesis of the Proterozoic Athabasca Basin, Northern
Saskatchewan, Canada, and its Relation to Diagenesis, Hydrothermal Uranium mineralization
and Paleohydrogeology. Chemical Geology, v.120, 45–89
Kyser T.K., Hiatt E., Renac C., Durocher K., Holk G., Deckart K., 2000 Diagenetic fluids in
paleo-and meso-proterozoic sedimentary basins and their implications for long protracted
fluid histories. Kyser, K (ed) Fluids and basin evolution. Mineralogical association of Canada
Short Course Series, Calgary, v.128, 225–26
Kyser, K., Lahusen, L., Drever, G., Dunn, C., Leduc, E., & Chipley, D., 2015. Using Pb Isotopes
in Surface Media to Distinguish Anthropogenic Sources from Undercover Uranium
Sources. Comptes Rendus Geoscience, v.347(5), 215-226.
Lewry, J.F. and Sibbald, T.I., 1980. Thermotectonic evolution of the Churchill Province in
northern Saskatchewan, Tectonophysics, v. 68, p. 45-82.
Ludwig, K. R., 2011. Isoplot/Ex, Version 4.15: A Geochronological Toolkit for Microsoft Excel:
Geochronology Center Berkeley, v. 4.
Marlatt, J., Kyser. K., 2011. Paradigmatic shifts in the uranium exploration process: knowledge
brokers and the Athabasca Basin learning curve. Society of Economic Geologists Newsletter
v.84 17-23. Kelley, D.L., Kelley, K.D., Coker, W.B., Caughlin, B. and Doherty, M.E., 2006.
Beyond the Obvious Limits of Ore Deposits: the Use of Mineralogical, Geochemical, and
Biological Features for the Remote Detection of Mineralization: Economic Geology, v.101,
729-752.
Marlatt, J., McGill, B., Matthews, R., Sopuck, V., & Pollock, G., 1992. The discovery of the
McArthur River uranium deposit, Saskatchewan, Canada (IAEA-TECDOC--650).
International Atomic Energy Agency (IAEA)
89
Meagher, E.P., 1982. Silicates Garnets. Orthosilicates (P.H. Ribbe, ed.). Reviews in Mineralogy
v.5, 25-66
Mercadier, J., Cuney, M., Lach, P., Boiron, M., Bonhoure, J., Richard, A., Leisen, M., Kister, P.,
2011. Origin of uranium deposits revealed by their rare earth element signature. Terra Nova,
v.23, No. 4, 264-269
Mercadier, J., Cuney, M., Cathelineau, M., Lacorde, M., 2011. U redox fronts and kaolinitisation
in basement-hosted unconformity-related U ores of the Athabasca Basin (Canada): late U
remobilization by meteoric fluids. Miner Deposita, v.46, 105-135
Mermillod-Blondin, R., Benzaazoua, M., Kongolo, M., de Donato, P., Bussière, B., Marion, P.,
2011. Development and Calibration of a Quantitative, Automated Mineralogical Assessment
Method Based on SEM-EDS and Image Analysis: Application for Fine Tailings. Journal of
Minerals & Materials Characterization & Engineering, v.10(12), 1111–1130.
Millard, M.J. (1988): Quaternary Geology and Drift Prospecting Dawn Lake Area, Northern
Saskatchewan; unpublished M.Sc. thesis, Univ. Saskatchewan, 171p.
National Institute of Standards & Technology, 1992a. Certificate of Analysis for Standard
Reference Materials 610, Trace Elements in a Glass Matrix (3mm Wafer), 611, Trace
Elements in a Glass Matrix (1mm Wafer) (Nominal Trace Element Concentration 500 mg/kg
(ppm)), Gaithersburg, MD
National Institute of Standards & Technology, 1992b. Certificate of Analysis for Standard
Reference Materials 612, Trace Elements in a Glass Matrix (3mm Wafer), 613, Trace
Elements in a Glass Matrix (1mm Wafer) (Nominal Trace Element Concentration 50 mg/kg
(ppm)), Gaithersburg, MD
90
Nickel, E., 1973. Experimental Dissolution of Light and Heavy Minerals in Comparison with
Weathering and Intrastratal Solution. Contributions to Sedimentology, v.1, 1-68.
Niskavaara, H.; Reimann, C.; Chekushin, V.; Kashulina, G., 1997. Seasonal Variability of Total
and Easily Leachable Element Contents in Topsoils (0-5 cm) from Eight Catchments in the
European Arctic (Finland, Norway and Russia). Environmental Pollution. v.96, 261-274.
Odom, E. 1975. Feldspar-grain size relations in Cambrian Arenites, Upper Mississippi Valley.
Journal of Sedimentary Petrology, 45- 3, 636--650.
Odom, E., Doe, T.W., Dott, R.H. Jr. 1976. Nature of Feldspar-Grain Size Relations in Some
Quartz-Rich Sandstones. Journal of Sedimentary Petrology, 46-4, 862-970
Organization for Economic Co-operation and Development, the International Atomic Energy
Association, and the Nuclear Energy Agency, 2012, Uranium 2011: Resources, Production,
and Demand, Annual Report, 489p.
p. 3–9.
Pagel, M., Poty, B. and Sheppard, S.M.F., 1980. Contributions to some Saskatchewan uranium
deposits mainly from fluid inclusion and isotopic data. Ferguson, S. and Goleby, A., eds.,
Uranium in the Pine Creek Geosyncline: IAEA, Vienna, 639-654.
Poppe, L. J., Paskevich, V. F., Hathaway, J. C., & Blackwood, D. S., 2001. A laboratory manual
for X-ray powder diffraction. US Geological Survey Open-File Report, v.1(041), 1-88.
Portella, P. and Annesley, I.R. 2000. Paleoproterozoic tectonic evolution of the eastern sub-
Athabasca basement, northern Saskatchewan: Integrated magnetic, gravity, and geological
data, extended abstract. GeoCanada: The Millennium Geoscience Summit: Joint meeting of
the Canadian Geophysical Union, Canadian Society of Exploration Geophysicists, Canadian
Society of Petroleum Geologists, Canadian Well Logging Society, Geological Association of
91
Canada, and the Mineralogical Association of Canada, May 29-June 2, 2000, Calgary,
Alberta, Canada (also known as GAC-MAC Program with Abstracts, v. 25), 647.PDF, 4 p.
Ramaekers, P. 1990. Geology of the Athabasca Group (Helikian) in northern Saskatchewan.
Saskatchewan Energy and Mines. Saskatchewan Geological Survey Report 195, 49 p.
Ramaekers, P., 2004, Development, Stratigraphy and Summary Diagenetic History of the
Athabasca Basin, Early Proterozoic of Alberta and its relation to Uranium Potential. Alberta
Geological Survey, Alberta Energy and Utilities Board, Special Report 62, 85 p.
Ramaekers, P., Jefferson, C.W., Yeo, G.M., Collier, B., Long, D.G.F., Drever, G., McHardy, S.,
Jiricka, D., Cutts, C., Wheatley, K., Catuneanu, O., Bernier, S., Kupsch, B., and Post, R.
2007. Revised geological map and stratigraphy of the Athabasca Group, Saskatchewan and
Alberta. Jefferson, C.W. and Delaney, G., eds., EXTECH IV: Geology and Uranium
EXploration TECHnology of the Proterozoic Athabasca Basin, Saskatchewan and Alberta:
Bulletin 588: Geological Survey of Canada (also Special Publication 18: Saskatchewan
Geological Society, Special Publication 4: Geological Association of Canada, Mineral
Deposits Division), 155-192.
Reed, J.B., 1990. Microbeam Analysis, San Francisco Press, San Francisco, 109p.
Reid, K.D., Ansdell, K., Jiricka, D., Witt, G., Card, C. 2014. Regional Setting, Geology, and
Paragenesis of the Centennial Unconformity-Related Uranium Deposit, Athabasca Basin,
Saskatchewan, Canada. Economic Geology, 109, 539-566
Rose, A.W., Hawkes, H.E. and Webb, J.S., 1979, Geochemistry in Mineral Exploration:
Academic Press, London, 657 p.
Rubey, W. W., 1933. Settling Velocity of Gravel, Sand, and Silt Particles. American Journal of
Science, v.148, 325-338.
92
Rudashevsky, N. S., Garuti, G., Andersen, J. Ø., Kretser, Y. L., Rudashevsky, V. N., &
Zaccarini, F., 2002. Separation of accessory minerals from rocks and ores by hydroseparation
(HS) technology: method and application to CHR-2 chromitite, Niquelândia intrusion,
Brazil. Applied Earth Science: Transactions of the Institutions of Mining and Metallurgy:
Section B, v.111(1), 87-94.
Schreiner, B.T. 1983. Quaternary Geology of the NEA/IAEA Athabasca Test Area. Uranium
Exploration in the Athabasca Basin, Saskatchewan, Canada, ed. E.M. Cameron; Geological
Survey of Canada, Paper 82-11, 27-32
Schreiner, B.T. 1984a. Quaternary Geology of the Precambrian Shield, Saskatchewan.
Saskatchewan Energy and Mines Report 221, 106p., 1 map, scale 1:1000000
Schreiner, B.T. 1984b. Quaternary Geology of the Stony Rapids Area (NTS 74P),
Saskatchewan. Saskatchewan Energy and Mines, Open File Report 84-19, scale 1:250000
Schreiner, B.T. 1984c. Quaternary Geology of the Wollaston Lake Area (NTS64L),
Saskatchewan. Saskatchewan Energy and Mines, Open File Report 84-14, Scale 1:250000
Schreiner, B.T. 1984d. Quaternary Geology of the Pasfield Lake Area (NTS 74I),
Saskatchewan. Saskatchewan Energy and Mines, Open File Report 84-15, Scale 1:250000
Schreiner, B.T. 1984e. Quaternary Geology of the Cree Lake Area (NTS 74G), Saskatchewan.
Saskatchewan Energy and Mines, Open File Report 84-12, scale 1:250000
Schreiner, B.T. 1984f. Quaternary Geology of the Geikie River Area (NTS 74H),
Saskatchewan. Saskatchewan Energy and Mines, Open File Report 84-11, scale 1:250000
Schreiner, B.T. 1984g. Quaternary Geology of the Livingstone Lake Area (NTS 74J),
Saskatchewan. Saskatchewan Energy and Mines, Open File Report 84-16, scale 1:250000
93
Severin, K. P., 2004. Energy dispersive spectrometry of common rock forming minerals. Kluwer
Academic, Berlin, Germany
Sibbald T. I. I. & Quirt D., 1987. Uranium deposits of the Athabasca Basin. Geol. Assoc. Can.,
Annual Meeting, Saskatoon, 1987. Field trip guidebook. Trip 9: Saskatchewan Research
Council Publication R-855-1-G-87.
Sibbald, T.I.I., 1985. Geology and genesis of the Athabasca Basin uranium deposits. Summary
of Investigations 1985: Saskatchewan Geological Survey, Saskatchewan Energy and Mines,
Miscellaneous Report 84-4, 133-156.
Smith, K.S. & Hyuck, H.L.O. 1999. An overview of the abundance, relative mobility,
bioavailabilty, and human toxicity of metals. G.S. Plumlee, J.J. Logsdon (Eds.), The
Environmental Geochemistry of Mineral Deposits: Part A. Processes, Techniques, and Health
Issues, Reviews in Economic Geology., 6A, 29–70
Sopuck, V.J., de Carle, E.M., and Cooper, B., 1983, The application of lithogeochemistry in the
search for unconformity-type uranium deposits, northern Saskatchewan, Canada, in Parslow,
G.R., ed., Geochemical Exploration 1982: Journal of Geochemical Exploration, Special Issue
19, p. 77-99.
Speer, J.A., 1982. Zircon, In Orthosilicates (P.H. Ribbe, ed.). Reviews in Mineralogy. v.5, 67-
112
Taylor, S. R., & McLennan, S. M., 1985. The continental crust: its composition and evolution.
Blackwell, Oxford. 312p.
Thiel, G. A. (1945, January). Mechanical effects of stream transportation of mineral grains of
sand size. In Geological Society of America Bulletin, v.56(12), 1207p.
94
Thomas, D.J., Jefferson, C.W., Yeo, G.M, Card, C., and. Sopuck, V.J., 2002. I. Introduction.
Andrade, N., Breton, G., Jefferson, C.W., Thomas, D.J., Tourigny, G., Wilson, S., and Yeo,
G.M., eds., Field Trip A1, The Eastern Athabasca Basin and its Uranium Deposits:
Geological Association of Canada – Mineralogical Association of Canada, Annual Meeting,
Field Trip Guidebook A1, 1-22.
Tole, M.P. 1984, The Kinetics of Dissolution of Zircon (ZrSiO4). Geochemica et Cosmochimica
Acta, 49, 453-458
Uravan, 2013, Centennial Surface Geochemical Orientation Study. Partners: Cameco,
Environmetnal BioTechnologies, Inc, and Queen’s Facility for Isotope Research. 61p.
Wakita, H., Shibao, K. & Nagashima, K., 1969. Yttrian Spessartine from Suishoyama
Fukushima Prefecture, Japan. American Mineralogy. v.54, 1,678 -1683.
Whitehouse, M. J., & Platt, J. P., 2003. Dating high-grade metamorphism—constraints from
rare-earth elements in zircon and garnet. Contributions to Mineralogy and Petrology.
v.145(1), 61-74.
Wiedenbeck, M., Allé, P., Corfu, F., Griffin, W.L., Meier, M., Oberli, F., Quadt, A.V., Roddick,
J.C. & Spiegel, W. 1995. Three Natural Zircon Standards for U-Th-Pb, Lu-Hf, Trace Element
and REE Analyses. Geostandards Newsletter, 19, 1-23
Wiedenbeck, M., Hanchar, J.M., Peck, W.H., Sylvester, P., Valley, J., Whitehouse, M., Kronz,
A., Morishita, Y., Nasdala, L., Fiebig, J., Franchi, I., Girard, J.P., Greenwood, R.C., Hinton,
R., Kita, N., Mason, P.R.D., Norman, M., Ogasawara, M., Piccoli, P.M., Rhede, D., Satoh, H.,
Shulz-Dobrick, B., Skår, Ø., Spicuzza, M.J., Terada, K., Tindle, A., Togashi, S., Vennemann,
T., Xie, Q., & Zheng, Y.F., 2005. Further Characterization of the Zircon 91500 Crystal.
Geostandards and Geoanalytical Research, v.28, 9-39
95
Woodhead, J.D. & Hergt, J.M., 2001. Strontium, Neodymium and Lead Isotope Analyses of
NIST Glass Certified References Materials: SRM 610, 612, 614. Geostandards Newsletter,
Geostandards and Geoanalytical Research, v. 25, 261-266
Woodward, J.C., Lewin, J. and MacKlin, M.G., 1992. Alluvial sediment sources in a glaciated
catchment: the Voidomatis basin, northwest Greece. Earth Surface Processes and
Landforms v. 17-3, 205-216.
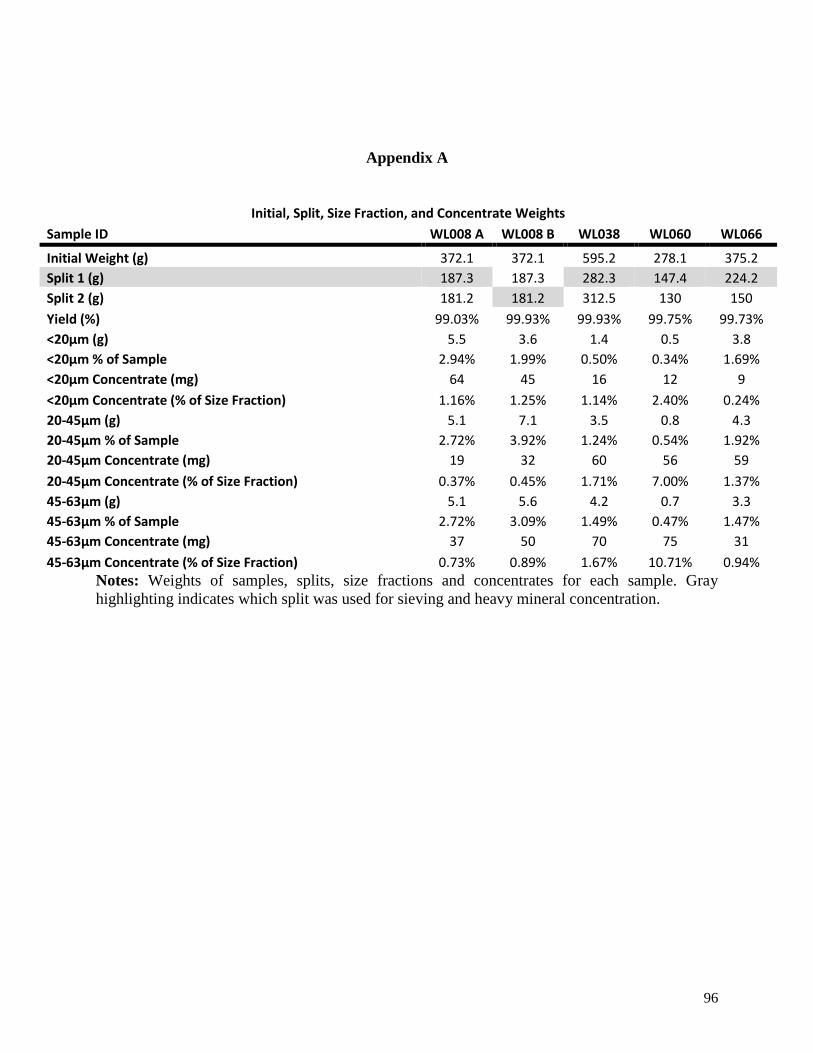
96
Appendix A
Initial, Split, Size Fraction, and Concentrate Weights
Sample ID WL008 A WL008 B WL038 WL060 WL066
Initial Weight (g) 372.1 372.1 595.2 278.1 375.2
Split 1 (g) 187.3 187.3 282.3 147.4 224.2
Split 2 (g) 181.2 181.2 312.5 130 150
Yield (%) 99.03% 99.93% 99.93% 99.75% 99.73%
<20µm (g) 5.5 3.6 1.4 0.5 3.8
<20µm % of Sample 2.94% 1.99% 0.50% 0.34% 1.69%
<20µm Concentrate (mg) 64 45 16 12 9
<20µm Concentrate (% of Size Fraction) 1.16% 1.25% 1.14% 2.40% 0.24%
20-45µm (g) 5.1 7.1 3.5 0.8 4.3
20-45µm % of Sample 2.72% 3.92% 1.24% 0.54% 1.92%
20-45µm Concentrate (mg) 19 32 60 56 59
20-45µm Concentrate (% of Size Fraction) 0.37% 0.45% 1.71% 7.00% 1.37%
45-63µm (g) 5.1 5.6 4.2 0.7 3.3
45-63µm % of Sample 2.72% 3.09% 1.49% 0.47% 1.47%
45-63µm Concentrate (mg) 37 50 70 75 31
45-63µm Concentrate (% of Size Fraction) 0.73% 0.89% 1.67% 10.71% 0.94%
Notes: Weights of samples, splits, size fractions and concentrates for each sample. Gray
highlighting indicates which split was used for sieving and heavy mineral concentration.
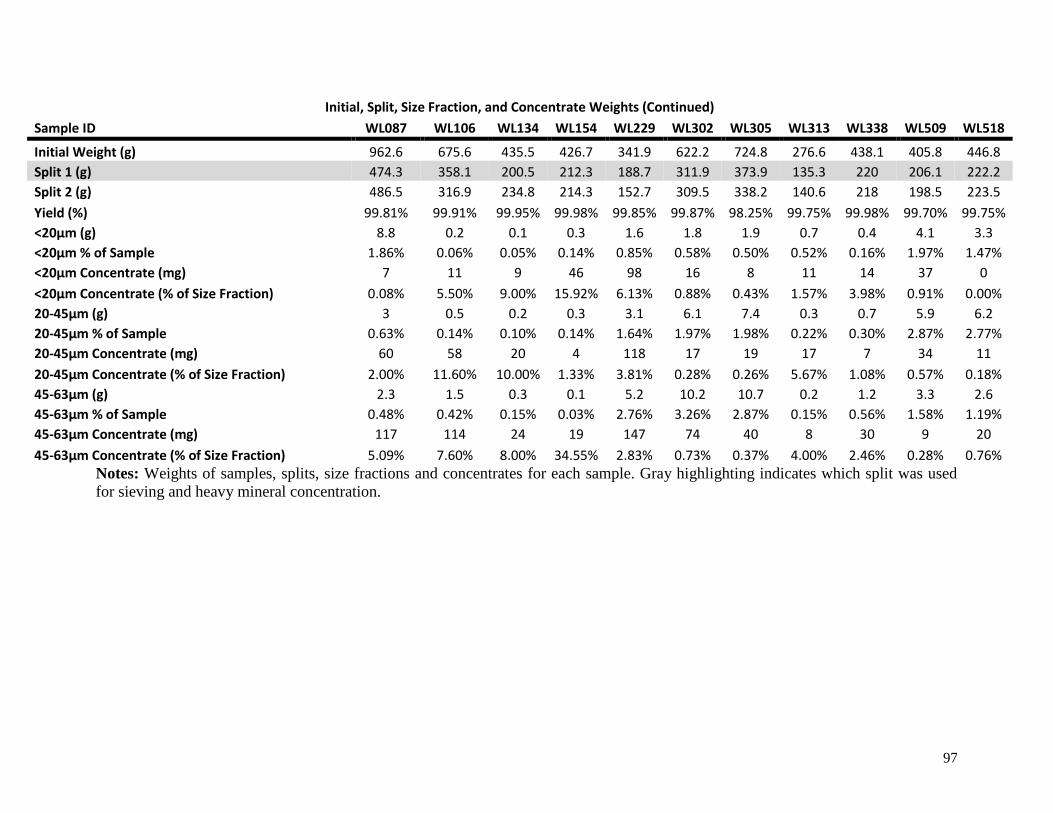
97
Initial, Split, Size Fraction, and Concentrate Weights (Continued)
Sample ID WL087 WL106 WL134 WL154 WL229 WL302 WL305 WL313 WL338 WL509 WL518
Initial Weight (g) 962.6 675.6 435.5 426.7 341.9 622.2 724.8 276.6 438.1 405.8 446.8
Split 1 (g) 474.3 358.1 200.5 212.3 188.7 311.9 373.9 135.3 220 206.1 222.2
Split 2 (g) 486.5 316.9 234.8 214.3 152.7 309.5 338.2 140.6 218 198.5 223.5
Yield (%) 99.81% 99.91% 99.95% 99.98% 99.85% 99.87% 98.25% 99.75% 99.98% 99.70% 99.75%
<20µm (g) 8.8 0.2 0.1 0.3 1.6 1.8 1.9 0.7 0.4 4.1 3.3
<20µm % of Sample 1.86% 0.06% 0.05% 0.14% 0.85% 0.58% 0.50% 0.52% 0.16% 1.97% 1.47%
<20µm Concentrate (mg) 7 11 9 46 98 16 8 11 14 37 0
<20µm Concentrate (% of Size Fraction) 0.08% 5.50% 9.00% 15.92% 6.13% 0.88% 0.43% 1.57% 3.98% 0.91% 0.00%
20-45µm (g) 3 0.5 0.2 0.3 3.1 6.1 7.4 0.3 0.7 5.9 6.2
20-45µm % of Sample 0.63% 0.14% 0.10% 0.14% 1.64% 1.97% 1.98% 0.22% 0.30% 2.87% 2.77%
20-45µm Concentrate (mg) 60 58 20 4 118 17 19 17 7 34 11
20-45µm Concentrate (% of Size Fraction) 2.00% 11.60% 10.00% 1.33% 3.81% 0.28% 0.26% 5.67% 1.08% 0.57% 0.18%
45-63µm (g) 2.3 1.5 0.3 0.1 5.2 10.2 10.7 0.2 1.2 3.3 2.6
45-63µm % of Sample 0.48% 0.42% 0.15% 0.03% 2.76% 3.26% 2.87% 0.15% 0.56% 1.58% 1.19%
45-63µm Concentrate (mg) 117 114 24 19 147 74 40 8 30 9 20
45-63µm Concentrate (% of Size Fraction) 5.09% 7.60% 8.00% 34.55% 2.83% 0.73% 0.37% 4.00% 2.46% 0.28% 0.76%
Notes: Weights of samples, splits, size fractions and concentrates for each sample. Gray highlighting indicates which split was used
for sieving and heavy mineral concentration.
98
Appendix B
Microriffle Splitting and Mono-layer Grain Mounting
A Quantachrome Rotary Micro-Riffler was used to make subsamples into small enough
aliquots (10-20 mg) to mount in epoxy. The microriffler splits individual grain or powder
samples into 8 subsamples. A representative subsample of the desired weight was achieved by
repetitive division of the 8 collected subsamples. One aliquot was collected for each size fraction
of heavy mineral concentrates because the whole concentrate, which is representative of the
heavy mineral content of the sample, was a small fraction (e.g. <1%) of the unprocessed sample
weight.
Simply adding subsamples to epoxy before curing may result in dense minerals settling to
the bottom of the epoxy mold and being overrepresented (Mermollid-Blondin, 2007). By
creating a monolayer of grains directly against a flat surface, there is no room for density
separation. Double sided tape was placed on polished epoxy caps and 10-20 mg subsamples of
grains mixed with 5-10 mg (ca. half the weight of the subsample) of micronized graphite powder
were spread on to the tape using a small plastic spatula. Graphite reduces grain clumping and
poor separation during MLA (Blaskovich, 2013). EpoxyCure 2 epoxy (Buehler Scientific,
Canada) was poured into the epoxy molds and placed in a vacuum chamber for about 5 minutes
to allow any bubbles to float to the top of the epoxy. Following the vacuum chamber, the grain
mounts set for at least 24 hours until fully cured. Mounts were then carefully polished with 1µm
diamond compound and carbon coated in preparation for MLA. Care was taken during the
polishing process to minimize grain loss.
To test the efficiency of the micro-riffler subsampling and mon-layer grain mounting
methods, 8 subsamples of 10-20 mg were from each size fraction (<20 μm, 20-45 μm, 45-63 μm)
99
were analyzed using MLA and the relative standard deviation (standard deviation of mineral
abundances divide by the mean) of each mineral abundance was calculated. The relative standard
deviations (RSD) were below 30% in all of the minerals except those that had average mineral
abundances below 0.10 wt%. This is reasonable because only 3 or 4 grains out of thousands
could change the mineral abundance by more than 30% of the average. The mineral category
“aluminosilicates” also had high RSDs because one clump of clay could change the abundance
by more than to 2 wt%. Aluminosilicates were labeled as mica by MLA in some of the
subsamples of the <20 µm fraction because of the similar chemistries of mica and clay minerals
so this also had a high RSD.
Once this subsampling method was developed, two subsamples of each size fraction were
made for mono-layer epoxy grain mounting and the average mineral abundances of these two
subsamples were used for the final mineral abundances of all the samples. Two subsamples of
unprocessed (non-hydroseparated) samples were analyzed for each size fraction so that an
average mineral abundance between the two would be more representative of the entire sample
than just one.
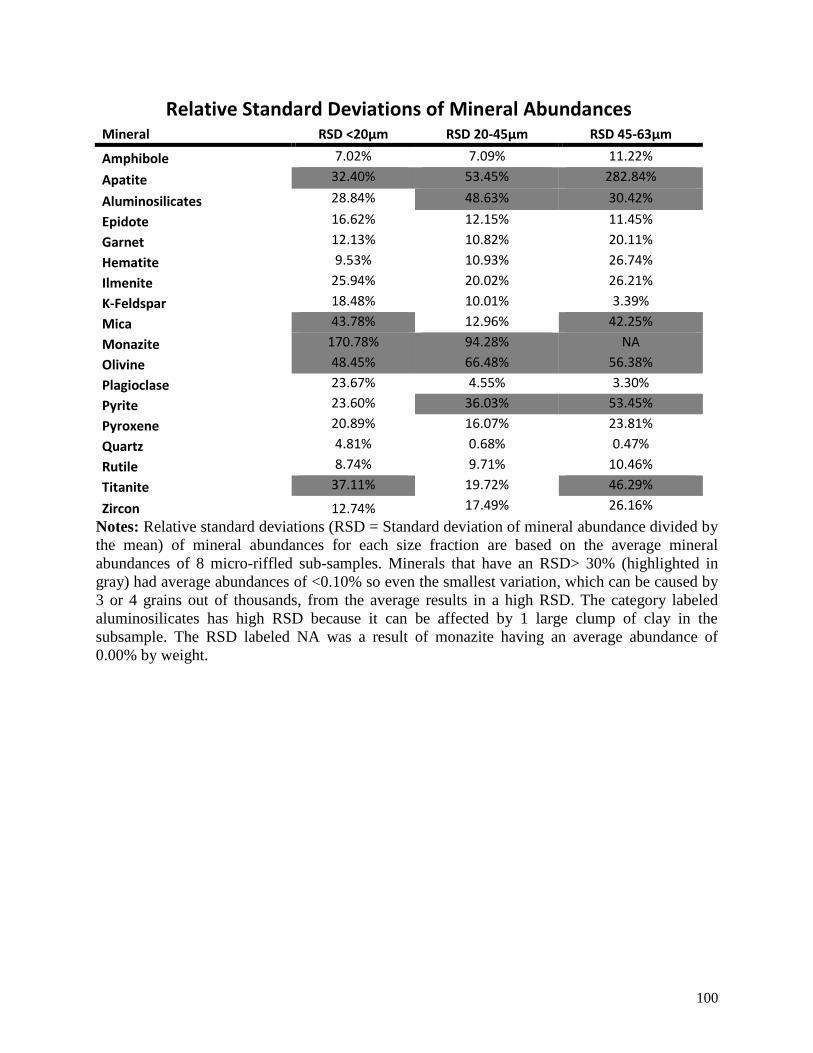
100
Relative Standard Deviations of Mineral Abundances Mineral RSD <20µm RSD 20-45µm RSD 45-63µm
Amphibole 7.02% 7.09% 11.22%
Apatite 32.40% 53.45% 282.84%
Aluminosilicates 28.84% 48.63% 30.42%
Epidote 16.62% 12.15% 11.45%
Garnet 12.13% 10.82% 20.11%
Hematite 9.53% 10.93% 26.74%
Ilmenite 25.94% 20.02% 26.21%
K-Feldspar 18.48% 10.01% 3.39%
Mica 43.78% 12.96% 42.25%
Monazite 170.78% 94.28% NA
Olivine 48.45% 66.48% 56.38%
Plagioclase 23.67% 4.55% 3.30%
Pyrite 23.60% 36.03% 53.45%
Pyroxene 20.89% 16.07% 23.81%
Quartz 4.81% 0.68% 0.47%
Rutile 8.74% 9.71% 10.46%
Titanite 37.11% 19.72% 46.29%
Zircon 12.74% 17.49% 26.16%
Notes: Relative standard deviations (RSD = Standard deviation of mineral abundance divided by
the mean) of mineral abundances for each size fraction are based on the average mineral
abundances of 8 micro-riffled sub-samples. Minerals that have an RSD> 30% (highlighted in
gray) had average abundances of <0.10% so even the smallest variation, which can be caused by
3 or 4 grains out of thousands, from the average results in a high RSD. The category labeled
aluminosilicates has high RSD because it can be affected by 1 large clump of clay in the
subsample. The RSD labeled NA was a result of monazite having an average abundance of
0.00% by weight.
101
Appendix C
HS-11 Hydroseparator & Heavy Liquid Separation
The hydroseparator uses curved vertical glass tubes (GST), a software controlled pulse
regulator, and a manually controlled flow rate regulator connected to a gravity controlled water
tank. The hydroseparator has two GST sizes: the large GST (LGST) is for initial concentration
and the small GST (SGST) is for final concentration. Heavier minerals stay at the bottom of the
GST and lighter minerals flow out the top of the GST (Figure A.1). Pulse regulator modes are
split into two categories: 1.1-1.5 and 2.1-2.5. When there is a large difference in densities
between light and target minerals (e.g., quartz and zircon) modes 1.1-1.5 are used. Modes 2.1-2.5
are used only for initial concentration when the difference in densities is closer (CNT Minerals,
2010). For this project, only modes 1.1-1.5 were tested.
Trial runs with heavy mineral-doped quartz powders were most successful (visual checks
of concentrates on SEM) with modes 1.2 and 1.3 so these were the only modes used. Calgon®
was added to the water used for hydroseparation to reduce clumping of samples in the GSTs
(some clumping is unavoidable in the <20 µm size fraction because not all the clay could be
removed during preparation). For initial concentrations, aliquots of approximately 4 g or less
were mixed with water to create a slurry that was poured into the top of the LGST. Each aliquot
was processed for 2-3 minutes until no grains were visibly flowing out of the top of the LGST.
The initial concentrates for all of the <4 g aliquots were combined and processed in the SGST for
1-2 minutes to produce a final HMC.
One sample (WL008) was run twice on the hydroseparator with the same setting to test
the reproducibility of concentration factors. The reproducibility of concentration factors was
102
close for the same sample, however there was no reproducibility between different samples. A
number of variables could account for different concentration factors between samples including
original mineral abundances and clay content, original weight of the size fraction, shapes of
heavy minerals, and human or instrumental error of hydroseparator operation.
Sub-splits of four samples (<63 μm) were sent to Laurentian University in Sudbury, ON
to be passed through methylene iodide (S.G. = 3.33; Brauns, 1912) for heavy liquid density
separation to compare the efficiency of hydroseparation with heavy liquid separation.
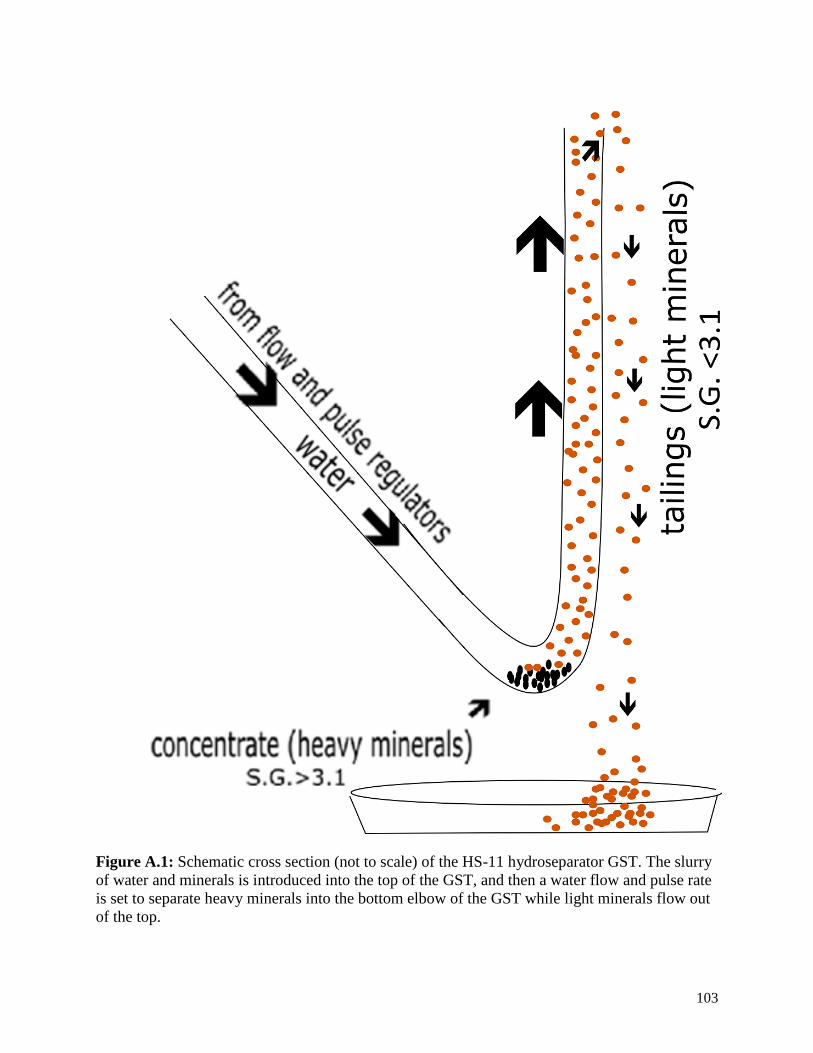
103
Figure A.1: Schematic cross section (not to scale) of the HS-11 hydroseparator GST. The slurry
of water and minerals is introduced into the top of the GST, and then a water flow and pulse rate
is set to separate heavy minerals into the bottom elbow of the GST while light minerals flow out
of the top.
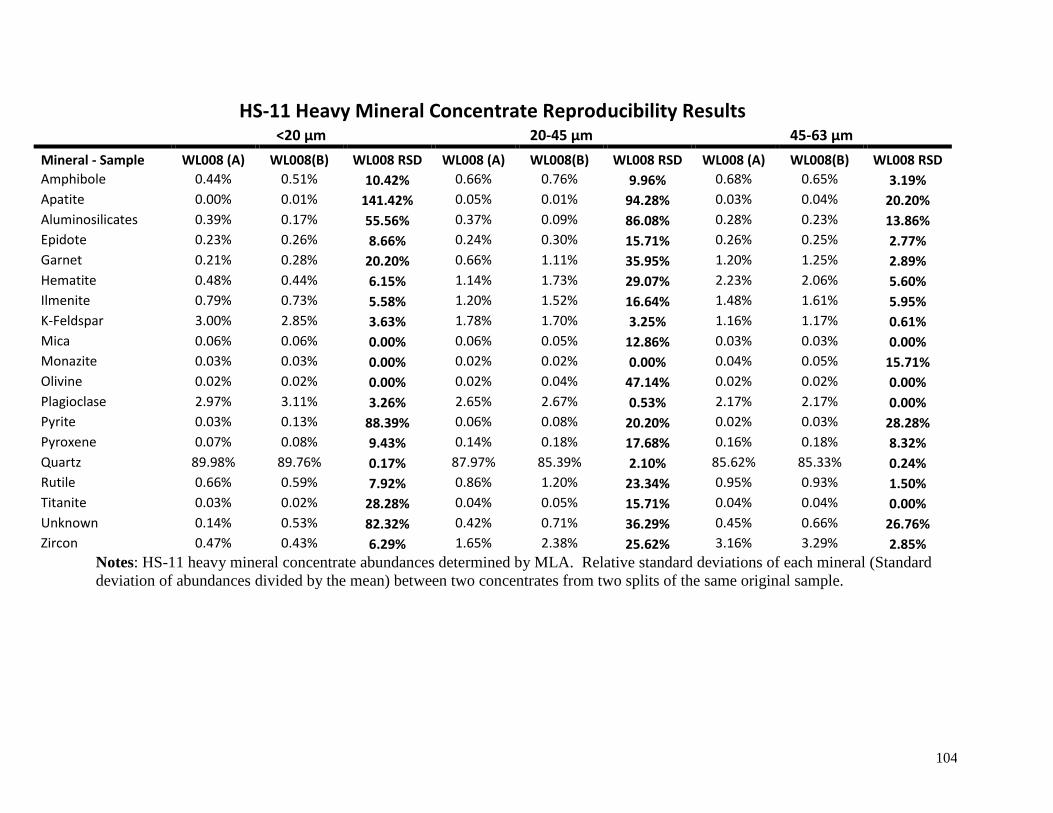
104
HS-11 Heavy Mineral Concentrate Reproducibility Results
<20 µm 20-45 µm 45-63 µm
Mineral - Sample WL008 (A) WL008(B) WL008 RSD WL008 (A) WL008(B) WL008 RSD WL008 (A) WL008(B) WL008 RSD
Amphibole 0.44% 0.51% 10.42% 0.66% 0.76% 9.96% 0.68% 0.65% 3.19%
Apatite 0.00% 0.01% 141.42% 0.05% 0.01% 94.28% 0.03% 0.04% 20.20%
Aluminosilicates 0.39% 0.17% 55.56% 0.37% 0.09% 86.08% 0.28% 0.23% 13.86%
Epidote 0.23% 0.26% 8.66% 0.24% 0.30% 15.71% 0.26% 0.25% 2.77%
Garnet 0.21% 0.28% 20.20% 0.66% 1.11% 35.95% 1.20% 1.25% 2.89%
Hematite 0.48% 0.44% 6.15% 1.14% 1.73% 29.07% 2.23% 2.06% 5.60%
Ilmenite 0.79% 0.73% 5.58% 1.20% 1.52% 16.64% 1.48% 1.61% 5.95%
K-Feldspar 3.00% 2.85% 3.63% 1.78% 1.70% 3.25% 1.16% 1.17% 0.61%
Mica 0.06% 0.06% 0.00% 0.06% 0.05% 12.86% 0.03% 0.03% 0.00%
Monazite 0.03% 0.03% 0.00% 0.02% 0.02% 0.00% 0.04% 0.05% 15.71%
Olivine 0.02% 0.02% 0.00% 0.02% 0.04% 47.14% 0.02% 0.02% 0.00%
Plagioclase 2.97% 3.11% 3.26% 2.65% 2.67% 0.53% 2.17% 2.17% 0.00%
Pyrite 0.03% 0.13% 88.39% 0.06% 0.08% 20.20% 0.02% 0.03% 28.28%
Pyroxene 0.07% 0.08% 9.43% 0.14% 0.18% 17.68% 0.16% 0.18% 8.32%
Quartz 89.98% 89.76% 0.17% 87.97% 85.39% 2.10% 85.62% 85.33% 0.24%
Rutile 0.66% 0.59% 7.92% 0.86% 1.20% 23.34% 0.95% 0.93% 1.50%
Titanite 0.03% 0.02% 28.28% 0.04% 0.05% 15.71% 0.04% 0.04% 0.00%
Unknown 0.14% 0.53% 82.32% 0.42% 0.71% 36.29% 0.45% 0.66% 26.76%
Zircon 0.47% 0.43% 6.29% 1.65% 2.38% 25.62% 3.16% 3.29% 2.85%
Notes: HS-11 heavy mineral concentrate abundances determined by MLA. Relative standard deviations of each mineral (Standard
deviation of abundances divided by the mean) between two concentrates from two splits of the same original sample.
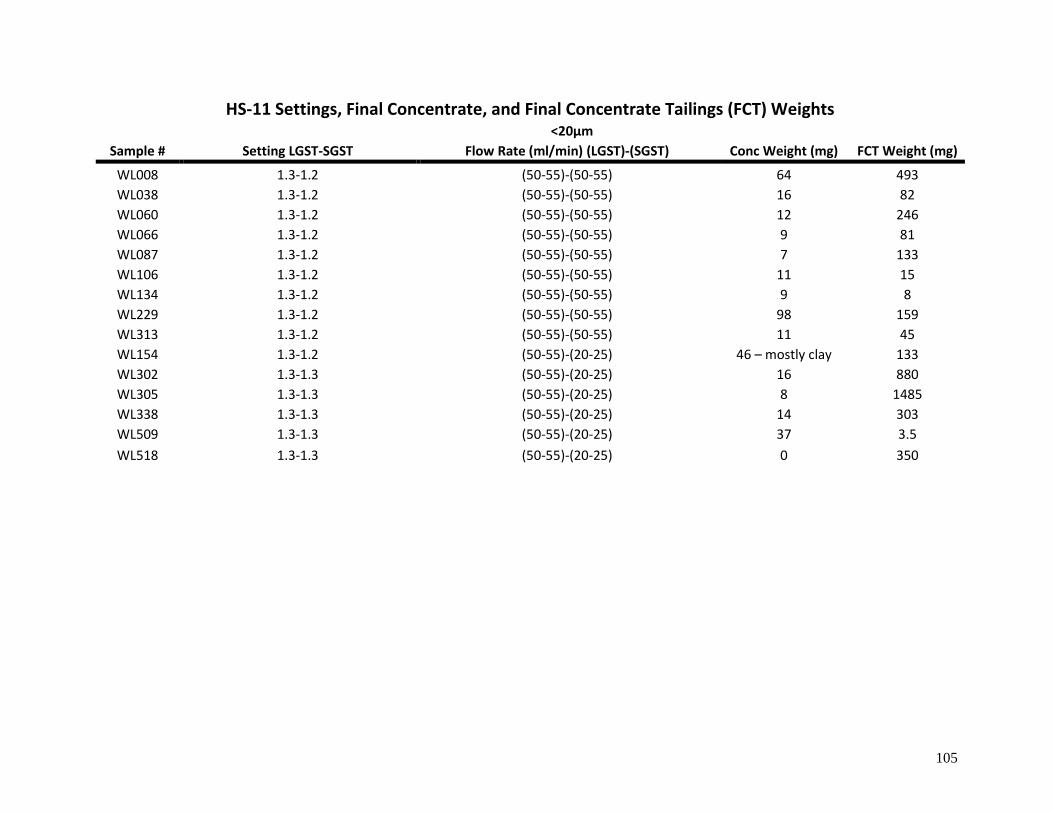
105
HS-11 Settings, Final Concentrate, and Final Concentrate Tailings (FCT) Weights <20µm
Sample # Setting LGST-SGST Flow Rate (ml/min) (LGST)-(SGST) Conc Weight (mg) FCT Weight (mg)
WL008 1.3-1.2 (50-55)-(50-55) 64 493
WL038 1.3-1.2 (50-55)-(50-55) 16 82
WL060 1.3-1.2 (50-55)-(50-55) 12 246
WL066 1.3-1.2 (50-55)-(50-55) 9 81
WL087 1.3-1.2 (50-55)-(50-55) 7 133
WL106 1.3-1.2 (50-55)-(50-55) 11 15
WL134 1.3-1.2 (50-55)-(50-55) 9 8
WL229 1.3-1.2 (50-55)-(50-55) 98 159
WL313 1.3-1.2 (50-55)-(50-55) 11 45
WL154 1.3-1.2 (50-55)-(20-25) 46 – mostly clay 133
WL302 1.3-1.3 (50-55)-(20-25) 16 880
WL305 1.3-1.3 (50-55)-(20-25) 8 1485
WL338 1.3-1.3 (50-55)-(20-25) 14 303
WL509 1.3-1.3 (50-55)-(20-25) 37 3.5
WL518 1.3-1.3 (50-55)-(20-25) 0 350
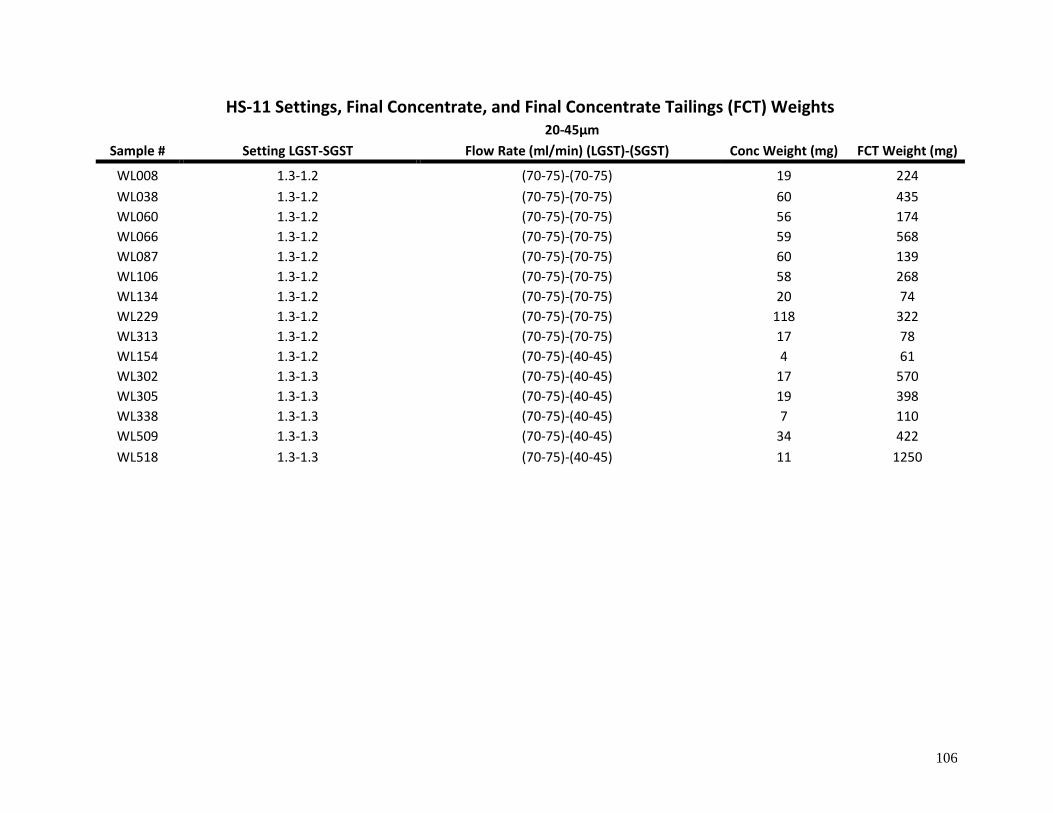
106
HS-11 Settings, Final Concentrate, and Final Concentrate Tailings (FCT) Weights 20-45µm
Sample # Setting LGST-SGST Flow Rate (ml/min) (LGST)-(SGST) Conc Weight (mg) FCT Weight (mg)
WL008 1.3-1.2 (70-75)-(70-75) 19 224
WL038 1.3-1.2 (70-75)-(70-75) 60 435
WL060 1.3-1.2 (70-75)-(70-75) 56 174
WL066 1.3-1.2 (70-75)-(70-75) 59 568
WL087 1.3-1.2 (70-75)-(70-75) 60 139
WL106 1.3-1.2 (70-75)-(70-75) 58 268
WL134 1.3-1.2 (70-75)-(70-75) 20 74
WL229 1.3-1.2 (70-75)-(70-75) 118 322
WL313 1.3-1.2 (70-75)-(70-75) 17 78
WL154 1.3-1.2 (70-75)-(40-45) 4 61
WL302 1.3-1.3 (70-75)-(40-45) 17 570
WL305 1.3-1.3 (70-75)-(40-45) 19 398
WL338 1.3-1.3 (70-75)-(40-45) 7 110
WL509 1.3-1.3 (70-75)-(40-45) 34 422
WL518 1.3-1.3 (70-75)-(40-45) 11 1250
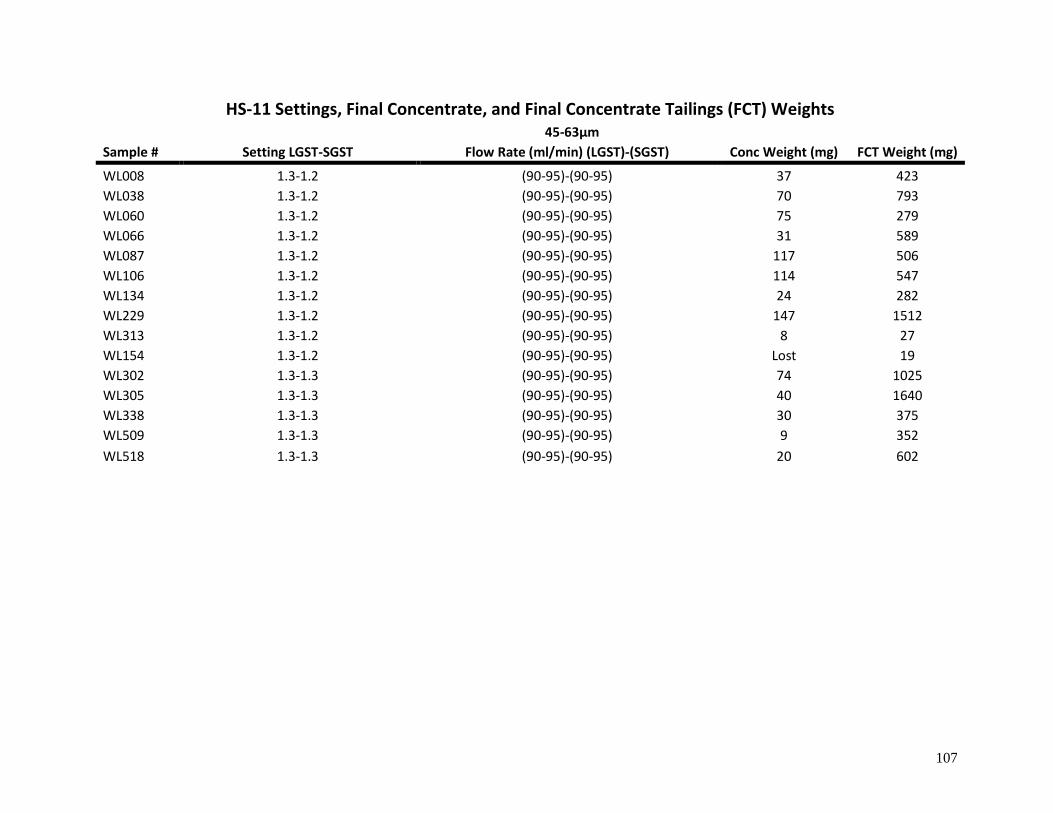
107
HS-11 Settings, Final Concentrate, and Final Concentrate Tailings (FCT) Weights 45-63µm
Sample # Setting LGST-SGST Flow Rate (ml/min) (LGST)-(SGST) Conc Weight (mg) FCT Weight (mg)
WL008 1.3-1.2 (90-95)-(90-95) 37 423
WL038 1.3-1.2 (90-95)-(90-95) 70 793
WL060 1.3-1.2 (90-95)-(90-95) 75 279
WL066 1.3-1.2 (90-95)-(90-95) 31 589
WL087 1.3-1.2 (90-95)-(90-95) 117 506
WL106 1.3-1.2 (90-95)-(90-95) 114 547
WL134 1.3-1.2 (90-95)-(90-95) 24 282
WL229 1.3-1.2 (90-95)-(90-95) 147 1512
WL313 1.3-1.2 (90-95)-(90-95) 8 27
WL154 1.3-1.2 (90-95)-(90-95) Lost 19
WL302 1.3-1.3 (90-95)-(90-95) 74 1025
WL305 1.3-1.3 (90-95)-(90-95) 40 1640
WL338 1.3-1.3 (90-95)-(90-95) 30 375
WL509 1.3-1.3 (90-95)-(90-95) 9 352
WL518 1.3-1.3 (90-95)-(90-95) 20 602
108
Concentration factors with heavy liquid separation were significantly higher in some
samples than with the hydroseparator; however, the efficiency of concentration was more
variable than the hydroseparator. Figure A.2 shows a comparison of zircon concentration factors
for heavy liquid to concentration factors for hydroseparation. Some heavy liquid concentration
factors were up to an order of magnitude higher than that of hydroseparation (e.g. zircon,
monazite), but there was a range heavy mineral concentration factors from 1 to 204. HMCs made
from methylene iodide contained many “unknown” minerals indicating that there likely was
contamination in these concentrates.
Heavy mineral concentration using hydroseparation is typically a pre-concentration method
before using heavy liquid separation (Stendal and Theobald, 1994; Towie and Seet, 1995; McClenaghan,
2011). Samples in this study were not pre-concentrated before heavy liquid separation. Pre-concentration
is important because although some heavy liquid concentrates had substantially higher concentration
factors than HS-11, other heavy liquid concentrates appeared to have no effective concentration of heavy
minerals. There were also many minerals in heavy liquid concentrates that were identified by MLA as
“unknown”. All of the minerals in the samples and HS-11 concentrates had already been identified on
MLA with <1% unknowns suggesting that contamination occurred during heavy liquid separation.
Heavy liquids are expensive and toxic, so they are commonly filtered and recycled (Towie and Seet,
1995). It is likely that new heavy mineral concentrates can contain minerals from previous heavy liquid
separations contaminating the HMC. Thousands of grains are counted on MLA and rapid scans may be
performed to identify specified minerals (Fandrich et al., 2007). Although the heavy minerals are not
concentrated as much with hydroseparation alone, MLA can still count several hundred heavy mineral
grains per 10-20mg HMC mount. Therefore, the HS-11 hydroseparation combined with mono-layer grain
mounting and MLA may be used an alternative to multistep heavy mineral concentration processes, but
further investigation of this is required.
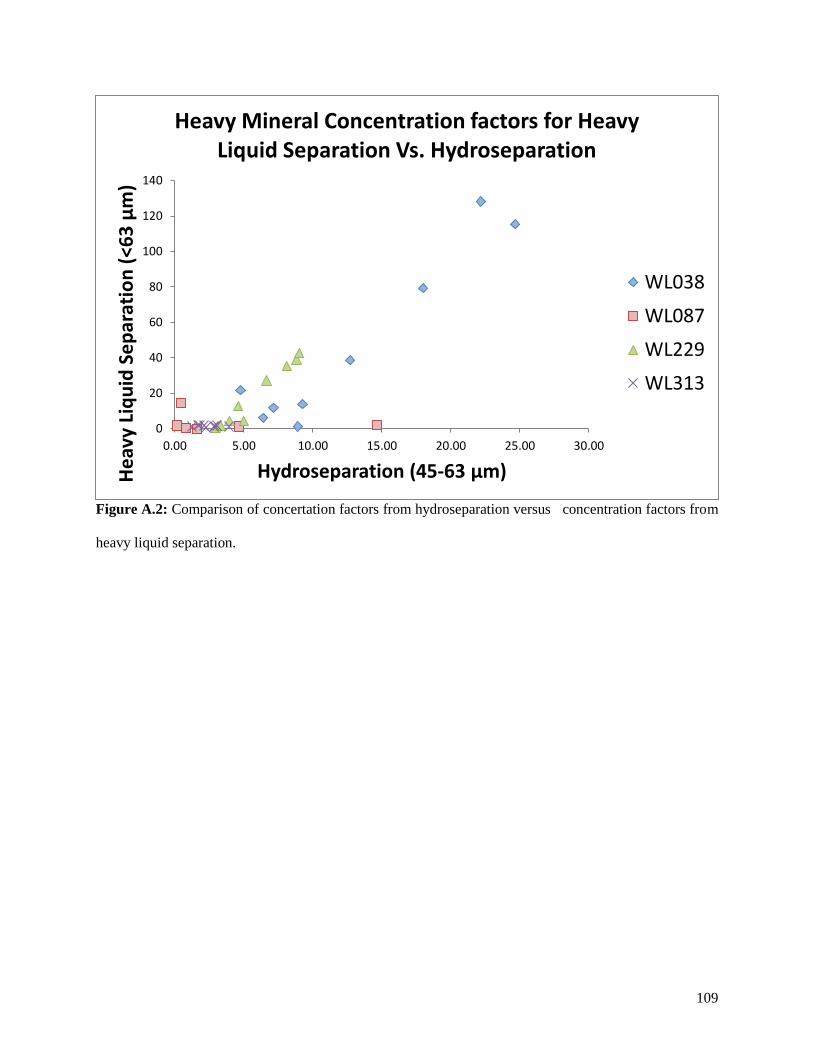
109
Figure A.2: Comparison of concertation factors from hydroseparation versus concentration factors from
heavy liquid separation.
0
20
40
60
80
100
120
140
0.00 5.00 10.00 15.00 20.00 25.00 30.00
He
avy
Liq
uid
Se
par
atio
n (
<63
μm
)
Hydroseparation (45-63 μm)
Heavy Mineral Concentration factors for Heavy Liquid Separation Vs. Hydroseparation
WL038
WL087
WL229
WL313
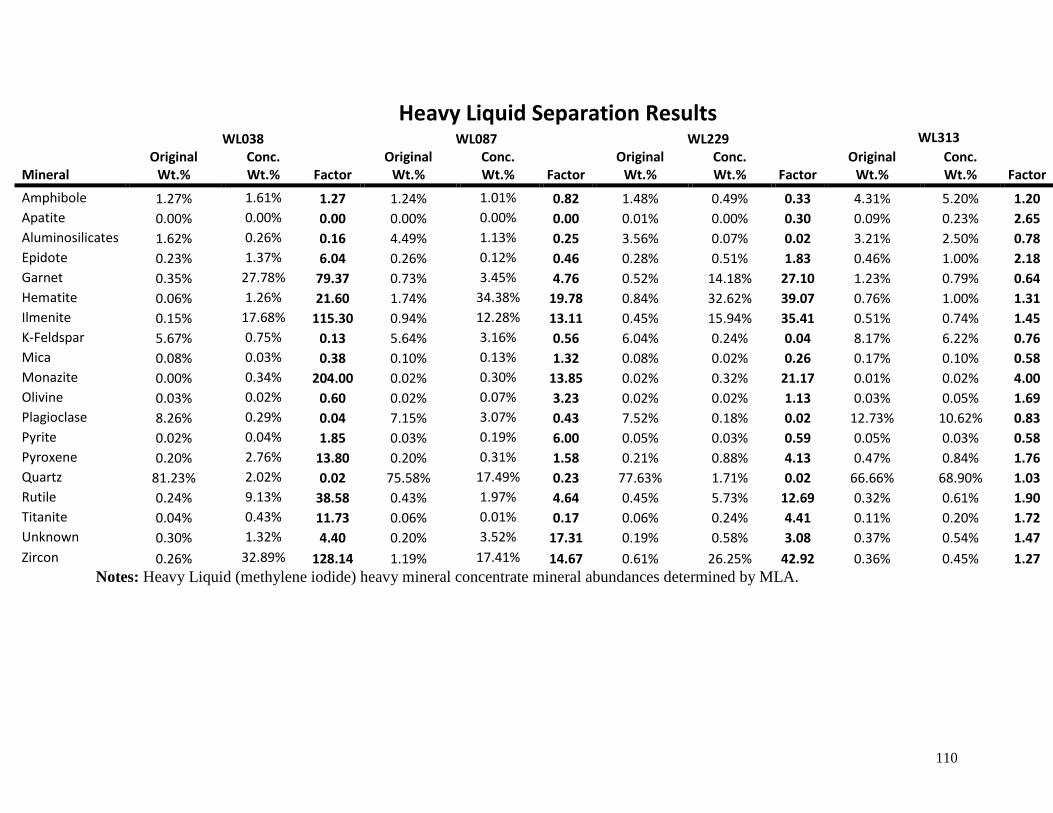
110
Heavy Liquid Separation Results WL038 WL087 WL229 WL313
Mineral Original
Wt.% Conc. Wt.% Factor
Original Wt.%
Conc. Wt.% Factor
Original Wt.%
Conc. Wt.% Factor
Original Wt.%
Conc. Wt.% Factor
Amphibole 1.27% 1.61% 1.27 1.24% 1.01% 0.82 1.48% 0.49% 0.33 4.31% 5.20% 1.20
Apatite 0.00% 0.00% 0.00 0.00% 0.00% 0.00 0.01% 0.00% 0.30 0.09% 0.23% 2.65
Aluminosilicates 1.62% 0.26% 0.16 4.49% 1.13% 0.25 3.56% 0.07% 0.02 3.21% 2.50% 0.78
Epidote 0.23% 1.37% 6.04 0.26% 0.12% 0.46 0.28% 0.51% 1.83 0.46% 1.00% 2.18
Garnet 0.35% 27.78% 79.37 0.73% 3.45% 4.76 0.52% 14.18% 27.10 1.23% 0.79% 0.64
Hematite 0.06% 1.26% 21.60 1.74% 34.38% 19.78 0.84% 32.62% 39.07 0.76% 1.00% 1.31
Ilmenite 0.15% 17.68% 115.30 0.94% 12.28% 13.11 0.45% 15.94% 35.41 0.51% 0.74% 1.45
K-Feldspar 5.67% 0.75% 0.13 5.64% 3.16% 0.56 6.04% 0.24% 0.04 8.17% 6.22% 0.76
Mica 0.08% 0.03% 0.38 0.10% 0.13% 1.32 0.08% 0.02% 0.26 0.17% 0.10% 0.58
Monazite 0.00% 0.34% 204.00 0.02% 0.30% 13.85 0.02% 0.32% 21.17 0.01% 0.02% 4.00
Olivine 0.03% 0.02% 0.60 0.02% 0.07% 3.23 0.02% 0.02% 1.13 0.03% 0.05% 1.69
Plagioclase 8.26% 0.29% 0.04 7.15% 3.07% 0.43 7.52% 0.18% 0.02 12.73% 10.62% 0.83
Pyrite 0.02% 0.04% 1.85 0.03% 0.19% 6.00 0.05% 0.03% 0.59 0.05% 0.03% 0.58
Pyroxene 0.20% 2.76% 13.80 0.20% 0.31% 1.58 0.21% 0.88% 4.13 0.47% 0.84% 1.76
Quartz 81.23% 2.02% 0.02 75.58% 17.49% 0.23 77.63% 1.71% 0.02 66.66% 68.90% 1.03
Rutile 0.24% 9.13% 38.58 0.43% 1.97% 4.64 0.45% 5.73% 12.69 0.32% 0.61% 1.90
Titanite 0.04% 0.43% 11.73 0.06% 0.01% 0.17 0.06% 0.24% 4.41 0.11% 0.20% 1.72
Unknown 0.30% 1.32% 4.40 0.20% 3.52% 17.31 0.19% 0.58% 3.08 0.37% 0.54% 1.47
Zircon 0.26% 32.89% 128.14 1.19% 17.41% 14.67 0.61% 26.25% 42.92 0.36% 0.45% 1.27
Notes: Heavy Liquid (methylene iodide) heavy mineral concentrate mineral abundances determined by MLA.
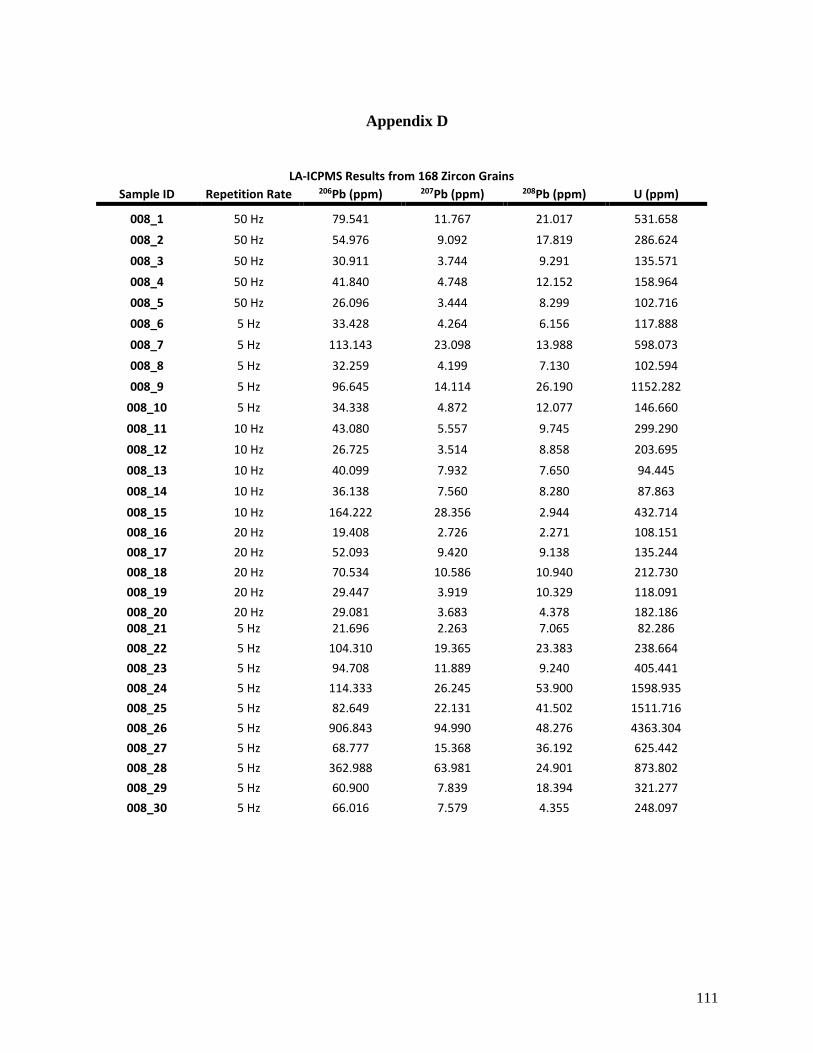
111
Appendix D
LA-ICPMS Results from 168 Zircon Grains
Sample ID Repetition Rate 206Pb (ppm) 207Pb (ppm) 208Pb (ppm) U (ppm)
008_1 50 Hz 79.541 11.767 21.017 531.658
008_2 50 Hz 54.976 9.092 17.819 286.624
008_3 50 Hz 30.911 3.744 9.291 135.571
008_4 50 Hz 41.840 4.748 12.152 158.964
008_5 50 Hz 26.096 3.444 8.299 102.716
008_6 5 Hz 33.428 4.264 6.156 117.888
008_7 5 Hz 113.143 23.098 13.988 598.073
008_8 5 Hz 32.259 4.199 7.130 102.594
008_9 5 Hz 96.645 14.114 26.190 1152.282
008_10 5 Hz 34.338 4.872 12.077 146.660
008_11 10 Hz 43.080 5.557 9.745 299.290
008_12 10 Hz 26.725 3.514 8.858 203.695
008_13 10 Hz 40.099 7.932 7.650 94.445
008_14 10 Hz 36.138 7.560 8.280 87.863
008_15 10 Hz 164.222 28.356 2.944 432.714
008_16 20 Hz 19.408 2.726 2.271 108.151
008_17 20 Hz 52.093 9.420 9.138 135.244
008_18 20 Hz 70.534 10.586 10.940 212.730
008_19 20 Hz 29.447 3.919 10.329 118.091
008_20 20 Hz 29.081 3.683 4.378 182.186 008_21 5 Hz 21.696 2.263 7.065 82.286
008_22 5 Hz 104.310 19.365 23.383 238.664
008_23 5 Hz 94.708 11.889 9.240 405.441
008_24 5 Hz 114.333 26.245 53.900 1598.935
008_25 5 Hz 82.649 22.131 41.502 1511.716
008_26 5 Hz 906.843 94.990 48.276 4363.304
008_27 5 Hz 68.777 15.368 36.192 625.442
008_28 5 Hz 362.988 63.981 24.901 873.802
008_29 5 Hz 60.900 7.839 18.394 321.277
008_30 5 Hz 66.016 7.579 4.355 248.097
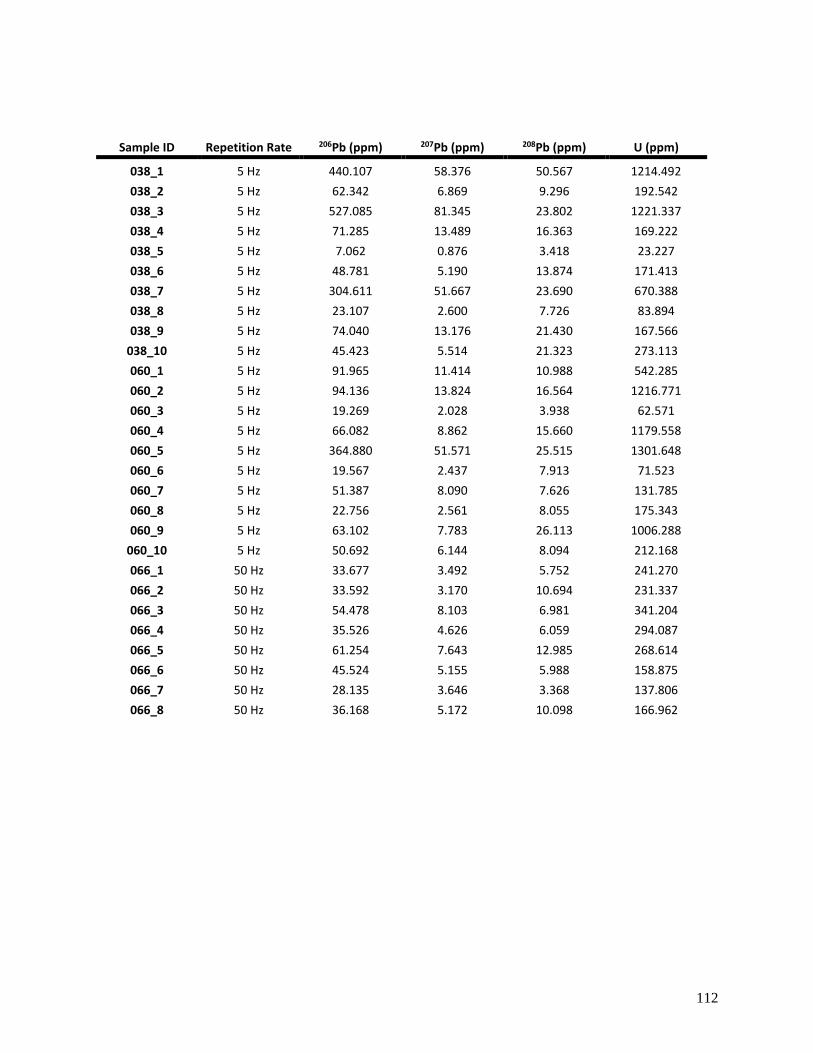
112
Sample ID Repetition Rate 206Pb (ppm) 207Pb (ppm) 208Pb (ppm) U (ppm)
038_1 5 Hz 440.107 58.376 50.567 1214.492
038_2 5 Hz 62.342 6.869 9.296 192.542
038_3 5 Hz 527.085 81.345 23.802 1221.337
038_4 5 Hz 71.285 13.489 16.363 169.222
038_5 5 Hz 7.062 0.876 3.418 23.227
038_6 5 Hz 48.781 5.190 13.874 171.413
038_7 5 Hz 304.611 51.667 23.690 670.388
038_8 5 Hz 23.107 2.600 7.726 83.894
038_9 5 Hz 74.040 13.176 21.430 167.566
038_10 5 Hz 45.423 5.514 21.323 273.113
060_1 5 Hz 91.965 11.414 10.988 542.285
060_2 5 Hz 94.136 13.824 16.564 1216.771
060_3 5 Hz 19.269 2.028 3.938 62.571
060_4 5 Hz 66.082 8.862 15.660 1179.558
060_5 5 Hz 364.880 51.571 25.515 1301.648
060_6 5 Hz 19.567 2.437 7.913 71.523
060_7 5 Hz 51.387 8.090 7.626 131.785
060_8 5 Hz 22.756 2.561 8.055 175.343
060_9 5 Hz 63.102 7.783 26.113 1006.288
060_10 5 Hz 50.692 6.144 8.094 212.168
066_1 50 Hz 33.677 3.492 5.752 241.270
066_2 50 Hz 33.592 3.170 10.694 231.337
066_3 50 Hz 54.478 8.103 6.981 341.204
066_4 50 Hz 35.526 4.626 6.059 294.087
066_5 50 Hz 61.254 7.643 12.985 268.614
066_6 50 Hz 45.524 5.155 5.988 158.875
066_7 50 Hz 28.135 3.646 3.368 137.806
066_8 50 Hz 36.168 5.172 10.098 166.962
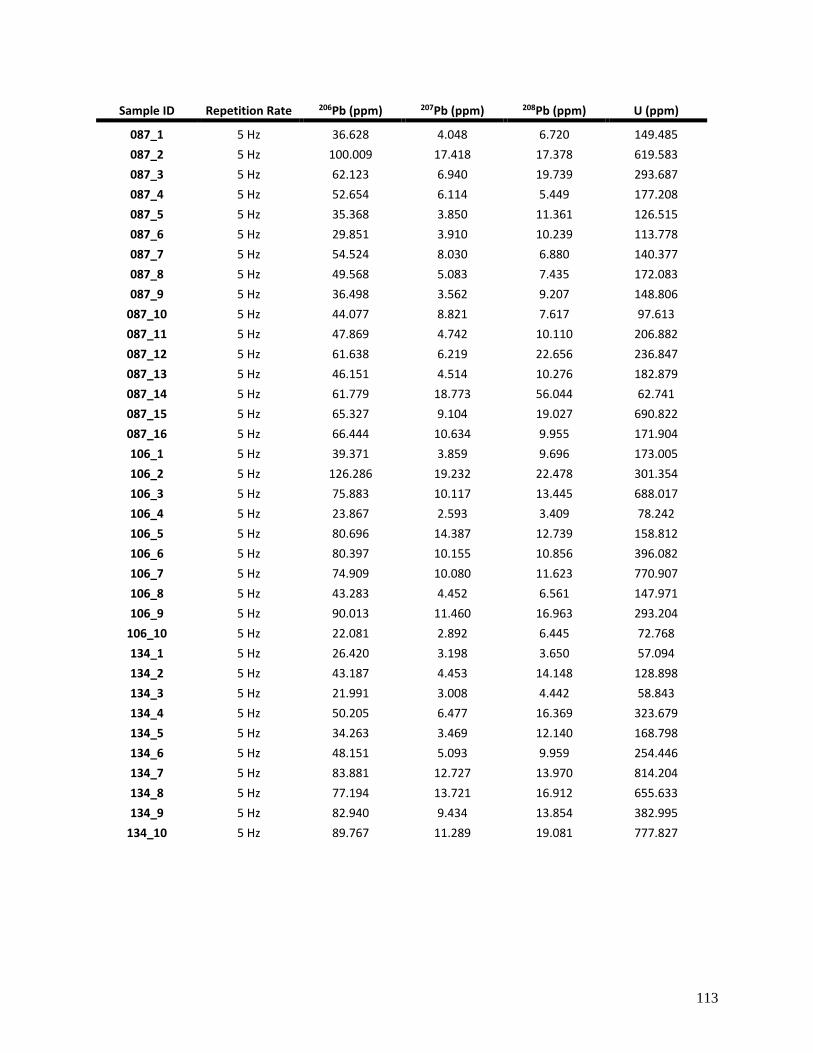
113
Sample ID Repetition Rate 206Pb (ppm) 207Pb (ppm) 208Pb (ppm) U (ppm)
087_1 5 Hz 36.628 4.048 6.720 149.485
087_2 5 Hz 100.009 17.418 17.378 619.583
087_3 5 Hz 62.123 6.940 19.739 293.687
087_4 5 Hz 52.654 6.114 5.449 177.208
087_5 5 Hz 35.368 3.850 11.361 126.515
087_6 5 Hz 29.851 3.910 10.239 113.778
087_7 5 Hz 54.524 8.030 6.880 140.377
087_8 5 Hz 49.568 5.083 7.435 172.083
087_9 5 Hz 36.498 3.562 9.207 148.806
087_10 5 Hz 44.077 8.821 7.617 97.613
087_11 5 Hz 47.869 4.742 10.110 206.882
087_12 5 Hz 61.638 6.219 22.656 236.847
087_13 5 Hz 46.151 4.514 10.276 182.879
087_14 5 Hz 61.779 18.773 56.044 62.741
087_15 5 Hz 65.327 9.104 19.027 690.822
087_16 5 Hz 66.444 10.634 9.955 171.904
106_1 5 Hz 39.371 3.859 9.696 173.005
106_2 5 Hz 126.286 19.232 22.478 301.354
106_3 5 Hz 75.883 10.117 13.445 688.017
106_4 5 Hz 23.867 2.593 3.409 78.242
106_5 5 Hz 80.696 14.387 12.739 158.812
106_6 5 Hz 80.397 10.155 10.856 396.082
106_7 5 Hz 74.909 10.080 11.623 770.907
106_8 5 Hz 43.283 4.452 6.561 147.971
106_9 5 Hz 90.013 11.460 16.963 293.204
106_10 5 Hz 22.081 2.892 6.445 72.768
134_1 5 Hz 26.420 3.198 3.650 57.094
134_2 5 Hz 43.187 4.453 14.148 128.898
134_3 5 Hz 21.991 3.008 4.442 58.843
134_4 5 Hz 50.205 6.477 16.369 323.679
134_5 5 Hz 34.263 3.469 12.140 168.798
134_6 5 Hz 48.151 5.093 9.959 254.446
134_7 5 Hz 83.881 12.727 13.970 814.204
134_8 5 Hz 77.194 13.721 16.912 655.633
134_9 5 Hz 82.940 9.434 13.854 382.995
134_10 5 Hz 89.767 11.289 19.081 777.827
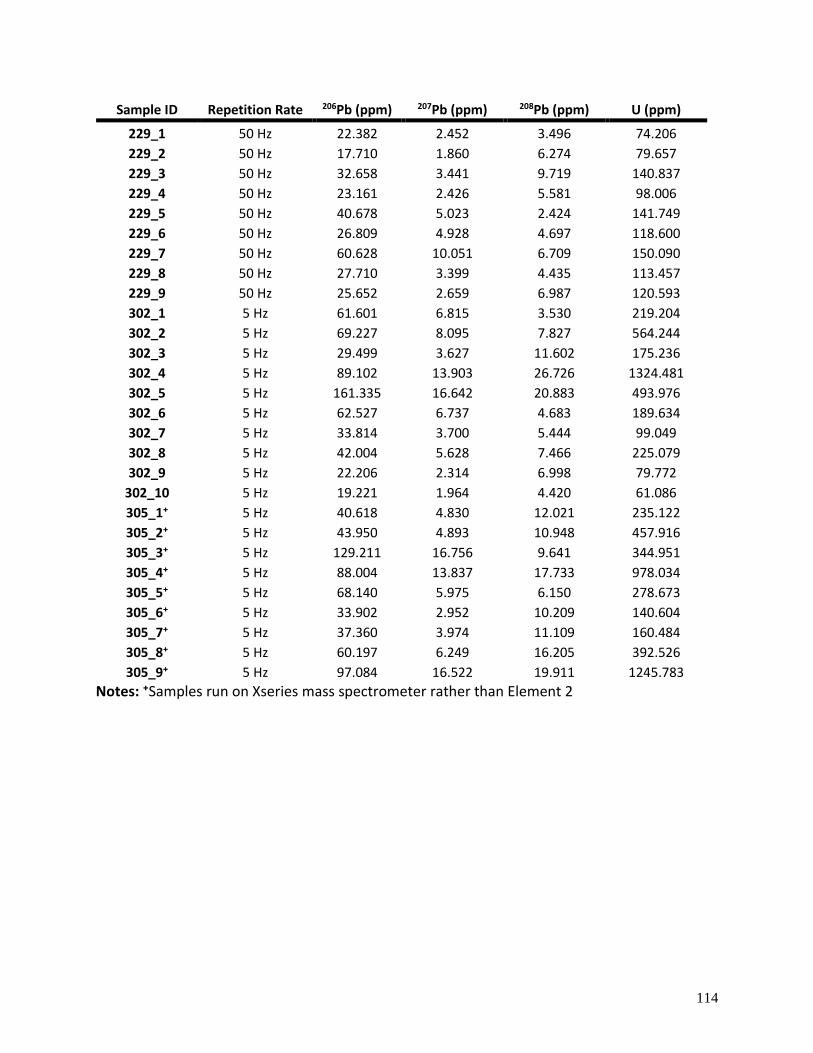
114
Sample ID Repetition Rate 206Pb (ppm) 207Pb (ppm) 208Pb (ppm) U (ppm)
229_1 50 Hz 22.382 2.452 3.496 74.206
229_2 50 Hz 17.710 1.860 6.274 79.657
229_3 50 Hz 32.658 3.441 9.719 140.837
229_4 50 Hz 23.161 2.426 5.581 98.006
229_5 50 Hz 40.678 5.023 2.424 141.749
229_6 50 Hz 26.809 4.928 4.697 118.600
229_7 50 Hz 60.628 10.051 6.709 150.090
229_8 50 Hz 27.710 3.399 4.435 113.457
229_9 50 Hz 25.652 2.659 6.987 120.593
302_1 5 Hz 61.601 6.815 3.530 219.204
302_2 5 Hz 69.227 8.095 7.827 564.244
302_3 5 Hz 29.499 3.627 11.602 175.236
302_4 5 Hz 89.102 13.903 26.726 1324.481
302_5 5 Hz 161.335 16.642 20.883 493.976
302_6 5 Hz 62.527 6.737 4.683 189.634
302_7 5 Hz 33.814 3.700 5.444 99.049
302_8 5 Hz 42.004 5.628 7.466 225.079
302_9 5 Hz 22.206 2.314 6.998 79.772
302_10 5 Hz 19.221 1.964 4.420 61.086
305_1⁺ 5 Hz 40.618 4.830 12.021 235.122
305_2⁺ 5 Hz 43.950 4.893 10.948 457.916
305_3⁺ 5 Hz 129.211 16.756 9.641 344.951
305_4⁺ 5 Hz 88.004 13.837 17.733 978.034
305_5⁺ 5 Hz 68.140 5.975 6.150 278.673
305_6⁺ 5 Hz 33.902 2.952 10.209 140.604
305_7⁺ 5 Hz 37.360 3.974 11.109 160.484
305_8⁺ 5 Hz 60.197 6.249 16.205 392.526
305_9⁺ 5 Hz 97.084 16.522 19.911 1245.783
Notes: ⁺Samples run on Xseries mass spectrometer rather than Element 2
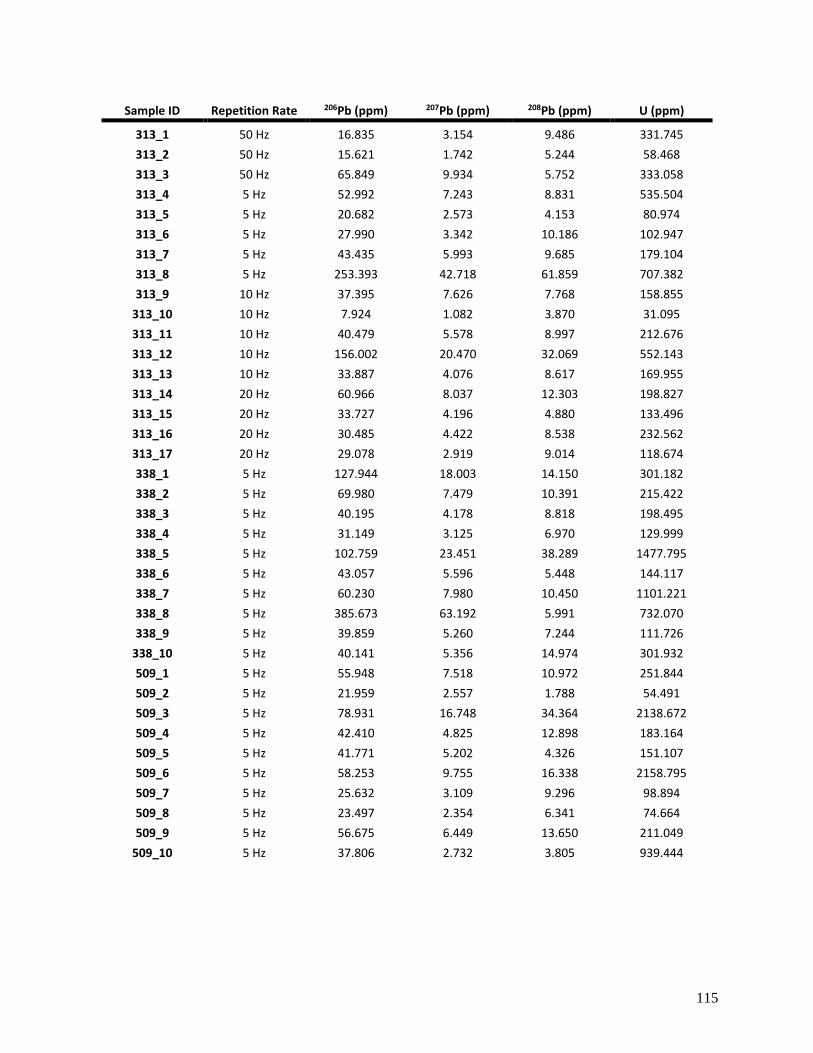
115
Sample ID Repetition Rate 206Pb (ppm) 207Pb (ppm) 208Pb (ppm) U (ppm)
313_1 50 Hz 16.835 3.154 9.486 331.745
313_2 50 Hz 15.621 1.742 5.244 58.468
313_3 50 Hz 65.849 9.934 5.752 333.058
313_4 5 Hz 52.992 7.243 8.831 535.504
313_5 5 Hz 20.682 2.573 4.153 80.974
313_6 5 Hz 27.990 3.342 10.186 102.947
313_7 5 Hz 43.435 5.993 9.685 179.104
313_8 5 Hz 253.393 42.718 61.859 707.382
313_9 10 Hz 37.395 7.626 7.768 158.855
313_10 10 Hz 7.924 1.082 3.870 31.095
313_11 10 Hz 40.479 5.578 8.997 212.676
313_12 10 Hz 156.002 20.470 32.069 552.143
313_13 10 Hz 33.887 4.076 8.617 169.955
313_14 20 Hz 60.966 8.037 12.303 198.827
313_15 20 Hz 33.727 4.196 4.880 133.496
313_16 20 Hz 30.485 4.422 8.538 232.562
313_17 20 Hz 29.078 2.919 9.014 118.674
338_1 5 Hz 127.944 18.003 14.150 301.182
338_2 5 Hz 69.980 7.479 10.391 215.422
338_3 5 Hz 40.195 4.178 8.818 198.495
338_4 5 Hz 31.149 3.125 6.970 129.999
338_5 5 Hz 102.759 23.451 38.289 1477.795
338_6 5 Hz 43.057 5.596 5.448 144.117
338_7 5 Hz 60.230 7.980 10.450 1101.221
338_8 5 Hz 385.673 63.192 5.991 732.070
338_9 5 Hz 39.859 5.260 7.244 111.726
338_10 5 Hz 40.141 5.356 14.974 301.932
509_1 5 Hz 55.948 7.518 10.972 251.844
509_2 5 Hz 21.959 2.557 1.788 54.491
509_3 5 Hz 78.931 16.748 34.364 2138.672
509_4 5 Hz 42.410 4.825 12.898 183.164
509_5 5 Hz 41.771 5.202 4.326 151.107
509_6 5 Hz 58.253 9.755 16.338 2158.795
509_7 5 Hz 25.632 3.109 9.296 98.894
509_8 5 Hz 23.497 2.354 6.341 74.664
509_9 5 Hz 56.675 6.449 13.650 211.049
509_10 5 Hz 37.806 2.732 3.805 939.444
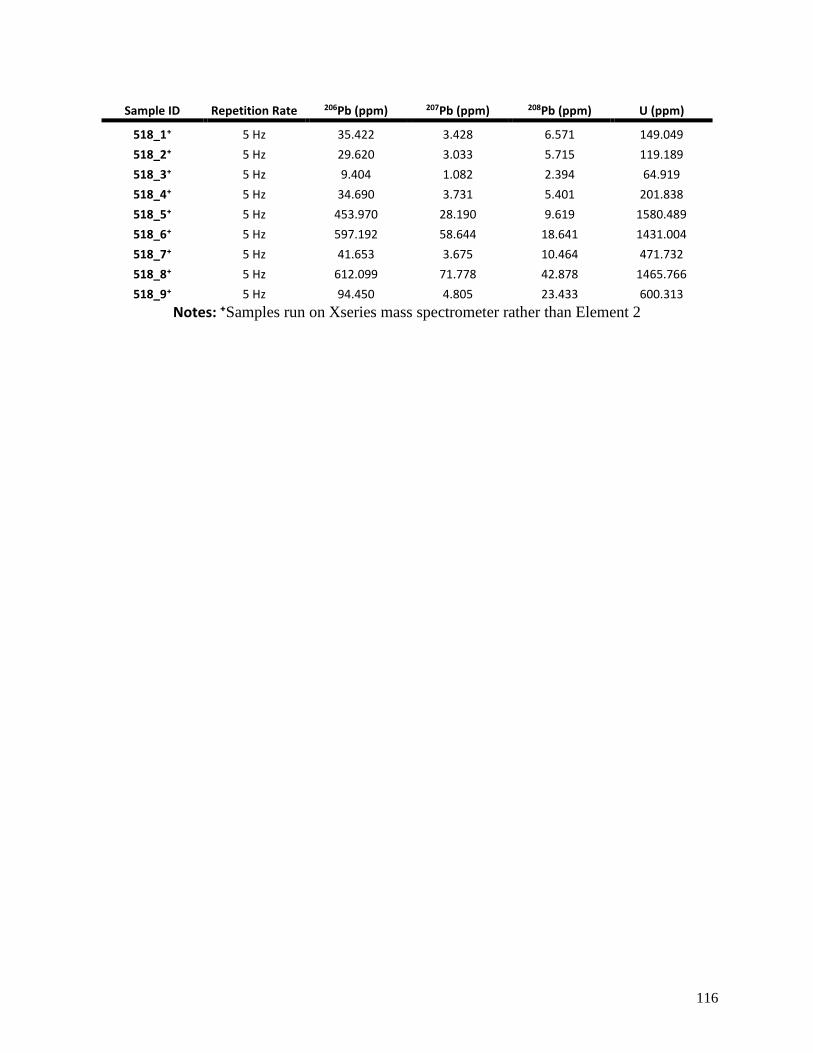
116
Sample ID Repetition Rate 206Pb (ppm) 207Pb (ppm) 208Pb (ppm) U (ppm)
518_1⁺ 5 Hz 35.422 3.428 6.571 149.049
518_2⁺ 5 Hz 29.620 3.033 5.715 119.189
518_3⁺ 5 Hz 9.404 1.082 2.394 64.919
518_4⁺ 5 Hz 34.690 3.731 5.401 201.838
518_5⁺ 5 Hz 453.970 28.190 9.619 1580.489
518_6⁺ 5 Hz 597.192 58.644 18.641 1431.004
518_7⁺ 5 Hz 41.653 3.675 10.464 471.732
518_8⁺ 5 Hz 612.099 71.778 42.878 1465.766
518_9⁺ 5 Hz 94.450 4.805 23.433 600.313
Notes: ⁺Samples run on Xseries mass spectrometer rather than Element 2
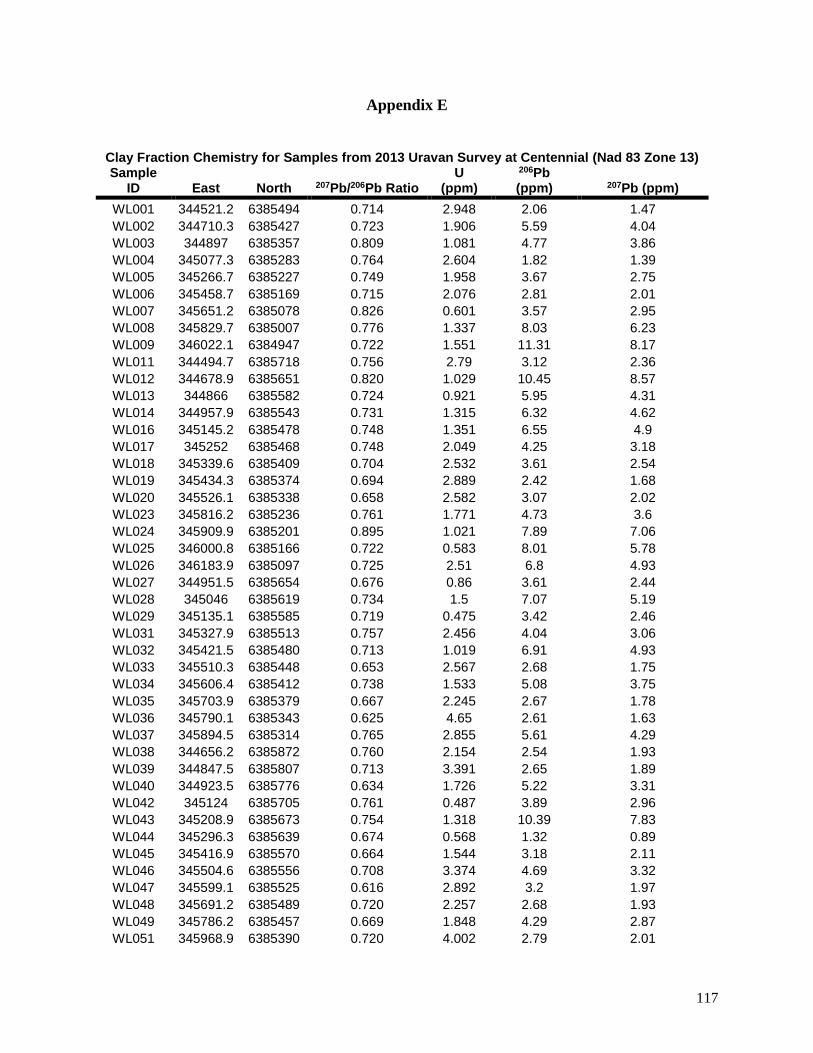
117
Appendix E
Clay Fraction Chemistry for Samples from 2013 Uravan Survey at Centennial (Nad 83 Zone 13) Sample
ID East North 207Pb/206Pb Ratio U
(ppm)
206Pb (ppm) 207Pb (ppm)
WL001 344521.2 6385494 0.714 2.948 2.06 1.47
WL002 344710.3 6385427 0.723 1.906 5.59 4.04
WL003 344897 6385357 0.809 1.081 4.77 3.86
WL004 345077.3 6385283 0.764 2.604 1.82 1.39
WL005 345266.7 6385227 0.749 1.958 3.67 2.75
WL006 345458.7 6385169 0.715 2.076 2.81 2.01
WL007 345651.2 6385078 0.826 0.601 3.57 2.95
WL008 345829.7 6385007 0.776 1.337 8.03 6.23
WL009 346022.1 6384947 0.722 1.551 11.31 8.17
WL011 344494.7 6385718 0.756 2.79 3.12 2.36
WL012 344678.9 6385651 0.820 1.029 10.45 8.57
WL013 344866 6385582 0.724 0.921 5.95 4.31
WL014 344957.9 6385543 0.731 1.315 6.32 4.62
WL016 345145.2 6385478 0.748 1.351 6.55 4.9
WL017 345252 6385468 0.748 2.049 4.25 3.18
WL018 345339.6 6385409 0.704 2.532 3.61 2.54
WL019 345434.3 6385374 0.694 2.889 2.42 1.68
WL020 345526.1 6385338 0.658 2.582 3.07 2.02
WL023 345816.2 6385236 0.761 1.771 4.73 3.6
WL024 345909.9 6385201 0.895 1.021 7.89 7.06
WL025 346000.8 6385166 0.722 0.583 8.01 5.78
WL026 346183.9 6385097 0.725 2.51 6.8 4.93
WL027 344951.5 6385654 0.676 0.86 3.61 2.44
WL028 345046 6385619 0.734 1.5 7.07 5.19
WL029 345135.1 6385585 0.719 0.475 3.42 2.46
WL031 345327.9 6385513 0.757 2.456 4.04 3.06
WL032 345421.5 6385480 0.713 1.019 6.91 4.93
WL033 345510.3 6385448 0.653 2.567 2.68 1.75
WL034 345606.4 6385412 0.738 1.533 5.08 3.75
WL035 345703.9 6385379 0.667 2.245 2.67 1.78
WL036 345790.1 6385343 0.625 4.65 2.61 1.63
WL037 345894.5 6385314 0.765 2.855 5.61 4.29
WL038 344656.2 6385872 0.760 2.154 2.54 1.93
WL039 344847.5 6385807 0.713 3.391 2.65 1.89
WL040 344923.5 6385776 0.634 1.726 5.22 3.31
WL042 345124 6385705 0.761 0.487 3.89 2.96
WL043 345208.9 6385673 0.754 1.318 10.39 7.83
WL044 345296.3 6385639 0.674 0.568 1.32 0.89
WL045 345416.9 6385570 0.664 1.544 3.18 2.11
WL046 345504.6 6385556 0.708 3.374 4.69 3.32
WL047 345599.1 6385525 0.616 2.892 3.2 1.97
WL048 345691.2 6385489 0.720 2.257 2.68 1.93
WL049 345786.2 6385457 0.669 1.848 4.29 2.87
WL051 345968.9 6385390 0.720 4.002 2.79 2.01

118
Sample
ID East North 207Pb/206Pb Ratio U
(ppm)
206Pb (ppm) 207Pb (ppm)
WL052 346160.1 6385315 0.698 1.562 11.64 8.13
WL053 346340.9 6385246 0.712 2.559 5.77 4.11
WL054 339577.8 6387843 0.697 1.801 2.97 2.07
WL055 340048.8 6387669 0.832 1.101 6.6 5.49
WL056 340515.6 6387499 0.612 3.021 2.73 1.67
WL057 340980 6387288 0.689 1.407 4.92 3.39
WL058 341542.6 6387164 0.687 1.304 4.12 2.83
WL059 341922.6 6386981 0.588 1.825 4.9 2.88
WL060 342394.6 6386807 0.644 2.24 2.7 1.74
WL061 342863.8 6386633 0.711 1.576 5.02 3.57
WL062 343325.2 6386462 0.774 2.035 3.59 2.78
WL063 343798.6 6386291 0.787 0.845 8.9 7
WL064 344273.6 6386111 0.796 2.279 5.04 4.01
WL065 345028 6385840 0.637 2.453 3.42 2.18
WL066 345112.2 6385800 0.678 2.031 4.54 3.08
WL068 345264.7 6385759 0.739 1.172 7.02 5.19
WL069 345296.6 6385733 0.809 2.395 3.19 2.58
WL071 345393.3 6385721 0.783 1.112 5.39 4.22
WL072 345440.8 6385688 0.642 1.534 1.2 0.77
WL074 345534.8 6385651 0.689 2.108 2.51 1.73
WL076 345631.3 6385614 0.654 2.283 4.36 2.85
WL077 345681.5 6385602 0.677 2.173 2.48 1.68
WL078 345725.1 6385588 0.705 2.088 1.76 1.24
WL079 345774.9 6385561 0.812 1.826 5.81 4.72
WL080 345856.8 6385531 0.673 2.311 2.84 1.91
WL081 345958.4 6385502 0.679 1.822 5.95 4.04
WL082 346612.5 6385240 0.742 2.939 3.68 2.73
WL083 347083 6385090 0.611 2.52 5.09 3.11
WL084 347553.7 6384916 0.639 2.033 6.85 4.38
WL085 348026 6384738 0.628 2.21 6.58 4.13
WL086 348491.9 6384635 0.569 3.007 4.89 2.78
WL087 348931.1 6384414 0.841 0.838 10.27 8.64
WL088 349419.8 6384220 0.716 2.131 4.54 3.25
WL089 349906.7 6384049 0.737 2.351 5.48 4.04
WL091 350839.7 6383702 0.680 1.891 3.75 2.55
WL092 351309.1 6383535 0.746 2.61 3.23 2.41
WL093 345201.5 6385827 0.763 1.466 7.09 5.41
WL095 345298.4 6385800 0.827 1.602 7.05 5.83
WL096 345346.7 6385778 0.715 2.135 4.32 3.09
WL097 345392.6 6385762 0.739 1.326 8.76 6.47
WL099 345483 6385730 0.753 0.362 1.58 1.19
WL100 345532.9 6385711 0.750 0.375 0.56 0.42
WL101 345571.5 6385683 0.772 2.264 3.16 2.44
WL102 345626.1 6385679 0.697 2.888 5.84 4.07
WL103 345673.3 6385659 0.704 2.297 4.25 2.99
WL104 345715 6385641 0.725 2.72 3.6 2.61
WL105 344633.6 6386099 0.650 3.283 3.34 2.17
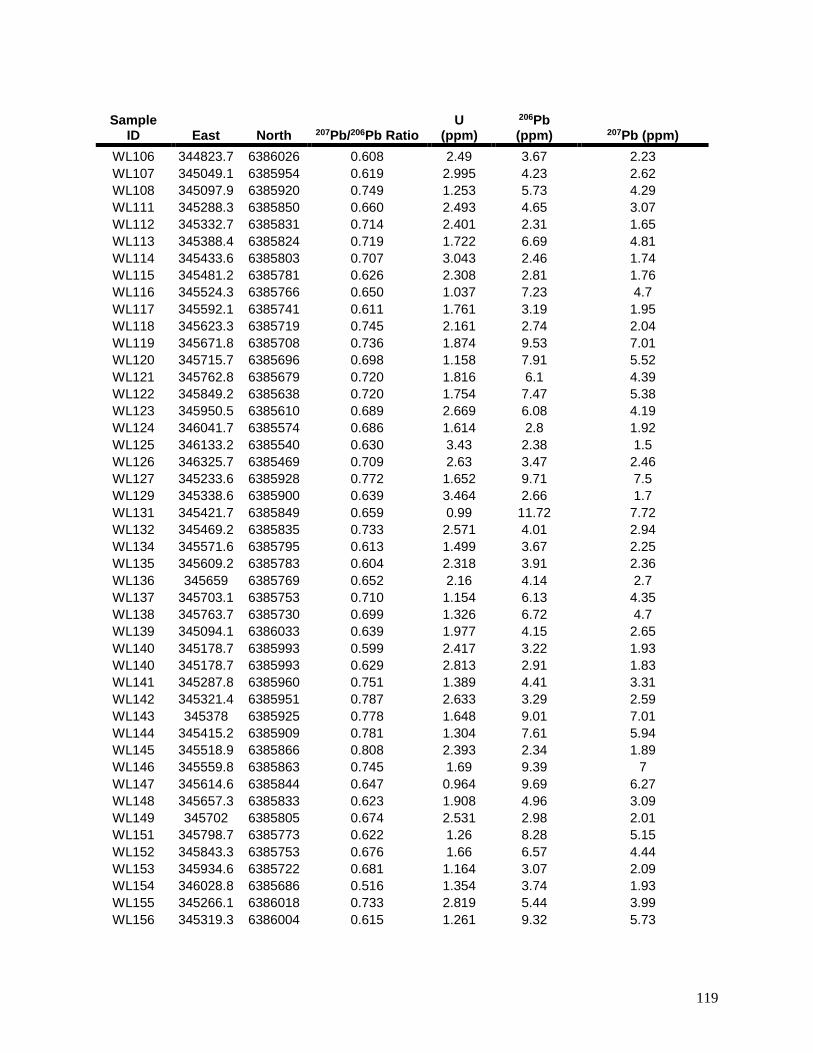
119
Sample
ID East North 207Pb/206Pb Ratio U
(ppm)
206Pb (ppm) 207Pb (ppm)
WL106 344823.7 6386026 0.608 2.49 3.67 2.23
WL107 345049.1 6385954 0.619 2.995 4.23 2.62
WL108 345097.9 6385920 0.749 1.253 5.73 4.29
WL111 345288.3 6385850 0.660 2.493 4.65 3.07
WL112 345332.7 6385831 0.714 2.401 2.31 1.65
WL113 345388.4 6385824 0.719 1.722 6.69 4.81
WL114 345433.6 6385803 0.707 3.043 2.46 1.74
WL115 345481.2 6385781 0.626 2.308 2.81 1.76
WL116 345524.3 6385766 0.650 1.037 7.23 4.7
WL117 345592.1 6385741 0.611 1.761 3.19 1.95
WL118 345623.3 6385719 0.745 2.161 2.74 2.04
WL119 345671.8 6385708 0.736 1.874 9.53 7.01
WL120 345715.7 6385696 0.698 1.158 7.91 5.52
WL121 345762.8 6385679 0.720 1.816 6.1 4.39
WL122 345849.2 6385638 0.720 1.754 7.47 5.38
WL123 345950.5 6385610 0.689 2.669 6.08 4.19
WL124 346041.7 6385574 0.686 1.614 2.8 1.92
WL125 346133.2 6385540 0.630 3.43 2.38 1.5
WL126 346325.7 6385469 0.709 2.63 3.47 2.46
WL127 345233.6 6385928 0.772 1.652 9.71 7.5
WL129 345338.6 6385900 0.639 3.464 2.66 1.7
WL131 345421.7 6385849 0.659 0.99 11.72 7.72
WL132 345469.2 6385835 0.733 2.571 4.01 2.94
WL134 345571.6 6385795 0.613 1.499 3.67 2.25
WL135 345609.2 6385783 0.604 2.318 3.91 2.36
WL136 345659 6385769 0.652 2.16 4.14 2.7
WL137 345703.1 6385753 0.710 1.154 6.13 4.35
WL138 345763.7 6385730 0.699 1.326 6.72 4.7
WL139 345094.1 6386033 0.639 1.977 4.15 2.65
WL140 345178.7 6385993 0.599 2.417 3.22 1.93
WL140 345178.7 6385993 0.629 2.813 2.91 1.83
WL141 345287.8 6385960 0.751 1.389 4.41 3.31
WL142 345321.4 6385951 0.787 2.633 3.29 2.59
WL143 345378 6385925 0.778 1.648 9.01 7.01
WL144 345415.2 6385909 0.781 1.304 7.61 5.94
WL145 345518.9 6385866 0.808 2.393 2.34 1.89
WL146 345559.8 6385863 0.745 1.69 9.39 7
WL147 345614.6 6385844 0.647 0.964 9.69 6.27
WL148 345657.3 6385833 0.623 1.908 4.96 3.09
WL149 345702 6385805 0.674 2.531 2.98 2.01
WL151 345798.7 6385773 0.622 1.26 8.28 5.15
WL152 345843.3 6385753 0.676 1.66 6.57 4.44
WL153 345934.6 6385722 0.681 1.164 3.07 2.09
WL154 346028.8 6385686 0.516 1.354 3.74 1.93
WL155 345266.1 6386018 0.733 2.819 5.44 3.99
WL156 345319.3 6386004 0.615 1.261 9.32 5.73
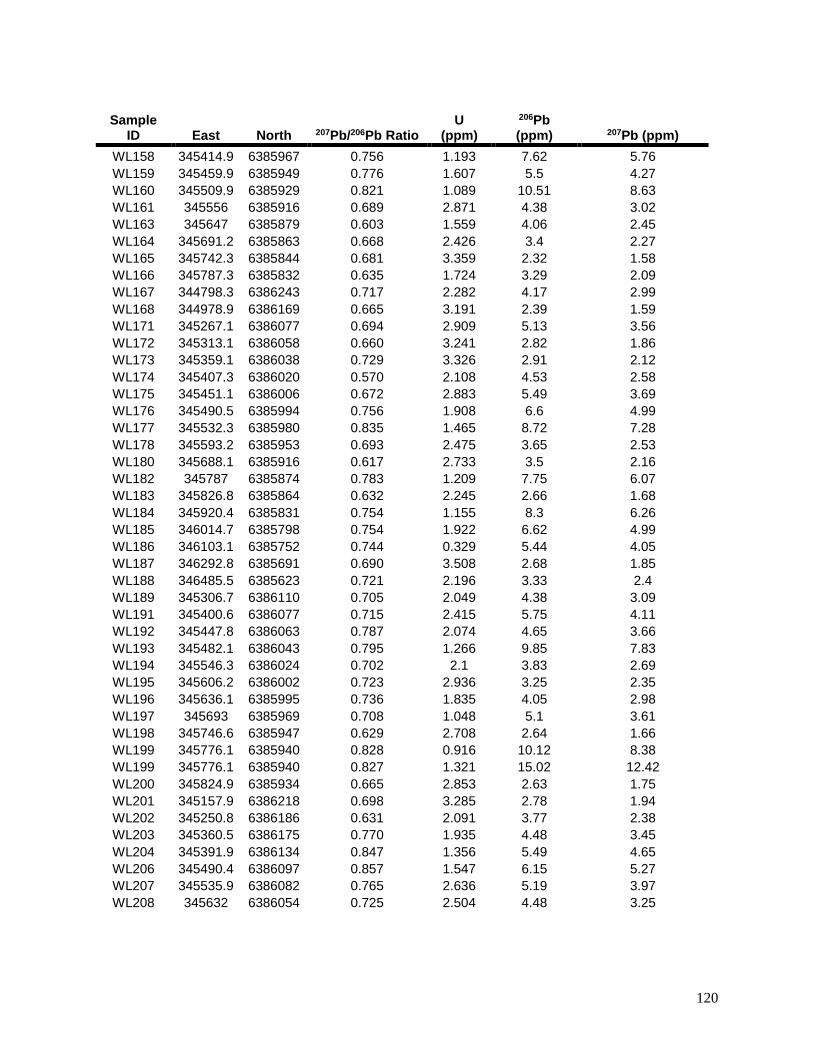
120
Sample
ID East North 207Pb/206Pb Ratio U
(ppm)
206Pb (ppm) 207Pb (ppm)
WL158 345414.9 6385967 0.756 1.193 7.62 5.76
WL159 345459.9 6385949 0.776 1.607 5.5 4.27
WL160 345509.9 6385929 0.821 1.089 10.51 8.63
WL161 345556 6385916 0.689 2.871 4.38 3.02
WL163 345647 6385879 0.603 1.559 4.06 2.45
WL164 345691.2 6385863 0.668 2.426 3.4 2.27
WL165 345742.3 6385844 0.681 3.359 2.32 1.58
WL166 345787.3 6385832 0.635 1.724 3.29 2.09
WL167 344798.3 6386243 0.717 2.282 4.17 2.99
WL168 344978.9 6386169 0.665 3.191 2.39 1.59
WL171 345267.1 6386077 0.694 2.909 5.13 3.56
WL172 345313.1 6386058 0.660 3.241 2.82 1.86
WL173 345359.1 6386038 0.729 3.326 2.91 2.12
WL174 345407.3 6386020 0.570 2.108 4.53 2.58
WL175 345451.1 6386006 0.672 2.883 5.49 3.69
WL176 345490.5 6385994 0.756 1.908 6.6 4.99
WL177 345532.3 6385980 0.835 1.465 8.72 7.28
WL178 345593.2 6385953 0.693 2.475 3.65 2.53
WL180 345688.1 6385916 0.617 2.733 3.5 2.16
WL182 345787 6385874 0.783 1.209 7.75 6.07
WL183 345826.8 6385864 0.632 2.245 2.66 1.68
WL184 345920.4 6385831 0.754 1.155 8.3 6.26
WL185 346014.7 6385798 0.754 1.922 6.62 4.99
WL186 346103.1 6385752 0.744 0.329 5.44 4.05
WL187 346292.8 6385691 0.690 3.508 2.68 1.85
WL188 346485.5 6385623 0.721 2.196 3.33 2.4
WL189 345306.7 6386110 0.705 2.049 4.38 3.09
WL191 345400.6 6386077 0.715 2.415 5.75 4.11
WL192 345447.8 6386063 0.787 2.074 4.65 3.66
WL193 345482.1 6386043 0.795 1.266 9.85 7.83
WL194 345546.3 6386024 0.702 2.1 3.83 2.69
WL195 345606.2 6386002 0.723 2.936 3.25 2.35
WL196 345636.1 6385995 0.736 1.835 4.05 2.98
WL197 345693 6385969 0.708 1.048 5.1 3.61
WL198 345746.6 6385947 0.629 2.708 2.64 1.66
WL199 345776.1 6385940 0.828 0.916 10.12 8.38
WL199 345776.1 6385940 0.827 1.321 15.02 12.42
WL200 345824.9 6385934 0.665 2.853 2.63 1.75
WL201 345157.9 6386218 0.698 3.285 2.78 1.94
WL202 345250.8 6386186 0.631 2.091 3.77 2.38
WL203 345360.5 6386175 0.770 1.935 4.48 3.45
WL204 345391.9 6386134 0.847 1.356 5.49 4.65
WL206 345490.4 6386097 0.857 1.547 6.15 5.27
WL207 345535.9 6386082 0.765 2.636 5.19 3.97
WL208 345632 6386054 0.725 2.504 4.48 3.25
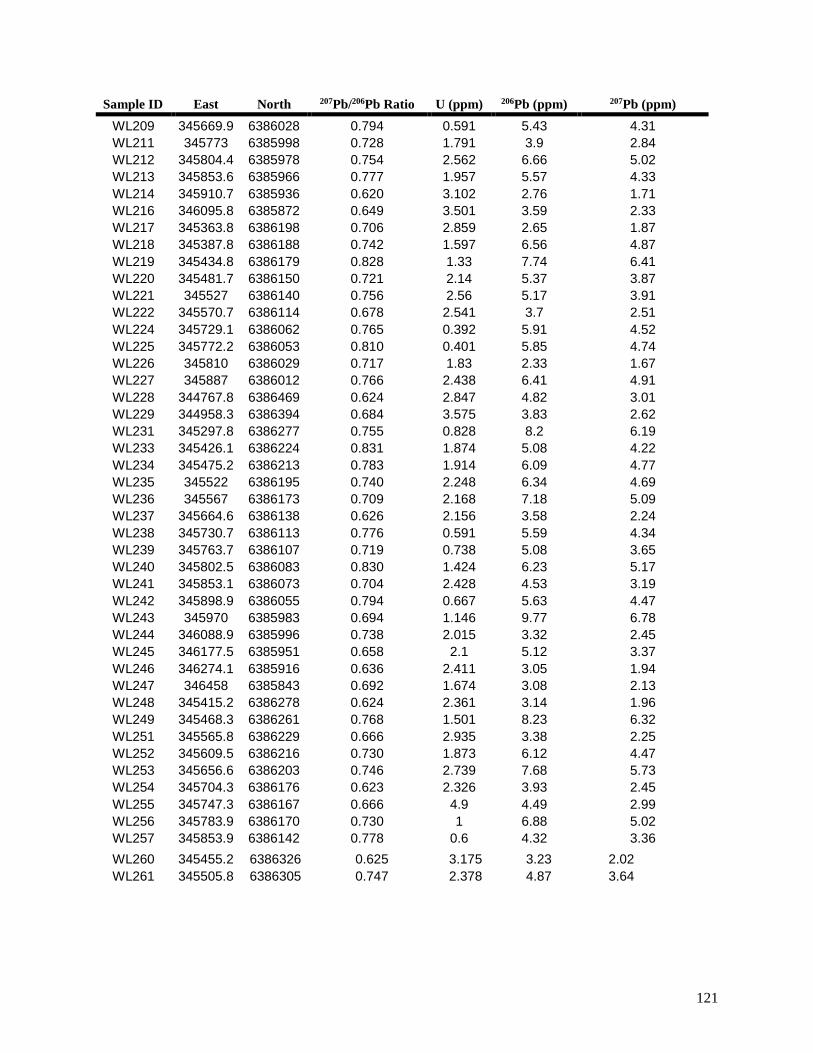
121
Sample ID East North 207Pb/206Pb Ratio U (ppm) 206Pb (ppm) 207Pb (ppm)
WL209 345669.9 6386028 0.794 0.591 5.43 4.31
WL211 345773 6385998 0.728 1.791 3.9 2.84
WL212 345804.4 6385978 0.754 2.562 6.66 5.02
WL213 345853.6 6385966 0.777 1.957 5.57 4.33
WL214 345910.7 6385936 0.620 3.102 2.76 1.71
WL216 346095.8 6385872 0.649 3.501 3.59 2.33
WL217 345363.8 6386198 0.706 2.859 2.65 1.87
WL218 345387.8 6386188 0.742 1.597 6.56 4.87
WL219 345434.8 6386179 0.828 1.33 7.74 6.41
WL220 345481.7 6386150 0.721 2.14 5.37 3.87
WL221 345527 6386140 0.756 2.56 5.17 3.91
WL222 345570.7 6386114 0.678 2.541 3.7 2.51
WL224 345729.1 6386062 0.765 0.392 5.91 4.52
WL225 345772.2 6386053 0.810 0.401 5.85 4.74
WL226 345810 6386029 0.717 1.83 2.33 1.67
WL227 345887 6386012 0.766 2.438 6.41 4.91
WL228 344767.8 6386469 0.624 2.847 4.82 3.01
WL229 344958.3 6386394 0.684 3.575 3.83 2.62
WL231 345297.8 6386277 0.755 0.828 8.2 6.19
WL233 345426.1 6386224 0.831 1.874 5.08 4.22
WL234 345475.2 6386213 0.783 1.914 6.09 4.77
WL235 345522 6386195 0.740 2.248 6.34 4.69
WL236 345567 6386173 0.709 2.168 7.18 5.09
WL237 345664.6 6386138 0.626 2.156 3.58 2.24
WL238 345730.7 6386113 0.776 0.591 5.59 4.34
WL239 345763.7 6386107 0.719 0.738 5.08 3.65
WL240 345802.5 6386083 0.830 1.424 6.23 5.17
WL241 345853.1 6386073 0.704 2.428 4.53 3.19
WL242 345898.9 6386055 0.794 0.667 5.63 4.47
WL243 345970 6385983 0.694 1.146 9.77 6.78
WL244 346088.9 6385996 0.738 2.015 3.32 2.45
WL245 346177.5 6385951 0.658 2.1 5.12 3.37
WL246 346274.1 6385916 0.636 2.411 3.05 1.94
WL247 346458 6385843 0.692 1.674 3.08 2.13
WL248 345415.2 6386278 0.624 2.361 3.14 1.96
WL249 345468.3 6386261 0.768 1.501 8.23 6.32
WL251 345565.8 6386229 0.666 2.935 3.38 2.25
WL252 345609.5 6386216 0.730 1.873 6.12 4.47
WL253 345656.6 6386203 0.746 2.739 7.68 5.73
WL254 345704.3 6386176 0.623 2.326 3.93 2.45
WL255 345747.3 6386167 0.666 4.9 4.49 2.99
WL256 345783.9 6386170 0.730 1 6.88 5.02
WL257 345853.9 6386142 0.778 0.6 4.32 3.36
WL260 345455.2 6386326 0.625 3.175 3.23 2.02
WL261 345505.8 6386305 0.747 2.378 4.87 3.64
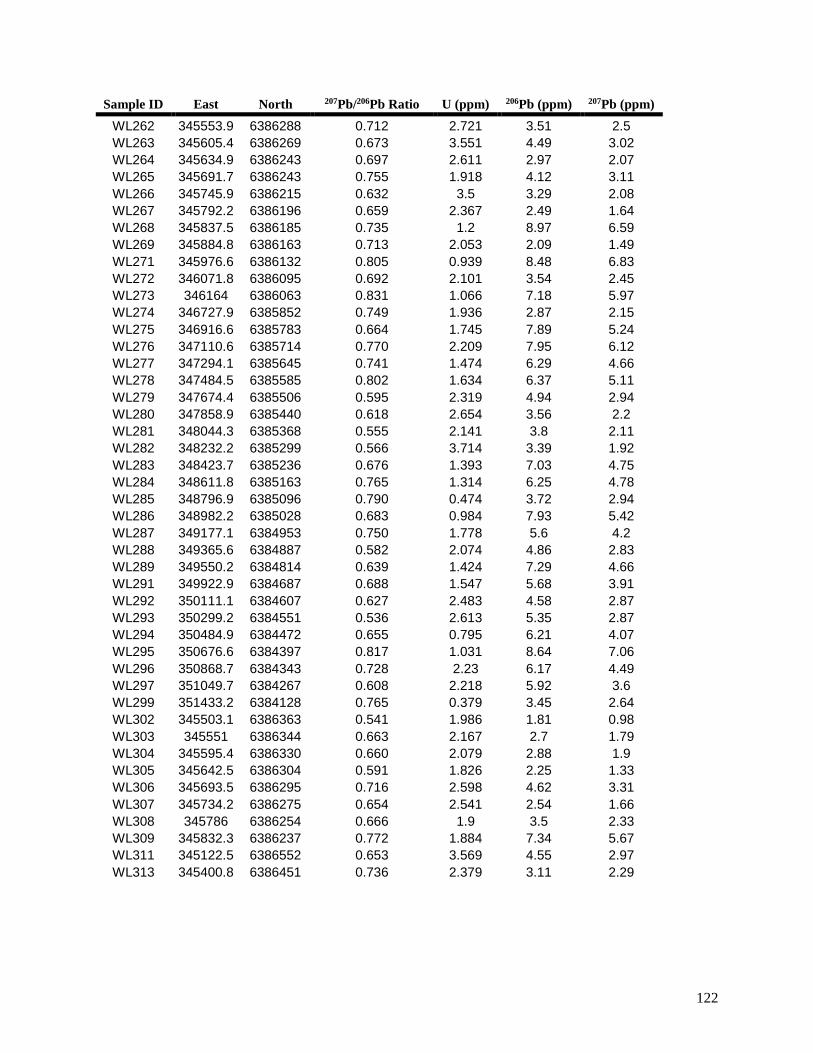
122
Sample ID East North 207Pb/206Pb Ratio U (ppm) 206Pb (ppm) 207Pb (ppm)
WL262 345553.9 6386288 0.712 2.721 3.51 2.5
WL263 345605.4 6386269 0.673 3.551 4.49 3.02
WL264 345634.9 6386243 0.697 2.611 2.97 2.07
WL265 345691.7 6386243 0.755 1.918 4.12 3.11
WL266 345745.9 6386215 0.632 3.5 3.29 2.08
WL267 345792.2 6386196 0.659 2.367 2.49 1.64
WL268 345837.5 6386185 0.735 1.2 8.97 6.59
WL269 345884.8 6386163 0.713 2.053 2.09 1.49
WL271 345976.6 6386132 0.805 0.939 8.48 6.83
WL272 346071.8 6386095 0.692 2.101 3.54 2.45
WL273 346164 6386063 0.831 1.066 7.18 5.97
WL274 346727.9 6385852 0.749 1.936 2.87 2.15
WL275 346916.6 6385783 0.664 1.745 7.89 5.24
WL276 347110.6 6385714 0.770 2.209 7.95 6.12
WL277 347294.1 6385645 0.741 1.474 6.29 4.66
WL278 347484.5 6385585 0.802 1.634 6.37 5.11
WL279 347674.4 6385506 0.595 2.319 4.94 2.94
WL280 347858.9 6385440 0.618 2.654 3.56 2.2
WL281 348044.3 6385368 0.555 2.141 3.8 2.11
WL282 348232.2 6385299 0.566 3.714 3.39 1.92
WL283 348423.7 6385236 0.676 1.393 7.03 4.75
WL284 348611.8 6385163 0.765 1.314 6.25 4.78
WL285 348796.9 6385096 0.790 0.474 3.72 2.94
WL286 348982.2 6385028 0.683 0.984 7.93 5.42
WL287 349177.1 6384953 0.750 1.778 5.6 4.2
WL288 349365.6 6384887 0.582 2.074 4.86 2.83
WL289 349550.2 6384814 0.639 1.424 7.29 4.66
WL291 349922.9 6384687 0.688 1.547 5.68 3.91
WL292 350111.1 6384607 0.627 2.483 4.58 2.87
WL293 350299.2 6384551 0.536 2.613 5.35 2.87
WL294 350484.9 6384472 0.655 0.795 6.21 4.07
WL295 350676.6 6384397 0.817 1.031 8.64 7.06
WL296 350868.7 6384343 0.728 2.23 6.17 4.49
WL297 351049.7 6384267 0.608 2.218 5.92 3.6
WL299 351433.2 6384128 0.765 0.379 3.45 2.64
WL302 345503.1 6386363 0.541 1.986 1.81 0.98
WL303 345551 6386344 0.663 2.167 2.7 1.79
WL304 345595.4 6386330 0.660 2.079 2.88 1.9
WL305 345642.5 6386304 0.591 1.826 2.25 1.33
WL306 345693.5 6386295 0.716 2.598 4.62 3.31
WL307 345734.2 6386275 0.654 2.541 2.54 1.66
WL308 345786 6386254 0.666 1.9 3.5 2.33
WL309 345832.3 6386237 0.772 1.884 7.34 5.67
WL311 345122.5 6386552 0.653 3.569 4.55 2.97
WL313 345400.8 6386451 0.736 2.379 3.11 2.29
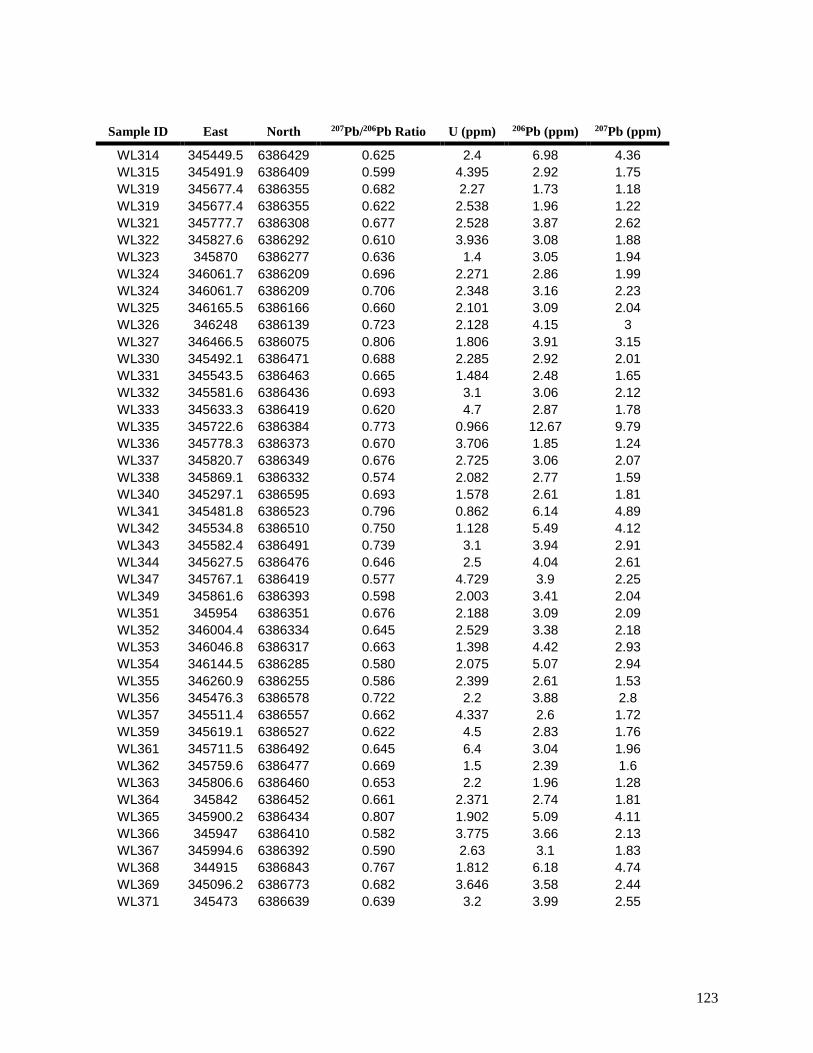
123
Sample ID East North 207Pb/206Pb Ratio U (ppm) 206Pb (ppm) 207Pb (ppm)
WL314 345449.5 6386429 0.625 2.4 6.98 4.36
WL315 345491.9 6386409 0.599 4.395 2.92 1.75
WL319 345677.4 6386355 0.682 2.27 1.73 1.18
WL319 345677.4 6386355 0.622 2.538 1.96 1.22
WL321 345777.7 6386308 0.677 2.528 3.87 2.62
WL322 345827.6 6386292 0.610 3.936 3.08 1.88
WL323 345870 6386277 0.636 1.4 3.05 1.94
WL324 346061.7 6386209 0.696 2.271 2.86 1.99
WL324 346061.7 6386209 0.706 2.348 3.16 2.23
WL325 346165.5 6386166 0.660 2.101 3.09 2.04
WL326 346248 6386139 0.723 2.128 4.15 3
WL327 346466.5 6386075 0.806 1.806 3.91 3.15
WL330 345492.1 6386471 0.688 2.285 2.92 2.01
WL331 345543.5 6386463 0.665 1.484 2.48 1.65
WL332 345581.6 6386436 0.693 3.1 3.06 2.12
WL333 345633.3 6386419 0.620 4.7 2.87 1.78
WL335 345722.6 6386384 0.773 0.966 12.67 9.79
WL336 345778.3 6386373 0.670 3.706 1.85 1.24
WL337 345820.7 6386349 0.676 2.725 3.06 2.07
WL338 345869.1 6386332 0.574 2.082 2.77 1.59
WL340 345297.1 6386595 0.693 1.578 2.61 1.81
WL341 345481.8 6386523 0.796 0.862 6.14 4.89
WL342 345534.8 6386510 0.750 1.128 5.49 4.12
WL343 345582.4 6386491 0.739 3.1 3.94 2.91
WL344 345627.5 6386476 0.646 2.5 4.04 2.61
WL347 345767.1 6386419 0.577 4.729 3.9 2.25
WL349 345861.6 6386393 0.598 2.003 3.41 2.04
WL351 345954 6386351 0.676 2.188 3.09 2.09
WL352 346004.4 6386334 0.645 2.529 3.38 2.18
WL353 346046.8 6386317 0.663 1.398 4.42 2.93
WL354 346144.5 6386285 0.580 2.075 5.07 2.94
WL355 346260.9 6386255 0.586 2.399 2.61 1.53
WL356 345476.3 6386578 0.722 2.2 3.88 2.8
WL357 345511.4 6386557 0.662 4.337 2.6 1.72
WL359 345619.1 6386527 0.622 4.5 2.83 1.76
WL361 345711.5 6386492 0.645 6.4 3.04 1.96
WL362 345759.6 6386477 0.669 1.5 2.39 1.6
WL363 345806.6 6386460 0.653 2.2 1.96 1.28
WL364 345842 6386452 0.661 2.371 2.74 1.81
WL365 345900.2 6386434 0.807 1.902 5.09 4.11
WL366 345947 6386410 0.582 3.775 3.66 2.13
WL367 345994.6 6386392 0.590 2.63 3.1 1.83
WL368 344915 6386843 0.767 1.812 6.18 4.74
WL369 345096.2 6386773 0.682 3.646 3.58 2.44
WL371 345473 6386639 0.639 3.2 3.99 2.55
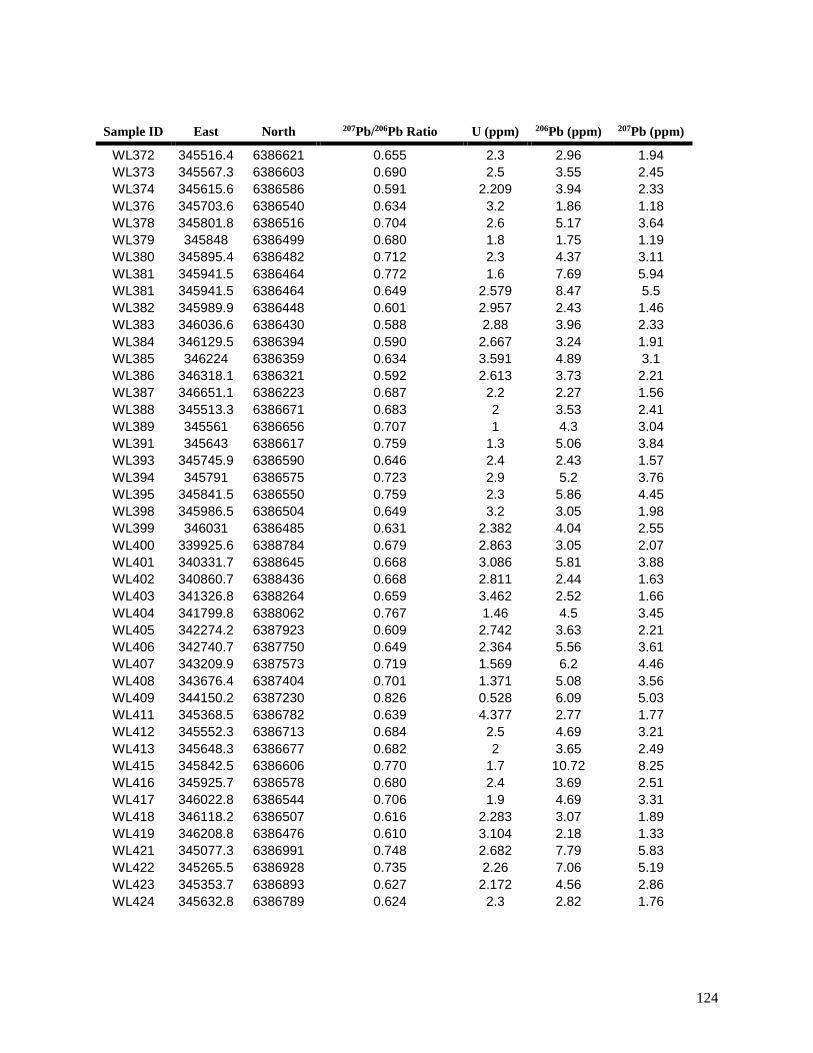
124
Sample ID East North 207Pb/206Pb Ratio U (ppm) 206Pb (ppm) 207Pb (ppm)
WL372 345516.4 6386621 0.655 2.3 2.96 1.94
WL373 345567.3 6386603 0.690 2.5 3.55 2.45
WL374 345615.6 6386586 0.591 2.209 3.94 2.33
WL376 345703.6 6386540 0.634 3.2 1.86 1.18
WL378 345801.8 6386516 0.704 2.6 5.17 3.64
WL379 345848 6386499 0.680 1.8 1.75 1.19
WL380 345895.4 6386482 0.712 2.3 4.37 3.11
WL381 345941.5 6386464 0.772 1.6 7.69 5.94
WL381 345941.5 6386464 0.649 2.579 8.47 5.5
WL382 345989.9 6386448 0.601 2.957 2.43 1.46
WL383 346036.6 6386430 0.588 2.88 3.96 2.33
WL384 346129.5 6386394 0.590 2.667 3.24 1.91
WL385 346224 6386359 0.634 3.591 4.89 3.1
WL386 346318.1 6386321 0.592 2.613 3.73 2.21
WL387 346651.1 6386223 0.687 2.2 2.27 1.56
WL388 345513.3 6386671 0.683 2 3.53 2.41
WL389 345561 6386656 0.707 1 4.3 3.04
WL391 345643 6386617 0.759 1.3 5.06 3.84
WL393 345745.9 6386590 0.646 2.4 2.43 1.57
WL394 345791 6386575 0.723 2.9 5.2 3.76
WL395 345841.5 6386550 0.759 2.3 5.86 4.45
WL398 345986.5 6386504 0.649 3.2 3.05 1.98
WL399 346031 6386485 0.631 2.382 4.04 2.55
WL400 339925.6 6388784 0.679 2.863 3.05 2.07
WL401 340331.7 6388645 0.668 3.086 5.81 3.88
WL402 340860.7 6388436 0.668 2.811 2.44 1.63
WL403 341326.8 6388264 0.659 3.462 2.52 1.66
WL404 341799.8 6388062 0.767 1.46 4.5 3.45
WL405 342274.2 6387923 0.609 2.742 3.63 2.21
WL406 342740.7 6387750 0.649 2.364 5.56 3.61
WL407 343209.9 6387573 0.719 1.569 6.2 4.46
WL408 343676.4 6387404 0.701 1.371 5.08 3.56
WL409 344150.2 6387230 0.826 0.528 6.09 5.03
WL411 345368.5 6386782 0.639 4.377 2.77 1.77
WL412 345552.3 6386713 0.684 2.5 4.69 3.21
WL413 345648.3 6386677 0.682 2 3.65 2.49
WL415 345842.5 6386606 0.770 1.7 10.72 8.25
WL416 345925.7 6386578 0.680 2.4 3.69 2.51
WL417 346022.8 6386544 0.706 1.9 4.69 3.31
WL418 346118.2 6386507 0.616 2.283 3.07 1.89
WL419 346208.8 6386476 0.610 3.104 2.18 1.33
WL421 345077.3 6386991 0.748 2.682 7.79 5.83
WL422 345265.5 6386928 0.735 2.26 7.06 5.19
WL423 345353.7 6386893 0.627 2.172 4.56 2.86
WL424 345632.8 6386789 0.624 2.3 2.82 1.76
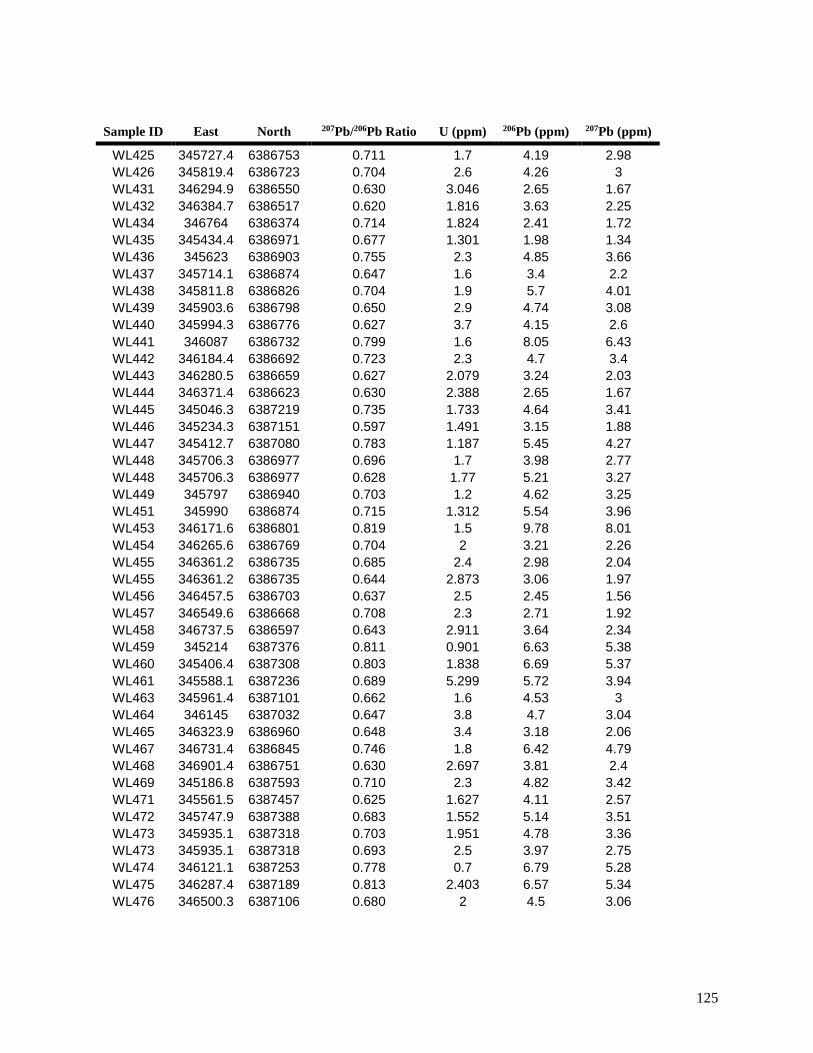
125
Sample ID East North 207Pb/206Pb Ratio U (ppm) 206Pb (ppm) 207Pb (ppm)
WL425 345727.4 6386753 0.711 1.7 4.19 2.98
WL426 345819.4 6386723 0.704 2.6 4.26 3
WL431 346294.9 6386550 0.630 3.046 2.65 1.67
WL432 346384.7 6386517 0.620 1.816 3.63 2.25
WL434 346764 6386374 0.714 1.824 2.41 1.72
WL435 345434.4 6386971 0.677 1.301 1.98 1.34
WL436 345623 6386903 0.755 2.3 4.85 3.66
WL437 345714.1 6386874 0.647 1.6 3.4 2.2
WL438 345811.8 6386826 0.704 1.9 5.7 4.01
WL439 345903.6 6386798 0.650 2.9 4.74 3.08
WL440 345994.3 6386776 0.627 3.7 4.15 2.6
WL441 346087 6386732 0.799 1.6 8.05 6.43
WL442 346184.4 6386692 0.723 2.3 4.7 3.4
WL443 346280.5 6386659 0.627 2.079 3.24 2.03
WL444 346371.4 6386623 0.630 2.388 2.65 1.67
WL445 345046.3 6387219 0.735 1.733 4.64 3.41
WL446 345234.3 6387151 0.597 1.491 3.15 1.88
WL447 345412.7 6387080 0.783 1.187 5.45 4.27
WL448 345706.3 6386977 0.696 1.7 3.98 2.77
WL448 345706.3 6386977 0.628 1.77 5.21 3.27
WL449 345797 6386940 0.703 1.2 4.62 3.25
WL451 345990 6386874 0.715 1.312 5.54 3.96
WL453 346171.6 6386801 0.819 1.5 9.78 8.01
WL454 346265.6 6386769 0.704 2 3.21 2.26
WL455 346361.2 6386735 0.685 2.4 2.98 2.04
WL455 346361.2 6386735 0.644 2.873 3.06 1.97
WL456 346457.5 6386703 0.637 2.5 2.45 1.56
WL457 346549.6 6386668 0.708 2.3 2.71 1.92
WL458 346737.5 6386597 0.643 2.911 3.64 2.34
WL459 345214 6387376 0.811 0.901 6.63 5.38
WL460 345406.4 6387308 0.803 1.838 6.69 5.37
WL461 345588.1 6387236 0.689 5.299 5.72 3.94
WL463 345961.4 6387101 0.662 1.6 4.53 3
WL464 346145 6387032 0.647 3.8 4.7 3.04
WL465 346323.9 6386960 0.648 3.4 3.18 2.06
WL467 346731.4 6386845 0.746 1.8 6.42 4.79
WL468 346901.4 6386751 0.630 2.697 3.81 2.4
WL469 345186.8 6387593 0.710 2.3 4.82 3.42
WL471 345561.5 6387457 0.625 1.627 4.11 2.57
WL472 345747.9 6387388 0.683 1.552 5.14 3.51
WL473 345935.1 6387318 0.703 1.951 4.78 3.36
WL473 345935.1 6387318 0.693 2.5 3.97 2.75
WL474 346121.1 6387253 0.778 0.7 6.79 5.28
WL475 346287.4 6387189 0.813 2.403 6.57 5.34
WL476 346500.3 6387106 0.680 2 4.5 3.06
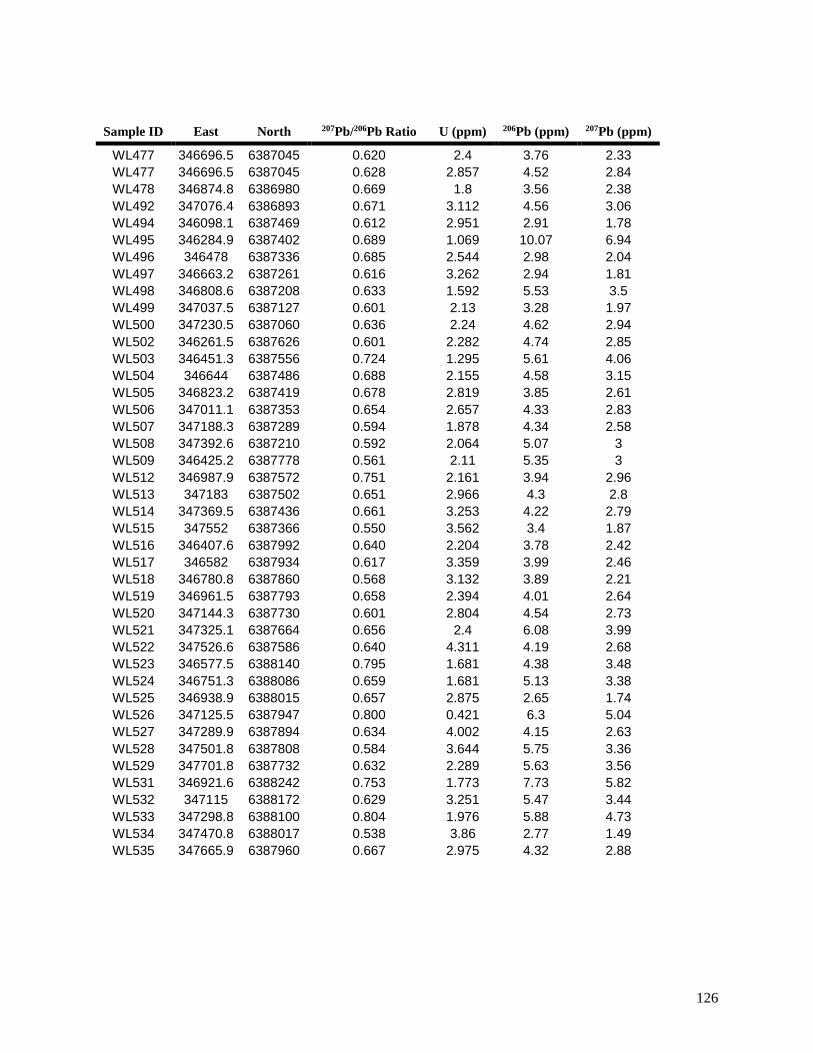
126
Sample ID East North 207Pb/206Pb Ratio U (ppm) 206Pb (ppm) 207Pb (ppm)
WL477 346696.5 6387045 0.620 2.4 3.76 2.33
WL477 346696.5 6387045 0.628 2.857 4.52 2.84
WL478 346874.8 6386980 0.669 1.8 3.56 2.38
WL492 347076.4 6386893 0.671 3.112 4.56 3.06
WL494 346098.1 6387469 0.612 2.951 2.91 1.78
WL495 346284.9 6387402 0.689 1.069 10.07 6.94
WL496 346478 6387336 0.685 2.544 2.98 2.04
WL497 346663.2 6387261 0.616 3.262 2.94 1.81
WL498 346808.6 6387208 0.633 1.592 5.53 3.5
WL499 347037.5 6387127 0.601 2.13 3.28 1.97
WL500 347230.5 6387060 0.636 2.24 4.62 2.94
WL502 346261.5 6387626 0.601 2.282 4.74 2.85
WL503 346451.3 6387556 0.724 1.295 5.61 4.06
WL504 346644 6387486 0.688 2.155 4.58 3.15
WL505 346823.2 6387419 0.678 2.819 3.85 2.61
WL506 347011.1 6387353 0.654 2.657 4.33 2.83
WL507 347188.3 6387289 0.594 1.878 4.34 2.58
WL508 347392.6 6387210 0.592 2.064 5.07 3
WL509 346425.2 6387778 0.561 2.11 5.35 3
WL512 346987.9 6387572 0.751 2.161 3.94 2.96
WL513 347183 6387502 0.651 2.966 4.3 2.8
WL514 347369.5 6387436 0.661 3.253 4.22 2.79
WL515 347552 6387366 0.550 3.562 3.4 1.87
WL516 346407.6 6387992 0.640 2.204 3.78 2.42
WL517 346582 6387934 0.617 3.359 3.99 2.46
WL518 346780.8 6387860 0.568 3.132 3.89 2.21
WL519 346961.5 6387793 0.658 2.394 4.01 2.64
WL520 347144.3 6387730 0.601 2.804 4.54 2.73
WL521 347325.1 6387664 0.656 2.4 6.08 3.99
WL522 347526.6 6387586 0.640 4.311 4.19 2.68
WL523 346577.5 6388140 0.795 1.681 4.38 3.48
WL524 346751.3 6388086 0.659 1.681 5.13 3.38
WL525 346938.9 6388015 0.657 2.875 2.65 1.74
WL526 347125.5 6387947 0.800 0.421 6.3 5.04
WL527 347289.9 6387894 0.634 4.002 4.15 2.63
WL528 347501.8 6387808 0.584 3.644 5.75 3.36
WL529 347701.8 6387732 0.632 2.289 5.63 3.56
WL531 346921.6 6388242 0.753 1.773 7.73 5.82
WL532 347115 6388172 0.629 3.251 5.47 3.44
WL533 347298.8 6388100 0.804 1.976 5.88 4.73
WL534 347470.8 6388017 0.538 3.86 2.77 1.49
WL535 347665.9 6387960 0.667 2.975 4.32 2.88
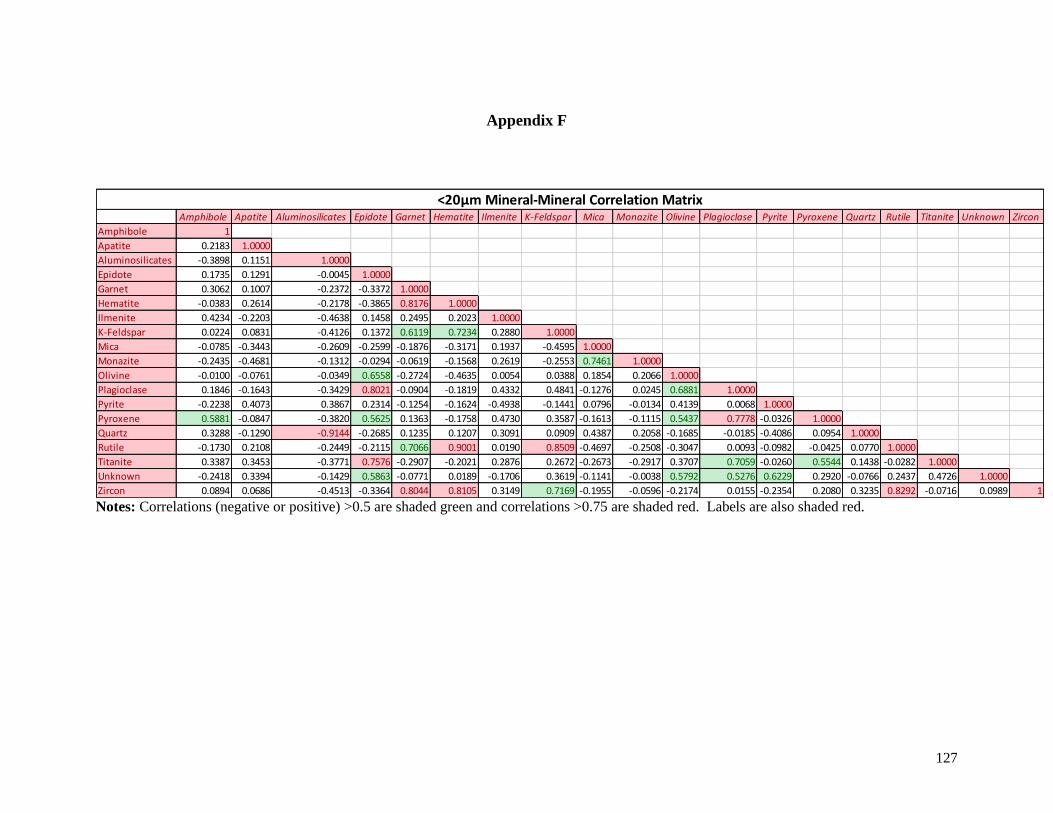
127
Appendix F
Notes: Correlations (negative or positive) >0.5 are shaded green and correlations >0.75 are shaded red. Labels are also shaded red.
Amphibole Apatite Aluminosilicates Epidote Garnet Hematite Ilmenite K-Feldspar Mica Monazite Olivine Plagioclase Pyrite Pyroxene Quartz Rutile Titanite Unknown Zircon
Amphibole 1
Apatite 0.2183 1.0000
Aluminosilicates -0.3898 0.1151 1.0000
Epidote 0.1735 0.1291 -0.0045 1.0000
Garnet 0.3062 0.1007 -0.2372 -0.3372 1.0000
Hematite -0.0383 0.2614 -0.2178 -0.3865 0.8176 1.0000
Ilmenite 0.4234 -0.2203 -0.4638 0.1458 0.2495 0.2023 1.0000
K-Feldspar 0.0224 0.0831 -0.4126 0.1372 0.6119 0.7234 0.2880 1.0000
Mica -0.0785 -0.3443 -0.2609 -0.2599 -0.1876 -0.3171 0.1937 -0.4595 1.0000
Monazite -0.2435 -0.4681 -0.1312 -0.0294 -0.0619 -0.1568 0.2619 -0.2553 0.7461 1.0000
Olivine -0.0100 -0.0761 -0.0349 0.6558 -0.2724 -0.4635 0.0054 0.0388 0.1854 0.2066 1.0000
Plagioclase 0.1846 -0.1643 -0.3429 0.8021 -0.0904 -0.1819 0.4332 0.4841 -0.1276 0.0245 0.6881 1.0000
Pyrite -0.2238 0.4073 0.3867 0.2314 -0.1254 -0.1624 -0.4938 -0.1441 0.0796 -0.0134 0.4139 0.0068 1.0000
Pyroxene 0.5881 -0.0847 -0.3820 0.5625 0.1363 -0.1758 0.4730 0.3587 -0.1613 -0.1115 0.5437 0.7778 -0.0326 1.0000
Quartz 0.3288 -0.1290 -0.9144 -0.2685 0.1235 0.1207 0.3091 0.0909 0.4387 0.2058 -0.1685 -0.0185 -0.4086 0.0954 1.0000
Rutile -0.1730 0.2108 -0.2449 -0.2115 0.7066 0.9001 0.0190 0.8509 -0.4697 -0.2508 -0.3047 0.0093 -0.0982 -0.0425 0.0770 1.0000
Titanite 0.3387 0.3453 -0.3771 0.7576 -0.2907 -0.2021 0.2876 0.2672 -0.2673 -0.2917 0.3707 0.7059 -0.0260 0.5544 0.1438 -0.0282 1.0000
Unknown -0.2418 0.3394 -0.1429 0.5863 -0.0771 0.0189 -0.1706 0.3619 -0.1141 -0.0038 0.5792 0.5276 0.6229 0.2920 -0.0766 0.2437 0.4726 1.0000
Zircon 0.0894 0.0686 -0.4513 -0.3364 0.8044 0.8105 0.3149 0.7169 -0.1955 -0.0596 -0.2174 0.0155 -0.2354 0.2080 0.3235 0.8292 -0.0716 0.0989 1
<20µm Mineral-Mineral Correlation Matrix
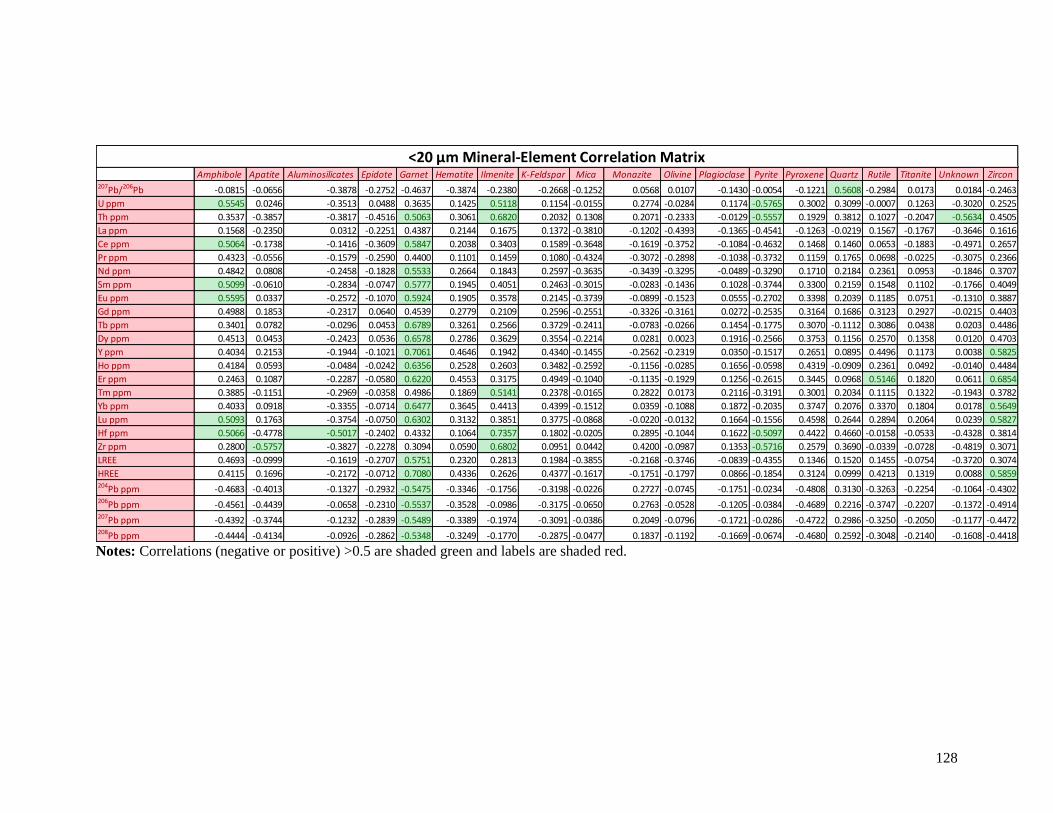
128
Notes: Correlations (negative or positive) >0.5 are shaded green and labels are shaded red.
Amphibole Apatite Aluminosilicates Epidote Garnet Hematite Ilmenite K-Feldspar Mica Monazite Olivine Plagioclase Pyrite Pyroxene Quartz Rutile Titanite Unknown Zircon207Pb/206Pb -0.0815 -0.0656 -0.3878 -0.2752 -0.4637 -0.3874 -0.2380 -0.2668 -0.1252 0.0568 0.0107 -0.1430 -0.0054 -0.1221 0.5608 -0.2984 0.0173 0.0184 -0.2463
U ppm 0.5545 0.0246 -0.3513 0.0488 0.3635 0.1425 0.5118 0.1154 -0.0155 0.2774 -0.0284 0.1174 -0.5765 0.3002 0.3099 -0.0007 0.1263 -0.3020 0.2525
Th ppm 0.3537 -0.3857 -0.3817 -0.4516 0.5063 0.3061 0.6820 0.2032 0.1308 0.2071 -0.2333 -0.0129 -0.5557 0.1929 0.3812 0.1027 -0.2047 -0.5634 0.4505
La ppm 0.1568 -0.2350 0.0312 -0.2251 0.4387 0.2144 0.1675 0.1372 -0.3810 -0.1202 -0.4393 -0.1365 -0.4541 -0.1263 -0.0219 0.1567 -0.1767 -0.3646 0.1616
Ce ppm 0.5064 -0.1738 -0.1416 -0.3609 0.5847 0.2038 0.3403 0.1589 -0.3648 -0.1619 -0.3752 -0.1084 -0.4632 0.1468 0.1460 0.0653 -0.1883 -0.4971 0.2657
Pr ppm 0.4323 -0.0556 -0.1579 -0.2590 0.4400 0.1101 0.1459 0.1080 -0.4324 -0.3072 -0.2898 -0.1038 -0.3732 0.1159 0.1765 0.0698 -0.0225 -0.3075 0.2366
Nd ppm 0.4842 0.0808 -0.2458 -0.1828 0.5533 0.2664 0.1843 0.2597 -0.3635 -0.3439 -0.3295 -0.0489 -0.3290 0.1710 0.2184 0.2361 0.0953 -0.1846 0.3707
Sm ppm 0.5099 -0.0610 -0.2834 -0.0747 0.5777 0.1945 0.4051 0.2463 -0.3015 -0.0283 -0.1436 0.1028 -0.3744 0.3300 0.2159 0.1548 0.1102 -0.1766 0.4049
Eu ppm 0.5595 0.0337 -0.2572 -0.1070 0.5924 0.1905 0.3578 0.2145 -0.3739 -0.0899 -0.1523 0.0555 -0.2702 0.3398 0.2039 0.1185 0.0751 -0.1310 0.3887
Gd ppm 0.4988 0.1853 -0.2317 0.0640 0.4539 0.2779 0.2109 0.2596 -0.2551 -0.3326 -0.3161 0.0272 -0.2535 0.3164 0.1686 0.3123 0.2927 -0.0215 0.4403
Tb ppm 0.3401 0.0782 -0.0296 0.0453 0.6789 0.3261 0.2566 0.3729 -0.2411 -0.0783 -0.0266 0.1454 -0.1775 0.3070 -0.1112 0.3086 0.0438 0.0203 0.4486
Dy ppm 0.4513 0.0453 -0.2423 0.0536 0.6578 0.2786 0.3629 0.3554 -0.2214 0.0281 0.0023 0.1916 -0.2566 0.3753 0.1156 0.2570 0.1358 0.0120 0.4703
Y ppm 0.4034 0.2153 -0.1944 -0.1021 0.7061 0.4646 0.1942 0.4340 -0.1455 -0.2562 -0.2319 0.0350 -0.1517 0.2651 0.0895 0.4496 0.1173 0.0038 0.5825
Ho ppm 0.4184 0.0593 -0.0484 -0.0242 0.6356 0.2528 0.2603 0.3482 -0.2592 -0.1156 -0.0285 0.1656 -0.0598 0.4319 -0.0909 0.2361 0.0492 -0.0140 0.4484
Er ppm 0.2463 0.1087 -0.2287 -0.0580 0.6220 0.4553 0.3175 0.4949 -0.1040 -0.1135 -0.1929 0.1256 -0.2615 0.3445 0.0968 0.5146 0.1820 0.0611 0.6854
Tm ppm 0.3885 -0.1151 -0.2969 -0.0358 0.4986 0.1869 0.5141 0.2378 -0.0165 0.2822 0.0173 0.2116 -0.3191 0.3001 0.2034 0.1115 0.1322 -0.1943 0.3782
Yb ppm 0.4033 0.0918 -0.3355 -0.0714 0.6477 0.3645 0.4413 0.4399 -0.1512 0.0359 -0.1088 0.1872 -0.2035 0.3747 0.2076 0.3370 0.1804 0.0178 0.5649
Lu ppm 0.5093 0.1763 -0.3754 -0.0750 0.6302 0.3132 0.3851 0.3775 -0.0868 -0.0220 -0.0132 0.1664 -0.1556 0.4598 0.2644 0.2894 0.2064 0.0239 0.5827
Hf ppm 0.5066 -0.4778 -0.5017 -0.2402 0.4332 0.1064 0.7357 0.1802 -0.0205 0.2895 -0.1044 0.1622 -0.5097 0.4422 0.4660 -0.0158 -0.0533 -0.4328 0.3814
Zr ppm 0.2800 -0.5757 -0.3827 -0.2278 0.3094 0.0590 0.6802 0.0951 0.0442 0.4200 -0.0987 0.1353 -0.5716 0.2579 0.3690 -0.0339 -0.0728 -0.4819 0.3071
LREE 0.4693 -0.0999 -0.1619 -0.2707 0.5751 0.2320 0.2813 0.1984 -0.3855 -0.2168 -0.3746 -0.0839 -0.4355 0.1346 0.1520 0.1455 -0.0754 -0.3720 0.3074
HREE 0.4115 0.1696 -0.2172 -0.0712 0.7080 0.4336 0.2626 0.4377 -0.1617 -0.1751 -0.1797 0.0866 -0.1854 0.3124 0.0999 0.4213 0.1319 0.0088 0.5859204Pb ppm -0.4683 -0.4013 -0.1327 -0.2932 -0.5475 -0.3346 -0.1756 -0.3198 -0.0226 0.2727 -0.0745 -0.1751 -0.0234 -0.4808 0.3130 -0.3263 -0.2254 -0.1064 -0.4302206Pb ppm -0.4561 -0.4439 -0.0658 -0.2310 -0.5537 -0.3528 -0.0986 -0.3175 -0.0650 0.2763 -0.0528 -0.1205 -0.0384 -0.4689 0.2216 -0.3747 -0.2207 -0.1372 -0.4914207Pb ppm -0.4392 -0.3744 -0.1232 -0.2839 -0.5489 -0.3389 -0.1974 -0.3091 -0.0386 0.2049 -0.0796 -0.1721 -0.0286 -0.4722 0.2986 -0.3250 -0.2050 -0.1177 -0.4472208Pb ppm -0.4444 -0.4134 -0.0926 -0.2862 -0.5348 -0.3249 -0.1770 -0.2875 -0.0477 0.1837 -0.1192 -0.1669 -0.0674 -0.4680 0.2592 -0.3048 -0.2140 -0.1608 -0.4418
<20 μm Mineral-Element Correlation Matrix
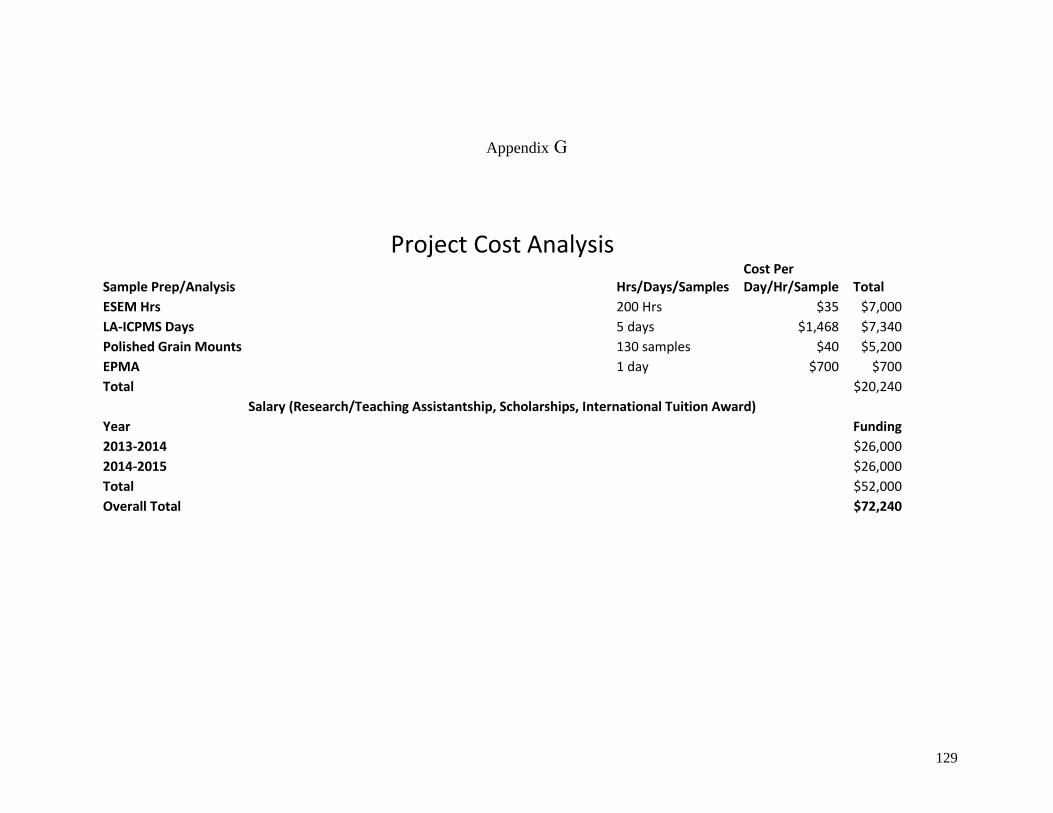
129
Appendix G
Project Cost Analysis
Sample Prep/Analysis Hrs/Days/Samples Cost Per Day/Hr/Sample Total
ESEM Hrs 200 Hrs $35 $7,000
LA-ICPMS Days 5 days $1,468 $7,340
Polished Grain Mounts 130 samples $40 $5,200
EPMA 1 day $700 $700
Total
$20,240
Salary (Research/Teaching Assistantship, Scholarships, International Tuition Award)
Year
Funding
2013-2014
$26,000
2014-2015
$26,000
Total
$52,000
Overall Total
$72,240
Related Documents