Welcome message from author
This document is posted to help you gain knowledge. Please leave a comment to let me know what you think about it! Share it to your friends and learn new things together.
Transcript
EUROPEAN ORGANIZATION FOR NUCLEAR RESEARCH
CERN-PPE/94-017
27 Jan 1994
Heavy Flavour Production and Decaywith Prompt Leptons in the ALEPH
Detector.
The ALEPH Collaboration
Abstract
In 431,000 hadronic Z decays recorded with the Aleph detector at LEP, the
yields of electrons and muons in events with one or more prompt leptons have
been analysed to give information on the production and decay of heavy quarks.
The fractions of bb and cc events are measured to be 0:219 � 0:006 � 0:005 and
0:165 � 0:005 � 0:020, and the corresponding forward{backward asymmetries at
Z mass are measured to be 0:090 � 0:013 � 0:003 and 0:111 � 0:021 � 0:018,
after QED and QCD corrections. Measurements for the semileptonic branching
ratios Br(b ! `��� X) and Br(b ! c ! `+� X) yield 0:114 � 0:003 � 0:004 and
0:082 � 0:003 � 0:012, respectively. The dilepton events enable measurement of
the b mixing parameter, � = 0:114� 0:014� 0:008. Results are also presented for
the energy variation of the bb asymmetry and the parameters required to describe
heavy quark fragmentation. From the asymmetry measurements, the e�ective
electroweak mixing angle is sin2 �effW = 0:2333 � 0:0022.
Submitted to Z. Phys.
The ALEPH Collaboration
D. Buskulic, D. Casper, I. De Bonis, D. Decamp, P. Ghez, C. Goy, J.-P. Lees, M.-N. Minard, P. Odier, B. Pietrzyk
Laboratoire de Physique des Particules (LAPP), IN2P3-CNRS, 74019 Annecy-le-Vieux Cedex, France
F. Ariztizabal, P. Comas, J.M. Crespo, I. Efthymiopoulos, E. Fernandez, M. Fernandez-Bosman, V. Gaitan,
Ll. Garrido,29 M. Martinez, T. Mattison,30 S. Orteu, A. Pacheco, C. Padilla, A. Pascual
Institut de Fisica d'Altes Energies, Universitat Autonoma de Barcelona, 08193 Bellaterra (Barcelona),Spain7
D. Creanza, M. de Palma, A. Farilla, G. Iaselli, G. Maggi, N. Marinelli, S. Natali, S. Nuzzo, A. Ranieri, G. Raso,
F. Romano, F. Ruggieri, G. Selvaggi, L. Silvestris, P. Tempesta, G. Zito
Dipartimento di Fisica, INFN Sezione di Bari, 70126 Bari, Italy
Y. Chai, D. Huang, X. Huang, J. Lin, T. Wang, Y. Xie, D. Xu, R. Xu, J. Zhang, L. Zhang, W. Zhao
Institute of High-Energy Physics, Academia Sinica, Beijing, The People's Republic of China8
G. Bonvicini, J. Boudreau,25 H. Drevermann, R.W. Forty, G. Ganis, C. Gay,3 M. Girone, R. Hagelberg, J. Harvey,
J. Hilgart,27 R. Jacobsen, B. Jost, J. Knobloch, I. Lehraus, M. Maggi, C. Markou, P. Mato, H. Meinhard, A. Minten,
R. Miquel, P. Palazzi, J.R. Pater, J.A. Perlas, P. Perrodo, J.-F. Pusztaszeri, F. Ranjard, L. Rolandi, J. Rothberg,2
T. Ruan, M. Saich, D. Schlatter, M. Schmelling, F. Sefkow,6 W. Tejessy, I.R. Tomalin, R. Veenhof, H. Wachsmuth,
S. Wasserbaech,2 W. Wiedenmann, T. Wildish, W. Witzeling, J. Wotschack
European Laboratory for Particle Physics (CERN), 1211 Geneva 23, Switzerland
Z. Ajaltouni, M. Bardadin-Otwinowska, A. Barres, C. Boyer, A. Falvard, P. Gay, C. Guicheney, P. Henrard,
J. Jousset, B. Michel, J-C. Montret, D. Pallin, P. Perret, F. Podlyski, J. Proriol, F. Saadi
Laboratoire de Physique Corpusculaire, Universit�e Blaise Pascal, IN2P3-CNRS, Clermont-Ferrand,63177 Aubi�ere, France
T. Fearnley, J.B. Hansen, J.D. Hansen, J.R. Hansen, P.H. Hansen, S.D. Johnson, R. M�llerud, B.S. Nilsson1
Niels Bohr Institute, 2100 Copenhagen, Denmark9
A. Kyriakis, E. Simopoulou, I. Siotis, A. Vayaki, K. Zachariadou
Nuclear Research Center Demokritos (NRCD), Athens, Greece
J. Badier, A. Blondel, G. Bonneaud, J.C. Brient, P. Bourdon, G. Fouque, L. Passalacqua, A. Roug�e, M. Rumpf,
R. Tanaka, M. Verderi, H. Videau
Laboratoire de Physique Nucl�eaire et des Hautes Energies, Ecole Polytechnique, IN2P3-CNRS, 91128Palaiseau Cedex, France
D.J. Candlin, M.I. Parsons, E. Veitch
Department of Physics, University of Edinburgh, Edinburgh EH9 3JZ, United Kingdom10
E. Focardi, L. Moneta, G. Parrini
Dipartimento di Fisica, Universit�a di Firenze, INFN Sezione di Firenze, 50125 Firenze, Italy
M. Corden, M. Del�no,12 C. Georgiopoulos, D.E. Ja�e, D. Levinthal15
Supercomputer Computations Research Institute, Florida State University, Tallahassee, FL 32306-4052, USA 13;14
A. Antonelli, G. Bencivenni, G. Bologna,4 F. Bossi, P. Campana, G. Capon, F. Cerutti, V. Chiarella, G. Felici,
P. Laurelli, G. Mannocchi,5 F. Murtas, G.P. Murtas, M. Pepe-Altarelli, S. Salomone
Laboratori Nazionali dell'INFN (LNF-INFN), 00044 Frascati, Italy
P. Colrain, I. ten Have, I.G. Knowles, J.G. Lynch, W. Maitland, W.T. Morton, C. Raine, P. Reeves, J.M. Scarr,
K. Smith, M.G. Smith, A.S. Thompson, S. Thorn, R.M. Turnbull
Department of Physics and Astronomy, University of Glasgow, Glasgow G12 8QQ,United Kingdom10
U. Becker, O. Braun, C. Geweniger, P. Hanke, V. Hepp, E.E. Kluge, A. Putzer,1 B. Rensch, M. Schmidt H. Stenzel,
K. Tittel, M. Wunsch
Institut f�ur Hochenergiephysik, Universit�at Heidelberg, 69120 Heidelberg, Fed. Rep. of Germany16
R. Beuselinck, D.M. Binnie, W. Cameron, M. Cattaneo, D.J. Colling, P.J. Dornan, J.F. Hassard, N. Konstantinidis,
A. Moutoussi, J. Nash, D.G. Payne, G. San Martin, J.K. Sedgbeer, A.G. Wright
Department of Physics, Imperial College, London SW7 2BZ, United Kingdom10
P. Girtler, D. Kuhn, G. Rudolph, R. Vogl
Institut f�ur Experimentalphysik, Universit�at Innsbruck, 6020 Innsbruck, Austria18
C.K. Bowdery, T.J. Brodbeck, A.J. Finch, F. Foster, G. Hughes, D. Jackson, N.R. Keemer, M. Nuttall, A. Patel,
T. Sloan, S.W. Snow, E.P. Whelan
Department of Physics, University of Lancaster, Lancaster LA1 4YB, United Kingdom10
A. Galla, A.M. Greene, K. Kleinknecht, J. Raab, B. Renk, H.-G. Sander, H. Schmidt, S.M. Walther, R. Wanke,
B. Wolf
Institut f�ur Physik, Universit�at Mainz, 55099 Mainz, Fed. Rep. of Germany16
A.M. Bencheikh, C. Benchouk, A. Bonissent, D. Calvet, J. Carr, P. Coyle, C. Diaconu, F. Etienne, D. Nicod,
P. Payre, L. Roos, D. Rousseau, P. Schwemling, M. Talby
Centre de Physique des Particules, Facult�e des Sciences de Luminy, IN2P3-CNRS, 13288 Marseille,France
S. Adlung, R. Assmann, C. Bauer, W. Blum, D. Brown, P. Cattaneo,23 B. Dehning, H. Dietl, F. Dydak,21M. Frank,
A.W. Halley, K. Jakobs, J. Lauber, G. L�utjens, G. Lutz, W. M�anner, H.-G. Moser, R. Richter, J. Schr�oder,
A.S. Schwarz, R. Settles, H. Seywerd, U. Stierlin, U. Stiegler, R. St. Denis, G. Wolf
Max-Planck-Institut f�ur Physik, Werner-Heisenberg-Institut, 80805 M�unchen, Fed. Rep. of Germany16
R. Alemany, J. Boucrot,1 O. Callot, A. Cordier, M. Davier, L. Du ot, J.-F. Grivaz, Ph. Heusse, P. Janot,
D.W. Kim,19 F. Le Diberder, J. Lefran�cois, A.-M. Lutz, G. Musolino, M.-H. Schune, J.-J. Veillet, I. Videau
Laboratoire de l'Acc�el�erateur Lin�eaire, Universit�e de Paris-Sud, IN2P3-CNRS, 91405 Orsay Cedex,France
D. Abbaneo, G. Bagliesi, G. Batignani, U. Bottigli, C. Bozzi, G. Calderini, M. Carpinelli, M.A. Ciocci, V. Ciulli,
R. Dell'Orso, I. Ferrante, F. Fidecaro, L. Fo�a,1 F. Forti, A. Giassi, M.A. Giorgi, A. Gregorio, F. Ligabue, A. Lusiani,
P.S. Marrocchesi, E.B. Martin, A. Messineo, F. Palla, G. Rizzo, G. Sanguinetti, P. Spagnolo, J. Steinberger,
R. Tenchini,1 G. Tonelli,28 G. Triggiani, A. Valassi, C. Vannini, A. Venturi, P.G. Verdini, J. Walsh
Dipartimento di Fisica dell'Universit�a, INFN Sezione di Pisa, e Scuola Normale Superiore, 56010 Pisa,Italy
A.P. Betteridge, Y. Gao, M.G. Green, D.L. Johnson, P.V. March, T. Medcalf, Ll.M. Mir, I.S. Quazi, J.A. Strong
Department of Physics, Royal Holloway & Bedford New College, University of London, Surrey TW20OEX, United Kingdom10
V. Bertin, D.R. Botterill, R.W. Cli�t, T.R. Edgecock, S. Haywood, M. Edwards, P.R. Norton, J.C. Thompson
Particle Physics Dept., Rutherford Appleton Laboratory, Chilton, Didcot, Oxon OX11 OQX, UnitedKingdom10
B. Bloch-Devaux, P. Colas, H. Duarte, S. Emery, W. Kozanecki, E. Lan�con, M.C. Lemaire, E. Locci, B. Marx,
P. Perez, J. Rander, J.-F. Renardy, A. Rosowsky, A. Roussarie, J.-P. Schuller, J. Schwindling, D. Si Mohand,
B. Vallage
Service de Physique des Particules, DAPNIA, CE-Saclay, 91191 Gif-sur-Yvette Cedex, France17
R.P. Johnson, A.M. Litke, G. Taylor, J. Wear
Institute for Particle Physics, University of California at Santa Cruz, Santa Cruz, CA 95064, USA22
W. Babbage, C.N. Booth, C. Buttar, S. Cartwright, F. Combley, I. Dawson, L.F. Thompson
Department of Physics, University of She�eld, She�eld S3 7RH, United Kingdom10
A. B�ohrer, S. Brandt, G. Cowan,1 E. Feigl, C. Grupen, G. Lutters, J. Minguet-Rodriguez, F. Rivera,26 P. Saraiva,
U. Sch�afer, L. Smolik
Fachbereich Physik, Universit�at Siegen, 57068 Siegen, Fed. Rep. of Germany16
L. Bosisio, R. Della Marina, G. Giannini, B. Gobbo, L. Pitis, F. Ragusa20
Dipartimento di Fisica, Universit�a di Trieste e INFN Sezione di Trieste, 34127 Trieste, Italy
L. Bellantoni, W. Chen, J.S. Conway,24 Z. Feng, D.P.S. Ferguson, Y.S. Gao, J. Grahl, J.L. Harton, O.J. Hayes,
H. Hu, J.M. Nachtman, Y.B. Pan, Y. Saadi, M. Schmitt, I. Scott, V. Sharma, J.D. Turk, A.M. Walsh, F.V. Weber,
Sau Lan Wu, X. Wu, M. Zheng, J.M. Yamartino, G. Zobernig
Department of Physics, University of Wisconsin, Madison, WI 53706, USA11
1Now at CERN, PPE Division, 1211 Geneva 23, Switzerland.2Permanent address: University of Washington, Seattle, WA 98195, USA.3Now at Harvard University, Cambridge, MA 02138, U.S.A.4Also Istituto di Fisica Generale, Universit�a di Torino, Torino, Italy.5Also Istituto di Cosmo-Geo�sica del C.N.R., Torino, Italy.6Now at DESY, Hamburg, Germany.7Supported by CICYT, Spain.8Supported by the National Science Foundation of China.9Supported by the Danish Natural Science Research Council.
10Supported by the UK Science and Engineering Research Council.11Supported by the US Department of Energy, contract DE-AC02-76ER00881.12On leave from Universitat Autonoma de Barcelona, Barcelona, Spain.13Supported by the US Department of Energy, contract DE-FG05-92ER40742.14Supported by the US Department of Energy, contract DE-FC05-85ER250000.15Present address: Lion Valley Vineyards, Cornelius, Oregon, U.S.A.16Supported by the Bundesministerium f�ur Forschung und Technologie, Fed. Rep. of Germany.17Supported by the Direction des Sciences de la Mati�ere, C.E.A.18Supported by Fonds zur F�orderung der wissenschaftlichen Forschung, Austria.19Permanent address: Kangnung National University, Kangnung, Korea.20Now at Dipartimento di Fisica, Universit�a di Milano, Milano, Italy.21Also at CERN, PPE Division, 1211 Geneva 23, Switzerland.22Supported by the US Department of Energy, grant DE-FG03-92ER40689.23Now at Universit�a di Pavia, Pavia, Italy.24Now at Rutgers University, Piscataway, NJ 08854, USA.25Now at FERMILAB, Batavia, IL 60510, U.S.A.26Partially supported by Colciencias, Colombia.27Now at SSCL, Dallas 75237-3946, TX, U.S.A.28Also at Istituto di Matematica e Fisica, Universit�a di Sassari, Sassari, Italy.29Permanent address: Dept. d'Estructura i Constituens de la Materia, Universitat de Barcelona, 08208 Barcelona, Spain.30Now at SLAC, Stanford, CA 94309, U.S.A.
1 Introduction
Approximately 40% of the hadronic decays of the Z boson are to pairs of b and
c quarks. Isolation of clean samples of these �nal states allows one to probe the
electroweak interaction in the quark sector. The basic electroweak parameters are
the ratios of the decay widths for b and c decay to the total hadronic width and
the forward{backward asymmetry for both species of heavy quark. The widths
require an identi�cation procedure (tag) which provides good separation of the
b, c, and uds decays of the Z whilst the asymmetries additionally require a tag
which discriminates the quark direction from the antiquark direction. Semilep-
tonic decays of beauty and charm states produce prompt electrons and muons
of high momentum due to the hard fragmentation of the heavy quark states and
also, in the case of beauty, with high momentum perpendicular to the direction
of the parent heavy avour hadron. In this paper the p and p? spectra of promptelectrons and muons are used to tag the b and c states; p? always refers to themomentum of the lepton perpendicular to the jet to which it belongs.
The number of prompt leptons in a sample of hadronic events is determinedby the products
Br(b! `��� X)�(bb)=�(had),
Br(b! c! `+� X)�(bb)=�(had),
and
Br(c! `+� X)�(cc)=�(had)
The three processes b ! `�, b ! c ! `+, and c ! `+ are distinguished bytheir di�erent spectra in the (p,p?) plane. The individual factors in the products
can only be isolated by a simultaneous consideration of single and dilepton events,
which in principle has the potential to extract all �ve quantities. However, thestatistics of the dilepton sample are inadequate, particularly for both the cascadeand charm decays, and so in this work the semileptonic charm decay rate is taken
from previous measurements and the current data are used to measure the other
four quantities.
The momentum spectrum of the leptons is strongly a�ected by the heavy
quark fragmentation and so this allows a measurement of < xb > and < xc >,where xb=c = Eb=c hadron=Ebeam, within the framework of a particular fragmenta-
tion model. A comparison of same and opposite charge dilepton events enablesthe integrated mixing parameter, �, to be determined.
The analyses require knowledge of the rest frame semileptonic decay spec-tra which is the main contributor to the transverse momentum lepton spectra.
Where possible this is taken from published data with models used to extrapolate
to regions for which no data exist. This is discussed in section 3. The momen-tum spectrum shape is largely determined by fragmentation; di�erent models are
considered and this is also discussed in section 3.
1
Clean identi�cation of the prompt lepton signal is vital. Hadronic event se-
lection, lepton identi�cation in Aleph and the optimisation of the de�nition of
jets are described in detail in reference [1]. Lepton detection e�ciencies and con-
tamination rates are taken from the data, except for the contamination of the
muon signal by � and K decays in ight. The measured rates are then used to
recalibrate the Monte Carlo; this will be referred to as the corrected Monte Carlo
in the following.
The results are presented in section 4. This commences with a number of
analyses purely in the b sector where a cut at high p? is used to give a relatively
pure b sample. Using this cut, values are obtained for the bb fraction of hadronic
events, Rb, the forward{backward asymmetry of bb production, AbFB, the b mixing
parameter, �, and the Br(b ! `��� X). The energy dependence of the forward{
backward asymmetry is also presented with the high p? sample. Extension to
lower p? where the charm component becomes signi�cant requires a simultaneous�t over the lepton and dilepton spectra. This gives the cc fraction of hadronicevents, Rc, the cascade branching ratio Br(b ! c ! `+� X), and Ac
FB as wellas the previous quantities and also allows measurement of the mean fragmenta-
tion parameters for beauty and charm. A detailed discussion of the systematicuncertainties is given in section 4.1.
Throughout this paper, unless speci�ed otherwise, charge conjugate reactionsare implied, and b! `�, c! `+, etc. will refer to the decays b! `��� X, c! `+��X, etc. . The symbol ` indicates either electrons or muons, but not the sum of
the two.
2 The Aleph detector
The Aleph detector has been described in detail elsewhere [2]. For the data usedin these analyses, taken in 1990 and 1991, charged tracks are measured over therange jcos(�)j < 0:95, where � is the polar angle, by an inner cylindrical drift
chamber (itc) and a large cylindrical time projection chamber (tpc). These
chambers are immersed in a magnetic �eld of 1.5 Tesla and together measure themomentum of charged particles with a resolution [3] of
�P=P = 0:0008P (P in GeV=c)
The tpc provides up to 330 measurements of the speci�c ionization, dE/dx, of each
charged track. Outside the tpc is the electromagnetic calorimeter (ecal), which
is constructed of 45 layers of lead interleaved with proportional wire chambers.
The ecal has an energy resolution of
�E=E = 0:19=pE + 0:01 (E in GeV )
and is used together with the dE/dx measurements of the tpc to identify electrons.
The hadron calorimeter (hcal) is the iron of the magnet return yoke interleaved
2
with 23 layers of streamer tubes which provide a two dimensional view of the
development of hadronic showers. The hcal is used in conjunction with the
muon chambers and the tracking detectors to identify muons. The calorimeters
and muon chambers cover nearly the entire 4� solid angle.
3 The simulation of heavy avour processes in
Z decays at LEP
3.1 The HVFL program
For heavy avour studies Aleph has developed a program, HVFL, based on
JETSET 7.3 [4]. JETSET procedures are used for the parton shower and string
fragmentation with parameters tuned to �t event shape variables [5] and to takeaccount of �nal state radiation. In addition several modi�cations have been made
to increase exibility and further improve agreement with known results. Theseare:
� The process e+e�! qq is generated with DYMU2 [6] to give the best possiblecalculation of the initial state photon radiation.
� The decay channels of charm hadrons take into account the latest experi-
mental results for both exclusive and inclusive modes [7].
� Two body branching ratios of the b mesons measured by ARGUS andCLEO [8] are used. Unmeasured two body decays are computed from themeasured ones using the Stech{Bauer approach [9].
� B meson decays to baryons are added so as to reproduce measurements of
inclusive production [10].
� The decay chain for B! J/ +X has been modi�ed to give multibody decays
and a J/ spectrum which agrees with data. B meson decays to 0 have
been added with a correct simulation of the 0! J= �� decay.
� The basic dynamics for B ! l� X has been modi�ed. The decays
B ! l� D and B ! l� D� in the ratio 1:3 are implemented accordingto the Korner{Schuler model [11]. Su�cient higher mass contributions,
B ! l� D�� and B ! l� D��, are included so that HVFL approximately
reproduces the lepton energy spectrum �tted by ARGUS and CLEO [12] us-ing the model of Altarelli et al. (ACCMM) [13]. In practice the �nal statesD : D� : D�� : D�� are generated in the ratios 0.211 : 0.639 : 0.075 : 0.075.
� Final states resulting from b ! u transitions are introduced. They are
computed in the free quark model with a rate proportional to phase space.
3
3.2 Corrections for decay and fragmentation models
To further improve the description of the lepton spectra, the simulated events
are given a weight based on the lepton energy in the b hadron centre of mass to
account for the following:
� The b! `� spectrum. Models of the b semileptonic decay di�er in their
treatment of the higher mass D�� and D�� components. Fitting the available
data [12, 14], to models with large explicit D�� contributions such as that
of Isgur et al. [15] (ISGW��) yields softer lepton spectra than with the
inclusive (ACCMM) model. For the analyses the two approaches are taken
as extremes and weights used so that both models reproduce the CLEO �ts.
The quoted results are the average of these two with an assigned modelling
uncertainty of half the di�erence.
� The c! `+ spectrum. The lepton energy spectrum in the c hadron restframe from charm decays contains large uncertainties. The main source ofexperimental information is fromDELCO [16]. In that experiment 00 decaysare the source of D0 and D+ with approximately the same production rate,
except for a small phase space e�ect. The shape of the energy spectrumgenerated in JETSET is softer than the DELCO results and is weighted toreproduce it. Half of the di�erence between the weighted and unweightedresults is taken as the modelling uncertainty.
� The b ! c ! `+ spectrum. This is a two step process and the experi-mental situation is less clear. For the analyses the energy spectrum is takendirectly from JETSET but the full di�erence between these results and thoseusing the weights for the c! l� X are taken as the modelling uncertainty.
� Internal bremsstrahlung in b and c semileptonic decays. The PHO-
TOS Monte Carlo [17] is used to give the ratio of the lepton spectra with and
without internal bremsstrahlung and this is then parametrised as a functionof the lepton rest frame energy to give the weight. The procedure is approx-
imate as it only corrects the lepton energy and not the direction but this
has a negligible e�ect on the results. The main e�ect is a 4% correction tothe b! e� branching ratio.
� Heavy Quark fragmentation. The events are generated with both b and
c fragmentation described by the Peterson et al. form [18] (PSSZ) which isde�ned in terms of the variable z, denoting the fraction of (E + Pk) taken
by the heavy avour hadron. It depends upon one parameter, "Q, for each
quark. The e�ects of the alternative fragmentation scheme of Kartvelishviliet al. [19] (KLP) are investigated by weighting the generated events in terms
of their z value.
4
4 Data analysis
Prompt electron and muon candidates result from the following physical processes:
� Primary semileptonic decays of b hadrons, denoted b! `�.
� Decays of a � from a b decay, denoted b! � ! `�.
� Cascade decays from the charm daughter of a b parent, denoted b! c! `+.
� Cascade decays of a charm state from the W� in the b decay, denoted
b! (cs)! `�.
� Semileptonic decays of charm states produced in Z ! cc, denoted c! `+.
� Leptons from non{prompt sources or hadrons misidenti�ed as leptons, de-noted fake.
The degree to which the origin of the observed leptons must be classi�eddepends on the physical quantity to be measured. For mixing and asymmetry
the sign is crucial and therefore the b ! c ! `+ cascade decay is an importantcontributor to the background together with the charm component. They areapproximately of the same size in the lepton sample while in the dilepton samplethe charm component is suppressed. On the other hand for the Z width to bbno information on the quark sign is needed so the primary charm component isthe most signi�cant background. Separation is achieved on a statistical basis by
the use of the (p,p?) spectrum; leptons from primary b decay have relatively highvalues for both p and p? as a result of the hard heavy quark fragmentation andthe high b hadron mass respectively. Below 3GeV/c some muons do not reachthe muon chambers and so the identi�cation e�ciency falls o�. Consequently, a
minimummomentum cut of 3GeV/c is applied for all lepton candidates. Electron
identi�cation is very good down to much lower momenta but there is then a large
background of non{prompt electrons from conversions.The choice of axis for the determination of the transverse momentum is im-
portant. In reference [1] it is shown that, with the data available from the Aleph
detector, the best discrimination is achieved when both neutrals and charged par-
ticles are used for the jet analysis and the jet axis is rede�ned after the lepton hasbeen excluded from the jet.
Results are obtained with two di�erent techniques which are compared forconsistency. In the �rst, the high p? analyses, a lower cut is made on the lepton
transverse momentum at 1.25GeV/c to produce a relatively pure sample of pri-
mary b decays. The predicted sample compositions for both electrons and muonsare given in table 1. The choice of 1.25GeV/c is a compromise between sam-
ple purity and adequate statistics. Measurements made on this sample of events
5
are essentially counting experiments and are purely in the b sector. Events are
categorized depending on whether they are single or dilepton, and in the latter
case, with regard to the relative charges and directions of the two leptons. Esti-
mated corrections for contaminants from background, cascade and charm decays
are then subtracted. The high p? analyses determine Rb, Br(b ! `��� X), AbFB
and �. Choosing this restricted region leads to relatively simple equations in
which the e�ects of the backgrounds from lepton misidenti�cation and leptons
from other sources are small. However, the magnitude of the contamination from
other sources does depend on external measurements of the branching ratios and
theoretical predictions for the spectra.
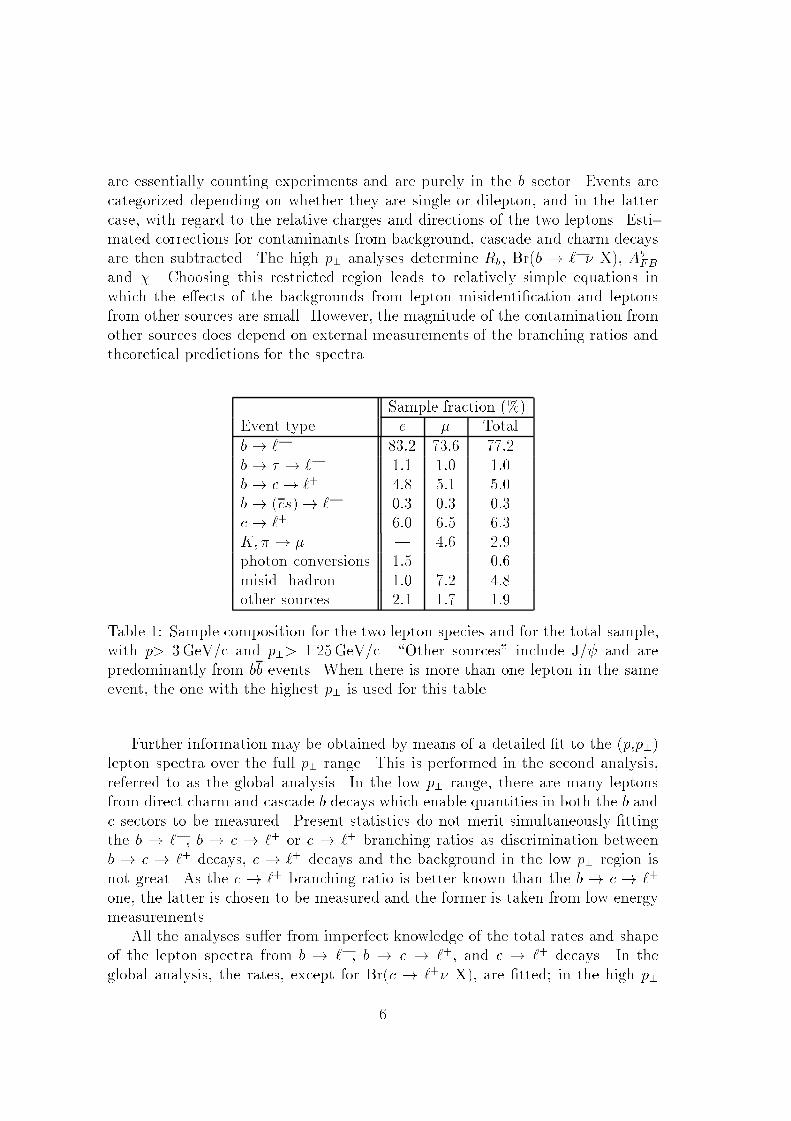
Sample fraction (%)Event type e � Total
b! `� 83:2 73:6 77:2
b! � ! `� 1:1 1:0 1:0b! c! `+ 4:8 5:1 5:0b! (cs)! `� 0:3 0:3 0:3c! `+ 6:0 6:5 6:3
K;� ! � | 4:6 2:9photon conversions 1:5 | 0:6
misid. hadron 1:0 7:2 4:8other sources 2:1 1:7 1:9
Table 1: Sample composition for the two lepton species and for the total sample,with p> 3GeV/c and p?> 1.25GeV/c. \Other sources" include J/ and arepredominantly from bb events. When there is more than one lepton in the sameevent, the one with the highest p? is used for this table.
Further information may be obtained by means of a detailed �t to the (p,p?)
lepton spectra over the full p? range. This is performed in the second analysis,
referred to as the global analysis. In the low p? range, there are many leptonsfrom direct charm and cascade b decays which enable quantities in both the b and
c sectors to be measured. Present statistics do not merit simultaneously �ttingthe b ! `�, b ! c ! `+ or c ! `+ branching ratios as discrimination between
b ! c ! `+ decays, c ! `+ decays and the background in the low p? region is
not great. As the c ! `+ branching ratio is better known than the b ! c ! `+
one, the latter is chosen to be measured and the former is taken from low energymeasurements.
All the analyses su�er from imperfect knowledge of the total rates and shape
of the lepton spectra from b ! `�, b ! c ! `+, and c ! `+ decays. In the
global analysis, the rates, except for Br(c ! `+� X), are �tted; in the high p?
6
analyses the b! `� and b! c! `+ rates are input where appropriate from the
global �t. The procedure adopted to assess the uncertainties in the results arising
from the sensitivity to the shape of the spectra is described in section 3.2. The
e�ects are di�erent for the two forms of analysis. For the high p? analyses, the
measurements must be extrapolated using the model into the low p? region. For
the global analysis, the functions which are used in the �t are changed according
to the model.
4.1 Sources of systematic uncertainties
All of the analyses are subject to uncertainties inherent in lepton identi�cation and
the modelling of lepton production. Those uncertainties speci�c to an individual
analysis are discussed with the appropriate results.
Identi�cation uncertainties for electrons. For electrons the e�ciencies ofboth the ecal and dE/dx identi�cation are directly measured from the data withgood statistics [1]. A total uncertainty of 3% is set for the electron identi�catione�ciency. The probability of hadron misidenti�cation is directly measured ondata; an uncertainty of 10% is assumed.
The rate of electrons from photon materialization is measured on data by thenumber of pairs observed with at least one track consistent with the electronidenti�cation criteria. The e�ciency of the pair �nder is known to 10%.
Identi�cation uncertainties for muons. From the studies of the processesZ ! �+�� and � decays, as described in [1], a global uncertainty on the muonidenti�cation e�ciency has been set at 3% . The contamination from hadron
punch{through is determined from pure samples of hadrons selected from � decays
(using the channels � ! ��, � ! K��, � ! ����) and K0 decays (K0 ! ��) [1];this also allows checks for the hadron decays. From this analysis, uncertainties
on the punch{through and decay rate of 20% and 10%, respectively have been
assigned.
The rate of b! (cs)! `�. The rate of lepton production from b! (cs)! `�
is taken from phase space calculations [20] and is equal to 14% of the rate of
b ! c ! `+. A 50% uncertainty is set on this number to compute systematic
uncertainties.
b ! � branching ratio. For this branching ratio the measured value [21] of
(4.08 � 0.76) % has been used. The systematic uncertainties of this measurement
were not used in estimating the error due to b ! � because they are explicitlycalculated in this paper.
7
J/ production from B decays. The B! J/ +X branching ratio is assumed
to be 1.12%, with a 15% variation.
b! u transition. It is assumed that 3% of the b quarks decay through b! u.
A 50% uncertainty is taken on this number.
The product of Rc� Br(c ! `+). The semileptonic branching ratio of charm
decays is taken to be (9:8 � 0:5)% [22]. An uncertainty of 10% is assumed on
Rc� Br(c! `+) for the high p? analyses, with Rc= 0.174. For the global analysis,
Rc is a �tted variable, and Br(c! `+) is varied by one �.
Gluon splitting to heavy quarks. Charm and beauty quark pairs may be
produced out of the vacuum. There is no experimental data on the rate at whichthis process occurs. An uncertainty of 100% on the JETSET predictions has been
used.
E�ect of heavy quark fragmentation modelling. In the overall �t a singleparameter is used for each heavy quark species to describe the data with a frag-mentation function of the PSSZ type. These parameters are free in the �t. Toexamine the sensitivity to an alternative fragmentation model, the �t has beenrepeated, weighting the events as a function of z to give the KLP parametrisation.This also has one free parameter per species. The e�ect is negligible for all results
except Rc, which changes by 3%.
The estimate of uncertainties due to the modelling of b ! `�, b ! c ! `+,and c! `+ decays have been discussed in section 3.2. For the high p? analyses,the value of Br(b! c! `+) is taken from the global �t.
5 High p? analyses
Using leptons with p? over 1.25GeV/c, the fraction of Z ! bb in Z hadronicdecays, Rb, the semileptonic branching ratio of the b, the B-B mixing and the
forward{backward asymmetry of bb production from Z decay have been measured.
5.1 Measurement of Rb
This method uses single and double tagged events to eliminate the uncertainties
on the details of b decays and fragmentation. Events with high p? leptons aresplit into two hemispheres with respect to the thrust axis, which is required to be
within j cos � j< 0.9. They are then divided into two categories: a double taggedsample in which both hemispheres contain at least one lepton, and a single tagged
8
sample in which one of the hemispheres does not contain a lepton. The value of
Rb is then derived from counting the numbers Nst and Ndt of single tagged and
double tagged events. These two numbers are related by:
Nst = 2Pb(1 � CPb)Nb�b +Nlightst (1)
Ndt = CP 2bNb�b +N light
dt (2)
Where:
� Nb�b and Pb are the two unknowns. Nb�b is the number of Z ! bb events
in the hadronic sample. Pb is the probability to tag one hemisphere of
a bb event. This quantity contains all the uncertainties related to decay
modelling, branching ratios, and fragmentation in the b sector.
� C = Pb�b=P2b where Pb�b is the probability to tag the two hemispheres in a
bb event. This factor accounts for possible correlations between the tagginge�ciencies of the two hemispheres.
� N lightst and N light
dt are the number of single and double tagged udsc events
respectively.
The values of C, N lightst and N light
dt are estimated from the corrected Monte
Carlo (i.e. after the misidenti�cation rates have been recalibrated from data) [1].
Computation of C. The C factor has been been estimated using 264,739 fully
simulated bb events. The value C = 1.002 � 0.012 is consistent with one. Thereis no evidence that C depends on the p? cut and hence it is independent of thephysical origin of the leptons.
Results. Following the j cos �thrust j< 0.9 cut, there are 380,604 hadronic Zdecays and 76,651 of these have identi�ed leptons with p > 3GeV/c. For the p?cut at 1.25GeV/c, there are 16,241 single tag and 710 double tag events, as shown
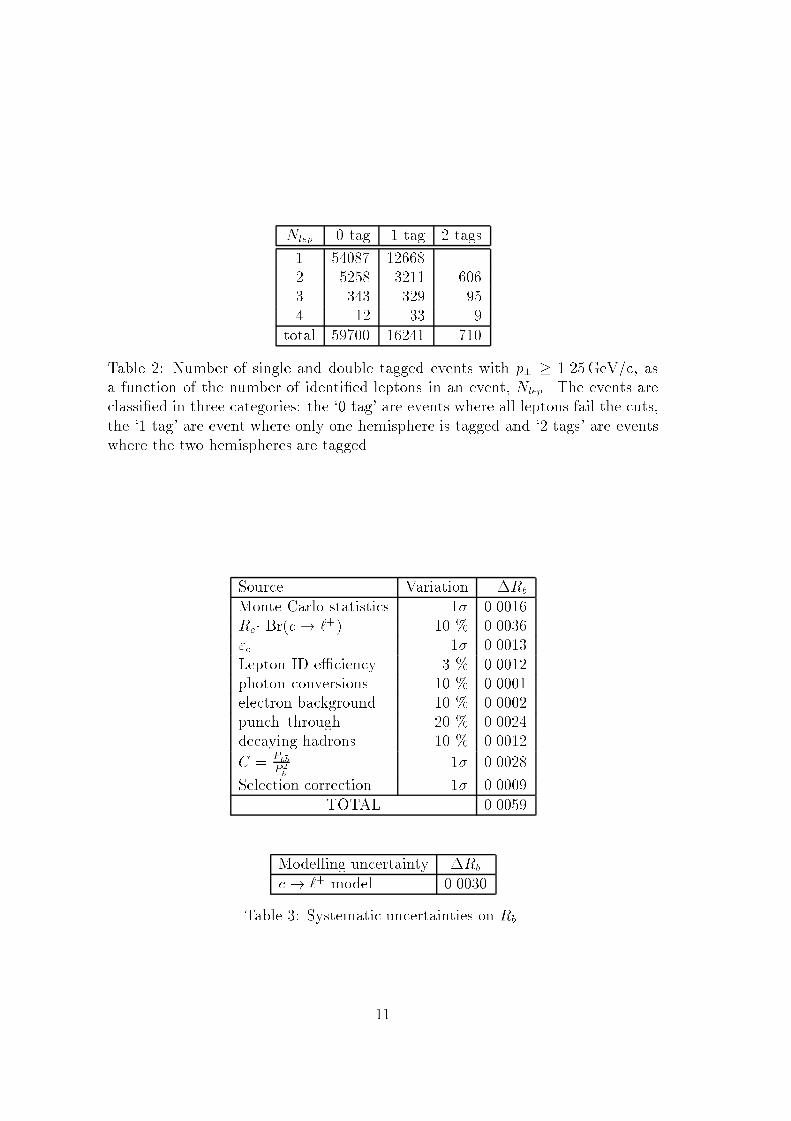
in table 2. The corrected Monte Carlo predicts that 2,158 single and 2 double
tag events are expected to come from light quarks. Solving equations 1 and 2with these light quark contributions subtracted yields Rb= 0:2215�0:0078, where
the uncertainty is statistical. The corresponding value of Pb is 0:091 � 0:003. Acorrection was made for the e�ciency di�erence in the hadronic event selection
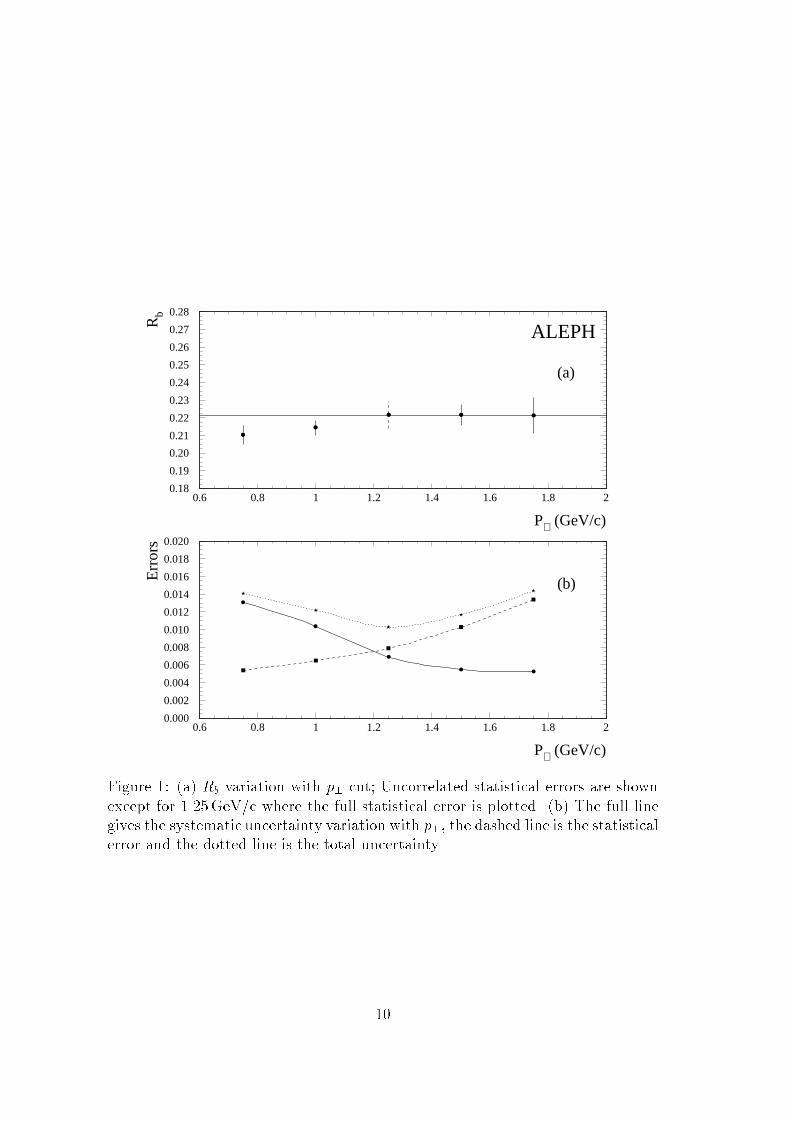
between b�b events and events of other avours. The values of Rb as a function of
the p? cut are given in �gure 1. There is a shift downward at lower values of p?,but smaller than the systematic uncertainty, which dominates in this region.
As this method is independent of all aspects of the b fragmentation model,
b decay models and experimental tagging, there are few sources of systematic
uncertainties. These are given in table 3.
9
0.18
0.19
0.20
0.21
0.22
0.23
0.24
0.25
0.26
0.27
0.28
0.6 0.8 1 1.2 1.4 1.6 1.8 2
P⊥ (GeV/c)
Rb
0.000
0.002
0.004
0.006
0.008
0.010
0.012
0.014
0.016
0.018
0.020
0.6 0.8 1 1.2 1.4 1.6 1.8 2
P⊥ (GeV/c)
Err
ors
(a)
(b)
ALEPH
Figure 1: (a) Rb variation with p? cut; Uncorrelated statistical errors are shown
except for 1.25GeV/c where the full statistical error is plotted. (b) The full linegives the systematic uncertainty variation with p?, the dashed line is the statistical
error and the dotted line is the total uncertainty.
10
Nlep 0 tag 1 tag 2 tags
1 54087 12668
2 5258 3211 6063 343 329 95
4 12 33 9
total 59700 16241 710
Table 2: Number of single and double tagged events with p? � 1.25GeV/c, as
a function of the number of identi�ed leptons in an event, Nlep. The events are
classi�ed in three categories: the `0 tag' are events where all leptons fail the cuts,
the `1 tag' are event where only one hemisphere is tagged and `2 tags' are eventswhere the two hemispheres are tagged.
Source Variation �Rb
Monte Carlo statistics 1� 0.0016Rc� Br(c! `+) 10 % 0.0036"c 1� 0.0013
Lepton ID e�ciency 3 % 0.0012photon conversions 10 % 0.0001
electron background 10 % 0.0002
punch{through 20 % 0.0024decaying hadrons 10 % 0.0012
C =Pb�bP 2
b
1� 0.0028
Selection correction 1� 0.0009
TOTAL 0.0059
Modelling uncertainty �Rb
c! `+ model 0.0030
Table 3: Systematic uncertainties on Rb.
11
At the present level of statistics, the p? cut at 1.25GeV/c yields the smallest
overall uncertainty. As statistics increase, the p? cut may be increased to reduce
the systematic error. Taking into account all uncertainties and corrections for
charm and lighter quarks, this method yields
Rb = 0:2215 � 0:0078 (stat)� 0:0059 (syst)� 0:0030 (models)
5.2 Measurement of Br(b! `��� X)
The semileptonic branching ratio, Br(b! `�), of b hadrons is easily measured in
the high p? region where contamination from other sources is low. The branching
ratio is essentially the ratio of dilepton to single lepton events, after contamination
from non{semileptonic b decays has been removed and detection e�ciencies have
been accounted for.Events where two leptons are detected in opposite hemispheres are mostly
composed of events where both b hadrons decayed semileptonically. The secondlargest component to this sample are events where one b hadron decayed semilep-tonically and the other decayed through the cascade process b! c! `+. Eventswhere two leptons are detected in the same hemisphere are mostly composed of
events where a b hadron decayed semileptonically and the resulting c hadron alsodecayed semileptonically. Thus, the same side dilepton sample depends on theproduct Br(b! `)Br(b! c! `) and is used to subtract the largest backgroundto the opposite side dilepton sample.
The number of semileptonic b decays is twice the number of bb events times
the semileptonic branching ratio; the number of events in which there are twosemileptonic b decays is just the number of bb events times square of the branchingratio. From this, allowing for backgrounds and e�ciencies, it follows that the
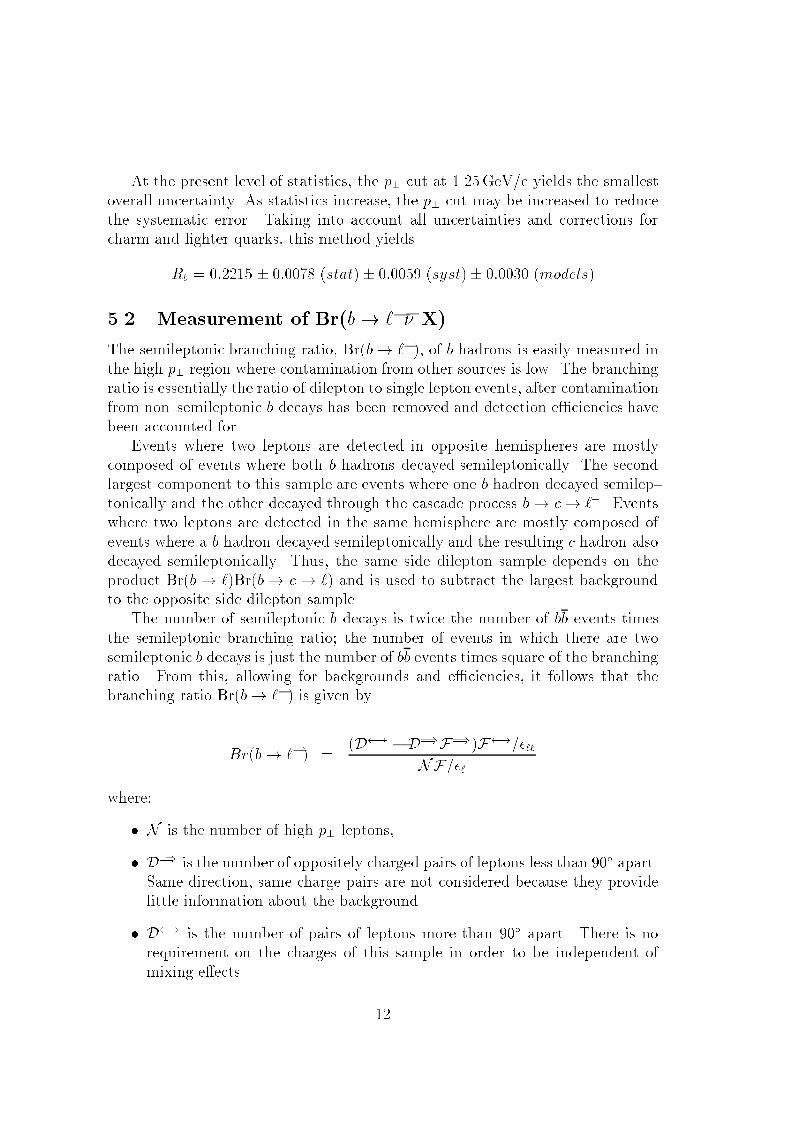
branching ratio Br(b! `�) is given by
Br(b! `�) =(D ! �D=)F=))F !=�``
NF=�`where:
� N is the number of high p? leptons,
� D=) is the number of oppositely charged pairs of leptons less than 90� apart.
Same direction, same charge pairs are not considered because they providelittle information about the background.
� D ! is the number of pairs of leptons more than 90� apart. There is norequirement on the charges of this sample in order to be independent of
mixing e�ects.
12
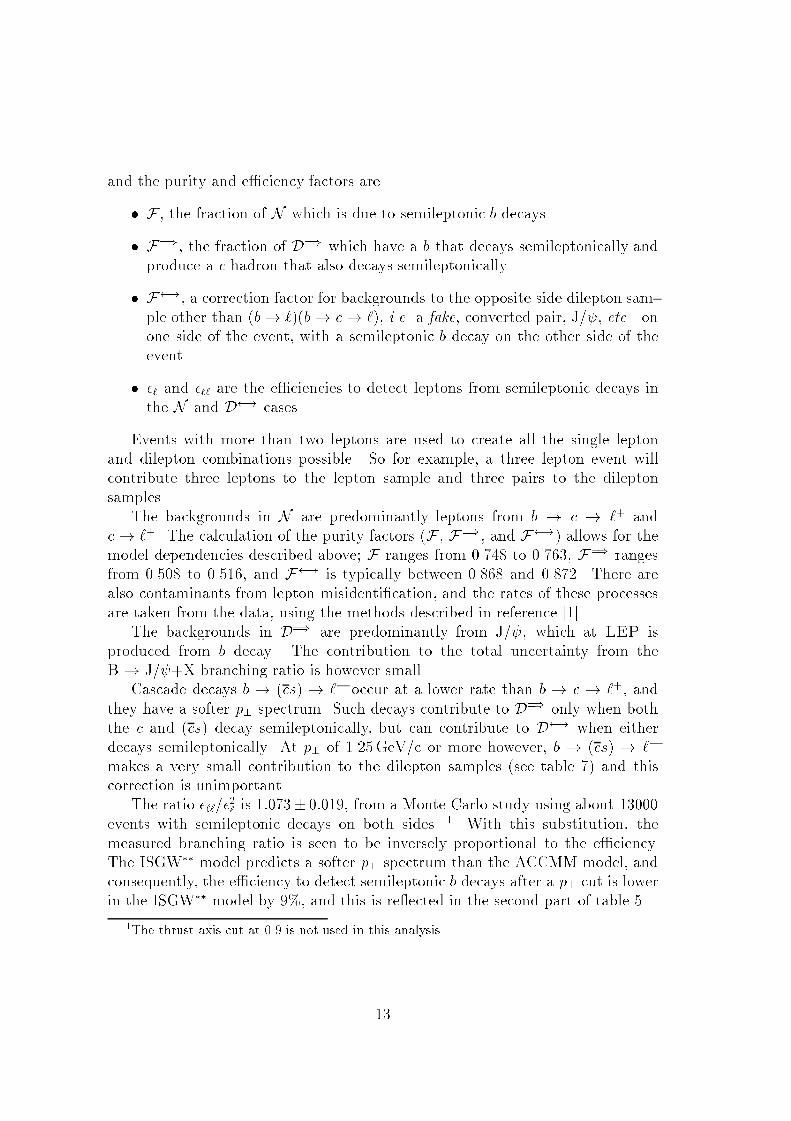
and the purity and e�ciency factors are
� F , the fraction of N which is due to semileptonic b decays.
� F=), the fraction of D=) which have a b that decays semileptonically and
produce a c hadron that also decays semileptonically.
� F !, a correction factor for backgrounds to the opposite side dilepton sam-
ple other than (b! `)(b! c! `), i.e. a fake, converted pair, J/ , etc. on
one side of the event, with a semileptonic b decay on the other side of the
event.
� �` and �`` are the e�ciencies to detect leptons from semileptonic decays in
the N and D ! cases.
Events with more than two leptons are used to create all the single leptonand dilepton combinations possible. So for example, a three lepton event willcontribute three leptons to the lepton sample and three pairs to the dileptonsamples.
The backgrounds in N are predominantly leptons from b ! c ! `+ andc! `+. The calculation of the purity factors (F , F=), and F !) allows for themodel dependencies described above; F ranges from 0.748 to 0.763, F=) rangesfrom 0.508 to 0.516, and F ! is typically between 0.868 and 0.872. There arealso contaminants from lepton misidenti�cation, and the rates of these processes
are taken from the data, using the methods described in reference [1].The backgrounds in D=) are predominantly from J/ , which at LEP is
produced from b decay. The contribution to the total uncertainty from theB ! J/ +X branching ratio is however small.
Cascade decays b ! (cs) ! `� occur at a lower rate than b ! c ! `+, and
they have a softer p? spectrum. Such decays contribute to D=) only when boththe c and (cs) decay semileptonically, but can contribute to D ! when either
decays semileptonically. At p? of 1.25GeV/c or more however, b ! (cs) ! `�
makes a very small contribution to the dilepton samples (see table 7) and thiscorrection is unimportant.
The ratio �``=�2` is 1:073� 0:019, from a Monte Carlo study using about 13000
events with semileptonic decays on both sides. 1 With this substitution, the
measured branching ratio is seen to be inversely proportional to the e�ciency.
The ISGW�� model predicts a softer p? spectrum than the ACCMM model, andconsequently, the e�ciency to detect semileptonic b decays after a p? cut is lowerin the ISGW�� model by 9%, and this is re ected in the second part of table 5.
1The thrust axis cut at 0.9 is not used in this analysis.
13
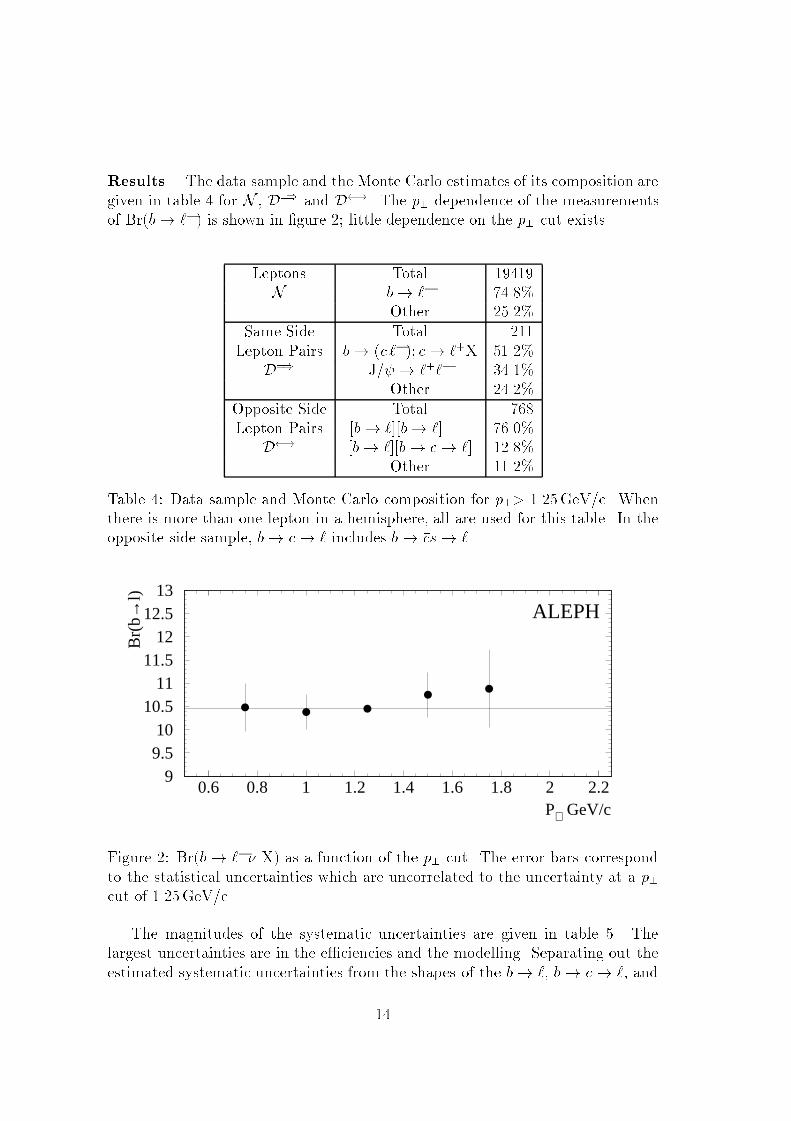
Results. The data sample and the Monte Carlo estimates of its composition are
given in table 4 for N , D=) and D !. The p? dependence of the measurements
of Br(b! `�) is shown in �gure 2; little dependence on the p? cut exists.
Leptons Total 19419N b! `� 74.8%
Other 25.2%
Same Side Total 211
Lepton Pairs b! (c `�); c! `+X 51.2%D=) J/ ! `+`� 34.1%
Other 24.2%
Opposite Side Total 768Lepton Pairs [b! `][b! `] 76.0%
D ! [b! `][b! c! `] 12.8%Other 11.2%
Table 4: Data sample and Monte Carlo composition for p?> 1.25GeV/c. Whenthere is more than one lepton in a hemisphere, all are used for this table. In theopposite side sample, b! c! ` includes b! �cs! `.
99.510
10.511
11.512
12.513
0.6 0.8 1 1.2 1.4 1.6 1.8 2 2.2
ALEPH
P⊥ GeV/c
Br(
b→l)
Figure 2: Br(b! `��� X) as a function of the p? cut. The error bars correspond
to the statistical uncertainties which are uncorrelated to the uncertainty at a p?cut of 1.25GeV/c.
The magnitudes of the systematic uncertainties are given in table 5. Thelargest uncertainties are in the e�ciencies and the modelling. Separating out the
estimated systematic uncertainties from the shapes of the b! `, b! c! `, and
14
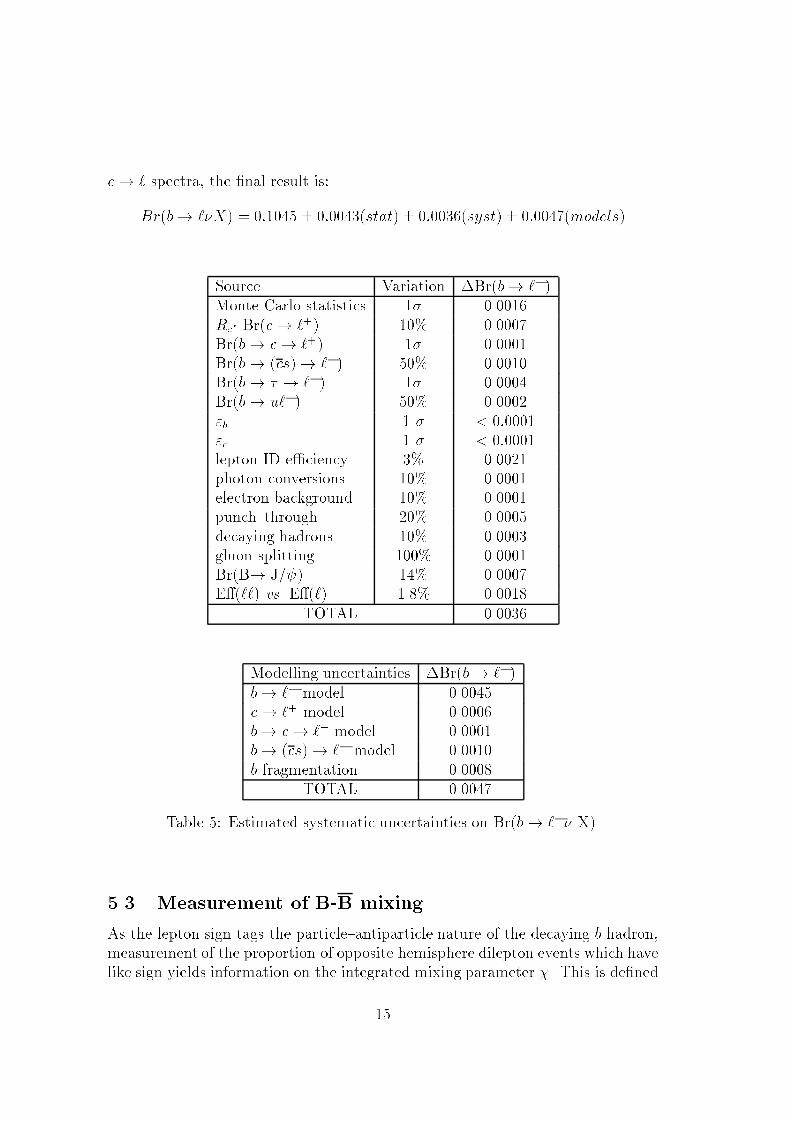
c! ` spectra, the �nal result is:
Br(b! `�X) = 0:1045 � 0:0043(stat)� 0:0036(syst)� 0:0047(models)
Source Variation �Br(b! `�)
Monte Carlo statistics 1� 0.0016
Rc� Br(c! `+) 10% 0.0007Br(b! c! `+) 1� 0.0001
Br(b! (cs)! `�) 50% 0.0010Br(b! � ! `�) 1� 0.0004
Br(b! u`�) 50% 0.0002
"b 1 � < 0:0001"c 1 � < 0:0001lepton ID e�ciency 3% 0.0021photon conversions 10% 0.0001electron background 10% 0.0001
punch{through 20% 0.0005
decaying hadrons 10% 0.0003gluon splitting 100% 0.0001
Br(B! J/ ) 14% 0.0007E�(``) vs. E�(`) 1.8% 0.0018
TOTAL 0.0036
Modelling uncertainties �Br(b! `�)
b! `� model 0.0045c! `+ model 0.0006
b! c! `+ model 0.0001
b! (cs)! `� model 0.0010
b fragmentation 0.0008
TOTAL 0.0047
Table 5: Estimated systematic uncertainties on Br(b! `��� X).
5.3 Measurement of B-B mixing
As the lepton sign tags the particle{antiparticle nature of the decaying b hadron,
measurement of the proportion of opposite hemisphere dilepton events which havelike sign yields information on the integrated mixing parameter �. This is de�ned
15
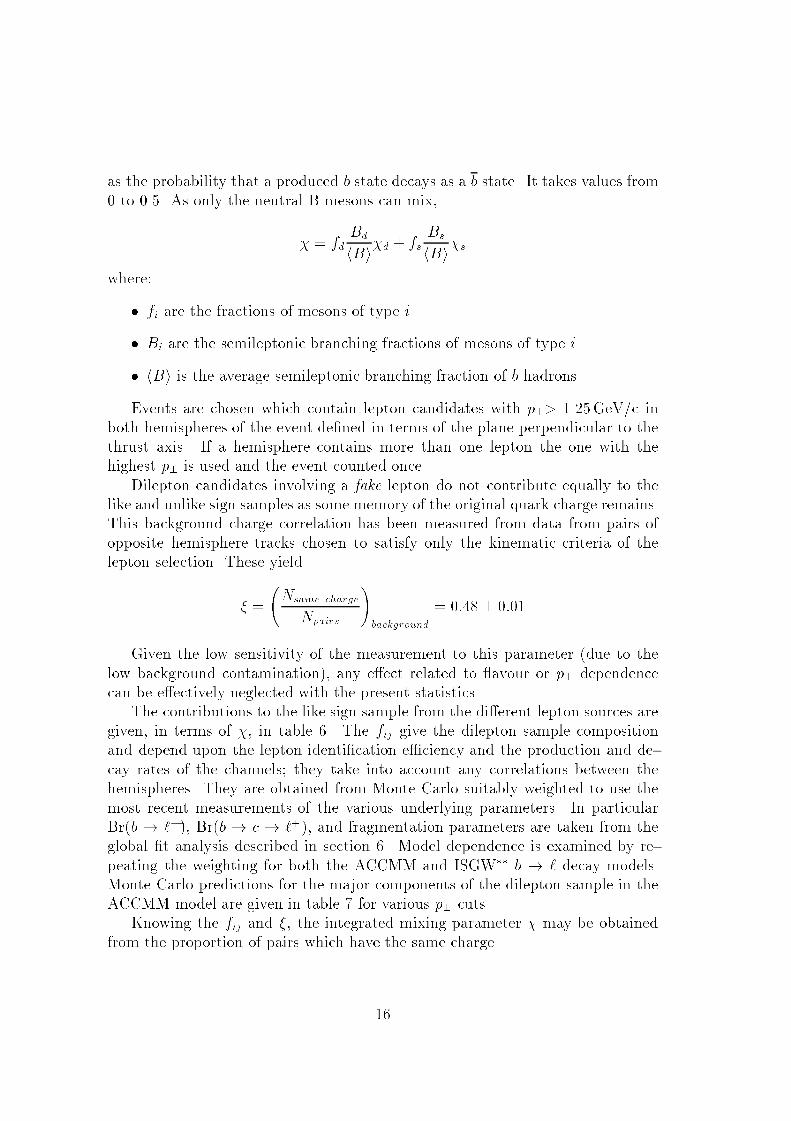
as the probability that a produced b state decays as a b state. It takes values from
0 to 0.5. As only the neutral B mesons can mix,
� = fdBd
hBi�d + fsBs
hBi�swhere:
� fi are the fractions of mesons of type i.
� Bi are the semileptonic branching fractions of mesons of type i.
� hBi is the average semileptonic branching fraction of b hadrons.
Events are chosen which contain lepton candidates with p?> 1.25GeV/c in
both hemispheres of the event de�ned in terms of the plane perpendicular to thethrust axis. If a hemisphere contains more than one lepton the one with thehighest p? is used and the event counted once.
Dilepton candidates involving a fake lepton do not contribute equally to thelike and unlike sign samples as some memory of the original quark charge remains.This background charge correlation has been measured from data from pairs ofopposite hemisphere tracks chosen to satisfy only the kinematic criteria of thelepton selection. These yield
� =
Nsame charge
Npairs
!background
= 0:48 � 0:01
Given the low sensitivity of the measurement to this parameter (due to the
low background contamination), any e�ect related to avour or p? dependencecan be e�ectively neglected with the present statistics.
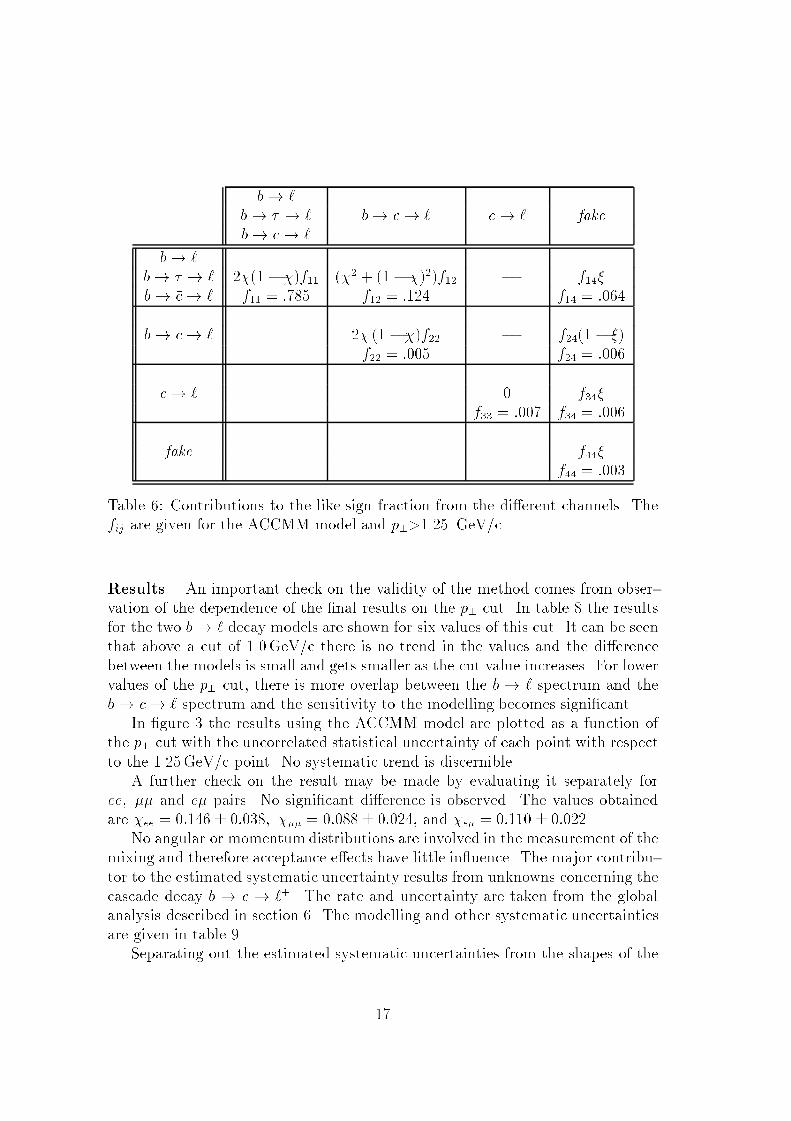
The contributions to the like sign sample from the di�erent lepton sources are
given, in terms of �, in table 6. The fij give the dilepton sample compositionand depend upon the lepton identi�cation e�ciency and the production and de-
cay rates of the channels; they take into account any correlations between thehemispheres. They are obtained from Monte Carlo suitably weighted to use the
most recent measurements of the various underlying parameters. In particular
Br(b ! `�), Br(b ! c ! `+), and fragmentation parameters are taken from theglobal �t analysis described in section 6. Model dependence is examined by re-
peating the weighting for both the ACCMM and ISGW�� b ! ` decay models.Monte Carlo predictions for the major components of the dilepton sample in the
ACCMM model are given in table 7 for various p? cuts.Knowing the fij and �, the integrated mixing parameter � may be obtained
from the proportion of pairs which have the same charge.
16
b! `
b! � ! ` b! c! ` c! ` fake
b! �c! `
b! `
b! � ! ` 2�(1� �)f11 (�2 + (1� �)2)f12 � f14�
b! �c! ` f11 = :785 f12 = :124 f14 = :064
b! c! ` 2� (1 � �)f22 � f24(1 � �)
f22 = :005 f24 = :006
c! ` 0 f34�
f33 = :007 f34 = :006
fake f44�
f44 = :003
Table 6: Contributions to the like sign fraction from the di�erent channels. Thefij are given for the ACCMM model and p?>1.25 GeV/c.
Results. An important check on the validity of the method comes from obser-vation of the dependence of the �nal results on the p? cut. In table 8 the resultsfor the two b! ` decay models are shown for six values of this cut. It can be seenthat above a cut of 1.0GeV/c there is no trend in the values and the di�erence
between the models is small and gets smaller as the cut value increases. For lowervalues of the p? cut, there is more overlap between the b ! ` spectrum and the
b! c! ` spectrum and the sensitivity to the modelling becomes signi�cant.
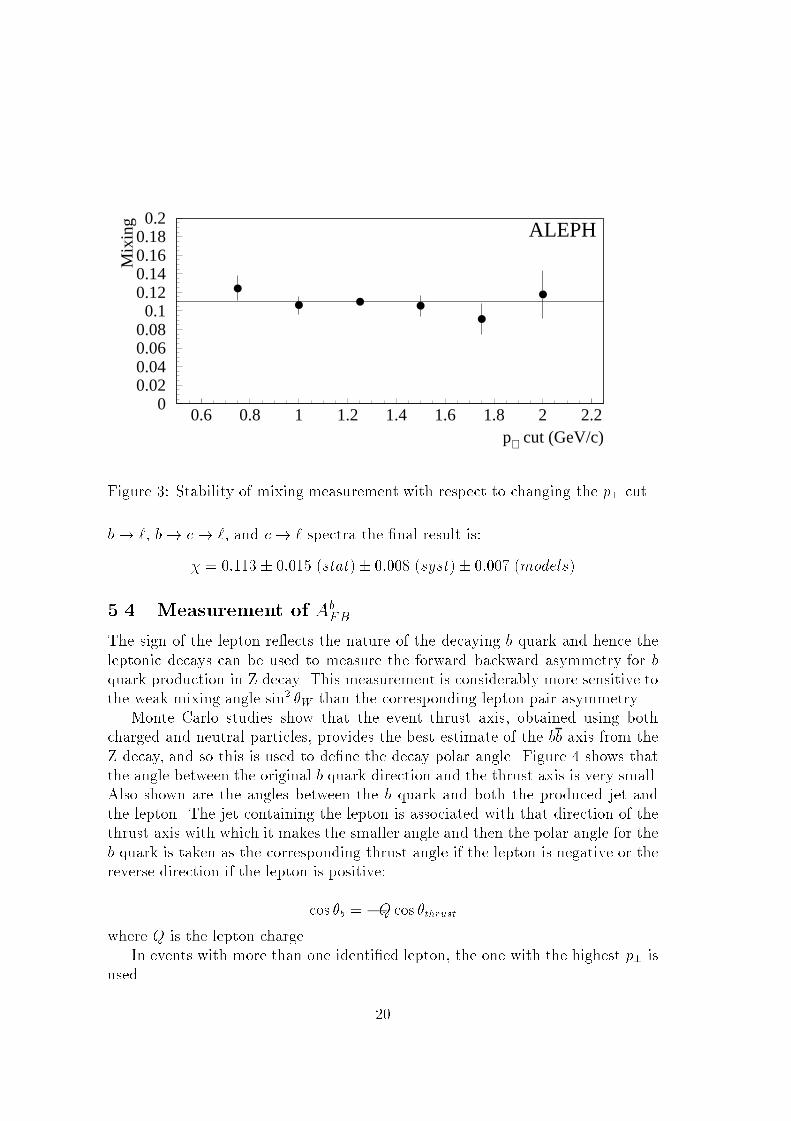
In �gure 3 the results using the ACCMM model are plotted as a function ofthe p? cut with the uncorrelated statistical uncertainty of each point with respect
to the 1.25GeV/c point. No systematic trend is discernible.A further check on the result may be made by evaluating it separately for
ee; �� and e� pairs. No signi�cant di�erence is observed. The values obtained
are �ee = 0:146 � 0:038; ��� = 0:088 � 0:024; and �e� = 0:110 � 0:022.No angular or momentumdistributions are involved in the measurement of the
mixing and therefore acceptance e�ects have little in uence. The major contribu-
tor to the estimated systematic uncertainty results from unknowns concerning the
cascade decay b ! c ! `+. The rate and uncertainty are taken from the global
analysis described in section 6. The modelling and other systematic uncertaintiesare given in table 9.
Separating out the estimated systematic uncertainties from the shapes of the
17
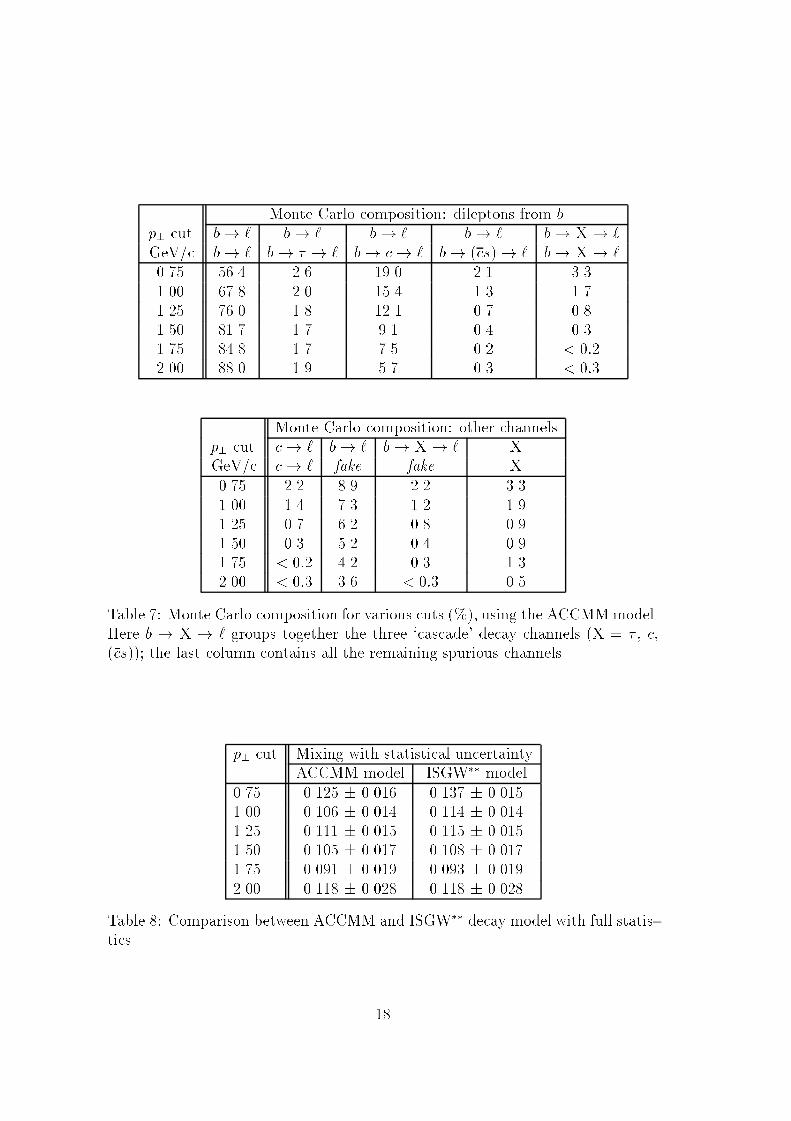
Monte Carlo composition: dileptons from b
p? cut b! ` b! ` b! ` b! ` b! X ! `
GeV/c b! ` b! � ! ` b! c! ` b! (cs)! ` b! X ! `
0.75 56.4 2.6 19.0 2.1 3.3
1.00 67.8 2.0 15.4 1.3 1.71.25 76.0 1.8 12.1 0.7 0.8
1.50 81.7 1.7 9.1 0.4 0.3
1.75 84.8 1.7 7.5 0.2 < 0:22.00 88.0 1.9 5.7 0.3 < 0:3
Monte Carlo composition: other channelsp? cut c! ` b! ` b! X ! ` XGeV/c c! ` fake fake X
0.75 2.2 8.9 2.2 3.3
1.00 1.4 7.3 1.2 1.91.25 0.7 6.2 0.8 0.91.50 0.3 5.2 0.4 0.91.75 < 0:2 4.2 0.3 1.3
2.00 < 0:3 3.6 < 0:3 0.5
Table 7: Monte Carlo composition for various cuts (%), using the ACCMMmodel.Here b ! X ! ` groups together the three `cascade' decay channels (X = � , c,(�cs)); the last column contains all the remaining spurious channels.
p? cut Mixing with statistical uncertaintyACCMM model ISGW�� model
0.75 0.125 � 0.016 0.137 � 0.015
1.00 0.106 � 0.014 0.114 � 0.0141.25 0.111 � 0.015 0.115 � 0.015
1.50 0.105 � 0.017 0.108 � 0.017
1.75 0.091 � 0.019 0.093 � 0.019
2.00 0.118 � 0.028 0.118 � 0.028
Table 8: Comparison between ACCMM and ISGW�� decay model with full statis-tics.
18
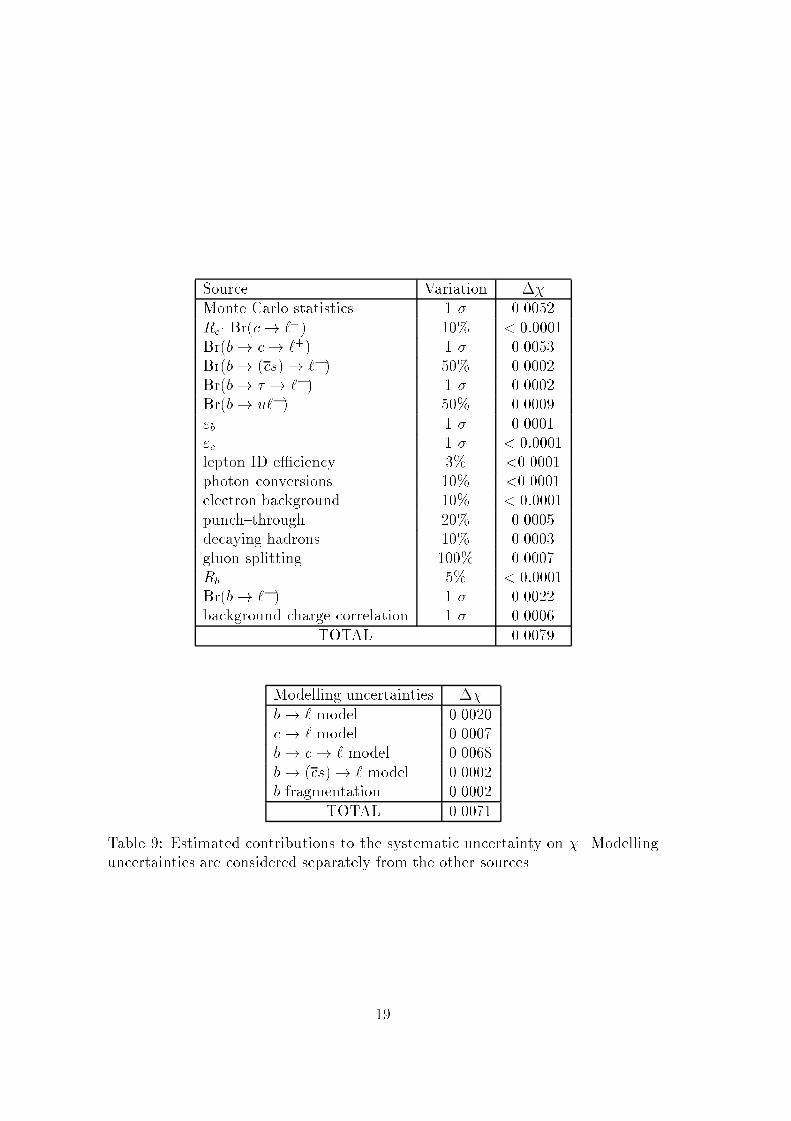
Source Variation ��
Monte Carlo statistics 1 � 0.0052
Rc� Br(c! `+) 10% < 0:0001
Br(b! c! `+) 1 � 0.0053Br(b! (cs)! `�) 50% 0.0002
Br(b! � ! `�) 1 � 0.0002Br(b! u`�) 50% 0.0009
"b 1 � 0.0001"c 1 � < 0:0001
lepton ID e�ciency 3% <0.0001photon conversions 10% <0.0001electron background 10% < 0:0001
punch{through 20% 0.0005
decaying hadrons 10% 0.0003gluon splitting 100% 0.0007Rb 5% < 0:0001Br(b! `�) 1 � 0.0022background charge correlation 1 � 0.0006
TOTAL 0.0079
Modelling uncertainties ��
b! ` model 0.0020
c! ` model 0.0007b! c! ` model 0.0068
b! (cs)! ` model 0.0002b fragmentation 0.0002
TOTAL 0.0071
Table 9: Estimated contributions to the systematic uncertainty on �. Modelling
uncertainties are considered separately from the other sources.
19
00.020.040.060.080.1
0.120.140.160.180.2
0.6 0.8 1 1.2 1.4 1.6 1.8 2 2.2p⊥ cut (GeV/c)
Mix
ing ALEPH
Figure 3: Stability of mixing measurement with respect to changing the p? cut.
b! `, b! c! `, and c! ` spectra the �nal result is:
� = 0:113 � 0:015 (stat)� 0:008 (syst)� 0:007 (models)
5.4 Measurement of AbFB
The sign of the lepton re ects the nature of the decaying b quark and hence the
leptonic decays can be used to measure the forward{backward asymmetry for bquark production in Z decay. This measurement is considerably more sensitive to
the weak mixing angle sin2 �W than the corresponding lepton pair asymmetry.
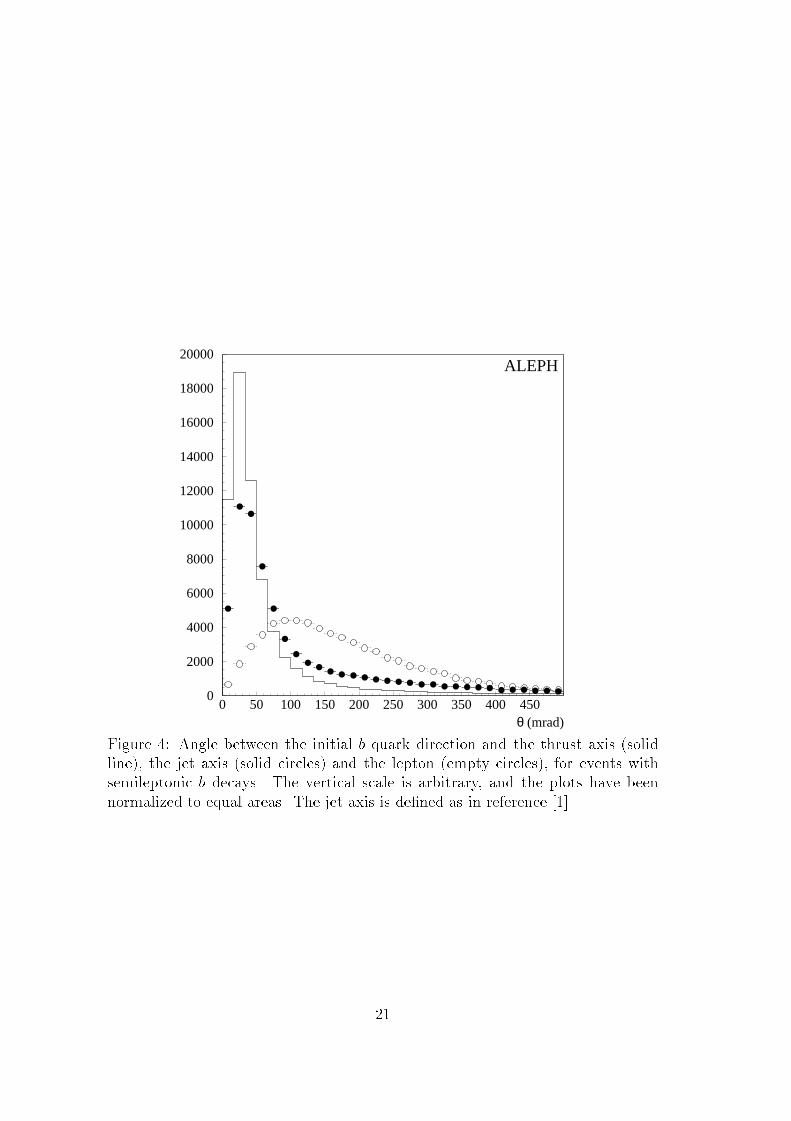
Monte Carlo studies show that the event thrust axis, obtained using bothcharged and neutral particles, provides the best estimate of the bb axis from the
Z decay, and so this is used to de�ne the decay polar angle. Figure 4 shows thatthe angle between the original b quark direction and the thrust axis is very small.
Also shown are the angles between the b quark and both the produced jet and
the lepton. The jet containing the lepton is associated with that direction of thethrust axis with which it makes the smaller angle and then the polar angle for the
b quark is taken as the corresponding thrust angle if the lepton is negative or thereverse direction if the lepton is positive:
cos �b = �Q cos �thrust
where Q is the lepton charge.
In events with more than one identi�ed lepton, the one with the highest p? is
used.
20
0
2000
4000
6000
8000
10000
12000
14000
16000
18000
20000
0 50 100 150 200 250 300 350 400 450θ (mrad)
ALEPH
Figure 4: Angle between the initial b quark direction and the thrust axis (solid
line), the jet axis (solid circles) and the lepton (empty circles), for events with
semileptonic b decays. The vertical scale is arbitrary, and the plots have been
normalized to equal areas. The jet axis is de�ned as in reference [1].
21
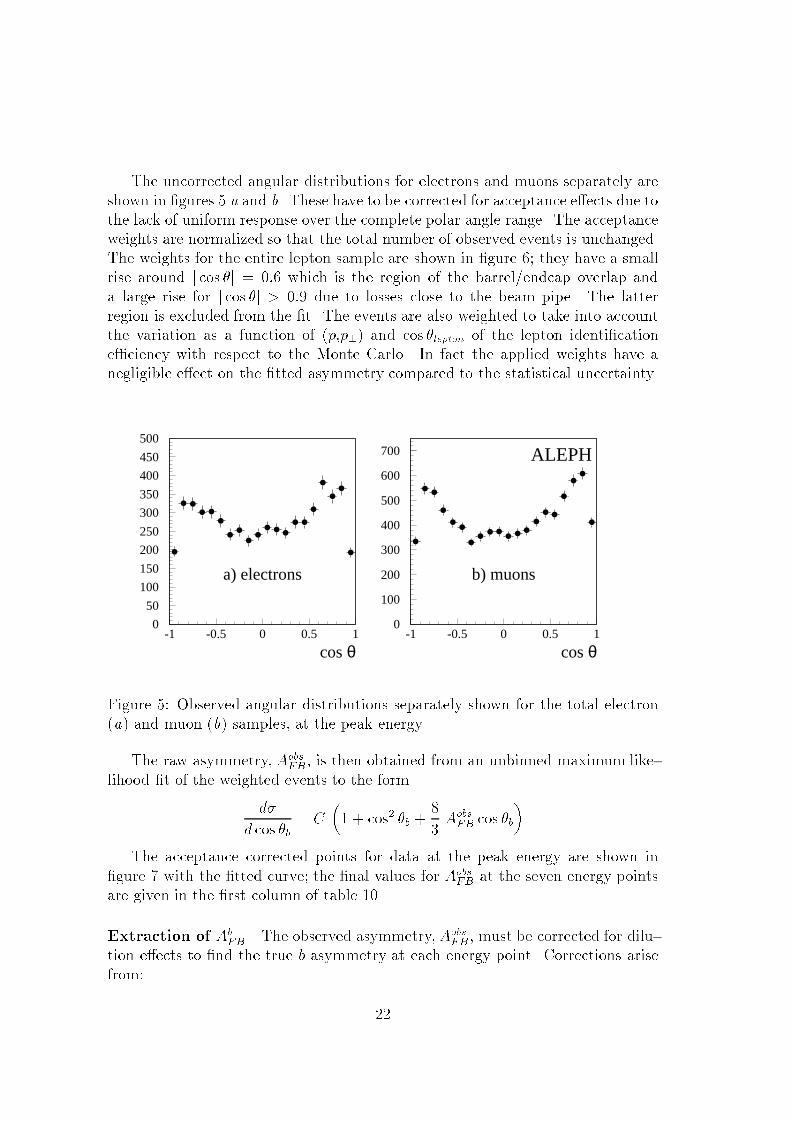
The uncorrected angular distributions for electrons and muons separately are
shown in �gures 5 a and b. These have to be corrected for acceptance e�ects due to
the lack of uniform response over the complete polar angle range. The acceptance
weights are normalized so that the total number of observed events is unchanged.
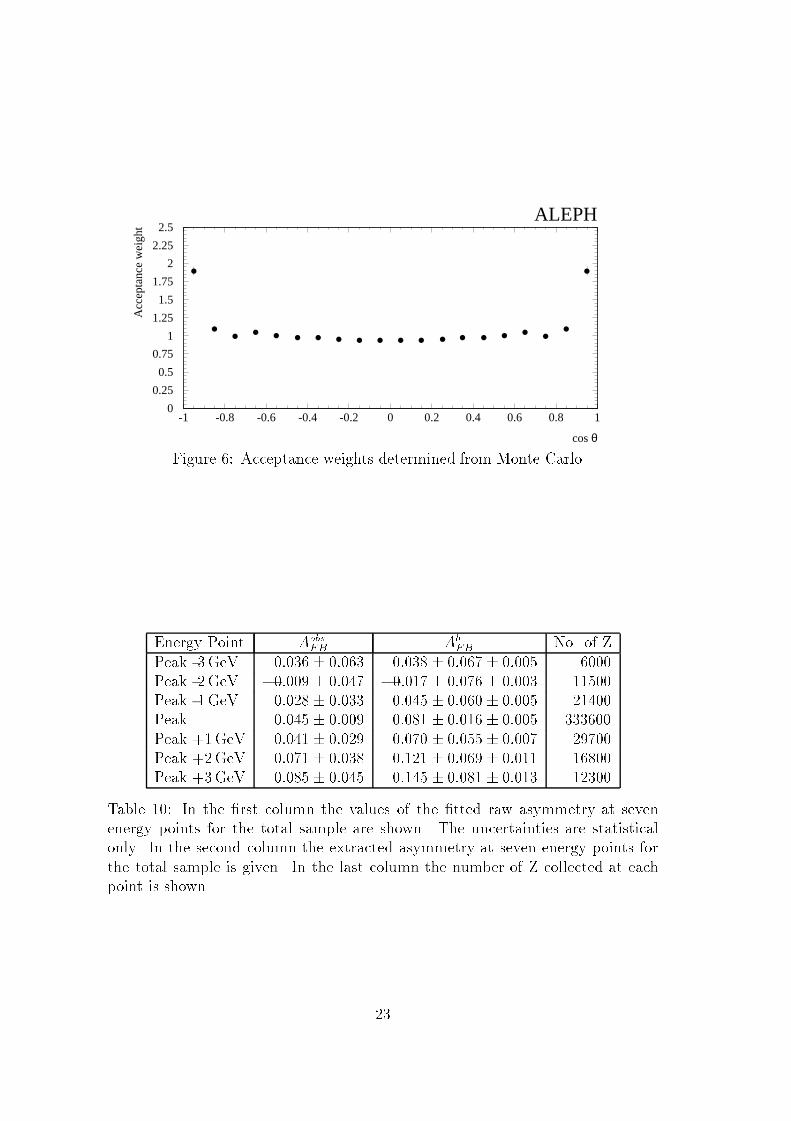
The weights for the entire lepton sample are shown in �gure 6; they have a small
rise around j cos �j = 0:6 which is the region of the barrel/endcap overlap and
a large rise for j cos �j > 0:9 due to losses close to the beam pipe. The latter
region is excluded from the �t. The events are also weighted to take into account
the variation as a function of (p,p?) and cos �lepton of the lepton identi�cation
e�ciency with respect to the Monte Carlo. In fact the applied weights have a
negligible e�ect on the �tted asymmetry compared to the statistical uncertainty.
0
50
100
150
200
250
300
350
400
450
500
-1 -0.5 0 0.5 1
cos θ
a) electrons
0
100
200
300
400
500
600
700
-1 -0.5 0 0.5 1
cos θ
b) muons
ALEPH
Figure 5: Observed angular distributions separately shown for the total electron(a) and muon (b) samples, at the peak energy.
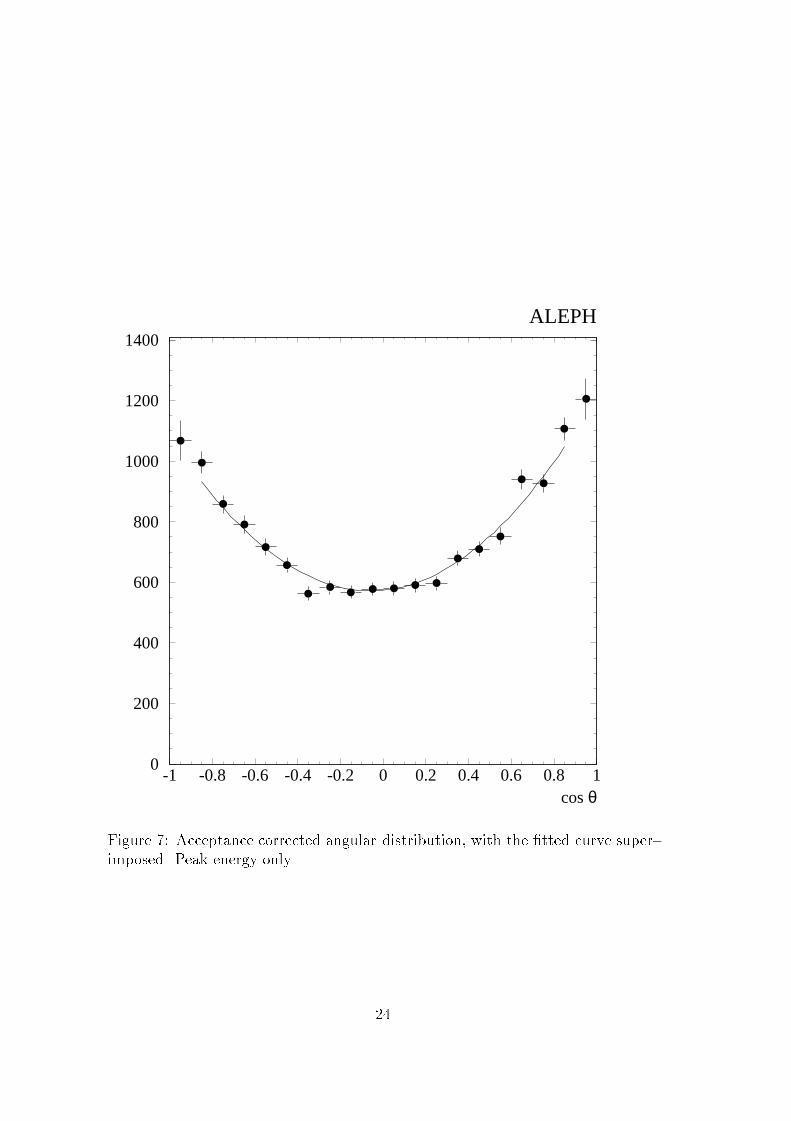
The raw asymmetry, AobsFB, is then obtained from an unbinned maximum like-
lihood �t of the weighted events to the form
d�
d cos �b= C
�1 + cos2 �b +
8
3AobsFB cos �b
�
The acceptance corrected points for data at the peak energy are shown in
�gure 7 with the �tted curve; the �nal values for AobsFB at the seven energy points
are given in the �rst column of table 10.
Extraction of AbFB The observed asymmetry,Aobs
FB, must be corrected for dilu-
tion e�ects to �nd the true b asymmetry at each energy point. Corrections arise
from:
22
0
0.25
0.5
0.75
1
1.25
1.5
1.75
2
2.25
2.5
-1 -0.8 -0.6 -0.4 -0.2 0 0.2 0.4 0.6 0.8 1
ALEPH
cos θ
Acc
epta
nce
wei
ght
Figure 6: Acceptance weights determined from Monte Carlo.
Energy Point AobsFB Ab
FB No. of Z
Peak -3GeV 0:036 � 0:063 0:038 � 0:067 � 0:005 6000Peak -2GeV �0:009 � 0:047 �0:017� 0:076 � 0:003 11500
Peak -1GeV 0:028 � 0:033 0:045 � 0:060 � 0:005 21400Peak 0:045 � 0:009 0:081 � 0:016 � 0:005 333600
Peak +1GeV 0:041 � 0:029 0:070 � 0:055 � 0:007 29700
Peak +2GeV 0:071 � 0:038 0:121 � 0:069 � 0:011 16800Peak +3GeV 0:085 � 0:045 0:145 � 0:081 � 0:013 12300
Table 10: In the �rst column the values of the �tted raw asymmetry at seven
energy points for the total sample are shown. The uncertainties are statisticalonly. In the second column the extracted asymmetry at seven energy points for
the total sample is given. In the last column the number of Z collected at each
point is shown.
23
0
200
400
600
800
1000
1200
1400
-1 -0.8 -0.6 -0.4 -0.2 0 0.2 0.4 0.6 0.8 1
ALEPH
cos θ
Figure 7: Acceptance corrected angular distribution, with the �tted curve super-imposed. Peak energy only.
24
� Leptons resulting from b hadrons which have mixed and therefore have the
wrong sign.
� Leptons resulting from the cascade decay b! c! `+ which yield the wrong
charge and hence the reverse direction for the b quark.
� Backgrounds from charm and light quark production in the selected sample.
The true b asymmetry, AbFB, is obtained from
AbFB =
AobsFB + �c!`A
cFB � �bkgA
bkgFB
(1 � 2�) (�b!` + �b!�!` + �b!�c!` � �b!c!`)
where the �i are the fractional contributions of process i to the �nal sample com-
position and AbkgFB is the asymmetry of the light quark contaminants.
For the small charm contribution the Standard Model is used to relate AcFB
to AbFB. The ratio
� =AcFB
AbFB
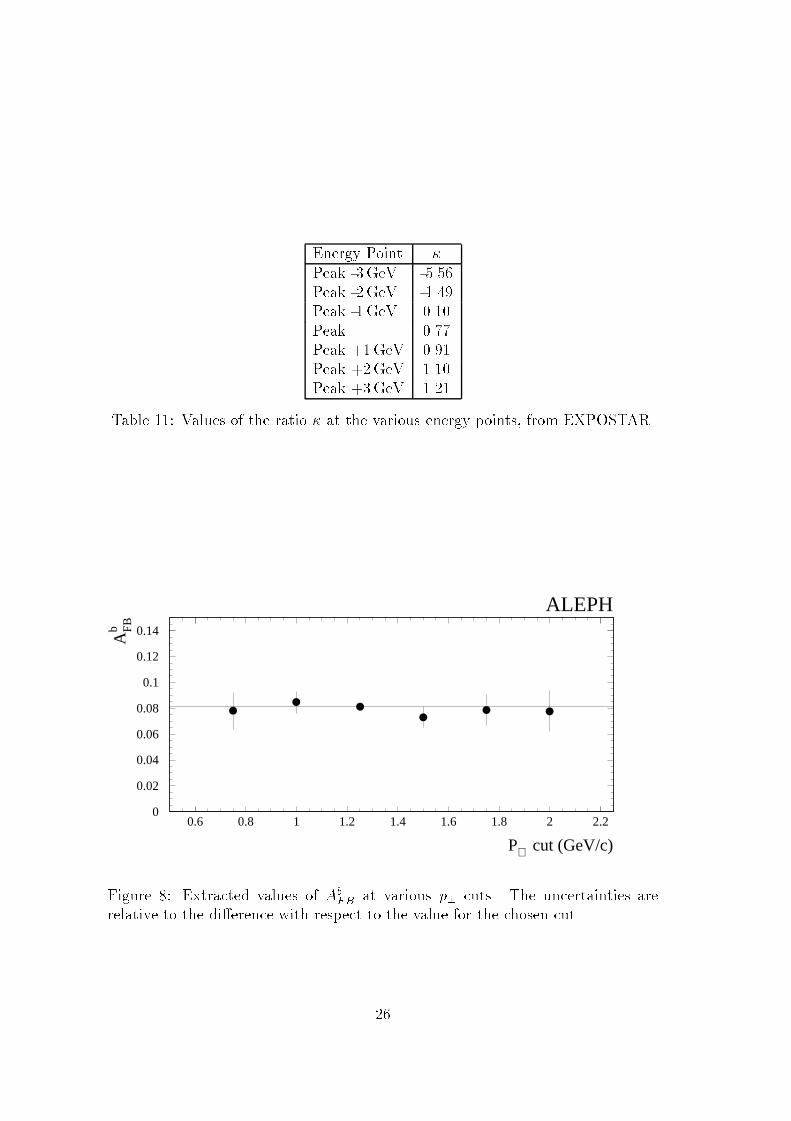
is well predicted in the Standard Model and has almost no dependence on the topmass. The values of � used at the di�erent centre of mass energies are taken from
EXPOSTAR [23] and listed in table 11.The �i are determined from the Monte Carlo simulation using Br(b! `�) and
Br(b ! c ! `+) from the global �t; the proportions have been given in table 1.The use of di�erent decay models for the b! `� spectrum has in practice no e�ecton the asymmetry and so only results from the ACCMM modelling are shown.
The background asymmetry resulting from non{prompt leptons and misiden-ti�ed hadrons in the sample is also taken from the Monte Carlo. It is found tobe
AbkgFB = 0:014 � 0:007
and is nonzero due to residual leading particle e�ects which are preferentially
selected by the lepton kinematic cuts.
Further corrections are required to obtain the Born level asymmetry at thepeak, A0
FB(b), from which sin2 �effW can be obtained. The only signi�cant onesresult from corrections for initial state photon radiation which decreases the e�ec-
tive centre of mass energy and �nal state gluon bremsstrahlung which decreases
the asymmetry. They are discussed in section 7.
Results. The stability of the extracted value of AbFB as a function of the p? cut
chosen is shown in �gure 8.
The uncertainties relate to the statistical di�erences of each point with re-spect to the standard cut at 1.25GeV/c. There is no evidence of any systematic
dependence on the cut value.
25
Energy Point �
Peak -3GeV -5.56Peak -2GeV -1.49
Peak -1GeV 0.10
Peak 0.77Peak +1GeV 0.91
Peak +2GeV 1.10Peak +3GeV 1.21
Table 11: Values of the ratio � at the various energy points, from EXPOSTAR.
0
0.02
0.04
0.06
0.08
0.1
0.12
0.14
0.6 0.8 1 1.2 1.4 1.6 1.8 2 2.2
P⊥ cut (GeV/c)
Ab F
B
ALEPH
Figure 8: Extracted values of AbFB at various p? cuts. The uncertainties are
relative to the di�erence with respect to the value for the chosen cut.
26
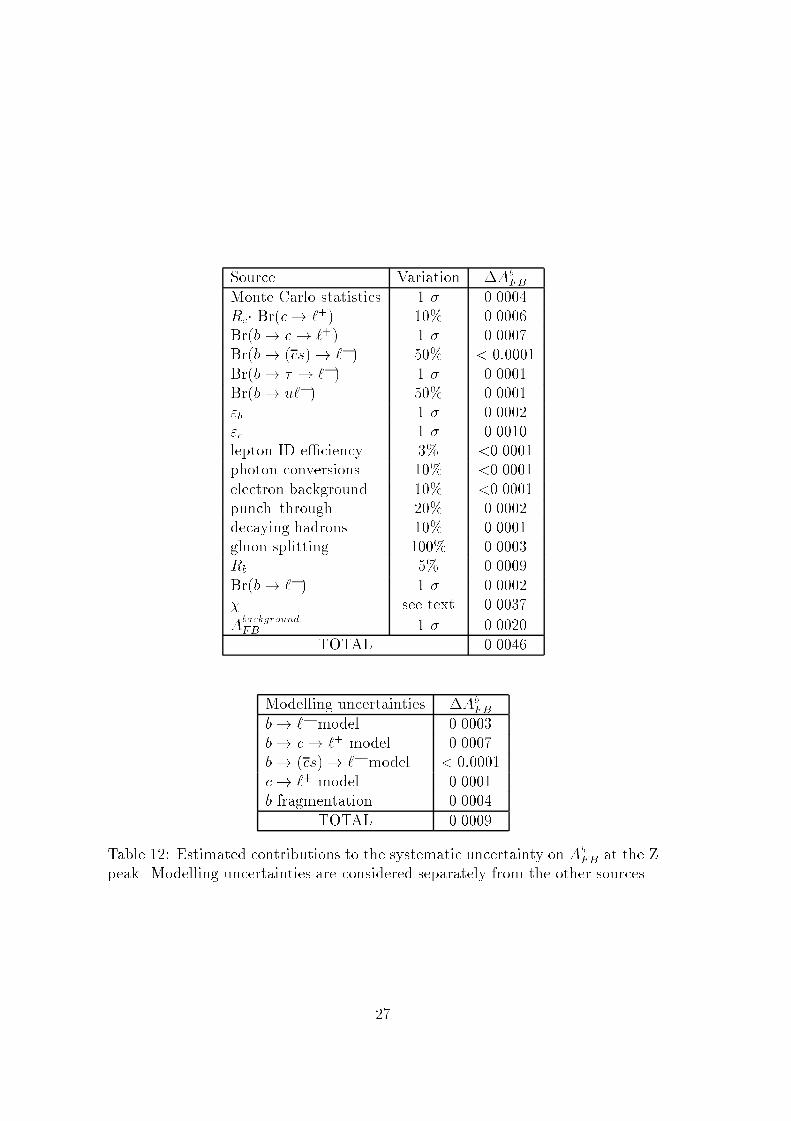
Source Variation �AbFB
Monte Carlo statistics 1 � 0.0004Rc� Br(c! `+) 10% 0.0006
Br(b! c! `+) 1 � 0.0007Br(b! (cs)! `�) 50% < 0:0001
Br(b! � ! `�) 1 � 0.0001
Br(b! u`�) 50% 0.0001"b 1 � 0.0002
"c 1 � 0.0010lepton ID e�ciency 3% <0.0001photon conversions 10% <0.0001
electron background 10% <0.0001punch{through 20% 0.0002decaying hadrons 10% 0.0001gluon splitting 100% 0.0003
Rb 5% 0.0009
Br(b! `�) 1 � 0.0002� see text 0.0037
AbackgroundFB 1 � 0.0020
TOTAL 0.0046
Modelling uncertainties �AbFB
b! `� model 0.0003
b! c! `+ model 0.0007
b! (cs)! `� model < 0:0001
c! `+ model 0.0001b fragmentation 0.0004
TOTAL 0.0009
Table 12: Estimated contributions to the systematic uncertainty on AbFB at the Z
peak. Modelling uncertainties are considered separately from the other sources.
27
The Aleph detector is symmetric with respect to the polar angle. Detector
inhomogeneities can only cause a systematic problem for the asymmetry measure-
ment if they are, at the same time, both forward{backward and charge asymmet-
ric. Examination of dimuon and Bhabha pairs reveal no such correlated asymme-
try within the apparatus. Simulations also show that the use of the thrust axis to
approximate the quark direction produces a negligible e�ect on the asymmetry.
The estimated systematic error in the measurement of AbFB is dominated by
the corrections which must be applied to AobsFB. The most signi�cant arises from
the mixing correction, for which � is taken from the previous analysis. However,
when calculating the contribution from � to the systematic error, allowance is
made for the contributions to �� resulting from uncertainties which are explicitly
considered for the asymmetry.
The next most signi�cant contribution arises from the background asymmetry
whose uncertainty is given by the statistical error on the Monte Carlo sample. Itis considerably smaller than the mixing uncertainty. Other contributions to thesystematic error are listed in table 12.
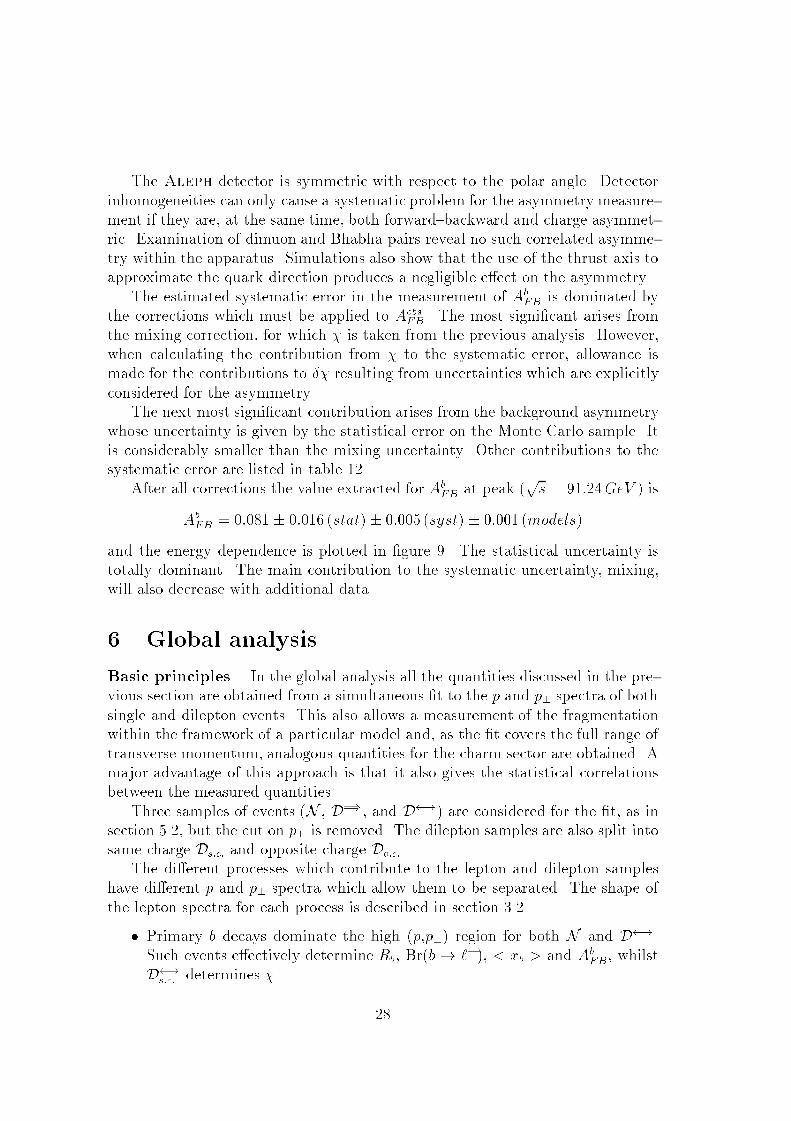
After all corrections the value extracted for AbFB at peak (
ps = 91:24GeV ) is
AbFB = 0:081 � 0:016 (stat)� 0:005 (syst) � 0:001 (models)
and the energy dependence is plotted in �gure 9. The statistical uncertainty istotally dominant. The main contribution to the systematic uncertainty, mixing,will also decrease with additional data.
6 Global analysis
Basic principles. In the global analysis all the quantities discussed in the pre-
vious section are obtained from a simultaneous �t to the p and p? spectra of both
single and dilepton events. This also allows a measurement of the fragmentation
within the framework of a particular model and, as the �t covers the full range oftransverse momentum, analogous quantities for the charm sector are obtained. Amajor advantage of this approach is that it also gives the statistical correlations
between the measured quantities.
Three samples of events (N , D=), and D !) are considered for the �t, as insection 5.2, but the cut on p? is removed. The dilepton samples are also split into
same charge Ds:c: and opposite charge Do:c:.The di�erent processes which contribute to the lepton and dilepton samples
have di�erent p and p? spectra which allow them to be separated. The shape of
the lepton spectra for each process is described in section 3.2.
� Primary b decays dominate the high (p,p?) region for both N and D !.Such events e�ectively determine Rb, Br(b! `�), < xb > and Ab
FB, whilst
D !s:c: determines �.
28
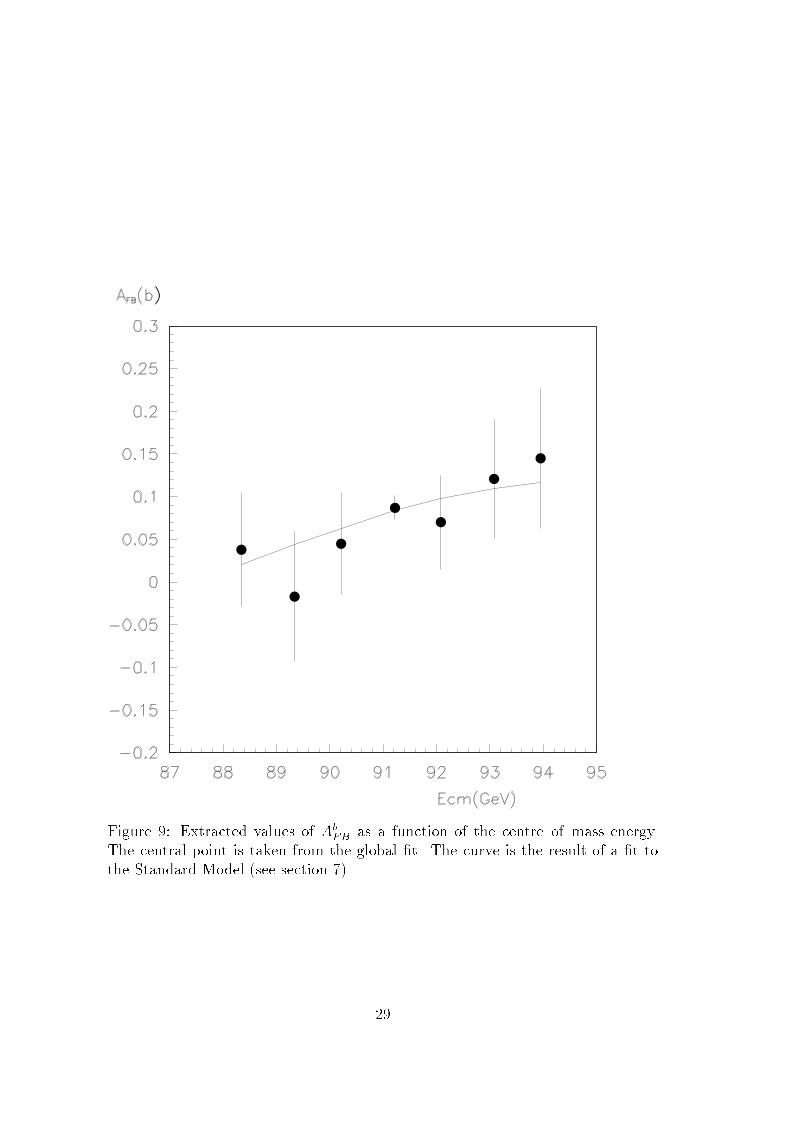
Figure 9: Extracted values of AbFB as a function of the centre{of{mass energy.
The central point is taken from the global �t. The curve is the result of a �t tothe Standard Model (see section 7).
29
� Cascade b decays have softer spectra for both p and p?. Events with one of
the leptons from a cascade decay dominate D=)o:c: and yield a measurement
of Br(b! c! `+).
� Leptons from charm decay populate the low p? region of N and D !o:c: and
enable measurements of Rc, AcFB, and < xc >. In principle one could also
determine Br(c ! `+) from the low p? dileptons, but the overlap with the
cascade decays makes separation di�cult with present statistics.
� The rates Br(b! � ! `�), Br(b! (cs) ! `�), and Br(c ! `+) are taken
from the best measurements available as described in section 4.1.
� The (p,p?) distributions of the fake sample are taken from Monte Carlo
simulation, after corrections for lepton identi�cation e�ciencies and con-
taminations as described in reference [1].
Choice of kinematic variables. For each lepton pair there are essentiallyfour kinematic quantities, pki, p?i (i = 1; 2) with pk and p? being the longitudinaland transverse components of the lepton momentum with respect to the jet axis.
Combinations of these were examined using a Fisher test method to maximizediscrimination of the (b ! `�) (�b ! `+) component from the others. The bestvariable was found to be
P = p?1pk2 + p?2pk1
similar to the one originally proposed by Mark II [24]. A second variable P?m =Min(p?1; p?2) is chosen because of its good discriminating power and its limited
correlation with P.These variables are also e�ective for the D=)
o:c: dilepton component where thesignal events result from b ! (c `�); c ! `+X. Dilepton decays of the J/ are
a major contaminant but these two processes populate di�erent areas of the(P,P?m) plane and so the analysis becomes insensitive to uncertainties in the
B ! J/ +X branching ratio.
Analysis procedure. Leptons are analysed in the (p,p?,�Q cos �) space while
both sets of dileptons are analysed in the (P,P?m) plane. The de�nition of
�Q cos � is the same as in section 5.4. Results are obtained from a binned maxi-mum likelihood �t of the weighted Monte Carlo assuming Poissonian uctuations.
The likelihood is the sum of three components from N , D ! and D=); the
likelihood function is given in the appendix. In the �t, only the fragmentation
parameters < xb > and < xc > distort the (p,p?) spectra; all the other parameters
appear as simple multiplicative numbers for the various components.All lepton candidates with p> 3GeV/c are used for all measurements except
as follows:
30
� As AbFB is energy dependent, the distribution in �Q cos � was only consid-
ered at the peak energy of 91.24 GeV.
� The dilepton charge information was only used for the mixing measurement
when both leptons had p?> 1.0GeV/c. As was demonstrated in section 5.3,
use of the ISGW�� b! `� decay model rather than ACCMM starts to have a
signi�cant e�ect as the p? region is extended to lower values. This is because
the softer spectrum reduces the b ! c ! `+ component which is the prin-
cipal background source. The cut at 1.0GeV/c provides the most accurate
value for � from the global analysis when both statistical and systematic
uncertainties are taken into account.
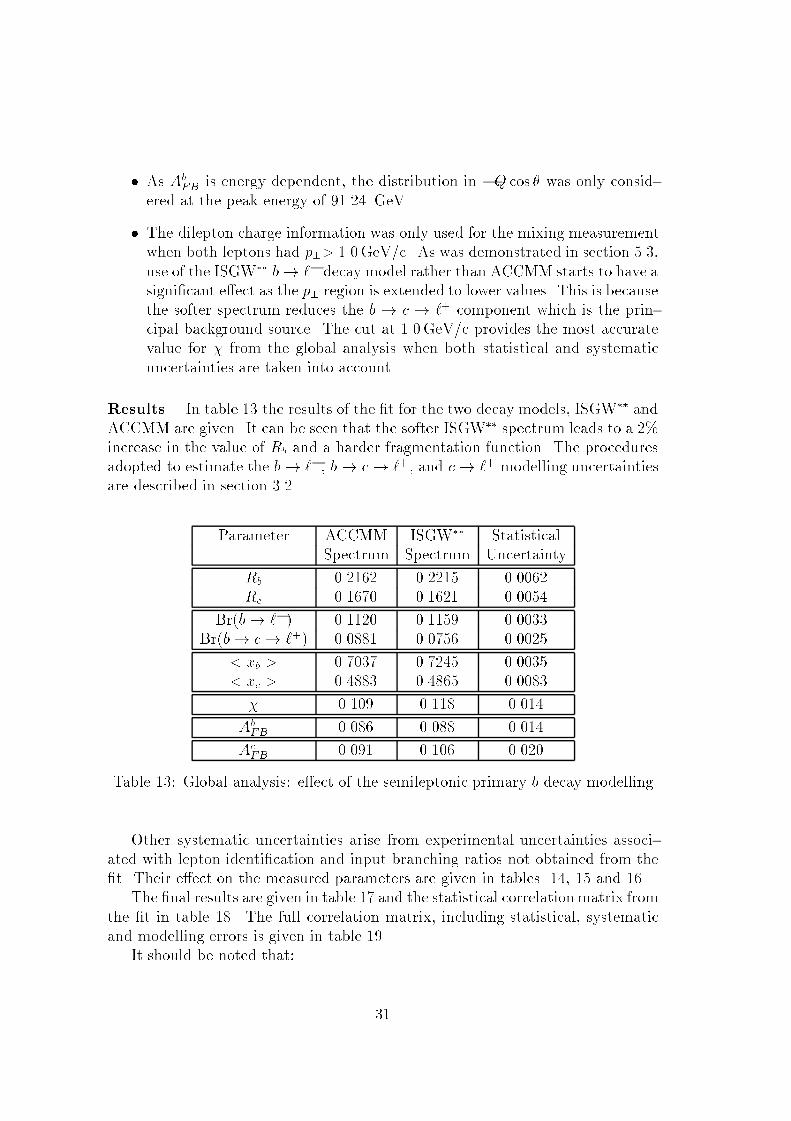
Results. In table 13 the results of the �t for the two decay models, ISGW�� and
ACCMM are given. It can be seen that the softer ISGW�� spectrum leads to a 2%increase in the value of Rb and a harder fragmentation function. The proceduresadopted to estimate the b! `�, b! c! `+, and c! `+ modelling uncertaintiesare described in section 3.2.
Parameter ACCMM ISGW�� StatisticalSpectrum Spectrum Uncertainty
Rb 0.2162 0.2215 0.0062
Rc 0.1670 0.1621 0.0054
Br(b! `�) 0.1120 0.1159 0.0033Br(b! c! `+) 0.0881 0.0756 0.0025
< xb > 0.7037 0.7245 0.0035< xc > 0.4883 0.4865 0.0083
� 0.109 0.118 0.014
AbFB 0.086 0.088 0.014
AcFB 0.091 0.106 0.020
Table 13: Global analysis: e�ect of the semileptonic primary b decay modelling
Other systematic uncertainties arise from experimental uncertainties associ-
ated with lepton identi�cation and input branching ratios not obtained from the
�t. Their e�ect on the measured parameters are given in tables 14, 15 and 16.The �nal results are given in table 17 and the statistical correlation matrix from
the �t in table 18. The full correlation matrix, including statistical, systematicand modelling errors is given in table 19.
It should be noted that:
31
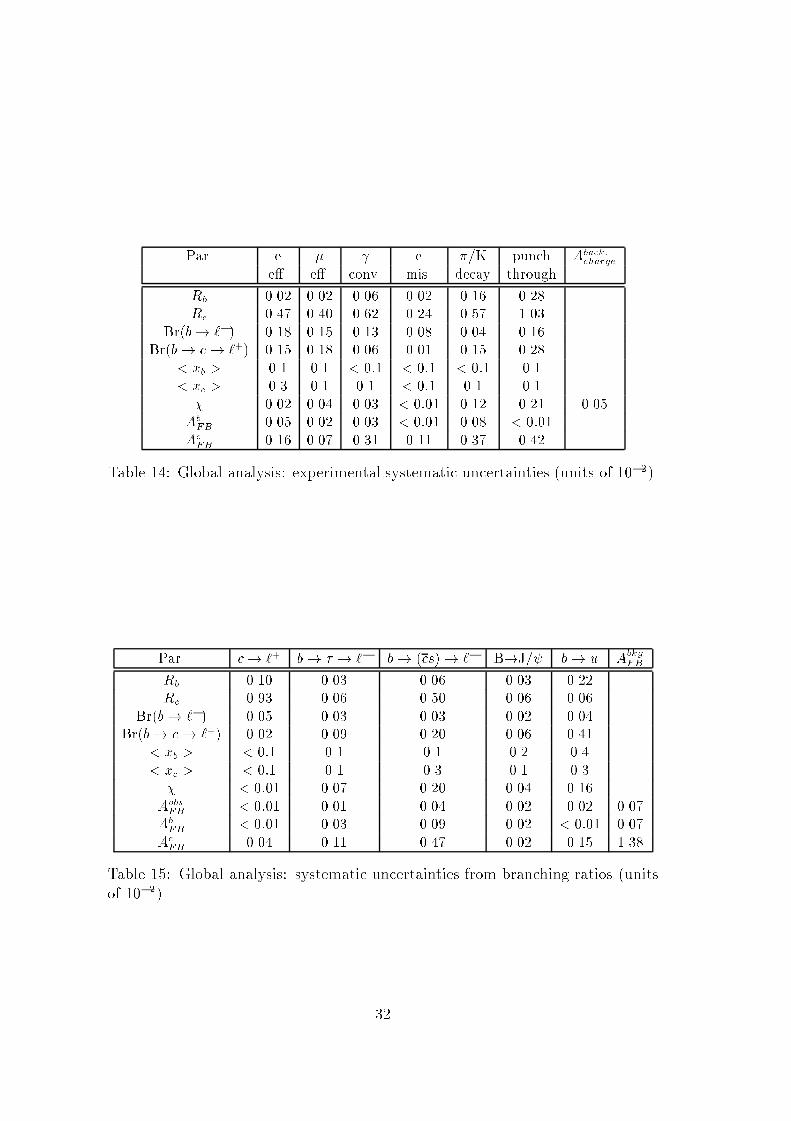
Par. e � e �/K punch Aback:charge
e�. e�. conv. mis. decay through
Rb 0.02 0.02 0.06 0.02 0.16 0.28
Rc 0.47 0.40 0.62 0.24 0.57 1.03
Br(b! `�) 0.18 0.15 0.13 0.08 0.04 0.16
Br(b! c! `+) 0.15 0.18 0.06 0.01 0.15 0.28
< xb > 0.1 0.1 < 0:1 < 0:1 < 0:1 0.1
< xc > 0.3 0.1 0.1 < 0:1 0.1 0.1
� 0.02 0.04 0.03 < 0:01 0.12 0.21 0.05
AbFB 0.05 0.02 0.03 < 0:01 0.08 < 0:01
AcFB 0.16 0.07 0.31 0.11 0.37 0.42
Table 14: Global analysis: experimental systematic uncertainties (units of 10�2).
Par. c! `+ b! � ! `� b! (cs)! `� B!J/ b! u AbkgFB
Rb 0.10 0.03 0.06 0.03 0.22
Rc 0.93 0.06 0.50 0.06 0.06
Br(b! `�) 0.05 0.03 0.03 0.02 0.04
Br(b! c! `+) 0.02 0.09 0.20 0.06 0.41
< xb > < 0:1 0.1 0.1 0.2 0.4
< xc > < 0:1 0.1 0.3 0.1 0.3
� < 0:01 0.07 0.20 0.04 0.16
AobsFB < 0:01 0.01 0.04 0.02 0.02 0.07
AbFB < 0:01 0.03 0.09 0.02 < 0:01 0.07
AcFB 0.04 0.11 0.47 0.02 0.15 1.38
Table 15: Global analysis: systematic uncertainties from branching ratios (units
of 10�2).
32
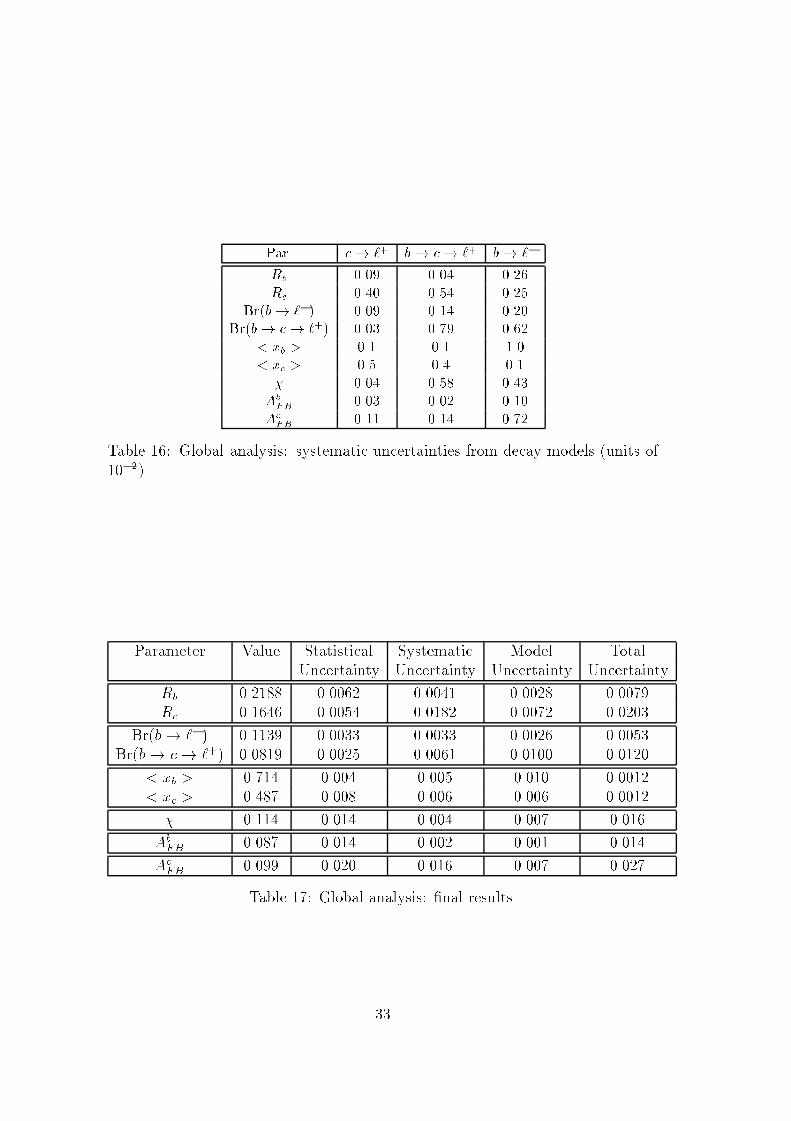
Par. c! `+ b! c! `+ b! `�
Rb 0.09 0.04 0.26
Rc 0.40 0.54 0.25
Br(b! `�) 0.09 0.14 0.20
Br(b! c! `+) 0.03 0.79 0.62
< xb > 0.1 0.1 1.0
< xc > 0.5 0.4 0.1
� 0.04 0.58 0.43
AbFB 0.03 0.02 0.10
AcFB 0.11 0.14 0.72
Table 16: Global analysis: systematic uncertainties from decay models (units of
10�2).
Parameter Value Statistical Systematic Model TotalUncertainty Uncertainty Uncertainty Uncertainty
Rb 0.2188 0.0062 0.0041 0.0028 0.0079Rc 0.1646 0.0054 0.0182 0.0072 0.0203
Br(b! `�) 0.1139 0.0033 0.0033 0.0026 0.0053
Br(b! c! `+) 0.0819 0.0025 0.0061 0.0100 0.0120
< xb > 0.714 0.004 0.005 0.010 0.0012
< xc > 0.487 0.008 0.006 0.006 0.0012
� 0.114 0.014 0.004 0.007 0.016
AbFB 0.087 0.014 0.002 0.001 0.014
AcFB 0.099 0.020 0.016 0.007 0.027
Table 17: Global analysis: �nal results.
33
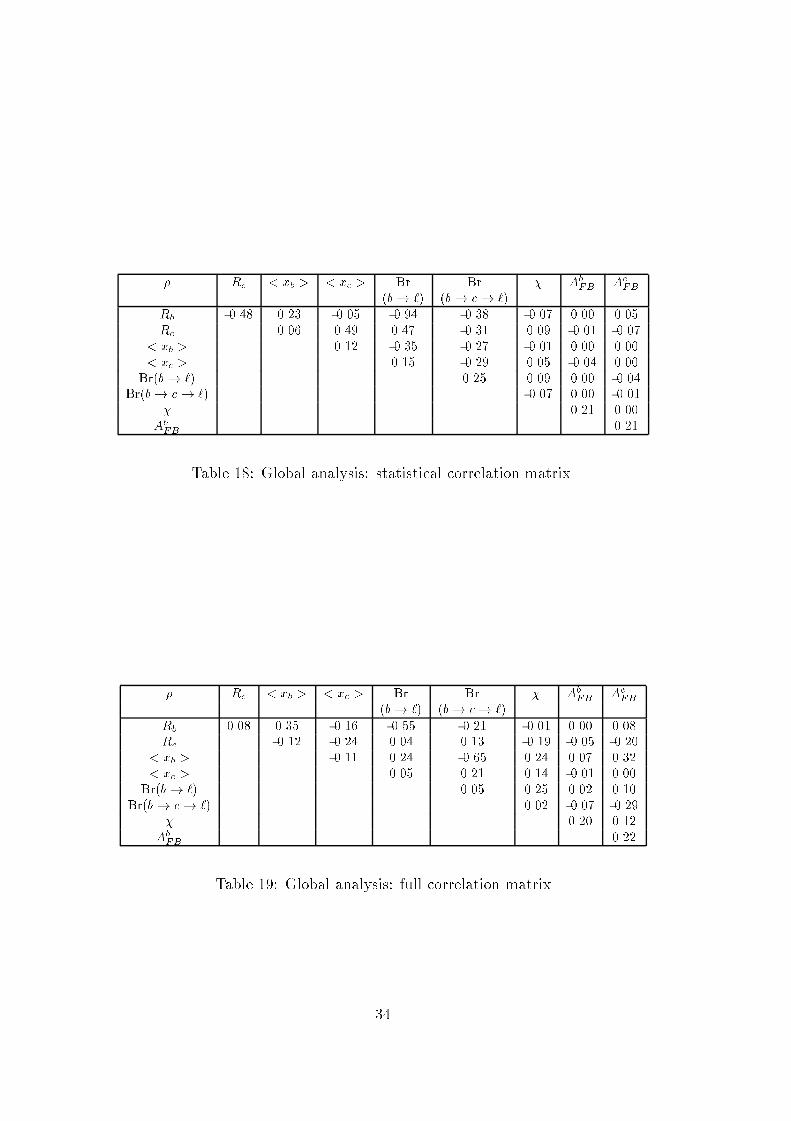
� Rc < xb > < xc > Br Br � AbFB Ac
FB
(b! `) (b! c! `)
Rb -0.48 0.23 -0.05 -0.94 -0.38 -0.07 0.00 0.05Rc 0.06 0.49 0.47 -0.31 0.09 -0.01 -0.07
< xb > 0.12 -0.35 -0.27 -0.01 0.00 0.00< xc > 0.15 -0.29 0.05 -0.04 0.00
Br(b! `) 0.25 0.09 0.00 -0.04Br(b! c! `) -0.07 0.00 -0.01
� 0.21 0.00AbFB 0.21
Table 18: Global analysis: statistical correlation matrix.
� Rc < xb > < xc > Br Br � AbFB Ac
FB
(b! `) (b! c! `)
Rb 0.08 0.35 -0.16 -0.55 -0.21 -0.01 0.00 0.08Rc -0.12 -0.24 0.04 0.13 -0.19 -0.05 -0.20
< xb > -0.11 0.24 -0.65 0.24 0.07 0.32< xc > 0.05 0.21 0.14 -0.01 0.00
Br(b! `) 0.05 0.25 0.02 0.10Br(b! c! `) 0.02 -0.07 -0.29
� 0.20 0.12
AbFB 0.22
Table 19: Global analysis: full correlation matrix
34
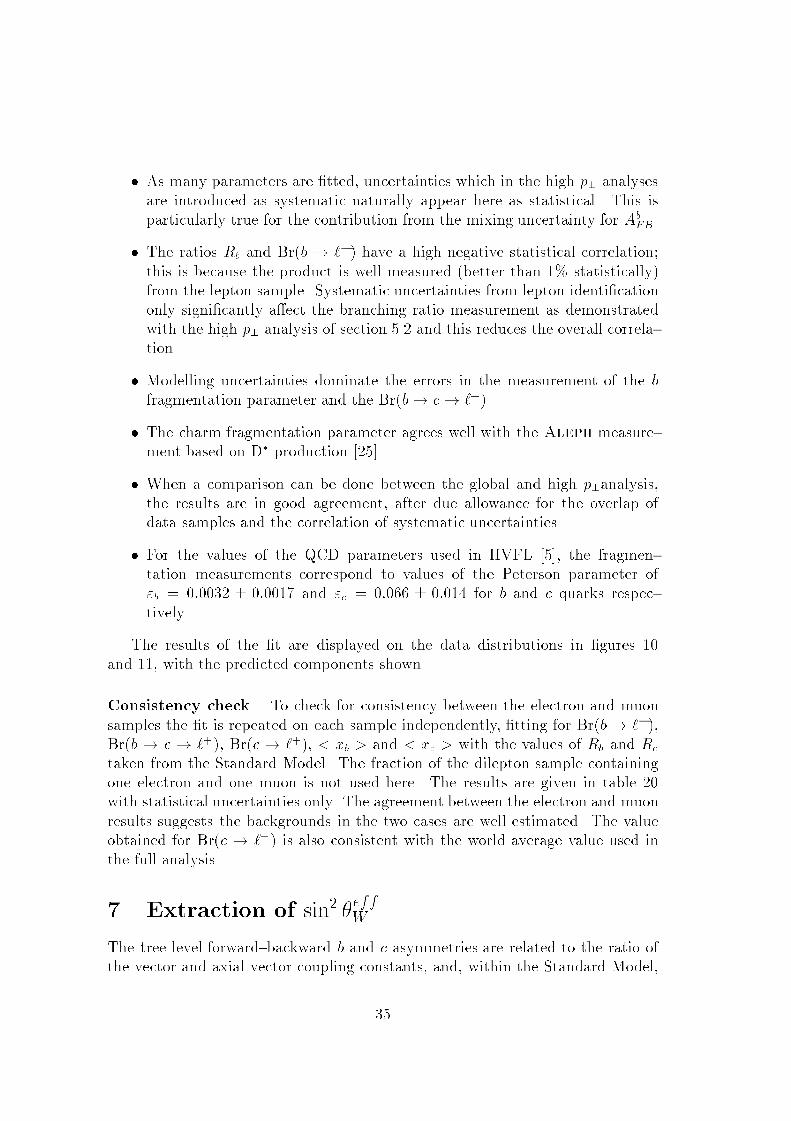
� As many parameters are �tted, uncertainties which in the high p? analyses
are introduced as systematic naturally appear here as statistical. This is
particularly true for the contribution from the mixing uncertainty for AbFB.
� The ratios Rb and Br(b ! `�) have a high negative statistical correlation;
this is because the product is well measured (better than 1% statistically)
from the lepton sample. Systematic uncertainties from lepton identi�cation
only signi�cantly a�ect the branching ratio measurement as demonstrated
with the high p? analysis of section 5.2 and this reduces the overall correla-
tion.
� Modelling uncertainties dominate the errors in the measurement of the b
fragmentation parameter and the Br(b! c! `+).
� The charm fragmentation parameter agrees well with the Aleph measure-ment based on D� production [25].
� When a comparison can be done between the global and high p?analysis,the results are in good agreement, after due allowance for the overlap ofdata samples and the correlation of systematic uncertainties.
� For the values of the QCD parameters used in HVFL [5], the fragmen-tation measurements correspond to values of the Peterson parameter of"b = 0:0032 � 0:0017 and "c = 0:066 � 0:014 for b and c quarks respec-
tively.
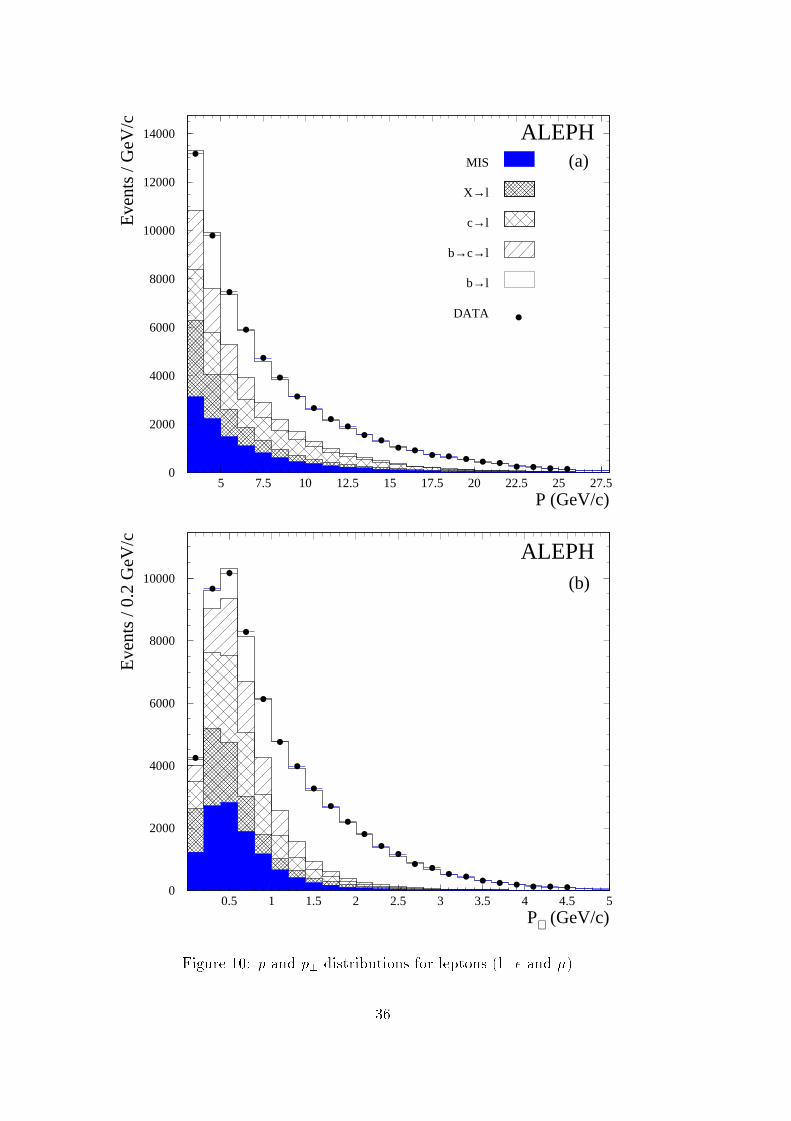
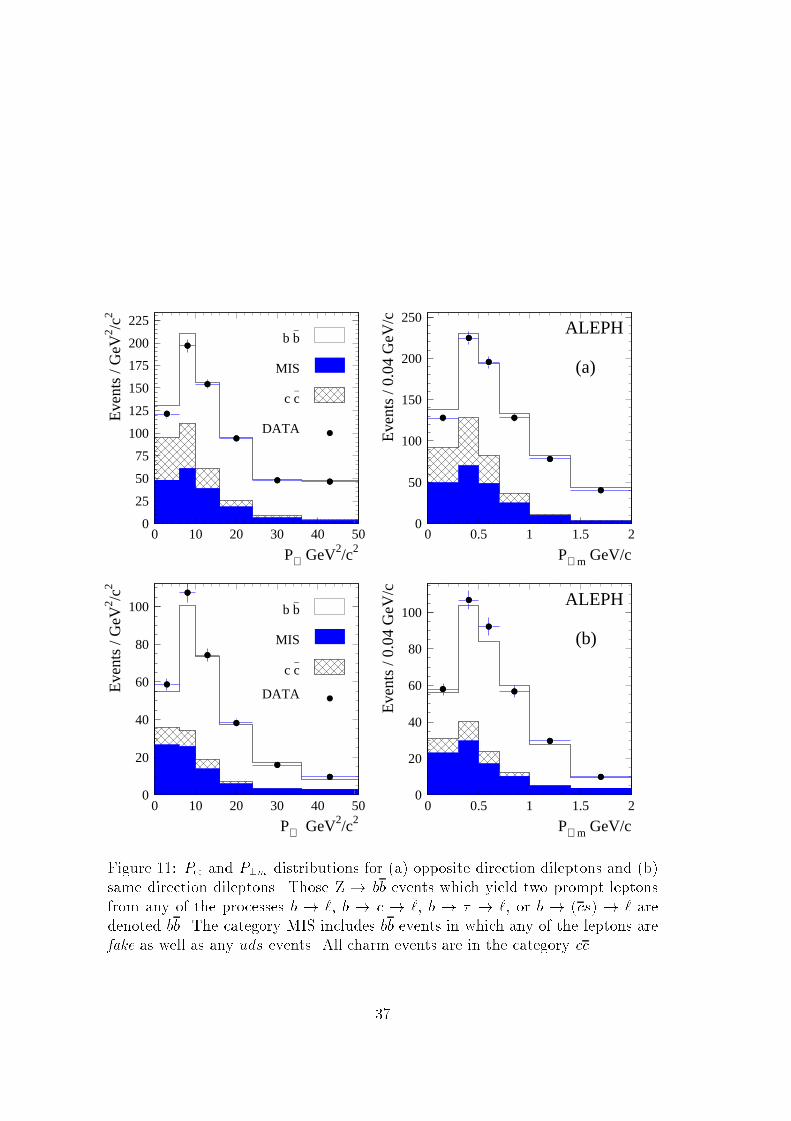
The results of the �t are displayed on the data distributions in �gures 10and 11, with the predicted components shown.
Consistency check. To check for consistency between the electron and muon
samples the �t is repeated on each sample independently, �tting for Br(b! `�),
Br(b ! c ! `+), Br(c ! `+), < xb > and < xc > with the values of Rb and Rc
taken from the Standard Model. The fraction of the dilepton sample containingone electron and one muon is not used here. The results are given in table 20
with statistical uncertainties only. The agreement between the electron and muon
results suggests the backgrounds in the two cases are well estimated. The valueobtained for Br(c ! `+) is also consistent with the world average value used inthe full analysis.
7 Extraction of sin2�effW
The tree level forward{backward b and c asymmetries are related to the ratio of
the vector and axial vector coupling constants, and, within the Standard Model,
35
0
2000
4000
6000
8000
10000
12000
14000
5 7.5 10 12.5 15 17.5 20 22.5 25 27.5
b→l
b→c→l
c→l
X→l
MIS
DATA
ALEPH
ALEPH
(a)
(b)
P (GeV/c)
Eve
nts
/ GeV
/c
0
2000
4000
6000
8000
10000
0.5 1 1.5 2 2.5 3 3.5 4 4.5 5
P⊥ (GeV/c)
Eve
nts
/ 0.2
GeV
/c
Figure 10: p and p? distributions for leptons (l=e and �).
36
0
25
50
75
100
125
150
175
200
225
0 10 20 30 40 50
b b–
c c–
MIS
DATA
ALEPH
(a)
P⊗ GeV2/c2
Eve
nts
/ GeV
2 /c2
0
50
100
150
200
250
0 0.5 1 1.5 2
P⊥ m GeV/c
Eve
nts
/ 0.0
4 G
eV/c
0
20
40
60
80
100
0 10 20 30 40 50
b b–
c c–
MIS
DATA
ALEPH
(b)
P⊗ GeV2/c2
Eve
nts
/ GeV
2 /c2
0
20
40
60
80
100
0 0.5 1 1.5 2
P⊥ m GeV/c
Eve
nts
/ 0.0
4 G
eV/c
Figure 11: P and P?m distributions for (a) opposite direction dileptons and (b)same direction dileptons. Those Z ! bb events which yield two prompt leptons
from any of the processes b ! `, b ! c ! `, b ! � ! `, or b ! (cs) ! ` are
denoted bb. The category MIS includes bb events in which any of the leptons arefake as well as any uds events. All charm events are in the category cc.
37
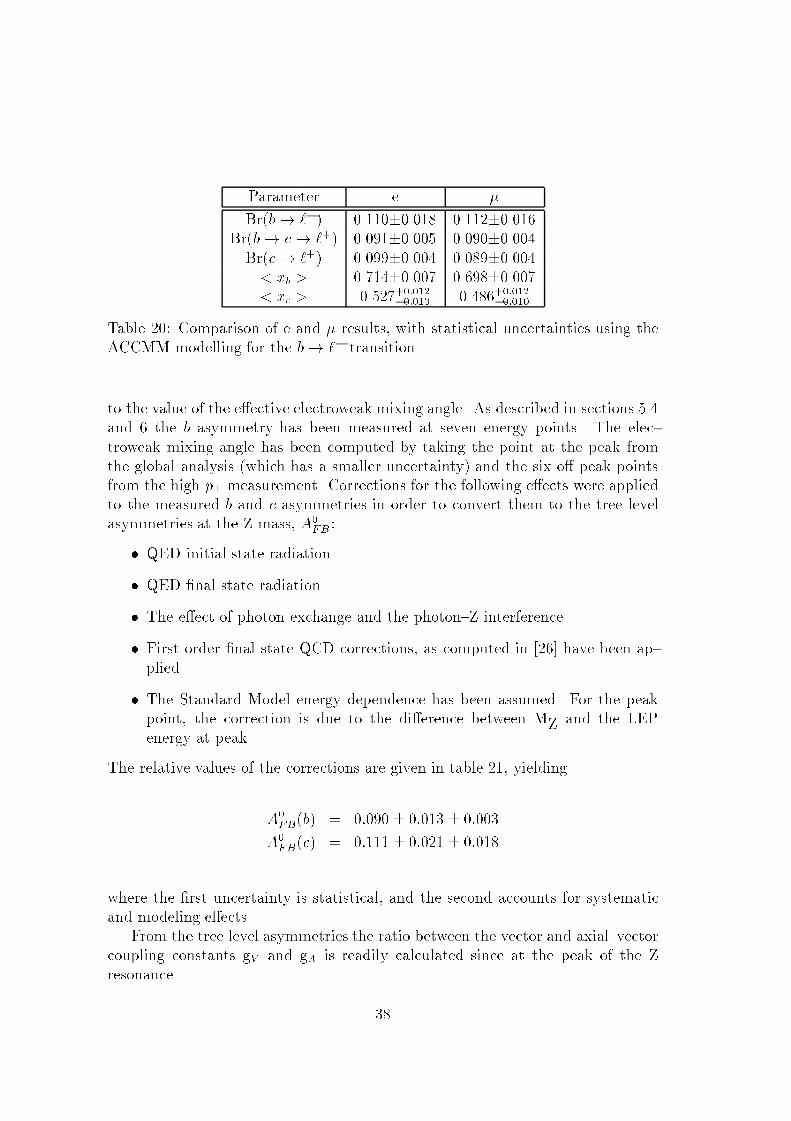
Parameter e �
Br(b! `�) 0.110�0.018 0.112�0.016Br(b! c! `+) 0.091�0.005 0.090�0.004Br(c! `+) 0.099�0.004 0.089�0.004< xb > 0.714�0.007 0.698�0.007< xc > 0.527+0:012�0:013 0.486+0:012�0:010
Table 20: Comparison of e and � results, with statistical uncertainties using the
ACCMM modelling for the b! `� transition.
to the value of the e�ective electroweak mixing angle. As described in sections 5.4
and 6 the b asymmetry has been measured at seven energy points. The elec-
troweak mixing angle has been computed by taking the point at the peak fromthe global analysis (which has a smaller uncertainty) and the six o� peak pointsfrom the high p? measurement. Corrections for the following e�ects were appliedto the measured b and c asymmetries in order to convert them to the tree levelasymmetries at the Z mass, A0
FB:
� QED initial state radiation.
� QED �nal state radiation.
� The e�ect of photon exchange and the photon{Z interference.
� First order �nal state QCD corrections, as computed in [26] have been ap-
plied.
� The Standard Model energy dependence has been assumed. For the peak
point, the correction is due to the di�erence between MZ and the LEPenergy at peak.
The relative values of the corrections are given in table 21, yielding
A0FB(b) = 0:090 � 0:013 � 0:003
A0FB(c) = 0:111 � 0:021 � 0:018
where the �rst uncertainty is statistical, and the second accounts for systematicand modeling e�ects.
From the tree level asymmetries the ratio between the vector and axial{vector
coupling constants gV and gA is readily calculated since at the peak of the Z
resonance
38
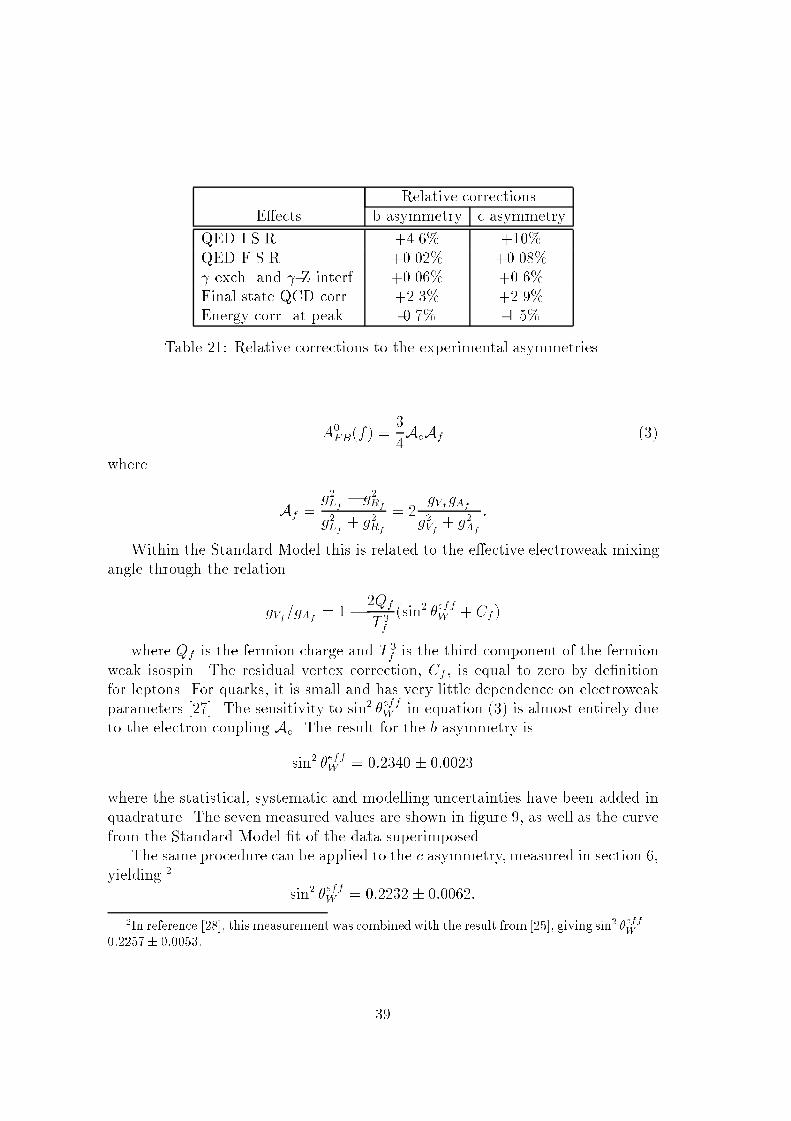
Relative corrections
E�ects b asymmetry c asymmetry
QED I.S.R. +4.6% +10%
QED F.S.R. +0.02% +0.08%
exch. and -Z interf. +0.06% +0.6%Final state QCD corr. +2.3% +2.9%
Energy corr. at peak -0.7% -1.5%
Table 21: Relative corrections to the experimental asymmetries.
A0FB(f) =
3
4AeAf (3)
where
Af =g2Lf � g2Rf
g2Lf + g2Rf
= 2gVf gAf
g2Vf + g2Af
:
Within the Standard Model this is related to the e�ective electroweak mixingangle through the relation
gVf=gAf= 1� 2Qf
T 3f
(sin2 �effW + Cf )
where Qf is the fermion charge and T 3f is the third component of the fermion
weak isospin. The residual vertex correction, Cf , is equal to zero by de�nitionfor leptons. For quarks, it is small and has very little dependence on electroweak
parameters [27]. The sensitivity to sin2 �effW in equation (3) is almost entirely due
to the electron coupling Ae. The result for the b asymmetry is
sin2 �effW = 0:2340 � 0:0023
where the statistical, systematic and modelling uncertainties have been added in
quadrature. The seven measured values are shown in �gure 9, as well as the curve
from the Standard Model �t of the data superimposed.The same procedure can be applied to the c asymmetry, measured in section 6,
yielding 2
sin2 �effW = 0:2232 � 0:0062:
2In reference [28], this measurement was combined with the result from [25], giving sin2 �effW =
0:2257� 0:0053:
39
In combining these two measurements the 22% correlation between the b and c
peak asymmetry has been taken into account (see table 19). This gives a total
20% correlation when the o� peak points are included, giving
sin2 �effW = 0:2333 � 0:0022:
The energy dependence of the b quark forward{backward asymmetry is almost
entirely due to photon{Z interference, and is therefore proportional to the linear
sum over colours of the b quark charge. This dependence can be used to extract
a measurement of the linear sum, as distinct from the quadratic sum that is
measured by the change in R at the b quark threshold. Further, it is the linear
sum that is relevant to the cancellation of the triangle anomaly [29].
The EXPOSTAR Standard Model �tting program was modi�ed to rescale the
b quark charge at the Born level as a �t parameter. In this way the loop andvertex corrections were not a�ected and the determination only depends on theenergy dependence of the interference. Fitting the measurements, allowing allother electroweak parameters (MZ, Mtop, �s) to vary within their ranges resultsin the summed b quark charge being
Xcolours
qb = �1:40 � :56
8 Conclusions
In 431,000 hadronic Z decays recorded with the Aleph detector at LEP, theyields of electrons and muons have been analysed to measure the observables Rb=
�(bb)=�(had), Rc= �(cc)=�(had), A0FB(b) and A
0FB(c), which yield information
on the neutral electroweak couplings of the b and c quarks. The branching ratiosBr(b! `��� X) and Br(b! c! `+� X), the integrated b mixing parameter �, and< x >= Ehadron=Equark for both b and c production have also been measured. The
e�ect of di�erent semileptonic decay models has been allowed for in the systematic
uncertainties.
In the b sector these quantities are derived from analyses in both the high p?region, with a sample of events highly enriched in primary b decays, and from aglobal �t over the whole p? region. The global analysis allows more events to be
e�ectively used and requires less external input. As a result, the overall errorsare lower than for the high p? analyses. Consequently the results are taken from
the overall �t, with the following exception: the statistics available for the o�{peak measurements of the b asymmetry are inadequate to justify the use of an
overall �t and so these measurements are taken from the high p? analyses. Where
results are obtained with both analyses, no di�erences are observed which cannotbe justi�ed on either statistical grounds or on di�erent sensitivities to the e�ect
of decay models.
40
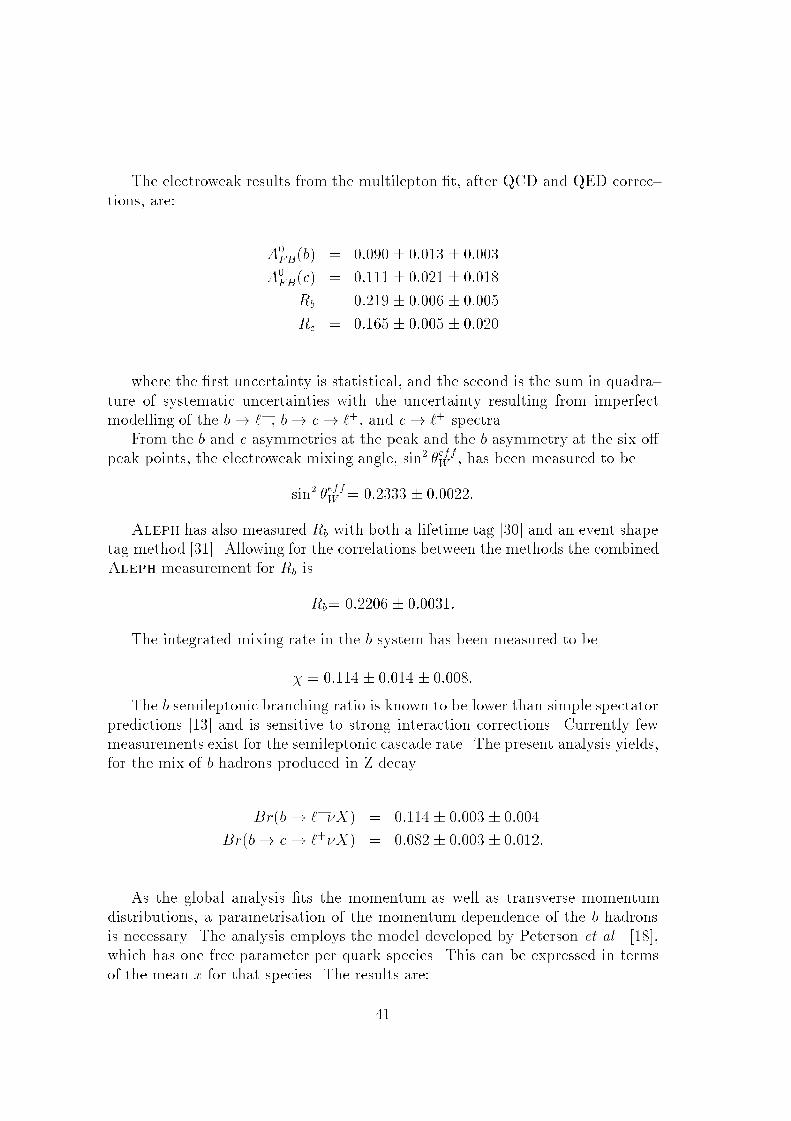
The electroweak results from the multilepton �t, after QCD and QED correc-
tions, are:
A0FB(b) = 0:090 � 0:013 � 0:003
A0FB(c) = 0:111 � 0:021 � 0:018
Rb = 0:219 � 0:006 � 0:005
Rc = 0:165 � 0:005 � 0:020
where the �rst uncertainty is statistical, and the second is the sum in quadra-
ture of systematic uncertainties with the uncertainty resulting from imperfect
modelling of the b! `�, b! c! `+, and c! `+ spectra.From the b and c asymmetries at the peak and the b asymmetry at the six o�
peak points, the electroweak mixing angle, sin2 �effW , has been measured to be
sin2 �effW = 0:2333 � 0:0022:
Aleph has also measured Rb with both a lifetime tag [30] and an event shapetag method [31]. Allowing for the correlations between the methods the combinedAleph measurement for Rb is
Rb= 0:2206 � 0:0031:
The integrated mixing rate in the b system has been measured to be
� = 0:114 � 0:014 � 0:008:
The b semileptonic branching ratio is known to be lower than simple spectator
predictions [13] and is sensitive to strong interaction corrections. Currently fewmeasurements exist for the semileptonic cascade rate. The present analysis yields,for the mix of b hadrons produced in Z decay
Br(b! `���X) = 0:114 � 0:003 � 0:004
Br(b! c! `+�X) = 0:082 � 0:003 � 0:012:
As the global analysis �ts the momentum as well as transverse momentum
distributions, a parametrisation of the momentum dependence of the b hadronsis necessary. The analysis employs the model developed by Peterson et al. [18],
which has one free parameter per quark species. This can be expressed in terms
of the mean x for that species. The results are:
41
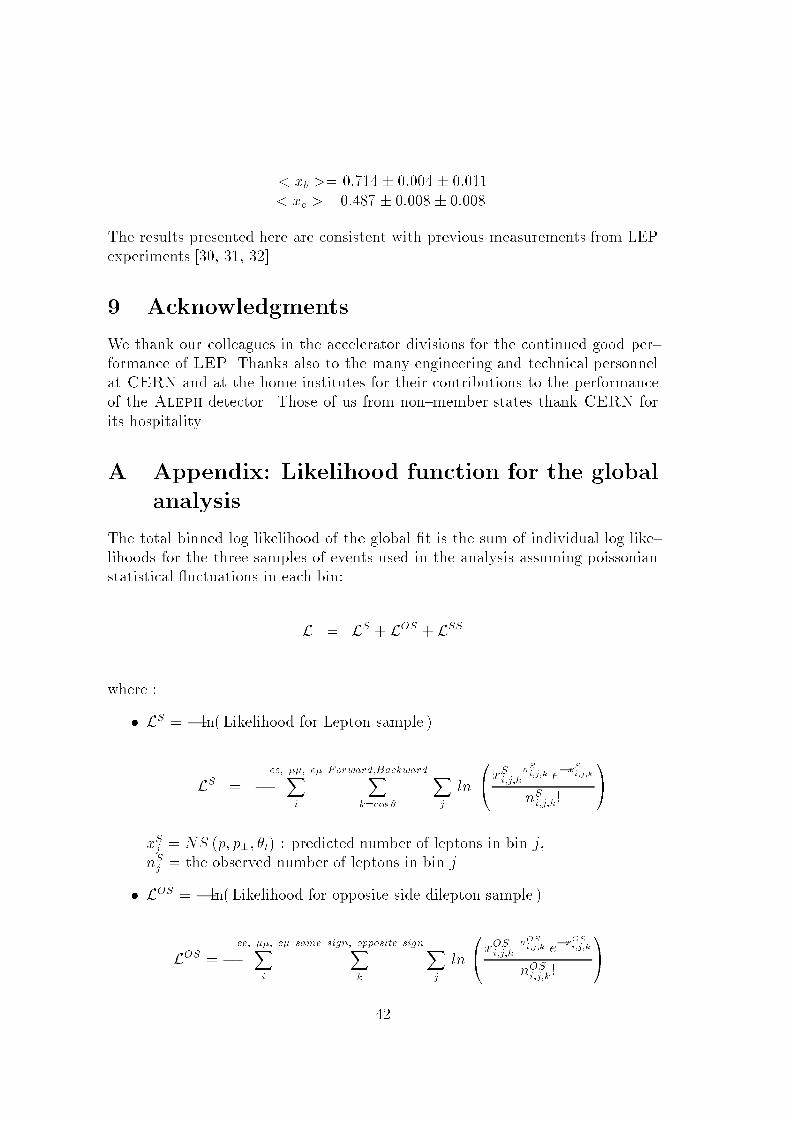
< xb >= 0:714 � 0:004 � 0:011
< xc >= 0:487 � 0:008 � 0:008.
The results presented here are consistent with previous measurements from LEP
experiments [30, 31, 32].
9 Acknowledgments
We thank our colleagues in the accelerator divisions for the continued good per-
formance of LEP. Thanks also to the many engineering and technical personnel
at CERN and at the home institutes for their contributions to the performance
of the Aleph detector. Those of us from non{member states thank CERN for
its hospitality.
A Appendix: Likelihood function for the global
analysis
The total binned log likelihood of the global �t is the sum of individual log like-lihoods for the three samples of events used in the analysis assuming poissonianstatistical uctuations in each bin:
L = LS + LOS + LSS
where :
� LS = � ln( Likelihood for Lepton sample )
LS = �ee; ��; e�X
i
Forward;BackwardXk=cos �
Xj
ln
0@xSi;j;knSi;j;k e�xSi;j;k
nSi;j;k!
1A
xSj = NS (p; p?; �t) : predicted number of leptons in bin j,nSj = the observed number of leptons in bin j.
� LOS = � ln( Likelihood for opposite side dilepton sample )
LOS = �ee; ��; e�X
i
same sign; opposite signXk
Xj
ln
0@xOSi;j;k nOS
i;j;k e�xOSi;j;k
nOSi;j;k!
1A
42
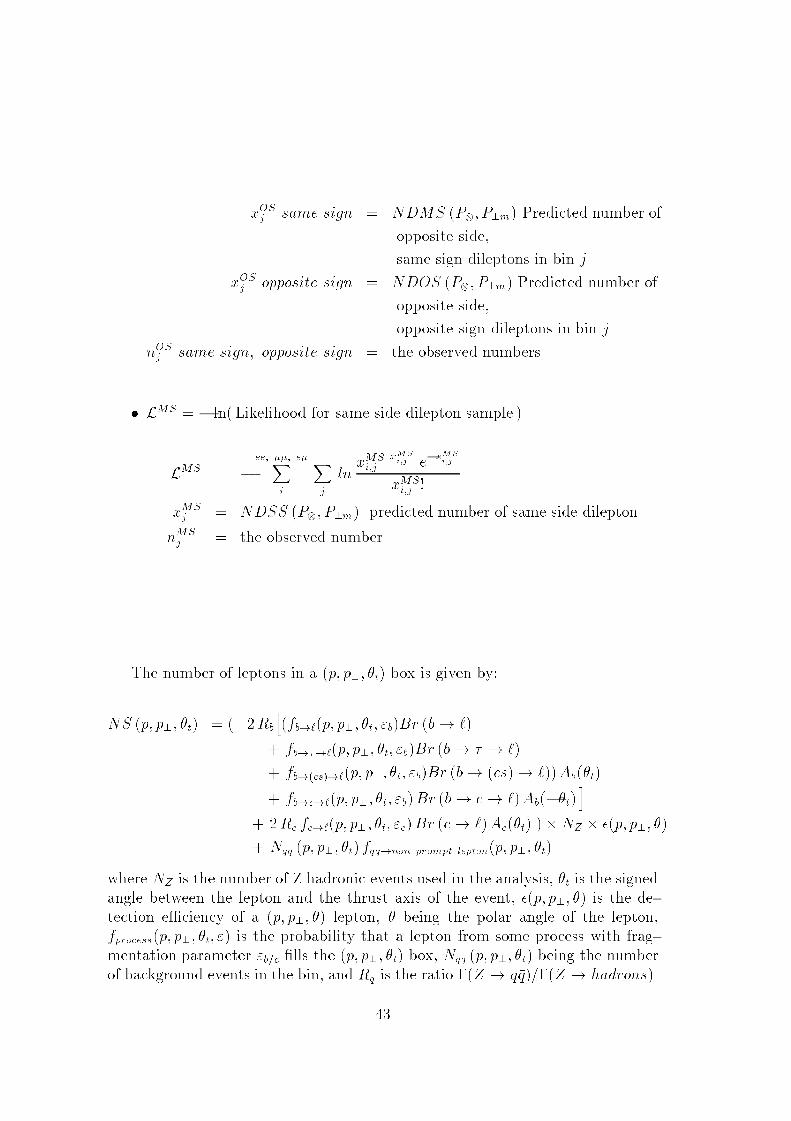
xOSj same sign = NDMS (P; P?m) Predicted number of
opposite side,
same sign dileptons in bin j
xOSj opposite sign = NDOS (P; P?m) Predicted number of
opposite side,
opposite sign dileptons in bin j
nOSj same sign; opposite sign = the observed numbers
� LMS = � ln( Likelihood for same side dilepton sample )
LMS = �ee; ��; e�X
i
Xj
lnxMSi;j
xMSi;j e�x
MSi;j
xMSi;j !
xMSj = NDSS (P; P?m) predicted number of same side dilepton
nMSj = the observed number
The number of leptons in a (p; p?; �t) box is given by:
NS (p; p?; �t) = ( 2Rb
h(fb!`(p; p?; �t; "b)Br (b! `)
+ fb!�!`(p; p?; �t; "b)Br (b! � ! `)
+ fb!(�cs)!`(p; p?; �t; "b)Br (b! (�cs)! `))Ab(�t)
+ fb!c!`(p; p?; �t; "b)Br (b! c! `)Ab(��t)i
+ 2Rc fc!`(p; p?; �t; "c)Br (c! `)Ac(�t) )�NZ � �(p; p?; �)
+ Nq�q (p; p?; �t) fq�q!non prompt lepton(p; p?; �t)
where NZ is the number of Z hadronic events used in the analysis, �t is the signed
angle between the lepton and the thrust axis of the event, �(p; p?; �) is the de-
tection e�ciency of a (p; p?; �) lepton, � being the polar angle of the lepton,fprocess(p; p?; �t; ") is the probability that a lepton from some process with frag-
mentation parameter "b=c �lls the (p; p?; �t) box, Nq�q (p; p?; �t) being the number
of background events in the bin, and Rq is the ratio �(Z ! q�q)=�(Z ! hadrons).
43
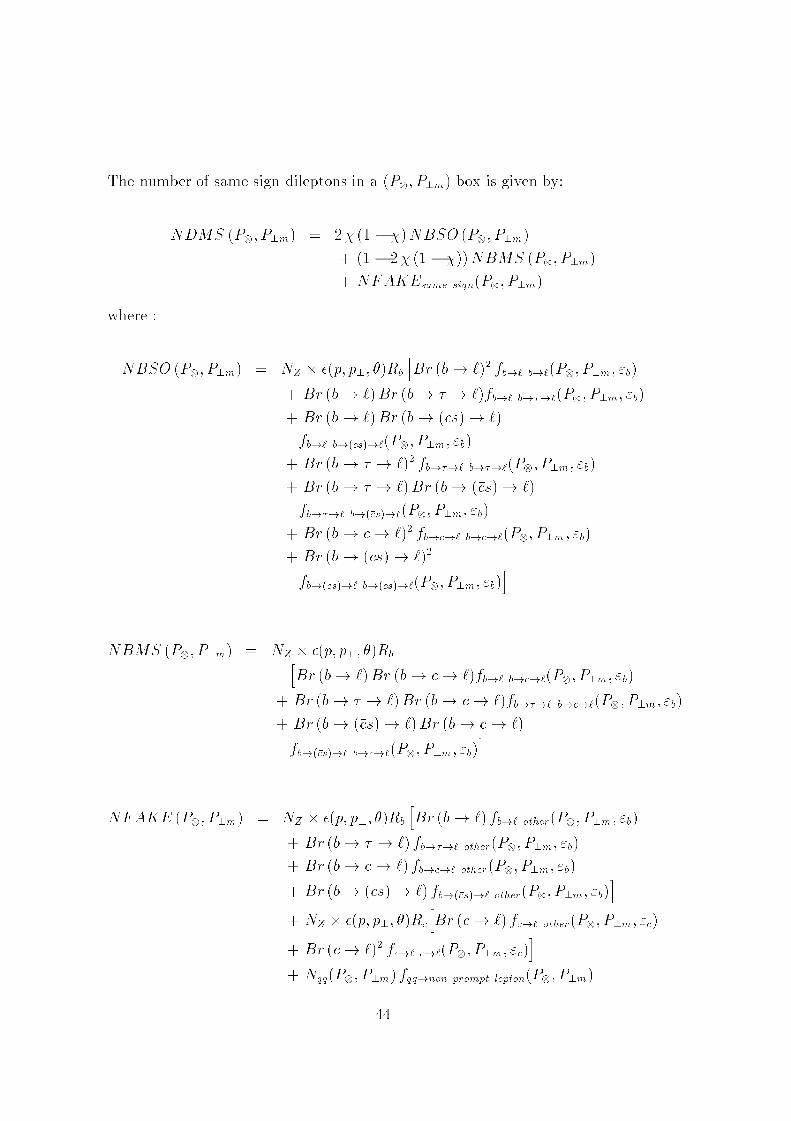
The number of same sign dileptons in a (P; P?m) box is given by:
NDMS (P; P?m) = 2� (1 � �)NBSO (P; P?m)
+ (1 � 2� (1 � �))NBMS (P; P?m)
+ NFAKEsame sign(P; P?m)
where :
NBSO (P; P?m) = NZ � �(p; p?; �)Rb
hBr (b! `)2 fb!` b!`(P; P?m; "b)
+ Br (b! `)Br (b! � ! `)fb!` b!�!`(P; P?m; "b)
+ Br (b! `)Br (b! (�cs)! `)
fb!` b!(�cs)!`(P; P?m; "b)
+ Br (b! � ! `)2 fb!�!` b!�!`(P; P?m; "b)
+ Br (b! � ! `)Br (b! (�cs)! `)
fb!�!` b!(�cs)!`(P; P?m; "b)
+ Br (b! c! `)2 fb!c!` b!c!`(P; P?m; "b)
+ Br (b! (�cs)! `)2
fb!(�cs)!` b!(�cs)!`(P; P?m; "b)i
NBMS (P; P?m) = NZ � �(p; p?; �)RbhBr (b! `)Br (b! c! `)fb!` b!c!`(P; P?m; "b)
+ Br (b! � ! `)Br (b! c! `)fb!�!` b!c!`(P; P?m; "b)
+ Br (b! (�cs)! `)Br (b! c! `)
fb!(�cs)!` b!c!`(P; P?m; "b)i
NFAKE (P; P?m) = NZ � �(p; p?; �)Rb
hBr (b! `) fb!` other(P; P?m; "b)
+ Br (b! � ! `) fb!�!` other(P; P?m; "b)
+ Br (b! c! `) fb!c!` other(P; P?m; "b)
+ Br (b! (�cs)! `) fb!(�cs)!` other(P; P?m; "b)i
+ NZ � �(p; p?; �)Rc
hBr (c! `) fc!` other(P; P?m; "c)
+ Br (c! `)2 fc!` c!`(P; P?m; "c)i
+ Nq�q(P; P?m) fq�q!non prompt lepton(P; P?m)
44
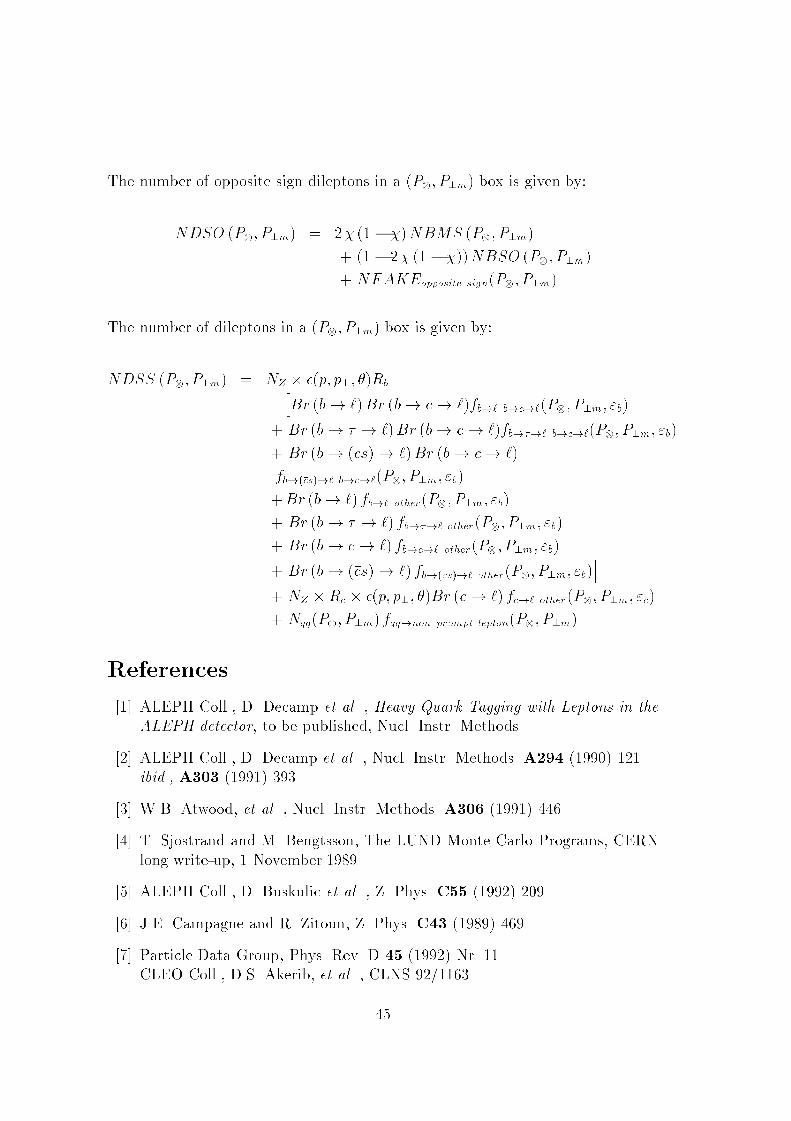
The number of opposite sign dileptons in a (P; P?m) box is given by:
NDSO (P; P?m) = 2� (1 � �)NBMS (P; P?m)
+ (1 � 2� (1 � �))NBSO (P; P?m)
+ NFAKEopposite sign(P; P?m)
The number of dileptons in a (P; P?m) box is given by:
NDSS (P; P?m) = NZ � �(p; p?; �)RbhBr (b! `)Br (b! c! `)fb!` b!c!`(P; P?m; "b)
+ Br (b! � ! `)Br (b! c! `)fb!�!` b!c!`(P; P?m; "b)
+ Br (b! (�cs)! `)Br (b! c! `)
fb!(�cs)!` b!c!`(P; P?m; "b)
+Br (b! `) fb!` other(P; P?m; "b)
+ Br (b! � ! `) fb!�!` other(P; P?m; "b)
+ Br (b! c! `) fb!c!` other(P; P?m; "b)
+ Br (b! (�cs)! `) fb!(�cs)!` other(P; P?m; "b)i
+ NZ �Rc � �(p; p?; �)Br (c! `) fc!` other(P; P?m; "c)
+ Nq�q(P; P?m) fq�q!non prompt lepton(P; P?m)
References
[1] ALEPH Coll., D. Decamp et al. , Heavy Quark Tagging with Leptons in the
ALEPH detector, to be published, Nucl. Instr. Methods.
[2] ALEPH Coll., D. Decamp et al. , Nucl. Instr. Methods. A294 (1990) 121
ibid., A303 (1991) 393
[3] W.B. Atwood, et al. , Nucl. Instr. Methods. A306 (1991) 446
[4] T. Sjostrand and M. Bengtsson, The LUND Monte Carlo Programs, CERN
long write-up, 1 November 1989
[5] ALEPH Coll., D. Buskulic et al. , Z. Phys. C55 (1992) 209
[6] J.E. Campagne and R. Zitoun, Z. Phys. C43 (1989) 469
[7] Particle Data Group, Phys. Rev. D 45 (1992) Nr. 11
CLEO Coll., D.S. Akerib, et al. , CLNS 92/1163
45
[8] Particle Data Group, Phys. Rev. D 45 (1992) Nr. 11
CLEO Coll., D. Bortollo, et al. , Phys. Rev. D 45 (1992) 21 and references
therein.
[9] M. Bauer, B. Stech, M. Wirbel, Z. Phys. C34 (1987) 103 M. Bauer, B. Stech,
M. Wirbel, Z. Phys. C29 (1985) 637
[10] H. Schr�oder, Rept. Prog. Phys. 52 (1989) 765
ARGUS Coll., H. Albrecht, et al. , Z. Phys. C42 (1989) 519
[11] J.G. K�orner et al. , Z. Phys. C38 (1988) 511
ibid., C41 (1989) 690.
[12] ARGUS Coll., H. Albrecht, et al. , Phys. Lett. B249 (1990) 359
CLEO Coll., S. Henderson, et al. , Phys. Rev. D45 (1992) 2212
[13] G. Altarelli et al. , Nucl. Phys. B208 (1982) 365G. Altarelli and S. Petrarca, Phys. Lett. B261 (1991) 303
[14] M.A. Worris PhD Thesis, Cornell University, 1991ARGUS Coll., H. Albrecht, et al. , Z. Phys. C57 (1993) 533CLEO Coll., R. Poling, Semileptonic B decays, Contributed paper to theX th International Symposium on Heavy Flavour Physics, 6-10 July 1993,
Montreal.
[15] B. Grinstein, et al. , Phys. Rev. D 39 (1989) 799B. Grinstein, et al. , Phys. Rev. Lett. 56 (1986) 298B. Grinstein, et al. , CALT-68-1311
[16] DELCO Coll., W. Bacino et al. , Phys. Rev. Lett. 43 (1979) 1073
[17] E. Barberio, et al. , CERN-TH-5857/90
D. Atwood and W.J. Marciano Phys. Rev. D 41 (1990) 1736
[18] C. Peterson, et al. , Phys. Rev. D 27 (1983) 105
[19] V.G. Kartvelishvili, et al. , Phys. Lett. B78 (1978) 615
[20] C. Quigg and J.L. Rosner, Phys. Rev. D 19 (1979) 1532
[21] ALEPH Coll., D. Buskulic et al. , Phys. Lett. B298 (1993) 479
[22] ARGUS Coll., H. Albrecht et al. , Phys. Lett. B278 (1992) 202
and references therein.
[23] D. Levinthal et al. , Z. Phys. C53 (1992) 617
46
[24] MARK II Coll., A.J. Weir et al., Phys. Lett. B240 (1990) 289.
[25] ALEPH Coll., D. Buskulic et al. , to be published, Z. Phys. PPE-93-208,
(1993)
[26] A. Djouadi, J.H. K�uhn, and P.M. Zerwas Z. Phys. C46 (1990) 411
G. Altarelli and B. Lampe, Nucl. Phys. B391 (1993) 3
[27] W. Hollik, private communication.
[28] ALEPH Coll., D. Buskulic et al. , Z. Phys. C60 (1993) 71
[29] T.P. Cheng, L.F. Li, Gauge Theory of Elementary Particle Theory,
Oxford Science Publications and references therein, pg 347
[30] ALEPH Coll., D. Buskulic et al. , Phys. Lett. B313 (1993) 535.
[31] ALEPH Coll., D. Buskulic et al. , Phys. Lett. B313 (1993) 549.
[32] ALEPH Coll., D. Decamp et al. , Phys. Lett. B244 (1990) 551.ALEPH Coll., D. Decamp et al. , Phys. Lett. B258 (1991) 237.ALEPH Coll., D. Decamp et al. , Phys. Lett. B263 (1991) 325.ALEPH Coll., D. Decamp et al. , Phys. Lett. B284 (1992) 177.DELPHI Coll., P.Abreu et al. , Phys. Lett. B276 (1992) 536.
DELPHI Coll., P.Abreu et al. , Z. Phys. C56 (1992) 47.DELPHI Coll., P.Abreu et al. , Phys. Lett. B295 (1992) 383.DELPHI Coll., P.Abreu et al. , Phys. Lett. B301 (1993) 145.L3 Coll., B. Adeva et al. , Phys. Lett. B252 (1990) 713.L3 Coll., B. Adeva et al. , Phys. Lett. B261 (1991) 177.
L3 Coll., B. Adeva et al. , Phys. Lett. B288 (1992) 395.L3 Coll., B. Adeva et al. , Phys. Lett. B292 (1992) 454.
L3 Coll., B. Adeva et al. , Phys. Lett. B307 (1993) 237.
OPAL Coll., P. Acton et al. , Z. Phys. C58 (1993) 523.OPAL Coll., P. Acton et al. , Z. Phys. C60 (1993) 19.OPAL Coll., R. Akers et al. , Z. Phys. C60 (1993) 199.
OPAL Coll., P. Acton et al. , Z. Phys. C60 (1993) 579.
OPAL Coll., R. Akers et al. , Z. Phys. C60 (1993) 601.
47
Related Documents