arXiv:1403.0819v1 [astro-ph.GA] 4 Mar 2014 Heavy elements in Globular Clusters: the role of AGB stars. O. Straniero INAF-Osservatorio Astronomico di Collurania, 64100 Teramo, Italy and INFN-sezione di Napoli, 80126 Napoli, Italy [email protected] S. Cristallo INAF-Osservatorio Astronomico di Collurania, 64100 Teramo, Italy and INFN-sezione di Napoli, 80126 Napoli, Italy L. Piersanti INAF-Osservatorio Astronomico di Collurania, 64100 Teramo, Italy and INFN-sezione di Napoli, 80126 Napoli, Italy March 5, 2014 Received ; accepted

Welcome message from author
This document is posted to help you gain knowledge. Please leave a comment to let me know what you think about it! Share it to your friends and learn new things together.
Transcript

arX
iv:1
403.
0819
v1 [
astr
o-ph
.GA
] 4
Mar
201
4
Heavy elements in Globular Clusters: the role of AGB stars.
O. Straniero
INAF-Osservatorio Astronomico di Collurania, 64100 Teramo, Italy and INFN-sezione di
Napoli, 80126 Napoli, Italy
S. Cristallo
INAF-Osservatorio Astronomico di Collurania, 64100 Teramo, Italy and INFN-sezione di
Napoli, 80126 Napoli, Italy
L. Piersanti
INAF-Osservatorio Astronomico di Collurania, 64100 Teramo, Italy and INFN-sezione di
Napoli, 80126 Napoli, Italy
March 5, 2014
Received ; accepted
– 2 –
ABSTRACT
Recent observations of heavy elements in Globular Clusters reveal intriguing
deviations from the standard paradigm of the early galactic nucleosynthesis. If
the r-process contamination is a common feature of halo stars, s-process enhance-
ments are found in a few Globular Clusters only. We show that the combined
pollution of AGB stars with mass ranging between 3 to 6 M⊙ may account for
most of the features of the s-process overabundance in M4 and M22. In these
stars, the s process is a mixture of two different neutron-capture nucleosynthesis
episodes. The first is due to the 13C(α,n)16O reaction and takes place during
the interpulse periods. The second is due to the 22Ne(α,n)25Mg reaction and
takes place in the convective zones generated by thermal pulses. The produc-
tion of the heaviest s elements (from Ba to Pb) requires the first neutron burst,
while the second produces large overabundances of light s (Sr, Y, Zr). The first
mainly operates in the less-massive AGB stars, while the second dominates in
the more-massive. From the heavy-s/light-s ratio, we derive that the pollution
phase should last for 150± 50 Myr, a period short enough compared to the for-
mation timescale of the Globular Cluster system, but long enough to explain
why the s-process pollution is observed in a few cases only. With few exceptions,
our theoretical prediction provides a reasonable reproduction of the observed s-
process abundances, from Sr to Hf. However, Ce is probably underproduced by
our models, while Rb and Pb are overproduced. Possible solutions are discussed.
Subject headings: Stars: AGB — globular clusters: general, chemical composition,
multiple populations

– 3 –
1. Introduction
All the elements heavier than iron are mainly produced by neutron captures1. There
exist two different nucleosynthesis processes of this type, the slow (s) process and the rapid
(r) process (Burbidge et al. 1957). Since the typical neutron density of the r process is
more than 10 orders of magnitude larger than that of the s process, significantly different
physical conditions are implied and, in turn, very different astrophysical environments.
The r process is commonly associated with massive stars. Two are the proposed scenarios:
core-collapse supernovae (type II, Ib and Ic) and Neutron-Star mergers. Although none of
the proposed astrophysical sites has been confirmed by direct observations, the yields of
the r process are commonly found in all the Galactic components, very-metal-poor stars
included. Such a prompt pollution, demonstrates that the r process takes place in stars
that evolves on a very short timescale (see Sneden et al. 2008).
On the contrary, our knowledge of the s-process site has been greatly improved in the
last 20 years (for a review see Busso et al. 1999). First of all, it should be reminded that
the most abundant products of the s process are the so-called neutron-magic nuclei, whose
neutron-capture cross section is particularly low compared to the cross section of nearby
nuclei. When the s-process flow encounters a neutron-magic nucleus, it acts as a bottleneck,
so that its abundance is greatly enhanced with respect to the nearby non-magic nuclei, for
which a nearly local equilibrium is established, as given by: σANA = σA−1NA−12. The most
important neutron-magic nuclei encountered by the s process are 88Sr, 89Y, 90Zr, 138Ba,
139La, 140Ce, 141Pr, 142Nd, 208Pb and 209Bi. Each of these nuclei corresponds to a peak in
1A few isotopes are actually synthesized by the so-called p process whose overall contri-
bution to the elemental abundances is, however, rather small.
2 σA = <σv>vth
= 2√KT
∫∞0
Eσn(E)exp(
− EKT
)
dE is the Maxwellian averaged cross section
(MACS) and NA is the fraction of isotopes with atomic mass A.
– 4 –
the distribution of the solar system abundances. The first three are the major contributors
to the light-s peak, while those from 138Ba to 142Nd contribute to the heavy-s peak.
As pointed out in the seminal paper of Burbidge et al. (1957), the s process follows
simple general rules. Three are the main players: neutrons (or neutron sources), seeds
(Fe nuclei) and neutron poisons. The latter are light elements that compete with the
seeds in the neutron-capture nucleosynthesis. In this context, a fundamental quantity that
characterizes the s process is the neutron-to-seed ratio, i.e., f = neutrons−poisons
seeds, where
neutrons, poisons and seeds represent fractions by number. As firstly shown by Cameron
(1957), the synthesis of the heaviest elements, such as Pb, requires a relatively large value
of this ratio (f > 20), while for low values, namely f ∼ 1, only light-s are produced. Note
that the number of seeds directly scales with the metallicity, so that the production of the
heaviest s elements is generally favored at low Z (Busso et al. 1999; Cristallo et al. 2009).
As a matter of fact, the cosmic concentration of lead is the result of the pollution caused
by low-metallicity AGB stars (e.g., Travaglio et al. 2001). Other important quantities
that characterize the s process are the neutron density (Nn), the temperature (T) and the
timescale (i.e., the duration of the s-process episode). They determine the time integrated
neutron flux, or neutron exposure, namely τ =∫
Nnvthdt3. Note that the larger the neutron
exposure the larger the probability to overshoot the neutron-magic nuclei. Moreover, the
Maxwellian averaged cross sections depend on the temperature, while the neutron density
is important for the various branchings occurring along the s-process path. Indeed, when
a neutron capture produces an unstable nucleus, the β decay may compete with a further
neutron capture (see Kappeler et al. 1989). For each branching, it exists a critical value
of the neutron density given by the ratio of the decay rate and the neutron-capture rate.
When the neutron density is much larger than this critical value, the neutron capture is
3vth is the thermal velocity, which depends on T

– 5 –
favored with respect to the β decay, while the opposite occurs at low neutron density. In
this way, the neutron density determines the abundances of the isotopes on the alternative
paths. Some examples are the branchings at 79Se, 85Kr, 95Zr, 134Cs and 151Sm. In general,
those isotopes/elements whose production is sensitive to the neutron density are good
estimators of the physical conditions of the s-process site (Lambert et al. 1995; Abia et al.
2001; Aoki et al. 2003; Barzyk et al. 2007; van Raai et al. 2012; Lugaro et al. 2014).
By analyzing the heavy element composition of the solar system, three different
components of the s process have been formerly identified, namely the weak, the main
and the strong (Seeger et al. 1965; Clayton & Rassbach 1967). Each s-process component
implies a specific range of neutron exposures and, in turn, a specific range of the quantities
characterizing different s-process sites, i.e., f , Nn, T and the timescale.
The weak component, which includes nuclei with 29 < Z < 40, is synthesized in
the He-burning core and, later on, in the C-burning shell of massive stars (M> 10 M⊙,
Raiteri et al. 1991b,a; Kaeppeler et al. 1994; Pignatari et al. 2006). The neutron density
may vary from ∼ 106 neutrons/cm3, in the case of the He burning, up to ∼ 1011, for
the C-burning. Temperatures and timescales are also very different, but the neutron
exposure is similar, namely ∼ 0.06 mbarn−1. In both cases, neutrons are provided by the
22Ne(α,n)25Mg reaction, so that 22Ne is a necessary ingredient for the weak-s process. In
practice, 22Ne is synthesized during He burning, through the 14N(α, γ)18F(β+)18O(α, γ)22Ne
chain, where 14N is that left by the former CNO burning. Therefore, the fraction (by
number) of 22Ne nuclei available for the s process in massive stars is approximately equal
to the original fraction of C+N+O nuclei. Such an occurrence implies that the synthesis
of the weak component is less efficient at low Z, because of the paucity of C+N+O and,
in turn, of 22Ne. For instance, during core-He burning, the main neutron poison is 25Mg
that is secondary like, since it is directly produced by the 22Ne(α,n)25Mg reaction. As a
– 6 –
result, the weak process yields decrease roughly linearly with metallicity. Instead, in the
C-burning shell there are primary like neutron poisons (e.g., 16O, 23Na, 24Mg), which do
not depend on the metallicity. Therefore, the s-process efficiency in the C-burning shell is
strongly suppressed at low Z (Pignatari & Gallino 2007).
Recently, Pignatari et al. (2008) show that in very low-metallicity fast-rotating massive
stars, fresh C synthesized by the 3α reaction may be transported by meridional circulation
into the H-rich envelope, thus increasing the amount of C+N+O. They find that this
phenomenon would allows an efficient s-process nucleosynthesis, up to Pb. However, in a
more recent paper, Frischknecht et al. (2012) argue that this result is due to the use of a
particularly low rate of the 17O(α, γ)21Ne reaction, i.e., that suggested by Descouvemont
(1993), which is up to a factor of 1000 lower than the values reported in the widely used
reaction rate compilations (Caughlan & Fowler 1988; Angulo et al. 1999). In the He-burning
core of fast rotating massive stars, this reaction is expected to destroy most of the 17O
released by the poisoning reaction 16O(n,γ)17O. The suppression of the 17O(α, γ)21Ne favors
the competitive channel 17O(α,n)20Ne, so that the neutrons subtracted by the 16O would be
recycled. However, new experiments reinvestigated both channels of the 17O+α, confirming
previous findings (Best et al. 2011, 2013). In particular, they find that the γ channel is
strong enough to compete with the neutron channel, thus leading to a less efficient neutron
recycling. Fast-rotating massive stars might still play a role in the production of the weak
component (up to Sr), but no significant s-process contribution to heavier elements are
expected (see Figure 14 in Best et al. 2013).
The main and the strong components, which include nuclei with 37 < Z < 84, are
produced by low-mass stars (1.5 <M/M⊙ < 2.5) (Straniero et al. 1995; Gallino et al. 1998;
Cristallo et al. 2009, 2011). In these stars, recursive thermonuclear runaways of the shell-He
burning, called thermal pulses (TPs), take place during the AGB phase. Two important
– 7 –
events are connected to the occurrence of these thermal pulses. First of all, owing to the
excess of nuclear energy released by the thermonuclear runaway, an extended convective
instability takes place within the He-rich layer. Later on, owing to the expansion powered by
He burning, the shell-H burning dies down and the inner border of the convective envelope
can attain the He-rich zone (third dredge up - TDU). The s-process nucleosynthesis in
low-mass stars mostly occurs during the relatively long interpulse period (∼ 105 yr), namely
the time elapsed between two subsequent thermal pulses, in a thin radiative layer located at
the top of the He-rich zone (Straniero et al. 1995). This layer is known as the 13C pocket,
because it is enriched in 13C. The neutron source is the 13C(α,n)16O reaction, which requires
a temperature of ∼ 90 − 100 MK and releases low-density neutron fluxes, i.e., about 107
neutrons/cm3, and neutron exposures between 0.1 and 0.4 mbarn−1 (Gallino et al. 1998).
A second neutron burst giving rise to a higher neutron density (> 1011 neutrons/cm3) is
due to the marginal activation of the 22Ne(α,n)25Mg reaction within the convective zone
generated by a thermal pulse, where the temperature may exceed 300 MK. In this case, the
timescale is rather short (∼ 1 yr), so that the resulting neutron exposure is lower than that
of the first neutron burst. These low-mass stars are the main contributors to the s-process
elements in the solar system. However, because of their long lifetime (≥ 1 Gyr), it appears
that they cannot have contaminated the gas from which the galactic halo formed.
This is the standard paradigm for the heavy element composition of the halo. In
practice, only r-process yields are expected in fossil records of the early Galaxy, the s process
being hampered by the secondary nature of the neutron sources in massive stars (weak
component) and by the too long lifetime of low-mass AGBs (main and strong components).
Spectroscopic studies generally confirm such a scenario: single halo stars are r-process
enriched, but s-process poor (see Sneden et al. 2008, and references therein). Exceptions
are the CEMP-s (Carbon-Enhanced-Metal-Poor stars, where the “s” stay for s-rich). In
this case however, the s and the C enrichments are a consequence of mass transfer or wind

– 8 –
accretion in binary systems, a process occurring on a longer timescale (see Bisterzo et al.
2012; Lugaro et al. 2012, and references therein).
In this context, recent spectroscopic studies of Globular Clusters (GCs) revealed a
rather different scenario. While the r-process yields generally appear similar to those
observed in halo field stars, some GCs show a clear signature of the s-process main
component pollution. The few GC stellar populations where an s-process enrichment has
been discovered are: M4 (Yong et al. 2008; D’Orazi et al. 2013a), ω-Cen, only stars with
[Fe/H]>-1.6 (Smith et al. 2000; Johnson & Pilachowski 2010; D’Orazi et al. 2011), and the
redder main sequences of M22 (Roederer et al. 2011) and NGC1851 (Gratton et al. 2012b).
Recently, s-process overabundances have been also found in M2 stars (Lardo et al. 2013).
Other clusters, like M5 (Ivans et al. 2001; Yong et al. 2008), as well as the most metal-poor
stellar populations of ω-Cen, M22 and NGC1851, present a “normal” halo distribution
of the heavy elements characterized by a pure r-process pollution. These challenging
observations represent a further evidence of the existence of multiple stellar populations
in GCs. Nevertheless, at variance with other spectroscopic anomalies, such as the O-Na
anticorrelation (Gratton et al. 2012a, and references therein), the s-process enhancement
is not a common feature of the majority of the GCs in the Milky Way. Therefore, a
different class of polluters should be responsible for the heavy-element anomalies. Such a
conclusion is also supported by the fact that in M22 and NGC1851 the O-Na anticorrelation
is observed in both s-rich and s-poor stars of the same cluster. Moreover, all stars in M4
show a similar overabundance of the s elements but this enrichment is uncorrelated with
the [Na/Fe]. More intriguing, some spectroscopic indexes, which depend on the metallicity
of the polluters, do not match the theoretical expectations for low-mass AGB stars, which
are considered the most important producers of the galactic s-process main and strong
components. In particular, the ratio between heavy-s (Ba, La or Nd) and light-s elements
(Sr, Y or Zr) are found in solar proportions ([hs/ls]∼ 0]), while an excess of heavy-s is
– 9 –
expected at low Z. Therefore, the polluters responsible for such a peculiar chemical pattern
cannot be the same stars responsible for the bulk of the s-process yields in the Galaxy.
In this paper we study the characteristics of the s-process nucleosynthesis in metal-poor
AGB stars of low and intermediate mass. We will discuss, in particular, the variations of
the nucleosynthesis outcomes with the stellar mass. In the next section we review the most
important inputs physics and how they are included in our stellar evolution code. In section
3 we analyse the operation of the two neutron sources active in thermally pulsing AGB
stars. This analysis is based on the models presented in section 4. The theoretical yields we
derive from these models may be used to test various scenarios for GC formation that have
been proposed to explain photometric and spectroscopic evidences of multiple populations,
among which: multiple photometric sequences, star-to-star variations of the chemical
composition, which cannot be ascribed to internal physical processes, and anomalous color
dispersion of horizontal branch stars or the so-called second parameter problem (for a
recent review see Gratton et al. 2012a). Several hypotheses about the GC formation have
been proposed to explain the new observational framework, such as: inhomogeneities of the
primordial material, merging of smaller stellar systems, pollution with external material
felt into the gravitational potential well of the cluster and various self-pollution scenarios.
Which of these scenarios can also provide an explanation for the s-process enhancements
observed in a few GC stellar populations? Which stars are responsible for the s-process
contamination in GCs? What are the special conditions determining the onset of this
peculiarity? These issues are addressed in section 5 and 6. We show, in particular, that
AGB stars with mass ranging between 3 to 6 M⊙ can produce the yields necessary to
reproduce the observed heavy-element anomalies. In this case, we find that the time elapsed
between the formation of the polluters and that of the polluted stellar populations should
be of the order of 100-200 Myr.
– 10 –
2. The stellar evolutionary code
All the stellar models presented in this paper have been computed by means of our
FUNS code (FUll Network Stellar evolution code)4. As illustrated in Straniero et al. (2006)
(see also Cristallo et al. 2009, 2011), it includes a full nuclear network of about 500 isotopes
(from 1H to 209Bi) and more than 1000 nuclear reactions, coupled to the standard set of
1d hydrostatic differential equations that describe the physical structure. Rotation has
been recently included and the resulting effects on the s-process nucleosynthesis occurring
in low-mass AGB stars have been discussed in Piersanti et al. (2013). The models here
presented are for non-rotating stars. Rotating models for intermediate mass AGB stars will
be presented in a forthcoming paper.
The occurrence of recursive thermonuclear runaways makes the computation of AGB
evolutionary sequences and the related nucleosynthesis a challenging task for stellar
modelers. Numerical algorithms and input physics should be particularly accurate to
properly follow significant variations of the physical and chemical structure on relatively
small temporal and spatial steps. Many efforts have been made to improve the physical
description of these stars and a qualitative agreement is generally found between models
produced by different groups, although quantitative results may be rather different. In this
section we review the physical processes expected to produce major uncertainties on AGB
calculations and how they are treated in the FUNS code.
4Such a code has been derived from the FRANEC code (Chieffi & Straniero 1989;
Chieffi et al. 1998).
– 11 –
2.1. Mass loss
The AGB mass-loss rates are usually estimated from infrared colors or CO rotational
lines. Thanks to the recent progress of the infrared astronomy, our knowledge of the AGB
mass loss has been significantly improved (see, e.g., Groenewegen et al. 2009, and references
therein). Nonetheless, a general prescription to be used in stellar model calculations is far
from being definitely established.
AGB stars are long period variables, Miras or irregulars. In this context, the mass-loss
rate versus period relation is an appealing tool for the purpose of stellar model calculations
(Vassiliadis & Wood 1993; Whitelock et al. 1994; Schoier & Olofsson 2001; Whitelock et al.
2003; Winters et al. 2003; Groenewegen et al. 2009). Vassiliadis & Wood (1993) firstly
use a mass-loss rate versus period relation to calculate AGB models of different masses.
In Straniero et al. (2006), we update this relation by means of a more extended set of
infrared data. In general, these measurements show that the mass-loss rate remains quite
moderate, namely 10−8 < dM/dt < 10−7, for logP (days) < 2.5. For larger periods the
mass-loss rate steeply increases and attains maximum values for logP > 3. This upper
limit (a few 10−5 M⊙/yr) coincides with the superwind phase, which is dominated by a
radiation-pressure driven wind (Vassiliadis & Wood 1993). It should be noted, however,
that the observed spread of the mass-loss rate versus period relation is rather large. For
a given period, the mass-loss rate may vary up to a factor of 10 (see, e.g., Straniero et al.
2006, Figure 5). Nevertheless, it appears that the mass loss versus period relation is a
universal feature of AGB stars, independent of stellar mass and envelope composition. For
instance, Whitelock et al. (2003) do not find differences between O-rich and C-rich stars,
while Groenewegen et al. (2009) exclude a variation with the metallicity. Therefore, it
appears that the same mass-loss rate versus period relations can be applied to AGB models
of different mass and initial composition. On the contrary, other mass-loss prescriptions,
– 12 –
such as the empirical formula derived by van Loon et al. (2005) or the semi-empirical
relation provided by Bloecker (1995), apply to models within a more restricted range of
stellar parameters (i.e., initial mass and composition). It should be remarked that most of
the available mass-loss studies are based on stars of the Galactic Disk, Galactic Bulge and
Magellanic Clouds. Little is known about AGB mass loss for stars with metallicity as low
as that of the Galactic GCs.
The mass-loss rate versus period formula used to compute all the AGB models
presented in this paper is that described in Straniero et al. (2006). For the pre-AGB phase
a classical Reimers’ mass-loss rate (η = 0.4) is used.
2.2. Super-adiabatic convection
In the external convective layers of red giant stars, convective heat transfer only
partially accounts for the whole outgoing energy flux. In this case, the effective temperature
gradient is larger than the adiabatic one. This is particularly important for AGB stars,
where more than 90% of the mass of the convective envelope undergoes super-adiabatic
conditions (see Figure 1). The mixing-length theory (MLT; Bohm-Vitense 1958) is widely
used to evaluate the super-adiabatic temperature gradient. Being a phenomenological
theory, it implies a number of free parameters, usually reduced to just one called α, i.e., the
ratio of the average mixing length to the pressure scale height. Note that there exist different
versions of the MLT, so that the physical meaning of α may differ from author to author.
In our calculation we adopt the formalism described by Cox & Giuli (1968). An alternative
phenomenological approach is that proposed by Canuto & Mazzitelli (1991) (hereinafter
CM). They consider the full turbulent energy spectrum and set the convective scale length
equal to the geometrical depth from the top of the convective region. Comparisons between
MLT and CM models show that the CM formalism cannot be reproduced by the MLT

– 13 –
with any constant value of α (Mazzitelli et al. 1995). In practice, the mixing-length free
parameter is usually calibrated by reproducing the solar radius with a standard solar
model. However, there are no physical reasons to believe that a unique value of α is
suitable for any stellar model. Therefore, it may be possible that α should be varied along
an evolutionary sequence. This issue has been investigated by Freytag & Salaris (1999)
by means of multidimensional radiation hydrodynamics (RHD) simulations covering the
range of effective temperatures, gravities, and compositions typical of MS and RGB stars
of Galactic GCs. They found that RGB models computed with the α parameter derived
from RHD are slightly cooler than those computed adopting a solar calibrated α, (less than
10%), while the CM models predict too low effective temperature. In practice, RGB models
would require an α value larger than that needed to reproduce the solar radius. A direct
comparison with measured effective temperatures of RGB stars have been also reported by
Ferraro et al. (2006) (see also Chieffi et al. 1995). This study confirms previous findings
of Freytag & Salaris (1999). Note that a similar comparison cannot be easily obtained
with AGB stars, because of the recursive variations of the effective temperature caused by
thermal pulses. Since the convective envelope of an AGB star is more similar to that of
a RGB star than to the solar convective envelope, all the models presented in this paper
have been computed with the MLT and α calibrated on GC RGB stars, namely α = 2.1, as
reported in Ferraro et al. (2006).
In low-mass AGB stars, a variation of α affects the efficiency of the TDU (e.g.,
Cristallo et al. 2009, 2011). In addition, since the effective temperature depends on α,
the mass-loss rate is also changed. Both these effects modify the heavy element yields.
Nevertheless, the relative abundances of Pb, heavy-s and light-s are marginally affected.
In massive AGB, a variation of α also affects the maximum temperature attained at the
bottom of the convective envelope and, in turn, the nucleosynthesis in the convective
envelope and the stellar luminosity (e.g., Iben & Renzini 1983; Ventura & D’Antona 2005).

– 14 –
2.3. Time dependent convection
Owing to the complex nucleosynthesis taking place within the convective regions of
AGB stars, which involve a great number of nuclear species, some nuclear burning timescales
may be comparable or smaller than the convective turnover timescale. In that case, the
assumption of instantaneous mixing, which is usually adopted in computations of pre-AGB
stellar models, is no more valid. In case of stars undergoing hot bottom burning (HBB, see
Iben & Renzini 1983), high temperatures are attained in the convective envelope during the
interpulse period. As an example, for the model shown in Figure 1, the temperature at the
bottom of the convective envelope is about 85 MK, which is large enough for the activation
of the CN cycle. Note that the extension of the convective envelope of these giant stars
is of a few hundreds R⊙ and the average convective velocity, as derived by means of the
MLT, is of a few 105 cm/s, so that the convective turnover timescale is of the order of 108
s. Then, it can be easily verified that the burning timescales of several isotopes involved in
the HBB nucleosynthesis are shorter than the convective turnover timescale. For instance,
the 12C burning timescale becomes shorter than 108 s for T> 60 MK5. Therefore, nuclear
reactions are faster than the convective mixing, so that partial mixing takes place. Note
that the effects of the HBB are overestimated when instantaneous mixing is assumed, with
important consequences on both the nucleosynthesis and the HBB contribution to the
luminosity. Concerning the convective zone generated by a thermal pulse, convection is
usually faster than the α captures, so that the majority of the nuclear species are efficiently
mixed. This is not the case of neutrons and protons. The neutron burning timescale is
extremely short, so that the neutrons released by the 22Ne(α,n)25Mg reactions are suddenly
captured as if they were in a radiative environment. On the other hand, within a C-rich
5The 12C burning timescale is given by τ12 = 1ρr12,1XH
, where r12,1 is the rate of the
12C(p, γ)13N reaction, ρ is the density and XH is the hydrogen mass fraction.

– 15 –
environment where the temperature is of the order of 200-300 MK, as in the convective
zone generated during a TP, the proton mobility is also very limited, mainly because of the
12C(p, γ)13N reactions. Also in this case deviations from the instantaneous mixing must be
properly accounted.
The time dependent mixing scheme we use has been described in Straniero et al.
(2006). It has been derived from an algorithm originally proposed by Sparks & Endal
(1980). In brief, the degree of mixing is calculated by means of the following relation:
Xj = Xoj +
1
Mconv
∑
k(Xo
k −Xoj )fj,k∆Mk (1)
where Xoj and Xj are the mass fractions in the mesh-point j at time t and t + ∆t,
respectively. The summation is extended over the whole convective zone. ∆Mk is the mass
of the mesh-point k, while Mconv is the total mass of the convective zone. The damping
factor fj,k is:
fj,k =∆t
τj,k(2)
if ∆t < τj,k, or
fj,k = 1 (3)
if ∆t ≥ τj,k. Here ∆t is the time step and τj,k is the mixing turnover time between the
mesh-points j and k, namely:
τj,k =
∫ r(k)
r(j)
dr
v(r)=
∑
i=j,k
∆rivi
(4)
The mixing velocity (vi) is computed according to the MLT.
2.4. Instability of the convective border, third dredge up and 13C pocket
When the convective envelope penetrates the H-exhausted core, a steep variation
of the composition takes place at the convective boundary: the H mass fraction drops

– 16 –
from about 70%, within the fully convective envelope, down to zero, in the underlying
radiative core. The composition gradient induces a sharp variation of the radiative
opacity and, in turn, an abrupt change of the radiative temperature gradient. In these
conditions, the precise location of the convective border, as defined by the neutrality
condition ∇rad = ∇ad6, becomes highly uncertain. Indeed, even a small perturbation
causing mixing across the boundary layer induces an increase of ∇rad in the radiative
stable zone so that the convective instability moves toward the interior. This situation
is commonly encountered in AGB stellar models when a bare Schwarzschild’s criterion is
used to fix the convective boundaries. It affects both the second and the third dredge
up (Becker & Iben 1979; Castellani et al. 1990; Frost & Lattanzio 1996; Castellani et al.
1998; Mowlavi 1999). However, if the effects of such an instability on the second dredge
up are probably marginal (Castellani et al. 1998), this is not the case of the third dredge
up. Various attempts have been made to overcome such a problem, but a satisfactory
solution is still lacking. For instance, Boothroyd & Sackmann (1988) extend to the AGB
a method originally developed by Castellani et al. (1985) to treat a similar instability
occurring at the outer edge of the convective core during the core-He burning phase. In
practice, they try to extend the convective zone, namely: if after mixing the previously
stable mesh points become unstable, a further extension of the convective zone is applied,
otherwise mixing is limited to the mesh-points where ∇rad > ∇ad. A different approach
has been followed by Frost & Lattanzio (1996). In stellar evolution codes based on the
implicit Henyey method, the convective boundaries are usually calculated once per time
step. Instead, Frost & Lattanzio (1996) recalculate the convective boundaries and the
corresponding new abundances after each Henyey iteration. This approach should allow to
6 ∇rad =(
∂ log T∂ logP
)
radand ∇ad =
(
∂ log T∂ logP
)
adare the radiative and the adiabatic tempera-
ture gradients, respectively.
– 17 –
take into account the feedback of the physical structure due to the variation of the chemical
composition induced by mixing. However, severe numerical instabilities are encountered
when this procedure is adopted. To overcome such a problem, Frost and Lattanzio set a
maximum number of Henyey iterations after which the integration is stopped, even if the
stellar structure equations are not satisfied. Note that both Boothroyd & Sackmann (1988)
and Frost & Lattanzio (1996) assume, as usually done, i) instantaneous mixing within
the convective zone and no extra-mixing beyond the convective boundaries. Actually,
the transition between the fully-radiative and the fully-convective zone most likely occurs
over a somewhat extended layer, where only a partial mixing takes place. In general,
hydrodynamical models of stellar convection confirm the existence of this transition layer
(e.g., Freytag et al. 1996; Canuto 1998, 1999; Young et al. 2003, and reference therein).
In particular, Freytag et al. (1996) find that the average convective velocity should drop
exponentially below the shallow fully-convective envelope of A-type stars and cool white
dwarfs. Unfortunately, a limited number of hydrodynamical investigations have been carried
out so far for AGB stars undergoing TDU (see, e.g., Young et al. 2003), so that generalized
prescriptions for the extension of the transition layer and the strength of the decline of the
average convective velocity are not available yet for AGB computations. Nevertheless, owing
to the relevance of this phenomenon, AGB models obtained by assuming an exponential
decline at the convective boundaries have been developed by various authors (Herwig et al.
1997; Herwig 2000; Mowlavi 1999; Chieffi et al. 2001; Straniero et al. 2006; Cristallo et al.
2009, 2011). In these models, a smooth and stable variable H profile forms at the inner
border of the convective envelope, so that the instability occurring at the third dredge up
is removed. In addition, the presence of this H profile left in the zone highly enriched in
He and C provides the conditions for the formation of the 13C pocket. Note that such an
approach necessarily requires the introduction of a free parameter, i.e., the strength of the
exponential decline (hereinafter, the β parameter). For instance, in our computation the
– 18 –
average convective velocity within the convective-radiative transition layer is given by:
v = v0 exp
(
−d
βHP
)
(5)
where d is the distance from the formal convective boundary, v0 is the average velocity of
the last unstable mesh point, HP is the pressure scale height and β is a free parameter.
In principle, each convective boundary would require a different β value. Note, however,
that within the fully convective zones we calculate v by means of the MLT. In this case
v ∝ (∇rad − ∇ad), so that v0 = 0 when, as usual, the neutrality condition is fulfilled at
the convective boundary. In practice, since we consider the average convective velocity,
convective overshoot is neglected in our models7. On the other hand, v0 ≫ 0 during a
dredge up (because ∇rad ≫ ∇ad), so that an extramixing naturally araises. Two are the
main consequences of this approach, namely i) a deeper dredge up and ii) the development
of a 13C pocket. The total mass of 13C in the pocket depends on both the strength of the
exponential decline (β in equation 5) and the adopted mixing scheme. Our tests show that
when a diffusive scheme is adopted, as in several extant stellar evolution codes, the resulting
13C mass is too small to allow a sizeable s-process nucleosynthesis for any choice of β (see
also Herwig 2000). Instead, in our scheme the degree of mixing between two mesh-points
depends linearly on the inverse of their reciprocal distance and on the corresponding
turnover timescale (see previous section). By means of this mixing scheme and with a
proper choice of β, we are able to obtain sufficiently large 13C pockets to account for the
bulk of the s-process enhancements measured in AGB stars of relatively low mass (1.5-2.5
M⊙). The variation of the 13C pocket with β and its calibration have been extensively
discussed in Cristallo et al. (2009).
7With the term “convective overshoot” we intend a mixing beyond the convective bound-
ary in a layer where ∇rad −∇ad < 0 both before and after the mixing (see, classical papers
by Bertelli et al. 1985; Maeder & Meynet 1987).
– 19 –
2.5. Radiative opacity and equation of state
The occurrence of recursive dredge-up episodes produces significant changes in the
chemical composition of the stellar envelope. In principle, a stellar evolution code should
account for this phenomenon. In practice, only variations of the main constituents are
usually considered. In particular, extant stellar models are based on radiative opacity tables
for fixed composition (i.e., scaled solar) except for H and He. This procedure substantially
underestimates the radiative opacity of the cool atmosphere of evolved AGB stars, which are
highly enriched in C and N. Besides the local thermodynamic conditions, the concentration
of the various molecular species basically depends on the atomic abundances. In this
respect, an important quantity is the C/O ratio. Among the various molecular species
involving C atoms, CO has the larger dissociation energy, so that for C/O<1 almost all the
C atoms participate to the formation of this molecule, while the oxygen atoms in excess
are free to form other molecules, such as TiO and H2O. However, when as a consequence
of the TDU C/O becomes larger than 1, carbon-bearing molecules, e.g., C2, CN, C2H2,
and C3, dominate the radiative opacity. In addition, if the bottom of the convective
envelope attains temperature that are large enough for the activation of the CN cycle,
some of the C dredged up is converted into N. Marigo (2002) made a first step toward a
correct description of the abundance changes in the calculation of opacity coefficients by
estimating molecular concentrations through dissociation equilibrium calculations. Her
main finding is the substantial decrease of the effective temperature of C-star models, which
implies a huge increase of the mass-loss rate. More recently, Cristallo et al. (2007) (see
also Marigo & Aringer 2009) presented new opacity tables with variable amount of C and
N. The effects of the adoption of these new opacity tables are particularly strong at low
metallicity for which the C+N enhancement in the envelope may be as large as a factor
1000.
– 20 –
The model presented in this paper have been computed with the following prescriptions
for the radiative opacity. For T≤ 104 K we use tables that allow arbitrary enhancements
of both C and N and include both atomic and molecular opacity sources (Cristallo et al.
2007). For larger temperature, we have generated specific opacity tables from the OPAL
facility (Iglesias & Rogers 1996). Also in this case arbitrary enhancements of C and N are
allowed.
The equation of state (EOS) is another critical ingredient of AGB models. An
EOS suitable for the high-density regime of the stellar core should account for electron
degeneracy and electrostatic interactions (see Straniero 1988). In addition, relativistic
corrections should be considered for density ∼ 106 g/cm3, as it occurs near the stellar center.
Partial degeneracy of the electron component takes place in the transition layer between
the CO core and the He-rich intershell. At the opposite, in the cool H-rich envelope,
partial ionization of atoms and, more outside, molecular recombination produce sizeable
modifications of the relevant thermodynamic quantities, such as pressure, specific heat or
adiabatic gradient. After various tests devoted to quantify the different contributions to the
EOS and their implications for the models, we have adopted the following prescriptions. For
T< 106 K we use the EOS2005 tables provided by the OPAL collaboration (Rogers et al.
1996). These temperatures are usually attained in a great portion of the H-rich envelope,
where partial ionization and molecular recombination of the most important chemical
species occur. A double interpolation, on hydrogen mass fractions and Z, is performed
to account for the variations of the chemical composition due to nuclear burning and/or
mixing. Note that in this way the modifications of the envelope composition due to the
TDU are not properly taken into account. Indeed, for a given Z, the relative abundances of
elements heavier than He are fixed to the scaled-solar values. Nevertheless, we have verified
that at variance with the radiative opacity, the interpolation on the total Z provides a
good approximation for the EOS. This method is not adequate for the H-exhausted core,
– 21 –
where the contribution to the EOS of elements heavier than He is more important. For this
reason, at temperature larger than 106 K we use EOS tables for pure elements, as described
in Straniero (1988) and Prada Moroni & Straniero (2002). This EOS implies full ionization,
which is a quite good approximation for T> 106 K8. Therefore, additivity laws that apply
to specific thermodynamic quantities, such as pressure, volume and all the state functions,
are exploited to combine the contributions of the various chemical species. The transition
across the T= 106 K boundary is sufficiently smooth.
3. The two neutron bursts
As recalled in the Introduction, two different neutron sources are active in AGB stars
undergoing TPs and TDU. In this section we illustrate, on the base of stellar models
computed with the FUNS code, the operation of these neutron sources in low metallicity
stars of low and intermediate mass. The discussion will be focused on the parameters
affecting the nucleosynthesis.
3.1. The radiative 13C(α,n)16O neutron source at low Z
The TDU is a necessary condition for the formation of the 13C pocket. When the
convective envelope penetrates the H-exhausted core, down to a layer where the mass
fraction of the 12C produced during the previous thermal pulse is about 20%, and, then,
recedes, it leaves a variable H profile (see section 2.4). Later on, when this region contracts
8Actually, at T∼ 106 K, this approximation is very good for hydrogen and helium, almost
true for the most abundant metals (C, N and O), while iron ions may hold a few of their
inner electrons.
– 22 –
and heats up, the 12C(p, γ)13N(β+)13C chain starts to produce 13C. Then, a 13C pocket
forms in the innermost tail of the variable H profile left by the TDU. More outside, owing
to the larger H mass fraction, the CN cycle is completed and 14N, rather than 13C, is
produced (see panel a) in Figure 2). The temperature in the zone occupied by the thin 13C
pocket, which now contains up to a few 10−6 M⊙ of 13C, continues to increase during the
interpulse period. Later on, when the temperature attains ∼ 90 MK, the neutron-capture
nucleosynthesys powered by the 13C(α,n)16O reaction begins. Initially, the iron seeds in
the pocket are rapidly consumed to produce light-s isotopes, up to the first bottleneck
corresponding to the magic nuclei 88Sr, 89Y and 90Zr (see panel b) in Figure 2). Then, since
at that time most of the iron has been already consumed within the pocket, these light-s
nuclei become the main seeds of the s process. While these nuclei are consumed, those
belonging to the second bottleneck, such as 138Ba or 139La, are accumulated (panel c) in
Figure 2). When the amount of heavy-s overcomes that of the light-s, the amount of 13C
is still large and also 138Ba or 139La become seeds, while 208Pb and 209Bi are accumulated
(panel d) in Figure 2). Summarizing, the large excess of 13C with respect to the original
iron seeds in the pocket leads to the production of a large amount of lead, the end-point
of the s process. This occurrence is a common feature of low-mass AGB models with
[Fe/H]< −1. By increasing the metallicity, the Pb produced by the 13C burning decreases,
but the heavy-s are overproduced with respect to the light-s (see Busso et al. 1999). Finally,
if the number of Fe nuclei in the pocket is comparable to (or larger than) the number of 13C
nuclei, the main s-process yields are light-s. Such a condition is attained for Z≥Z⊙. Note
that the mass extension of the 13C pocket decreases as the core mass increases. As a result,
the largest pockets are those forming at the beginning of the thermal pulse AGB phase. For
this reason, in low-mass AGB stars (M< 3 M⊙), the s-process nucleosynthesis is dominated
by the few (3 or 4) initial 13C bursts (Cristallo et al. 2009). For the same reason, the 13C
pockets are smaller in more massive AGB, so that the s-process contribution of the radiative

– 23 –
13C(α,n)16O neutron-capture nucleosynthesis decreases as the stellar mass increases. In
massive AGB stars, additional phenomena affecting the development of the 13C pocket
should be considered: the hot third dredge up (HTDU, see Goriely & Siess 2004) and the
HBB. In the first case, when the convective envelope penetrates into the H-exhausted core
(TDU), it encounters hotter layers. If the core mass is large enough, the temperature
may be sufficiently high to activate proton capture reactions. Then, the energy released
by the nuclear reactions contrasts the convective instability that is pushed outward. This
phenomenon has two effects. First, it rises a barrier that limits the TDU. Second, when
the convective envelope recedes, it leaves a steeper H profile compared to that obtained
in low-mass stars. Therefore, the resulting 13C pockets are smaller. The HBB takes place
during the interpulse period in the more massive AGB and in super-AGB stars9. In this
case, the convective envelope attains layers where the H-burning nucleosynthesis takes
place. Then, fresh fuel stored in the cooler portion of the envelope is continuously brought
into the burning zone, so that the H-burning rate increases. As firstly demonstrated by
Straniero et al. (2000), this rate determines i) the physical conditions at the He ignition, ii)
the power of the consequent thermal pulse and iii) the deepness of the following TDU. In
particular, the faster the H burning, the weaker the He flash and, in turn, the shallower
the following TDU. In summary, the combined action of HTDU and HBB prevents the
formation of sizeable 13C pockets and limits the penetration of the convective instability into
the H-exhausted core, so that the s-process nucleosynthesis due to the 13C(α,n)16O neutron
burst is suppressed. The upper mass limit depends on the metallicity. At Z= 10−4, we
9As usual, AGB stars are those stars that enter in the AGB phase just after the He-
burning phase, while in super-AGB stars the AGB phase follows the C-burning phase. The
transition mass between the progenitors of AGB and super-AGB stars, the so-called Mup, is
rather uncertain and depends on both metallicity and He content (Becker & Iben 1979).

– 24 –
found that the 13C neutron source provides a non-negligible contribution to the s-process
nucleosynthesis for M≤ 4 M⊙, while at Z=Z⊙ this limit rises up to ∼ 5 M⊙. In any case,
the core mass should be lower than about 0.9 M⊙. Let us note that the precise value of
the maximum mass (or core mass) for the development of sizeable 13C pockets depends on
the adopted mixing scheme (see section 2.3). However, as far as we know, no other authors
have investigated this limit by means of self-consistent stellar models. Indeed, a proper
treatment of both HBB and HTDU requires stellar model calculations performed with
a sufficiently extended nuclear network coupled to the stellar structure equations. Only
in this case, the calculation may account for all the energetic feedbacks on the physical
structure. Nonetheless, the shrinking of the 13C pockets in the more massive AGB is a
widely accepted phenomenon (Goriely & Siess 2004). For instance, Lugaro et al. (2012),
in their post-process calculations, do not include the nucleosynthesis associated to the 13C
pocket in models with M> 4.5 M⊙.
3.2. The convective 22Ne(α,n)25Mg neutron source at low Z
The second neutron burst occurs under very different environmental conditions. First
of all, the temperature required to activate the 22Ne(α,n)25Mg reaction is definitely larger,
namely about 300 MK. The maximum temperature reached at the bottom of the convective
shell generated by a thermal pulse (TMAXcsh ) depends on the mass of the H-exhausted core
(see, e.g., Iben & Renzini 1983): the larger the core mass, the larger TMAXcsh . Larger core
masses are attained by more massive stars and, for a given mass, by more metal-poor stars.
For instance, at Z=0.0001, the 22Ne(α,n)25Mg reaction provides an important contribution
to the overall s-process nucleosynthesis for M>2.5 M⊙, while at solar metallicity this limit
rises up to 3.5 M⊙. At variance with the 13C burning, since the core mass increases as the
star climbs the AGB, the 22Ne(α,n)25Mg reaction is more efficient near the AGB tip, when
– 25 –
the temperature within the convective zone generated by the thermal pulse is larger.
Owing to the large temperature (T> 300 MK), the 22Ne burning generates quite
large neutron densities, i.e., in between 1011 and 1013 neutrons/cm3. As a consequence,
some branchings, which are closed in the case of the radiative 13C(α,n)16O neutron burst,
are opened, thus allowing alternative s-process paths. Nonetheless, the neutron exposure
is not particularly high because of the short duration of a thermal pulse. In addition,
the iron reservoir in the convective zone generated by a thermal pulse is large enough to
guarantee a sufficiently large amount of seeds for the whole duration of 22Ne burning, even
for metallicity as low as Z∼0.0001. Then, the f factor defined in the Introduction does
not rich the large values attained in the case of the radiative 13C burning as a consequence
of the rapid Fe consumption. For all these reasons, the main yields of the second neutron
burst are light-s elements, while heavy-s and Pb are marginally produced.
Note that at variance with massive stars, in AGB stars undergoing TDU the
22Ne(α,n)25Mg reaction may be a primary neutron source. Indeed, the TDU moves primary
C from the He-rich intershell to the H-rich envelope. In AGB models with M< 4 M⊙ and
low initial metallicity, we find that the C abundance in the envelope attains solar values
just after a few TDU episodes. As a result, a relatively high amount of primary 22Ne is
piled up within the He-rich layer. In any case, the amount of primary 22Ne in the intershell
decreases as the stellar mass increases. Indeed, as already discussed, HBB and HTDU
prevent deep TDUs in the more massive AGB models, thus reducing the contamination of
the envelope with the ashes of the internal nucleosynthesis. For instance, we find that the
s-process contribution is substantially reduced in models with M> 6 M⊙. Such a conclusion
confirms previous finding by Doherty et al. (2014). In their super-AGB models most of
the neutrons released by the 22Ne(α,n)25Mg reaction are captured by the 25Mg(n,γ)26Mg
reaction. As a result, a marginal contribution to the synthesis of heavy elements is expected
– 26 –
from super-AGB stars.
4. The s-process polluters
In this section we present a set of models of AGB stars with mass 2 ≤ M/M⊙ ≤ 6,
[Fe/H]=-1.7, [α/Fe]=0.5 and Y=0.24510. The corresponding metallicity is Z=7×10⁻⁴.
Table 1 reports various properties of these models. In principle, owing to the relatively
short lifetime (second column of Table 1), these stars could have time to evolve up to the
AGB, thus contaminating the still not-completed building blocks of the early Galaxy. In
colum 2 and 3 we report the number of TDU episods and the total mass of the material
dredged up, respectively. Note that the average mass dredged up in a single TDU episode
decreases as the stellar mass increases. On the contrary, the number of TDU epsidodes
increases as the stellar mass increases. As a result the MTDU versus M relation is not linear.
In particular, MTDU is practically the same in all models with 3 ≤M≤ 5, while in the 6
M⊙ model it is the 27% of that of the 2 M⊙ model. As it is well known, the maximum
peak temperature in the convective shells generated by thermal pulses (column 7) as well
as the maximum temperature developed at the base of the convective envelope during the
interpulse periods (column 8) increase as the stellar mass (or the core mass) increases
(Iben & Renzini 1983). The first temperature affects the efficiency of the convective
neutron-capture nucleosynthesis as powered by the 22Ne(α,n)25Mg reaction, while the
second temperature determines the efficiency of the HBB. We also report the maximum
neutron density corresponding to the maximum peak temperature attained at the base
of the convective shells generated by TPs (last column in Table 1). Note that, in spite
10 The initial composition has been obtained following the procedure described in
Piersanti et al. (2007). The reference solar abundance compilation is from Lodders (2003).
– 27 –
of the similar temperature, the maximum neutron densities of the 5.5 and 6 M⊙ models
are smaller than that of the 5 M⊙. Such an occurrence is due to the limited dredge up
suffered by the more massive AGB stars and, in turn, to the smaller amount of primary
22Ne accumulated in the He-rich intershell (see section 3.2).
In Figure 3 we compare the final surface composition of three of the computed models.
In the upper panel we show the 2 M⊙ case. This model represents a typical case of a
low-mass AGB stars, characterized by a low core mass, quite deep TDU episodes, low
temperature at the base of the convective zone generated by a TP and low temperature
at the base of the convective envelope. The nucleosynthesis is dominated by the radiative
13C burning, while the convective 22Ne burning only plays a marginal role and the HBB is
negligible 11. The opposite situation is illustrated in the lowest panel, where the 6 M⊙ case
is shown. In this model the 13C pockets are rather small and the corresponding contribution
to the s-process nucleosynthesis is marginal. On the contrary, due to the large core mass, the
temperature at the base of the convective shell generated by a TP is quite large and the s
process powered by the 22Ne(α,n)25Mg reaction is very efficient. These stars also experience
a substantial HBB, as clearly shown by the large nitrogen enhancement. The central panel
shows an intermediate case, the 4 M⊙ model. In these stars the synthesis of heavy elements
is determined by a combination of both the 13C(α,n)16O and the 22Ne(α,n)25Mg neutron
bursts. During the first part of the TP AGB phase, the 13C pockets are sufficiently large
to power a substantial production of lead and, to a less extent, of heavy-s elements, while
11Measurements of C and N in Carbon Enhanced Metal Poor stars (e.g., Johnson et al.
2007) demonstrate that some kind of extra-mixing, deep mixing or cool bottom process
should be active in these stars (see also Cristallo et al. 2007). This phenomenon, whose
physical origin is a controversial issue, is not included in the models here presented. Note,
however, that it does not affect the synthesis of heavy elements.

– 28 –
the lack of 22Ne hampers the second neutron burst. After a few TPs, physical and chemical
conditions are reversed. The 13C pockets becomes progressively smaller, while the amount
of 22Ne in the He intershell grows up as a consequence of the C dredge up. Then, in the
late part of the AGB, the convective 22Ne burning dominates the s-process nucleosynthesis.
The synthesis of lead, which is very efficient during the first part of the thermal pulse AGB
evolution, reduces significantly after a few TPs, while the production of the light-s elements
increases. Note the Rb peak (Z=37) in both the 4 and the 6 M⊙ models. This feature is
the signature of the high neutron density characterizing the 22Ne neutron burst, which is
absent in models with M≤ 2.5 M⊙, because of the marginal activation of the second neutron
source.
In Table 2 we report the average overabundances in the ejected material of some
representative elements, namely:
1) C+N+O. As a consequence of both the first and the second dredge up, material processed
by the H burning is mixed into the envelope. As a result, the abundances of C and O
decrease, while that of N increases. Nevertheless, the total amount of C+N+O nuclei is
conserved. This is not the case of the TDU, which moves into the envelope primary C and,
to a less extent, primary O produced by the He burning. As a result, the overabundance of
C+N+O at the end of the AGB depends on the efficiency of the TDU and, then, it reflects
the variation of MTDU with the initial mass (see Table 1).
2) Fluorine. The AGB production of this element is strictly connected to the
13C(α,n)16O reaction (Lugaro et al. 2004; Abia et al. 2009, and references therein). Indeed,
19F is mainly synthesized by the 15N(α, γ)19F reaction in the convective zone generated by
a TP. 15N may be produced by the 18O(p, α)15N reaction, which requires the simultaneous
presence of certain amounts of both protons and 18O. This condition is fulfilled in the 13C
pocket, where protons are released by the 14N(n, p)14C reaction, the main neutron poison,

– 29 –
and 18O mainly by the 14C(α, γ)18O reaction. If the C+N+O abundance in the envelope
is large enough, an additional source of 15N is provided by the 13C left in the H-burning
ashes and engulfed in the convective zone generated by a TP. At the beginning of the
thermal pulse, this 13C is rapidly consumed by the 13C(α,n)16O reaction, thus allowing the
production of 15N through the same nuclear chain already active in the 13C pocket, with the
additional contribution of the 14N(α, γ)18F(β)18O reaction. In a low-mass AGB star with
solar Z, more than 50% of the fluorine enhancement is due to the 13C left in the H-burning
ashes, while at low Z this contribution becomes important in the late part of the AGB,
when, as a consequence of the TDU, the C+N+O in the envelope increases. By increasing
the stellar mass, the F production decreases, according to the progressive reduction of the
13C pockets mass and of the TDU. In addition, owing to the larger temperature within
the convective zone generated by a TP, the two reactions 19F(α, p)22Ne and 19F(n, γ)20F
(followed by a β decay into 20Ne) become efficient fluorine destroyers. Finally, in the more
massive AGB a further depletion of F is due to the HBB. Since also Pb is a main product of
low-mass stars, while it is underproduced in the more massive AGB, a positive correlation
between F and Pb is expected in s-rich GC stars.
3) Sodium. Na partecipates to the Ne-Na cycle active in the hottest zone of the H-burning
shell. In low-mass AGB stars a further sodium source is provided by the so-called 23Na
pocket (Goriely & Mowlavi 2000; Cristallo et al. 2009), as due to an incomplete Ne-Na cycle
occurring in the thin layer with variable H profile left by the third dredge up. In addition,
neutron captures on 22Ne may produce some 23Na within the He intershell. Therefore, the
surface sodium abundance increases after each dredge-up episode. In the more massive
AGB, the HBB modifies the surface sodium abundance. It may be produced or destroyed,
depending on the maximum attained temperature and on the interplay with the TDU that
brings in the envelope additional 22Ne (see Ventura & D’Antona 2006). The large part of
the Na enhancement we find in our models with M> 3 M⊙ is a consequence of the second
– 30 –
dredge up, while the HBB and the TDU play a marginal role (see Figure 4). In lower mass
models, additional contributions come from the third dredge up. Owing to the combination
of different sources, no clear correlations between the Na abundance and the stellar mass
can be derived.
4) Y, La and Pb. These three elements are representative of light-s, heavy-s and of the
end point of the s-process nucleosynthesis, respectively. Relative abundances are also
reported in the last two columns. As expected, lead is the major product of low-mass
AGB. Its overabundance decreases as the mass increases. In the more massive models
it is underproduced with respect to the light-s. On the contrary, light-s elements are
underproduced by low-mass stars, while for M≥ 3.5 M⊙ they are as overabundant as the
heavy-s or even more abundant. As for the Pb, the La overabundance decreases as the mass
increases.
5) Rubidium. As already recalled, the overabundance of this element with respect to
the other light-s, such as Sr, depends on the neutron density developed in the convective
22Ne(α,n)25Mg neutron burst. The nuclei chart in the Rb region is shown in Figure 5. In the
radiative 13C(α,n)16O neutron-capture nucleosynthesis, the two major branchings at 85Kr
and 86Rb are practically closed, so that the s-process path proceeds through the sequence
84Kr-85Kr-85Rb-86Rb-86Sr and, then, to the neutron magic 88Sr. As a result, the [Rb/Sr]< 0.
The case of the 22Ne(α,n)25Mg neutron burst is substantially different. About 50% of the
neutron captures on 84Kr directly produce ground state 85Kr, whose β− decay half-life is
10.756 yr. The remaining 50% feeds the isomeric state of 85Kr (half-life 4.480 h), which
decays β− (78.6%) and γ (21.4%). As a result, about 60% of the neutrons captured by 84Kr
produce 85Krg. Since the temperature at the base of the convective zone generated by a
thermal pulse remains above 300 MK for no more than 1 yr (the precise value depends on
the mass), 85Krg practically behaves as a stable nucleus during the whole neutron-capture

– 31 –
nucleosynthesys episode. Nonetheless, it may capture a neutron producing the neutron
magic 86Kr. Then, a further neutron capture would finally lead to 87Rb. However, the
latter is hampered by the low MACS of 86Kr, namely 3.4 ± 0.3 mbarn12. Indeed, we find
that as a consequence of this s-process path, 86Kr is accumulated rather than 87Rb (see
also van Raai et al. 2012). Nevertheless, the 85Krg remained unburnt at the end of the TP
will decay into 85Rb, and, later on, it will be dredge up to the envelope. Note that the
efficiency of this Rb source depends on the rather uncertain neutron capture cross section
on 85Krg (see section 6). The 40% of the 84Kr(n, γ) reactions produces 85Krm that suddenly
decays β into 85Rb and, after a further neutron capture, leads to 86Rb. Due to the large
cross section (202± 163), the neutron capture on 86Rb competes with the β decay (half-life
18.63 d), so that a certain amount of the neutron magic 87Rb can be produced. Also in this
case, the precise evaluation of the efficiency of this Rb source relies on the rather uncertain
MACS of the 86Rb(n, γ) reaction. We have performed some tests to distinguish the various
contributions to the Rb synthesis. These tests confirm previous finding of van Raai et al.
(2012), namely the dominant contribution is from the 86Rb branching.
The heavy element yields (from Fe to Bi) of the 3, 4, 5 and 6 M⊙ models are compared
in Figure 6. Below the Ba peak the yields of the various models are very similar (within a
factor of 2), except for the 3 M⊙ that shows a smaller overproduction of all the elements
usually ascribed to the weak s-process component(Z < 36). Above the Ba peak, the
differences are definitely more pronounced. If the total La mass ejected by the 3 M⊙ is
about 5 time larger than that ejected by the 6 M⊙, the Pb ejected mass is about 30 time
larger. As already stated, the more massive AGB stars provide a little contribution to the
synthesis of the heaviest s elements.
12 The values of the cross sections here reported are the 30 KeV MACS from the KADONIS
database, (Dillman et al. 2010).
– 32 –
As far as we know, our stellar models are the only ones obtained by coupling the stellar
structure equations with a full network of chemical evolution equations. Indeed, s-process
calculations in AGB stars are usually obtained by means of post-process codes (Gallino et al.
1998; Goriely & Mowlavi 2000; Lugaro et al. 2012). Probably the main difference concerns
the inclusion of the 13C pocket that in post-process calculations is decoupled from the
evolution of the physical structure. Indeed, in the extant post-process calculations the same
13C pocket is assumed for the whole evolutionary sequence. As shown by Cristallo et al.
(2009), this is a rather crude approximation, because of the natural shrinking of the He-rich
intershell and, in turn, of the 13C pocket, due to the increase of the pressure gradient
caused by the increase of the core mass occurring during the AGB evolution. Comparisons
between our nucleosynthesis results for low-mass stars and those obtained by other authors
can be found in several papers. Cristallo et al. (2009) find a qualitative agreement with the
s-process calculations of Gallino et al. (1998). Note that the latter were based on old stellar
models (Straniero et al. 1997), obtained by using an essential nuclear network, Reimers
mass loss and neglecting the modifications of the radiative opacity caused by the TDU.
More recently, Lugaro et al. (2012) present new post-process calculations based on updated
stellar models with Z=0.0001. In spite on the many differences in both stellar models and
nucleosynthesis, their results for low-mass stars are in very good agreement with those
we have reported in Cristallo et al. (2009), for both light and heavy elements (see table
5 and 6 in Lugaro et al. (2012)). Concerning more massive AGB stars, the models here
presented have an initial composition quite different from that of the Lugaro et al. (2012)
models. In particular, the iron abundance (the s-process seed) is about 3 times larger in
our models. Recently, D’Orazi et al. (2013b) presented two more models of massive AGB
stars, 5 and 6 M⊙, obtained with the same stellar evolution code of Lugaro et al. (2012)
(see also Karakas 2010), with total metallicity Z=0.002 and [α/Fe]= 0.4. This composition
is more similar to that of a model of 6 M⊙ we have recently computed with our FUNS

– 33 –
code for a work in progress on galactic chemical evolution. The initial iron content is the
same as in D’Orazi et al., even if we assume [α/Fe]= 0, so that Z= 0.001. Note that
D’Orazi et al. present two models computed under different assumptions for the mass-loss
rate, namely Vassiliadis & Wood (1993) and Bloecker (1995), respectively. Like us, they
use radiative opacity tables that account for the effects of the TDU (see section 2.5). The
evolution of the surface abundances of representative s-process elements of our model are
shown in Figure 7. This plot can be directly compared with Figure 11 in the D’Orazi et
al. paper. In spite of the many differences of the two stellar models, the overall result
appear quite similar. In particular, both calculations show a significant enhancement of
Rb and, to a less extent, of other light-s elements (Sr, Y and Zr), while heavier elements
are marginally produced. Note that D’Orazi et al. neglect the s-process contribution due
to the radiative 13C(α,n)16O burning. The low Pb abundance we find confirms that this
is a good approximation for the more massive AGB stars. Nevertheless, they use the
22Ne(α,n)25Mg rate reported in the Angulo et al. (1999) compilation, while we use the more
recent Jaeger et al. (2001) that is about 50% smaller at the temperatures of the shell-He
burning (about 350 MK). Some minor discrepancies in the resulting surface composition
probably reflect such a difference. The TP-AGB lifetime we find is intermediate between
those obtained by D’Orazi et al. with the two different choices of the mass-loss rate.
Indeed, the mass-loss rate we use is intermediate between Vassiliadis & Wood (1993) and
Bloecker (1995) (see section 2.1). Consequently, our final heavy element abundances are
in between the two obtained by D’Orazi et al. Once the initial composition is properly
re-scaled (our model is for [O/Fe]=0), the final C+N+O of our models is also consistent
with the differences in the mass-loss rate. It implies a similar TDU efficiency. On the
contrary, the HBB is less efficient in our model. Indeed, at variance with D’Orazi et al.,
in our model, the C dredged up is only partially converted into N, while O, Na, Mg and
Al are very marginally affected by the HBB. This discrepancy may be partially attributed

– 34 –
to different input physics, such as the EOS, interpolation on radiative opacity tables,
super-adiabatic convection and the like. However, the use of different mixing schemes may
be the main origin of this difference. In particular, at variance with D’Orazi et al., who
assume instantaneous mixing, we make use of a time-dependent mixing scheme (see section
2.3).
5. Multiple populations and heavy elements in Globular Clusters
A growing amount of observational evidences, among which multiple sequences in color-
magnitude diagrams, extremely blue horizontal branches, cyanogen variations and their
anticorrelation with CH, O-Na and Mg-Al anticorrelations, support multiple population
(MP) scenarios for the formation of GCs (Cottrell & Da Costa 1981; D’Antona et al. 2005;
Gratton et al. 2012a, and references therein). Alternative models, such as the accretion
on main-sequence low-mass stars of material lost by more massive objects, have been also
proposed (Dantona et al. 1983; D’Antona et al. 2002). Our aim is to verify if these models
can also account for the observed s-process pollution and under which conditions this
chemical anomaly arises. In the rest of the paper we discuss the case of MP models, even if
the yields presented in the previous section may be also used to test accretion models.
MPs may be the result of i) multiple star formation episodes within the same
cluster or ii) merging of smaller stellar systems containing a single stellar population.
In principle, a combination of the two types is also possible. In any case, the pollution
responsible for the observed chemical variations may be due to external stellar populations
(primordial-pollution) or caused by the same stars of the cluster (self-pollution). In the
following, we will assume that the polluters are normal halo stars, i.e., they form from s-poor
– 35 –
gas with low [Fe/H], [α/Fe]> 0 and [r/Fe]> 013. Moreover, we will not distinguish between
primordial-pollution or self-pollution scenarios. Hereinafter the term first generation refers
to the polluters. As these stars evolve, they lose material containing the imprint of the
internal nucleosynthesis. Possibly, this gas is mixed with some amount of residual pristine
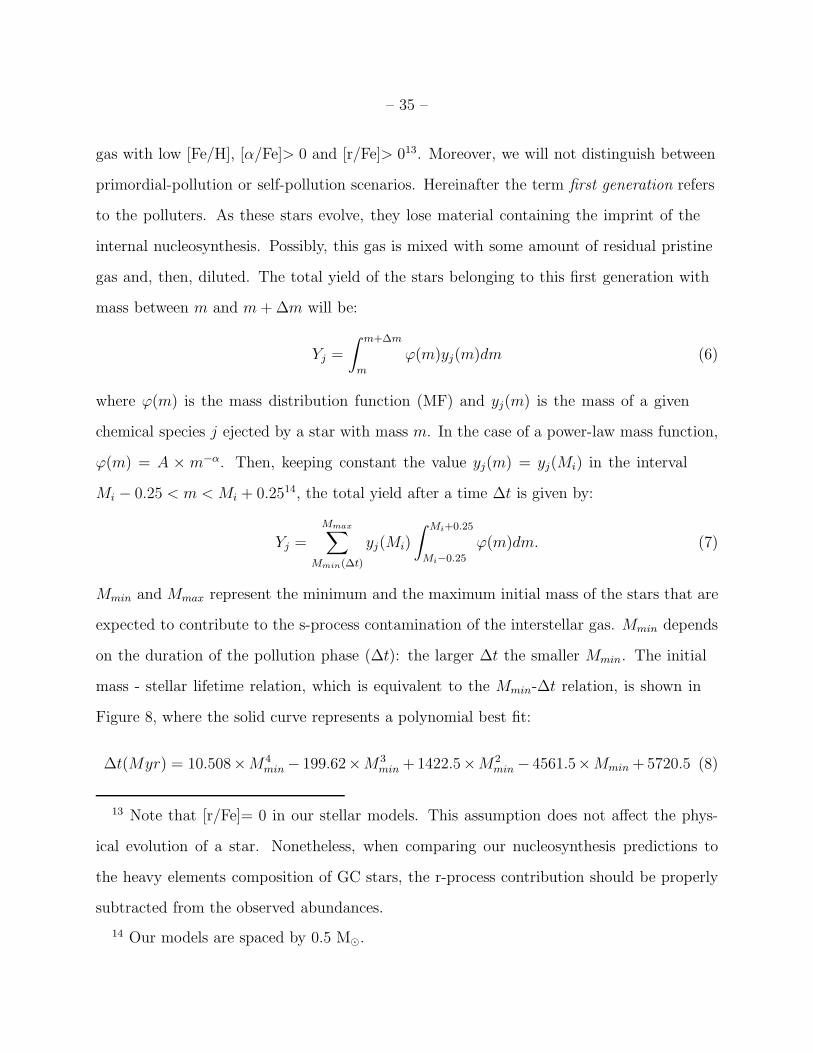
gas and, then, diluted. The total yield of the stars belonging to this first generation with
mass between m and m+∆m will be:
Yj =
∫ m+∆m
m
ϕ(m)yj(m)dm (6)
where ϕ(m) is the mass distribution function (MF) and yj(m) is the mass of a given
chemical species j ejected by a star with mass m. In the case of a power-law mass function,
ϕ(m) = A × m−α. Then, keeping constant the value yj(m) = yj(Mi) in the interval
Mi − 0.25 < m < Mi + 0.2514, the total yield after a time ∆t is given by:
Yj =
Mmax∑
Mmin(∆t)
yj(Mi)
∫ Mi+0.25
Mi−0.25
ϕ(m)dm. (7)
Mmin and Mmax represent the minimum and the maximum initial mass of the stars that are
expected to contribute to the s-process contamination of the interstellar gas. Mmin depends
on the duration of the pollution phase (∆t): the larger ∆t the smaller Mmin. The initial
mass - stellar lifetime relation, which is equivalent to the Mmin-∆t relation, is shown in
Figure 8, where the solid curve represents a polynomial best fit:
∆t(Myr) = 10.508×M4min − 199.62×M3
min +1422.5×M2min − 4561.5×Mmin +5720.5 (8)
13 Note that [r/Fe]= 0 in our stellar models. This assumption does not affect the phys-
ical evolution of a star. Nonetheless, when comparing our nucleosynthesis predictions to
the heavy elements composition of GC stars, the r-process contribution should be properly
subtracted from the observed abundances.
14 Our models are spaced by 0.5 M⊙.

– 36 –
In the following, we will assume Mmax = 6 M⊙, i.e., more massive stars do not contribute to
the synthesis of s-process elements. As recalled in the Introduction, fast-rotating massive
stars might contribute to the weak component, but here we will limit our analysis to the
main and the strong components. Morover, this assumption also implies that we neglect
possible contributions to the s process from super-AGB stars (see section 3.2). Then, if
the total mass returned to the interstellar medium (magb) is mixed to a certain amount of
residual pristine gas (mp), the resulting mass fraction (Xj) is:
Xj = Xagbj
magb
mtot
+Xpj
mP
mtot
= Xagbj d+Xp
j (1− d) (9)
where Xagbj and Xp
j are the mass fractions in the AGB ejecta15 and in the pristine gas,
respectively, mtot = magb +mp is the resulting total mass and d = magb/mtot is the dilution
factor. Therefore, the overabundance with respect to iron will be:
[Xj
Fe
]
= log(Xagb
j
Fed+
Xpj
Fe(1− d)
)
− log(Xj
Fe
)
⊙. (10)
Since we assume that the prestine gas is s-process free, Xpj is zero, so that:
[Xj
Fe
]
= log(Xagb
j
Fed)
− log(Xj
Fe
)
⊙. (11)
.
Summarizing, the unknown quantities in this simple model are: ∆t, the MF of the
first stellar generation and the dilution factor (d). Note that all the constants, such as the
total mass of the primordial stellar generation, are canceled when relative abundances are
considered.
The resulting undiluted (d = 1) compositions for different ∆t are compared in Figure
9. Here, we have assumed a power-law MF with α = 2.35, namely a classical Salpeter mass
15Xagbj = Yj/magb, where Yj is the yield of equation 7.

– 37 –
function. As noted by Kroupa (2001), this MF is a reasonable choice for M≥ 3 M⊙. The
various curves are shifted in order to have the same [La/Fe] of the ∆t = 493 Myr case. As
expected, light-s elements (Z < 40) increase by decreasing ∆t. In fact, a short timescale
implies more massive polluters that are dominated by the neutron-capture nucleosynthesis
powered by the convective 22Ne(α,n)25Mg reaction. On the contrary, the abundances of
Pb and Bi, mainly produced by the radiative 13C(α,n)16O nucleosynthesis, decrease as ∆t
decreases. In this way, the relative abundances between Pb, heavy-s and light-s elements
are potential indicators of the duration of the pollution phase.
Finally, the effects of a variation of the MF are illustrated in Figure 10. All the models
shown in this Figure have ∆t = 205 Myr, but different exponent of the power-law MF,
namely: −5 ≤ α ≤ 5. Note that positive α values correspond to the most common case of a
MF that decreases as the stellar mass increases. On the contrary, negative α values imply
a MF that increases as the mass increases; in that case a maximum of the MF could be
located above Mmax. A similar MF has been obtained by Yoshii & Saio (1986) (see also
Nakamura & Umemura 2002) in case of extremely metal poor environments. We are aware
that this peculiar MF is in contrast with many observational evidences as well as theoretical
estimations of the GC mass function. The models here reported should be considered as a
test to check the sensitivity of our results on the adopted MF. The various curves have been
shifted to match the [La/Fe] value of the α = 2.35 case. Note that small α values favor the
production of light-s elements, while the Pb abundance is suppressed. In synthesis, if α ≥ 0
the differences implied by a change of the MF are rather small. The (extreme) case α = −5
mimics a moderate reduction of the ∆t.

– 38 –
6. Discussion
In the previous sections we have derived the chemical contamination of pristine gas
caused by a first generation of intermediate mass polluters. In particular we have shown
how the composition of the gas returned to the interstellar medium is expected to change
as a function of the duration of the pollution phase that precedes the formation of the stars
presently showing an altered heavy-element composition.
In order to test such a theoretical prediction, we have compared the predicted chemical
pattern to the observed s-process composition of M22 and M4 stars. For these two clusters,
extended samples of heavy element abundances are available. All the stars of M4 so far
analyzed present similar overabundances of the s-elements (Yong et al. 2008), while only
a subset of M22 members are s rich (Roederer et al. 2011). This difference is likely the
result of a different formation history. Nevertheless, as illustrated in the previous section,
our model may be applied to both primordial and self-pollution scenarios. Note that the
stellar models here used have been computed for [Fe/H]=-1.7. This is quite similar to
the value estimated for the first stellar generation of M22, i.e., [Fe/H]= −1.82 ± 0.02
(Marino et al. 2012), but smaller than [Fe/H]∼ −1.2 attributed to M4 (Yong et al. 2008).
The original iron abundance mainly affects the contribution to the s process due to the
radiative 13C(α,n)16O burning. In particular, a reduction of the Pb production is expected
by increasing [Fe/H].
The pure s-process pollution in M22 may be obtained by subtracting the average heavy
elements composition of the stars belonging to the bluer sequence, those showing r-process
enrichment only, to that of the stars belonging to the redder sequence, those showing both
r and s enhancements (see Roederer et al. 2011). First of all, ∆t has been estimated by
means of 5 spectroscopic indexes, namely: [Pb/Y], [Pb/La], [Pb/Ba], [La/Y] and [Ba/Y].
Note that since La and Y are the elements with the smaller spectroscopic errors the [La/Y]
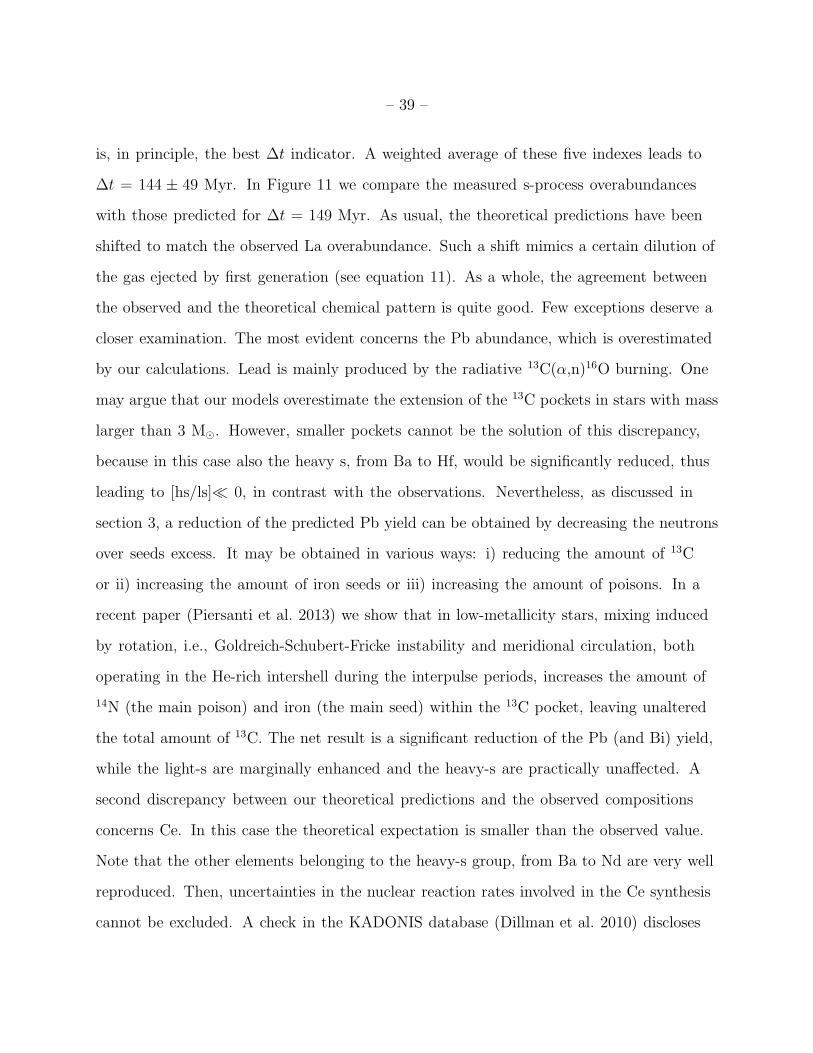
– 39 –
is, in principle, the best ∆t indicator. A weighted average of these five indexes leads to
∆t = 144 ± 49 Myr. In Figure 11 we compare the measured s-process overabundances
with those predicted for ∆t = 149 Myr. As usual, the theoretical predictions have been
shifted to match the observed La overabundance. Such a shift mimics a certain dilution of
the gas ejected by first generation (see equation 11). As a whole, the agreement between
the observed and the theoretical chemical pattern is quite good. Few exceptions deserve a
closer examination. The most evident concerns the Pb abundance, which is overestimated
by our calculations. Lead is mainly produced by the radiative 13C(α,n)16O burning. One
may argue that our models overestimate the extension of the 13C pockets in stars with mass
larger than 3 M⊙. However, smaller pockets cannot be the solution of this discrepancy,
because in this case also the heavy s, from Ba to Hf, would be significantly reduced, thus
leading to [hs/ls]≪ 0, in contrast with the observations. Nevertheless, as discussed in
section 3, a reduction of the predicted Pb yield can be obtained by decreasing the neutrons
over seeds excess. It may be obtained in various ways: i) reducing the amount of 13C
or ii) increasing the amount of iron seeds or iii) increasing the amount of poisons. In a
recent paper (Piersanti et al. 2013) we show that in low-metallicity stars, mixing induced
by rotation, i.e., Goldreich-Schubert-Fricke instability and meridional circulation, both
operating in the He-rich intershell during the interpulse periods, increases the amount of
14N (the main poison) and iron (the main seed) within the 13C pocket, leaving unaltered
the total amount of 13C. The net result is a significant reduction of the Pb (and Bi) yield,
while the light-s are marginally enhanced and the heavy-s are practically unaffected. A
second discrepancy between our theoretical predictions and the observed compositions
concerns Ce. In this case the theoretical expectation is smaller than the observed value.
Note that the other elements belonging to the heavy-s group, from Ba to Nd are very well
reproduced. Then, uncertainties in the nuclear reaction rates involved in the Ce synthesis
cannot be excluded. A check in the KADONIS database (Dillman et al. 2010) discloses
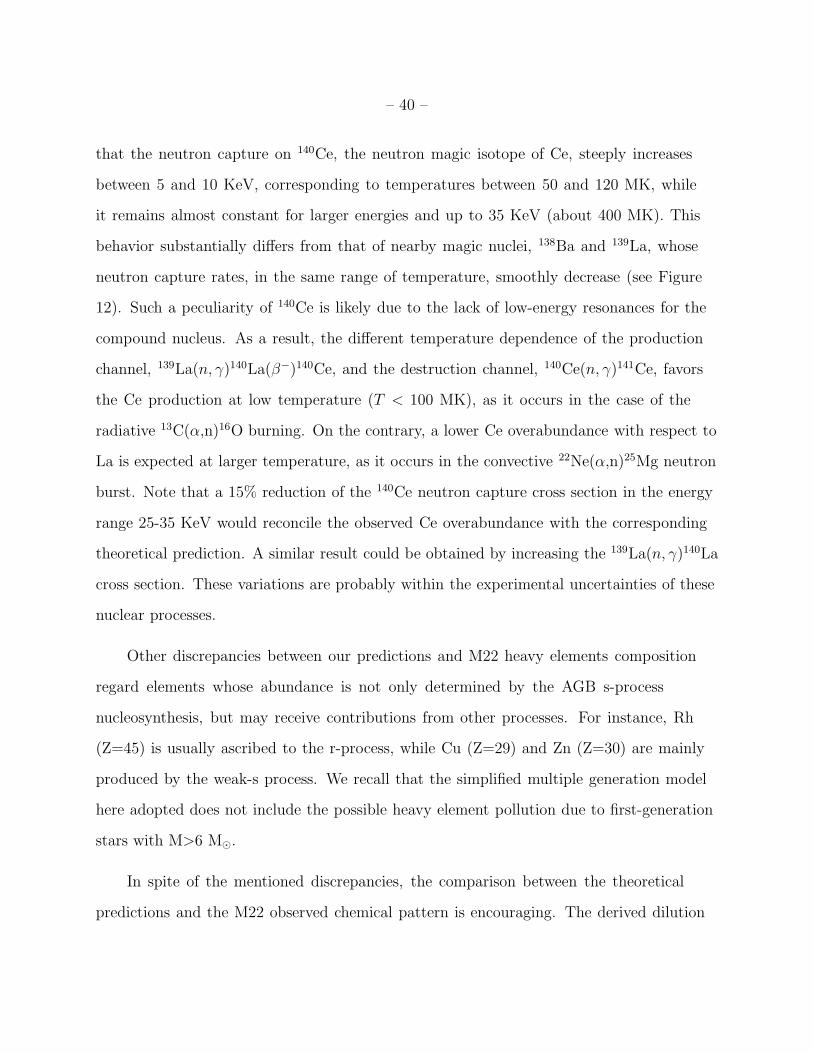
– 40 –
that the neutron capture on 140Ce, the neutron magic isotope of Ce, steeply increases
between 5 and 10 KeV, corresponding to temperatures between 50 and 120 MK, while
it remains almost constant for larger energies and up to 35 KeV (about 400 MK). This
behavior substantially differs from that of nearby magic nuclei, 138Ba and 139La, whose
neutron capture rates, in the same range of temperature, smoothly decrease (see Figure
12). Such a peculiarity of 140Ce is likely due to the lack of low-energy resonances for the
compound nucleus. As a result, the different temperature dependence of the production
channel, 139La(n, γ)140La(β−)140Ce, and the destruction channel, 140Ce(n, γ)141Ce, favors
the Ce production at low temperature (T < 100 MK), as it occurs in the case of the
radiative 13C(α,n)16O burning. On the contrary, a lower Ce overabundance with respect to
La is expected at larger temperature, as it occurs in the convective 22Ne(α,n)25Mg neutron
burst. Note that a 15% reduction of the 140Ce neutron capture cross section in the energy
range 25-35 KeV would reconcile the observed Ce overabundance with the corresponding
theoretical prediction. A similar result could be obtained by increasing the 139La(n, γ)140La
cross section. These variations are probably within the experimental uncertainties of these
nuclear processes.
Other discrepancies between our predictions and M22 heavy elements composition
regard elements whose abundance is not only determined by the AGB s-process
nucleosynthesis, but may receive contributions from other processes. For instance, Rh
(Z=45) is usually ascribed to the r-process, while Cu (Z=29) and Zn (Z=30) are mainly
produced by the weak-s process. We recall that the simplified multiple generation model
here adopted does not include the possible heavy element pollution due to first-generation
stars with M>6 M⊙.
In spite of the mentioned discrepancies, the comparison between the theoretical
predictions and the M22 observed chemical pattern is encouraging. The derived dilution
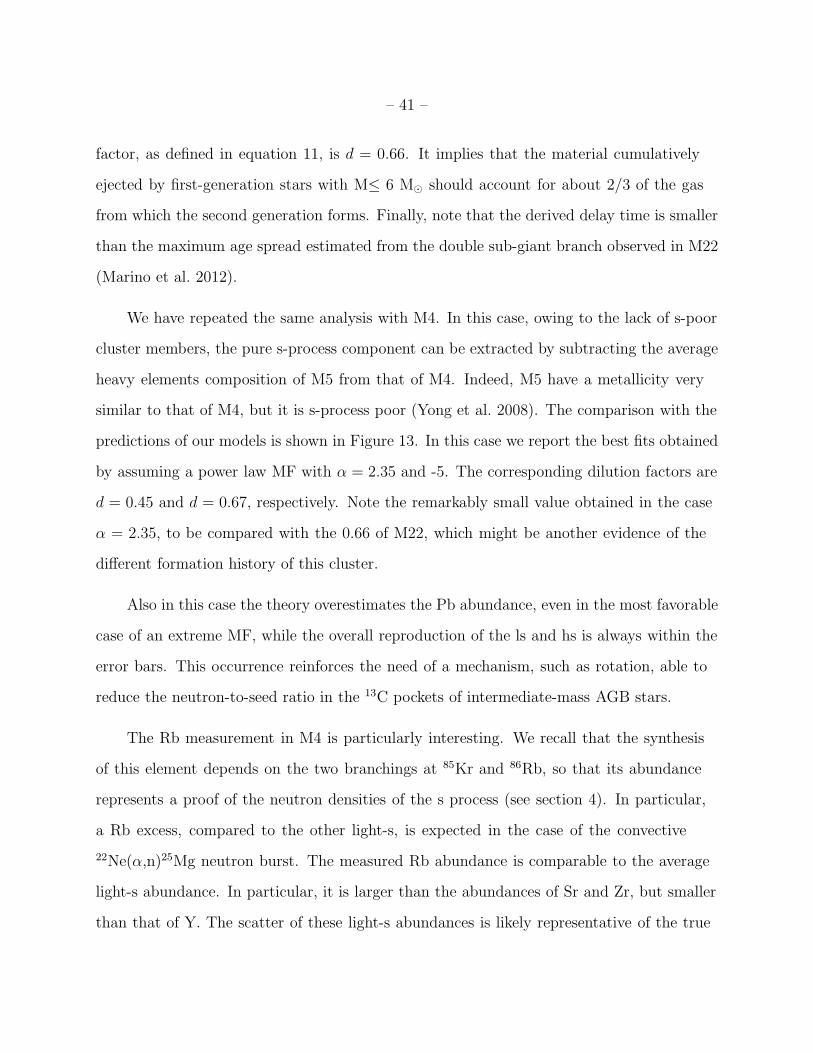
– 41 –
factor, as defined in equation 11, is d = 0.66. It implies that the material cumulatively
ejected by first-generation stars with M≤ 6 M⊙ should account for about 2/3 of the gas
from which the second generation forms. Finally, note that the derived delay time is smaller
than the maximum age spread estimated from the double sub-giant branch observed in M22
(Marino et al. 2012).
We have repeated the same analysis with M4. In this case, owing to the lack of s-poor
cluster members, the pure s-process component can be extracted by subtracting the average
heavy elements composition of M5 from that of M4. Indeed, M5 have a metallicity very
similar to that of M4, but it is s-process poor (Yong et al. 2008). The comparison with the
predictions of our models is shown in Figure 13. In this case we report the best fits obtained
by assuming a power law MF with α = 2.35 and -5. The corresponding dilution factors are
d = 0.45 and d = 0.67, respectively. Note the remarkably small value obtained in the case
α = 2.35, to be compared with the 0.66 of M22, which might be another evidence of the
different formation history of this cluster.
Also in this case the theory overestimates the Pb abundance, even in the most favorable
case of an extreme MF, while the overall reproduction of the ls and hs is always within the
error bars. This occurrence reinforces the need of a mechanism, such as rotation, able to
reduce the neutron-to-seed ratio in the 13C pockets of intermediate-mass AGB stars.
The Rb measurement in M4 is particularly interesting. We recall that the synthesis
of this element depends on the two branchings at 85Kr and 86Rb, so that its abundance
represents a proof of the neutron densities of the s process (see section 4). In particular,
a Rb excess, compared to the other light-s, is expected in the case of the convective
22Ne(α,n)25Mg neutron burst. The measured Rb abundance is comparable to the average
light-s abundance. In particular, it is larger than the abundances of Sr and Zr, but smaller
than that of Y. The scatter of these light-s abundances is likely representative of the true
– 42 –
observational error. As shown in the upper panel of Figure 2 (see also Table 2), [Rb/ls]
≤ −0.4 is expected in the case of a negligible activation of the 22Ne(α,n)25Mg reaction
(further details in Cristallo et al. 2011). Therefore, even if the predicted value is larger
than the observed one, the Rb measurements in M4 clearly indicate the operation of the
convective 22Ne(α,n)25Mg neutron-capture nnucleosynthesis in the s-process polluters.
Nevertheless, the models overestimate the observed Rb abundance. Note that the theoretical
prediction relies on rather uncertain nuclear physics inputs affecting the 85Kr and 86Rb
branchings (see section 4). In particular, only theoretical evaluations are available for the
86Rb neutron-capture cross section. From the KADONIS database we derive that the
MACS at 30 KeV is 202± 163 mbarn. A reduction of this cross section to the quoted lower
limit would reduce the major Rb production channel in intermediate mass AGB stars. On
the other hand, for the 85Krg neutron capture cross section, we have used the KADONIS
prescriptions, also based on theoretical calculations, namely 55 ± 45 mbarn (at 30 KeV).
Recently Raut et al. (2013) presented the first experimental evaluation of this cross section.
They obtain a 30 KeV MACS of 83+23−38, which is higher than that provided by KADONIS,
although compatible within the quoted errors. Note that the higher the 85Krg neutron
capture cross section the smaller is the amount of 85Krg survived at the end of the TP and,
in turn, the smaller is the amount of 85Rb accumulated after its slow β decay and, later on,
dredged up. Note that an increase of this cross section has minor effects on the overall 87Rb
production, because of the very low neutron-capture cross section on 86Kr (see section 4).
Therefore, further experimental investigations, as well as other spectroscopic confirmations
of Rb abundance in s-rich GC stars are required to solve this problem.
Although the analysis of light elements cannot be limited to the restricted range
of stellar masses here considered, some further considerations may be derived from the
present study. Among the light elements fluorine deserves a major attention. Until now,
F enhancements have been found in AGB stars only or in stars polluted by an AGB

– 43 –
companion, e.g., CEMPs stars (Jorissen et al. 1992; Schuler et al. 2007; Abia et al. 2010,
2011; Lucatello et al. 2011). As shown in section 4, an anticorrelation between the F
production and the stellar mass is expected, so that the larger the ∆t the higher the
fluorine pollution. Recently, D’Orazi et al. (2013c) derived F abundance for a small sample
of stars in M22, namely 3 r-only stars plus 3 r+s stars. Although no significant variations
of the [F/Fe] is found, the small difference in the average Fe abundance of the two groups
of stars may suggest a moderate F enhancement in the r+s stars with respect to the r-only.
However, de Laverny & Recio-Blanco (2013) argue that these measurements are affected
by an incorrect identification of continuum fluctuations as HF signature and a wrong
correction of the stellar radial velocity. Owing to these uncertainties, further investigations
are required before considering fluorine measurements in the more general context of GC
MP scenarios.
A further comment concerns the sodium pollution by stars with M≤6 M⊙. As we
have reported in section 3, these stars release a not negligible Na yield. Such a Na is not
produced by the HBB, because in these models the convective envelope never attains the
layer where the Ne-Na cycle is active. Instead, the Na enhancements are a consequence of
the second and, to a less extent, of the third dredge up. If the duration of the pollution
phase is sufficiently large, this contribution should be considered in addition to the Na
pollution possibly caused by more massive AGB, super-AGB and/or massive stars. This
occurrence would imply a deviation from a straight O-Na anticorrelation, leading to a
certain spread of Na in stars with similar O. Similarly, since Mg and Al isotopes participate
to the neutron-capture nucleosynthesis, also the Mg-Al anticorrelation may be affected
by the pollution of intermediate mass AGB stars. In particular, 25Mg is produced by the
22Ne(α,n)25Mg reaction in the He-rich intershell and both Mg and Al isotopes are produced
by neutron capture chains starting from 22Ne and 23Na.

– 44 –
7. Conclusions
In this paper we presented new models of low-metallicity AGB stars with mass in the
range 2-6 M⊙. The heavy elements yields of these models allow us to reproduce most of
the observed features of the s-process main and strong components, as shown by stars of
some GC stellar populations. The comparison between the theoretical predictions and the
observed overabundance of s elements has been done by adopting a simple MP model for
the early GC history. This model implies two main temporal steps, namely:
1) a first stellar generation forms from pristine gas whose heavy element composition
is that typical of the bulk of the galactic halo, i.e., r rich, but s poor.
2) after about 150± 50 Myr, a second stellar generation forms within a newborn GC
from the gas ejected by the stars of the first generation, possibly diluted with some amount
of pristine gas.
The first generation may or may not be a member of the cluster where the second
generation is observed. In other words, the pollution may be either primordial or internal
to the cluster (self pollution).
According to this picture, if the star formation definitely halts in less than ∼ 50 Myr,
namely before that intermediate-mass stars (M≤ 6 M⊙) have time to evolve up to the AGB
phase and pollute the interstellar gas, the GC will be s-process poor. This occurrence
explains why s-process enhancements are so rare in GCs. It also implies that the more
massive stars, whose lifetime is shorter than 50 Myr, do not substantially contribute to
the main and strong components of the s process. On the contrary, these stars should be
responsible, fully or partially, for the more common variations of C, N, O, Na, Mg, Al and
other light elements. For this reason, a more powerful and complete pollution model may
be obtained by coupling the yields here presented to those of more massive stars. On the

– 45 –
other hand, physical phenomena not yet included in the present stellar models, such as
rotation, may also improve the theoretical tool.
We are grateful to F. Kappeler and I. Dillman, for they help in interpreting the
KADONIS reaction rates, and to D. Yong for providing us the M4 and M5 data in a
computer readable form. The present work has been support by the PRIN-INAF 2010 and
FIRB-MIUR 2008 (RBFR08549F-002) programs. Extended Tables of the models presented
in this paper are available in the FRUITY database (fruity.oa-teramo.inaf.it).
– 46 –
REFERENCES
Abia, C., Busso, M., Gallino, R., et al. 2001, ApJ, 559, 1117
Abia, C., Cunha, K., Cristallo, S., et al. 2011, ApJ, 737, L8
Abia, C., Recio-Blanco, A., de Laverny, P., et al. 2009, ApJ, 694, 971
Abia, C., Cunha, K., Cristallo, S., et al. 2010, ApJ, 715, L94
Angulo, C., Arnould, M., Rayet, M., et al. 1999, Nuclear Physics A, 656, 3
Aoki, W., Ryan, S. G., Iwamoto, N., et al. 2003, ApJ, 592, L67
Barzyk, J. G., Savina, M. R., Davis, A. M., et al. 2007, Meteoritics and Planetary Science,
42, 1103
Becker, S. A., & Iben, Jr., I. 1979, ApJ, 232, 831
Bertelli, G., Bressan, A. G., & Chiosi, C. 1985, A&A, 150, 33
Best, A., Gorres, J., Couder, M., et al. 2011, Phys. Rev. C, 83, 052802
Best, A., Beard, M., Gorres, J., et al. 2013, Phys. Rev. C, 87, 045805
Bisterzo, S., Gallino, R., Straniero, O., Cristallo, S., & Kappeler, F. 2012, MNRAS, 422,
849
Bloecker, T. 1995, A&A, 297, 727
Bohm-Vitense, E. 1958, ZAp, 46, 108
Boothroyd, A. I., & Sackmann, I.-J. 1988, ApJ, 328, 653
Burbidge, E. M., Burbidge, G. R., Fowler, W. A., & Hoyle, F. 1957, Reviews of Modern
Physics, 29, 547

– 47 –
Busso, M., Gallino, R., & Wasserburg, G. J. 1999, ARA&A, 37, 239
Cameron, A. G. W. 1957, PASP, 69, 201
Canuto, V. M. 1998, ApJ, 508, L103
Canuto, V. M. 1999, in Astronomical Society of the Pacific Conference Series, Vol. 173,
Stellar Structure: Theory and Test of Connective Energy Transport, ed. A. Gimenez,
E. F. Guinan, & B. Montesinos, 133
Canuto, V. M., & Mazzitelli, I. 1991, ApJ, 370, 295
Castellani, V., Chieffi, A., & Straniero, O. 1990, ApJS, 74, 463
Castellani, V., Chieffi, A., Tornambe, A., & Pulone, L. 1985, ApJ, 296, 204
Castellani, V., Marconi, M., & Straniero, O. 1998, A&A, 340, 160
Caughlan, G. R., & Fowler, W. A. 1988, Atomic Data and Nuclear Data Tables, 40, 283
Chieffi, A., Domınguez, I., Limongi, M., & Straniero, O. 2001, ApJ, 554, 1159
Chieffi, A., Limongi, M., & Straniero, O. 1998, ApJ, 502, 737
Chieffi, A., & Straniero, O. 1989, ApJS, 71, 47
Chieffi, A., Straniero, O., & Salaris, M. 1995, ApJ, 445, L39
Clayton, D. D., & Rassbach, M. E. 1967, ApJ, 148, 69
Cottrell, P. L., & Da Costa, G. S. 1981, ApJ, 245, L79
Cox, J. P., & Giuli, R. T. 1968, Principles of Stellar Structure (Gordon and Breach)
Cristallo, S., Straniero, O., Gallino, R., et al. 2009, ApJ, 696, 797
– 48 –
Cristallo, S., Straniero, O., Lederer, M. T., & Aringer, B. 2007, ApJ, 667, 489
Cristallo, S., Piersanti, L., Straniero, O., et al. 2011, ApJS, 197, 17
D’Antona, F., Bellazzini, M., Caloi, V., et al. 2005, ApJ, 631, 868
D’Antona, F., Caloi, V., Montalban, J., Ventura, P., & Gratton, R. 2002, A&A, 395, 69
Dantona, F., Gratton, R., & Chieffi, A. 1983, Mem. Soc. Astron. Italiana, 54, 173
de Laverny, P., & Recio-Blanco, A. 2013, A&A, 560, A74
Descouvemont, P. 1993, Phys. Rev. C, 48, 2746
Dillman, I., Plag, R., Kappeler, F., et al. 2010, in EFNUDAT Fast Neutrons, ed. F.-J.
Hambsch, 190
Doherty, C. L., Gil-Pons, P., Lau, H. H. B., Lattanzio, J. C., & Siess, L. 2014, MNRAS,
437, 195
D’Orazi, V., Campbell, S. W., Lugaro, M., et al. 2013a, MNRAS, 433, 366
D’Orazi, V., Gratton, R. G., Pancino, E., et al. 2011, A&A, 534, A29
D’Orazi, V., Lugaro, M., Campbell, S. W., et al. 2013b, ApJ, 776, 59
D’Orazi, V., Lucatello, S., Lugaro, M., et al. 2013c, ApJ, 763, 22
Ferraro, F. R., Valenti, E., Straniero, O., & Origlia, L. 2006, ApJ, 642, 225
Freytag, B., Ludwig, H.-G., & Steffen, M. 1996, A&A, 313, 497
Freytag, B., & Salaris, M. 1999, ApJ, 513, L49
Frischknecht, U., Hirschi, R., & Thielemann, F.-K. 2012, A&A, 538, L2

– 49 –
Frost, C. A., & Lattanzio, J. C. 1996, ApJ, 473, 383
Gallino, R., Arlandini, C., Busso, M., et al. 1998, ApJ, 497, 388
Goriely, S., & Mowlavi, N. 2000, A&A, 362, 599
Goriely, S., & Siess, L. 2004, A&A, 421, L25
Gratton, R. G., Carretta, E., & Bragaglia, A. 2012a, A&A Rev., 20, 50
Gratton, R. G., Lucatello, S., Carretta, E., et al. 2012b, A&A, 547, C2
Groenewegen, M. A. T., Sloan, G. C., Soszynski, I., & Petersen, E. A. 2009, A&A, 506,
1277
Herwig, F. 2000, A&A, 360, 952
Herwig, F., Bloecker, T., Schoenberner, D., & El Eid, M. 1997, A&A, 324, L81
Iben, Jr., I., & Renzini, A. 1983, ARA&A, 21, 271
Iglesias, C. A., & Rogers, F. J. 1996, ApJ, 464, 943
Ivans, I. I., Kraft, R. P., Sneden, C., et al. 2001, AJ, 122, 1438
Jaeger, M., Kunz, R., Mayer, A., et al. 2001, Physical Review Letters, 87, 202501
Johnson, C. I., & Pilachowski, C. A. 2010, ApJ, 722, 1373
Johnson, J. A., Herwig, F., Beers, T. C., & Christlieb, N. 2007, ApJ, 658, 1203
Jorissen, A., Smith, V. V., & Lambert, D. L. 1992, A&A, 261, 164
Kaeppeler, F., Wiescher, M., Giesen, U., et al. 1994, ApJ, 437, 396
Kappeler, F., Beer, H., & Wisshak, K. 1989, Reports on Progress in Physics, 52, 945

– 50 –
Karakas, A. I. 2010, MNRAS, 403, 1413
Kroupa, P. 2001, MNRAS, 322, 231
Lambert, D. L., Smith, V. V., Busso, M., Gallino, R., & Straniero, O. 1995, ApJ, 450, 302
Lardo, C., Pancino, E., Mucciarelli, A., et al. 2013, MNRAS, 433, 1941
Lodders, K. 2003, ApJ, 591, 1220
Lucatello, S., Masseron, T., Johnson, J. A., Pignatari, M., & Herwig, F. 2011, ApJ, 729, 40
Lugaro, M., Karakas, A. I., Stancliffe, R. J., & Rijs, C. 2012, ApJ, 747, 2
Lugaro, M., Tagliente, G., Karakas, A. I., et al. 2014, ApJ, 780, 95
Lugaro, M., Ugalde, C., Karakas, A. I., et al. 2004, ApJ, 615, 934
Maeder, A., & Meynet, G. 1987, A&A, 182, 243
Marigo, P. 2002, A&A, 387, 507
Marigo, P., & Aringer, B. 2009, A&A, 508, 1539
Marino, A. F., Milone, A. P., Sneden, C., et al. 2012, A&A, 541, A15
Mazzitelli, I., D’Antona, F., & Caloi, V. 1995, A&A, 302, 382
Mowlavi, N. 1999, A&A, 344, 617
Nakamura, F., & Umemura, M. 2002, ApJ, 569, 549
Piersanti, L., Cristallo, S., & Straniero, O. 2013, ApJ, 774, 98
Piersanti, L., Straniero, O., & Cristallo, S. 2007, A&A, 462, 1051
Pignatari, M., & Gallino, R. 2007, Mem. Soc. Astron. Italiana, 78, 543

– 51 –
Pignatari, M., Gallino, R., Baldovin, C., et al. 2006, in International Symposium on Nuclear
Astrophysics - Nuclei in the Cosmos
Pignatari, M., Gallino, R., Meynet, G., et al. 2008, ApJ, 687, L95
Prada Moroni, P. G., & Straniero, O. 2002, ApJ, 581, 585
Raiteri, C. M., Busso, M., Picchio, G., & Gallino, R. 1991a, ApJ, 371, 665
Raiteri, C. M., Busso, M., Picchio, G., Gallino, R., & Pulone, L. 1991b, ApJ, 367, 228
Raut, R., Tonchev, A. P., Rusev, G., et al. 2013, Physical Review Letters, 111, 112501
Roederer, I. U., Marino, A. F., & Sneden, C. 2011, ApJ, 742, 37
Rogers, F. J., Swenson, F. J., & Iglesias, C. A. 1996, ApJ, 456, 902
Schoier, F. L., & Olofsson, H. 2001, A&A, 368, 969
Schuler, S. C., Cunha, K., Smith, V. V., et al. 2007, ApJ, 667, L81
Seeger, P. A., Fowler, W. A., & Clayton, D. D. 1965, ApJS, 11, 121
Smith, V. V., Suntzeff, N. B., Cunha, K., et al. 2000, AJ, 119, 1239
Sneden, C., Cowan, J. J., & Gallino, R. 2008, ARA&A, 46, 241
Sparks, W. M., & Endal, A. S. 1980, ApJ, 237, 130
Straniero, O. 1988, A&AS, 76, 157
Straniero, O., Chieffi, A., Limongi, M., et al. 1997, ApJ, 478, 332
Straniero, O., Gallino, R., Busso, M., et al. 1995, ApJ, 440, L85
Straniero, O., Gallino, R., & Cristallo, S. 2006, Nuclear Physics A, 777, 311
– 52 –
Straniero, O., Limongi, M., Chieffi, A., et al. 2000, Mem. Soc. Astron. Italiana, 71, 719
Travaglio, C., Gallino, R., Busso, M., & Gratton, R. 2001, ApJ, 549, 346
van Loon, J. T., Cioni, M.-R. L., Zijlstra, A. A., & Loup, C. 2005, A&A, 438, 273
van Raai, M. A., Lugaro, M., Karakas, A. I., Garcıa-Hernandez, D. A., & Yong, D. 2012,
A&A, 540, A44
Vassiliadis, E., & Wood, P. R. 1993, ApJ, 413, 641
Ventura, P., & D’Antona, F. 2005, A&A, 431, 279
—. 2006, A&A, 457, 995
Whitelock, P., Menzies, J., Feast, M., et al. 1994, MNRAS, 267, 711
Whitelock, P. A., Feast, M. W., van Loon, J. T., & Zijlstra, A. A. 2003, MNRAS, 342, 86
Winters, J. M., Le Bertre, T., Jeong, K. S., Nyman, L.-A., & Epchtein, N. 2003, A&A, 409,
715
Yong, D., Karakas, A. I., Lambert, D. L., Chieffi, A., & Limongi, M. 2008, ApJ, 689, 1031
Yoshii, Y., & Saio, H. 1986, ApJ, 301, 587
Young, P. A., Knierman, K. A., Rigby, J. R., & Arnett, D. 2003, ApJ, 595, 1114
This manuscript was prepared with the AAS LATEX macros v5.2.

– 53 –
Table 1. Physical properties of the computed stellar models: initial mass (M⊙), total
lifetime (Myr), n. of TPs followed by a TDU, total dredge-up mass (10−2 M⊙), final core
mass (M⊙), total ejected mass (M⊙), maximum peak temperature attained at the bottom
of the convective shells generated by thermal pulses (MK), maximum temperature attained
at the bottom of the convective envelope during the AGB (MK), neutron density
corresponding to the maximum peak temperature attained at the bottom of the convective
shells generated by thermal pulses (1013 neutrons/cm3).
Mass lifetime n. TPs MTDU MfH ejected mass TMAX
csh TMAXce nn
2.0 861 10 7.5 0.670 1.330 320 4 < 0.1
2.5 493 13 6.7 0.725 1.775 342 6 0.1
3.0 302 15 3.9 0.814 2.186 347 11 0.5
3.5 205 19 3.9 0.850 2.650 365 19 0.8
4.0 149 23 3.9 0.875 3.125 366 22 0.9
4.5 113 29 3.9 0.909 3.591 367 30 1.1
5.0 90 35 3.5 0.947 4.053 371 43 1.8
5.5 73 48 3.0 0.996 4.504 373 73 1.5
6.0 61 72 2.0 1.052 4.949 371 91 0.8

–54
–
Table 2. Average composition of the ejected material.
Mass[
C+N+OFe
] [
FFe
] [
NaFe
] [
RbFe
] [
YFe
] [
LaFe
] [
PbFe
] [
LaY
] [
PbY
]
2.0 1.69 2.02 0.80 0.53 0.85 1.37 2.69 0.52 1.84
2.5 1.57 1.91 0.75 0.66 0.76 1.24 2.60 0.48 1.84
3.0 1.38 1.57 0.55 0.98 1.00 1.36 2.49 0.36 1.49
3.5 1.32 1.31 0.68 0.98 0.83 1.07 2.20 0.24 1.13
4.0 1.29 1.06 0.80 1.06 0.81 0.87 1.95 0.06 1.13
4.5 1.24 0.76 0.87 1.06 0.76 0.63 1.60 -0.13 0.84
5.0 1.19 0.49 0.91 1.10 0.78 0.48 1.26 -0.30 0.48
5.5 1.14 0.28 0.97 1.07 0.77 0.44 1.00 -0.33 0.23
6.0 0.97 -0.08 0.97 0.81 0.53 0.22 0.37 -0.31 -0.16

– 55 –
Fig. 1.— Temperature gradients within the convective envelope of a 6 M⊙ model during the
50th interpulse period: effective gradient (solid line), adiabatic gradient (short-dashed line).
The temperature profile is also shown (long-dashed line). Note that the temperature at the
convective boundaries, i.e., 85 MK (internal) and 4000 K (external), are out of the Y axis
range.
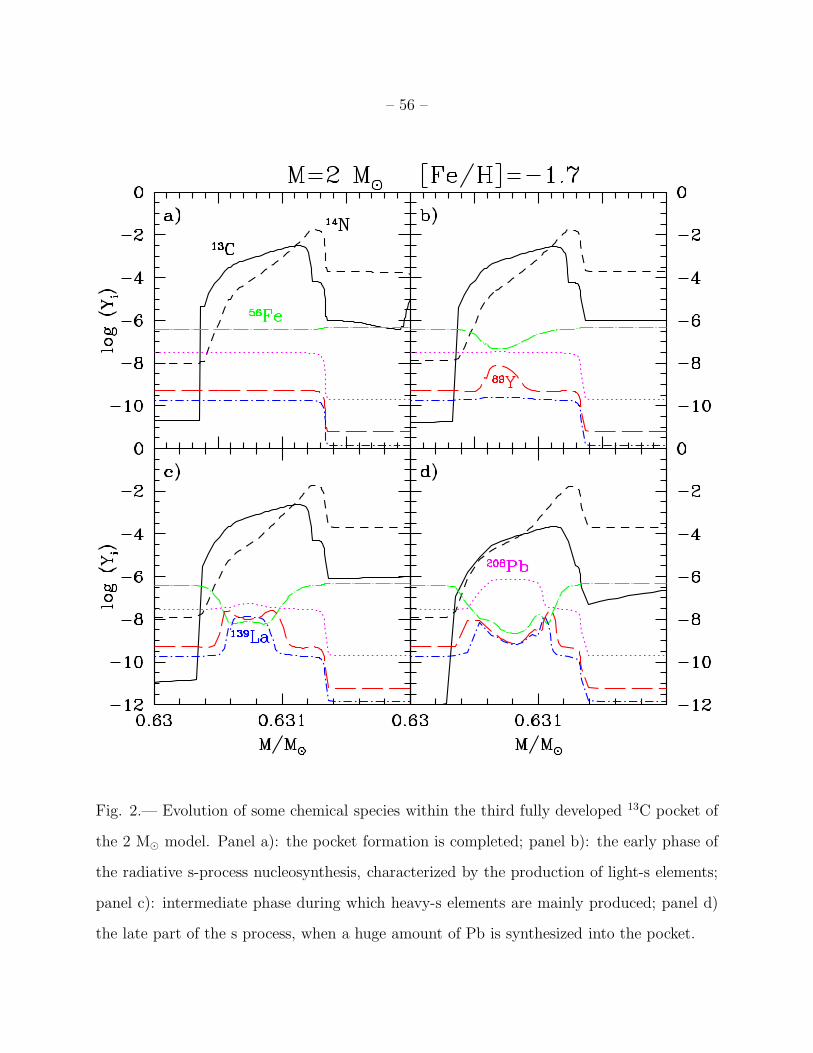
– 56 –
Fig. 2.— Evolution of some chemical species within the third fully developed 13C pocket of
the 2 M⊙ model. Panel a): the pocket formation is completed; panel b): the early phase of
the radiative s-process nucleosynthesis, characterized by the production of light-s elements;
panel c): intermediate phase during which heavy-s elements are mainly produced; panel d)
the late part of the s process, when a huge amount of Pb is synthesized into the pocket.
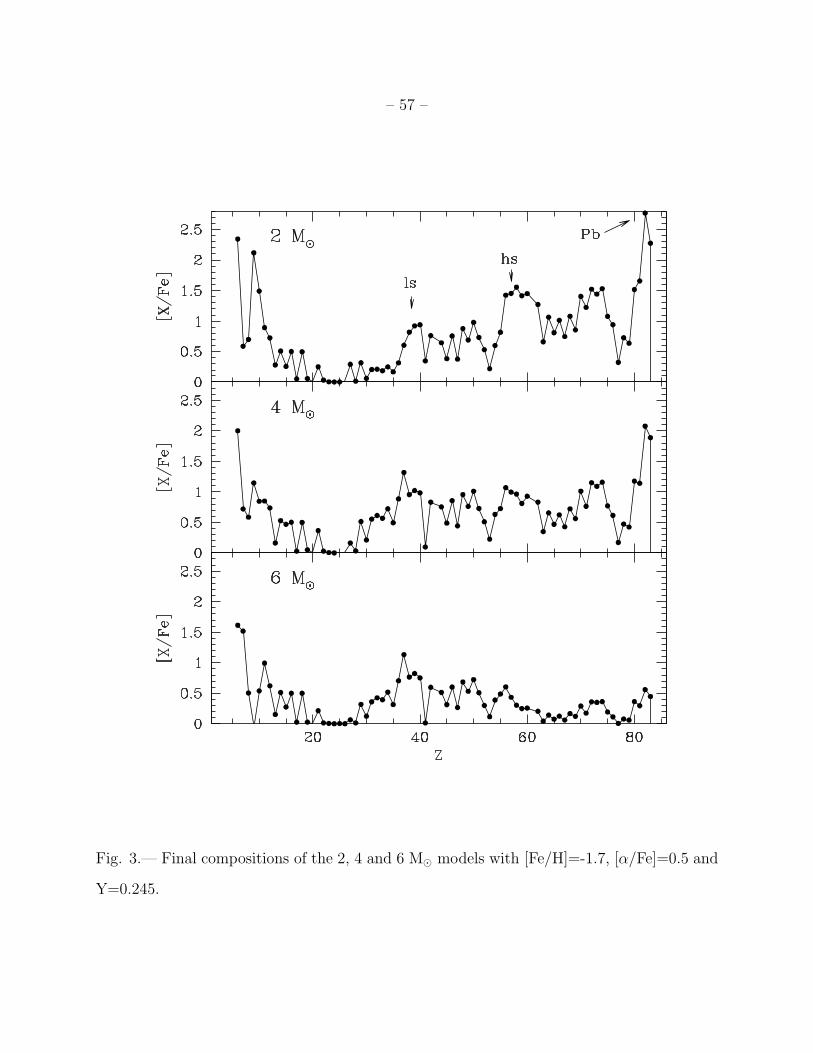
– 57 –
Fig. 3.— Final compositions of the 2, 4 and 6 M⊙ models with [Fe/H]=-1.7, [α/Fe]=0.5 and
Y=0.245.
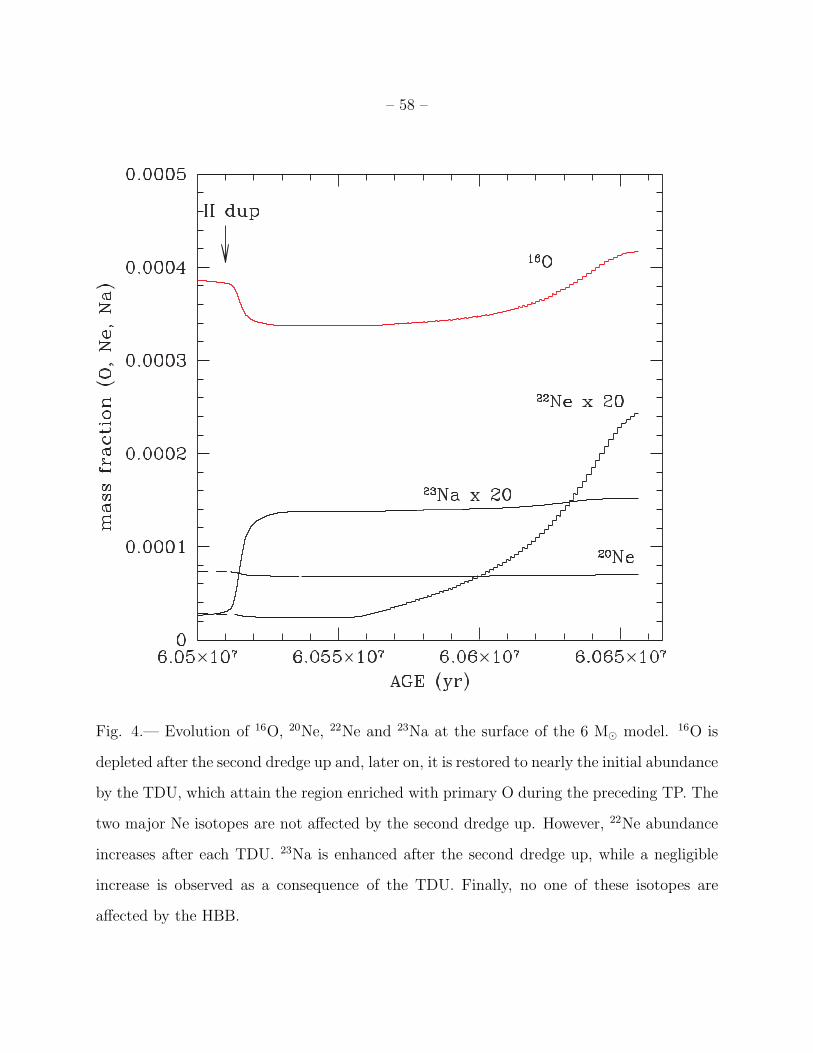
– 58 –
Fig. 4.— Evolution of 16O, 20Ne, 22Ne and 23Na at the surface of the 6 M⊙ model. 16O is
depleted after the second dredge up and, later on, it is restored to nearly the initial abundance
by the TDU, which attain the region enriched with primary O during the preceding TP. The
two major Ne isotopes are not affected by the second dredge up. However, 22Ne abundance
increases after each TDU. 23Na is enhanced after the second dredge up, while a negligible
increase is observed as a consequence of the TDU. Finally, no one of these isotopes are
affected by the HBB.
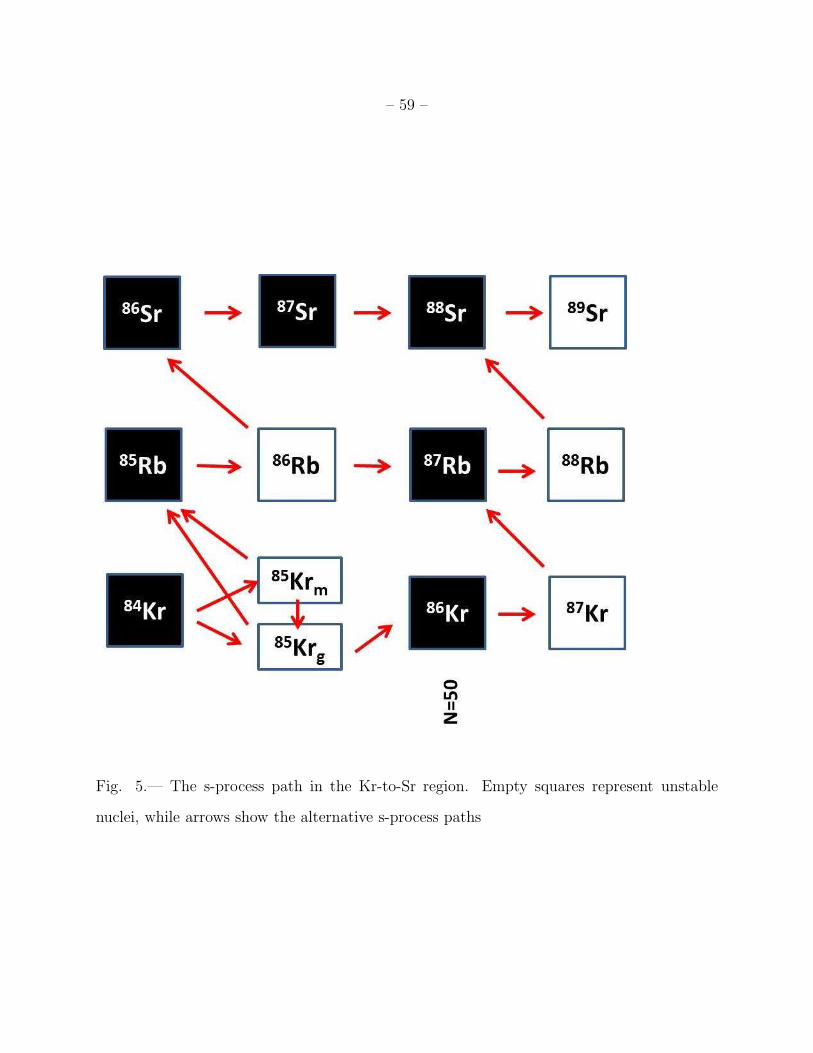
– 59 –
Fig. 5.— The s-process path in the Kr-to-Sr region. Empty squares represent unstable
nuclei, while arrows show the alternative s-process paths
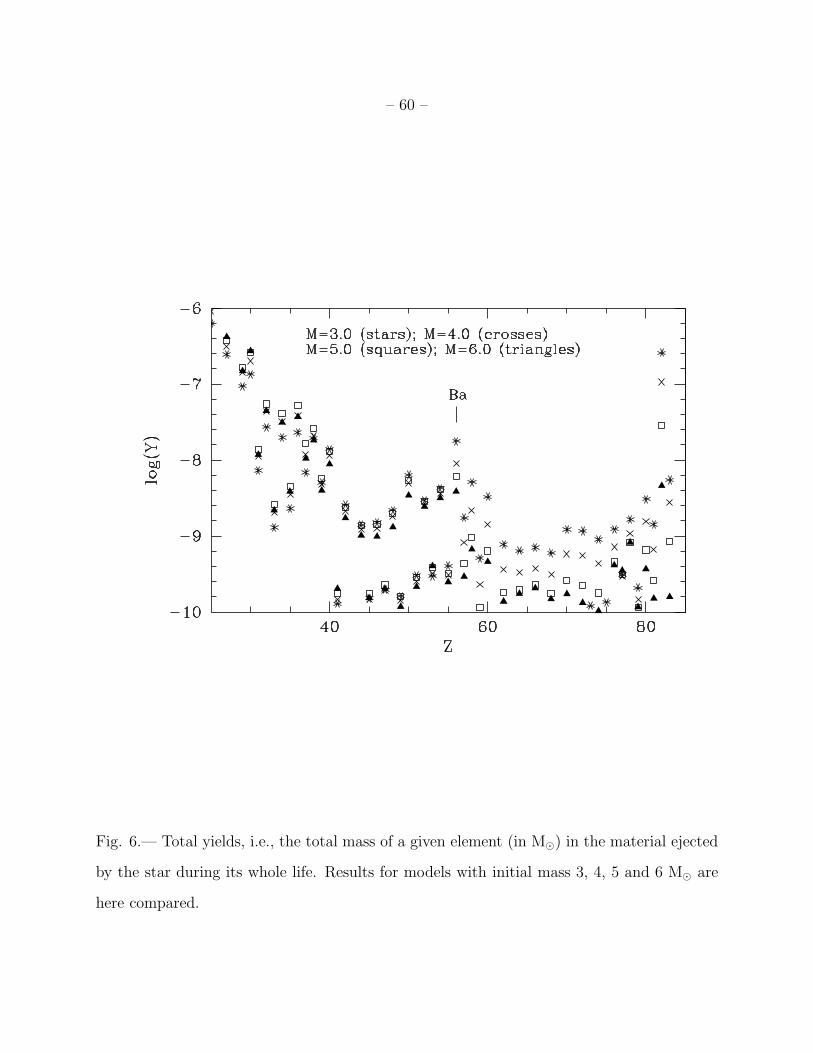
– 60 –
Fig. 6.— Total yields, i.e., the total mass of a given element (in M⊙) in the material ejected
by the star during its whole life. Results for models with initial mass 3, 4, 5 and 6 M⊙ are
here compared.

– 61 –
Fig. 7.— Evolution of the s process surface abundances for a model of M=6 M⊙ and Z=0.001.

– 62 –
Fig. 8.— Stellar lifetime versus initial mass.
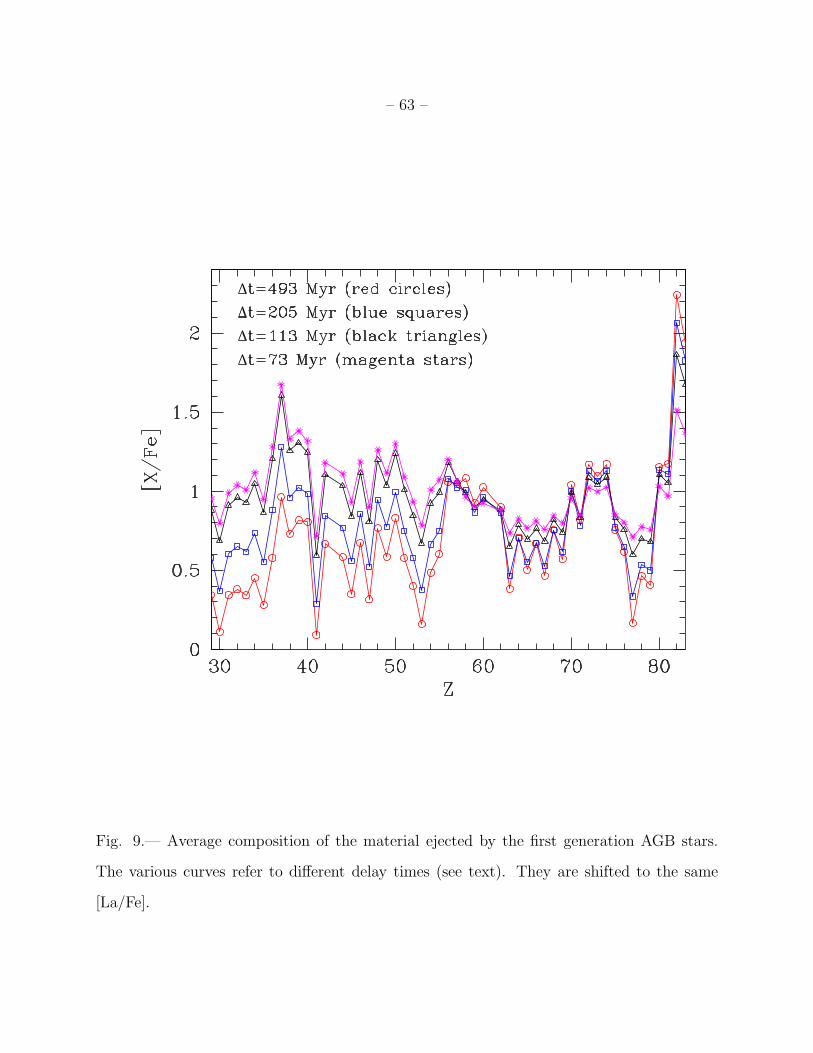
– 63 –
Fig. 9.— Average composition of the material ejected by the first generation AGB stars.
The various curves refer to different delay times (see text). They are shifted to the same
[La/Fe].
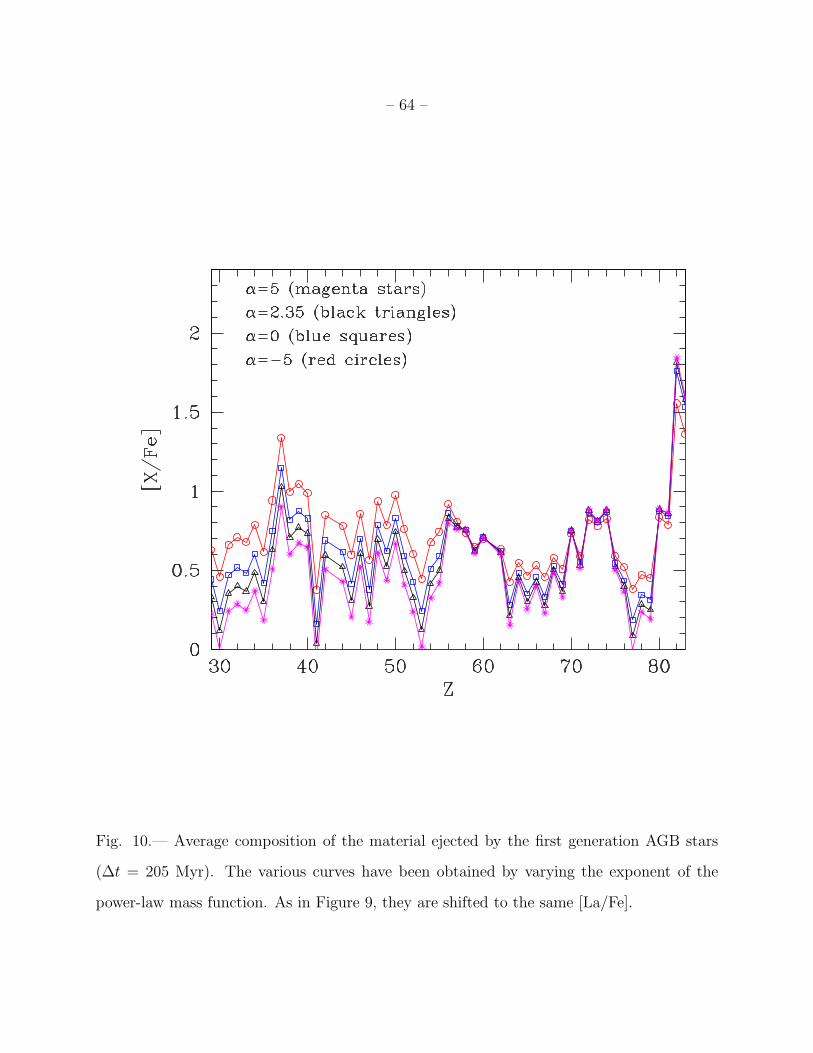
– 64 –
Fig. 10.— Average composition of the material ejected by the first generation AGB stars
(∆t = 205 Myr). The various curves have been obtained by varying the exponent of the
power-law mass function. As in Figure 9, they are shifted to the same [La/Fe].

– 65 –
Fig. 11.— Best fit of the average s-process chemical pattern of stars in M22.
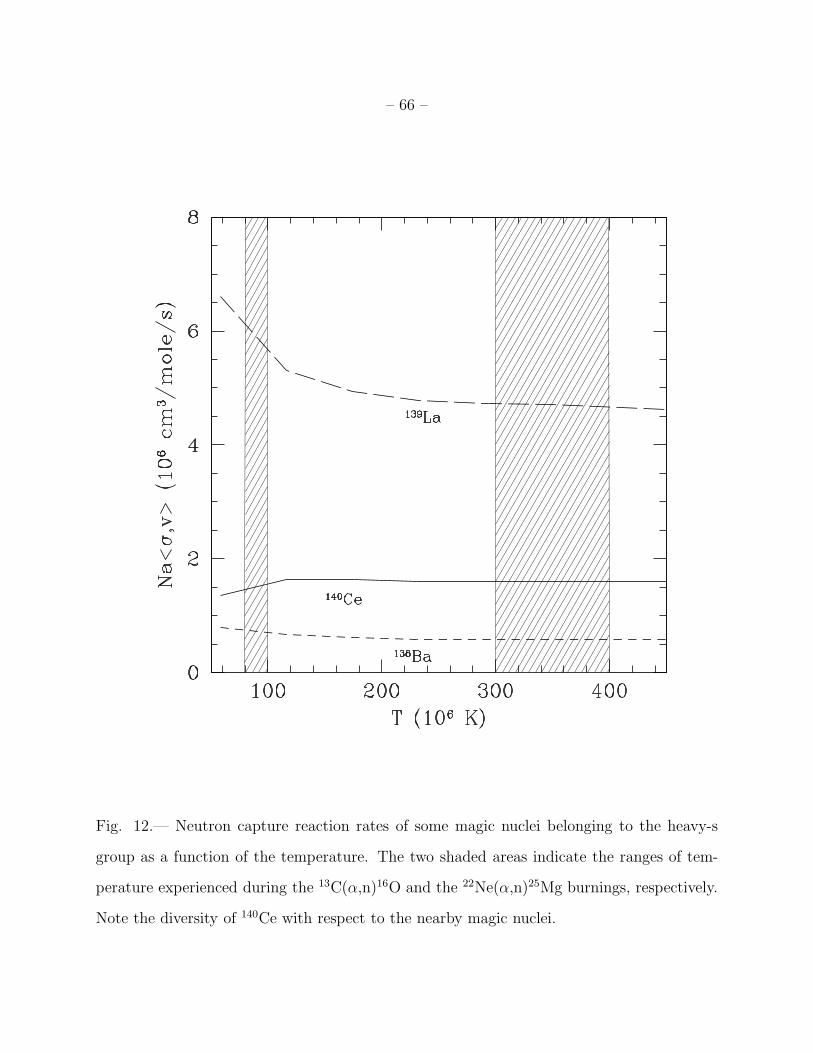
– 66 –
Fig. 12.— Neutron capture reaction rates of some magic nuclei belonging to the heavy-s
group as a function of the temperature. The two shaded areas indicate the ranges of tem-
perature experienced during the 13C(α,n)16O and the 22Ne(α,n)25Mg burnings, respectively.
Note the diversity of 140Ce with respect to the nearby magic nuclei.
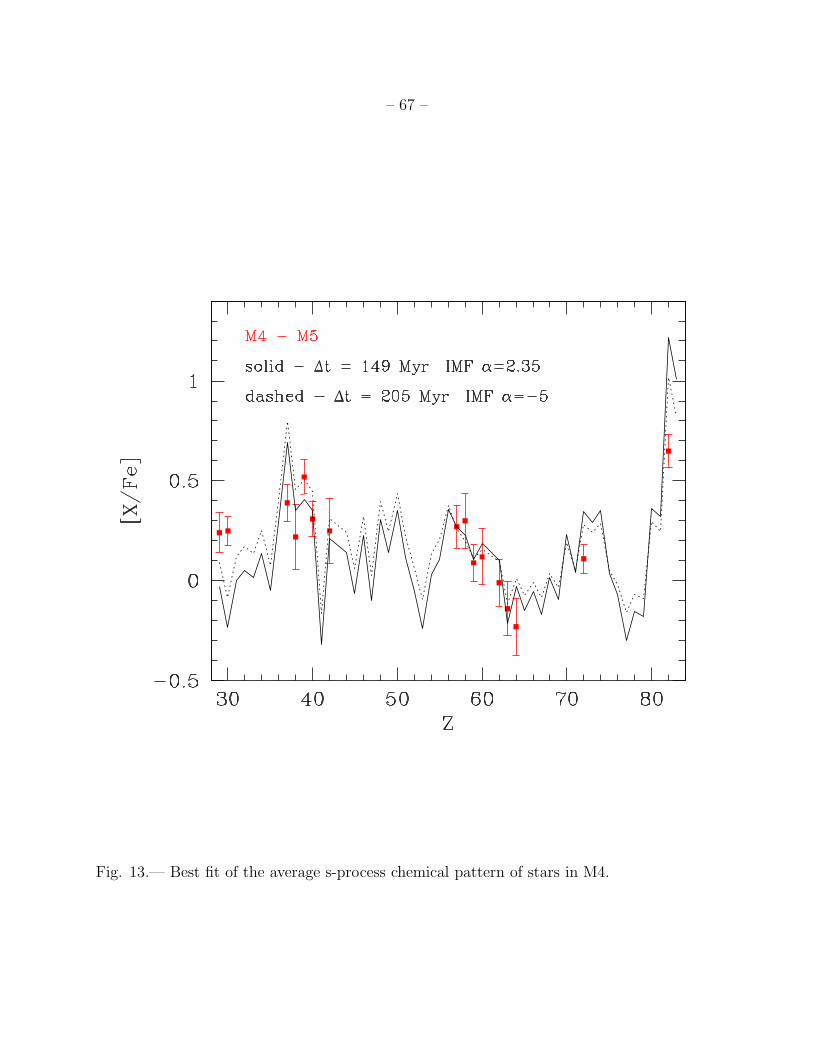
– 67 –
Fig. 13.— Best fit of the average s-process chemical pattern of stars in M4.
Related Documents