energies Article Heat Recovery for a Textile Stenter: CFD Analysis of Air Curtain Benefits Lorenzo Ciappi 1 , Daniele Fiaschi 1 , Giampaolo Manfrida 1, * , Simone Salvadori 1 , Jacek Smolka 2 and Lorenzo Talluri 1 1 Department of Industrial Engineering, University of Florence, I50135 Florence, Italy; lorenzo.ciappi@unifi.it (L.C.); daniele.fiaschi@unifi.it (D.F.); simone.salvadori@unifi.it (S.S.); lorenzo.talluri@unifi.it (L.T.) 2 Institute of Thermal Technology, Silesian University of Technology, 44100 Gliwice, Poland; [email protected] * Correspondence: giampaolo.manfrida@unifi.it; Tel.: +39-055-2758676 Received: 21 December 2018; Accepted: 31 January 2019; Published: 2 February 2019 Abstract: Modern textile stenters are designed to reduce the inefficiency of the process and to recover the flow stream, which still contains a relatively high energetic value. In recent years, research has focused on the recovery of the energy content of the low-temperature exhaust flow; nonetheless, another important aspect that may increase the efficiency of the process is the reduction of the ambient air suction. In the present research, an innovative way to improve both machine insulation and energy savings, by using preheated air, was numerically evaluated. The proposed solution utilizes an air stream transverse to the fabric (generally called air curtain), either preheated or not, to create soft gates both at the inlet and at the outlet section of the drying machine. Several valuable advantages can be listed when using this solution: reduction of the dispersion of heat and humid polluted air to the work environment, limitation of air ingestion from outside, and effective heat recovery coupled to a uniform temperature profile around the textile fabric. To analyze the insulation capability of the air curtains in terms of mass and energy transfer, a two-dimensional CFD model of the machine was realized. A test matrix including three possible fabric speeds (20, 40 and 60 m/min), three tilt angles (-15 ◦ ,0 ◦ and 15 ◦ ), four mass flow rates (0% with no air curtains and 3%, 5% and 7% of the total flow rate through the machine, where the 5% case is equivalent to the flow rate ingested from the ambient) and two temperatures (15 ◦ C and 70 ◦ C) of the plane jets exiting from the air curtains was considered, thus covering a wide range of possible practical applications. The obtained results demonstrate that warm air curtains at both the inlet and outlet are very effective in a fabric speed range up to 40 m/min; at higher fabric speed, entrainment of warm gases from inside the machine at the fabric outlet becomes relevant, and the adoption of a cold air curtain (capable of better insulation) can be recommended in this position. Keywords: air curtain; textile dryer; stenter; energy saving; computational fluid dynamics 1. Introduction Over the last years, the world energy scenario has experienced a sharp increase of the energy demand, which has raised attention on several issues, from the exhaustion of resources to the pressing matter of pollutant and greenhouse emissions. This has resulted in the promotion of research into new technologies for energy conversion, as well as in the development of technologies to recover heat that would otherwise be wasted. One of the main sectors involved in this is industrial manufacturing, which accounts for about 38% of the primary energy consumption [1]. To reduce the share of energy consumption, correct management strategies and advanced conversion and utilization technologies Energies 2019, 12, 482; doi:10.3390/en12030482 www.mdpi.com/journal/energies

Welcome message from author
This document is posted to help you gain knowledge. Please leave a comment to let me know what you think about it! Share it to your friends and learn new things together.
Transcript

energies
Article
Heat Recovery for a Textile Stenter: CFD Analysis ofAir Curtain Benefits
Lorenzo Ciappi 1, Daniele Fiaschi 1 , Giampaolo Manfrida 1,* , Simone Salvadori 1 ,Jacek Smolka 2 and Lorenzo Talluri 1
1 Department of Industrial Engineering, University of Florence, I50135 Florence, Italy;[email protected] (L.C.); [email protected] (D.F.); [email protected] (S.S.);[email protected] (L.T.)
2 Institute of Thermal Technology, Silesian University of Technology, 44100 Gliwice, Poland;[email protected]
* Correspondence: [email protected]; Tel.: +39-055-2758676
Received: 21 December 2018; Accepted: 31 January 2019; Published: 2 February 2019�����������������
Abstract: Modern textile stenters are designed to reduce the inefficiency of the process and to recoverthe flow stream, which still contains a relatively high energetic value. In recent years, research hasfocused on the recovery of the energy content of the low-temperature exhaust flow; nonetheless,another important aspect that may increase the efficiency of the process is the reduction of the ambientair suction. In the present research, an innovative way to improve both machine insulation andenergy savings, by using preheated air, was numerically evaluated. The proposed solution utilizes anair stream transverse to the fabric (generally called air curtain), either preheated or not, to create softgates both at the inlet and at the outlet section of the drying machine. Several valuable advantagescan be listed when using this solution: reduction of the dispersion of heat and humid polluted air tothe work environment, limitation of air ingestion from outside, and effective heat recovery coupledto a uniform temperature profile around the textile fabric. To analyze the insulation capability ofthe air curtains in terms of mass and energy transfer, a two-dimensional CFD model of the machinewas realized. A test matrix including three possible fabric speeds (20, 40 and 60 m/min), three tiltangles (−15◦, 0◦ and 15◦), four mass flow rates (0% with no air curtains and 3%, 5% and 7% of thetotal flow rate through the machine, where the 5% case is equivalent to the flow rate ingested fromthe ambient) and two temperatures (15 ◦C and 70 ◦C) of the plane jets exiting from the air curtainswas considered, thus covering a wide range of possible practical applications. The obtained resultsdemonstrate that warm air curtains at both the inlet and outlet are very effective in a fabric speedrange up to 40 m/min; at higher fabric speed, entrainment of warm gases from inside the machine atthe fabric outlet becomes relevant, and the adoption of a cold air curtain (capable of better insulation)can be recommended in this position.
Keywords: air curtain; textile dryer; stenter; energy saving; computational fluid dynamics
1. Introduction
Over the last years, the world energy scenario has experienced a sharp increase of the energydemand, which has raised attention on several issues, from the exhaustion of resources to the pressingmatter of pollutant and greenhouse emissions. This has resulted in the promotion of research intonew technologies for energy conversion, as well as in the development of technologies to recover heatthat would otherwise be wasted. One of the main sectors involved in this is industrial manufacturing,which accounts for about 38% of the primary energy consumption [1]. To reduce the share of energyconsumption, correct management strategies and advanced conversion and utilization technologies
Energies 2019, 12, 482; doi:10.3390/en12030482 www.mdpi.com/journal/energies

Energies 2019, 12, 482 2 of 22
are required [2]. Indeed, the actual fraction of wasted heat in the industrial sector is between 20% and50% [3].
1.1. Waste Heat Utilization in the Textile Industry
In the most energy-intensive industrial sectors, such as the cement, glass or metallurgicalindustries, widespread use of energy recovery systems can be found, by which a strong reduction ofenergy consumption and, consequently, of greenhouse gas emissions may be achieved. An example isprovided by the case study of the Kwinana district in Australia, where a significant CO2 mitigationpotential of 245–370 k/year was achieved through energy recovery from flue gas [4].
Another industrial sector with a very high energy recovery potential from its various processesis the textile industry. For instance, only in the USA, the energy consumption amounts to about87 TWh [1] and its related waste heat share is about 40% [1]. The high value of wasted heat is mainlydue to limited information on how to apply energy-efficiency measures [5]. Therefore, there is acompelling interest in introducing solutions to limit the energy wastage. An example is presentedin [6], where a summary of the energy saving methods applied to the Taiwanese textile industry isreported. The total savings assessed amounted to 94.6 MWh of electricity (out of which 27.4 MWhwas from the process control system), 23.69 m3 of fuel oil (out of which 17.82 was from the boilersystem) and 4.89 t of coal (out of which 4.22 t was from the process control system), just by applyingcorrect management methods. Furthermore, each source of inefficiency was assessed, and a possiblereduction solution was also presented. Another work, which focused on the waste heat utilizationin the textile industry, was presented in [7]. A quantification of the possible solutions of waste heatrecovery from the processes in Bangladesh textile industry, assessing both energy flows and cost, waspresented. The analyzed waste heat recovery systems are: (a) heat recovery from generator flue gas,(b) economizers for boilers, (c) waste-heat extraction from dye waste water, (d) steam-condensaterecovery, (e) waste-heat recovery from stenter exhaust and (f) blow-down heat recovery.
Further studies on energy optimization management to move towards a sustainable textileindustry are introduced in [8] and [9], where a woven manufacturing mill in Bursa (Turkey) wastaken as case study. Specifically, in the former, several sustainable systems were assessed, to reduceenergy consumption and pollutant emissions. Some of the proposed solutions (reuse of cooling water,renewal of the water softening system) were also implemented, bringing a substantial reduction ofwater and energy consumption. In the latter, the focus of research was put on a waste heat recoverysystem. A techno-economic analysis was developed to prove the environmental and economicalsustainability of waste heat recovery systems for drying processes in the textile industry. A technicaland environmental analysis of another Turkey fabric mill (located in Denizli) was performed in [10].Particularly, the implementation of 22 Best Available Technologies (BATs), that allow strong reductionsof energy consumption and relatively short payback periods, was proposed. In [11], environmentaland economical assessments on three different textile factories of the Biyagama Export ProcessingZone (Sri Lanka) were performed to demonstrate that environmentally-friendly technology solutionsalso allow for economic gain.
A significant part of energy consumption in the textile sector is caused by the drying process,which occurs through the utilization of different machines. One of the most used machines fordrying fabrics is the stenter machine, which is a large, high-productivity machine that requires aconsiderable amount of thermal energy to operate correctly. Therefore, several studies were developedon the assessment of the causes of inefficiencies and the possible performance improvement solutions.The exergetic analysis of a real stenter coupled with a boiler and a circulation pump is presented in [12],exploiting the experimental data provided by the factory. The overall assessed exergetic efficiencywas found to be 34.4%. Different machine configurations involved a stenter coupled with a conveyorbelt dryer [13], proposing a new model for the exergy analysis on convective drying stenters [14] andassessing the influence of several operational parameters on the performance of the machine, such asthe drying temperature and the moisture content [15].

Energies 2019, 12, 482 3 of 22
Stenter machines are suitable for waste heat recovery system utilization, as the exhaust airflowstill has a valuable energy content. This is highlighted in [16] where a drying system with waste-heatrecovery is investigated and the energy saving effects as a function of the drying inlet temperatureare shown. In [17], the reduction of energy consumption is achieved though the recovery of thewaste heat from an indirectly heated stenter, which allows for a strong reduction of coal consumption.The improvement of a low-temperature exhaust indirect heat recovery network for an industrialtextile stenter was evaluated in [18], showing the beneficial effects of a targeted redesign of the layoutand pipe geometry; the model predictions were positively confirmed by the experimental results.The amount of heat recovered with these improvements was so relevant, that a problem of managingthe cold side heat supply is present today. An obvious solution would be to propose combustionair preheating, however this is not simple to implement, because the several gas burners serving themachine are designed for cold air inlet, and the combustion air flow rate is small (in comparison withcold air entering through the fabric inlet/outlet ports) and subject to combustion control adjustment.
1.2. Air Curtains Possible Use in Stenters
Air curtain devices (ACs) were first patented in 1904 [19] as a method to isolate two zones.The first objective of these devices was to “furnish a mean of excluding wind, snow, rain anddust from doorways” as stated in [19]. From its original application, air curtain devices wereemployed in different fields, such as in safety applications, where the transfer of heat and smoke toa protected ambient can be thus prevented [20]. An experimental investigation of air curtains usedas smoke blockage systems, assessing different air curtains velocities, injection angles, slot widthsand temperatures and heat rate of the fire, is described in [21]. A recent work applies the air curtaintechnology to the reduction of dust diffusion during the excavation of tunnels [22], determining thebest suited air curtain parameters to achieve a correct dust treatment, reduced energy consumption andcost. Another typical application is the confinement of cold rooms, as it allows the energy consumptionreduction of the cooling equipment in applications where the cooled space needs to be open, suchas retail stores or commercial display cabinets. This type of application has been deeply assessed,analytically [23], numerically and experimentally [24].
Foster et al. developed a thorough assessment of the optimal jet velocities which are requiredto achieve high confinement effectiveness [25]. Another parameter, which affects the air curtainsperformance, is the presence of external lateral flows. A numerical and experimental evaluation wascarried out to understand the reduction of effectiveness due to external lateral flows [26]. A specificstudy on the behavior of air curtains was developed in [27], where a thermography measurementtechnique was applied. The temperature profile along the central axis of the jet was displayed,confirming that the optimal working conditions correspond to the minimum of the deflection modulus,as stated in [28]. Finally, air curtain applications were studied even in terms of environmental andeconomic aspects and several analyses were performed to demonstrate the actual attractiveness ofsuch systems compared to the commonly employed ones [29].
Referring to textile machines, sealing more effectively the stenter from cold air ingestion from thefabric inlet/outlet ports is certainly a recommendable practice, allowing one to improve the quality ofthe work environment and the textile process itself. Application of air curtain technology to stentermachines was addressed in a European project [30]. The provided results claim a 30% energy savingsderived from the use of air curtains, mainly due to the reduction of the exhaust flow rate. The noveltyof the approach here proposed is to use the air curtain as an efficient heat recovery device: the sealingair is preheated through an indirect heat exchanger (water/air heat exchanger, connected to the wasteheat recovery unit for commercial fabric drying machines): the warm air provides a permeable shield,and enters inside the stenter in place of the cold air infiltration, thereby allowing a reduction of therequired heat input from the burners. This solution can result in a significant improvement for thefield of textile waste heat recovery.

Energies 2019, 12, 482 4 of 22
In the present study, air curtains are thus proposed both as a means of shielding a cold inlet flowand as a means for regenerative air preheating, effectively using the heat recovered from the flue gases.The potential savings of the related air curtains are evaluated by the means of dedicated 2D CFDsimulations, comparing configurations with or without the air curtains.
2. Description of the Application
2.1. Stenter Geometry
A stenter unit allows wet fabrics, which move across the machine on a horizontal plane at atypical speed between 0.1 and 1 m/s, to be effectively dried through the action of warm air producedby burners and recirculated inside the chamber to obtain a homogenous ambient. A textile stenter hasgenerally a modular structure, where the modules are positioned one after the other in the direction ofthe moving cloth, as displayed in Figure 1. Each module is composed of an air distribution system,which includes recirculation fans, and specifically designed blowing sections, which ensure the optimaldistribution of hot air on the surface of the wet fabric. The number of installed modules depends onthe speed of the process, which in turn depends on the type of textile to dry, the wetness of the fabric,the temperature inside of the drying chamber and the ambient conditions. In the present study, asingle module of the machine was considered to evaluate the effects of using air curtains to limit thedispersion of heat and effluents to the outside work environment and, at the same time, to reduce theingestion of ambient air.
Energies 2018, 11, x FOR PEER REVIEW 4 of 21
2. Description of the Application
2.1. Stenter Geometry
A stenter unit allows wet fabrics, which move across the machine on a horizontal plane at a typical speed between 0.1 and 1 m/s, to be effectively dried through the action of warm air produced by burners and recirculated inside the chamber to obtain a homogenous ambient. A textile stenter has generally a modular structure, where the modules are positioned one after the other in the direction of the moving cloth, as displayed in Figure 1. Each module is composed of an air distribution system, which includes recirculation fans, and specifically designed blowing sections, which ensure the optimal distribution of hot air on the surface of the wet fabric. The number of installed modules depends on the speed of the process, which in turn depends on the type of textile to dry, the wetness of the fabric, the temperature inside of the drying chamber and the ambient conditions. In the present study, a single module of the machine was considered to evaluate the effects of using air curtains to limit the dispersion of heat and effluents to the outside work environment and, at the same time, to reduce the ingestion of ambient air.
Figure 1. Stenter schematics with highlight of a single module [31].
2.2. Stenter Model
Stenter machines are built in standardized sizes for length and height, while width is dependent on the type of fabric undergoing the drying process. Therefore, if a generalized configuration needs to be considered, a two-dimensional approach must be used, also keeping in mind that the length dimension is the predominant one. For this reason, and to realize a fast prediction model, a simplified 2-D geometry of the machine was selected, by considering a section of the stenter defined by the longitudinal axis and the sagittal axis.
A single module was considered as the effects of air suction on the fabric is particularly relevant in the two zones close to machine inlet and outlet. A 4-stage blowing section is placed within the module, so that the sealing issues should not differ significantly for a single or a multiple-module stenter. The 2-D schematic of a single module of a stenter machine is represented in Figure 2. The recirculated hot air enters the drying chamber through specifically designed arrays of blowing nozzles. The nozzle arrays accelerate and distribute the air flow. They were schematized as porous media in the present study. The hot air passes through the porous media, impacts on the wet fabric and is successively sucked in the recirculation chamber by means of channels positioned between two blowing arrays. The cooled mass flow is recirculated and heated again through mixing with the combustion air coming from the burners and is re-injected through the blowing arrays. Part of the cooled flow rate is expelled from the machine by the means of exhaust fans. This moist stream still has an appreciable energy content: for this reason, in modern stenters the waste heat can be recovered in various forms: it may directly heat up air to be recirculated into the machine or be indirectly recovered to produce hot water.
A feature of the stenter machine is keeping the pressure into the drying chamber below the ambient value. This condition is ensured by the exhaust fans, and it is required to prevent the leakage of combustion gases and effluents from the drying chamber. Indeed, if the combustion gases and the effluents of the drying process get out of the machine, they may cause serious human health issues, besides environmental pollution. However, as the stenter working chamber operates below the atmospheric pressure, cold air is ingested from both the inlet and outlet slots of the machine, with a relative fraction of the total mass flow between 3% and 7% [12–15]. Ingestion of cold air decreases the machine efficiency and the effectiveness of the drying process. Therefore, to improve the stenter
Figure 1. Stenter schematics with highlight of a single module [31].
2.2. Stenter Model
Stenter machines are built in standardized sizes for length and height, while width is dependenton the type of fabric undergoing the drying process. Therefore, if a generalized configuration needsto be considered, a two-dimensional approach must be used, also keeping in mind that the lengthdimension is the predominant one. For this reason, and to realize a fast prediction model, a simplified2-D geometry of the machine was selected, by considering a section of the stenter defined by thelongitudinal axis and the sagittal axis.
A single module was considered as the effects of air suction on the fabric is particularly relevant inthe two zones close to machine inlet and outlet. A 4-stage blowing section is placed within the module,so that the sealing issues should not differ significantly for a single or a multiple-module stenter.The 2-D schematic of a single module of a stenter machine is represented in Figure 2. The recirculatedhot air enters the drying chamber through specifically designed arrays of blowing nozzles. The nozzlearrays accelerate and distribute the air flow. They were schematized as porous media in the presentstudy. The hot air passes through the porous media, impacts on the wet fabric and is successivelysucked in the recirculation chamber by means of channels positioned between two blowing arrays.The cooled mass flow is recirculated and heated again through mixing with the combustion air comingfrom the burners and is re-injected through the blowing arrays. Part of the cooled flow rate is expelledfrom the machine by the means of exhaust fans. This moist stream still has an appreciable energycontent: for this reason, in modern stenters the waste heat can be recovered in various forms: it maydirectly heat up air to be recirculated into the machine or be indirectly recovered to produce hot water.
A feature of the stenter machine is keeping the pressure into the drying chamber below theambient value. This condition is ensured by the exhaust fans, and it is required to prevent the leakageof combustion gases and effluents from the drying chamber. Indeed, if the combustion gases and

Energies 2019, 12, 482 5 of 22
the effluents of the drying process get out of the machine, they may cause serious human healthissues, besides environmental pollution. However, as the stenter working chamber operates belowthe atmospheric pressure, cold air is ingested from both the inlet and outlet slots of the machine, witha relative fraction of the total mass flow between 3% and 7% [12–15]. Ingestion of cold air decreasesthe machine efficiency and the effectiveness of the drying process. Therefore, to improve the stenteroperation, cold airflow from the surrounding environment into the machine should be minimized.From the process point of view, this also improves the quality of the manufactured fabric, as theingested air may contain dust and other contaminants. The proposed solution to this issue is the use ofair curtains at both machine inlet and outlet, as displayed in Figure 3.
Energies 2018, 11, x FOR PEER REVIEW 5 of 21
operation, cold airflow from the surrounding environment into the machine should be minimized. From the process point of view, this also improves the quality of the manufactured fabric, as the ingested air may contain dust and other contaminants. The proposed solution to this issue is the use of air curtains at both machine inlet and outlet, as displayed in Figure 3.
Figure 2. Model scheme without air curtains.
The air curtains configuration shown in Figure 3 takes advantage of the presence, in the modern stenter here investigated, of an indirect heat recovery system for the waste heat: a large fraction of this last is recovered and temporarily stored as warming reservoir (allowing an easy closed-loop distribution through a manifold arrangement). In the present case, the warm water can be used to increase the temperature level of the air flow used to seal the air curtain. The proposed solution should determine the injection of warm sealing air inside the chamber in place of the cold ambient air. For this reason, it is expected that the warm sealing air should determine an increase of the drying efficiency (and consequently a reduction of the required heat input) of the stenter machine. As a high speed of the textile can determine the entrainment of the sealing air outside of the stenter at the outlet section (right), a design alternative with a cold air curtain might be proposed in this position.
Figure 3. Model scheme with air curtains.
3. Methodology
3.1. Stenter Configurations
The model for the CFD analyses was generated considering the two-dimensional longitudinal section of a single stenter module. Since the machine is vertically symmetrical relative to the textile, only the upper half of the geometry was created to reduce the use of computational resources and speed up calculations. Three cell zones were defined, as shown in Figure 4 where the main fluid domain, the porous media and the blowing arrays are respectively represented in grey, violet and red. The latter two zones represent the internal recirculation circuit of the machine, while the main fluid domain covers both internal recirculation and the external air. Indeed, a correct fluid domain definition requires that representative portions of the ambient air section both upstream and downstream of the stenter inlet and outlet, as well as the air inside the machine, are considered. The
Figure 2. Model scheme without air curtains.
The air curtains configuration shown in Figure 3 takes advantage of the presence, in the modernstenter here investigated, of an indirect heat recovery system for the waste heat: a large fraction ofthis last is recovered and temporarily stored as warming reservoir (allowing an easy closed-loopdistribution through a manifold arrangement). In the present case, the warm water can be used toincrease the temperature level of the air flow used to seal the air curtain. The proposed solution shoulddetermine the injection of warm sealing air inside the chamber in place of the cold ambient air. For thisreason, it is expected that the warm sealing air should determine an increase of the drying efficiency(and consequently a reduction of the required heat input) of the stenter machine. As a high speed ofthe textile can determine the entrainment of the sealing air outside of the stenter at the outlet section(right), a design alternative with a cold air curtain might be proposed in this position.
Energies 2018, 11, x FOR PEER REVIEW 5 of 21
operation, cold airflow from the surrounding environment into the machine should be minimized. From the process point of view, this also improves the quality of the manufactured fabric, as the ingested air may contain dust and other contaminants. The proposed solution to this issue is the use of air curtains at both machine inlet and outlet, as displayed in Figure 3.
Figure 2. Model scheme without air curtains.
The air curtains configuration shown in Figure 3 takes advantage of the presence, in the modern stenter here investigated, of an indirect heat recovery system for the waste heat: a large fraction of this last is recovered and temporarily stored as warming reservoir (allowing an easy closed-loop distribution through a manifold arrangement). In the present case, the warm water can be used to increase the temperature level of the air flow used to seal the air curtain. The proposed solution should determine the injection of warm sealing air inside the chamber in place of the cold ambient air. For this reason, it is expected that the warm sealing air should determine an increase of the drying efficiency (and consequently a reduction of the required heat input) of the stenter machine. As a high speed of the textile can determine the entrainment of the sealing air outside of the stenter at the outlet section (right), a design alternative with a cold air curtain might be proposed in this position.
Figure 3. Model scheme with air curtains.
3. Methodology
3.1. Stenter Configurations
The model for the CFD analyses was generated considering the two-dimensional longitudinal section of a single stenter module. Since the machine is vertically symmetrical relative to the textile, only the upper half of the geometry was created to reduce the use of computational resources and speed up calculations. Three cell zones were defined, as shown in Figure 4 where the main fluid domain, the porous media and the blowing arrays are respectively represented in grey, violet and red. The latter two zones represent the internal recirculation circuit of the machine, while the main fluid domain covers both internal recirculation and the external air. Indeed, a correct fluid domain definition requires that representative portions of the ambient air section both upstream and downstream of the stenter inlet and outlet, as well as the air inside the machine, are considered. The
Figure 3. Model scheme with air curtains.
3. Methodology
3.1. Stenter Configurations
The model for the CFD analyses was generated considering the two-dimensional longitudinalsection of a single stenter module. Since the machine is vertically symmetrical relative to the textile,

Energies 2019, 12, 482 6 of 22
only the upper half of the geometry was created to reduce the use of computational resources andspeed up calculations. Three cell zones were defined, as shown in Figure 4 where the main fluiddomain, the porous media and the blowing arrays are respectively represented in grey, violet and red.The latter two zones represent the internal recirculation circuit of the machine, while the main fluiddomain covers both internal recirculation and the external air. Indeed, a correct fluid domain definitionrequires that representative portions of the ambient air section both upstream and downstream of thestenter inlet and outlet, as well as the air inside the machine, are considered. The external air regions(dashed light blue line) were sized during preliminary analyses with the aim of modelling the ambientregion, which is perturbed by the air flow induced by the machine.
Energies 2018, 11, x FOR PEER REVIEW 6 of 21
external air regions (dashed light blue line) were sized during preliminary analyses with the aim of modelling the ambient region, which is perturbed by the air flow induced by the machine.
Figure 4. Schematic of the fluid domain used in CFD analyses.
Regarding the geometry, the investigated stenter configurations are four (Figure 5) and vary based on the absence or the presence of the air curtains and on their tilt angle (−15°, 0° and +15°). The tilt angle represents the inclination of the air curtain duct relative to the vertical axis: it is defined positive when the air flow is oriented inward to the machine and negative when the AC is pointing outwards. Indeed, the sign convention for tilt angle, as for all the variables, is that quantities entering the system are considered positive. The aspect ratio of the ACs, defined as the ratio between the width of the AC passage and the gap to be sealed, is 2.5.
Figure 5. Geometric configurations of the stenter model; (a) No air curtain, (b) AC tilt angle = 0°, (c) AC tilt angle = +15°, (d) AC tilt angle = −15°.
The geometric configuration without air curtains is the reference case, which is compared with the other configurations to assess the effects of the ACs. The investigated stenter configurations are 60 and differ for fabric velocity, AC temperature and AC mass flow, besides of the geometry in terms of the mentioned AC tilt angle. To cover the most common industrial applications [12], three textile velocities for each of the four geometries presented in Figure 5 and, in addition, two AC flow temperatures to mimic cold and warm air flow and three mass flow rates through air curtains with respect to the ambient air flow for the three geometries with ACs were analyzed. All the considered tilt angles and the operating parameters are listed in Table 1.
Table 1. Parameters determining stenter model configurations investigated with CFD.
AC Tilt Angle (°)
AC Temperature (°C)
AC/Ambient Flow Ratio (%)
Fabric Velocity (m/min)
−15 0
+15
15 3 5 7
0 20
70 40 60
Inlet Outlet Inlet Outlet
Inlet Outlet Inlet Outlet
NO AC AC 0°
AC +15° AC -15°
Figure 4. Schematic of the fluid domain used in CFD analyses.
Regarding the geometry, the investigated stenter configurations are four (Figure 5) and vary basedon the absence or the presence of the air curtains and on their tilt angle (−15◦, 0◦ and +15◦). The tiltangle represents the inclination of the air curtain duct relative to the vertical axis: it is defined positivewhen the air flow is oriented inward to the machine and negative when the AC is pointing outwards.Indeed, the sign convention for tilt angle, as for all the variables, is that quantities entering the systemare considered positive. The aspect ratio of the ACs, defined as the ratio between the width of the ACpassage and the gap to be sealed, is 2.5.
Energies 2018, 11, x FOR PEER REVIEW 6 of 21
external air regions (dashed light blue line) were sized during preliminary analyses with the aim of modelling the ambient region, which is perturbed by the air flow induced by the machine.
Figure 4. Schematic of the fluid domain used in CFD analyses.
Regarding the geometry, the investigated stenter configurations are four (Figure 5) and vary based on the absence or the presence of the air curtains and on their tilt angle (−15°, 0° and +15°). The tilt angle represents the inclination of the air curtain duct relative to the vertical axis: it is defined positive when the air flow is oriented inward to the machine and negative when the AC is pointing outwards. Indeed, the sign convention for tilt angle, as for all the variables, is that quantities entering the system are considered positive. The aspect ratio of the ACs, defined as the ratio between the width of the AC passage and the gap to be sealed, is 2.5.
Figure 5. Geometric configurations of the stenter model; (a) No air curtain, (b) AC tilt angle = 0°, (c) AC tilt angle = +15°, (d) AC tilt angle = −15°.
The geometric configuration without air curtains is the reference case, which is compared with the other configurations to assess the effects of the ACs. The investigated stenter configurations are 60 and differ for fabric velocity, AC temperature and AC mass flow, besides of the geometry in terms of the mentioned AC tilt angle. To cover the most common industrial applications [12], three textile velocities for each of the four geometries presented in Figure 5 and, in addition, two AC flow temperatures to mimic cold and warm air flow and three mass flow rates through air curtains with respect to the ambient air flow for the three geometries with ACs were analyzed. All the considered tilt angles and the operating parameters are listed in Table 1.
Table 1. Parameters determining stenter model configurations investigated with CFD.
AC Tilt Angle (°)
AC Temperature (°C)
AC/Ambient Flow Ratio (%)
Fabric Velocity (m/min)
−15 0
+15
15 3 5 7
0 20
70 40 60
Inlet Outlet Inlet Outlet
Inlet Outlet Inlet Outlet
NO AC AC 0°
AC +15° AC -15°
Figure 5. Geometric configurations of the stenter model; (a) No air curtain, (b) AC tilt angle = 0◦,(c) AC tilt angle = +15◦, (d) AC tilt angle = −15◦.
The geometric configuration without air curtains is the reference case, which is compared with theother configurations to assess the effects of the ACs. The investigated stenter configurations are 60 anddiffer for fabric velocity, AC temperature and AC mass flow, besides of the geometry in terms of thementioned AC tilt angle. To cover the most common industrial applications [12], three textile velocitiesfor each of the four geometries presented in Figure 5 and, in addition, two AC flow temperaturesto mimic cold and warm air flow and three mass flow rates through air curtains with respect to theambient air flow for the three geometries with ACs were analyzed. All the considered tilt angles andthe operating parameters are listed in Table 1.

Energies 2019, 12, 482 7 of 22
Table 1. Parameters determining stenter model configurations investigated with CFD.
AC Tilt Angle (◦) AC Temperature (◦C) AC/Ambient FlowRatio (%) Fabric Velocity (m/min)
−150
+15
15 357
020
704060
A porous media assumption was utilized to model the nozzle arrays through which the hot airreaches the main air-drying zone. The geometric parameters of the blowing boxes were selected tomodel the perforated plates as generally as possible (Table 2).
Table 2. Main geometric parameters of the hot air blowers.
Blower Number(-)
Plate Total Area(m2)
Plate Open Area(m2)
Plate Porosity(%)
12 0.7 0.0245 3.5
In Table 3, the coding rules for the several examined configurations are defined. For example,the code AC0CCMV40 identifies a configuration with two air curtains with tilt angle 0◦, temperature15 ◦C, intermediate flow ratio (5%) and textile speed of 40 m/min while the code NOACV0 states aconfiguration without air curtains and stationary fabric.
Table 3. Coding scheme based on the parameters from Table 1.
AC Tilt Angle AC Temperature AC/Ambient FlowRatio Fabric Velocity
−150
+15
C LMH
V0V20
WV40V60
3.2. Numerical Setup
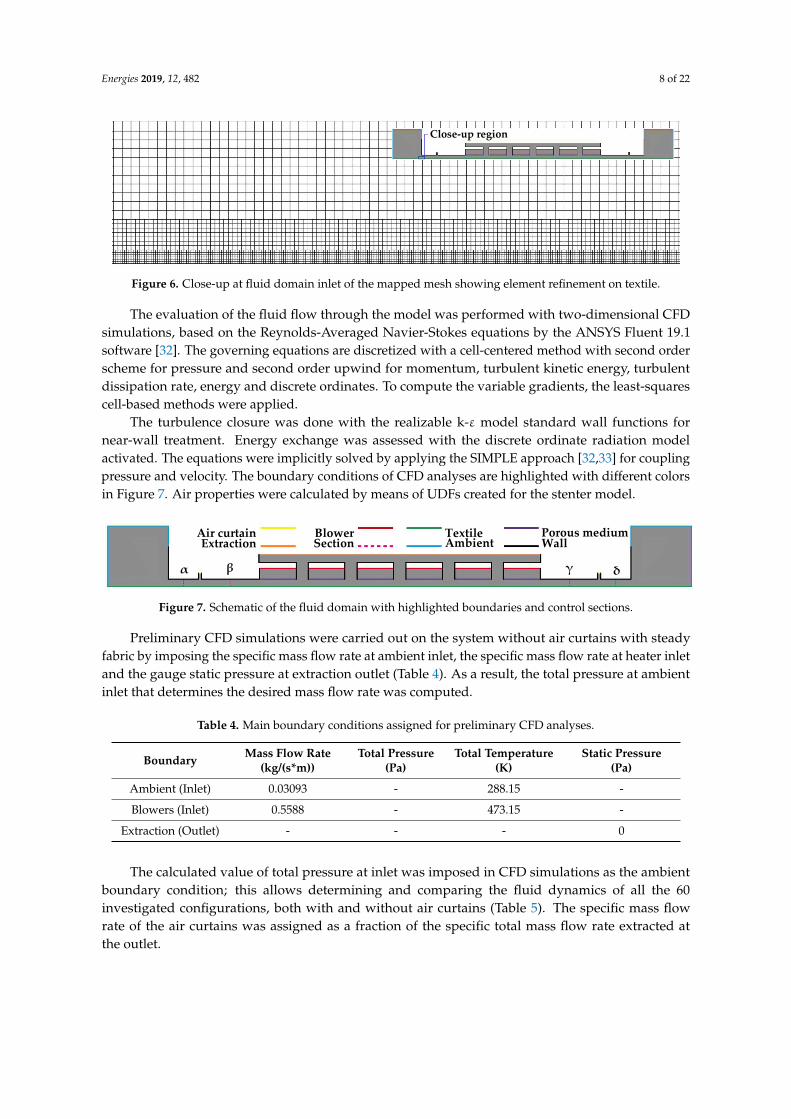
The spatial discretization method utilized in the numerical setup is the finite volume withcell-centered approach. A mapped mesh with quadrilateral elements was generated to discretize thestenter schematic geometry. To assess computational grid independency, a mesh sensitivity analysiswas conducted by comparing the results of several diverse meshes with number of elements rangingfrom 50,000 to 1 million. Since the mesh sensitivity analysis showed a relevant influence of celldimensions around the fabric, an element refinement in its proximity was done for each grid. The finalgrid was defined as a compromise between accuracy and computational time: the selected meshwith 260,000 elements fulfils the fixed net mass flux accuracy criterion of 10−10 with respect to thespecific total mass flux of 0.06185 kg/(s·m). In Figure 6, a close-up of the mapped grid at domain inlethighlighting element structure and distribution is represented.
Energies 2019, 12, 482 8 of 22
Energies 2018, 11, x FOR PEER REVIEW 7 of 21
A porous media assumption was utilized to model the nozzle arrays through which the hot air reaches the main air-drying zone. The geometric parameters of the blowing boxes were selected to model the perforated plates as generally as possible (Table 2).
Table 2. Main geometric parameters of the hot air blowers.
Blower Number (-)
Plate Total Area (m2)
Plate Open Area (m2)
Plate Porosity (%)
12 0.7 0.0245 3.5
In Table 3, the coding rules for the several examined configurations are defined. For example, the code AC0CCMV40 identifies a configuration with two air curtains with tilt angle 0°, temperature 15 °C, intermediate flow ratio (5%) and textile speed of 40 m/min while the code NOACV0 states a configuration without air curtains and stationary fabric.
Table 3. Coding scheme based on the parameters from Table 1.
AC Tilt Angle AC Temperature AC/Ambient Flow Ratio Fabric Velocity
−15 0
+15
C L M H
V0 V20
W V40 V60
3.2. Numerical Setup
The spatial discretization method utilized in the numerical setup is the finite volume with cell-centered approach. A mapped mesh with quadrilateral elements was generated to discretize the stenter schematic geometry. To assess computational grid independency, a mesh sensitivity analysis was conducted by comparing the results of several diverse meshes with number of elements ranging from 50,000 to 1 million. Since the mesh sensitivity analysis showed a relevant influence of cell dimensions around the fabric, an element refinement in its proximity was done for each grid. The final grid was defined as a compromise between accuracy and computational time: the selected mesh with 260,000 elements fulfils the fixed net mass flux accuracy criterion of 10-10 with respect to the specific total mass flux of 0.06185 kg (s ∙ m)⁄ . In Figure 6, a close-up of the mapped grid at domain inlet highlighting element structure and distribution is represented.
Figure 6. Close-up at fluid domain inlet of the mapped mesh showing element refinement on textile.
The evaluation of the fluid flow through the model was performed with two-dimensional CFD simulations, based on the Reynolds-Averaged Navier-Stokes equations by the ANSYS Fluent 19.1 software [32]. The governing equations are discretized with a cell-centered method with second order scheme for pressure and second order upwind for momentum, turbulent kinetic energy, turbulent dissipation rate, energy and discrete ordinates. To compute the variable gradients, the least-squares cell-based methods were applied.
The turbulence closure was done with the realizable k-ε model standard wall functions for near-wall treatment. Energy exchange was assessed with the discrete ordinate radiation model activated. The equations were implicitly solved by applying the SIMPLE approach [32,33] for coupling pressure
Close-up region
Figure 6. Close-up at fluid domain inlet of the mapped mesh showing element refinement on textile.
The evaluation of the fluid flow through the model was performed with two-dimensional CFDsimulations, based on the Reynolds-Averaged Navier-Stokes equations by the ANSYS Fluent 19.1software [32]. The governing equations are discretized with a cell-centered method with second orderscheme for pressure and second order upwind for momentum, turbulent kinetic energy, turbulentdissipation rate, energy and discrete ordinates. To compute the variable gradients, the least-squarescell-based methods were applied.
The turbulence closure was done with the realizable k-ε model standard wall functions fornear-wall treatment. Energy exchange was assessed with the discrete ordinate radiation modelactivated. The equations were implicitly solved by applying the SIMPLE approach [32,33] for couplingpressure and velocity. The boundary conditions of CFD analyses are highlighted with different colorsin Figure 7. Air properties were calculated by means of UDFs created for the stenter model.
Energies 2018, 11, x FOR PEER REVIEW 8 of 21
and velocity. The boundary conditions of CFD analyses are highlighted with different colors in Figure 7. Air properties were calculated by means of UDFs created for the stenter model.
Figure 7. Schematic of the fluid domain with highlighted boundaries and control sections
Preliminary CFD simulations were carried out on the system without air curtains with steady fabric by imposing the specific mass flow rate at ambient inlet, the specific mass flow rate at heater inlet and the gauge static pressure at extraction outlet (Table 4). As a result, the total pressure at ambient inlet that determines the desired mass flow rate was computed.
Table 4. Main boundary conditions assigned for preliminary CFD analyses.
Boundary Mass Flow Rate
(kg/(s*m)) Total Pressure
(Pa) Total Temperature
(K) Static Pressure
(Pa) Ambient (Inlet) 0.03093 - 288.15 - Blowers (Inlet) 0.5588 - 473.15 -
Extraction (Outlet) - - - 0
The calculated value of total pressure at inlet was imposed in CFD simulations as the ambient boundary condition; this allows determining and comparing the fluid dynamics of all the 60 investigated configurations, both with and without air curtains (Table 5). The specific mass flow rate of the air curtains was assigned as a fraction of the specific total mass flow rate extracted at the outlet.
Table 5. Main boundary conditions assigned for CFD analyses.
Boundary Mass Flow Rate (kg/(s·m))
Total Pressure (Pa)
Total Temperature (K)
Static Pressure (Pa)
Ambient (Inlet) 2.71 288.15
Air curtains (Inlet) 0.01856 (3%) 0.03093 (5%) 0.04330 (7%)
- - -
288.15 or 343.15 288.15 or 343.15 288.15 or 343.15
- - -
Blowers (Inlet) 0.5588 - 473.15 - Extraction (Outlet) - - - 0
3.3. Performance Indicators
The evaluation of the global performance of the selected air curtains configurations is performed through the definition of a mass sealing effectiveness coefficient and an energy effectiveness coefficient, following a common practice in AC parametrization. The former states the sealing effectiveness of the air curtain in terms of air ingested from the ambient, while the latter states the AC effectiveness of energy recovery in terms of enthalpy. The mass sealing effectiveness coefficient (here reported as ξM) is calculated for each configuration equipped with air curtains as the ratio between the mass flow rate passing through a specific control section (CS) and the total mass flow rate exiting the air curtains:
𝜉 =
(1)
where �� and �� are the mass flow rates through the control section and the air curtain, respectively. The energy effectiveness coefficient (here reported as ξE) is calculated only for the configurations with warm fluid exiting from the ACs at 70 °C as the ratio between the sensible heat flow passing through a specific control section (CS) and the original sensible heat flow rate associated to the air curtain:
α β γ δ
Air curtain
Extraction
Blower
Section
Textile
Ambient
Porous medium
Wall
Figure 7. Schematic of the fluid domain with highlighted boundaries and control sections.
Preliminary CFD simulations were carried out on the system without air curtains with steadyfabric by imposing the specific mass flow rate at ambient inlet, the specific mass flow rate at heater inletand the gauge static pressure at extraction outlet (Table 4). As a result, the total pressure at ambientinlet that determines the desired mass flow rate was computed.
Table 4. Main boundary conditions assigned for preliminary CFD analyses.
Boundary Mass Flow Rate(kg/(s*m))
Total Pressure(Pa)
Total Temperature(K)
Static Pressure(Pa)
Ambient (Inlet) 0.03093 - 288.15 -
Blowers (Inlet) 0.5588 - 473.15 -
Extraction (Outlet) - - - 0
The calculated value of total pressure at inlet was imposed in CFD simulations as the ambientboundary condition; this allows determining and comparing the fluid dynamics of all the 60investigated configurations, both with and without air curtains (Table 5). The specific mass flowrate of the air curtains was assigned as a fraction of the specific total mass flow rate extracted atthe outlet.

Energies 2019, 12, 482 9 of 22
Table 5. Main boundary conditions assigned for CFD analyses.
Boundary Mass Flow Rate(kg/(s·m))
Total Pressure(Pa)
Total Temperature(K)
Static Pressure(Pa)
Ambient (Inlet) 2.71 288.15
Air curtains (Inlet)0.01856 (3%) - 288.15 or 343.15 -0.03093 (5%) - 288.15 or 343.15 -0.04330 (7%) - 288.15 or 343.15 -
Blowers (Inlet) 0.5588 - 473.15 -
Extraction (Outlet) - - - 0
3.3. Performance Indicators
The evaluation of the global performance of the selected air curtains configurations is performedthrough the definition of a mass sealing effectiveness coefficient and an energy effectiveness coefficient,following a common practice in AC parametrization. The former states the sealing effectiveness of theair curtain in terms of air ingested from the ambient, while the latter states the AC effectiveness ofenergy recovery in terms of enthalpy. The mass sealing effectiveness coefficient (here reported as ξM)is calculated for each configuration equipped with air curtains as the ratio between the mass flow ratepassing through a specific control section (CS) and the total mass flow rate exiting the air curtains:
ξM =
.mCS.
mAC(1)
where.
mCS and.
mAC are the mass flow rates through the control section and the air curtain, respectively.The energy effectiveness coefficient (here reported as ξE) is calculated only for the configurations withwarm fluid exiting from the ACs at 70 ◦C as the ratio between the sensible heat flow passing through aspecific control section (CS) and the original sensible heat flow rate associated to the air curtain:
ξE =
.mCSCpCS(TCS − TAmb).
mACCp AC(TAC − TAmb)= ξM
CpCS(TCS − TAmb)
Cp AC(TAC − TAmb)(2)
where CpCS and Cp AC are the specific heat capacities of the air flowing through the control section andthe air curtain and TCS, TAC and TAmb are the specific heat capacities of the air flowing through thecontrol section and the air curtain, respectively.
Four control sections were used, two on the left side of the blowing array and two on the right side,positioned at intermediate distance between each ambient opening and the air curtain and betweeneach air curtain and the blowing array. The control sections (α, β, γ, δ from left to right) are shownwith dashed lines in Figure 7. For each control section the mass sealing effectiveness coefficient andthe energy effectiveness coefficient was calculated.
The target values for ξM are the null value for the control section α and δ, that implies perfectsealing, and 0.5 for control sections β and γ, which indicates that the full mass flow rate of the aircurtains at machine inlet and outlet respectively is directed inwards. Values of ξM higher than theseindicate that net flow is entering the stenter, while lower values indicate that net flow is exiting thestenter. By analogy, the targets for ξE are zero for control sections α and δ and 0.5 for control sections βand γ to ensure a full exploitation of the air curtain energy input; positive values of ξE indicate energyrecovery, while negative values represent a waste of energy.

Energies 2019, 12, 482 10 of 22
4. Results
4.1. Mass Sealing Effectiveness
The mass sealing effectiveness coefficient (ξM) corresponding to the four control sections ispresented in function of the AC tilt angle and of the fabric velocity for the three investigated massflow rates.
The tilt angle configurations are presented in orange (−15◦, dotted line), green (0◦, dashed line)and violet (+15◦, dash-dotted line), with blue pointers for an AC temperature of 15 ◦C and red pointersfor 70◦C. In Figure 8 the control section α is considered and it is noticeable that an increase of massflow rate from 3% to 5% corresponds to a global decrease of ξM for each fabric speed; a further increaseof AC mass flow rate (up to 7%) reduces furtherly the ξM value, but a limited amount of flow leakageacross the machine inlet section at the lowest fabric speed appears (negative ξM values). The resultsobtained for the section β (Figure 9) are a consequence of this behavior and indicate that for the highestmass flow rate, with fabric moving at 20 m/min, the air curtain flow is partially directed outside of thestenter, while for all the other configurations it is moved towards into the machine.
Energies 2018, 11, x FOR PEER REVIEW 9 of 21
𝜉 = ( )
( )= 𝜉
( )
( ) (2)
where 𝐶 and 𝐶 are the specific heat capacities of the air flowing through the control section and the air curtain and 𝑇 , 𝑇 and 𝑇 are the specific heat capacities of the air flowing through the control section and the air curtain, respectively.
Four control sections were used, two on the left side of the blowing array and two on the right side, positioned at intermediate distance between each ambient opening and the air curtain and between each air curtain and the blowing array. The control sections (α, β, γ, δ from left to right) are shown with dashed lines in Figure 7. For each control section the mass sealing effectiveness coefficient and the energy effectiveness coefficient was calculated.
The target values for ξM are the null value for the control section α and δ, that implies perfect sealing, and 0.5 for control sections β and γ, which indicates that the full mass flow rate of the air curtains at machine inlet and outlet respectively is directed inwards. Values of ξM higher than these indicate that net flow is entering the stenter, while lower values indicate that net flow is exiting the stenter. By analogy, the targets for ξE are zero for control sections α and δ and 0.5 for control sections β and γ to ensure a full exploitation of the air curtain energy input; positive values of ξE indicate energy recovery, while negative values represent a waste of energy.
4. Results
4.1. Mass Sealing Effectiveness
The mass sealing effectiveness coefficient (ξM) corresponding to the four control sections is presented in function of the AC tilt angle and of the fabric velocity for the three investigated mass flow rates.
The tilt angle configurations are presented in orange (−15°, dotted line), green (0°, dashed line) and violet (+15°, dash-dotted line), with blue pointers for an AC temperature of 15 °C and red pointers for 70°C. In Figure 8 the control section α is considered and it is noticeable that an increase of mass flow rate from 3% to 5% corresponds to a global decrease of ξM for each fabric speed; a further increase of AC mass flow rate (up to 7%) reduces furtherly the ξM value, but a limited amount of flow leakage across the machine inlet section at the lowest fabric speed appears (negative ξM values). The results obtained for the section β (Figure 9) are a consequence of this behavior and indicate that for the highest mass flow rate, with fabric moving at 20 m/min, the air curtain flow is partially directed outside of the stenter, while for all the other configurations it is moved towards into the machine.
(a) (b)
Energies 2018, 11, x FOR PEER REVIEW 10 of 21
Figure 8. Mass sealing effectiveness coefficient at section α for AC mass flow (a) 3%; (b) 5%; (c) 7%.
In Figure 10, the values of ξM on section γ indicate that the sealing efficiency of the air curtains decreases with increasing AC mass flow rate, as the fraction of air entrained by the fabric rises. The mass sealing effectiveness coefficients computed on section δ (Figure 11) indicate that the air curtains can seal the machine outlet only at the lowest fabric speed, when the lowest AC mass flow rate is used; for all the other configurations ξM is negative and thus the ACs are unable to provide sealing.
As a general comment on the computational fluid dynamics results, it can be immediately observed that the efficiency and effectiveness of the air curtains mainly depend on the AC temperature and mass flow rate, while the reliance on the AC tilt angle is limited to the impact of the energy effectiveness coefficient for a few specific configurations. Detailed comments on the obtained results follow.
Figure 9. Mass sealing effectiveness coefficient at section β for AC mass flow (a) 3%; (b) 5%; (c) 7%.
(c)
(a) (b)
(c)
Figure 8. Mass sealing effectiveness coefficient at section α for AC mass flow (a) 3%; (b) 5%; (c) 7%.

Energies 2019, 12, 482 11 of 22
Energies 2018, 11, x FOR PEER REVIEW 10 of 21
Figure 8. Mass sealing effectiveness coefficient at section α for AC mass flow (a) 3%; (b) 5%; (c) 7%.
In Figure 10, the values of ξM on section γ indicate that the sealing efficiency of the air curtains decreases with increasing AC mass flow rate, as the fraction of air entrained by the fabric rises. The mass sealing effectiveness coefficients computed on section δ (Figure 11) indicate that the air curtains can seal the machine outlet only at the lowest fabric speed, when the lowest AC mass flow rate is used; for all the other configurations ξM is negative and thus the ACs are unable to provide sealing.
As a general comment on the computational fluid dynamics results, it can be immediately observed that the efficiency and effectiveness of the air curtains mainly depend on the AC temperature and mass flow rate, while the reliance on the AC tilt angle is limited to the impact of the energy effectiveness coefficient for a few specific configurations. Detailed comments on the obtained results follow.
Figure 9. Mass sealing effectiveness coefficient at section β for AC mass flow (a) 3%; (b) 5%; (c) 7%.
(c)
(a) (b)
(c)
Figure 9. Mass sealing effectiveness coefficient at section β for AC mass flow (a) 3%; (b) 5%; (c) 7%.
In Figure 10, the values of ξM on section γ indicate that the sealing efficiency of the air curtainsdecreases with increasing AC mass flow rate, as the fraction of air entrained by the fabric rises. Themass sealing effectiveness coefficients computed on section δ (Figure 11) indicate that the air curtainscan seal the machine outlet only at the lowest fabric speed, when the lowest AC mass flow rate is used;for all the other configurations ξM is negative and thus the ACs are unable to provide sealing.
As a general comment on the computational fluid dynamics results, it can be immediatelyobserved that the efficiency and effectiveness of the air curtains mainly depend on the AC temperatureand mass flow rate, while the reliance on the AC tilt angle is limited to the impact of the energyeffectiveness coefficient for a few specific configurations. Detailed comments on the obtainedresults follow.
The results achieved for the mass sealing effectiveness coefficients show that the tilt angle of theair curtains has negligible effects on sealing, while the ratio between the mass flow rate of the aircurtains and that of the air that would leak towards the ambient in absence of ACs has a key role. Aircurtains with low mass flow rate are not useful for sealing the machine openings both at inlet and atoutlet and they are only capable of reducing the suction effect. The sealing effect becomes significantwhen their mass flow rate is equal to the mass flow rate that would be ingested from the surroundingsin absence of air curtains. Higher values of mass flow rate would result in a better sealing, but thesealing effectiveness would be worse as indicated by lower values of the related coefficients.

Energies 2019, 12, 482 12 of 22Energies 2018, 11, x FOR PEER REVIEW 11 of 21
Figure 10. Mass sealing effectiveness coefficient at section γ for AC mass flow (a) 3%; (b) 5%; (c) 7%.
Figure 11. Mass sealing effectiveness coefficient at section δ for AC mass flow (a) 3%; (b) 5%; (c) 7%.
(a) (b)
(c)
(a) (b)
(c)
Figure 10. Mass sealing effectiveness coefficient at section γ for AC mass flow (a) 3%; (b) 5%; (c) 7%.
Energies 2018, 11, x FOR PEER REVIEW 11 of 21
Figure 10. Mass sealing effectiveness coefficient at section γ for AC mass flow (a) 3%; (b) 5%; (c) 7%.
Figure 11. Mass sealing effectiveness coefficient at section δ for AC mass flow (a) 3%; (b) 5%; (c) 7%.
(a) (b)
(c)
(a) (b)
(c)
Figure 11. Mass sealing effectiveness coefficient at section δ for AC mass flow (a) 3%; (b) 5%; (c) 7%.

Energies 2019, 12, 482 13 of 22
4.2. Energy Effectiveness
The energy effectiveness coefficient (ξE) is represented for the tilt angles −15◦, 0◦ and +15◦ withorange (dotted), green (dashed) and violet (dash-dotted) lines respectively only for an AC temperatureof 70◦C as the purpose is to assess heat recovery potential.
Figure 12 shows that the use of warm air at machine inlet is beneficial for increasing the heatrecovery inside of the stenter. In cases (a) and (b) with 3% and 5% of AC mass flow, respectively,the entire mass flow rate of the air curtains is ingested by the machine for each fabric speed, withpositive effects on the effectiveness of heat recovery. This means that higher values of this parameterare observed for the increasing values of the fabric velocity. For the case (c) with 7% of AC mass flowrate, a positive value of ξE is obtained only at the highest fabric speed, while for lower velocities ξE isnegative due to partial leakage of the AC mass flow rate.
Energies 2018, 11, x FOR PEER REVIEW 12 of 21
The results achieved for the mass sealing effectiveness coefficients show that the tilt angle of the air curtains has negligible effects on sealing, while the ratio between the mass flow rate of the air curtains and that of the air that would leak towards the ambient in absence of ACs has a key role. Air curtains with low mass flow rate are not useful for sealing the machine openings both at inlet and at outlet and they are only capable of reducing the suction effect. The sealing effect becomes significant when their mass flow rate is equal to the mass flow rate that would be ingested from the surroundings in absence of air curtains. Higher values of mass flow rate would result in a better sealing, but the sealing effectiveness would be worse as indicated by lower values of the related coefficients.
4.2. Energy Effectiveness
The energy effectiveness coefficient (ξE) is represented for the tilt angles −15°, 0° and +15° with orange (dotted), green (dashed) and violet (dash-dotted) lines respectively only for an AC temperature of 70°C as the purpose is to assess heat recovery potential.
Figure 12 shows that the use of warm air at machine inlet is beneficial for increasing the heat recovery inside of the stenter. In cases (a) and (b) with 3% and 5% of AC mass flow, respectively, the entire mass flow rate of the air curtains is ingested by the machine for each fabric speed, with positive effects on the effectiveness of heat recovery. This means that higher values of this parameter are observed for the increasing values of the fabric velocity. For the case (c) with 7% of AC mass flow rate, a positive value of ξE is obtained only at the highest fabric speed, while for lower velocities ξE is negative due to partial leakage of the AC mass flow rate.
Figure 12. Energy effectiveness coefficient at section α for AC mass flow inlet (a) 3%; (b) 5%; (c) 7%.
In Figure 13, it is noticeable that the tilt angle of the air curtains influences the energy effectiveness. The highest values of the ξE are obtained with zero tilt angle air curtains. Nonetheless, that influence is reduced at higher fabric speed and higher AC mass flow rate. At the machine outlet, on section γ (Figure 14), it is evident that the warm air of the air curtains is not correctly recovered. In fact, in most of the cases the ξE value is close to 0 or lower when the textile velocity is medium or
(a) (b)
(c)
Figure 12. Energy effectiveness coefficient at section α for AC mass flow inlet (a) 3%; (b) 5%; (c) 7%.
In Figure 13, it is noticeable that the tilt angle of the air curtains influences the energy effectiveness.The highest values of the ξE are obtained with zero tilt angle air curtains. Nonetheless, that influenceis reduced at higher fabric speed and higher AC mass flow rate. At the machine outlet, on section γ(Figure 14), it is evident that the warm air of the air curtains is not correctly recovered. In fact, in most ofthe cases the ξE value is close to 0 or lower when the textile velocity is medium or high, while a positiveoutcome is visible for low AC flow rates at low fabric velocity. The energy effectiveness coefficients atsection δ in Figure 15 confirm this trend with even lower values, thus demonstrating that the heatedair is wasted at the machine outlet due to the action of the moving fabric. This clearly indicates that,for the outlet sections, air curtains at ambient temperature, or even the absence of ACs, could bepreferred, as the heat recovered would be dispersed in the surrounding environment. The data statethat a configuration with air curtains with tilt angles 0◦ or +15◦ and warm jets (70 ◦C) and a massflow rate equal to the mass flow rate that would be ingested from the surroundings without these

Energies 2019, 12, 482 14 of 22
devices, provides the best effects. However, at the highest fabric velocity analyzed, a cold air curtain atmachine outlet has better parameters. For this reason and to assess the possibility of a reduction ofregenerative heat demand, even a mixed configuration with a warm inlet AC (70◦C) and a cold outletAC (15 ◦C) was analyzed. Since tilted air curtains would imply higher manufacturing complexitiesthan vertical orientation, without significant improvements, only null tilt angles were considered.
Energies 2018, 11, x FOR PEER REVIEW 13 of 21
high, while a positive outcome is visible for low AC flow rates at low fabric velocity. The energy effectiveness coefficients at section δ in Figure 15 confirm this trend with even lower values, thus demonstrating that the heated air is wasted at the machine outlet due to the action of the moving fabric. This clearly indicates that, for the outlet sections, air curtains at ambient temperature, or even the absence of ACs, could be preferred, as the heat recovered would be dispersed in the surrounding environment. The data state that a configuration with air curtains with tilt angles 0° or +15° and warm jets (70 °C) and a mass flow rate equal to the mass flow rate that would be ingested from the surroundings without these devices, provides the best effects. However, at the highest fabric velocity analyzed, a cold air curtain at machine outlet has better parameters. For this reason and to assess the possibility of a reduction of regenerative heat demand, even a mixed configuration with a warm inlet AC (70°C) and a cold outlet AC (15 °C) was analyzed. Since tilted air curtains would imply higher manufacturing complexities than vertical orientation, without significant improvements, only null tilt angles were considered.
Figure 13. Energy effectiveness coefficient at section β for AC mass flow inlet (a) 3%; (b) 5%; (c) 7%.
(a) (b)
(c)
(a) (b)
Figure 13. Energy effectiveness coefficient at section β for AC mass flow inlet (a) 3%; (b) 5%; (c) 7%.
Energies 2018, 11, x FOR PEER REVIEW 13 of 21
high, while a positive outcome is visible for low AC flow rates at low fabric velocity. The energy effectiveness coefficients at section δ in Figure 15 confirm this trend with even lower values, thus demonstrating that the heated air is wasted at the machine outlet due to the action of the moving fabric. This clearly indicates that, for the outlet sections, air curtains at ambient temperature, or even the absence of ACs, could be preferred, as the heat recovered would be dispersed in the surrounding environment. The data state that a configuration with air curtains with tilt angles 0° or +15° and warm jets (70 °C) and a mass flow rate equal to the mass flow rate that would be ingested from the surroundings without these devices, provides the best effects. However, at the highest fabric velocity analyzed, a cold air curtain at machine outlet has better parameters. For this reason and to assess the possibility of a reduction of regenerative heat demand, even a mixed configuration with a warm inlet AC (70°C) and a cold outlet AC (15 °C) was analyzed. Since tilted air curtains would imply higher manufacturing complexities than vertical orientation, without significant improvements, only null tilt angles were considered.
Figure 13. Energy effectiveness coefficient at section β for AC mass flow inlet (a) 3%; (b) 5%; (c) 7%.
(a) (b)
(c)
(a) (b)
Figure 14. Cont.

Energies 2019, 12, 482 15 of 22Energies 2018, 11, x FOR PEER REVIEW 14 of 21
Figure 14. Energy effectiveness coefficient at section γ for AC mass flow inlet (a) 3%; (b) 5%; (c) 7%.
Figure 15. Energy effectiveness coefficient at section δ for AC mass flow inlet (a) 3%; (b) 5%; (c) 7%.
In Table 6 and Table 7, the mass sealing effectiveness coefficient and the energy effectiveness coefficient of this configuration are enumerated and compared with those of the similar configuration with both warm air curtains. This implies that a correct selection of AC mass flow rate is fundamental to reach the optimal sealing effect, to prevent the leakage of air both for protection of the workplace environment and to avoid the waste of the warm flow of the air curtains.
Table 6. Mass sealing effectiveness coefficient of the two best air curtain configurations.
Configuration ξE for CS α (-) ξE for CS β (-) ξE for CS ϒ (-) ξE for CS δ (-) AC0WWMV20 0.09 0.59 0.28 −0.22 AC0WWMV40 0.20 0.70 0.05 −0.45 AC0WWMV60 0.30 0.80 −0.17 −0.67 AC0WCMV20 0.08 0.57 0.36 −0.14 AC0WCMV40 0.19 0.69 0.18 −0.32 AC0WCMV40 0.28 0.78 0.01 −0.49
(c)
(a) (b)
(c)
Figure 14. Energy effectiveness coefficient at section γ for AC mass flow inlet (a) 3%; (b) 5%; (c) 7%.
Energies 2018, 11, x FOR PEER REVIEW 14 of 21
Figure 14. Energy effectiveness coefficient at section γ for AC mass flow inlet (a) 3%; (b) 5%; (c) 7%.
Figure 15. Energy effectiveness coefficient at section δ for AC mass flow inlet (a) 3%; (b) 5%; (c) 7%.
In Table 6 and Table 7, the mass sealing effectiveness coefficient and the energy effectiveness coefficient of this configuration are enumerated and compared with those of the similar configuration with both warm air curtains. This implies that a correct selection of AC mass flow rate is fundamental to reach the optimal sealing effect, to prevent the leakage of air both for protection of the workplace environment and to avoid the waste of the warm flow of the air curtains.
Table 6. Mass sealing effectiveness coefficient of the two best air curtain configurations.
Configuration ξE for CS α (-) ξE for CS β (-) ξE for CS ϒ (-) ξE for CS δ (-) AC0WWMV20 0.09 0.59 0.28 −0.22 AC0WWMV40 0.20 0.70 0.05 −0.45 AC0WWMV60 0.30 0.80 −0.17 −0.67 AC0WCMV20 0.08 0.57 0.36 −0.14 AC0WCMV40 0.19 0.69 0.18 −0.32 AC0WCMV40 0.28 0.78 0.01 −0.49
(c)
(a) (b)
(c)
Figure 15. Energy effectiveness coefficient at section δ for AC mass flow inlet (a) 3%; (b) 5%; (c) 7%.
In Tables 6 and 7, the mass sealing effectiveness coefficient and the energy effectiveness coefficientof this configuration are enumerated and compared with those of the similar configuration with bothwarm air curtains. This implies that a correct selection of AC mass flow rate is fundamental to reach theoptimal sealing effect, to prevent the leakage of air both for protection of the workplace environmentand to avoid the waste of the warm flow of the air curtains.

Energies 2019, 12, 482 16 of 22
Table 6. Mass sealing effectiveness coefficient of the two best air curtain configurations.
Configuration ξE for CS α (-) ξE for CS β (-) ξE for CS γ (-) ξE for CS δ (-)
AC0WWMV20 0.09 0.59 0.28 −0.22AC0WWMV40 0.20 0.70 0.05 −0.45AC0WWMV60 0.30 0.80 −0.17 −0.67AC0WCMV20 0.08 0.57 0.36 −0.14AC0WCMV40 0.19 0.69 0.18 −0.32AC0WCMV40 0.28 0.78 0.01 −0.49
Table 7. Energy effectiveness coefficient of the two best air curtain configurations.
Configuration ξE for CS α (-) ξE for CS β (-) ξE for CS γ (-) ξE for CS δ (-)
AC0WWMV20 0.02 0.51 0.30 −0.22AC0WWMV40 0.05 0.55 0.08 −0.46AC0WWMV60 0.07 0.58 −0.57 −1.01AC0WCMV20 0.02 0.49 - -AC0WCMV40 0.04 0.51 - -AC0WCMV40 0.05 0.52 - -
4.3. Temperature Distribution
The air curtains have relevant effects on the temperature distribution inside the stenter at all theinvestigated fabric speeds. To assess these effects, the adiabatic wall effectiveness coefficient ηAW wascalculated:
ηAW =T − T0,Blowers
T0,AC − T0,Blowers(3)
where T is the variable temperature and T0,Blowers and T0,AC are the reference temperatures of theblowers (200◦C) and of the air curtains (70 ◦C), respectively. The ηAW coefficient is borrowed from theturbomachinery field, where it is used to evaluate the cooling effectiveness of jets in cross-flow [34].Here it indicates the behavior of air curtains flow and the temperature of air surrounding the fabric,considering adiabatic wall conditions. Null values of ηAW mean that the air has the same temperature ofthe blowers and unitary values state that air has the same temperature of the air curtain; values rangingfrom 0 and 1 are related to intermediate temperatures, while values greater than 1 denote temperatureslower than that of air curtains (generated by the presence of air ingested from the ambient).
In Figures 16–19, the ηAW coefficient distribution of the reference configuration without aircurtains (NOAC) is compared with that of the two best configurations identified, with air curtains ofzero tilt angle and mass flow rate 5% in both cases and warm jets (AC0WWM) or warm and cold jets(AC0WCM). The color map is limited between 0 and 1 to clearly underline the interaction between theblowers and the air curtains, while the regions where an impact of the ambient flow is foreseen (ηAWgreater than 1) are in white. The solid line in black represents the ηAW distribution on the fabric.
Energies 2018, 11, x FOR PEER REVIEW 15 of 21
Table 7. Energy effectiveness coefficient of the two best air curtain configurations.
Configuration ξE for CS α (-) ξE for CS β (-) ξE for CS ϒ (-) ξE for CS δ (-) AC0WWMV20 0.02 0.51 0.30 −0.22 AC0WWMV40 0.05 0.55 0.08 −0.46 AC0WWMV60 0.07 0.58 −0.57 −1.01 AC0WCMV20 0.02 0.49 - - AC0WCMV40 0.04 0.51 - - AC0WCMV40 0.05 0.52 - -
4.3. Temperature Distribution
The air curtains have relevant effects on the temperature distribution inside the stenter at all the investigated fabric speeds. To assess these effects, the adiabatic wall effectiveness coefficient ηAW was calculated:
𝜂 =𝑇 − 𝑇 ,
𝑇 , − 𝑇 ,
(3)
where 𝑇 is the variable temperature and 𝑇 , and 𝑇 , are the reference temperatures of the blowers (200°C) and of the air curtains (70 °C), respectively. The ηAW coefficient is borrowed from the turbomachinery field, where it is used to evaluate the cooling effectiveness of jets in cross-flow [34]. Here it indicates the behavior of air curtains flow and the temperature of air surrounding the fabric, considering adiabatic wall conditions. Null values of ηAW mean that the air has the same temperature of the blowers and unitary values state that air has the same temperature of the air curtain; values ranging from 0 and 1 are related to intermediate temperatures, while values greater than 1 denote temperatures lower than that of air curtains (generated by the presence of air ingested from the ambient).
In Figures 16–19, the ηAW coefficient distribution of the reference configuration without air curtains (NOAC) is compared with that of the two best configurations identified, with air curtains of zero tilt angle and mass flow rate 5% in both cases and warm jets (AC0WWM) or warm and cold jets (AC0WCM). The color map is limited between 0 and 1 to clearly underline the interaction between the blowers and the air curtains, while the regions where an impact of the ambient flow is foreseen (ηAW greater than 1) are in white. The solid line in black represents the ηAW distribution on the fabric.
V0 NO AC
Figure 16. Adiabatic wall effectiveness coefficient distribution for the reference configuration without air curtains and the best configuration with warm air curtains, at 20 m/min fabric speed.
In general, an effective configuration should show a ηAW line that reaches the unitary values in correspondence of the AC positions. A ηAW line that does not reach the unitary value at the stenter outlet marks a configuration where warm air is wasted outside of the machine. As a general comment on the results, at the stenter inlet, the air curtains allow for a progressive heating of the fabric for each operating condition analyzed; the central part of the cavity is not considerably affected by air flows other than the blower jets; at the stenter outlet the behavior significantly depends on fabric speed.
Figure 16. Adiabatic wall effectiveness coefficient distribution for the reference configuration withoutair curtains and the best configuration with warm air curtains, at 20 m/min fabric speed.

Energies 2019, 12, 482 17 of 22
In general, an effective configuration should show a ηAW line that reaches the unitary values incorrespondence of the AC positions. A ηAW line that does not reach the unitary value at the stenteroutlet marks a configuration where warm air is wasted outside of the machine. As a general commenton the results, at the stenter inlet, the air curtains allow for a progressive heating of the fabric for eachoperating condition analyzed; the central part of the cavity is not considerably affected by air flowsother than the blower jets; at the stenter outlet the behavior significantly depends on fabric speed.
Figure 16 illustrates the symmetrical distribution of ηAW for the reference configuration withoutair curtains when fabric is steady. In this reference case, the negative influence of cold air entranceis clearly visible, as part of the ambient flow is mixed with the warm air from the blowers. Thecomparison between the reference case without air curtains at 20 m/min fabric speed and the twobest configurations with ACs (Figure 17) shows the beneficial impact of these devices. At stenter inlet,the presence of a warm air curtain determines a negligible variation of the ηAW field, but its valueon the fabric results to be lower (from 0.55 to 0.45), thus demonstrating that in this case the AC flowsubstitutes the ambient flow, ensuring a good sealing efficiency.
Energies 2018, 11, x FOR PEER REVIEW 16 of 21
Figure 16 illustrates the symmetrical distribution of ηAW for the reference configuration without air curtains when fabric is steady. In this reference case, the negative influence of cold air entrance is clearly visible, as part of the ambient flow is mixed with the warm air from the blowers. The comparison between the reference case without air curtains at 20 m/min fabric speed and the two best configurations with ACs (Figure 17) shows the beneficial impact of these devices. At stenter inlet, the presence of a warm air curtain determines a negligible variation of the ηAW field, but its value on the fabric results to be lower (from 0.55 to 0.45), thus demonstrating that in this case the AC flow substitutes the ambient flow, ensuring a good sealing efficiency.
V20
NO AC
AC 0°
W-W
AC 0°
W-C
Figure 17. Adiabatic wall effectiveness coefficient distribution for the reference configuration without air curtains and the best configuration with warm air curtains, at 20 m/min fabric speed.
At the stenter outlet, a warm air curtain (b) seems to be preferable to a cold one (c) as the effect of suction caused by the negative pressure difference between the cavity and the environment, overrides the effect of entrainment due to fabric motion. This outcome is supported by the slowest growth of the ηAW curve on the fabric, which reaches the unitary value in correspondence of the AC slot and has lower average values, and by the fact that the injected warm air from the AC is not wasted in the ambient.
Figure 18 denotes that the use of air curtains provides some benefits for the fabric, even if its speed rises to 40 m/min. In fact, the distribution of ηAW for the warm case shows values around the unit, also after the AC section due to the entrainment of air towards the ambient. This configuration (b) is positive for the drying process because of higher and more uniform temperatures, but the increased fabric speed makes the sealing action of the AC at the stenter outlet less effective. Instead, the use of cold air from the AC positioned near the stenter outlet (c) generates a ηAW map like that obtained without ACs (a), thus suggesting that with this configuration there is no waste of energy and that a certain amount of sealing can be obtained also for high fabric speeds.
a)
b)
c)
Figure 17. Adiabatic wall effectiveness coefficient distribution for the reference configuration withoutair curtains and the best configuration with warm air curtains, at 20 m/min fabric speed.
At the stenter outlet, a warm air curtain (b) seems to be preferable to a cold one (c) as the effect ofsuction caused by the negative pressure difference between the cavity and the environment, overridesthe effect of entrainment due to fabric motion. This outcome is supported by the slowest growth ofthe ηAW curve on the fabric, which reaches the unitary value in correspondence of the AC slot andhas lower average values, and by the fact that the injected warm air from the AC is not wasted inthe ambient.
Figure 18 denotes that the use of air curtains provides some benefits for the fabric, even if itsspeed rises to 40 m/min. In fact, the distribution of ηAW for the warm case shows values around theunit, also after the AC section due to the entrainment of air towards the ambient. This configuration (b)is positive for the drying process because of higher and more uniform temperatures, but the increased

Energies 2019, 12, 482 18 of 22
fabric speed makes the sealing action of the AC at the stenter outlet less effective. Instead, the useof cold air from the AC positioned near the stenter outlet (c) generates a ηAW map like that obtainedwithout ACs (a), thus suggesting that with this configuration there is no waste of energy and that acertain amount of sealing can be obtained also for high fabric speeds.
Energies 2018, 11, x FOR PEER REVIEW 17 of 21
V40
NO AC
AC 0°
W-W
AC 0°
W-C
Figure 18. Adiabatic wall effectiveness coefficient distribution for the reference configuration without air curtains and the best configuration with warm air curtains, at 40 m/min fabric speed.
In Figure 19, the worst scenario is represented. In the absence of air curtains (a), it is clearly visible that the fabric is subject to a low ηAW value for a great portion of the machine due to a strong entrainment. Although that configuration could be of interest for the fabric warming, a significant amount of hot air exits from the outlet opening and the energy efficiency is greatly reduced. The use of a double-warm air curtain configuration (b) allows for a slight decrease of the ηAW values near the stenter outlet (also on the fabric) but the warm flow from the AC is still wasted, as the flow is almost completely entrained towards the exit section. The configuration with the mixed warm-cold air curtains (c) reduces the portion of fabric that is subject to high temperatures, but at the same time is preferable for its higher sealing efficiency (also indicated by the mass sealing effectiveness coefficient closer to zero at control section γ shown in Figure 14) and for its increased thermal efficiency, as there is no waste of energy towards the ambient.
A further analysis of the temperature distribution of the stenter cavity was carried out on a control rectangular area, positioned between the control sections β and γ of Figure 7. The average temperature, the temperature ratio and the mass flow rate ratios were calculated to compare the reference configuration without air curtains and the two best configurations with air curtains (Table 8).
By comparing the average temperatures and the temperature ratios, it is noticeable that the use of air curtains is more effective at low fabric speed and that the configuration with two warm air curtains ensures a higher temperature field as expected. The comparison of the mass flow rate ratios at control section β confirms that both AC configurations have excellent sealing effects. At control section ϒ it is interesting to note that this parameter quantifies the outcomes of the ηAW maps: for a fabric moving at 20 m/min and 40 m/min a warm air curtain provides better results, while at 60 m/min a cold air curtain is preferable.
a)
b)
c)
Figure 18. Adiabatic wall effectiveness coefficient distribution for the reference configuration withoutair curtains and the best configuration with warm air curtains, at 40 m/min fabric speed.
In Figure 19, the worst scenario is represented. In the absence of air curtains (a), it is clearlyvisible that the fabric is subject to a low ηAW value for a great portion of the machine due to a strongentrainment. Although that configuration could be of interest for the fabric warming, a significantamount of hot air exits from the outlet opening and the energy efficiency is greatly reduced. The useof a double-warm air curtain configuration (b) allows for a slight decrease of the ηAW values nearthe stenter outlet (also on the fabric) but the warm flow from the AC is still wasted, as the flow isalmost completely entrained towards the exit section. The configuration with the mixed warm-cold aircurtains (c) reduces the portion of fabric that is subject to high temperatures, but at the same time ispreferable for its higher sealing efficiency (also indicated by the mass sealing effectiveness coefficientcloser to zero at control section γ shown in Figure 14) and for its increased thermal efficiency, as thereis no waste of energy towards the ambient.
A further analysis of the temperature distribution of the stenter cavity was carried out on acontrol rectangular area, positioned between the control sections β and γ of Figure 7. The averagetemperature, the temperature ratio and the mass flow rate ratios were calculated to compare thereference configuration without air curtains and the two best configurations with air curtains (Table 8).
By comparing the average temperatures and the temperature ratios, it is noticeable that the use ofair curtains is more effective at low fabric speed and that the configuration with two warm air curtainsensures a higher temperature field as expected. The comparison of the mass flow rate ratios at controlsection β confirms that both AC configurations have excellent sealing effects. At control section γ it isinteresting to note that this parameter quantifies the outcomes of the ηAW maps: for a fabric moving

Energies 2019, 12, 482 19 of 22
at 20 m/min and 40 m/min a warm air curtain provides better results, while at 60 m/min a cold aircurtain is preferable.
Energies 2018, 11, x FOR PEER REVIEW 18 of 21
V60
NO AC
AC 0°
W-W
AC 0°
W-C
Figure 19. Adiabatic wall effectiveness coefficient distribution for the reference configuration without air curtains and the best configuration with warm air curtains, at 60 m/min fabric speed.
Table 8. Comparison of temperature fields and mass flow rates.
Configuration Average Temperature (K)
Temperature Ratio (-)
Mass Flow Rate ratio at CS β (-)
Mass Flow Rate Ratio at CS γ (-)
𝑻𝑨𝑪 − 𝑻𝑨𝑴𝑩
𝑻𝑵𝑶𝑨𝑪 − 𝑻𝑨𝑴𝑩
��𝒘𝒊𝒕𝒉𝑨𝑪
��𝑵𝑶𝑨𝑪
��𝒘𝒊𝒕𝒉𝑨𝑪
��𝑵𝑶𝑨𝑪
NOACV20 440.53 - - - NOACV40 442.05 - - - NOACV60 443.67 - - -
AC0WWMV20 451.65 11.12 0.96 0.78 AC0WWMV40 452.14 10.09 0.98 0.27 AC0WWMV60 453.51 9.84 0.96 2.03 AC0WCMV20 446.94 6.40 0.94 1.01 AC0WCMV40 448.31 6.26 0.96 1.03 AC0WCMV60 449.17 5.50 0.93 −0.16
4. Conclusions
The novelty of the solution proposed is using the air curtains both as an insulation and as a heat recovery device. The evaluation of the benefits of using air curtains in stenter machines was performed by means of computational fluid dynamics, applying a simplified 2-D model. A wide range of configurations including AC mass flow rate and temperature, fabric velocity as well as different geometrical configurations of the ACs were analyzed. The results state that the installation of the proposed regenerative ACs should allow an appreciable improvement of the machine performance, with reduction of burner heat supply and humid polluted air dispersion to the surrounding environment, limitation of air ingestion from outside and a proper distribution of air temperature around the fabric.
The key design parameters obtained in this study are the following: the AC configuration with 0° of tilt, mass flow rate 5% and two warm jets (70 °C) provides the best results for fabric speeds of
a)
b)
c)
Figure 19. Adiabatic wall effectiveness coefficient distribution for the reference configuration withoutair curtains and the best configuration with warm air curtains, at 60 m/min fabric speed.
Table 8. Comparison of temperature fields and mass flow rates.
Configuration AverageTemperature (K)
Temperature Ratio(-)
Mass Flow Rateratio at CS β (-)
Mass Flow RateRatio at CS γ (-)
¯TAC−TAMB
¯TNOAC−TAMB
.mwithAC.mNOAC
.mwithAC.mNOAC
NOACV20 440.53 - - -NOACV40 442.05 - - -NOACV60 443.67 - - -
AC0WWMV20 451.65 11.12 0.96 0.78AC0WWMV40 452.14 10.09 0.98 0.27AC0WWMV60 453.51 9.84 0.96 2.03AC0WCMV20 446.94 6.40 0.94 1.01AC0WCMV40 448.31 6.26 0.96 1.03AC0WCMV60 449.17 5.50 0.93 −0.16
5. Conclusions
The novelty of the solution proposed is using the air curtains both as an insulation and asa heat recovery device. The evaluation of the benefits of using air curtains in stenter machineswas performed by means of computational fluid dynamics, applying a simplified 2-D model.A wide range of configurations including AC mass flow rate and temperature, fabric velocity aswell as different geometrical configurations of the ACs were analyzed. The results state that theinstallation of the proposed regenerative ACs should allow an appreciable improvement of themachine performance, with reduction of burner heat supply and humid polluted air dispersion to the

Energies 2019, 12, 482 20 of 22
surrounding environment, limitation of air ingestion from outside and a proper distribution of airtemperature around the fabric.
The key design parameters obtained in this study are the following: the AC configuration with0◦ of tilt, mass flow rate 5% and two warm jets (70 ◦C) provides the best results for fabric speeds of20 m/min and 40 m/min, while a warm (inlet) and a cold (outlet) AC solution (70 ◦C and 15 ◦C) ispreferable at 60 m/min. The detailed results can be summarized as follows:
• 60 different configurations were analyzed, determining that the most influencing parameters forair curtains effectiveness are mass flow rate and temperature;
• The tilt angle of the air curtains (−15◦, 0◦ and +15◦) has a moderate effect on themachine performance;
• A high AC mass flow rate can result in a negative effect for the stenter, as the recovered heat couldbe leaked to the environment, as the values of ξM and ξE are negatively affected;
• The ACs determine an effective reduction of air suction from the environment compared to thereference case without air curtains;
• The use of ACs reduces the energy loss with respect to the reference case and part of the sensibleheat used in the ACs is effectively recovered.
• A warm AC is always preferable at the stenter inlet (warm air is ingested by the machine andregeneration is effective)
• At large fabric speeds (above 40 m/min), entrainment of hot gases at the outlet from insidethe machine becomes relevant, and a cold AC is recommended at the outlet to improve sealingperformance; regeneration can be promoted boosting the flow rate at the inlet warm AC.
Author Contributions: Conceptualization: G.M. and D.F.; Methodology: G.M., L.C., L.T. and J.S.; Softwarecalculations: L.C. and S.S.; Validation: L.C., G.M., S.S. and L.T.; Formal Analysis, Investigation, Resources: AllAuthors; Data Curation: L.C.; Writing (Original Draft Preparation—Review & Editing): L.C., G.M. and S.S.;Supervision, G.M., D.F., S.S. and J.S.
Funding: This research received no external funding.
Conflicts of Interest: The authors declare no conflict of interest.
Nomenclature
Symbolscp Specific heat capacity (J/(kg·K)).
m Mass flow rate (kg/s)h Specific enthalpy (J/kg)Acronyms2D Two-dimensionalAC Air curtainAW Adiabatic wallCFD Computational fluid dynamicsCS Control sectionGreekLettersα, β, γ, δ Control sectionsξM Mass sealing effectiveness coefficientξE Energy effectiveness coefficientηAW Adiabatic wall effectiveness coefficientAbbreviationsAmb Ambient

Energies 2019, 12, 482 21 of 22
References
1. U.S. Energy Information Administration. International Energy Outlook. 2013. Available online: http://www.eia.gov/outlooks/ieo/pdf/0484(2013).pdf (accessed on 30 November 2018).
2. Zuazua-Ros, A.; Martín Gómez, C.; Ramos, J.C.; Bermejo-Busto, J. Towards cooling systems integration inbuildings: Experimental analysis of a heat dissipation panel. Renew. Sustain. Energy Rev. 2017, 72, 73–82.[CrossRef]
3. Tello, P.; Weerdmeester, R. Spire Roadmap. 2013. Available online: https://www.spire2030.eu/sites/default/files/pressoffice/spire-roadmap.pdf (accessed on 30 November 2018).
4. Beers, D.V.; Biswas, W.K. A regional synergy approach to energy recovery: The case of the Kwinana industrialarea, Western Australia. Energy Convers. Manag. 2008, 49, 3051–3062. [CrossRef]
5. Hasanbeigi, A.; Price, L. A review of energy use and energy efficiency technologies for textile industry.Renew. Sustain. Energy Rev. 2012, 16, 3648–3665. [CrossRef]
6. Hong, G.B.; Su, T.L.; Lee, J.D.; Hsu, T.C.; Chen, H.W. Energy conservation potential in Taiwanese textileindustry. Energy Policy 2010, 38, 7048–7053. [CrossRef]
7. Rakib, M.I.; Saidur, R.; Mohamad, E.N.; Afifi, A.M. Waste-heat utilization—The sustainable technologies tominimize energy consumption in Bangladesh textile sector. J. Clean. Prod. 2017, 142, 1867–1876. [CrossRef]
8. Alkaya, E.; Demirer, G.N. Sustainable textile production: A case study from a woven fabric manufacturingmill in Turkey. J. Clean. Prod. 2014, 65, 595–603. [CrossRef]
9. Pulat, E.; Etemoglu, A.B.; Can, M. Waste-heat recovery potential in Turkish textile industry: Case study forcity of Bursa. Renew. Sustain. Energy Rev. 2009, 13, 663–672. [CrossRef]
10. Ozturk, E.; Koseoglu, H.; Karaboyaci, M.; Yigit, N.O.; Yetis, U.; Kitis, M. Sustainable textile production:Cleaner production assessment/eco-efficiency analysis study in a textile mill. J. Clean. Prod. 2016, 138,248–263. [CrossRef]
11. Shiwanthi, S.; Lokupitiya, E.; Peiri, S. Evaluation of the environmental and economic performances of threeselected textile factories in Biyagama Export Processing Zone Sri Lanka. Environ. Dev. 2018, 27, 70–82.[CrossRef]
12. Cay, A.; Tarakcioglu, I.; Hepbasli, A. Exergetic performance assessment of a stenter system in a textilefinishing mill. Int. J. Energy Res. 2007, 31, 1251–1265. [CrossRef]
13. Cay, A.; Tarakcioglu, I.; Hepbasli, A. A study on the exergetic analysis of continuous textile dryer. Int. J.Exergy 2009, 6, 422–439. [CrossRef]
14. Cay, A.; Tarakcioglu, I.; Hepbasli, A. Exergetic analysis of textile convective drying with stenters by subsystemmodels: Part 1—Exergetic modelling and evaluation. Dry. Technol. 2010, 28, 1359–1367. [CrossRef]
15. Cay, A.; Tarakcioglu, I.; Hepbasli, A. Exergetic analysis of textile convective drying with stenters by subsystemmodels: Part 2—Parametric study on exergy analysis. Dry. Technol. 2010, 28, 1368–1376. [CrossRef]
16. Ogulata, R.T. Utilization of waste-heat recovery in textile drying. Appl. Energy 2014, 79, 41–49. [CrossRef]17. Sekkeli, M.; Keçecioglu, O.F. Scada based an energy saving approach to operation of stenter machine in a
textile plant using waste-heat recovery system. J. Text. Appar./Tekstil ve Konfeksiyon 2012, 22, 248–257.18. Fiaschi, D.; Manfrida, G.; Russo, L.; Talluri, L. Improvement of waste heat recuperation on an industrial
textile dryer: Redesign of heat exchangers network and components. Energy Convers. Manag. 2017, 150,924–940. [CrossRef]
19. Van Kennel, T. Means for Excluding Drafts from Open Doorways. U.S. Patent 774,730, 8 November 1904.20. Krajewki, G.; Wegrzynski, W. Air curtain as a barrier for smoke in case of fire: Numerical modelling. Bull.
Pol. Acad. Sci. Tech. Sci. 2015, 63, 145–153.21. Yu, L.X.; Liu, F.; Beji, T.; Weng, M.C.; Merci, B. Experimental study of the effectiveness of air curtains of
variable width and injection angle to block fire-induced smoke in a tunnel configuration. Int. J. Therm. Sci.2018, 134, 13–26. [CrossRef]
22. Liu, Q.; Nie, W.; Hua, Y.; Peng, H.; Liu, C.; Wei, C. Research on tunnel ventilation systems: Dust diffusionand pollution behavior by air curtains based on CFD technology and field measurement. Build. Environ.2019, 147, 444–460. [CrossRef]
23. Van Belleghem, M.; Verhaehe, G.; T’Joen, C.; Huisseune, H.; De Jaeger, P.; De Paepe, M. Heat transfer throughvertically downward-blowing single-jet air curtains for cold rooms. Heat Transf. Eng. 2012, 33, 1196–1206.[CrossRef]
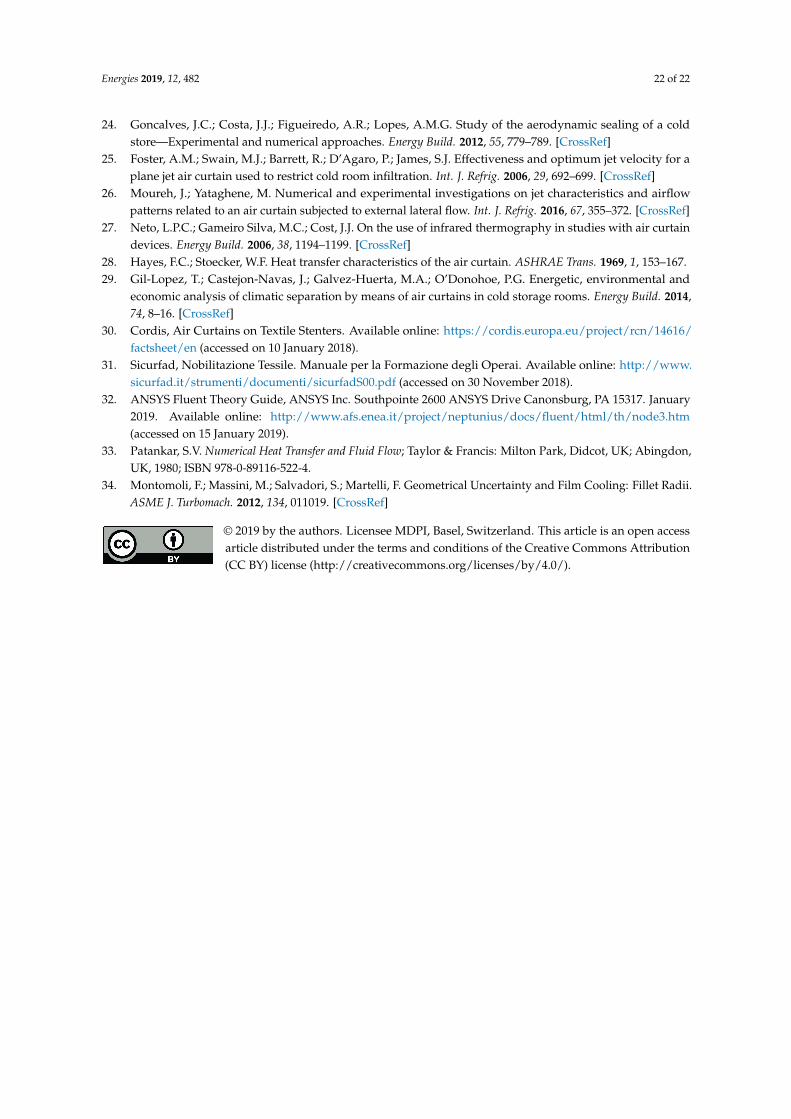
Energies 2019, 12, 482 22 of 22
24. Goncalves, J.C.; Costa, J.J.; Figueiredo, A.R.; Lopes, A.M.G. Study of the aerodynamic sealing of a coldstore—Experimental and numerical approaches. Energy Build. 2012, 55, 779–789. [CrossRef]
25. Foster, A.M.; Swain, M.J.; Barrett, R.; D’Agaro, P.; James, S.J. Effectiveness and optimum jet velocity for aplane jet air curtain used to restrict cold room infiltration. Int. J. Refrig. 2006, 29, 692–699. [CrossRef]
26. Moureh, J.; Yataghene, M. Numerical and experimental investigations on jet characteristics and airflowpatterns related to an air curtain subjected to external lateral flow. Int. J. Refrig. 2016, 67, 355–372. [CrossRef]
27. Neto, L.P.C.; Gameiro Silva, M.C.; Cost, J.J. On the use of infrared thermography in studies with air curtaindevices. Energy Build. 2006, 38, 1194–1199. [CrossRef]
28. Hayes, F.C.; Stoecker, W.F. Heat transfer characteristics of the air curtain. ASHRAE Trans. 1969, 1, 153–167.29. Gil-Lopez, T.; Castejon-Navas, J.; Galvez-Huerta, M.A.; O’Donohoe, P.G. Energetic, environmental and
economic analysis of climatic separation by means of air curtains in cold storage rooms. Energy Build. 2014,74, 8–16. [CrossRef]
30. Cordis, Air Curtains on Textile Stenters. Available online: https://cordis.europa.eu/project/rcn/14616/factsheet/en (accessed on 10 January 2018).
31. Sicurfad, Nobilitazione Tessile. Manuale per la Formazione degli Operai. Available online: http://www.sicurfad.it/strumenti/documenti/sicurfadS00.pdf (accessed on 30 November 2018).
32. ANSYS Fluent Theory Guide, ANSYS Inc. Southpointe 2600 ANSYS Drive Canonsburg, PA 15317. January2019. Available online: http://www.afs.enea.it/project/neptunius/docs/fluent/html/th/node3.htm(accessed on 15 January 2019).
33. Patankar, S.V. Numerical Heat Transfer and Fluid Flow; Taylor & Francis: Milton Park, Didcot, UK; Abingdon,UK, 1980; ISBN 978-0-89116-522-4.
34. Montomoli, F.; Massini, M.; Salvadori, S.; Martelli, F. Geometrical Uncertainty and Film Cooling: Fillet Radii.ASME J. Turbomach. 2012, 134, 011019. [CrossRef]
© 2019 by the authors. Licensee MDPI, Basel, Switzerland. This article is an open accessarticle distributed under the terms and conditions of the Creative Commons Attribution(CC BY) license (http://creativecommons.org/licenses/by/4.0/).
Related Documents