JOURNAL OF RESEARCH of the National Bureau of Standards - A. Physics and Chemistry Vol. 79A, No.2, March-April 1975 Heat Capacities of Polyethylene III. One Linear and One Branched Sample from 5 to 350 K Shu-Sing Chang Institute for Materials Research, National Bureau of Standards, Washington, D.C. 20234 and Edgar F. Westrum, Jr., and H. Gary Carlson * Department of Chemistry, University of Michigan, Ann Arbor, Michigan 48104 (December 20, 1974) Heat ca paciti es of two polyethylene sa mpl es. one lin ea r with a density of 0.973 g cm -3 and one bran ched with a density of 0.91 g cm - 3, have bee n determined by adiabatic calorime tr y fr om 5 to 360 K in a different e xp erimental arr angement then employed for studi es of other polyethylene sampl es in this series . Th e heat capacity behavior of th ese two sa mples co nfirms exp ec tations for sa mpl es with co rr espo nding densities. Key words: Adiaba ti c ca lorime tr y; branched polyethylene; calorime tr y; cryoge ni c tempe ratur e; hea t ca pacity; lin ea r polyethylene; polyethylene; thermodynamic properties. 1. Introduction Heat capacities of two polyethylene samples, one linear and one bran c hed, were determined from 5 to 350 K by adiabatic calorimetry. The linear sample has been treated to yield a relatively high density value of 0.973 g cm- 3 • The branched sample was one of the lowest density polyethylene sample available, its density value is 0.91 g cm- 3 . The heat capacity behavior of th ese two samples, produced by different sources and measured with different experimental arrangements than that for four samples derived from two Standard Referen ce Materials [1, 2),1 closely parallels the behavior (as a function of density) of the Standard Reference Materials [2]. 2. Experimental Detail 2.1. Calorimetry Heat capacities of the two polyethylene samples were me asured with the Mark I c ryostat in the Depart· ment of Chemistry, University of Michigan. Ann Arbor, Michigan. The design and the operational procedures of this aneroid·type adiabatic cryostat have been desc ribed else where [3 , 4] , and are similar to a c ryostat * Prese nt Address: General Electric Co .. Syracuse. New York. 1 Figures in brac kets indic at e th e lit e rature references at the end of this pape r. d esc ribed in more detail else wh ere [5] . Th e go ld· plated co pp er s ampl e container, laboratory d es igna· tion W-9 [6], was use d in the meas ur ements of the branch ed polyethylene sa mpl e. Container, W- lO. was used in the measurements of the lin ea r poly- ethylene sa mple. Container W-I0 is of similar d es ign to W-9 exce pt that there are no int ernal van es for thermal conduction and the entire top of the container is made of co pp er and is removable for the admission of samples. Temperatures were meas ured by a capsu le-type platinum resistance thermometer. lab oratory designa- tion A-3, inserted in the axial well of the samp le container. This thermometer has been ca librated by the National Bureau of Standards (NBS) according to the International Practical Temperature Scale (IPTS) of 1948 above 90 K; and to the NBS-1955 provisional temperature scale between 10 and 90 K. Below 10 K, a laboratory provisional scale was ob- tained by solving for the constants in the equation [7] R = A + BP + CT5 from the observed resistances at the boiling point of helium and at 10 K and the dR/dT value at 10 K. To correct the original heat capacity data to temp era- tures expressed in terms of IPTS-1968 [8], th e fol- lowing procedures were used to provide adjustments between the several temperature scales. Above 13.81 K, an approxima te corr ec tion scheme was used to corr ect the hea t c apaciti es to valu es th ey 437

Welcome message from author
This document is posted to help you gain knowledge. Please leave a comment to let me know what you think about it! Share it to your friends and learn new things together.
Transcript
JOURNAL OF RESEARCH of the National Bureau of Standards - A. Physics and Chemistry Vol. 79A, No.2, March-April 1975
Heat Capacities of Polyethylene III. One Linear and One Branched Sample from 5 to 350 K
Shu-Sing Chang
Institute for Materials Research, National Bureau of Standards, Washington, D.C. 20234
and
Edgar F. Westrum, Jr., and H. Gary Carlson *
Department of Chemistry, University of Michigan, Ann Arbor, Michigan 48104
(December 20, 1974)
Heat capacities of two polyethyle ne samples. one linear with a de nsity of 0.973 g c m - 3 and one branched with a density of 0.91 g c m - 3, have been dete rmine d by adiabati c ca lorimetry from 5 to 360 K in a different experimen tal arra nge ment the n e mployed for studies of othe r polyeth ylene samples in thi s series. The heat capac ity behavior of these two samples confirms expectation s for samples with corresponding de ns ities .
Key words: Adiabati c ca lorimetry; branched polyethylene ; calorim etr y; cryogenic te mpe rature; heat capacity; linear polyethylene; polyethyle ne; thermodynamic properti es .
1. Introduction
Heat capacities of two polyethylene samples, one linear and one branched, were determined from 5 to 350 K by adiabatic calorimetry. The linear sample has been treated to yield a relatively high density value of 0.973 g cm- 3• The branched sample was one of the lowest density polyethylene sample available, its density value is 0.91 g cm- 3 . The heat capacity behavior of these two samples, produced by different sources and measured with different experimental arrangements than that for four samples derived from two Standard Reference Materials [1, 2),1 closely parallels the behavior (as a function of density) of the Standard Reference Materials [2].
2. Experimental Detail
2.1. Calorimetry
Heat capacities of the two polyethylene samples we re measured with the Mark I cryostat in the Depart· me nt of Chemistry, University of Michigan. Ann Arbor, Michigan. The design and the operational procedures of this aneroid·type adiabatic cryostat have been d escribed elsewhere [3 , 4] , and are similar to a cryostat
* Present Address: General Elec tri c Co .. Syracuse. New York. 1 Figures in brackets indicate the lit e rature re fe rences at the end of this paper.
described in more detail elsewh ere [5]. The gold· plated copper sample container, laboratory des igna· tion W-9 [6], was used in th e meas ure me nts of the branched polyethyle ne sample. Container, W- lO. was used in the measure me nts of the linear polyethyle ne sample . Container W-I0 is of similar des ign to W-9 exce pt that there are no inte rnal vanes for th ermal conduction and the e ntire top of the co ntainer is made of copper and is re movable for the admission of samples.
Temperatures were measured by a capsule-type platinum resistance thermometer. laboratory designation A-3, inserted in the axial well of the sample container. This thermometer has been calibrated by the National Bureau of Standards (NBS) according to the International Practical Temperature Scale (IPTS) of 1948 above 90 K; and to the NBS-1955 provisional temperature scale between 10 and 90 K. Below 10 K, a laboratory provisional scale was obtained by solving for the constants in the equation [7] R = A + BP + CT5 from the observed resistances at the boiling point of helium and at 10 K and the dR/dT value at 10 K.
To correct the original heat capacity data to temperatures expressed in terms of IPTS-1968 [8], the following procedures were used to provide adjustments between the several temperature scales.
Above 13.81 K, an approximate correc tion scheme was used to correct the heat capacities to values th ey
437

would have if they were determined by a thermometer calibrated in accordance to the IPTS- 1968 [8]. This procedure [9] involves the multiplication of each experimental heat capacity value by a factor of 1 + d (T68 - T)/dT, where T is the temperature scale used in the experiment and (T68 - T) is the difference between the IPTS-1968 and the experimental temperature scale. Tables of the differences between the IPTS-1968 and the IPTS-1948 or the NBS-1955 provisional scale are given in reference [10], and in more detail elsewhere [ll].
Heat capacity values below 13.81 K may be corrected from the previously mentioned laboratory provisional temperature scale to a temperature scale which approximates the thermodynamic temperature scale or the NBS-1965 (2-20 K) temperature scale [12] based on acoustic thermometry. An improved thermometer calibration with an accuracy of about 0.02 K was obtained from a two-way structure analysis of the behaviors of a group of platinum resistance thermometers [13]. The differences between this improved calibration and the laboratory provisional scale were then used to correct the heat capacity values in a manner similar to the procedure described above for correcting heat capacity values at te mperatures above 13.81 K.
2.2. Materials
a. Linear Palyethylene
A molded piece of Marlex 50 2 was supplied by Dr. Raymond L. Arnett of the Phillips P etrole um Co., Bartlesville, Oklahoma. This piece was mac hined as a cylinder with an axial hole (to accommodate the thermometer-heater wall) and was then loaded into the sample container, laboratory designation W-lO, which has no thermal conducting vanes. The de nsity of the machine d sample was de termined to be 0.973 g c m - 3.
The mass of the calorimetric sample was 87.121 g in vacuo. Helium gas at a pressure of 815 mm Hg (l08 kPa) was sealed in to aid the thermal conduction within the sample container. Indium-tin alloy (50-50) was used to seal the top of the sample container. Apiezon.T grease was used to es tablish thermal contact betwee n the sample co ntainer and the heater-thermometer assembly. In order to minimize the corrections, masses of both solder and grease were adjusted to approxmately the values used when the heat capacity of the empty sample co ntaine r was measured.
b. Branched Polyethylene
A sample with the designation DYNH CT-1660 was also supplied by Dr. Raymond L. Arnett of the Phillips Petroleum Co., Bartlesville, Oklahoma. This sample consists of cylindrical pellets about 5 mm diam and 5 mm length. The density was reported by Dr. Arnett to be 0.91 g cm - 3• A sample mass of 45.122 g in vacuum was loaded in the sample container, laboratory
2Certa in c llmme rc iul equipment. in s trume nt s. or mat erial s are identifi ed in thi s paper in order to adequately s peci fy th e expe rime nt al procedure. In no case does such identificat ion imply recommendation or endorsement by the National Bureau of Standards. nor does it imply that the mat eria l ur equi pment iden tified is necessar il y the bes t a va ilahle for the purpose.
designation W- 9. Dried and purified helium gas at a pressure of 190 mm Hg (25.2 kPa) was sealed· in the calorimeter to aid the thermal conduction. Masses of indium-tin (50-50) solder and grease are adjusted to approximate the amounts used during e mpty sample container measurements.
3. Results
The experimental heat capacity determinations are listed chronologically in table 1 and are shown graphically in Figure 1. The approximate te mperature
40
100
o BRANCHED • LINEAR
POLYETHYLENE T. K
200
T. K
300 400
. 40
FIGURE 1. Heat capacities of 1 linear and I branched polyethylene samples.
• - Madex 50. 0- DYNI-I CT- 1660.
increments of each determination may be inferred from th e adjacent mean temperatures in a series of co ntinuous determinations. An analytically determined curvature correction has been applied to the observed values of tlH/tlT to correct for the finit e size of the te mperature increment used in the heat capacity determination. The molecular weight for the repeating methylene segme nt, -CH2-, is take n as 14.027. Molal values of the heat capacity at constant pressure and the entropy and enthalpy increments generated by a leas t-square c urve·fitting program are listed at selected rounded temperatures in table 2. The reported values of the heat capacities are belie ved to have probable errors less than 0.1 percent at te mperatures above 25 K, about 1 percent at 10 K and 5 percent at 5 K. The probable error of the thermodynamic function s are considered to be less than 0.1 percent above 100 K. Ho and So refer to the zero point enthalpy
438

and residual e ntropy of individual samples. Gibbs energies for these samples are not given in table 2,
TABLE 1. Heat Capacities of Polyethylene
(base mole [- CH,- ] = 14.027)
A. Linear Po lye th yle ne (p = 0.973 g cm - 3)
T, K C1h J K - I mol- I T, K C1" J K- I mol - I
SER I ES I SERIES vn
80.41 7.953 4.83 0.016 83.41 8.242 5.58 0.022 89.78 8.841 6.44 0.035
7.25 0.054 SERIES [] 8.16 0.081
9.15 0.122 104.13 9.856 10.21 0.176 111.84 10.41 11.31 0.2 10 119.96 11 .07 12.52 0.265 128.03 11. 51 13.77 0.341 136.03 12.09 15 .06 0.429 144.31 12.64 16.48 0.533 152.99 13.21 18.15 0.667 161.82 13.78 20.07 0.841 170.27 14.32 22.25 1.055 178.43 14.83 24.69 1.317
27.30 1.622 SERIES 1II 30.15 1.964
33 .34 2.375 182.55 15. 07 36.90 2.845 191.25 15.65 40.89 3.376 200.25 16.26 45.23 3.945 209.09 16.86 49 .84 4.542 217.87 17.51 226.96 18.20 SERIES V1l1
SERIES IV 50.12 4.574 55.46 5.236
235.53 18.99 61.16 5.935 244.50 19.75 67.26 6.620 253.69 20.51 73.65 7.214 262.73 21.34 80.32 7.934 271.59 22.17 87.05 8.613
94.22 9.144 SERrES V 102.37 9.734
275.83 22.58 SERIES IX 284.92 23.48 293.96 24.40 193.27 15.80
202.14 16.36 SERIES VI 211.13 16.99
291.67 24.10 SERIES X 300.82 25.09 310.33 26.18 266.77 21.63 320.12 27.36 278.40 22.75 329.53 28.58 338.51 30.46 347.51 31.62
439
567-521 0 - 75 - 3
because these sam pJes are expected to have undetermined residual entropies at 0 K.
TAB LE I -Continued
B. Branched Polyethyl ene (p = 0.91 g cm- 3 )
T, K C1" J K- I mol - I T, K C1h .J K- I mor '
SERIES I SERIES V
5.20 0.039 193 .89 16.74 6.05 .062 202.65 17.54 6.98 .098 211.45 18.38 7.87 .146 220.45 19.35 8.87 .200 229 .57 20 .60 9.90 .284
11.04 .331 SERIES VI 12.20 .406 13.32 .499 237.06 22.08 14.51 .597 246.25 23.64 15.79 .712 255.39 25 .18 17.16 .841 264.61 26.60 18.70 .997 273.75 28.08 20.52 1.184 22.63 1.422 SERIES VII 24.93 1.708
278.37 28.92 286.74 30 .43
SERIES II 295.89 31.67 305.57 33.52
23.94 1.563 314.85 35.34 26.39 1.858 29.00 2.175 SERIES VllI 31.87 2.540 34.93 2.931 324.45 37.97 38.47 3.381 334.68 41.29
344.69 43.72 SE RIES III
40.32 3.612 44.44 4.125 48.95 4.681 54.26 5.306
SERIES IV
58.16 5.749 64.59 6.473 71.56 7.331 78.46 7.661 85.47 8.506 92.32 9.068 99.62 9.621
107.66 10.23 115.56 10.83 123.49 11.42 131.71 12.03 151.04 13.45 161.99 14.22 171.15 14.93 180.32 15.66 189.54 16.39
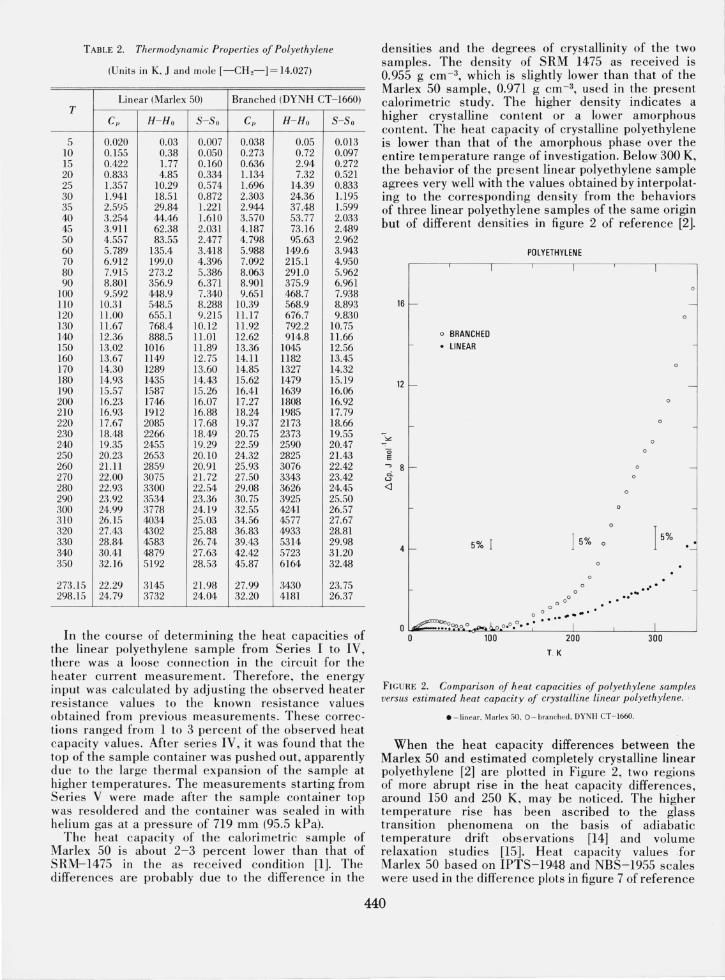
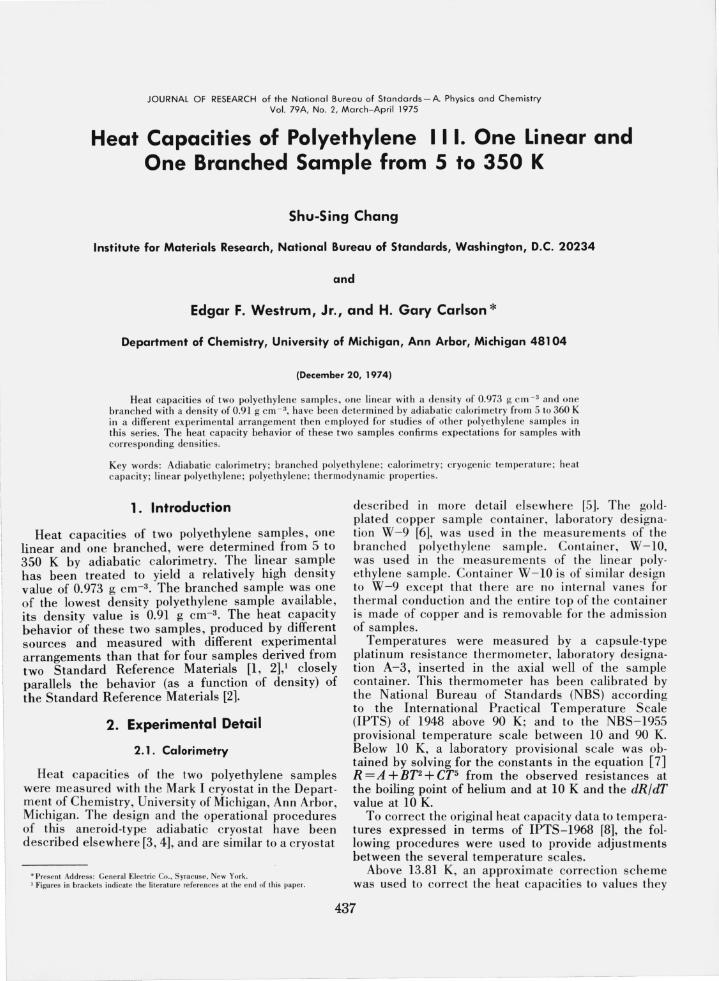
TABLE 2. Thermodynamic Properties of Polyethylene
(Units in K, J a nd mole [-CH 2-] = 14.027)
Linear (Marie x 50) Branched (DYNH CT-1660) T
C" H- Ho 5- 50 Cp H- Ho 5-50
5 0.020 0.03 0.007 0.038 0.05 0.013 10 0.155 0.38 0.050 0.273 0.72 0.097 15 0.422 1.77 0.160 0.636 2.94 0.272 20 0.833 4.85 0.334 1.134 7.32 0.521 25 1.357 10.29 0.574 1.696 14.39 0.833 30 1.941 18.51 0.872 2.303 24.36 1.195 35 2.595 29.84 1.221 2.944 37.48 1.599 40 3.254 44.46 1.610 3.570 53.77 2.033 45 3.911 62.38 2.031 4.187 73. 16 2.489 50 4.557 83.55 2.477 4.798 95.63 2.962 60 5.789 135.4 3.418 5.988 149.6 3.943 70 6.912 199.0 4.396 7.092 215.1 4.950 80 7.915 273.2 5.386 8.063 291.0 5.962 90 8.801 356.9 6.371 8.901 375.9 6.961
100 9.592 448.9 7.340 9.651 468.7 7.938 llO 10.31 548.5 8.288 10.39 568.9 8.893 120 11.00 655.1 9.215 11.17 676.7 9.830 130 11.67 768.4 10.12 11.92 792.2 10.75 140 12.36 888.5 11.01 12.62 914.8 11.66 150 13.02 1016 11.89 13.36 1045 12.56 160 13.67 1149 12.75 14.11 1182 13.45 170 14.30 1289 13.60 14.85 1327 14.32 180 14.93 1435 14.43 15.62 1479 15.19 190 15.57 1587 15.26 16.41 1639 16.06 200 16.23 1746 16.07 17.27 1808 16.92 210 16.93 1912 16.88 18.24 1985 17.79 220 17.67 2085 17.68 19.37 2173 18.66 230 18.48 2266 18.49 20.75 2373 19.55 240 19.35 2455 19.29 22.59 2590 20.47 250 20.23 2653 20.10 24.32 2825 21.43 260 21.11 2859 20.91 25.93 3076 22.42 270 22.00 3075 21. 72 27.50 3343 23.42 280 22.93 3300 22.54 29.08 3626 24.45 290 23.92 3534 23.36 30.75 3925 25.50 300 24.99 3778 24.19 32.55 4241 26.57 310 26.15 4034 25.03 34.56 4577 27.67 320 27.43 4302 25.88 36.83 4933 28.81 330 28.84 4583 26.74 39.43 5314 29.98 340 30.41 4879 27.63 42.42 5723 31.20 350 32. 16 5192 28.53 45.87 6164 32.48
273.15 22.29 3145 21.98 27.99 3430 23.75 298.15 24.79 3732 24.04 32.20 4181 26.37
In the course of determi ning the heat capacities of the linear polyethylene sample from Series I to IV, there was a loose connection in the circuit for the heater current measureme nt. Therefore, the energy input was calculated by adjusting the observed heater resistance values to the known resistance values obtained from previous measurements. These corrections ranged from 1 to 3 percent of the observed heat capacity values. After series IV, it was found that the top of the sample container was pushed out, apparently due to the large thermal expansion of the sample at higher temperatures. The measurements starting from Series V were made after the sample container top was resoldered and the container was sealed in with helium gas at a pressure of 719 mm (95.5 kPa)_
The heat capacity of the calorimetric sample of Marlex 50 is about 2-3 percent lower than that of SRM-1475 in the as received condition [ll- The differences are probably due to the difference in the
densities and the degrees of crystallinity of the two samples_ The density of SRM 1475 as received is 0.955 g cm - 3, which is slightly lower than that of the Marlex 50 sample, 0.971 g cm - 3, used in the present calorimetric study. The higher density indicates a higher crystalline content or a lower amorphous content. The heat capacity of crystalline polyethylene is lower than that of the amorphous phase over the entire temperature range of investigation. Below 300 K, the behavior of the present linear polyethylene sample agrees very well with the values obtained by interpolating to the corresponding density from the behaviors of three linear polyethylene samples of the same origin but of different densities in figure 2 of reference [2].
'""
16 r-
12 r-
4r-
o BRANCHED ° LINEAR
I
5% I
POLYETHYLENE
o 0
I
J 5% 0
o o
a 100 200
T. K
o 0
000 .....
I
15%
I 300
.-
-
-
0 -
FIGURE 2. Comparison of heat capacities of polyethylene samples versus estimated heat capacity of crystalline linear polyethylene . .
• - linear. Marlex 50. 0- bra nched. DYNH CT-166O.
When the heat capacity differences between the Marlex 50 and estimated completely crystalline linear polyethylene [2] are plotted in Figure 2, two regions of more abrupt rise in the heat capacity differences, around 150 and 250 K, may be noticed. The higher temperature rise has been ascribed to the glass transition phenomena on the basis of adiabatic temperature drift observations [14] and volume relaxation studies [15]_ Heat capacity values for Marlex 50 based on IPTS-1948 and NBS-1955 scales were used in the difference plots in figure 7 of reference
440

[2]. After the values have been corrected to IPTS-1968 re presentation as described in previous sec tion, the irregularities in the region 70-90 K due to the joining of the two scales [16] are diminished in magnitude but still noticeable .
The heat capacity behavior of the branch ed polyethyle ne used in this study is very similar to that of SRM-1476 branched polyethylene whole polymer [llExce pt in the region from 100 to 200 K, the heat capacities of these two samples and other branc hed polyethylene samples [17, 18, 19] are in ge neral slightly higher than linear polyethyle ne res ults extrapolated to corres ponding densities (cf. fi g_ 2 in reference [2]). Thus, the curves of the difference between the heat capacities, fi gure 2, of th e branc hed polyethylene and 100 pe rce nt crys talline linear polyethyle ne show a more pronounced abrupt c han ge in the region of 250 K than the corres ponding curves for lin ear polyethyle ne and almos t s mooth c urves in th e region of 150 K.
Relatively large positive te mperature drifts have been observed during the measurements of the bran ched polyeth ylene DYNH CT -1660 sample_ In the 200 to 300 K region, a maximum drift of 0.01 K min - I was observed at a round 255 K. This is probably similar to tha t which has bee n obse rved for the qu enc hed , branched polyethyle ne , SRM 1476, in refere nce [1]. At te mperatures above 300 K, the drift of DYNH CT -1660 gradually in creased to about 0.15 K min - I at about 350 K. S imilar be hav ior has been noted for SRM- 1476 when it was heated above room temperature for th e firs t tim e [1]. Calorime tri c te mperature drifts longe r a nd larger than us ual have also bee n observed for th e linear polyethyle ne, Marlex 50, sample at te mperatures above 220 K. Below 300 K, the maximum te mperature drift observed at 30 min aft er the termin ation of heater input was less than 0.005 K min - I. Near the hi ghes t meas ure me nt te mpe rature the drift was still less than 0.01 K min - I.
The authors ackn owledge the cooperation of Elfreda Chang, B. H . Justi ce and N. E. Levitin with the
measure ments, the cooperation of Dr. Raymond L. Arnett and the Phillips P etrole um Co mpan y in providin g the samples , and the parti al fin a ncial s upport of the researc h e ndeavor at the Unive rs ity of Mic higan by the U.S. Atomic Energy Com mi ss ion.
4. References
[1] Chang, S . S. , and Bestul , A. B. , J. Res. Na l. Bur. S tand. (U.S.), 77 A (phys. a nd Chem.) , No.4, 395- 405 (.jul y- Aug. 1973).
[21 Chang, S . S ., J. Res. Nat. Bur. S ta nd. (U.S.), 78A Whys. a nd Che m.), No. 3, 387- 400 (May-J un e 1974).
[31 Wes trum , E. F. , Jr. , Adv . C ryo. Eng. 7,1 ( 1961). [4] Wes trum , E. F., Jr. , Furuk awa. C. T ., a nd McC ull uugh , J. 1".,
in McC ullough. J. P. , a nd Scott . D. W. ed .. " Expe rime ntal Th ermod yna mics Vo l. 1. Ca lorim etr y uf No n· Reac ting Systems." P le num Press, N. Y. (1968).
lSI Westrum , E. F. , Jr. . Hatcher , J . B. , a nd Osbo l'ne, D. W., J. Che m. P hys .. 21 4 19 (1 953).
[61 C ree nbe rg, E., a nd Wes trum . E. F., Jr., .I . Am. C he rn . Soc . 78, 4526 (1956).
[7J Hoge. H . .I ., and Bric kwedde. F. C. , J . Res. Na t. Bur. S tand . 22 , 351 (1939) RP 1188.
18] Co mit.e Int e rn aliona l des Poi s e t Mes ures , Melrolugia, 5, 35 (1969) .
[91 Douglas , T. B., .J. Res. Nal. Bur. S tand. (U.S .). 73A (phys . and Che m.), No.5. 451- 470 (Sep t. - Oc t. 1969).
[10] Bedford. R. E., Durie ux. M. , Muij lwijk , R. , and Barbe r, C. R., Metrologia, 5, 47 (1969).
[11] Ridd le, J. L. , Furukawa. C. T. and P lumb , H. H. , Na t. Bur. S tand . (U.S.) Monogr. 126. "Plalinum res is tance th e rmom· e tr y," 129 page (April 1973).
(1 2] Ca l a la nd , C., a nd Plumb, H. H., J . Res. Na t. Bur. S ta nd. (U.S.), 70A. Wh ys. and C hem.), Nu. 3, 243- 252 (May- June 1966).
[13] McC rac kin , F. L. , and Cha ng, S. S. , Re v. c i. In str. , to be pub li s hed.
114J Chang, S . S ., J . Po lyme r Sci. C ( ymp.) 43, 43 (1973). [15] Dav is, C. T . and Eby. R. K. , .I . Appl. I' hys. 4 4, 4274 (1973). [16] F urukawa, C. T. and Re ill y, M., .I . Hes. Na t. Bur. S ta nd. (U.S.),
69A Whys. a nd C he m.) , No. 1, 5-12 (J an.- Feb. 1965). [1 7] Dain ton, F. S., Eva ns, D. M. , Hoa re, F. E. , a nd Melia, T. 1". ,
Polymer 3, 277 ( 1962). [18] Passagli a , E. , a nd Kevorkian, H. K., J. Appl. Polyme r Sci. 7,
119 (1963). [19] Tucker, .J. E. and Reese, W., J . C he m. Phys. 46,1388 (1967).
441
Related Documents


