Heat Capacities and a Snapshot of the Energy Landscape in Protein GB1 from the Pre-denaturation Temperature Dependence of Backbone NH Nanosecond Fluctuations Djaudat Idiyatullin, Irina Nesmelova, Vladimir A. Daragan and Kevin H. Mayo* Department of Biochemistry Molecular Biology and Biophysics, University of Minnesota, 6-155 Jackson Hall 321 Church Street, Minneapolis MN 55455, USA Protein stability is usually characterized calorimetrically by a melting tem- perature and related thermodynamic parameters. Despite its importance, the microscopic origin of the melting transition and the relationship between thermodynamic stability and dynamics remains a mystery. Here, NMR relaxation parameters were acquired for backbone 15 NH groups of the 56 residue immunoglobulin-binding domain of strepto- coccal protein G over a pre-denaturation temperature range of 5–50 8C. Relaxation data were analyzed using three methods: the standard three- Lorentzian model free approach; the F(v) ¼ 2vJ(v) spectral density approach that yields motional correlation time distributions, and a new approach that determines frequency-dependent order parameters. Regardless of the method of analysis, the temperature dependence of internal motional correlation times and order parameters is essentially the same. Nanosecond time-scale internal motions are found for all NHs in the protein, and their temperature dependence yields activation energies ranging up to about 33 kJ/mol residue. NH motional barrier heights are structurally correlated, with the largest energy barriers being found for residues in the most “rigid” segments of the fold: b-strands 1 and 4 and the a-helix. Trends in this landscape also parallel the free energy of folding–unfolding derived from hydrogen–deuterium (H–D) exchange measurements, indicating that the energetics for internal motions occurring on the nanosecond time-scale mirror those occurring on the much slower time-scale of H–D exchange. Residual heat capacities, derived from the temperature dependence of order parameters, range from near zero to near 100 J/mol K residue and correlate with this energy landscape. These results provide a unique picture of this protein’s energy landscape and a relationship between thermodynamic stability and dynamics that suggests thermosensitive regions in the fold that could initiate the melting process. q 2002 Elsevier Science Ltd. All rights reserved Keywords: NMR; 15 N relaxation; spectral density; correlation times; motional models *Corresponding author Introduction The 56 residue immunoglobulin-binding domain of streptococcal protein G (GB1) is an ideal model system with which to investigate the pre-denatura- tion temperature dependence of protein dynamics. It is a small, yet highly stable 1 (T m of 87 8C at pH 5.4), well-structured protein 2–4 that is folded as a four-stranded b-sheet (residues 2–8, 13–20, 42–46 and 51–56) on top of which lies an a-helix running from residues 22–37. The folding of GB1 has been extensively studied. 1,5 – 8 Over the pre-denaturation temperature range between 5 8C and 30 8C, the calorimetrically determined free energy of 0022-2836/03/$ - see front matter q 2002 Elsevier Science Ltd. All rights reserved E-mail address of the corresponding author: [email protected] Abbreviations used: GB1, protein G. doi:10.1016/S0022-2836(02)01155-5 J. Mol. Biol. (2003) 325, 149–162

Welcome message from author
This document is posted to help you gain knowledge. Please leave a comment to let me know what you think about it! Share it to your friends and learn new things together.
Transcript
Heat Capacities and a Snapshot of the EnergyLandscape in Protein GB1 from the Pre-denaturationTemperature Dependence of Backbone NHNanosecond Fluctuations
Djaudat Idiyatullin, Irina Nesmelova, Vladimir A. Daragan andKevin H. Mayo*
Department of BiochemistryMolecular Biology andBiophysics, University ofMinnesota, 6-155 Jackson Hall321 Church Street, MinneapolisMN 55455, USA
Protein stability is usually characterized calorimetrically by a melting tem-perature and related thermodynamic parameters. Despite its importance,the microscopic origin of the melting transition and the relationshipbetween thermodynamic stability and dynamics remains a mystery.Here, NMR relaxation parameters were acquired for backbone 15NHgroups of the 56 residue immunoglobulin-binding domain of strepto-coccal protein G over a pre-denaturation temperature range of 5–50 8C.Relaxation data were analyzed using three methods: the standard three-Lorentzian model free approach; the F(v) ¼ 2vJ(v) spectral densityapproach that yields motional correlation time distributions, and a newapproach that determines frequency-dependent order parameters.Regardless of the method of analysis, the temperature dependence ofinternal motional correlation times and order parameters is essentiallythe same. Nanosecond time-scale internal motions are found for all NHsin the protein, and their temperature dependence yields activationenergies ranging up to about 33 kJ/mol residue. NH motional barrierheights are structurally correlated, with the largest energy barriers beingfound for residues in the most “rigid” segments of the fold: b-strands 1and 4 and the a-helix. Trends in this landscape also parallel the freeenergy of folding–unfolding derived from hydrogen–deuterium (H–D)exchange measurements, indicating that the energetics for internalmotions occurring on the nanosecond time-scale mirror those occurringon the much slower time-scale of H–D exchange. Residual heat capacities,derived from the temperature dependence of order parameters, rangefrom near zero to near 100 J/mol K residue and correlate with this energylandscape. These results provide a unique picture of this protein’s energylandscape and a relationship between thermodynamic stability anddynamics that suggests thermosensitive regions in the fold that couldinitiate the melting process.
q 2002 Elsevier Science Ltd. All rights reserved
Keywords: NMR; 15N relaxation; spectral density; correlation times;motional models*Corresponding author
Introduction
The 56 residue immunoglobulin-binding domainof streptococcal protein G (GB1) is an ideal modelsystem with which to investigate the pre-denatura-
tion temperature dependence of protein dynamics.It is a small, yet highly stable1 (Tm of 87 8C at pH5.4), well-structured protein2 – 4 that is folded as afour-stranded b-sheet (residues 2–8, 13–20, 42–46and 51–56) on top of which lies an a-helix runningfrom residues 22–37. The folding of GB1 has beenextensively studied.1,5 – 8 Over the pre-denaturationtemperature range between 5 8C and 30 8C,the calorimetrically determined free energy of
0022-2836/03/$ - see front matter q 2002 Elsevier Science Ltd. All rights reserved
E-mail address of the corresponding author:[email protected]
Abbreviations used: GB1, protein G.
doi:10.1016/S0022-2836(02)01155-5 J. Mol. Biol. (2003) 325, 149–162

unfolding for GB11 varies little and, on raising thetemperature further, falls gradually to zero by87 8C. In this regard, GB1 behaves thermodynami-cally like a larger protein and, therefore, may beconsidered representative of any number ofproteins.
Protein stability and function are dictated bothby structure and dynamics. Structural stability isusually characterized calorimetrically by a meltingtemperature and related thermodynamicparameters.9 Despite its importance, the micro-scopic origin of the melting transition and therelationship between thermodynamic stability anddynamics remains a mystery that is only recentlybeginning to be unraveled.10 Although much isknown regarding thermodynamic stabilities ofnumerous proteins and protein complexes, little isknown about the thermal activation of internalmotions in proteins or about a protein’s motionalenergy landscape. NMR relaxation provides theonly way to derive site-specific dynamics infor-mation through the protein sequence and over arelatively wide temperature range.
Because NMR relaxation studies are being per-formed more and more frequently to obtain infor-
mation on protein dynamics, the ability toaccurately determine internal motional parametersis crucial. The model free approaches of Lipari &Szabo11,12 and of Clore et al.,13 which providemotional correlation times and order parametersrelated to the degree of internal mobility, are themost often employed to analyze NMR relaxationdata. These approaches generally render a crediblepicture of restricted motions in the system onlywhen internal motions can be described by one ortwo correlation times and overall moleculartumbling is isotropic, i.e. the molecule is spherical.In more complicated cases, these methods falter,yielding inaccurate correlation times andunrealistic order parameters approaching unity. Inaddition, even when a molecule is spherical, theLipari–Szabo approach11,12 may still yield over-estimated order parameters and inaccurate overallrotational correlation times when internal motionsoccur on the same nanosecond time-scale as overalltumbling.14 A number of NMR relaxation-basedstudies on protein dynamics, including two onGB1,15,16 have reported the presence of someinternal motions occurring on the nanosecondtime-scale17 – 24. Most protein dynamics studies,however, do not, or perhaps cannot, accuratelyderive internal motional correlation times,primarily due to the paucity of NMR relaxationdata and limitations of the motional model(s)used. Inaccuracies in NMR-derived motional par-ameters clearly could lead to incorrect physicalinterpretations. Recently, we have developedapproaches to visualize and to analyze NMRrelaxation-derived spectral densities that provideinformation on the distribution of motional corre-lation times (the F(v) approach)25 and the fre-quency-dependence of order parameters (S 2(v)approach)26 that make no assumptions about thenumber or types of internal motions or about theshape of the molecule. The F(v) approach isdifferent from that of Peng & Wagner,27 whichprovides values of the spectral density functiononly at fixed frequencies.
The temperature dependence of NMR-derivedorder parameters and correlation times allows esti-mation of residual entropies (heat capacities)28,29
and motional energy barriers30 and, therefore, canprovide an experimental view of the energylandscape31,32 and insight into the thermalactivation of various motional modes in a protein.Several studies have used NMR relaxation toinvestigate contributions of backbone NHfluctuations to the heat capacity of the nativecalmodulin E140Q mutant C-terminal domain,33
the partially unfolded state of staphylcoccalnuclease,34 the unfolded state of the N-terminalSH3 domain from drk,28 ribonuclease H,18 andeven protein GB1.16 The present study was aimedat providing a more in depth investigation intothe relationship between thermodynamic stabilityand dynamics in the model protein GB1. NMRrelaxation parameters were acquired at threespectrometer frequencies and three different
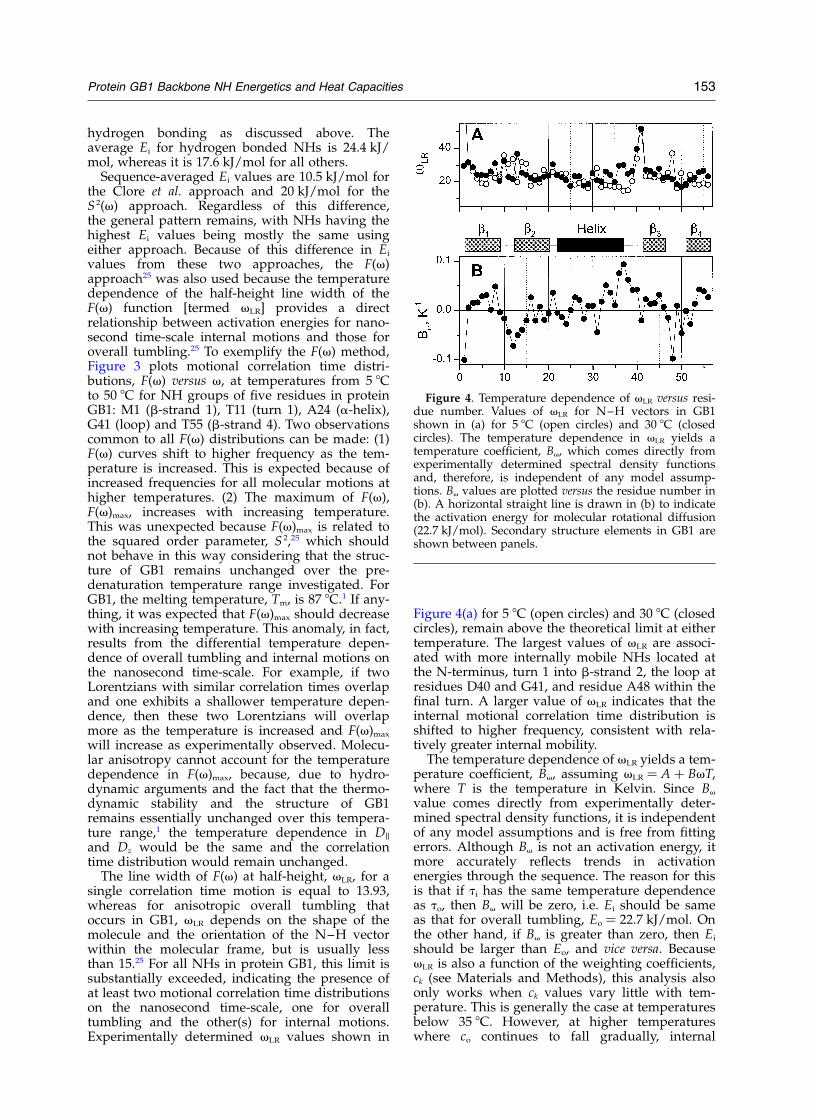
Figure 1. S 2(v) for NHs in protein GB1. S 2(v) functionsare shown for NH backbone bonds of three residues inprotein GB1 (T2, E19, D36). S 2(v) was calculated using15N NMR relaxation data acquired at three frequencies(500 MHz, 600 MHz and 800 MHz 1H spectrometerfrequencies) at temperatures from 5 8C to 50 8C asindicated in the Figure.
150 Protein GB1 Backbone NH Energetics and Heat Capacities
approaches were used to analyze relaxation dataand to derive internal motional correlationtimes and order parameters for estimation ofmotional activation energies and entropies (heatcapacities).
Results
15NH relaxation data (T1, T2 and {1H}-15N NOE)were acquired at three frequencies (1H frequenciesof 500 MHz, 600 MHz and 800 MHz) and at tem-peratures from 5 8C to 50 8C at intervals of 5 deg.C. These relaxation parameters have beendeposited in the BMRB. As expected, residues atthe N-terminus, turn 1 into b-strand 2 and G41 inthe loop display relaxation parameters (R1 ¼ 1/T1
and R2 ¼ 1/T2) indicative of more mobilesegments. This is consistent with previousrelaxation studies performed on GB1.15,16 Threemodel free approaches13,25,26 were used to analyzethese relaxation data and to derive internalmotional correlation times and order parametersfor estimation of motional activation energies andentropies (heat capacities).
Motional activation energies
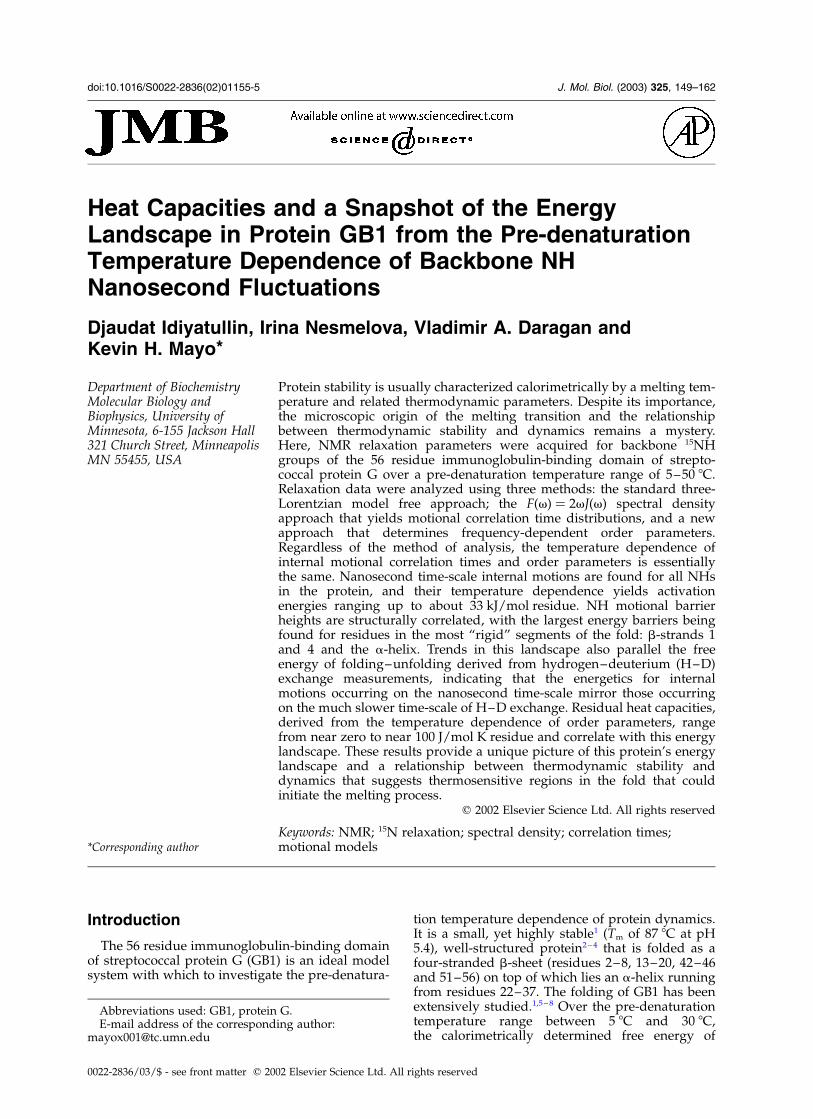
Frequency-dependent order parameters, S 2(v),are plotted versus correlation time (1/v) for resi-dues T2, E19 and D36 in Figure 1 for selected pre-denaturation temperatures from 5 8C to 50 8C. Atlower temperatures, two distinct inflections arenoted, one at correlation times between about 1 nsand 3 ns and one at a larger correlation time. Over-all tumbling correlation times, to, were derivedfrom the mid-point of the inflection at the largercorrelation time. These values, which are close tothose determined by Seewald et al.,16 are plottedversus residue number in Figure 2(a). Whereas thepresent analysis using relaxation data acquired at10 8C yields a sequence-averaged to value of5.9 ns, Seewald et al. reported a value of 5.2 ns,and at 30 8C, average to values are 3.9 ns and3.2 ns, respectively. Slightly larger to valuesobtained by using this new approach compared tothose from Seewald et al.16 result from our con-sideration of a larger number of motional modes,i.e. Lorentzians, and possibly the use of a largerrelaxation data set. Moreover, use of the S 2(v)approach is completely model free in that initialassumptions regarding molecular shape need notbe made. In fact, variations in to values shown in
Figure 2. to, ti and Ei valuesversus the residue number. to(a), ti
(b) and Ei (c) values are plotted forNH groups in GB1 versus residuenumber. to and ti values werederived from S 2(v) functions usingrelaxation data acquired at 5 8C asdescribed in the text. The insetexemplifies the temperature depen-dence of ti values for three residues(E27, V54 and E56). Ei values werederived from the slope of the tem-perature dependence of ti, assum-ing Arrhenius behavior. Ahorizontal straight line is drawn in(c) to indicate the activation energyfor molecular rotational diffusion(22.7 kJ/mol). Secondary structureelements in GB1 are indicated atthe bottom of (c).
Protein GB1 Backbone NH Energetics and Heat Capacities 151
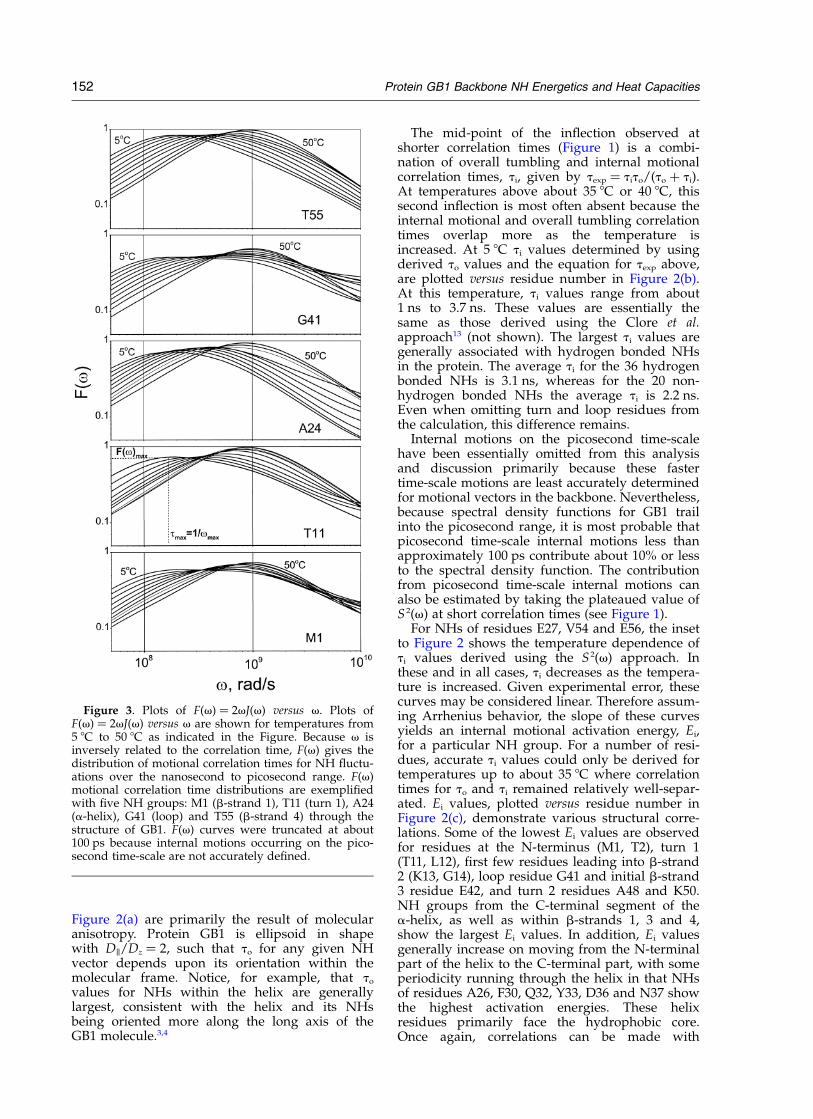
Figure 2(a) are primarily the result of molecularanisotropy. Protein GB1 is ellipsoid in shapewith Dk/Dz ¼ 2, such that to for any given NHvector depends upon its orientation within themolecular frame. Notice, for example, that to
values for NHs within the helix are generallylargest, consistent with the helix and its NHsbeing oriented more along the long axis of theGB1 molecule.3,4
The mid-point of the inflection observed atshorter correlation times (Figure 1) is a combi-nation of overall tumbling and internal motionalcorrelation times, ti, given by texp ¼ tito/(to þ ti).At temperatures above about 35 8C or 40 8C, thissecond inflection is most often absent because theinternal motional and overall tumbling correlationtimes overlap more as the temperature isincreased. At 5 8C ti values determined by usingderived to values and the equation for texp above,are plotted versus residue number in Figure 2(b).At this temperature, ti values range from about1 ns to 3.7 ns. These values are essentially thesame as those derived using the Clore et al.approach13 (not shown). The largest ti values aregenerally associated with hydrogen bonded NHsin the protein. The average ti for the 36 hydrogenbonded NHs is 3.1 ns, whereas for the 20 non-hydrogen bonded NHs the average ti is 2.2 ns.Even when omitting turn and loop residues fromthe calculation, this difference remains.
Internal motions on the picosecond time-scalehave been essentially omitted from this analysisand discussion primarily because these fastertime-scale motions are least accurately determinedfor motional vectors in the backbone. Nevertheless,because spectral density functions for GB1 trailinto the picosecond range, it is most probable thatpicosecond time-scale internal motions less thanapproximately 100 ps contribute about 10% or lessto the spectral density function. The contributionfrom picosecond time-scale internal motions canalso be estimated by taking the plateaued value ofS 2(v) at short correlation times (see Figure 1).
For NHs of residues E27, V54 and E56, the insetto Figure 2 shows the temperature dependence ofti values derived using the S 2(v) approach. Inthese and in all cases, ti decreases as the tempera-ture is increased. Given experimental error, thesecurves may be considered linear. Therefore assum-ing Arrhenius behavior, the slope of these curvesyields an internal motional activation energy, Ei,for a particular NH group. For a number of resi-dues, accurate ti values could only be derived fortemperatures up to about 35 8C where correlationtimes for to and ti remained relatively well-separ-ated. Ei values, plotted versus residue number inFigure 2(c), demonstrate various structural corre-lations. Some of the lowest Ei values are observedfor residues at the N-terminus (M1, T2), turn 1(T11, L12), first few residues leading into b-strand2 (K13, G14), loop residue G41 and initial b-strand3 residue E42, and turn 2 residues A48 and K50.NH groups from the C-terminal segment of thea-helix, as well as within b-strands 1, 3 and 4,show the largest Ei values. In addition, Ei valuesgenerally increase on moving from the N-terminalpart of the helix to the C-terminal part, with someperiodicity running through the helix in that NHsof residues A26, F30, Q32, Y33, D36 and N37 showthe highest activation energies. These helixresidues primarily face the hydrophobic core.Once again, correlations can be made with
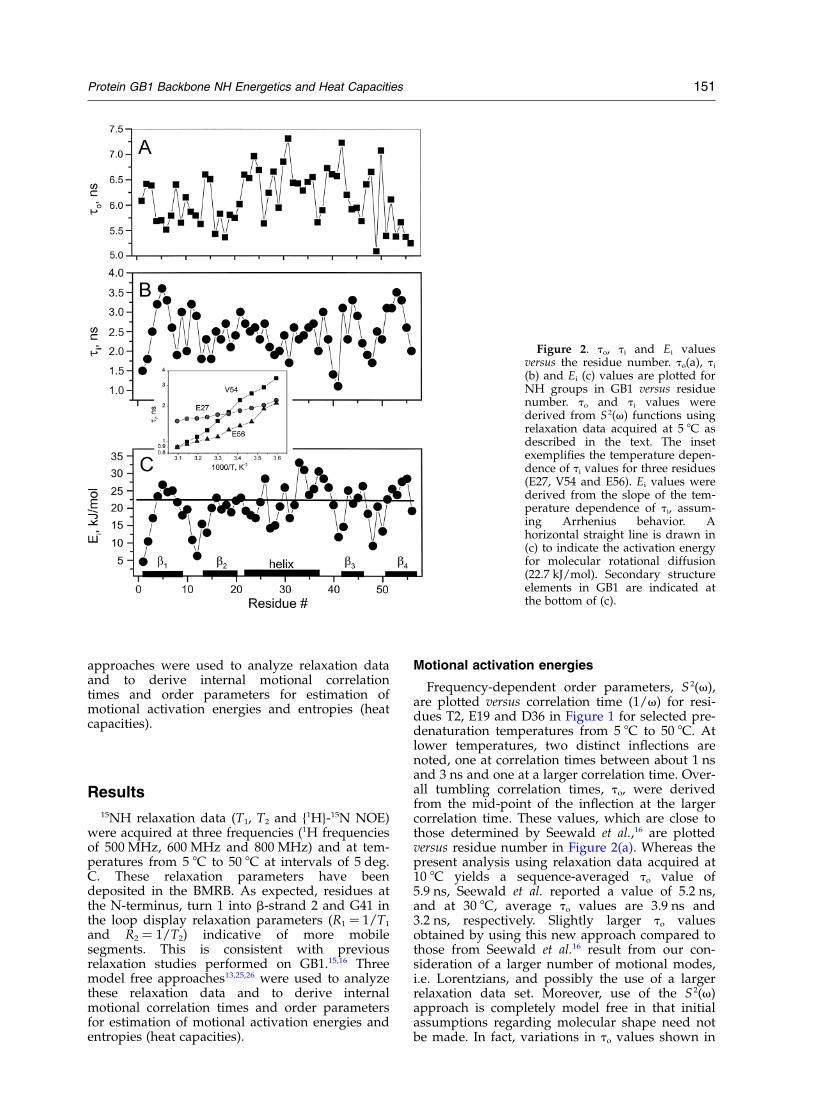
Figure 3. Plots of F(v) ¼ 2vJ(v) versus v. Plots ofF(v) ¼ 2vJ(v) versus v are shown for temperatures from5 8C to 50 8C as indicated in the Figure. Because v isinversely related to the correlation time, F(v) gives thedistribution of motional correlation times for NH fluctu-ations over the nanosecond to picosecond range. F(v)motional correlation time distributions are exemplifiedwith five NH groups: M1 (b-strand 1), T11 (turn 1), A24(a-helix), G41 (loop) and T55 (b-strand 4) through thestructure of GB1. F(v) curves were truncated at about100 ps because internal motions occurring on the pico-second time-scale are not accurately defined.
152 Protein GB1 Backbone NH Energetics and Heat Capacities
hydrogen bonding as discussed above. Theaverage Ei for hydrogen bonded NHs is 24.4 kJ/mol, whereas it is 17.6 kJ/mol for all others.
Sequence-averaged Ei values are 10.5 kJ/mol forthe Clore et al. approach and 20 kJ/mol for theS 2(v) approach. Regardless of this difference,the general pattern remains, with NHs having thehighest Ei values being mostly the same usingeither approach. Because of this difference in Ei
values from these two approaches, the F(v)approach25 was also used because the temperaturedependence of the half-height line width of theF(v) function [termed vLR] provides a directrelationship between activation energies for nano-second time-scale internal motions and those foroverall tumbling.25 To exemplify the F(v) method,Figure 3 plots motional correlation time distri-butions, F(v) versus v, at temperatures from 5 8Cto 50 8C for NH groups of five residues in proteinGB1: M1 (b-strand 1), T11 (turn 1), A24 (a-helix),G41 (loop) and T55 (b-strand 4). Two observationscommon to all F(v) distributions can be made: (1)F(v) curves shift to higher frequency as the tem-perature is increased. This is expected because ofincreased frequencies for all molecular motions athigher temperatures. (2) The maximum of F(v),F(v)max, increases with increasing temperature.This was unexpected because F(v)max is related tothe squared order parameter, S 2,25 which shouldnot behave in this way considering that the struc-ture of GB1 remains unchanged over the pre-denaturation temperature range investigated. ForGB1, the melting temperature, Tm, is 87 8C.1 If any-thing, it was expected that F(v)max should decreasewith increasing temperature. This anomaly, in fact,results from the differential temperature depen-dence of overall tumbling and internal motions onthe nanosecond time-scale. For example, if twoLorentzians with similar correlation times overlapand one exhibits a shallower temperature depen-dence, then these two Lorentzians will overlapmore as the temperature is increased and F(v)max
will increase as experimentally observed. Molecu-lar anisotropy cannot account for the temperaturedependence in F(v)max, because, due to hydro-dynamic arguments and the fact that the thermo-dynamic stability and the structure of GB1remains essentially unchanged over this tempera-ture range,1 the temperature dependence in Dk
and Dz would be the same and the correlationtime distribution would remain unchanged.
The line width of F(v) at half-height, vLR, for asingle correlation time motion is equal to 13.93,whereas for anisotropic overall tumbling thatoccurs in GB1, vLR depends on the shape of themolecule and the orientation of the N–H vectorwithin the molecular frame, but is usually lessthan 15.25 For all NHs in protein GB1, this limit issubstantially exceeded, indicating the presence ofat least two motional correlation time distributionson the nanosecond time-scale, one for overalltumbling and the other(s) for internal motions.Experimentally determined vLR values shown in
Figure 4(a) for 5 8C (open circles) and 30 8C (closedcircles), remain above the theoretical limit at eithertemperature. The largest values of vLR are associ-ated with more internally mobile NHs located atthe N-terminus, turn 1 into b-strand 2, the loop atresidues D40 and G41, and residue A48 within thefinal turn. A larger value of vLR indicates that theinternal motional correlation time distribution isshifted to higher frequency, consistent with rela-tively greater internal mobility.
The temperature dependence of vLR yields a tem-perature coefficient, Bv, assuming vLR ¼ A þ BvT,where T is the temperature in Kelvin. Since Bv
value comes directly from experimentally deter-mined spectral density functions, it is independentof any model assumptions and is free from fittingerrors. Although Bv is not an activation energy, itmore accurately reflects trends in activationenergies through the sequence. The reason for thisis that if ti has the same temperature dependenceas to, then Bv will be zero, i.e. Ei should be sameas that for overall tumbling, Eo ¼ 22.7 kJ/mol. Onthe other hand, if Bv is greater than zero, then Ei
should be larger than Eo, and vice versa. BecausevLR is also a function of the weighting coefficients,ck (see Materials and Methods), this analysis alsoonly works when ck values vary little with tem-perature. This is generally the case at temperaturesbelow 35 8C. However, at higher temperatureswhere co continues to fall gradually, internal
Figure 4. Temperature dependence of vLR versus resi-due number. Values of vLR for N–H vectors in GB1shown in (a) for 5 8C (open circles) and 30 8C (closedcircles). The temperature dependence in vLR yields atemperature coefficient, Bv, which comes directly fromexperimentally determined spectral density functionsand, therefore, is independent of any model assump-tions. Bv values are plotted versus the residue number in(b). A horizontal straight line is drawn in (b) to indicatethe activation energy for molecular rotational diffusion(22.7 kJ/mol). Secondary structure elements in GB1 areshown between panels.
Protein GB1 Backbone NH Energetics and Heat Capacities 153

motional distributions vary considerably, makingthis approach inaccurate. Therefore, the tempera-ture dependence of vLR was analyzed only from5 8C to 30 8C. Bv values are plotted versus residuenumber in Figure 4(b). A line is shown throughthe Bv value of zero, where Ei ¼ 22.7 kJ/mol. Forall other residues, Ei values are only relative. Bv
values reflect essentially the same trend asobserved for Ei values derived using the S 2(v)approach (Figure 2), lending greater confidence tothe derived energy landscape.
Entropy and heat capacity
Entropies for NH motions were derived usingorder parameters28,29 and their temperature depen-dence was used to determine contributions to theheat capacity from these fluctuations.16,18,33,34 Orderparameters for NHs in protein GB1 were derivedfrom analyses described above and are displayedin Figure 5 for 5 8C. Order parameters derivedusing both the Clore et al.13 (continuous line) andF(v)25 (open squares) approaches are shown andare comparable. Those derived using the S 2(v)and exemplified in Figure 1 are essentially thesame. Because order parameters are dependent
upon the frequency range over which motionsoccur, the S 2(v) approach has an advantage in thatthese order parameters can be used directly tocalculate frequency-dependent entropy terms.Analysis using the Clore et al. and F(v) approachesyields generalized order parameters S 2. To showthe overall quality of the data, the inset to Figure 5plots the temperature dependence of order par-ameters for T2 and E27. Given errors inherent indetermining S 2 values, these curves should beconsidered linear.
Heat capacities, Cp, derived using order par-ameters from the Clore et al. and S 2(v) approachesare plotted in Figures 6(a) and (b), respectively,along with errors determined from fits to curvesfor the temperature dependence of the orderparameters. As with Ei values, Cp values vary con-siderably through the sequence. The largest Cp
values are observed for residues in b-strands 1and 4 and in the a-helix. b-strands 1 and 4 are thetwo central strands of the 4-stranded b-sheet ontop of which is folded the helix. Outer strands 2and 3 show some of the lowest Cp values. Althougherrors in determining Cp values using order par-ameters from either method are substantial, it issupportive to note that two different methods
Figure 5. 15NH order parameters versus residue number. 15NH order parameters, S 2 are plotted versus the residuenumber. Data were acquired at 5 8C. Order parameters were obtained using the Clore et al. method (continuous line)and the F(v) deconvolution approach (open squares) as described in Materials and Methods. Secondary structureelements in GB1 are shown at the top of the figure.
154 Protein GB1 Backbone NH Energetics and Heat Capacities
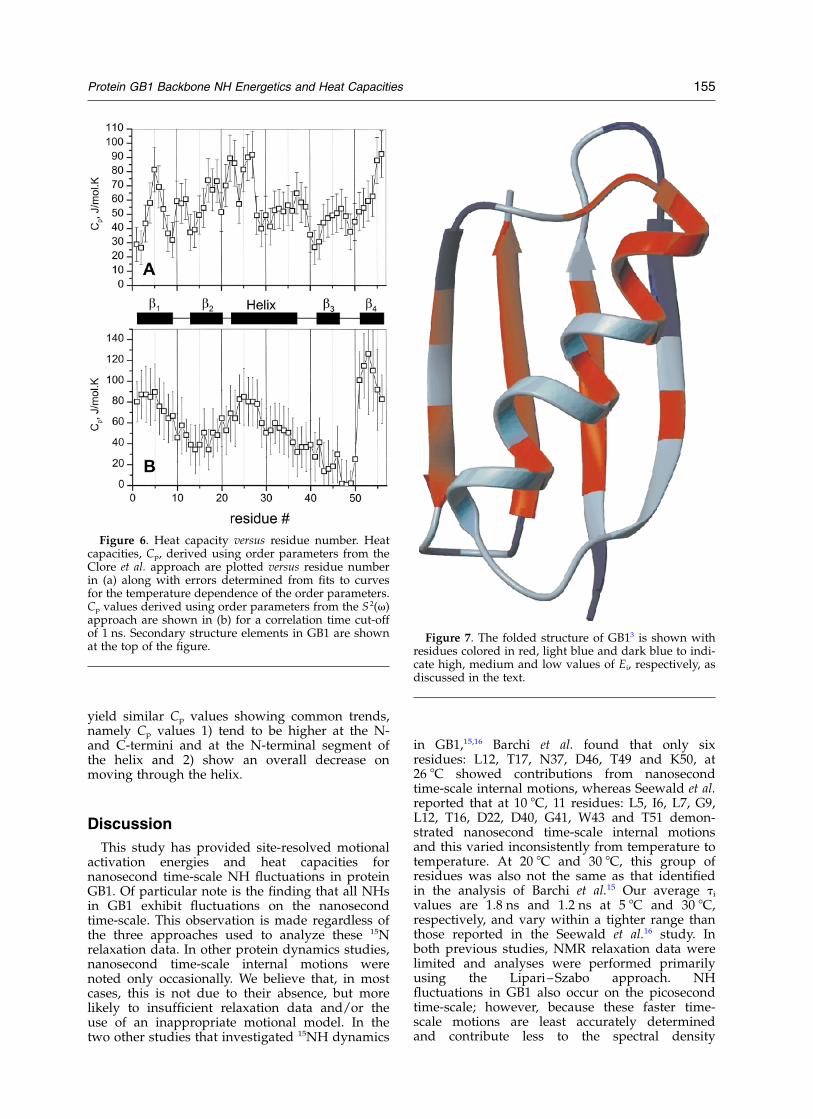
yield similar Cp values showing common trends,namely Cp values 1) tend to be higher at the N-and C-termini and at the N-terminal segment ofthe helix and 2) show an overall decrease onmoving through the helix.
Discussion
This study has provided site-resolved motionalactivation energies and heat capacities fornanosecond time-scale NH fluctuations in proteinGB1. Of particular note is the finding that all NHsin GB1 exhibit fluctuations on the nanosecondtime-scale. This observation is made regardless ofthe three approaches used to analyze these 15Nrelaxation data. In other protein dynamics studies,nanosecond time-scale internal motions werenoted only occasionally. We believe that, in mostcases, this is not due to their absence, but morelikely to insufficient relaxation data and/or theuse of an inappropriate motional model. In thetwo other studies that investigated 15NH dynamics
in GB1,15,16 Barchi et al. found that only sixresidues: L12, T17, N37, D46, T49 and K50, at26 8C showed contributions from nanosecondtime-scale internal motions, whereas Seewald et al.reported that at 10 8C, 11 residues: L5, I6, L7, G9,L12, T16, D22, D40, G41, W43 and T51 demon-strated nanosecond time-scale internal motionsand this varied inconsistently from temperature totemperature. At 20 8C and 30 8C, this group ofresidues was also not the same as that identifiedin the analysis of Barchi et al.15 Our average ti
values are 1.8 ns and 1.2 ns at 5 8C and 30 8C,respectively, and vary within a tighter range thanthose reported in the Seewald et al.16 study. Inboth previous studies, NMR relaxation data werelimited and analyses were performed primarilyusing the Lipari–Szabo approach. NHfluctuations in GB1 also occur on the picosecondtime-scale; however, because these faster time-scale motions are least accurately determinedand contribute less to the spectral density
Figure 6. Heat capacity versus residue number. Heatcapacities, Cp, derived using order parameters from theClore et al. approach are plotted versus residue numberin (a) along with errors determined from fits to curvesfor the temperature dependence of the order parameters.Cp values derived using order parameters from the S 2(v)approach are shown in (b) for a correlation time cut-offof 1 ns. Secondary structure elements in GB1 are shownat the top of the figure.
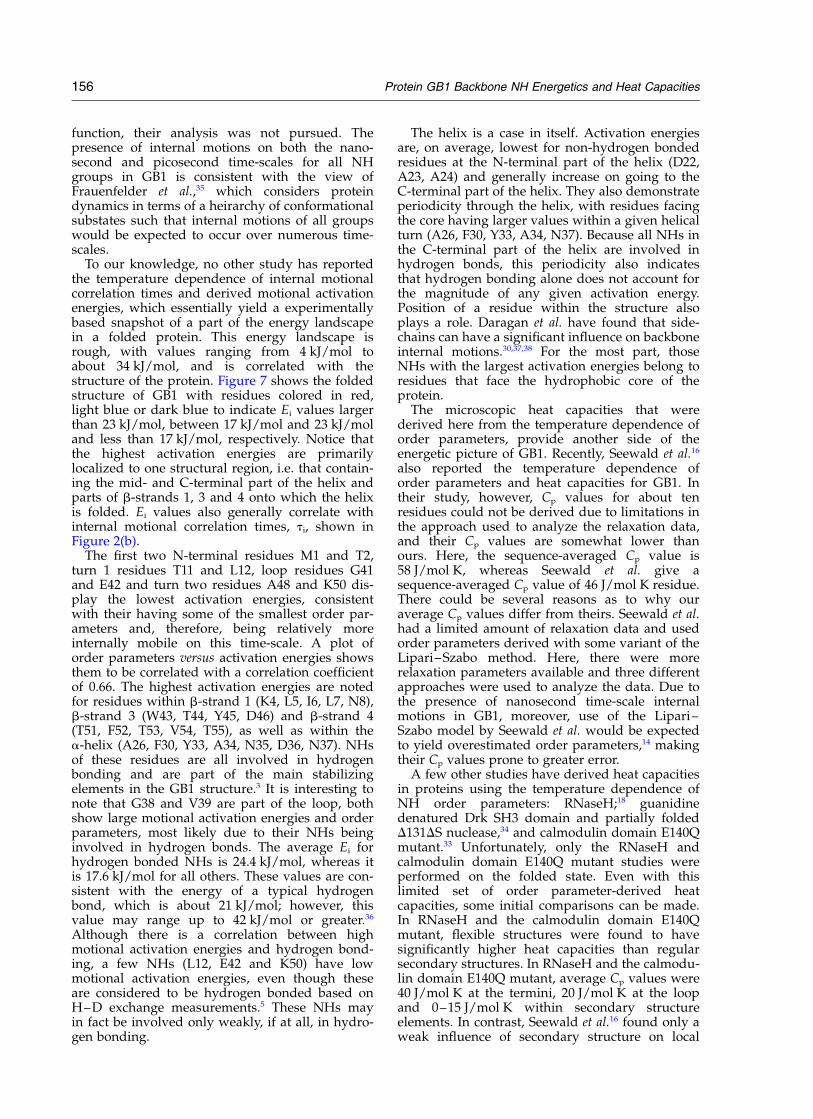
Figure 7. The folded structure of GB13 is shown withresidues colored in red, light blue and dark blue to indi-cate high, medium and low values of Ei, respectively, asdiscussed in the text.
Protein GB1 Backbone NH Energetics and Heat Capacities 155
function, their analysis was not pursued. Thepresence of internal motions on both the nano-second and picosecond time-scales for all NHgroups in GB1 is consistent with the view ofFrauenfelder et al.,35 which considers proteindynamics in terms of a heirarchy of conformationalsubstates such that internal motions of all groupswould be expected to occur over numerous time-scales.
To our knowledge, no other study has reportedthe temperature dependence of internal motionalcorrelation times and derived motional activationenergies, which essentially yield a experimentallybased snapshot of a part of the energy landscapein a folded protein. This energy landscape isrough, with values ranging from 4 kJ/mol toabout 34 kJ/mol, and is correlated with thestructure of the protein. Figure 7 shows the foldedstructure of GB1 with residues colored in red,light blue or dark blue to indicate Ei values largerthan 23 kJ/mol, between 17 kJ/mol and 23 kJ/moland less than 17 kJ/mol, respectively. Notice thatthe highest activation energies are primarilylocalized to one structural region, i.e. that contain-ing the mid- and C-terminal part of the helix andparts of b-strands 1, 3 and 4 onto which the helixis folded. Ei values also generally correlate withinternal motional correlation times, ti, shown inFigure 2(b).
The first two N-terminal residues M1 and T2,turn 1 residues T11 and L12, loop residues G41and E42 and turn two residues A48 and K50 dis-play the lowest activation energies, consistentwith their having some of the smallest order par-ameters and, therefore, being relatively moreinternally mobile on this time-scale. A plot oforder parameters versus activation energies showsthem to be correlated with a correlation coefficientof 0.66. The highest activation energies are notedfor residues within b-strand 1 (K4, L5, I6, L7, N8),b-strand 3 (W43, T44, Y45, D46) and b-strand 4(T51, F52, T53, V54, T55), as well as within thea-helix (A26, F30, Y33, A34, N35, D36, N37). NHsof these residues are all involved in hydrogenbonding and are part of the main stabilizingelements in the GB1 structure.3 It is interesting tonote that G38 and V39 are part of the loop, bothshow large motional activation energies and orderparameters, most likely due to their NHs beinginvolved in hydrogen bonds. The average Ei forhydrogen bonded NHs is 24.4 kJ/mol, whereas itis 17.6 kJ/mol for all others. These values are con-sistent with the energy of a typical hydrogenbond, which is about 21 kJ/mol; however, thisvalue may range up to 42 kJ/mol or greater.36
Although there is a correlation between highmotional activation energies and hydrogen bond-ing, a few NHs (L12, E42 and K50) have lowmotional activation energies, even though theseare considered to be hydrogen bonded based onH–D exchange measurements.5 These NHs mayin fact be involved only weakly, if at all, in hydro-gen bonding.
The helix is a case in itself. Activation energiesare, on average, lowest for non-hydrogen bondedresidues at the N-terminal part of the helix (D22,A23, A24) and generally increase on going to theC-terminal part of the helix. They also demonstrateperiodicity through the helix, with residues facingthe core having larger values within a given helicalturn (A26, F30, Y33, A34, N37). Because all NHs inthe C-terminal part of the helix are involved inhydrogen bonds, this periodicity also indicatesthat hydrogen bonding alone does not account forthe magnitude of any given activation energy.Position of a residue within the structure alsoplays a role. Daragan et al. have found that side-chains can have a significant influence on backboneinternal motions.30,37,38 For the most part, thoseNHs with the largest activation energies belong toresidues that face the hydrophobic core of theprotein.
The microscopic heat capacities that werederived here from the temperature dependence oforder parameters, provide another side of theenergetic picture of GB1. Recently, Seewald et al.16
also reported the temperature dependence oforder parameters and heat capacities for GB1. Intheir study, however, Cp values for about tenresidues could not be derived due to limitations inthe approach used to analyze the relaxation data,and their Cp values are somewhat lower thanours. Here, the sequence-averaged Cp value is58 J/mol K, whereas Seewald et al. give asequence-averaged Cp value of 46 J/mol K residue.There could be several reasons as to why ouraverage Cp values differ from theirs. Seewald et al.had a limited amount of relaxation data and usedorder parameters derived with some variant of theLipari–Szabo method. Here, there were morerelaxation parameters available and three differentapproaches were used to analyze the data. Due tothe presence of nanosecond time-scale internalmotions in GB1, moreover, use of the Lipari–Szabo model by Seewald et al. would be expectedto yield overestimated order parameters,14 makingtheir Cp values prone to greater error.
A few other studies have derived heat capacitiesin proteins using the temperature dependence ofNH order parameters: RNaseH;18 guanidinedenatured Drk SH3 domain and partially foldedD131DS nuclease,34 and calmodulin domain E140Qmutant.33 Unfortunately, only the RNaseH andcalmodulin domain E140Q mutant studies wereperformed on the folded state. Even with thislimited set of order parameter-derived heatcapacities, some initial comparisons can be made.In RNaseH and the calmodulin domain E140Qmutant, flexible structures were found to havesignificantly higher heat capacities than regularsecondary structures. In RNaseH and the calmodu-lin domain E140Q mutant, average Cp values were40 J/mol K at the termini, 20 J/mol K at the loopand 0–15 J/mol K within secondary structureelements. In contrast, Seewald et al.16 found only aweak influence of secondary structure on local
156 Protein GB1 Backbone NH Energetics and Heat Capacities
heat capacity, with secondary structures exhibitinga somewhat larger Cp value (48 J/mol K in b-sheetand helix, compared to 37 J/mol K in otherresidues). Our results on GB1 indicate that NHswithin some of the most rigid parts of the molecule(b-strands 1 and 4 and the a-helix) generally doexhibit the highest heat capacities. Residues fromb-strands 1 and 4 and the a-helix form the core ofthe folded protein. b-strands 2 and 3, which arethe outer strands in the 4-stranded b-sheet, havesome of the lowest values. On the other hand, tworelatively flexible regions (the N-terminus andturn 1) have some of the highest values as well,and the more rigid C-terminal segment of thehelix has Cp values lower than its more “flexible”N-terminal segment. This suggests that any corre-lations are not absolute, and it may depend partlyon the position in the folded structure, rather thanspecifically within any secondary structuralelement. There are, however, correlations amongheat capacity, activation energy and, surprisingly,the free energy for transient opening of the foldedstructure, DGop, of GB1 derived from H–Dexchange measurements.5 These correlations willbe discussed in the following paragraphs.
If motional amplitudes alone contribute to theorder parameter, energy landscape parameters forinternal motions should be correlated to heatcapacity, as would be the case for a harmonic oscil-lator where Cp increases both with temperatureand with decreasing force constant.39 This isgenerally the case for fast internal motions on thepicosecond time-scale, which can be considered aslow amplitude oscillations within a potential well.Previous studies that investigated the temperaturedependence of order parameters,16,18,33,34 essentiallymade this assumption by the very nature of theiranalyses and by omission of NHs that showedinternal motions greater than a few hundred pico-seconds. To analyze the relationship between theheat capacity and energetic parameters for largeramplitude, nanosecond time-scale motions, con-sider a simple model of molecular motion whereinthere is a single axis with rotational jumps betweentwo non-equivalent states as illustrated in the insetto Figure 8. Rather than swinging within thebottom of a potential well as would be the casewith picosecond time-scale motions, tetrahedralgeometry was assumed. For this model, thesquared order parameter, S 2 can be written30 as:
S2 ¼ 1 2 P1P28
27sin2 Df
2þ
16
27sin2Df
� �ð1Þ
where P1 and P2 are the probabilities of occupyingstates 1 and 2, respectively, and Df is the angulardifference between the states. With P1 þ P2 ¼ 1and Pk ¼ constant% expð2Ek=RTÞ:
P1P2 ¼ expð2DE=RTÞ=ð1 þ expð2DE=RTÞÞ2 ð2Þ
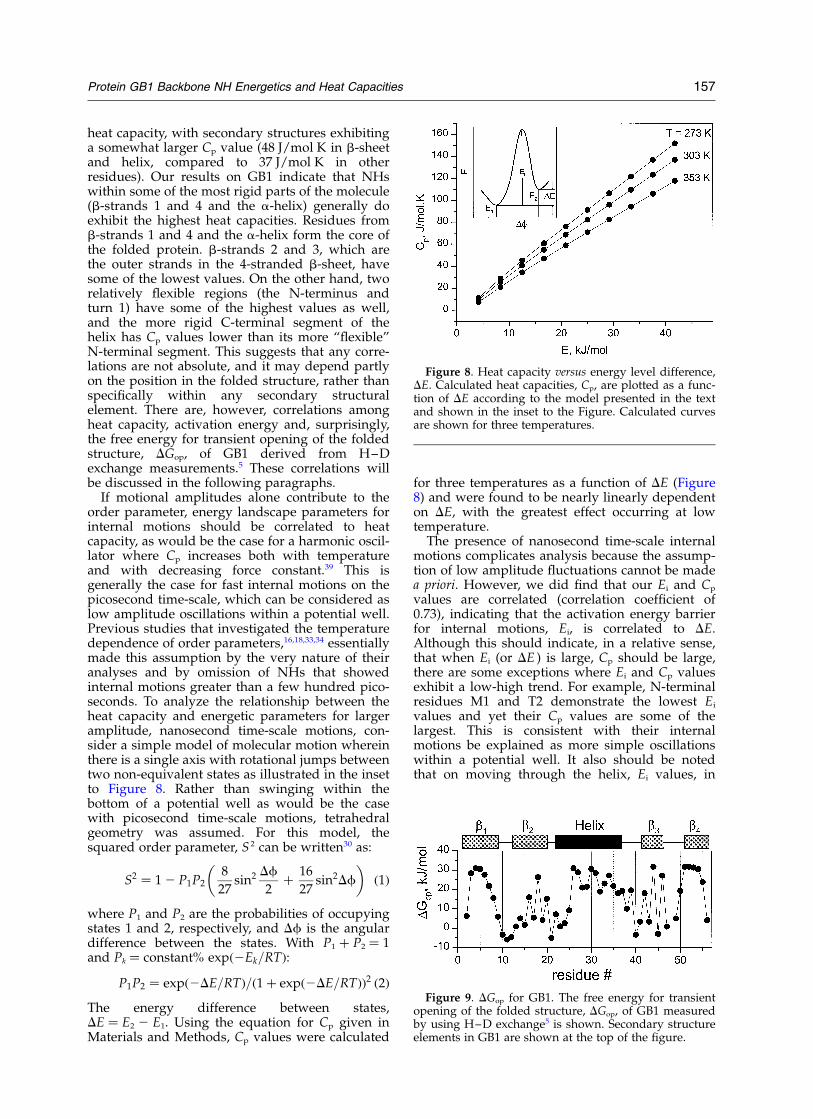
The energy difference between states,DE ¼ E2 2 E1. Using the equation for Cp given inMaterials and Methods, Cp values were calculated
for three temperatures as a function of DE (Figure8) and were found to be nearly linearly dependenton DE, with the greatest effect occurring at lowtemperature.
The presence of nanosecond time-scale internalmotions complicates analysis because the assump-tion of low amplitude fluctuations cannot be madea priori. However, we did find that our Ei and Cp
values are correlated (correlation coefficient of0.73), indicating that the activation energy barrierfor internal motions, Ei, is correlated to DE.Although this should indicate, in a relative sense,that when Ei (or DE ) is large, Cp should be large,there are some exceptions where Ei and Cp valuesexhibit a low-high trend. For example, N-terminalresidues M1 and T2 demonstrate the lowest Ei
values and yet their Cp values are some of thelargest. This is consistent with their internalmotions be explained as more simple oscillationswithin a potential well. It also should be notedthat on moving through the helix, Ei values, in
Figure 8. Heat capacity versus energy level difference,DE. Calculated heat capacities, Cp, are plotted as a func-tion of DE according to the model presented in the textand shown in the inset to the Figure. Calculated curvesare shown for three temperatures.
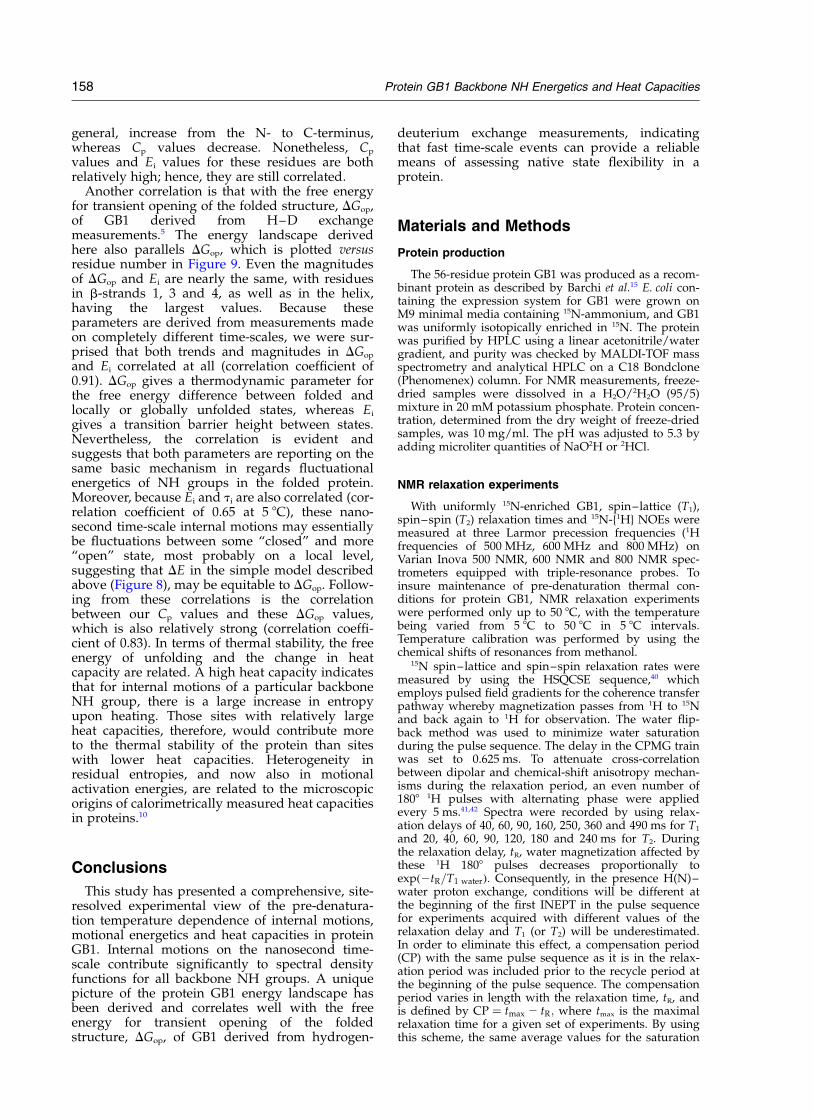
Figure 9. DGop for GB1. The free energy for transientopening of the folded structure, DGop, of GB1 measuredby using H–D exchange5 is shown. Secondary structureelements in GB1 are shown at the top of the figure.
Protein GB1 Backbone NH Energetics and Heat Capacities 157
general, increase from the N- to C-terminus,whereas Cp values decrease. Nonetheless, Cp
values and Ei values for these residues are bothrelatively high; hence, they are still correlated.
Another correlation is that with the free energyfor transient opening of the folded structure, DGop,of GB1 derived from H–D exchangemeasurements.5 The energy landscape derivedhere also parallels DGop, which is plotted versusresidue number in Figure 9. Even the magnitudesof DGop and Ei are nearly the same, with residuesin b-strands 1, 3 and 4, as well as in the helix,having the largest values. Because theseparameters are derived from measurements madeon completely different time-scales, we were sur-prised that both trends and magnitudes in DGop
and Ei correlated at all (correlation coefficient of0.91). DGop gives a thermodynamic parameter forthe free energy difference between folded andlocally or globally unfolded states, whereas Ei
gives a transition barrier height between states.Nevertheless, the correlation is evident andsuggests that both parameters are reporting on thesame basic mechanism in regards fluctuationalenergetics of NH groups in the folded protein.Moreover, because Ei and ti are also correlated (cor-relation coefficient of 0.65 at 5 8C), these nano-second time-scale internal motions may essentiallybe fluctuations between some “closed” and more“open” state, most probably on a local level,suggesting that DE in the simple model describedabove (Figure 8), may be equitable to DGop. Follow-ing from these correlations is the correlationbetween our Cp values and these DGop values,which is also relatively strong (correlation coeffi-cient of 0.83). In terms of thermal stability, the freeenergy of unfolding and the change in heatcapacity are related. A high heat capacity indicatesthat for internal motions of a particular backboneNH group, there is a large increase in entropyupon heating. Those sites with relatively largeheat capacities, therefore, would contribute moreto the thermal stability of the protein than siteswith lower heat capacities. Heterogeneity inresidual entropies, and now also in motionalactivation energies, are related to the microscopicorigins of calorimetrically measured heat capacitiesin proteins.10
Conclusions
This study has presented a comprehensive, site-resolved experimental view of the pre-denatura-tion temperature dependence of internal motions,motional energetics and heat capacities in proteinGB1. Internal motions on the nanosecond time-scale contribute significantly to spectral densityfunctions for all backbone NH groups. A uniquepicture of the protein GB1 energy landscape hasbeen derived and correlates well with the freeenergy for transient opening of the foldedstructure, DGop, of GB1 derived from hydrogen-
deuterium exchange measurements, indicatingthat fast time-scale events can provide a reliablemeans of assessing native state flexibility in aprotein.
Materials and Methods
Protein production
The 56-residue protein GB1 was produced as a recom-binant protein as described by Barchi et al.15 E. coli con-taining the expression system for GB1 were grown onM9 minimal media containing 15N-ammonium, and GB1was uniformly isotopically enriched in 15N. The proteinwas purified by HPLC using a linear acetonitrile/watergradient, and purity was checked by MALDI-TOF massspectrometry and analytical HPLC on a C18 Bondclone(Phenomenex) column. For NMR measurements, freeze-dried samples were dissolved in a H2O/2H2O (95/5)mixture in 20 mM potassium phosphate. Protein concen-tration, determined from the dry weight of freeze-driedsamples, was 10 mg/ml. The pH was adjusted to 5.3 byadding microliter quantities of NaO2H or 2HCl.
NMR relaxation experiments
With uniformly 15N-enriched GB1, spin–lattice (T1),spin–spin (T2) relaxation times and 15N-{1H} NOEs weremeasured at three Larmor precession frequencies (1Hfrequencies of 500 MHz, 600 MHz and 800 MHz) onVarian Inova 500 NMR, 600 NMR and 800 NMR spec-trometers equipped with triple-resonance probes. Toinsure maintenance of pre-denaturation thermal con-ditions for protein GB1, NMR relaxation experimentswere performed only up to 50 8C, with the temperaturebeing varied from 5 8C to 50 8C in 5 8C intervals.Temperature calibration was performed by using thechemical shifts of resonances from methanol.
15N spin–lattice and spin–spin relaxation rates weremeasured by using the HSQCSE sequence,40 whichemploys pulsed field gradients for the coherence transferpathway whereby magnetization passes from 1H to 15Nand back again to 1H for observation. The water flip-back method was used to minimize water saturationduring the pulse sequence. The delay in the CPMG trainwas set to 0.625 ms. To attenuate cross-correlationbetween dipolar and chemical-shift anisotropy mechan-isms during the relaxation period, an even number of1808 1H pulses with alternating phase were appliedevery 5 ms.41,42 Spectra were recorded by using relax-ation delays of 40, 60, 90, 160, 250, 360 and 490 ms for T1
and 20, 40, 60, 90, 120, 180 and 240 ms for T2. Duringthe relaxation delay, tR, water magnetization affected bythese 1H 1808 pulses decreases proportionally toexpð2tR=T1 waterÞ: Consequently, in the presence H(N)–water proton exchange, conditions will be different atthe beginning of the first INEPT in the pulse sequencefor experiments acquired with different values of therelaxation delay and T1 (or T2) will be underestimated.In order to eliminate this effect, a compensation period(CP) with the same pulse sequence as it is in the relax-ation period was included prior to the recycle period atthe beginning of the pulse sequence. The compensationperiod varies in length with the relaxation time, tR, andis defined by CP ¼ tmax 2 tR; where tmax is the maximalrelaxation time for a given set of experiments. By usingthis scheme, the same average values for the saturation
158 Protein GB1 Backbone NH Energetics and Heat Capacities
of water and protein resonances have been achieved. Italso allows one to avoid different sample heating duringthe set of relaxation experiments with various relaxationdelays. Recovery of magnetization of nuclei from theprotein depends only on the recycle period because 1H1808 pulses prohibit recovery of magnetization duringthe compensation period. For all T1 and T2 experiments,the recycle period was 1.7 seconds, and all relaxationcurves followed single exponential decay.
Steady-state {1H}-15N NOEs were determined fromthree spectra recorded with proton broadbandirradiation and in the absence of proton saturation withdifferent water saturation conditions to compensate forH(N)–water proton exchange.43 Saturation was achievedby application of 1208 1H pulses applied every 5 ms44
during recycle times of three seconds.
Relaxation data analysis
Using these 15N relaxation data, F(v) ¼ 2vJ(v) curves,which are independent of any motional model, weredetermined over the frequency range0 , v , 6.28 £ 109 rad/s by using the Monte–Carlominimization protocol as described by Idiyatullin et al.25
Because v is inversely related to the correlation time,these plots give the distribution of motional correlationtimes over the nanosecond to picosecond range. Thesedistributions are truncated at about 100 ps because ofinaccuracies in determining F(v) at shorter correlationtimes, i.e. higher frequencies, where actual experimentaldata are lacking. Three main parameters define F(v):F(v)max, tmax, and vLR. F(v)max is the absolute maximumvalue of F(v) and is equal to or larger than the squaredorder parameter.S 2 When correlation times for internalmotions and overall tumbling are closer in value, thereexists a larger the difference in S 2 and F(v)max. tmax isthe inverse of the frequency v at F(v)max. With well-separated correlation time distributions for overalltumbling and internal motion, tmax will be close to thevalue of the correlation time for overall tumbling, to.However, if internal motions have correlation timesclose to to, the value tmax will be less than the value ofto. The last parameter, vLR, is the line width at half-heightof F(v). In effect, vLR ¼ vR/vL, where vR and vL are thehigh and low frequency positions taken at the half-heightof F(v), i.e. F(vR) ¼ F(vL) ¼ 0.5F(v)max. If the molecule isspherical and the spectral density function can bedescribed by a single Lorentzian, then vLR ¼ 13.9. Thismethod is based on the spectral density function, J(v),as a sum of Lorentzians:
JðvÞ ¼c0t0
1 þ v2t20
þc1t1
1 þ ðvt1Þ2þ · · · þ
cNtN
1 þ ðvtNÞ2
ð3Þ
where ci are weighting coefficients related to motionalrestriction parameters with
Pci ¼ 1: For isotropic overall
tumbling, c0, for example, is equal toS 2 ¼ S1
2 £ S22 £ S3
2 £ …, where Sk2 is the squared order par-
ameter for motions with correlation time tk. For manytypes of internal motions, F(v) can be expressed as:
FðvÞ ¼ coFoðvÞ þXN
i¼1
2vciti
1 þ v2t21
with
XN
i¼0
ci ¼ 1 ð4Þ
where Fo(v) is the function F(v) for overall tumbling
alone. This term can be written as:
FoðvÞ ¼XN
i¼1
2vaiti
1 þ v2t21
with
XN
i¼1
ai ¼ 1 ð5Þ
For isotropic overall tumbling, N ¼ 1; whereas forsymmetric top type motions, N ¼ 3, and so on. Theweighting coefficient, c0, can be interpreted as thesquared order parameter, S 2.
In the F(v) approach, order parameters are derived bydeconvoluting F(v) into components for overalltumbling, Fo(v), and internal motions, Fi(v), as describedby Idiyatullin et al.25 The maximum of Fo(v) gives thecoefficient c0 (equation 1), which essentially is the gener-alized order parameter, S 2, or S 2
s from the Clore et al.method.13
Another approach to interpret the experimental data isto use frequency-dependent order parameters,26 whichare independent of overall tumbling and describeinternal motional restrictions with correlation timesdefined over some specific frequency region. Correlationtimes in equation 3 with k . 0 are modified by to, i.e.tk ¼ tR
k to/(tRk þ to), with tR
k being the actual internalmotional correlation time. N is the number of internalmotional correlation times or motional modes.
The function S 2(v) is defined as the squared order par-ameter governing motions for any tk less than somevalue of 1/v. If the terms in equation 3 are sorted astk . tkþ1, one can write:
S2ðvÞ ¼ 1 2XN
i¼k
ci ð6Þ
where k is the motional mode number for 1/ti . v. Theparameter S 2(v) has a very simple physical meaning: itis the squared order parameter for all motions withmotional frequencies which are greater than v. Becausethere is no dependence of S 2(v) on to when v is largerthan 1/to, the use of S 2(v) is a convenient way to analyzeand compare internal motional amplitudes and frequen-cies in proteins with different shapes and sizes.
According to equation 4, to is the largest correlationtime, and S 2(v) is related to the generalized order par-ameter, S 2, by:
lim S2ðv=t0Þ ¼ S2 ð7Þ
Determination of S 2 devoid of significant contributionsfrom overall tumbling, is difficult due to the presence oflow frequency motions having correlation times tk ¼ to-
tRk /(to þ tR
k ) close to to. This makes separation of theseinternal motional modes from overall tumbling motionspractically impossible, and therefore the resulting valuesof S 2 will always be a function of to. Using S 2(v) at lowerthan v ¼ 1/to frequencies allows one to avoid thisproblem.
To use this method, one needs to determine the coeffi-cients ci and correlation times tk, for k ¼ 0, 1,…, N, withN being as large as possible for any given set of experi-mental data. With three relaxation parameters, e.g. T1,T2 and NOE, acquired at three magnetic field strengths,there are nine experimental parameters that can be usedto determine up to nine theoretical parameters, i.e. fiveLorentzians in equation 3 if one takes into account thatP
ck ¼ 1. Although it is practically impossible to obtain
Protein GB1 Backbone NH Energetics and Heat Capacities 159

reliable values of ck and tk for N . 2, linear combinationsof ck and tk and sums of Lorentzian-type funtcions oversome frequency range are very stable and can be deter-mined accurately.25,45 This is the key to obtaining F(v)and S 2(v) values from experiment. It is worth mention-ing that using a larger number of Lorentzians thanallowed by the number of experiments does not changethe resulting values of J(v) and S 2(v).
A simple way to calculate F(v) and S 2(v) is to use theMonte 2 Carlo procedure. By randomly taking fivevalues of tk, one can find appropriate values of ck whichbest fit the experimental data. Then, by changing the setof tk, one can obtain a second set of ci. By repeating thisprocess n times, one obtains n sets of ck and tk. The prob-ability Pj of finding the jth set of ck and tk can beexpressed46 as:
Pj ¼Y9
i¼1
1ffiffiffiffiffiffiffiffiffiffiffi2pv2
l
q expðRl 2 Rcalc
lk Þ2
2s2l
� ð8Þ
Rl are experimental parameters; Rlkcalc are calculated par-
ameters for the lth set, and sl are the experimental errorsin measuring Rl. For each lth set of ck and tk, one then cal-culates S 2(v) for any v. Using these values, averagevalues of S 2(v) and their errors are obtained.
For the most accurate fits, relaxation data wereanalyzed simultaneously over all temperatures byassuming that the temperature dependence of overalltumbling follows that of the viscosity of water havingapproximately an activation energy of 22.7 kJ/mol,which is consistent with activation energy for the self-diffusion of water.30,47,48 Because the length of the amideHN bond used in analysis of 15N NMR relaxation datais the subject of an ongoing debate that primarilyaddresses the problem of vibrational corrections,49 weused a traditional value of 1.02 A, which is widely usedby others in the field.50 The value for the 15N CSA tensorwas taken from the literature51 as 2170 ppm.
Using the temperature dependency of, S 2 one candetermine the entropy change, DSp, with temperature.Based on the equations in Yang & Kay29 and in Yanget al.,34 one can write:
DSp12 ¼ kB ln3 2
ffiffiffiffiffiffiffiffiffiffiffiffiffiffiffiffi1 þ 8S2
p
3 2ffiffiffiffiffiffiffiffiffiffiffiffiffiffiffiffi1 þ 8S1
p
�ð9Þ
where S2 and S1 are the order parameters at two tem-peratures. The heat capacity, Cp, is calculated as:
Cp ¼Dvp12
lnðTEMP2=TEMP1Þð10Þ
where DSp12 is the change in entropy on going from tem-perature TEMP1 to temperature TEMP2. Here, it shouldbe mentioned that equation (10) is based on a linearinterpolation in order to estimate the heat capacity,which actually corresponds to a harmonic oscillatorpotential52 Wand53 mentioned that “significant work inthis area is required, particularly in the development ofphysical models”.
Acknowledgements
This work was supported by a research grantfrom the National Institutes of Health (NIH, GM-58005) and benefited from use of the high fieldNMR facility at the University of Minnesota. We
would like to thank Judy Haseman for preparing15N-enriched samples of protein GB1.
References
1. Alexander, P., Fahnestock, S., Lee, T., Orban, J. &Bryan, P. (1992). Thermodynamic analysis of thefolding of the Streptococcal protein G IgG-bindingdomains B1 and B2: why small proteins tend tohave high denaturation temperatures. Biochemistry,31, 3597–3603.
2. Akerstrom, B., Brodin, T., Reis, K. & Bjorck, L. (1985).Protein G: a powerful tool for binding and detectionof monoclonal and polyclonal antibodies. J. Immunol.135, 2589–2592.
3. Gronenborn, A. M., Filpula, D. R., Essig, N. Z.,Achari, A., Whitlow, M., Wingfield, P. T. & Clore,G. M. (1991). A novel, highly stable fold of theimmunoglobulin binding domain of streptococcalprotein G. Science, 253, 657–660.
4. Gallagher, T., Alexander, P., Bryan, P. & Gilliland,G. L. (1994). Two crystal structures of the B1immunoglobulin-binding domain of Streptococcalprotein G and comparison with NMR. Biochemistry,33, 4721–4729.
5. Orban, J., Alexander, P., Bryan, P. & Khare, D. (1995).Assessment of stability differences in the protein GB1 and B2 domains from hydrogen–deuteriumexchange: comparison with calorimetric data.Biochemistry, 34, 15291–15300.
6. Kobayashi, N., Honda, S., Yoshii, H., Uedaira, H. &Munekata, E. (1995). Complement assembly of twofragments of the streptococcal protein G B1 domainin aqueous solution. FEBS Letters, 366, 99–103.
7. Park, S.-H., O’Neil, K. T. & Roder, H. (1997). An earlyintermediate in the folding reaction of the B1 domainof protein G contains a native-like core. Biochemistry,36, 14277–14283.
8. Sheinerman, F. B. & Brooks, C. L. (1998). Calculationson folding of segment B1 of Streptococcal protein G.J. Mol. Biol. 278, 439–456.
9. Makhatadze, G. I. & Privalov, P. L. (1995). Energeticsof protein structure. Advan. Protein Chem. 47,307–425.
10. Lee, A. L. & Wand, A. J. (2001). Microscopic originsof entropy, heat capacity and the glass transition inproteins. Nature, 411, 501–504.
11. Lipari, G. & Szabo, A. (1982). Model-free approach tothe interpretation of nuclear magnetic resonancerelaxation in macromolecules. I. Theory and rangeof validity. J. Am. Chem. Soc. 104, 4546–4559.
12. Lipari, G. & Szabo, A. (1982). Model-free approach tothe interpretation of nuclear magnetic resonancerelaxation in macromolecules. II. Analysis of experi-mental results. J. Am. Chem. Soc. 104, 4559–4570.
13. Clore, G. M., Szabo, A., Bax, A., Kay, L. E., Driscoll,P. C. & Gronenborn, A. M. (1990). Deviations fromthe simple two-parameter model free approach tothe interpretation of 15N NMR relaxation of proteins.J Am. Chem. Soc. 112, 4989–4991.
14. Idiyatullin, D., Daragan, V. A., Mayo, K. H. (2002).15NH backbone dynamics of protein GB1: compari-son of order parameters and correlation timesderived using three “model free” approaches. J. Mol.Biol., submitted for publication.
15. Barchi, J. J., Grasberger, B., Gronenborn, A. M. &Clore, G. M. (1994). Investigation of the backbonedynamics of the IgG-binding domain of streptococcal
160 Protein GB1 Backbone NH Energetics and Heat Capacities
protein G by heteronuclear two-dimensional 1H–15NNMR spectroscopy. Protein Sci. 3, 15–21.
16. Seewald, M. J., Pichumani, K., Stowell, C., Tibbals,B. V., Regan, L. & Stone, M. J. (2000). The role ofbackbone conformational heat capacity in proteinstability: temperature dependent dynamics of the B1domain of Streptococcal protein G. Protein Sci. 9,1177–1193.
17. Clore, G. M., Driscoll, P. C., Wingfield, P. T. &Gronenborn, A. M. (1991). Analysis of the backbonedynamics of interleukin-1b using two-dimensionalinverse detected heteronuclear 15N-1H NMR spec-troscopy. Biochemistry, 29, 7387–7401.
18. Mandel, A. M., Akke, M. & Palmer, A. G., III (1996).Dynamics of ribonuclease H: temperaturedependence of motions on multiple time-scales.Biochemistry, 35, 16009–16023.
19. Coles, M., Diercks, T., Muehlenweg, B., Bartsch, S.,Zoelzer, V., Tschesche, H. & Kessler, H. (1999). Thesolution structure and dynamics of humanneutrophil gelatinase-associated lipocalin. J. Mol.Biol. 289, 139–157.
20. Hidehito, T., Hung, F., Li, M., Bredt, D. S. & Zhang,M. (2000). Solution structure and backbone dynamicsof the second PDZ domain of postsynaptic density-95. J. Mol. Biol. 295, 225–237.
21. Zajicek, J., Chang, Y. & Castellino, F. J. (2000). Theeffects of ligand binding on the backbone dynamicsof the kringle 1 domain of human plasminogen.J. Mol. Biol. 301, 333–347.
22. Berglund, H., Olerenshaw, D., Sankar, A.,Federwisch, M., McDonald, N. Q. & Driscoll, P. C.(2000). The three-dimensional solution structure anddynamic properties of the human FADD deathdomain. J. Mol. Biol. 302, 171–188.
23. Canet, D., Barthe, P., Mutzenhardt, P. & Roumestand,C. (2001). A comprehensive analysis of multifield 15Nrelaxation parameters in proteins: determination of15N chemical shift anisotropies. J. Am. Chem. Soc.123, 4567–4576.
24. Baber, J. L., Szabo, A. & Tjandra, N. (2001). Analysisof slow interdomain motion of macromoleculesusing NMR relaxation data. J. Am. Chem. Soc. 123,3953–3959.
25. Idiyatullin, D., Daragan, V. A. & Mayo, K. H. (2001).A new approach to visualizing spectral density func-tions and deriving motional correlation time distri-butions: applications to an a-helix-forming peptideand to a well-folded protein. J. Magn. Reson. 152,132–148.
26. Idiyatullin, D., Daragan, V. A., Mayo, K. H. (2002).Protein dynamics using frequency-dependent orderparameters from analysis of NMR relaxation data.J. Magn. Reson. In press.
27. Peng, J. W. & Wagner, G. (2001). Mapping of spectraldensity functions using heteronuclear NMR relax-ation measurements. J. Magn. Reson. 98, 308–332.
28. Akke, M., Bruschweiler, R. & Palmer, A. G., III (1993).NMR order parameters and free energy: an analyti-cal approach and its application to cooperative Ca2þ
binding by calbindin D9k. J. Am. Chem. Soc. 115,9832–9833.
29. Yang, D. & Kay, L. E. (1996). Contributions to confor-mational entropy arising from bond vector fluctu-ations measured from NMR-derived orderparameters: appplication to protein folding. J. Mol.Biol. 263, 369–382.
30. Daragan, V. A. & Mayo, K. H. (1997). Motional modelanalyses of protein and peptide dynamics using 13C
and 15N NMR relaxation. Prog. NMR Spectrosc. 32,63–105.
31. Onuchic, J. N., Luthey-Schulten, Z. & Wolynes, P. G.(1997). Theory of protein folding: the energy land-scape perspective. Annu. Rev. Phys. Chem. 48,545–600.
32. Chan, H. S. & Dill, K. A. (1998). Protein folding in thelandscape perspective: chevron plots and non-Arrhe-nius kinetics. Proteins: Struct. Funct. Genet. 30, 2–33.
33. Evenas, J., Forsen, S., Malmendal, A. & Akke, M.(1999). Backbone dynamics and energetics of a cal-modulin domain mutant exchanging between closedand open conformations. J. Mol. Biol. 289, 603–617.
34. Yang, D., Yu-Keung, M., Forman-Kay, J. D. & Kay,L. E. (1997). Contributions to protein entropy andheat capacity from bond vector motions measuredby NMR spin relaxation. J. Mol. Biol. 272, 790–804.
35. Frauenfelder, H., Sligar, S. G. & Wolynes, P. G. (1991).The energy landscape and motions of proteins.Science, 254, 1598–1603.
36. Perrin, C. L. & Nielson, J. B. (1997). “Strong” hydro-gen bonds in chemistry and biology. Annu. Rev.Phys. Chem. 48, 511–544.
37. Daragan, V. A., Ilyina, E., Fields, C. G., Fields, G. B. &Mayo, K. H. (1997). Backbone and side-chaindynamics of residues in a partially folded b-sheetpeptide from PF4. Protein Sci. 6, 355–363.
38. Mikhailov, D. V., Washington, L., Voloshin, A. M.,Daragan, V. A. & Mayo, K. H. (1999). Angularvariances for internal bond rotations of side-chainsin GXG-based tripeptides derived from 13C NMRrelaxation measurements. Biopolymers, 49, 373–383.
39. Eisenberg, D. & Crothers, D. (1979). PhysicalChemistry with Applications to the Life Sciences,Benjamin/Cummings, Menlo Park, CA.
40. Farrow, N. A., Zhang, O., Szabo, A., Torchia, D. A. &Kay, L. E. (1995). Spectral density function mappingusing 15N relaxation data exclusively. J. Biomol.NMR, 6, 153–162.
41. Kay, L. E., Nicholson, L. K., Delaglio, F., Bax, A. &Torchia, D. A. (1992). Pulse sequences for removal ofthe effect of cross correlation between dipolar andchemical-shift anisotropy relaxation mechanisms onthe measurement of heteronuclear T1 and T2 valuesin proteins. J. Magn. Reson. 97, 359–375.
42. Palmer, A. G., III, Skelton, N. J., Chazin, W. J., Wright,P. E. & Rance, M. (1992). Suppression of the effect ofcross-correlation between dipolar and anisotropicchemical-shift relaxation mechanisms in themeasurement of spin–spin relaxation rates. Mol.Phys. 75, 699–711.
43. Idiyatullin, D., Daragan, V. A. & Mayo, K. H. (2001).Improved measurement of 15N–{1H}NOEs in thepresence of H(N)–water proton chemical exchange.J. Magn. Reson. 153, 138–143.
44. Markley, J. L., Horsley, W. J. & Klein, M. P. (1971).Spin–lattice relaxation measurement in slowly relax-ing complex spectra. J. Chem. Phys. 53, 3604–3605.
45. LeMaster, D. M. (1999). NMR relaxation order par-ameter analysis of the dynamics of protein side-chains. J. Am. Chem. Soc. 121, 1726–1742.
46. Andrec, M., Montelione, G. T. & Levy, R. M. (1999).Estimation of dynamic parameters from NMR relax-ation data using the Lipari–Szabo model freeapproach and Bayesian statistical methods. J. Magn.Reson. 139, 408–421.
47. McCall, A. W., Douglass, D. C. & Anderson, E. W.(1959). Diffusion in liquids. J. Chem. Phys. 31,1955–1957.
Protein GB1 Backbone NH Energetics and Heat Capacities 161
48. Tanford, C. (1981). Physical Chemistry ofMacromolecules, Wiley, New York pp. 286–296.
49. Korzhnev, D. M., Billeter, M., Arseniev, A. S. &Orekhov, V. Y. (2001). NMR studies of Browniantumbling and internal motions in proteins. Prog.NMR Spectrosc. 38, 197–266.
50. Kay, L. E., Torchia, D. A. & Bax, A. (1989). Backbonedynamics of proteins as studied by 15N inversedetected heteronuclear NMR spectroscopy: appli-cation to staphylococcal nuclease. Biochemistry, 28,8972–8979.
51. Tjandra, N., Szabo, A. & Bax, A. (1996). Protein back-bone dynamics and 15N chemical shift anisotropyfrom quantitative measurement of relaxation inter-ference effect. J. Am. Chem. Soc. 118, 6986–6991.
52. Li, Z., Raychaudhuri, S. & Wand, A. J. (1996).Insights into the local residual entropy of proteinsprovided by NMR relaxation. Protein Sci. 5,2647–2650.
53. Wand, A. J. (2001). Dynamic activation of proteinfunction: a view emerging from NMR spectroscopy.Nature Struct. Biol. 8, 926–931.
Edited by P. Wright
(Received 15 July 2002; received in revised form 11 October 2002; accepted 11 October 2002)
162 Protein GB1 Backbone NH Energetics and Heat Capacities
Related Documents


